CHAPTER 3. ALASKA NATIVE HEALTH AND WELL-BEING
|
|
|
- Lawrence Powell
- 6 years ago
- Views:
Transcription
1 CHAPTER 3. ALASKA NATIVE HEALTH AND WELL-BEING Are Alaska Natives healthier now than they were 15 years ago? In some ways, yes. Still, major health problems and social problems like domestic violence are very widespread. Many of these problems are linked to alcohol. This chapter looks at health and well-being among Alaska Natives at the start of the 21st century. We report changes over time, mostly since 1990, but also from earlier periods, in a wide range of indicators. We also compare the health of Natives with that of other Alaskans and other Americans. Data Sources and Organization of Chapter We collected and analyzed the best available information from many sources, as noted in the text and on the figures. In particular, we relied on data from the Alaska Department of Health and Social Services, especially the Bureau of Vital Statistics, the Alaska Area Native Health Service, and the Alaska Native Tribal Health Consortium. The most recent information available for some measures is from the late 1990s. That s largely because most agencies and organizations base their calculations of health measures by race on figures from the U.S. census. As we described in Chapter 2, there was an important change in the 2000 census. For the first time, people answering census questions could specify more than one primary race. So 2000 census data include not only people who described themselves as just Alaska Native, but also those who reported being of Native and some other race. State agencies are still grappling with how to report racial information for Alaskans of more than one race and especially how to compare data from before 2000 with data since As a result, many have not reported some data by race in the past several years. Another recent change also complicates comparisons over time. To compare rates of disease or death among populations say to compare death rates from heart disease among Alaska Natives and other Americans statisticians do what they call age adjusting, because not all populations have the same age make-up. For example, Alaska Natives as a people are younger than the overall American population. To make populations comparable, statisticians use a standard population, with specific shares of the population in each age group. That way, rates of death or other measures aren t affected by the fact that a population has more older or more younger people. The federal government now uses the 2000 U.S. population as the standard. But for the previous 60 years, the 1940 U.S. population was the standard. The change is important, because it means that rates calculated with the 1940 standard aren t directly comparable with rates calculated under the new standard. When appropriate in this chapter, we ll remind readers about how this change affects the figures we re reporting. Below we first summarize our findings about Alaska Native health and well-being, grouping them under Successes Since 1990 and Continuing Challenges. Four sections follow the summary: (1) Background: Long-Term Improvements in Living Conditions: a description of broad improvements in sanitation systems, housing, and health care facilities in Native communities since the mid-1970s; (2) Introduction to Findings: a general description of trends in Native health since 1990; (3) Successes Since 1990: a detailed discussion of our findings about improvements in Native health since 1990; and (4) Continuing Challenges: a description of health and social problems that either worsened or showed no improvement in the past decade. 3-1
2 Summary of Findings Successes Since 1990 Life expectancy among Alaska Natives continues to increase. It was up from 64.4 years in 1980 to 68.8 in 1990 and 69.5 by More Native babies are surviving. Infant mortality rates dropped more than a third between the early and the late 1990s, bringing rates much closer to but still above national averages. Native teenagers are less likely to have babies. The teen birth rate declined more than 20 percent between 1990 and Still, it remains more than twice the rate among white teenagers. Smoking among Native high-school students is down, dropping nearly a third between 1995 and 2003 from 62 percent to 44 percent. Despite that progress, smoking among Native students remains nearly four times higher than among other students. Alaska Natives are much less likely to die by accident. The rate of accidental death was nearly 40 percent lower in the late 1990s than in the early 1980s. Still, rates of accidental death among Natives remain more than twice those of other Alaskans. Rates of homicide and suicide may be trending down and at least didn t increase. From the data we have, we can t say for certain that homicide and suicide rates are declining because these rates are based on small numbers that can fluctuate sharply from year to year. But the rates in recent years didn t increase, and as more data accumulate in the coming decade, the trends will be clearer. Still, current rates remain several times higher than those among other Alaskans. Alaska Natives are less likely to die from pneumonia or flu, with rates in the late 1990s nearly a third less than they had been 10 years earlier. Still, in the late 1990s Alaska Natives were still about a third more likely than white Americans to die from these causes. Native children are being immunized at higher rates than other American children. In recent years, more than 81 percent of Native children were immunized for common childhood diseases, compared with about 77 percent of children nationwide. The Native health care system saw improvements, including construction of a new Native medical center in Anchorage to replace a hospital built in the 1950s. Other improvements included expansion of the community health aide system to more than 170 villages by 2003 and the introduction of telemedicine to some remote places. More than 60 percent of small Native communities controlled alcohol by the end of the 1990s. Before state law was changed in the mid-1980s, very few communities were able to control alcohol locally. About 77 percent of rural homes had safe water and sewer systems by That s up from 40 percent in 1990 and is projected to reach 87 percent by Nearly 3,700 new housing units were built in remote communities in the 1990s. Nearly one quarter of all housing in remote areas was added between 1990 and
3 Continuing Challenges Rates of Fetal Alcohol Spectrum Disorder (FASD) increased sharply. FASD among Alaska Native children increased from 2.5 cases per 1,000 births in the late 1980s to 5 per 1,000 in the late 1990s. FASD is many times more common among Alaska Natives than other Alaskans and other Americans. Alaska Native children are far more likely to be neglected or abused than other Alaska children. From , more than half the neglected or abused children were Alaska Native. Analysts say alcohol plays a part in 80 percent of child abuse. Alaska Native women are victims of domestic violence and sexual assault far more often than other Alaska women. From , 36 percent of the victims of domestic violence and 44 percent of the victims of sexual assault were Native, although they make up only about 19 percent of adult Alaskans. Experts say alcohol contributes to more than 80 percent of domestic violence and sexual assault. More than a third of Alaska s prison inmates are Alaska Natives, although they make up only about a fifth of Alaskans. The number of Native prisoners increased 50 percent from , a rate considerably faster than overall Native population growth. Native prisoners are mainly men ages 20 to 49. Law enforcement authorities link a large share of crime to alcohol. Sniffing fumes of gasoline, glue, and other substances remains a widespread problem among all Alaska teenagers, but many rural residents and health officials believe the problem is worse in remote villages. The 1990s saw establishment of Alaska s first treatment center specifically for inhalant abusers. About 40 percent of Alaska Native adults smoke, compared with about 25 percent among other Alaska adults. Unlike the smoking rate among Native teenagers, which declined recently, the rate among adults stayed about the same. Smoking causes most lung cancer, a big share of emphysema, and various heart problems. Obesity among Native adults increased sharply in the past decade. The percentage of Native adults considered obese went from less than 20 percent in the early 1990s to nearly 30 percent a decade later. Diabetes soared among Alaska Natives in the past 15 years. In 1985, about 16 of every 1,000 Natives had diabetes about half the rate among other Americans. By 1999, diabetes among Natives had doubled, to 31.4 cases per 1,000 above the U.S. rate of Heart disease is now as widespread among Alaska Natives as among other Alaskans. Twenty years ago, heart disease was less common among Alaska Natives. Alaska Natives are still more likely than other Americans to die at all ages, but the biggest gaps are among young adults. In 1999, Alaska Natives ages 25 to 34 were nearly four times more likely to die than white Alaskans their age. 3-3
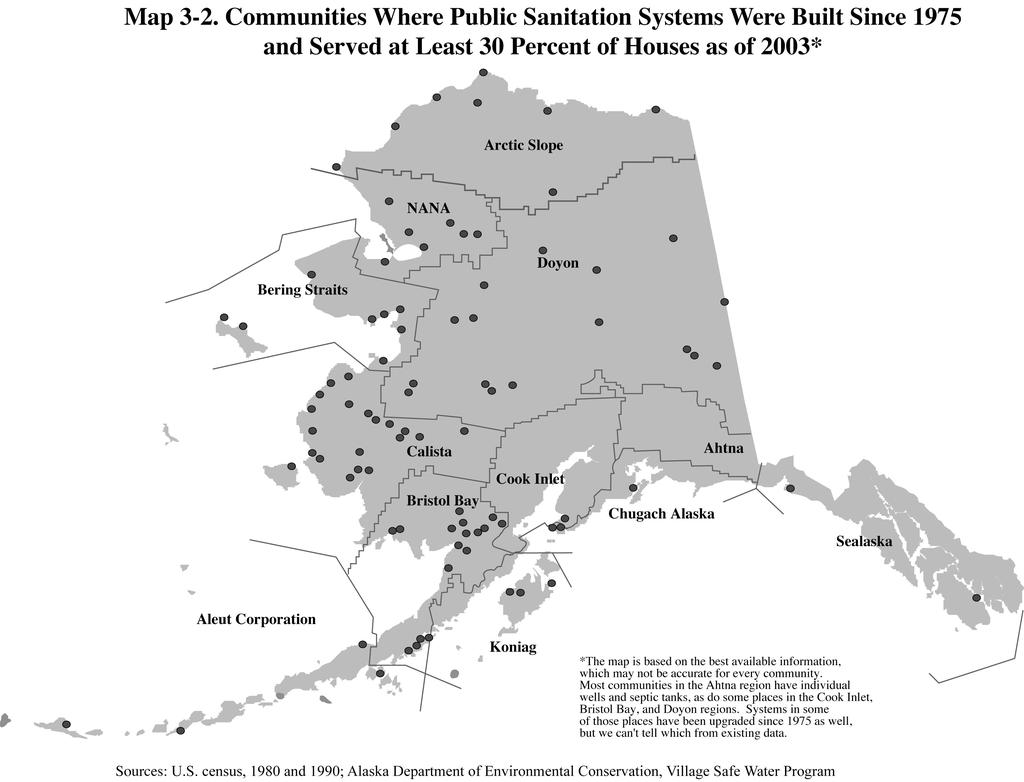
4 Background: Long-term Improvements in Living Conditions In the 1960s, when Alaska was a new state, a major federal report on Alaska Natives described conditions in most villages: small, crowded, dilapidated houses; unsafe water supplies and unsanitary sewage disposal; health care only from the occasional visiting doctor or nurse. The director of the Alaska Native Medical Center at the time said these living conditions were central to most health problems of villagers. 1 Since then, the villages have seen sharp improvements in sanitation systems, housing, and access to health care. Construction of Rural Sanitation Systems In 1974, only a handful of Alaska s rural homes somewhere around 10 percent had running water and flush toilets. Map 3-1 shows which Alaska communities had some form of public sanitation at that time. That includes communities with (1) public water and sewer systems or (2) safe water sources, either a water system or a central location where residents could come to haul water. But keep in mind that even in those places with water and sewer systems, not all houses were necessarily connected. We know that sanitation systems often extended only to parts of communities and in fact that s still true today. But the map shows where at least some access to public sanitation systems existed, even if it was only a central location to get water. (In some other communities, residents had their own individual wells and septic tanks so they had safe water and waste disposal, even though there might not have been public systems. Those communities aren t shown on the map because 1974 data about them are not available.) The largest cities Anchorage, Fairbanks, and Juneau had water and sewer systems in the 1970s, as did most of the larger towns in southcentral and southeast Alaska. Elsewhere, just a handful of places often the regional centers or other large villages had both public water and sewer systems in But the state and federal governments were working to improve sanitation in rural Alaska, spending about $135 million in the 1970s. The first step in villages without water or sewer systems was establishing a safe water source, usually some central location where residents could come to get water. Roughly 65 rural communities had at least a central source of water by That left somewhere around 100 small villages where residents typically hauled water directly from lakes or rivers and used honey buckets for sewage and there may or may not have been any central location to dump the honey buckets. Improvements Between 1980 and 2003, the federal and state governments spent more than $1 billion to improve sanitation in rural Alaska. Most of that spending $840 million was just since Nearly 90 communities got new or improved sanitation systems during that time, as Map 3-2 shows. Pinpointing when each community got sanitation systems is impossible, because there s no central source of data going back that far at the community level. We relied on information from the U.S. census to estimate changes between 1980 and For changes from 1990 through 2003, we used a combination of census data and information from the Alaska Department of 1 Alaska Natives and the Land, Federal Field Committee for Development Planning in Alaska, October 1968, page
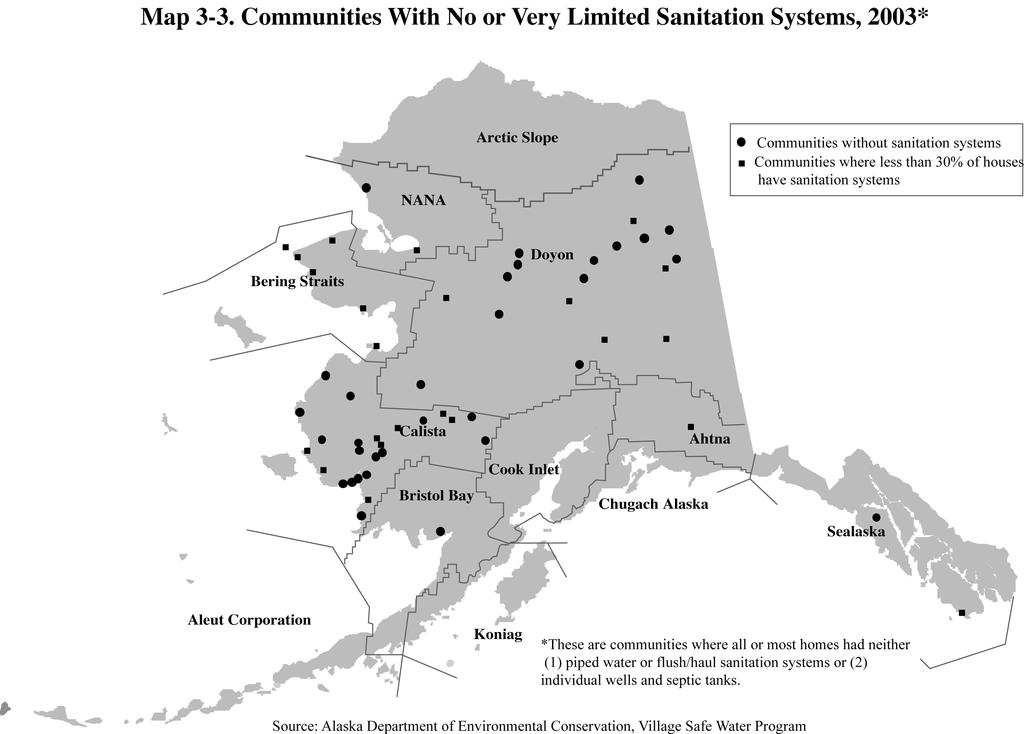
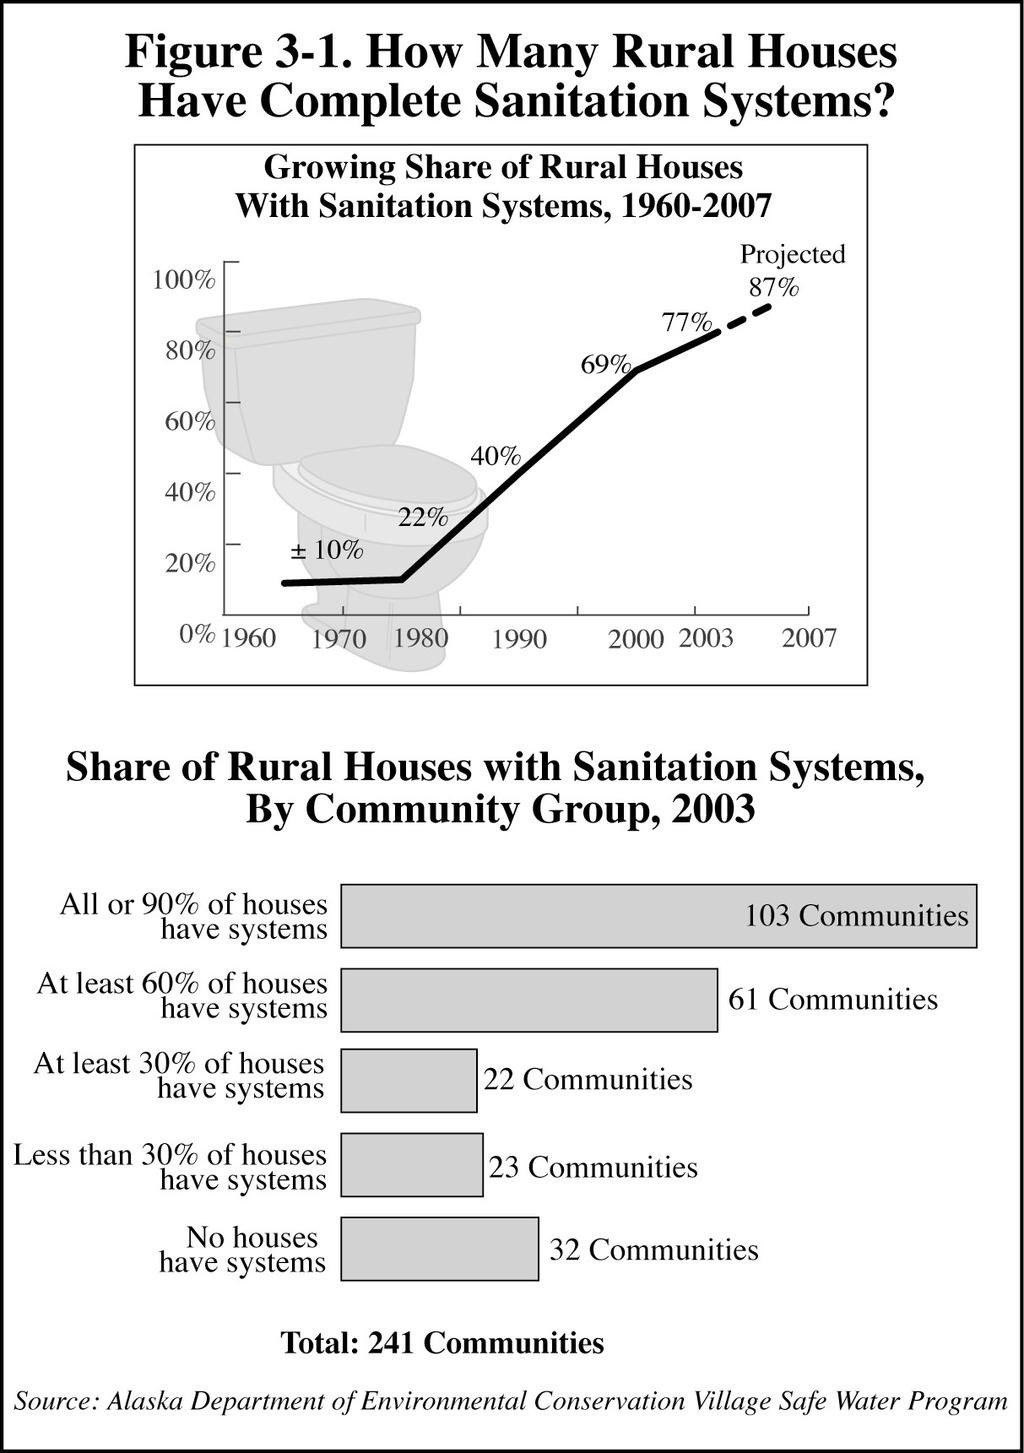
5 Environmental Conservation. Census information from different years is not always exactly comparable, and sometimes it s based just on a sample, rather than on data from all households so it may not be as accurate as complete data would be. Also, keep in mind that tracking sanitation improvements in rural communities is complicated not only by lack of complete data from the early years but also because the original systems in some communities have failed or partly failed; the systems may or may not have been replaced by And building a sanitation system in any given community typically involves several projects over a period of years. Status in 2003 So where are we today? The Alaska Department of Environmental Conservation reports that at the end of 2003, 77 percent of rural houses had complete sanitation systems either piped or flush/haul systems or individual wells and septic systems. Map 3-3 shows that 32 small rural places still completely lacked piped water and sewer systems in In another 23 communities, less than 30 percent of the houses had piped systems. Those places are primarily small Native communities in southwest, western, and interior Alaska. And in many other rural communities, a majority but still not all houses were connected to sanitation systems in 2003, as Figure 3-1 shows. Future Expectations The major expansion in rural sanitation systems in recent times is especially impressive, if you remember that the rural population and the number of rural houses were growing at the same time. Planning, design, or construction of new systems or improvements in and expansion of existing systems was underway in about 156 communities in The Department of Environmental Conservation projects that by 2007, 87 percent of all rural homes will have complete sanitation systems. 3-5
6 3-6
7 3-7
8 3-8
9 3-9
10 Improvements in Housing Stock In 1968, a milestone publication, Alaska Natives and the Land, documented conditions among Alaska Natives just before the Alaska Native Claims Settlement Act was passed. It reported that of the roughly 7,500 houses in Native villages at that time, 7,100 needed to be replaced and an additional 350 were needed every year to meet population growth. And in fact there has been substantial construction in rural Alaska in the past 30 years. Information from the U.S. census tells us that most of the houses in rural Alaska today occupied by all Alaskans Native and non-native have been built since In remote rural areas, where most of the population is Alaska Native, Native regional housing authorities have largely managed housing construction in recent decades. Those housing authorities were established in the 1970s, under terms of the Indian Self-Determination and Education Assistance Act. They were strengthened with passage of the Native American Housing and Self-Determination Act in Between 1998 and 2002, about 1,150 units (not necessarily all individual houses) were built with money appropriated under that act. 2 Map 3-4 shows how many houses were built in remote rural and other rural areas in every decade since Tracing new housing construction in specific villages over time is impossible, because such data don t exist. But the figures from the U.S. census show the magnitude of housing construction throughout rural Alaska in the past 30 years. Most units built in rural areas were individual houses, but the figures include all housing units, which might be duplexes or other multi-unit structures. Also keep in mind that these figures include all housing, regardless of whether Alaska Natives or other Alaskans live in them. The remote rural areas shown on the map are predominantly Alaska Native. Of the roughly 16,800 houses in remote areas in 2000, about 13,800 more than 80 percent were built after The pie graphs on Map 3-4 shows that about 28 percent of the houses in remote areas were built in the 1970s, 32 percent in the 1980s, and 22 percent in the 1990s. The remaining 18 percent were built before In other rural areas, there were about 29, 600 housing units as of About 20,600 of those 70 percent were built since About 26 percent were built during the 1970s, 25 percent during the 1980s, and 19 percent during the 1990s. The other 30 percent pre-date Future levels and timing of rural housing construction are impossible to predict, but we know that construction is continuing under terms of the Native American Housing and Self- Determination Act. 2 Office of Native American Programs, Housing and Urban Development, Anchorage 3-10
11 3-11
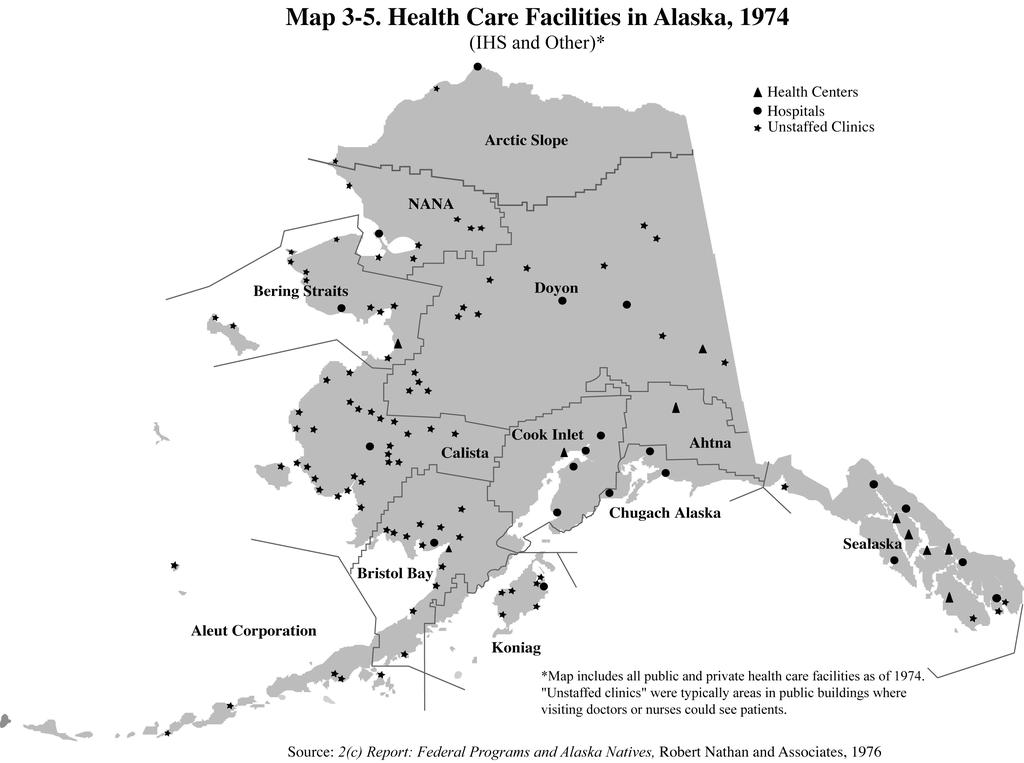
12 Improvements in Health Care System In 1974, even basic health care wasn t routinely available in most villages. The 2(c) Report: Federal Programs and Alaska Natives, published in the mid-1970s, reported the status of healthcare facilities throughout Alaska (including those of the Indian Health Service, state government, the military, and private and religious organizations). Map 3-5 shows that information. The Indian Health Service (IHS) operated Native hospitals in Anchorage, Sitka, Tanana, Bethel, Barrow, Kotzebue, and Dillingham in There were also other public and private hospitals in the larger communities. The IHS or the state government also had health centers which usually had at least one permanent staff person in about a dozen places, mostly rural regional centers or larger villages and towns. And the state or IHS had what were called clinics in about 80 communities. But these clinics had no local staff; they were typically areas in public buildings, set aside so when visiting state or federal health-care workers periodically came to town, they had a place to see patients. About 85 Native villages didn t have even specific clinic areas for visiting health-care workers. 3 Map 3-6 shows locations of just IHS facilities thirty years later, in IHS health-care facilities are now managed by Alaska Native health organizations. IHS now funds the formerly private hospital in Nome, and it has closed the hospital in Tanana. Except for those changes, IHS hospitals are in the same locations as in the 1970s. Those hospitals have seen significant improvements over the years. There are also 26 IHS health centers around Alaska. And in more than 170 villages, there are clinics that are generally staffed by at least one local community health aide. Health aides examine patients and report symptoms to doctors via telephone or radio, or through the evolving telemedicine system that allows doctors to see digital images of patients. The aides then carry out doctors instructions; they re also trained to provide emergency first aid and to help educate residents about health issues. Besides health aides, who live in the villages they serve, state public health nurses also routinely travel to villages to help with immunization and other public health programs. Most village residents who need dental care have to travel to regional hubs or urban places, but dentists sometimes travel to smaller communities. (For example, the Medicaid program contracts with pediatric dental teams to visit communities in southeast Alaska.) Mental health centers have also been established in about 15 Native communities, mostly regional centers. A dozen or so Native communities again, mostly regional centers have substance-abuse treatment centers. About 85 villages have mental health or substance-abuse counselors. Most mental health and substanceabuse clinics are in Anchorage or other urban places. Despite these additions, many communities still lack adequate facilities. Village residents have worked with the federal Denali Commission to identify what they need. In 2000, the Commission estimated that needed rural primary care facilities would cost $250 million. 4 And getting advanced medical care still requires villagers to make long, expensive trips to Anchorage or other urban towns. 3 2 (c) Report: Federal Programs and Alaska Natives, Task I An Analysis of Alaska Natives Well-Being. Prepared for U.S. Department of the Interior by Robert R. Nathan Associates, Denali Commission, 2001 Annual Report 3-12
13 3-13
14 3-14
15 Introduction to Findings Alaska s Native villages have, as we just discussed, benefited from long-term and ongoing improvements in the quality of and access to health care, in safe water and sewer systems, and in the quality of housing. Those improvements began in the 1960s and 1970s, but accelerated in the 1980s and 1990s, with sharply increased federal and state spending. Alaska Natives today are living longer; fewer babies are dying; and illnesses that are caused or aggravated by unsanitary conditions and crowded, substandard housing are either gone or on their way out. In the past decade, deaths from Sudden Infant Death Syndrome and diseases of early infancy dropped, as did deaths from pneumonia and flu. Outbreaks of measles were cut sharply; hepatitis A was stopped in its tracks; and cases of hepatitis B dropped by more than half, according to figures from the Alaska Department of Health and Social Services. Tuberculosis has not been eradicated, but rates are a small fraction of what they were a few decades ago, when tuberculosis was a leading cause of death among Alaska Native people. Improvements in the Native health-care system in the past 10 years include construction of a new Alaska Native Medical Center in Anchorage and new or expanded health-care clinics and other facilities throughout rural Alaska. Another improvement in rural Alaskans access to medical care since the late 1990s is telemedicine which allows health aides or other health-care workers in remote communities to electronically transmit images and patient information to doctors in larger communities, who can then better diagnose problems. The Alaska Telehealth Advisory Council reported in late 2003 that 235 Alaska communities had telemedicine connections. 5 Another major change in the 1990s was that Native organizations took over administration of virtually all the Indian Health Service operations in Alaska, providing Native people with a level of control over health-care delivery they never had before. Native communities in the past decade also increasingly voted to use their authority under state law to control alcohol locally and there is evidence that local control of alcohol is helping reduce some of the many problems alcohol abuse has created in Native communities. Also in the 1990s, a special federal entity the Denali Commission was created, with authority (among other things) to build and equip health, nutrition, and child-care projects across the state. Projects could include hospitals, clinics, and drug and alcohol treatment centers. The commission and rural communities have jointly identified primary care facilities needed in many places, and in the coming years will work together to improve facilities to meet the standard of adequate. The federal and state governments spent almost $850 million for rural sanitation systems between 1990 and 2003 and nearly doubled the share of rural houses with safe water and sewer systems. Housing built in remote rural areas between 1990 and 2000 added nearly 30 percent to the housing stock in those areas.. But despite these advances, Alaska Natives today are still far more likely than other Alaskans to die by accident, suicide, or homicide although rates of accidental death are significantly lower now than in the 1980s. Natives are more likely to go to prison and to be victims of domestic violence and sexual assault. They are more likely to smoke and to be overweight which is 5 Alaska Journal of Commerce, State s telemedicine network reaches milestone, by Robert Howk, November 24,
16 contributing to soaring rates of diabetes. The two leading causes of death among Alaska Natives are now cancer and heart disease just as they are among other Alaskans and other Americans. In many ways, the future challenges in improving Native health are as they are throughout the United States fighting problems caused by what people do: drinking too much; eating too much of the wrong things; smoking. Alaska Natives themselves have recognized and are taking steps to fight alcohol abuse and other behavioral problems, including bans or restrictions on alcohol in about 60 percent of the smallest communities. Federal and state agencies, together with Native organizations, are (1) making people aware of the consequences of what they do and (2) helping them change behavior that risks their health and endangers other people. Figure 3-2 shows why the fight against smoking, heavy drinking, and other risky behavior is so important. The U.S. Centers for Disease Control has assessed how various factors affect life expectancy. Genetic make-up, which one cannot control, determines 20 percent of life expectancy. The environment food, housing, sanitation determines another 20 percent; and access to health care, 10 percent. The remaining half of life expectancy as much as all the other factors combined depends on behavior that affects your health: what you eat and drink, how much you exercise, whether you smoke, whether you use drugs. Figure 3-2. What Determines How Long You Live? Source: U.S. Centers for Disease Control 3-16
17 Successes Since 1990 Life Expectancy Improves Increasing life expectancy among Alaska Natives is a good measure of better health. Figure 3-3 shows improvements in life expectancy among Alaska Natives and all Americans since An Alaska Native born in 1950 could expect to live, on average, 46 years 22 years less than the average American life expectancy. In the 1950s, U.S. public health programs began fighting tuberculosis and other infectious diseases, helping boost life expectancy for the average Alaska Native. Native babies born in 1960, just a decade later, could expect to live on average 61 years. Since then, increases in life expectancy have continued every decade, but at a slower pace. Native babies born in 1997 could expect to live 69.5 years, up from 68.8 for babies born in That continuing improvement reflects many things, including improved access to health care, better medical technology and health facilities, and improved living conditions including less crowded housing, safer water supplies, and better sewage disposal. Still, in 1997 Native life expectancy still fell 7 years short of the average life expectancy of 76.5 years for all Americans. Figure 3-3. Years of Life Expectancy at Birth All Americans Alaska Natives Sources: Alaska Area Native Health Service; Alaska Bureau of Vital Statistics More Babies Survive Another widely-used measure of improving health is a reduction in infant mortality the share of babies who die before their first birthday. When fewer babies die, it s a sign of better health, resulting from better medical care (both pre- and post-natal) and healthier living conditions. As Figure 3-4 shows, infant mortality among Alaska Natives and among other Americans as 3-17
18 well has been declining for decades and continued to drop in the 1990s. In 1945, more than 120 of every 1,000 Native babies died before their first birthday. By 1975, deaths had dropped to 24 per 1,000 and by 1990 to about 15 per 1,000. By the period, the rate was at 9.5 per 1,000 much closer to but still above the rate of 7.0 per 1,000 for the entire U.S. population. In recent years, Alaska Native babies have been much less likely to die from Sudden Infant Death Syndrome (SIDS) and from various diseases of early infancy, according to figures of the Alaska Native Tribal Health Consortium. 6 Analysts also sometimes divide infant mortality into two periods: babies who die during the first month of life (neonatal period) and those who die sometime after the first month, but before they reach their first birthday (postnatal period). Figure 3-5 shows that breakdown in infant mortality among Alaska Native and other American infants during the period The rate of deaths for Alaska Native babies during their first month was actually lower than the national rate 4.2 per 1,000 babies compared with 4.7. That neonatal death rate among Natives was half what it had been in 1980, and it represents the clearest payoff for the significant effort the Native health care system has made to reduce infant mortality. Pre-maternal homes provide shelter close to hospitals for women from villages who are awaiting delivery. Prenatal care and education have also emphasized the need for a healthy lifestyle during pregnancy The postnatal mortality rate for Alaska Native infants also declined in recent years, dropping from 11.8 per 1,000 babies in 1980 to 5.3 during the period. Still, this rate was twice as high as the 2.4 per 1,000 rate among all American babies during that time. So the Alaska Native Medical Care Center in Anchorage and other parts of the Native health care system are now focusing on ways to better support families with new babies when they return home. Figure 3-4. Infant Mortality Rates, Alaska Natives and All Americans, (Deaths per 1,000 Births) Alaska Native Infants All American Infants Alaska Natives All Americans Sources: Alaska Native Health Services, Alaska Area Profile, August 2002; Alaska Native Health Board, Progress Toward Healthy Alaskans 2010 Goals, July Alaska Native Mortality , Alaska Native Tribal Health Consortium, August
19 Figure 3-5. Infant Mortality in Neonatal and Postnatal Periods (Average, , Deaths per 1,000 Births) Neonatal Deaths (first 28 days) Postnatal Deaths (29 days to 1 year) Alaska Natives All Americans Source: Alaska Native Health Board, Progress Toward Healthy Alaskans 2010 Goals, July 2003 Teen Pregnancy Rates Drop Teen-age girls across the U.S. are less likely to have babies now than they were 10 years ago. As Figure 3-6 shows, birth rates among Alaska Native girls (15 to 19) dropped from a high of 123 births per 1,000 in 1982 to 108 in 1990 and to 85 by That decline is good news, because teen-age mothers face a sea of troubles. Many don t get support from the fathers of their babies, according to national studies, and often they don t finish high school. Teen-age mothers and their children are much more likely to be poor than families with two parents. But despite the improvement, birth rates among Native teenagers remain over twice those of white teenagers. Figure 3-6. Birth Rates, Alaska Native and White Teenage Girls in Alaska, (Births per 1,000 Girls 15-19) Alaska Native White Source: Alaska Bureau of Vital Statistics Alaska Native White
20 Overall Death Rates and Rates of Accidental Death Decline The overall death rate for Alaska Natives deaths from all causes declined about 20 percent between the 1980s and the late 1990s (Table 3-1). We don t know whether that decline has continued since then, because no recent figures on overall death rates by race are yet available. That s because of the problem we explained at the beginning of this chapter, stemming from the change in the 2000 census that allowed respondents to specify more than one primary race. State agencies have not yet fully determined how to calculate rates by race, when many people, including Alaska Natives and others, reported being of more than one race. Also, when new death rates by race are available, they will (as we also discussed at the beginning of the chapter) be adjusted by a new standard population. So the new rates won t be directly comparable with the old rates. As time goes on, however, we will be able to see whether the trend is still down. Table 3-1. Death Rates From All Causes Combined, Alaska Natives and White Americans (Age-Adjusted Deaths per 100,000) Percent Change Alaska Natives percent White Americans* percent * Nationwide from 1981 and Source: Alaska Native Mortality, , Alaska Native Tribal Health Consortium, August 2002 Still, despite the decline in the Native death rate, Natives are still far more likely than other Alaskans to die at all ages (Figure 3-7). The biggest differences are among young people especially Natives 25 to 34, who die at nearly four times the rate of white Alaskans their age. Figure 3-7. Death Rates, by Age, All Causes, Alaska Natives and White Alaskans, 1999 (Deaths per 100,000, In Each Age Group) 3,000 2,500 2,000 1,500 1, Alaska Native ,359 2,980 White ,471 Source: Alaska Bureau of Vital Statistics Under
21 A large part of the explanation for the higher death rates among young adult Natives is that many violent deaths are among young people and violent death rates in the Native community are higher than among other Alaskans and other Americans. The top half of Figure 3-8 shows trends in violent death rates (accidents, suicides, homicides) in the 1980s and 1990s, and the bottom half shows figures for The most recent figures are not directly comparable to the earlier figures because they are adjusted with a different standard population (as we talked about at the beginning of the chapter). 3-21
22 Rates of accidental death among Alaska Natives dropped about 40 percent from the early 1980s to the late 1990s. Some of the major causes of accidental death in rural Alaska are motor vehicle crashes, drownings, accidental poisonings, and boat and airplane accidents. Accidental poisoning can be from a wide range of causes, including unintentional drug and alcohol overdoses; huffing inhaling fumes from gasoline or other noxious substances; and accidental exposure to pesticides or other chemicals. Health officials credit much of the drop in accidental deaths to injury prevention programs for adults and children. For example, the Alaska Native Tribal Health Consortium sponsors a program that has focused on reducing the number of deaths by drowning and motor-vehiclerelated injuries by encouraging drivers and passengers to use life vests in boats, seat belts in cars, and helmets on snow machines and three-wheelers. Data from the U.S. Centers for Disease Control show that such efforts have helped: between 1990 and 1998, the rate of drowning among all Alaskans (Alaska Natives and others) dropped 40 percent; deaths related to motor vehicles dropped 20 percent; and injury rates dropped 27 percent. Still, despite this good news, rates of accidental death among Alaska Natives remain more than twice those among other Alaskans. Recent trends in suicides and homicides are less clear. That s because the rates are (mercifully) based on much smaller numbers of deaths than the accident rates are. A relatively small increase or decrease in the number of deaths by suicide or homicide in any given year can cause a substantial change in the rates. So while homicide and suicides rates among Natives appear lower in the late 1990s than in the early 1980s, we can t say for certain that such declines will hold. We know, from numbers published by the Alaska Native Tribal Health Consortium for the 1980s and 1990s (as shown in Table 3-2), that the rates fluctuate. Still, ANTHC s numbers show that rates of suicide and homicide at least did not worsen in recent times. But even though they didn t increase, suicide and homicide rates among Alaska Natives remain in the range of three to four times higher than among the U.S. white population. Table 3-2 provides a more comprehensive look at the changing rates of death from various causes among Alaska Natives and other Americans from the early 1980s to the late 1990s. Again, keep in mind that these rates are not directly comparable with the most recent rates, shown later in Figure 3-22, because the new rates are age-adjusted with a new standard population. Still, the trends and comparisons shown in Table 3-2 give us an accurate picture of changes over the past 20 years. 3-22
23 Table 3-2. Leading Causes of Deaths, Alaska Natives and Whites Nationwide (Age-Adjusted Rates per 100,000) Rates among Alaska Natives Cause of Death % Change Cancer % Cerebrovascular Diseases % Chronic Liver Disease and Cirrhosis NS Chronic Obstructive Pulmonary Diseases % Diabetes Mellitus % Heart Disease NS Homicide and Legal Intervention % Pneumonia and Influenza % Suicide NS Unintentional Injuries % Total, All Cases % Rates among White Americans, Nationwide Cause of Death % Change Cancer % Cerebrovascular Diseases % Chronic Liver Disease and Cirrhosis % Chronic Obstructive Pulmonary Diseases % Diabetes Mellitus % Heart Disease % Homicide and Legal Intervention % Pneumonia and Influenza % Suicide % Unintentional Injuries % Total, All Cases % NS = not significant; +- Chi Square Test for Trend significant at p<0.05 Source: Alaska Native Mortality, , Alaska Native Tribal Health Consortium, August Smoking Drops But Still Widespread Among Native Teenagers Smoking among Alaska Native teenagers declined from about 62 percent in 1995 to 45 percent by 1993 a decline of nearly a third (Figure 3-9). But that rate was nearly four times the rate of 12 percent among other Alaska high-school students in So although rates are down, smoking among Native teenagers is still staggeringly high. Also, the 2003 Youth Risk Behavior Survey shows that a third of Native high-school boys, and nearly 20 percent of Native girls, also use smokeless tobacco. Among other Alaska high-school students, around 11 percent of boys but very few girls use smokeless tobacco. Using tobacco can cause lung cancer, emphysema, and heart disease, among other things. National research shows that not only is nicotine addictive, but that addiction occurs in most 3-23
24 smokers during adolescence. 7 Public health campaigns and increased sales taxes on tobacco have likely helped reduce smoking among Alaska s teenagers. Figure 3-9. Share of Alaska High-School Students Who Smoke, 1995 and % 44.2% 32.4% 12.3% AK Native Non-Native Source: Alaska Youth Risk Behavior Survey, 1995 and 2003 Community Control of Alcohol Grows Analysts say that the most difficult social problems in the Native community from high rates of suicide to domestic violence and child abuse can be traced in large part to alcohol. We ll document the levels of some of those problems in the next section of this chapter. But here we talk about one important step Alaska Native villages are taking to fight alcohol. Residents of more than 100 Native communities including over 60 percent of the smallest rural communities and a few of the larger ones have voted for some form of alcohol control in their communities. It was only in the 1980s that the Alaska Legislature passed local option laws giving communities the authority to control alcohol by holding special elections and getting the approval of a majority of voters. Communities have approved different levels of local control over alcohol. Some ban just sales, some ban sales and imports, and some also ban possession. 7 Alaska Department of Health and Social Services, Healthy Alaskans 2010, April 2002, pages
25 Figure 3-10 shows the status of alcohol control in small rural communities as of ISER research in the late 1990s estimated that communities with alcohol controls may have prevented as many as 20 percent of violent deaths that would otherwise have occurred. 8 Other research has demonstrated that banning or limiting alcohol has reduced the prevalence of binge drinking and reduced injuries particularly vehicle injury, homicide, and hypothermia. 9 Figure Alcohol Control in Small Rural Communities, Matthew Berman, Alcohol Control Policy and Native American Communities, April A version of this paper was published by the National Institute on Alcohol Abuse and Alcoholism, Research Monogram 37, Landed, M.G. et al., Alcohol related injury death and alcohol availability in remote Alaska, in Journal of the American Medical Association, December 3, 1997; 278(21):
26 Continuing Challenges Alcohol Abuse Remains Widespread Alcohol abuse plagues Alaska Native communities. Alcohol has been linked to high rates of Fetal Alcohol Spectrum Disorder, child abuse, domestic violence, sexual assault, violent death, and incarceration. Below we look at each of those problems. Rates of Fetal Alcohol Spectrum Disorder High and Climbing During the last half of the 1990s, 5 of every 1,000 Alaska Native babies were diagnosed with Fetal Alcohol Spectrum Disorder (FASD). That s the new term health workers are using to describe the range of conditions including mental retardation, growth deficiencies, behavior disorders, and more that children can develop when they re exposed to alcohol in the womb. And many more babies most of them Native born in Alaska every year are in some way affected by prenatal exposure to alcohol. The state government agency that diagnoses and helps children with FASD reports that about 125 children born in Alaska annually are affected in some way because their mothers drank during pregnancy; only a small share of those are specifically diagnosed with FASD. 10 Figure 3-11 shows that rates of FASD among Alaska Natives were higher in the 1990s than in previous periods and many times the rate among non-natives. In fact, Alaska has the highest rate of FASD in the country, and 89 percent of the Alaska victims are Alaska Natives. Research shows that the woman most likely to have a child with FASD is an Alaska Native woman over age 30, who not only drinks during pregnancy but also smokes. 11 Children with FASD place large financial and behavioral burdens on families and communities. They need much more than other children, and those needs boost costs for special care services and adoption, as well as for infant learning programs, health care, educational services, and more. 12 The lifetime costs of care for one person diagnosed with FASD have been estimated at $1.4 million dollars. 13 In Alaska, state agencies report that about 65 percent of children with FASD are either in state custody or living in foster care. Only 23 percent of affected children are living at home with one or both biological parents. FASD is completely preventable it happens only when pregnant women drink. It is only within roughly the past decade or so that more health professionals themselves realized that pregnant women who drink any alcohol even small quantities can damage their babies. Not long ago, doctors often told women that a beer or a glass of wine wouldn t hurt and could help relax them. Native and state organizations now have major efforts underway to prevent and diagnose FASD and to help those affected by it. In 1998, Alaska established the Office of Fetal Alcohol Syndrome in the Department of Health and Social Services, to develop an FASD prevention program and to improve services for those affected by prenatal exposure to alcohol. Another effort the FAS Surveillance Project has teams of physicians and social workers statewide, 10 Diane Casto, supervisor of Alaska s FAS program, quoted in the Anchorage Daily News, March 16, Alaska FAS Surveillance Project, Alaska Department of Health and Social Services, Alaska Department of Health and Social Services, Office of Child Services, Alaska Department of Health and Social Services, Economic Cost of Alcohol and Other Drug Abuse, Phase Two, McDowell Group, for Alaska Advisory Board on Alcohol and Drug Abuse, November 13, 2001, page
27 evaluating and diagnosing children with FASD. These teams have increased reporting to the Alaska Birth Defects Registry and are providing comprehensive services to families affected by FASD. The state has also used television, radio, and newspaper ads to educate Alaskans about the dangers of drinking during pregnancy. Part of the increase in FASD rates in the 1990s may be due to the fact that doctors were becoming more aware of the problem and therefore more likely to diagnose it. Health officials also anticipate that the current effort to improve diagnostic services will result in increased reporting and, therefore, in increased rates of FASD in the coming years as well. Figure Fetal Alcohol Spectrum Disorder Rates Among Alaska Natives and Non-Natives, (Cases per 1,000 Births) Alaska Native Non-Native Source: Alaska Department of Health and Social Services 3-27
28 Many Children are Abused or Neglected Another problem that can be laid largely at the door of alcohol is child abuse and neglect. Analysts estimate that 80 percent of all substantiated child abuse cases in Alaska are related to alcohol or drug abuse. Figure 3-12 shows that abuse and neglect of children in Alaska aren t confined to any one type of family. Almost half the substantiated cases of abuse are in twoparent families. Next are families headed by single mothers, which account for 35 percent of abuse cases, followed by 10 percent among households with a mother and a stepfather, and nearly 3 percent among single fathers. Figure Child Abuse in Alaska, by Type of Family, Among All Alaska Families (November 2003) All Others 7.4% Single Father 2.7% Mother/Stepfather 10.0% Two-Parent Family 44.6% Single Mother 35.3% Total: 552 Families Source: Alaska Department of Health and Social Services, Office of Children's Services Figure 3-13 shows that Alaska Native children are far more likely than any other children in Alaska to be abused or neglected. During the period from , Alaska Native children suffered more than half the substantiated child abuse in Alaska, but made up only about 25 percent of children under 18. The figure also shows that three-in-four cases of child abuse among Alaska Native children are cases of neglect rather than physical abuse. Although White and Black children are less likely overall to be abused, more of those cases involve abuse rather than neglect. 3-28
29 Figure Victims of Child Abuse and Neglect in Alaska, by Race ( ) Black (241) 7.5% Asian/Pacific Island (92) 2.8% Alaska Native (1,694) 53% White (1,202) 37.2% Total Substantiated Cases, : 3,229 Physical or Mental Abuse (477) 28% Neglect (1,217) 72% Note: Based on unduplicated, substantiated cases of abuse and neglect among children under 18. Source: Alaska Department of Health and Social Services, Division of Family and Youth Services 3-29
30 Domestic Violence and Sexual Assault are Widespread Domestic violence and sexual assault are also closely linked to alcohol abuse, with alcohol a factor in an estimated 85 percent of reported cases of domestic violence and 80 percent of sexual assault. Native people almost entirely women are frequent victims of both crimes. Figure 3-14 shows that from , 36 percent of the victims of domestic violence were Alaska Native, compared with a Native share of less than 20 percent of the adult population. (Experts also say that the 19,000 cases of domestic violence reported during that period fall far short of the actual incidence of domestic violence, since many cases are not reported.) Figure Victims of Domestic Violence in Alaska, by Race (Total Reports, : 19,028) 46% 36% 18% Alaska Native White Other* Number of Cases: 6,830 8,704 3,494 *Includes other races and cases where race of victim was unknown. Source: Council on Domestic Violence and Sexual Assault Figure 3-15 shows the number of sexual assault cases reported in Alaska from 2000 to 2003, and the pattern is the same: Alaska Native women made up 44 percent of the victims of sexual assault, despite representing less than 20 percent of the general population. Again, experts say the reported number of cases is less than the actual number of sexual assaults, since some cases go unreported. The University of Alaska Anchorage s Justice Center recently reported that, in Anchorage during the years 2000 and 2001, Alaska Natives were 7.6 times more likely than others to be victims of sexual assault. 14 Additional statewide data from the Council for Domestic Violence and Sexual Assault show that same pattern: even though the total number of reported sexual assaults declined between 2000 and 2003, the proportion of Alaska Natives who were sexually assaulted increased. 14 André Rosay and Robert Langworthy, Descriptive Analysis of Sexual Assaults in Anchorage, Alaska, Alaska Justice Statistical Analysis Center, Justice Center, University of Alaska Anchorage, October
Initial Report of Oregon s State Epidemiological Outcomes Workgroup. Prepared by:
 Alcohol Consumption and Consequences in Oregon Prepared by: Addictions & Mental Health Division 5 Summer Street NE Salem, OR 9731-1118 To the reader, This report is one of three epidemiological profiles
Alaska Native Injury Atlas of Mortality and Morbidity. Prepared by: The Injury Prevention Program and the Alaska Native Epidemiology Center
 Alaska Native Injury Atlas of Mortality and Morbidity Prepared by: The Injury Prevention Program and the Alaska Native Epidemiology Center Alaska Native Tribal Health Consortium January 2008 Acknowledgements
Community Health Needs Assessment
 Community Health Needs Assessment Scott County, Missouri This assessment will identify the health needs of the residents of Scott County, Missouri, and those needs will be prioritized and recommendations
Indian Country Site Visit Executive Summary
 EXECUTIVE SUMMARY As part of its outreach efforts in Indian Country, the Substance Abuse and Mental Health Services Administration (SAMHSA) Fetal Alcohol Spectrum Disorders (FASD) Center for Excellence
New Mexico Department of Health. Racial and Ethnic Health Disparities Report Card
 New Mexico Department of Health Racial and Ethnic Health Disparities Report Card August 30, 2006 Acknowledgments Many individuals contributed to the production of this report card and the Office of Policy
2016 Collier County Florida Health Assessment Executive Summary
 2016 Florida Health Assessment Executive Summary Prepared by: The Health Planning Council of Southwest Florida, Inc. www.hpcswf.com Executive Summary To access the report in its entirety, visit http://www.hpcswf.com/health-planning/health-planningprojects/.
EVEN IF YOU KNOW ABOUT DRINKING OR DRUGS. Simple Questions. Straight Answers.
 EVEN IF YOU KNOW ABOUT DRINKING OR DRUGS Simple Questions. Straight Answers. WHY IS MY HEALTHCARE PROVIDER ASKING ME ABOUT ALCOHOL AND OTHER DRUGS? Asking these questions is part of good health care, just
Progress Tracker. Photo - https://www.healthypeople.gov/
 Progress Tracker Healthy People provides a framework for prevention for communities in the U.S. Healthy People 2020 is a comprehensive set of key disease prevention and health promotion objectives. The
Good Health & Well-Being. By Alexandra Russo
 Good Health & Well-Being By Alexandra Russo SDG 3 Goal 3 aims to ensure healthy living and promote well-being for all at all ages There are 9 targets associated with SDG 3 The targets encompass a wide
Community Health Needs Assessment PREPARED BY
 Community Health Needs Assessment PREPARED BY DEAR COMMUNITY PARTNERS We all know that good health is essential for a productive and thriving community. Furthermore, we understand that conditions in the
Socioeconomic Factors
 Socioeconomic Factors Guochang Zhao RIEM, SWUFE Week 12, Spring 2016 May 18, 2016 1 / 11 Guochang Zhao RIEM, SWUFE Socioeconomic Factors Health care spending and types of societal problems The U.S. spends
Adult Health ALASKA NATIVE HEALTH STATUS REPORT 11
 Adult Health ALASKA NATIVE HEALTH STATUS REPORT 11 12 ALASKA NATIVE HEALTH STATUS REPORT ADULT HEALTH Highlights More than a third (38.1%) of Alaska Native adults report being in very good or excellent
Community Health Needs Assessment Centra Southside Medical Center
 Community Health Needs Assessment Centra Southside Medical Center 2017-2019 Healthy People 2020 Healthy People provides a framework for prevention for communities in the U.S. Healthy People 2020 is a comprehensive
PHACS County Profile Report for Searcy County. Presented by: Arkansas Center for Health Disparities and Arkansas Prevention Research Center
 PHACS County Profile Report for Searcy County Presented by: Arkansas Center for Health Disparities and Arkansas Prevention Research Center Contents Introduction... Page 2 Demographics...Page 3 Social Environment
HIP Year 2020 Health Objectives related to Perinatal Health:
 PERINATAL HEALTH Perinatal health is the health and wellbeing of mothers and babies before, during, and after child birth. As described by Healthy People 2020, Pregnancy can provide an opportunity to identify
Module 6: Substance Use
 Module 6: Substance Use Part 1: Overview of Substance Abuse I am Martha Romney and I am presenting on substance abuse. This module focuses on the healthy people 2020 objective to reduce substance abuse
FLHealthCHARTS.com Update List
 Released = New data, statistical brief, or analytic report not previously posted on FLHealthCHARTS. Added = New features or indicators not previously posted on FLHealthCHARTS. Updated = Change to data
Centers for Disease Control and Prevention (CDC) Coalition C/o American Public Health Association 800 I Street NW Washington, DC,
 Coalition C/o American Public Health Association 800 I Street NW Washington, DC,") Centers for Disease Control and Prevention (CDC) Coalition C/o American Public Health Association 800 I Street NW Washington, DC, 20001 202-777-2514 Donald Hoppert, Director of Government Relations, American
Centers for Disease Control and Prevention (CDC) Coalition C/o American Public Health Association 800 I Street NW Washington, DC, 20001 202-777-2514 Donald Hoppert, Director of Government Relations, American
The Price of Injury The Burden of Injury and the Legislative Actions to Prevent Injury
 The Price of Injury The Burden of Injury and the Legislative Actions to Prevent Injury Laura Tobler, laura.tobler@ncsl.org July 26, 2010 Injury in the United States Injuries are the leading cause of death
11 Indicators on Thai Health and the Sustainable Development Goals
 11 11 Indicators on Thai Health and the Sustainable Development Goals 11 Indicators on Thai Health and the Sustainable Development Goals The Post -2015 Development Agenda began upon completion of the monitoring
Local Laws to Raise the Minimum Legal Sale Age for all Tobacco Products 21 Years of Age in the North Country Frequently Asked Questions
 Local Laws to Raise the Minimum Legal Sale Age for all Tobacco Products 21 Years of Age in the North Country Frequently Asked Questions It s Time to Clear the Air in the North Country Tobacco use remains
5 Public Health Challenges
 5 Public Health Challenges The most recent Mecklenburg County Community Health Assessment (CHA) prioritized the prevention of premature death and disability from chronic disease as the number one public
HealtheCNY Indicator List by Data Source
 American Community Survey 23 Adults with Health Insurance Children Living Below Poverty Level Children with Health Insurance Families Living Below Poverty Level Homeowner Vacancy Rate Homeownership Households
Healthy People 2010 Leading Health Indicators: California, 2000
 January 4 DATA SUMMARY No. DS4- Healthy People Leading Health Indicators: California, By Jim Sutocky This report focuses on the Healthy People Leading Health Indicators (LHIs). H i g h l i g h t s As of
Tobacco Use in Alaska Natives Behavioral Risk Factor Surveillance System
 Tobacco Use in Alaska Natives Behavioral Risk Factor Surveillance System 1998-2000 Alaska Native Epidemiology Center Alaska Native Tobacco Programs The Alaska Native Health Board March 2003 Tobacco Use
Underage Drinking. Underage Drinking Statistics
 Underage Drinking Underage drinking is a serious public health problem in the United States. Alcohol is the most widely used substance of abuse among America s youth, and drinking by young people poses
Health Status Disparities in New Mexico Identifying and Prioritizing Disparities
 Health Status Disparities in New Mexico Identifying and Prioritizing Disparities Public Health Division March 23 Health Status Disparities in New Mexico Identifying and Prioritizing Disparities New Mexico
Walworth County Health Data Report. A summary of secondary data sources
 Walworth County Health Data Report A summary of secondary data sources 2016 This report was prepared by the Design, Analysis, and Evaluation team at the Center for Urban Population Health. Carrie Stehman,
Cambridge Health Indicators 2015
 Cambridge Health Indicators 2015 Cambridge Health Indicators Broad Measures of Health for Cambridge, Massachusetts, and the United States Division of Epidemiology & Data Services November 2015 Claude-Alix
Tuscarawas County Health Department
 Tuscarawas County Health Department Community Health Needs Assessment 214 TUSCARAWAS COUNTY HEALTH DEPARTMENT Community Health Needs Assessment 214 Assessment Commissioned by: Dr. James Hubert D.O Health
Underage Drinking and Alcohol Abuse in Kent County, Delaware
 Underage Drinking and Alcohol Abuse in Kent County, Delaware Delaware Drug and Alcohol Tracking Alliance (DDATA) Center for Drug and Alcohol Studies University of Delaware April 2013 42% of Delaware 5
2012 Assessment of St. Lucie County s Social, Health, and Public Safety Services
 2012 Assessment of St. Lucie County s Social, Health, and Public Safety Services April 5, 2013 140 Intracoastal Pointe Drive, Suite 212 Jupiter, FL 33477-5064 561.744.5662 Fax: 561.575.7396 www.sra-researchgroup.com
San Diego County Health Briefs North Coastal Region
 Non-Communicable Disease This brief contains 2009 chronic disease health data for the of San Diego County. Data are provided from the Community Health Statistics Unit and the 2009 California Health Interview
Public Health and the Promise of Prevention
 Public Health and the Promise of Prevention Director of Health Policy Research Office of Statewide Initiatives University of Nevada School of Medicine March 23, 2016 Public Health and the Public Health
Executive Summary To access the report in its entirety, visit
 Executive Summary To access the report in its entirety, visit http://www.hpcswf.com/health-planning/health-planningprojects/. Demographic and Socioeconomic Characteristics Population Demographics has a
Multnomah County Health Department. Report Card on Racial and Ethnic Health Disparities. April 2011
 Multnomah County Health Department Report Card on Racial and Ethnic Health Disparities April 2011 Lillian Shirley, Director, Multnomah County Health Department Sandy Johnson, Office of Health and Social
Violence Prevention A Strategy for Reducing Health Inequalities
 Violence Prevention A Strategy for Reducing Health Inequalities Professor Mark A Bellis Centre for Public Health Liverpool John Moores University WHO Collaborating Centre for Violence Prevention Overview
Initial Report of Oregon s State Epidemiological Outcomes Workgroup. Prepared by:
 Tobacco Consumption and Consequences in Oregon Prepared by: To the reader, Addictions & Mental Health Division 5 Summer Street NE Salem, OR 9731-1118 This report is one of three epidemiological profiles
Sarpy/Cass Department of Health and Wellness
 This 2012 Community Health Report Card is the product of many community surveys and agency recordkeeping. The staff at the Sarpy/ Department of Health and Wellness finds value in all of this community
Selected Risk Behaviors in Wyoming Adults and Youth John Olson UW Department of Family & Consumer Sciences student intern
 Selected Risk Behaviors in Wyoming Adults and Youth John Olson UW Department of Family & Consumer Sciences student intern Alcohol Consumption: o According to the Behavioral Risk Factor Surveillance System
MOSBIRT - Personal Health Risk Assessment
 Participant: Test, Amy (9987631) Assessed: Wednesday, February 01, 2012 About this report: Like most women you face a lot of responsibilities and decisions every day. These include how you take care of
ATTACHMENT 7. Identifying Strategic Issues
 ATTACHMENT7 Identifying Strategic Issues NORTHERN MICHIGAN MOBILIZING FOR ACTION THROUGH PLANNING & PARTNERSHIPS (MAPP) Identifying Strategic Issues Sample Agenda 6-9:00 PM I. Refreshments/Dinner II. Welcome
Your Health Report Is your substance use hurting your health?
 Test, Joan Wednesday, August 01, 2012 Joan, Your Health Report Is your substance use hurting your health? Like most women you face a lot of responsibilities and decisions every day. These include how you
Chapter 14. Injuries with a Focus on Unintentional Injuries & Deaths
 Chapter 14 Injuries with a Focus on Unintentional Injuries & Deaths Learning Objectives By the end of this chapter the reader will be able to: Define the term intentionality of injury Describe environmental
Magnitude. SELECT A TOPIC...
 Page 1 of 6 SELECT A TOPIC..... NIDA Home > Drug Abuse and Addiction: One of America's Most Challenging Public Health Problems Magnitude Drug Abuse is Costly Drug abuse is a major public health problem
71 Potential Leading Health Indicators for Healthy Alaskans 2020: Documenting Progress Towards 25 LHIs
 71 Potential Leading Health Indicators for Healthy Alaskans 2020: Documenting Progress Towards 25 LHIs : Documenting Progress Towards 25 LHIs The purpose of this report is to document the data and information
2010 Mecklenburg County Health Department Community Report Appointments: General Information:
 2010 Mecklenburg County Health Department Community Report Appointments: 704-336-6500 General Information: 704-336-4700 meckhealth.org twitter.com/meckhealth Table of Contents Message from the Health Director
Take The Pledge! Underage Alcohol Use. By James L. Holly, MD. Your Life Your Health. The Examiner. May 11, 2006
 Take The Pledge! Underage Alcohol Use By James L. Holly, MD Your Life Your Health The Examiner May 11, 2006 We protect everything! We buy insurance to protect our property from storms. Insurance is nothing
Alcohol affects your brain. Alcohol affects your body.
 Alcohol Alcohol affects your brain. Drinking alcohol leads to a loss of coordination, poor judgment, slowed reflexes, distorted vision, memory lapses, and even blackouts. Alcohol affects your body. Alcohol
Brant County Community Health Status Report: 2001 OVERVIEW
 Brant County Community Health Status Report: 2001 OVERVIEW Brantford County of Brant Brant County Health Unit and Grand River District Health Council April 2001 Brant County Community Health Status Report:
Nicotine Dependence Treatment Among Alaska Native People. We re not quitting yet!
 Nicotine Dependence Treatment Among Alaska Native People We re not quitting yet! MCH and Immunizations Conference September 27, 2010 ccrenner@anthc.org Objectives Current state of tobacco prevalence Tribal
Jackson County Community Health Assessment
 2016 Jackson County Community Health Assessment With Collaboration from Black River Memorial Hospital and Jackson County Public Health Wisconsin Population Health Institute Table of Contents Structure
Safe Babies Foster Parent Training Program
 Safe Babies Foster Parent Training Program Module 1: Introduction to the Safe Babies Program 1 Begin the process of group participation Learning outcomes Understand the purpose and origins of the Safe
MetroWest Adolescent Health Survey
 MetroWest Adolescent Health Survey Informing data driven school and community health policies and practices 2016 High School Report GRADES 9-12 Spring 2017 Funded by: MetroWest Health Foundation Submitted
New Jersey s Comprehensive Tobacco Control Program: Importance of Sustained Funding
 New Jersey s Comprehensive Tobacco Control Program: Importance of Sustained Funding History of Tobacco Control Funding Tobacco use is the leading preventable cause of death in the U.S., killing more than
Tobacco, Alcohol, and
 Healthier San Joaquin County Community Assessment 2011 Tobacco, Alcohol, and Drug Use Summary... 100 Indicators Tobacco Use... 101 Tobacco Use Among Pregnant Women... 103 Alcohol Consumption... 104 Adult
Tobacco Data, Prevention Spending, and the Toll of Tobacco Use in North Carolina
 Tobacco Data, Prevention Spending, and the Toll of Tobacco Use in North Carolina North Carolina Alliance for Health 2017 0 Table of Contents Highlights from the Surgeon General s Report on E-Cigarette
The Great Lakes EpiCenter News
 The Great Lakes EpiCenter News Epidemiology Project of the Great Lakes Inter-Tribal Council, Inc. Vol.7, No.2 Spring 2006 Epidemiology is the study of the distribution and determinants of health-related
STATISTICAL NEWS. Breast Cancer Cases Up; Mortality Rates Down. Multiple Race Reporting In 2000 Census Noted
 STATISTICAL NEWS Pennsylvania Department of Health Bureau of Health Statistics Vol. 24 No. 3 May 2001 Multiple Race Reporting In 2000 Census Noted Multiple Race Reporting Will Start with 2003 Birth/Death
Frequently Asked Questions
 Frequently Asked Questions Legal 1. Can I use cannabis? You can legally use cannabis if you are 21 or older. You can also use cannabis if you are 18 or older and have a current qualifying physician s recommendation
2015 United States Fact Sheet
 Fact Sheet Unintentional injuries and violence are the leading causes of death, hospitalization, and disability for children ages -. This fact sheet provides a state snapshot of data on the injury-related
Child Health. Ingham County Health Surveillance Book the data book. Ingham County Health Surveillance Book 2016.
 Child Health Child Health- 1 Child Health I ngham County child health data is presented in this section. The data in this section includes information on weight, hospitalizations, and the State of Michigan
help your family member or friend
 How to Tips for Women on Fetal Alcohol Spectrum Disorders help your family member or friend be an alcohol free mother to be. Give good advice that will help a woman or girl have a healthy baby. You could
Mental and Behavioral Health
 Mental and Behavioral Health Mental Health Poor mental health is a major source of distress, disability, and social burden. In any given year, as many as one in five adults in the United States have a
An APA Report: Executive Summary of The Behavioral Health Care Needs of Rural Women
 1 Executive Summary Of The Behavioral Health Care Needs of Rural Women The Report Of The Rural Women s Work Group and the Committee on Rural Health Of the American Psychological Association Full Report
2018 Community Health Assessment
 2018 Community Health Assessment Community Health Status Assessment Linn County, IA Prepared by Amy Hockett, PhD, MPH, CHES Epidemiologist Linn County Public Health August 9, 2018 Community Health Status
25 Fun Insane Facts about Alaska. And what EMS can, could and should do!
 25 Fun Insane Facts about Alaska And what EMS can, could and should do! An incredible Save Rate What are our Save Rates for Cardiac Arrest? Specifically measuring VF rates means there is a chance for survival.
Community Health Status Assessment
 Community Health Status Assessment EXECUTIVE SUMMARY The Community Health Status Assessment (CHSA) is one of four assessments completed as part of the 2015-2016 Lane County Community Health Needs Assessment
Prepared by Southern Illinois University School of Medicine s Center for Clinical Research And Office of Community Health and Service
 Hospital Sisters Health System Community Health Needs Assessment (FY2015-FY2018) Quantitative and Secondary Data Analysis Report For St. Anthony s Hospital Effingham, Prepared by Southern University School
Pierce County Health Indicators
 Pierce County Health Indicators 3629 S. D. St., Tacoma WA 98418-6813 Phone: 253-798-7668 email: oapi@tpchd.org Demographics Characteristics Latest Year count Percent WA State count Percent Data Source
PERINATAL TOBACCO USE
 PERINATAL TOBACCO USE Child Fatality Task Force Perinatal Health Committee Meeting November 4, 2015 Erin McClain, MA, MPH You Quit, Two Quit, UNC Center for Maternal & Infant Health Percentage Women &
WASHINGTON STATE COMPARISONS TO: KITSAP COUNTY CORE PUBLIC HEALTH INDICATORS May 2015
 WASHINGTON STATE COMPARISONS TO: KITSAP COUNTY CORE PUBLIC HEALTH INDICATORS This is a companion document to the Core Public Health Indicators that provides a comparison of to Washington State for the
Pierce County Health Indicators
 Pierce County Health Indicators Updated 11/10/2016 Demographics Characteristics Latest Year count Percent WA State count Percent Total Population 2015 830,120 7,061,408 2015 Total Percent Total Percent
Racial and Ethnic Health Disparities Report Card
 Racial and Ethnic Health Disparities Report Card August 2010 Acknowledgements Many individuals contributed to the production of this report card. The Division of Policy and Performance wishes to particularly
Working with Youths and Suicide in a substance abuse setting
 Working with Youths and Suicide in a substance abuse setting By Ben Ramos-Nieves Program Director GRAF Rheeneerhaanjii- Adolescent Treatment Center Fairbanks Native Association Statewide Suicide Prevention
The University of Michigan
 The University of Michigan News and Information Services 412 Maynard Ann Arbor, Michigan 48109-1399 December 13, 2002 Contact: Patti Meyer Phone: (734) 647-1083 E-mail: pmeyer@umich.edu Study Web site:
In their Eyes: An Average Child s View of their World
 In their Eyes: An Average Child s View of their World April 2014 University of Delaware Center for Drug and Health Studies Based on the 2013 Delaware School Surveys And the 2013 Delaware Youth Risk Behavior
Part I. Health-related Millennium Development Goals
 11 1111111111111111111111111 111111111111111111111111111111 1111111111111111111111111 1111111111111111111111111111111 111111111111111111111111111111 1111111111111111111111111111111 213 Part I Health-related
Get the Facts: Minnesota s 2013 Tobacco Tax Increase is Improving Health
 Get the Facts: Minnesota s 2013 Tobacco Tax Increase is Improving Health February 10, 2015 Lisa R. Mattson, MD Frank J. Chaloupka, PhD Raymond Boyle, PhD, MPH Overview The tobacco industry has a well-known
Chapter 7 Health: Health and Access To Care
 Chapter 7 Health: Health and Access To Care Percent of Pregnant Women Aged - The Health of Northwest Residents An optimal quality of life mandates a complete state of physical and mental well-being. This
Substance Abuse Trends in Maine Epidemiological Profile 2013
 Substance Abuse Trends in Maine Epidemiological Profile 2013 Western District Produced for Maine Department of Health and Human Services Office of Substance Abuse and Mental Health Services by Hornby Zeller
Alcohol Use and Related Behaviors
 Alcohol Use and Related Behaviors 1 8 6 4 2 21 23 25 27 Current Drinking 48.7 5.7 42.3 43.2 Binge Drinking First Drink of Alcohol Before Age 13 28.6 27.9 Figure 1 Trends in Alcohol Use, Grades 7 12, 21
Save Lives and Save Money
 Tobacco Control Policies & Programs Save Lives and Save Money Matthew L. Myers President, Campaign for Tobacco Free Kids Alliance for Health Reform Luncheon Briefing July 13, 2012 1 We Know How to Reduce
State of Nebraska 2015 Youth Risk Behavior Survey Results
 State of Nebraska 2015 Youth Risk Behavior Survey Results June 2016 Nebraska Department of Education Nebraska Department of Health and Human Services Report Prepared by: Bureau of Sociological Research
Are You Ready to Sail. February 11, 2016
 Are You Ready to Sail your SHIP?! February 11, 2016 Acknowledgement and Disclaimer This webinar was supported by funds made available from the Centers for Disease Control and Prevention, Office for State,
7. Injury & Violence. pg : Unintentional injury hospitalizations. pg : Mortality from unintentional injuries
 7. pg 124-125: Unintentional injury hospitalizations pg 126-131: Mortality from unintentional injuries pg 132-133: Unintentional injury mortality trends pg 134-135: Hospitalizations for homicide pg 136-137:
Community Health Profile: Minnesota, Wisconsin, & Michigan Tribal Communities 2006
 Community Health Profile: Minnesota, Wisconsin, & Michigan Tribal Communities 26 This report is produced by: The Great Lakes EpiCenter If you would like to reproduce any of the information contained in
JOINING HANDS: SHARING RESOURCES AND DATA ACROSS SECTORS TO IMPROVE POPULATION HEALTH
 JOINING HANDS: SHARING RESOURCES AND DATA ACROSS SECTORS TO IMPROVE POPULATION HEALTH Virginia Population Health Summit Charlottesville, Virginia March 29, 2017 Steven H. Woolf, MD, MPH Director, Center
Health is excellent, very good, or good
 Health is excellent, very good, or good Source Description Item National Health Interview Survey Health is excellent, very good, or good Would you say [fill: your/alias s] health in general is excellent,
Nutrition and Physical Activity
 Nutrition and Physical Activity Lifestyle choices made early in life have a significant impact on the patterns of chronic disease developed in adulthood. In the U.S., poor diet and physical inactivity
Slide 1. The Public Health Approach. This is Part 2 of an Orientation to Violence Prevention. Slide 2
 Slide 1 Orientation to Violence Prevention The Public Health Approach 1 Slide 2 Slide 3 Lesson Objectives Describe common misconceptions about public health Describe key concepts of public health Lesson
Community Health Assessment. May 21, 2014
 Community Health Assessment May 21, 2014 1 Presenters Stacey Adams, MS Co-Leader Domain 1 Carol Heier, LCSW Accreditation Coordinator Dale Quinney, MPH Co-Leader Domain 1 2 Recording available There is
The Mentor Project: Fostering Consumer Advocacy Among Native Alaskans
 Cultural Competency Toolkit CHAPTER1 The Mentor Project: Fostering Consumer Advocacy Among Native Alaskans The Mental Health Association in Alaska 4045 Lake Otis Parkway, Suite 209 Anchorage, Alaska, 99508
Racial and Ethnic Health Disparities Report Card, 7th Edition
 Racial and Ethnic Health Disparities Report Card, 7th Edition September 2012 Department of Health 1190 South St. Francis Drive Santa Fe, NM 87502 www.nmhealth.org/opa/ Produced by the Office of Health
Public Health, History and Achievements. Dr Faris Al Lami MBChB PhD FFPH
 Public Health, History and Achievements Dr Faris Al Lami MBChB PhD FFPH Objectives Define public health. Describe conditions that existed before the advent of modern public health. Describe important achievements
THE HEALTH OF LINN COUNTY, IOWA A COUNTYWIDE ASSESSMENT OF HEALTH STATUS AND HEALTH RISKS
 THE HEALTH OF LINN COUNTY, IOWA A COUNTYWIDE ASSESSMENT OF HEALTH STATUS AND HEALTH RISKS Project Team Pramod Dwivedi, Health Director Amy Hockett, Epidemiologist Kaitlin Emrich, Assessment Health Promotion
Community Health Profile: Minnesota, Wisconsin & Michigan Tribal Communities 2005
 Community Health Profile: Minnesota, Wisconsin & Michigan Tribal Communities 25 This report is produced by: The Great Lakes EpiCenter If you would like to reproduce any of the information contained in
WOMEN S REPRODUCTIVE HEALTH AS A GENDER, DEVELOPMENT AND HUMAN RIGHTS ISSUE: REGAINING PERSPECTIVE
 WOMEN S REPRODUCTIVE HEALTH AS A GENDER, DEVELOPMENT AND HUMAN RIGHTS ISSUE: REGAINING PERSPECTIVE Monique V. Chireau, MD, MPH Assistant Professor, Division of Clinical and Epidemiologic Research Department
Health Status of New Mexico 2015
 Health Status of New Mexico 2015 New Mexico Health s Northwest Northeast Metro Southwest Southeast NM Urban-Rural County Classification Metropolitan Counties Small Metro Counties Mixed Urban/Rural Counties
Amendment 72 Increase Cigarette and Tobacco Taxes
 Amendment 72 Increase Cigarette and Tobacco Taxes ANALYSIS Amendment 72 proposes amending the Colorado Constitution to: increase the state tax on a pack of cigarettes from $0.84 to $2.59; increase the