Are You Ready to Sail. February 11, 2016
|
|
|
- Lydia Morrison
- 5 years ago
- Views:
Transcription

1 Are You Ready to Sail your SHIP?! February 11, 2016
2 Acknowledgement and Disclaimer This webinar was supported by funds made available from the Centers for Disease Control and Prevention, Office for State, Tribal, Local and Territorial Support. The content of this webinar are those of the authors and do not necessarily represent the official position of or endorsement by the Centers for Disease Control and Prevention. ASTHO does not guarantee that states who follow the guidance in this document will meet PHAB requirements, only the PHAB site visitors can make that determination.
3 Webinar Objectives Identify data inputs from the SHA and other areas to inform the SHIP process Identify resources for comparative data Understand asset mapping as it relates to the SHIP develop process Understand ways to identify health disparate populations
4 USE OF THE CHAT FUNCTION AT THE BOTTOM LEFT OF YOUR SCREEN
5 AUDIO QUESTIONS If you would like to speak to our presenters directly, we have ample time at the end of the presentations for you to do so. Please hit *1 on your telephone and the operator will put you in the queue to ask your question. Our presenters are excited to speak with their peers directly so we encourage you to use this function!
6 NEW YORK Our Presenters Priti Irani Priti Irani, MSPH Research Scientist, Office of Public Health Practice Sylvia Pirani Sylvia Pirani, MPH, MS Director, Office of Public Health Practice Nguyen Trang Trang Nguyen, MD, DrPH Director, Public Health Information Group Deputy Director, Office of Public Health Practice

7 Priti Irani
8 Dr. Trang Nguyen
9 Sylvia Pirani Sylvia Pirani, MPH, MS Director, Office of Public Health Practice
10

11 Switch to live website Where Do I Find This Resources?
12
13
14

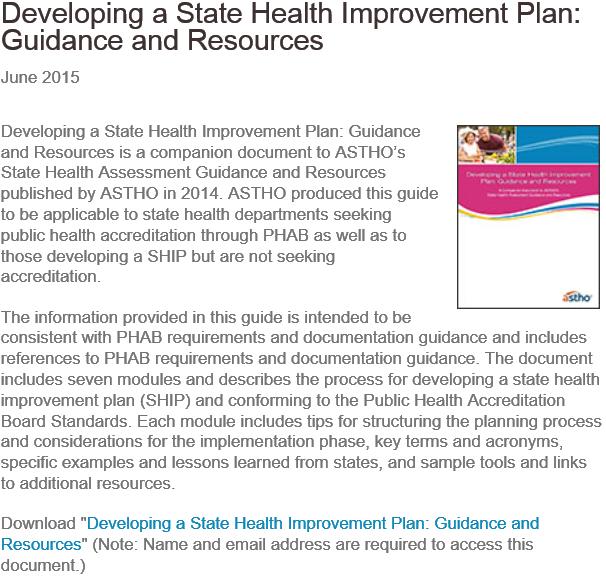
15 Seven Modules
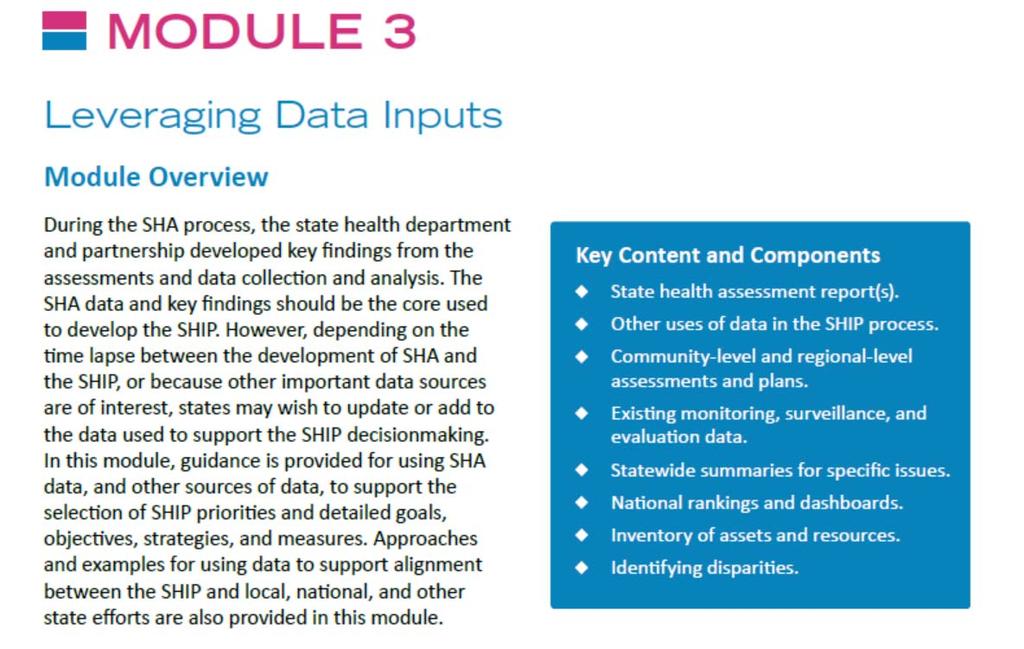
16 Each Module Contains: Preview of the content The relevant PHAB Standards and Measures Ideas for structuring the planning process Important considerations Key terms and acronyms State examples and lessons learned Sample tools and links to resources Throughout: Cross reference to the ASTHO State Health Assessment Guidance and Resources

17 Links to resources
18
19
20 Placeholder for Polling Questions Where are you in the SHIP process? We have not started We have begun data collection We have engaged partners and stakeholders We have an official advisory committee for our SHIP Our SHIP is complete
21
22
23 Data Sources in the SHIP Process 1. Community Level and Regional Level Assessments and Plans 2. Existing Monitoring, Surveillance, and Evaluation Data 3. Statewide Data Summaries for Specific Issues 4. National Rankings and Dashboards 5. Inventory of Assets and Resources

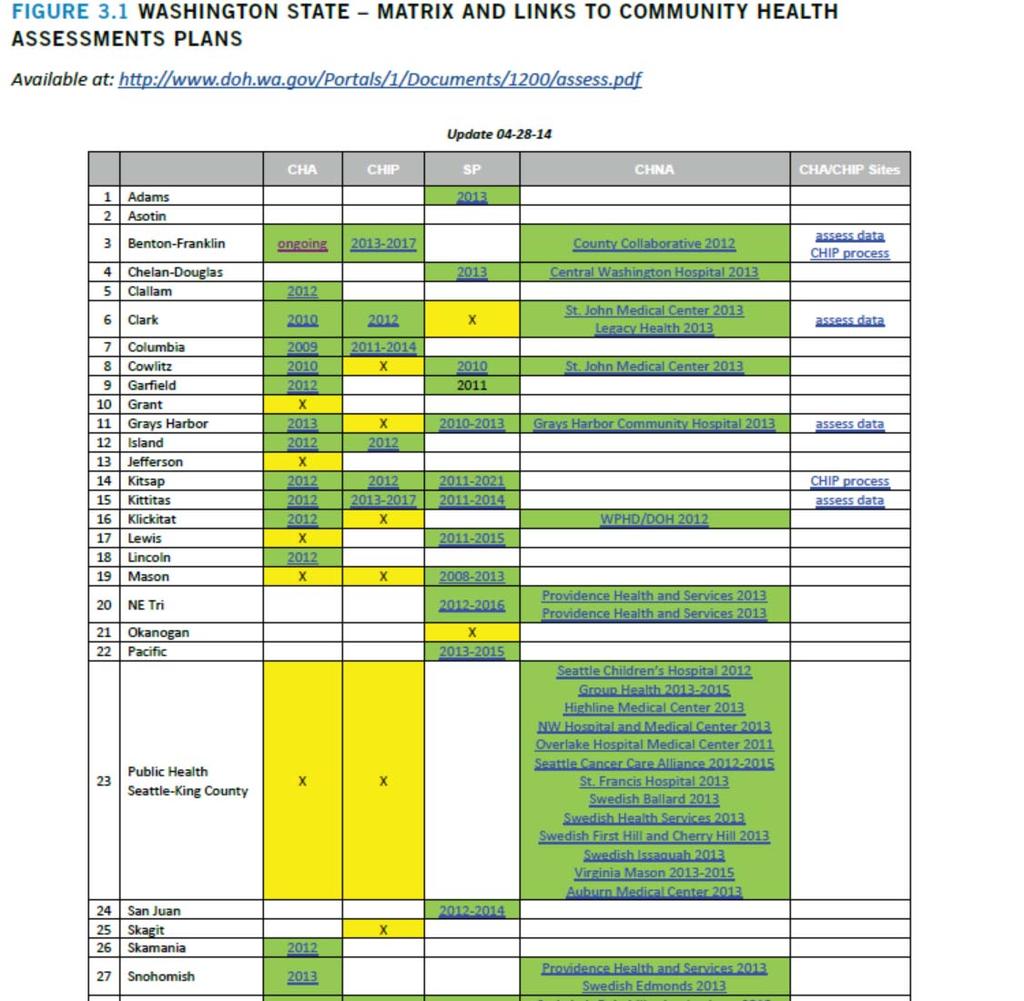
24 Community Level and Regional Level Assessments and Plans
25
26


27 Statewide Data Summaries for Specific Issues

28 National Rankings and Dashboards


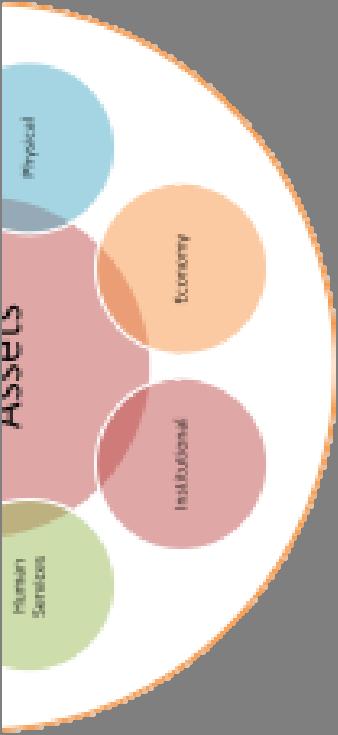

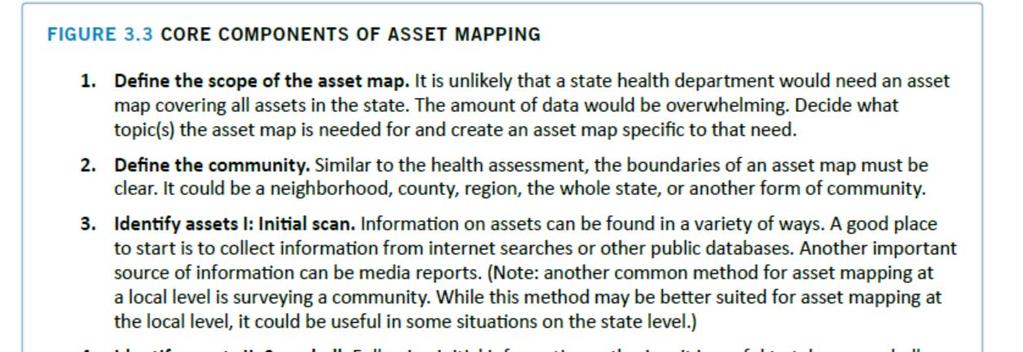
29 Inventory of Assets and Resources
30

31 Identifying Populations Experiencing the Greatest Health Disparities

32 Leveraging Data inputs Sylvia Pirani, MS, MPH, Director Trang Nguyen, MD, DrPH, Deputy Director Priti Irani, MSPH, Research Scientist Office of Public Health Practice New York State Department of Health
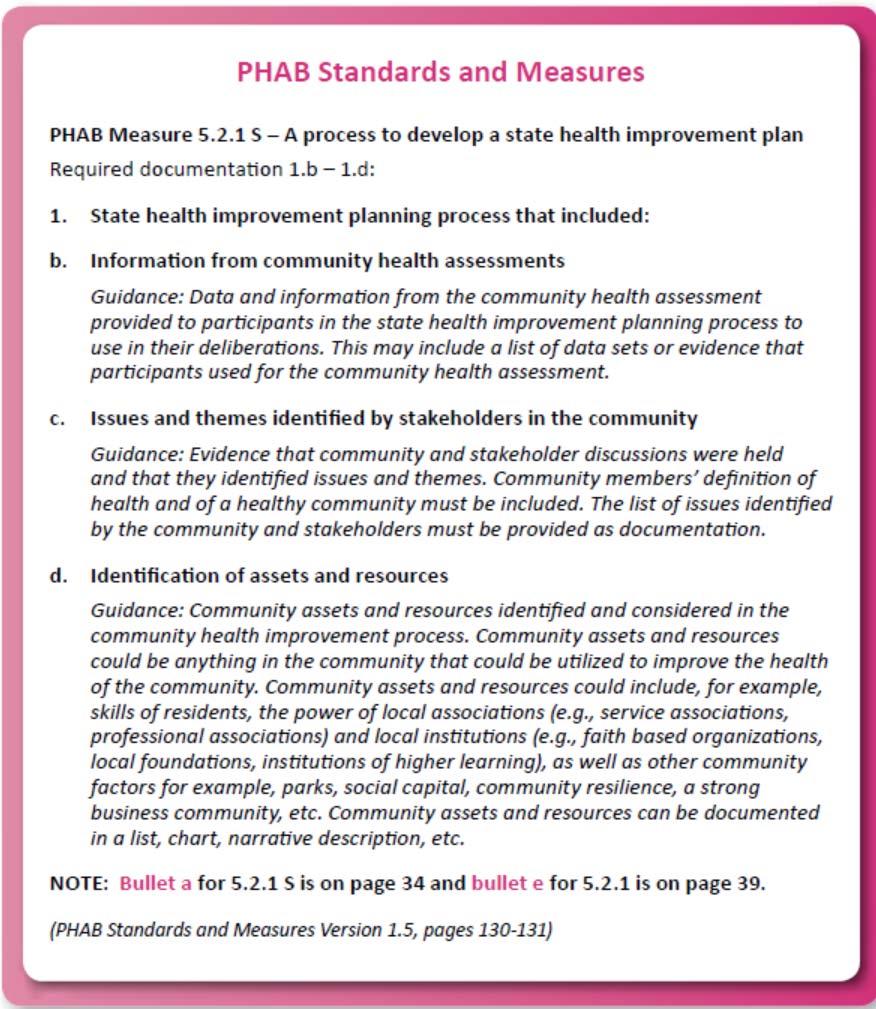
33 How does this work fit with the accreditation required documents? PHAB Domain 1 33 Domain 1: Conduct and Disseminate Assessments Focused on Population Health Status And Public Health Issues Facing the Community Standard 1.1: Participate in or Lead a Collaborative Process Resulting in a Comprehensive Community Health Assessment Measure S: A state partnership that develops a comprehensive state community health assessment of the population of the state: Participation of representatives from a variety of state sectors Regular meetings or communications with partners The process used to identify health issues and assets
34 PHAB Domain 1 (cont d) 34 Measure S: A state level community health assessment Required documentation 1: A state level community health assessment that includes: - a. Data and information from various sources contributed to the community health assessment and how the data were obtained - b. Demographics of the population - c. Description of health issues and descriptions of specific population groups with particular health issues and health disparities or inequities - d. Description of factors that contribute to the state populations health challenges - e. Description of existing state assets or resources to address health issues Required documentation 2: Opportunity for the state population at large to review drafts and contribute to the community health assessment Required documentation 3: The ongoing monitoring, refreshing, and adding of data and data analysis
35 35 Background New York State Previous State Health Improvement Plan (SHIP): Prevention Agenda Current SHIP: Prevention Agenda New York State SHA and SHIP development in 2012: Assessed progress of cycle; Developed State community health needs assessment (SHA); and Developed State Health Improvement Plan (SHIP) Materials available: NYS PHAB application with pre-requisites submitted December 2012
. Final Priorities based on active participation from members of committee and stakeholder feedback.")
36 36 Prevention Agenda : Steered by Ad Hoc Leadership Group Collaborative effort led by committee appointed by Public Health and Health Planning Council, including leaders from more than 140 organizations (e.g., Healthcare, Business, Academia, CBOs, Local Health Departments, OMH and OASAS). Final Priorities based on active participation from members of committee and stakeholder feedback.
37 37 State Health Assessment Conducted late 2011 to early 2012 and presented to statewide stakeholders in February 2012 to help select five priorities for : Progress to Date on Prevention Agenda Description of Population and General Health Status
38 Progress to Date on Prevention Agenda (State previous SHIP) 38 Goal was to improve the health status of NYS population for the 10 health priority areas via state and local collaboration and interventions with focus on prevention rather than clinical activities. We assessed and summarized progress to date of PA Collaboration between LHDs and hospitals on the implementation of local health improvement plans regarding priorities selected, partners, progress of implementation and gaps and lessons learned Status of leading indicators in the 10 areas, including disparities (summary on slide 20)
39 39 Key Component: Collaborative Community Health Planning Processes Local health departments (n = 58) asked to work with hospitals and community partners to describe community health needs and identify priorities in Community Health Assessments and Municipal Heath Services Plans Non-profit hospitals (n =165) asked to work with LHDs to assess community health issues and identify local priorities in Community Service Plans
40 Prevention Agenda Priorities Selected by Counties Chronic Disease Access to Quality Health Care Access to health care Physical Activity and Nutrition Chronic Disease Community Preparedness Healthy Environment Healthy Mothers, Babies, Children Infectious Disease Mental Health and Substance Abuse Physical Activity and Nutrition 10 Tobacco Use Unintentional Injury 2 0 *N=57
 = 132 * Multiple hospitals may have submitted one CSP 19% 45% Physical Activity and Nutrition 32% Tobacco 10% Community Preparedness Healthy Environment")
41 41 Prevention Agenda Hospital Priorities 70% 62% Access to Quality Health Care Chronic Disease % of CSPs with Selected Priority 60% 50% 40% 30% 20% 10% 0% 50% Chronic Disease Access to health care 6% 3% 18% 6% N* (number of CSPs submitted) = 132 * Multiple hospitals may have submitted one CSP 19% 45% Physical Activity and Nutrition 32% Tobacco 10% Community Preparedness Healthy Environment Healthy Mothers, Healthy Babies, Healthy Children Infectious Disease Mental Health and Substance Abuse Physical Activity and Nutrition Tobacco Use Unintentional Injury

42 42 County Health Department Partners 9% Universities 38% 28% Schools 53% Rural Health Networks 61% Other Health Care Providers 66% 34% Faith Based Orgs. 44% 27% Community HCs 45% CBOs 71% Businesses 47% Universities/colleges Transportation agency Substance abuse agency Schools Rural health networks Other health care providers Mental health agency Faith based organizations Emergency responders Community health center 0% 20% 40% 60% 80% *N=57

43 43 Hospital Partners Universities 31% 5% 12% Schools 49% 29% Other Health Care Providers 18% Faith based 31% 23% Community HCs 40% CBOs Businesses 35% 63% 76% 0% 20% 40% 60% 80% Universities/colleges Transportation agency Substance abuse agency Schools Rural health networks Other health care providers Mental health agency Faith based organizations Emergency responders Community health center Community-based organizations Business

44 LHD Progress on top five priorities

45 Steps taken to implement strategies,
46 46 Challenges Funding to carry out planning and implementation, especially for those counties/partnerships without Heal 9 grants, Competing public health challenges (H1N1), Adapting evidence-based intervention strategies to local communities, Identifying and using short-term improvement measures to assess progress toward Prevention Agenda goals.
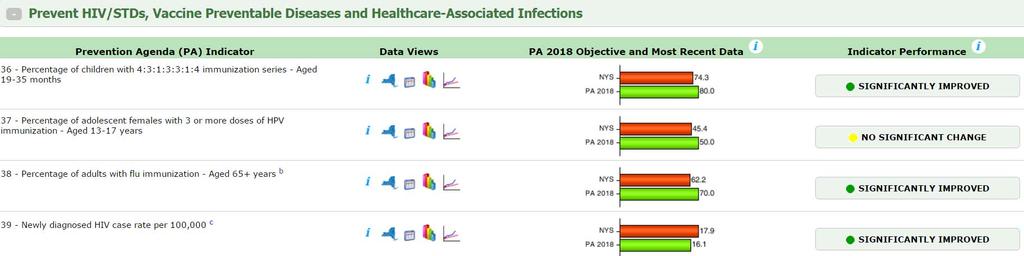
47 47 Progress to Date: 2010 Status Of 51 Prevention Agenda Indicators 35 Indicators improving 3 Indicators achieved target: Coronary Heart Disease Hospitalizations Newly Diagnosed HIV Case Rate Motor Vehicle Related Mortality 14 Indicators moving in the wrong direction 1 Indicator unchanged 1 Indicator no new data Disparities not improving 47
48 Description of Population and General Health Status 48 PHAB: Measure S (b and c) b. Demographic: A description of the demographics of the population served by the state health department c. Description of health issues and descriptions of specific population groups with particular health issues and health disparities or inequities; must include the existence and extent of health inequities between and among specific populations or areas of the state
49 Description of Population Demographics and General Health Status New York State,
50 50 Status for: Maternal and infant health Infectious diseases Chronic diseases Mental health and substance abuse Health risk behaviors Presented: trend data for state and compared to the U.S. and HP2020 objectives, where available; disparities by race/ethnicity, gender, age group, and geographic (county), where available.
51 Population Distribution by Age and Gender, New York State, 2000, <5 Population by Age and Gender for New York State, ,000600,000400,000200, ,000400,000600,000800,000 Data Source: US Census Bureau Females Males <5 Population by Age and Gender for New York State, 2010 Female s Males 800,000600,000400,000200, ,000400,000600,000800,000 Data Source: US Census Bureau Note: the percent change of USA total population(from 2000 to 2010) is 9.7%.
52 Asian non- Hispanic, 1,406,194, 7% American Indian/Alaska Native non- Hispanic 53,908,<1% Population by Race/Ethnicity, New York State, 2010 Two or more races, non- Hispanic, 326,034, 2% Hispanic, 3,416,922, 18% Black non- Hispanic, 2,783,857, 14% White non- Hispanic, 11,304,247, 59% 52 Data source: Census 2010 Redistricting Data
53 53 Percent Change in Population by Race/Ethnicity, New York State, 2000 and Percent Change White non- Hispanic Black non- Hispanic 2.7 American Indian and Alaska Native non-hispanic Asian non- Hispanic 1.7 Native Hawaiian and Other Pacific Islander non- Hispanic Data source: Census 2000 Redistricting Data and Census 2010 Redistricting Data 19.2 Hispanic 2.1 Total
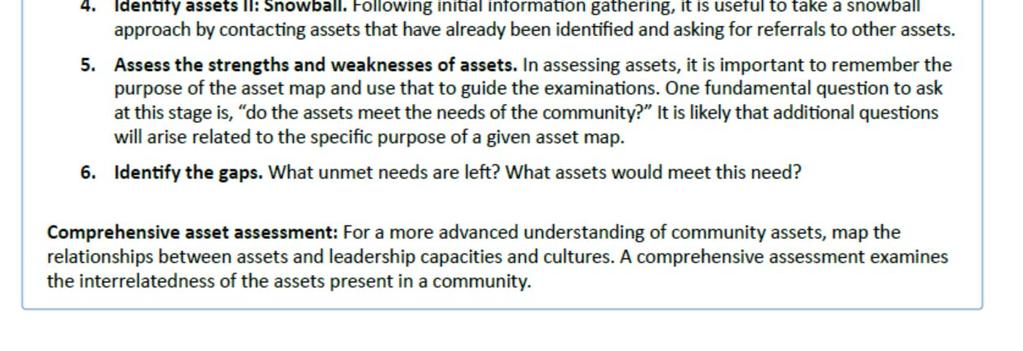
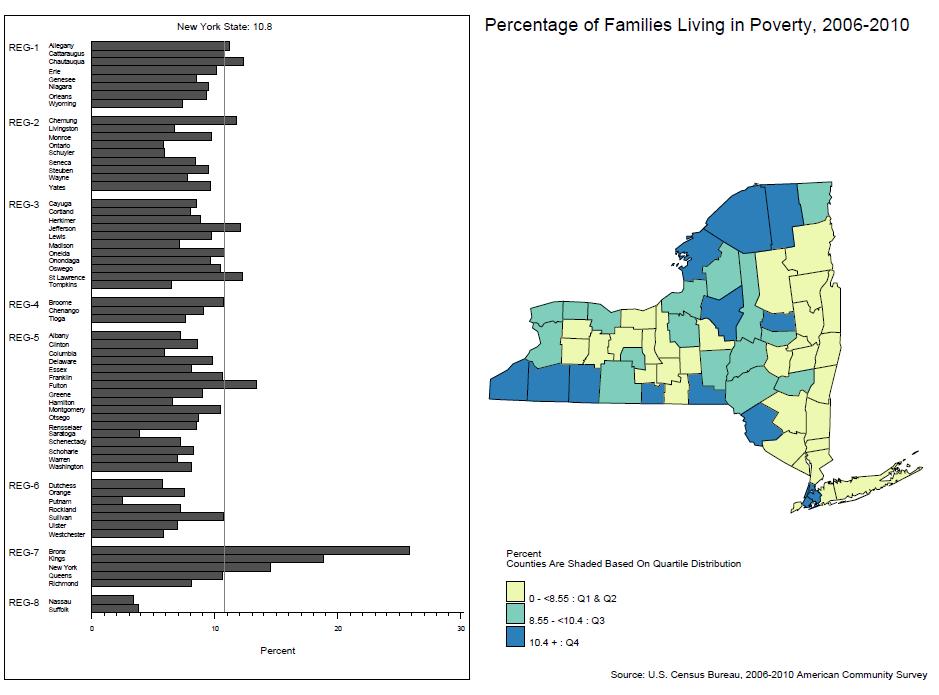
54 54 Income and Poverty New York State and U.S. NYS 2000 NYS 2010 US 2010 Median Household Income $54,148 $50,046 % of Families with Children (Ages <18) Below Poverty 16.9% 17.9% 17.9% % of Families Below Poverty 11.5% 11.5% 11.3% % of Persons Aged 16+ Unemployed 4.3% 6.2% 6.9% Source: U.S. Census Bureau Note: Median Income in 2010 Inflation-adjusted dollars
55 55 55
56 56 Education New York State and U.S. NYS 2000 NYS 2010 High School (4 Year) Graduation Rate* % Persons Aged 25+ who are HS Graduates** 60.5% 70.8% 74.9% 80.0% 84.9% 85.6% % Persons Aged 25+ with Bachelor's 27.4% 32.5% 28.2% *Source: National Center for Education Statistics, Data for school years and ** U S Census Bureau 56
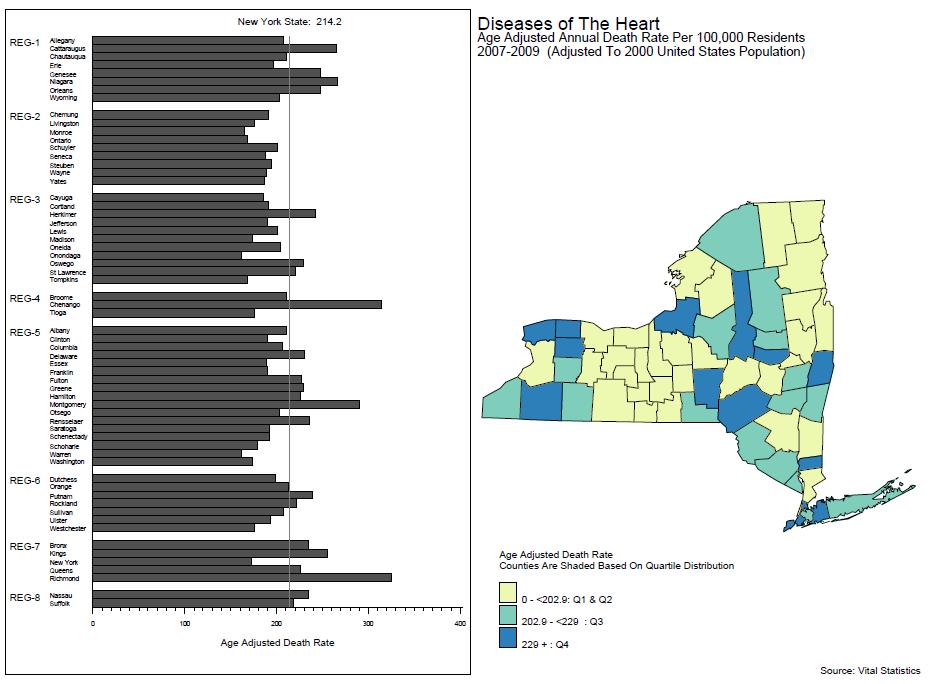
57 Leading Causes of Death, New York State, Heart Disease, 207/100,000 Rate per 100, Cancer, 160/100,000 CLRD, 31/100,000 Stroke, 26/100,000 Pneumonia/flu 20/100,000 Unintentional Injury, 20/100, Heart Disease Cancer CLRD Stroke Pneumonia/Influenza Unintentional Injury
58 Age-Adjusted* Heart Disease Death Rate per 100,000 by Race/Ethnicity, New York State, White/NH Black/NH AsianPI/NH Hispanic * Age-adjusted to U.S. Census 2000 population
59 59
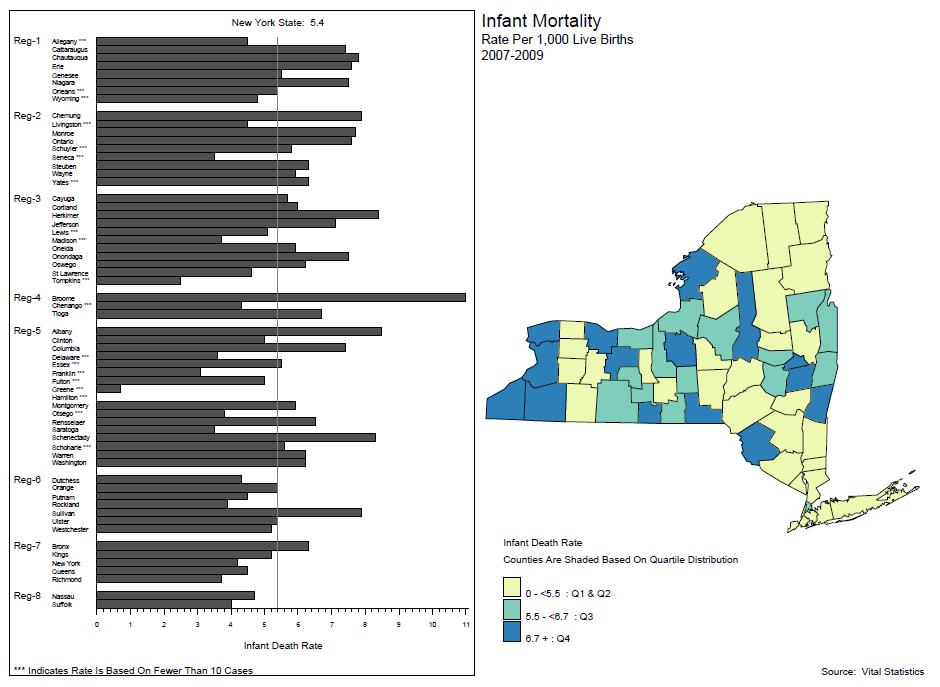
60 Infant Mortality Rate, New York State and U.S., Rate per 1, U.S., 6.7/1, NY State, 5.5/1,000 HP 2020: 5.6/ NY State U.S. Source: America s Health Rankings, 2011 Note: Data are presented by report year and include data years: ( ) - ( ).
61 61 Infant Mortality Rate per 1,000 Live Births by Race/Ethnicity, New York State, HP 2020: 5.6/ White/NH Black/NH AsianPI/NH Hispanic
62 62
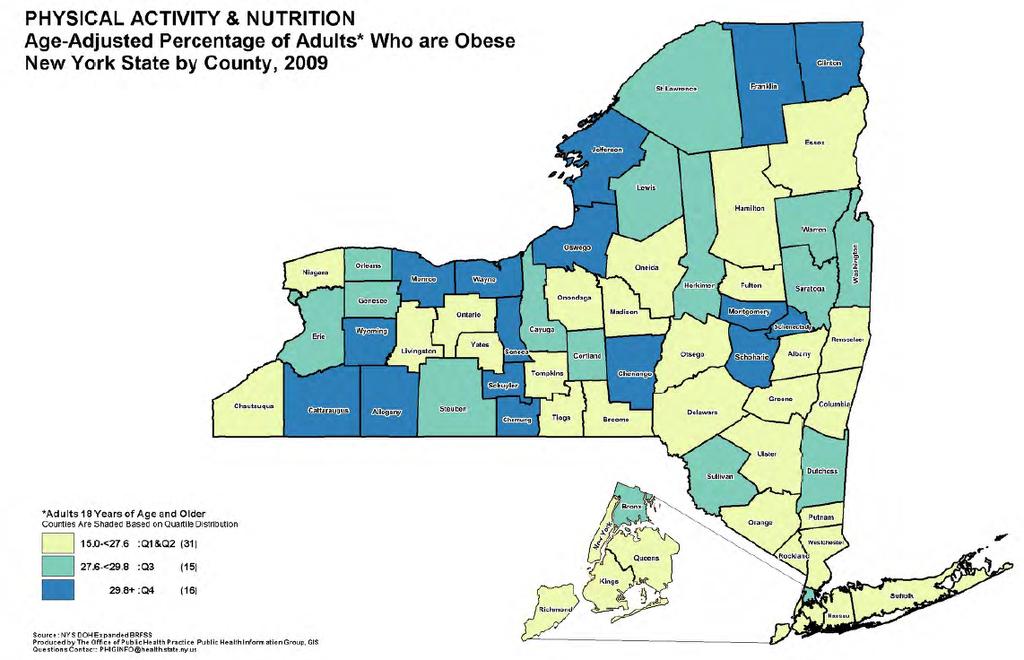
63 Prevalence of Obesity among Children and Adults, New York State and U.S., Adults: HP2020: 30.6% U.S , 27.5% NY State , 24.5% Percent HP2020: 9.6% (Ages 2 5 Years) 2010 NYS -14.5% U.S.-14.4% NY State Adults U.S. Adults NYS WIC Children U.S. WIC Children Source: Behavioral Risk Factor Surveillance System, Adults ages 18+ Pediatric Nutrition Surveillance System, Children ages 2-4 years
64 64
65 65 Indicators are based on the most current data available and range between the years 2007 and Tuberculosis Case Rate HIV New Case Rate*# Asthma Hospitalizations* Drug related Hospitalizations* Infant Mortality Colorectal Cancer Mortality* Fall Hospitalizations, Ages 65+ Suicide Mortality* COPD Hospitalizations, Ages 18+ Breast Cancer Mortality* Unintentional Injury Hospitalizations* Pedestrian Injury Hospitalizations* Stroke Mortality* Binge Drinking, Ages 18+ Lung Cancer Incidence Male* Breastfeeding at 6 Mo, WIC Early Prenatal Care Poor Mental Health, 14+ Days, Ages 18+ Health Care Coverage, Ages 18+ Regular Health Care Provider, Ages 18+ Cigarette Smoking, Ages 18+ Seen Dentist in Past Year, Ages 18+ Index of Disparity for Public Health Priority Areas, New York State, % 140% 194% 65% 78%83% 65% 64% 53% 44% 42% 33% 38% 39% 42% 42% 23% 26% 29% 32% 33% 23% 23% 23% 20% 22% 23% 13% 15% 19% 19% 4% 5% 6% 6% 6% 7% 7% 8% 9% 9% 10% 12% *Rate age adjusted to the 2000 US population **Rate for New York State, excluding New York City # Rate includes Hispanics and Non Hispanics 0% 50% 100% 150% 200% 250%

66 Sharing and Communicating with Stakeholders 66 Meeting agendas and materials shared:


67 67 Stakeholder feedback = Survey + Discussions Source:
68 68 Stakeholder Feedback Strengths Specificity of priorities Local health departments and hospitals encouraged to collaborate Five Priorities Prevent chronic diseases Promote a healthy and safe environment. Promote healthy women, infants and children. Promote mental health and prevent substance abuse. Prevent HIV, STDs, vaccine-preventable diseases and health care-associated infections Challenges Priorities too broad e.g. access to care Resources: Funding, data, Address Challenges: Focus on disparities and social determinants of health Include long-term indicators and intermediate measures Source:
69 69 State Health Assessment (cont d) PHAB: Measure S (d and e) After five priority areas were selected, data were analyzed within each of the five priority areas to assess and develop d. Contributing Causes of Health Challenges e. Summary of State Assets These documents were used to support the selection and development of SHIP intervention strategies and recommendations, as well as tracking indicators to monitor progress of SHIP implementation
70 70 Contributing Causes of Health Challenges Contents: Background, health burden and trend data, disparities (SES and geographic), risk factors, and challenges in addressing the disease/condition Link:
71 71 Summary of State Assets Content summary: identified programs and partners available that can contribute to policies and existing resources for each health issue to address the five health priorities. Link:
72 72 Data Used to Support Implementation of SHIP Prevention Agenda Tracking Dashboard: Local CHAs/CHIPs and annual progress on the implementation of local plans from LHDs and hospitals: /implementation/chip_csp/index.htm Sharing progress with statewide stakeholders: planning_council/meetings/ /docs/ad_hoc_committee_slides.pdf
73 73

74 Click on the County Dashboard to view more data 74
75 Select another indicator to view trend data 75

76 To select other indicators below county level 76
77 77 PHAB feedback on NYS accreditation application and site visit The New York State Department of Health has an outstanding partnership with stakeholders and community organizations including local health departments. The level of collaboration was clearly evident in multiple site visit meetings. The strength of collaboration is most evident in the success of NYS DOH's state health improvement plan called "The Prevention Agenda." NYS DOH has been highly successful engaging partners across the state in the implementation of the Prevention Agenda. NYS DOH has used the local health department contracting process to guarantee commitment to community level implementation. well-organized and informative. The process of combining the review of an older SHIP with a new assessment leading to an updated SHIP seemed to work well for partners.. impressively evidence-based, easy to understand and comprehensive

78 Questions?? Hit *1 on your telephone key pad and the operator will queue you up to speak directly with the presenters Our presenters are excited to speak with their peers directly so we encourage you to use this function!
79 THANK YOU! For further information, do not hesitate to contact me: Denise Pavletic
People 2010 Goal Agenda 2013 Objective 6.3 (5.0 HP 2010)
") Maternal Mortality rate per live births NYS Status / 2005-2007 1 2005 9 2005-2007 1 2010 Health People Ontario 0.0~ 15.1 16.7 3.3 Early prenatal care - % of live births 2004-2006 1 2003-2005 11 2004-2006
Maternal Mortality rate per live births NYS Status / 2005-2007 1 2005 9 2005-2007 1 2010 Health People Ontario 0.0~ 15.1 16.7 3.3 Early prenatal care - % of live births 2004-2006 1 2003-2005 11 2004-2006
Service Area: Herkimer, Fulton & Montgomery Counties. 140 Burwell St. 301 N. Washington St. Little Falls, NY Herkimer, NY 13350
 2016 Community Service Plan & Community Health Improvement Plan & Herkimer County Public Health Service Area: Herkimer, Fulton & Montgomery Counties Bassett Healthcare Network s Little Falls Hospital Herkimer
Consolidated Project Information Project 4.b.ii Access to Chronic Disease Preventive Care Initiative
 Consolidated Project Information Project 4.b.ii Access to Chronic Disease Preventive Care Initiative Contents 4.b.ii Increase Access to High Quality Chronic Disease Preventative Care and Management in
2018 Community Health Assessment
 2018 Community Health Assessment Community Health Status Assessment Linn County, IA Prepared by Amy Hockett, PhD, MPH, CHES Epidemiologist Linn County Public Health August 9, 2018 Community Health Status
Community Health Assessment. May 21, 2014
 Community Health Assessment May 21, 2014 1 Presenters Stacey Adams, MS Co-Leader Domain 1 Carol Heier, LCSW Accreditation Coordinator Dale Quinney, MPH Co-Leader Domain 1 2 Recording available There is
Walworth County Health Data Report. A summary of secondary data sources
 Walworth County Health Data Report A summary of secondary data sources 2016 This report was prepared by the Design, Analysis, and Evaluation team at the Center for Urban Population Health. Carrie Stehman,
2016 Community Service Plan & Community Health Improvement Plan
 2016 Community Service Plan & Community Health Improvement Plan A.O. Fox Memorial Hospital The Mary Imogene Bassett Hospital (dba: Bassett Medical Center) & Otsego County Health Department Service Area:
Demographics and Health Data
 Demographics and Health Data Information for Local Planners City of Puyallup, WA Demographic Characteristics Environmental Health Division 3629 South D Street, Tacoma, WA 98418 (253) 798-6470 Table 1 presents
Consolidated Project Information Project 4.a.ii Substance Abuse Prevention and Identification Initiative
 Consolidated Project Information Project 4.a.ii Substance Abuse Prevention and Identification Initiative Contents 4.a.ii Prevent Substance Abuse and Other Mental Emotional Disorders (Focus Area 2)... 3
Demographics and Health Data
 Demographics and Health Data Information for Local Planners City of Lakewood, WA Demographic Characteristics Environmental Health Division 3629 South D Street, Tacoma, WA 98418 (253) 798-6470 Table 1 presents
MARICOPA COUNTY COMMUNITY HEALTH ASSESSMENT. Maricopa County Board of Health July 23, 2012 Eileen Eisen-Cohen, PhD
 MARICOPA COUNTY COMMUNITY HEALTH ASSESSMENT Maricopa County Board of Health July 23, 2012 Eileen Eisen-Cohen, PhD 1 What? Why? We Are Here 2 Local Public Health System Faith Instit. Military Dentists Labs
HealtheCNY Indicator List by Data Source
 American Community Survey 23 Adults with Health Insurance Children Living Below Poverty Level Children with Health Insurance Families Living Below Poverty Level Homeowner Vacancy Rate Homeownership Households
Assessing Health Disparities and Closing the Gap
 Assessing Health Disparities and Closing the Gap.an overview Florida Department of Health Objectives Understand basic use of FLHealthCHARTS Understand the concept of social determinants of health Understand
In Health Matters, Place Matters - The Health Opportunity Index (HOI) Virginia Department of Health Office of Health Equity
 Virginia Department of Health Office of Health Equity") In Health Matters, Place Matters - The Health Opportunity Index (HOI) Virginia Department of Health Office of Health Equity 1 Identifying the Problem America s Health Rankings United Health Foundation
In Health Matters, Place Matters - The Health Opportunity Index (HOI) Virginia Department of Health Office of Health Equity 1 Identifying the Problem America s Health Rankings United Health Foundation
Healthy Connecticut 2020: A Call to Action
 C O N N E C T I C U T HEALTH IMPROVEMENT PLANNING COALITION Healthy Connecticut 2020: A Call to Action Kristin L. Sullivan, MA Public Health Systems Improvement Connecticut Department of Public Health
Pierce County Health Indicators
 Pierce County Health Indicators 3629 S. D. St., Tacoma WA 98418-6813 Phone: 253-798-7668 email: oapi@tpchd.org Demographics Characteristics Latest Year count Percent WA State count Percent Data Source
Pierce County Health Indicators
 Pierce County Health Indicators Updated 11/10/2016 Demographics Characteristics Latest Year count Percent WA State count Percent Total Population 2015 830,120 7,061,408 2015 Total Percent Total Percent
Jackson Hospital Community Health Needs Assessment. Fiscal Year 2016
 Jackson Hospital Community Health Needs Assessment Fiscal Year 2016 JACKSON HOSPITAL AT A GLANCE Jackson Hospital, located in Montgomery, Alabama, is a not-for-profit organization committed to improving
LEADING CAUSES OF DEATH, EL DORADO,
 LEADING CAUSES OF DEATH, EL DORADO, 2006-2010 EL DORADO COUNTY HEALTH SERVICES DEPARTMENT DIVISON OF PUBLIC HEALTH Date: 05/12/2011 CREATED BY OLIVIA BYRON-COOPER, MPH EPIDEMIOLOGIST LEADING CAUSES OF
Franklin County The Health of Our Communities
 Franklin County The Health of Our Communities Paul Smith s College May 1, 2013 1 Welcome and Introductions Meeting Agenda New York State s Health Improvement Plan (Prevention Agenda 2013-2017) Franklin
An Aging Population Why This Matters to Public Health. Health Data On the Older Adult Population. Opportunities For Public Health
 Healthy Aging in Oregon Kirsten Aird, MPH Cross Agency Systems Manager Public Health Division www.nwcphp.org/hot-topics Presentation Overview 1 An Aging Population Why This Matters to Public Health 2 Health
Introduction to the HIA Process. What makes us healthy? What is HIA? How is HIA done?
 Introduction to the HIA Process What makes us healthy? What is HIA? How is HIA done? Source: Lots to Lose: How America s Health and Obesity Crisis Threatens our Economic Future (2012) $4,000 4 Years Social
WASHINGTON STATE COMPARISONS TO: KITSAP COUNTY CORE PUBLIC HEALTH INDICATORS May 2015
 WASHINGTON STATE COMPARISONS TO: KITSAP COUNTY CORE PUBLIC HEALTH INDICATORS This is a companion document to the Core Public Health Indicators that provides a comparison of to Washington State for the
Arizona Health Improvement Plan
 Arizona Health Improvement Plan Arizona Alliance for Community Health Centers February 4, 2015 Will Humble, MPH ADHS Director Leading Health Issues State Health Assessment Obesity Behavioral Health Services
2013 Arizona State Health Assessment Summary and Findings. Health and Wellness for all Arizonans
 2013 Arizona State Health Assessment Summary and Findings Health and Wellness for all Arizonans Presentation Overview The State Health Assessment Process Health Indicators 15 Leading Health Issues: o County
Health Status Disparities in New Mexico Identifying and Prioritizing Disparities
 Health Status Disparities in New Mexico Identifying and Prioritizing Disparities Public Health Division March 23 Health Status Disparities in New Mexico Identifying and Prioritizing Disparities New Mexico
Prince George s County Health Department Health Report Findings
 Prince George s County Health Department 2018 Health Report Findings Our Residents Socioeconomic Factors Compared to Maryland, Prince George s residents: have a higher median household income, are employed
2014 Butte County BUTTE COUNTY COMMUNITY HEALTH ASSESSMENT
 2014 Butte County BUTTE COUNTY COMMUNITY HEALTH ASSESSMENT EXECUTIVE SUMMARY 2015 2017 EXECUTIVE SUMMARY TOGETHER WE CAN! HEALTHY LIVING IN BUTTE COUNTY Hundreds of local agencies and community members
Tuscarawas County Health Department
 Tuscarawas County Health Department Community Health Needs Assessment 214 TUSCARAWAS COUNTY HEALTH DEPARTMENT Community Health Needs Assessment 214 Assessment Commissioned by: Dr. James Hubert D.O Health
M.A.P. II. Monitoring and Assessment Project Executive Summary. Infectious Diseases. Chronic Diseases. Tarrant County Public Health
 M.A.P. II Monitoring and Assessment Project 2002-2004 Environmental Health Social & Mental Health Injuries Chronic Diseases County Maternal & Child Health Infectious Diseases County Public Health Safeguarding
LPHA Contractor: Wright County Health Department. LPHA Administrator/Director or Designee: Tracy Hardcastle. Report Prepared By:
 LPHA Contractor: Wright County Health Department LPHA Administrator/Director or Designee: Tracy Hardcastle Report Prepared By: Contact Telephone Number: Date: 1. Please describe (summarize) the methodology
ALACHUA COUNTY COMMUNITY HEALTH ASSESSMENT
 ALACHUA COUNTY COMMUNITY HEALTH ASSESSMENT JUNE 2016 This page intentionally left blank. ALACHUA COUNTY COMMUNITY HEALTH ASSESSMENT (CHA) Contents Executive Summary 4 The Alachua Community Health Assessment
Healthy People 2010 Leading Health Indicators: California, 2000
 January 4 DATA SUMMARY No. DS4- Healthy People Leading Health Indicators: California, By Jim Sutocky This report focuses on the Healthy People Leading Health Indicators (LHIs). H i g h l i g h t s As of
HOSPITAL AUTHORITY OF VALDOSTA & LOWNDES COUNTY, GEORGIA COMMUNITY HEALTH NEEDS ASSESSMENT SGMC LANIER CAMPUS
 HOSPITAL AUTHORITY OF VALDOSTA & LOWNDES COUNTY, GEORGIA COMMUNITY HEALTH NEEDS ASSESSMENT SGMC LANIER CAMPUS July 16, 2015 DRAFT Allison McCarthy Principal 70 Old Field Road, Plymouth, MA 02360 Tel/Fax:
Influenza Strategies for At-Risk Populations
 Catherine D. Torres, M.D., Cabinet Secretary Influenza Strategies for At-Risk Populations National Influenza Vaccine Summit May 10, 2011 New Mexico s Population New Mexico is a majority-minority state
National Comprehensive Cancer Control Program Reviewer Training March 16, 2017
 FOA DP17-1701 Cancer Prevention and Control Programs for State, Territorial, and Tribal Organizations National Comprehensive Cancer Control Program Reviewer Training March 16, 2017 Angela Moore, MPH, Team
Lincoln Trail District Health Department. Health Report Card
 Lincoln Trail District Health Department 2015 Health Report Card 108 New Glendale Road, Elizabethtown, KY 42701 Phone: 270-769-1601 Fax: 270-765-7274 Website: www.ltdhd.ky.gov Mission The Lincoln Trail
Community Health Profile: Minnesota, Wisconsin, & Michigan Tribal Communities 2006
 Community Health Profile: Minnesota, Wisconsin, & Michigan Tribal Communities 26 This report is produced by: The Great Lakes EpiCenter If you would like to reproduce any of the information contained in
PHACS County Profile Report for Searcy County. Presented by: Arkansas Center for Health Disparities and Arkansas Prevention Research Center
 PHACS County Profile Report for Searcy County Presented by: Arkansas Center for Health Disparities and Arkansas Prevention Research Center Contents Introduction... Page 2 Demographics...Page 3 Social Environment
COMMUNITY HEALTH NEEDS ASSESSMENT AND IMPROVEMENT PLANNING
 COMMUNITY HEALTH NEEDS ASSESSMENT AND IMPROVEMENT PLANNING Theresa Green, MBA, PhD Candidate Director of Community Health Policy and Education, Center for Community Health Faculty, Public Health Sciences
San Diego County Health Briefs North Coastal Region
 Non-Communicable Disease This brief contains 2009 chronic disease health data for the of San Diego County. Data are provided from the Community Health Statistics Unit and the 2009 California Health Interview
Moving Forward in 2010 Health Status by Race and Ethnicity
 Health Status by Race and Ethnicity 2005 Versus 2010 April Young Bennett, MPA Utah Department of Health, Center for Multicultural Health/ Office of Health Disparities Reduction Methods Analysis Years:
Texas Department of State Health Services and the Michael & Susan Dell Center for Healthy Living for providing data used in this report
 Acknowledgements Authors: Eileen Nehme, PhD MPH Nagla Elerian, MS Jay Morrow, DVM MPH Dorothy Mandell, PhD Ella Puga, MPH Divya Patel, PhD MPH David Lakey, MD Additional thanks and acknowledgements to:
2016 PRC Community Health Needs Assessment
 2016 PRC Community Health Needs Assessment Staunton City, Waynesboro City, and Augusta County, Virginia Prepared for: Augusta Health By Professional Research Consultants, Inc. The PRC Community Health
Office of Minority Health (OMH) at Work in Indian Country
 at Work in Indian Country") Office of Minority Health (OMH) at Work in Indian Country J. Nadine Gracia, MD, MSCE Deputy Assistant Secretary for Minority Health Director, Office of Minority Health U.S. Department of Health and Human
Office of Minority Health (OMH) at Work in Indian Country J. Nadine Gracia, MD, MSCE Deputy Assistant Secretary for Minority Health Director, Office of Minority Health U.S. Department of Health and Human
Washington State Getting to the End of AIDS
 Washington State Getting to the End of AIDS Tamara Jones End AIDS Washington Policy & Systems Coordinator Office of Infectious Disease Washington State Department of Health 1 End AIDS Washington Developing
Health System Members of the Milwaukee Health Care Partnership
 Health System Members of the Milwaukee Health Care Partnership Aurora Health Care Children s Hospital of Wisconsin Columbia St. Mary s Health System Froedtert Health Wheaton Franciscan Healthcare In Collaboration
Manatee County Community Health Assessment 2015
 Manatee County Community Health Assessment 2015 W E L L N E S S C O M M I T T E E M A N A T E E H E A L T H C A R E A L L I A N C E 7 / 3 0 / 1 5 Overview Background 4 Subcommittee Findings Community Health
2014 Edition RHODE ISLAND
 214 RHODE ISLAND America's Health Rankings is the longest running comparative health index of states. It uses measures of behavior, community and environment, policy, clinical care, and health outcomes
2014 Edition TENNESSEE
 214 TENNESSEE America's Health Rankings is the longest running comparative health index of states. It uses measures of behavior, community and environment, policy, clinical care, and health outcomes to
Improve Health Status and Reduce Health Disparities
 Improve Health Status and Reduce Health Disparities Indicator Prevention Agenda 2017 Objective NYS NYS excl. NYC (Upstate) Capital Region (6 ) Summary Albany Schenectady Rensselaer YEAR Rate Rate & # Rate
Reducing Maternal Mortality & Morbidity Surveillance & Action
 Reducing Maternal Mortality & Morbidity Surveillance & Action Marilyn Kacica, MD, MPH Medical Director Division of Family Health February 14, 2018 February 14, 2018 2 Presentation Overview Surveillance
Health of the City & Community Health Improvement Planning. Raynard Washington, PhD, MPH Chief Epidemiologist
 Health of the City & Community Health Improvement Planning Raynard Washington, PhD, MPH Chief Epidemiologist What is the Community Health Assessment (CHA)? An annual assessment of population health in
Data Disaggregation to Inform Health Policy
 Data Disaggregation to Inform Health Policy Minh Wendt Data Policy Lead Division of Policy & Data Office of Minority Health Department of Health and Human Services The Report of the Secretary s Task Force
Straub Clinic and Hospital Implementation Strategy Plan. May 2013
 Straub Clinic and Hospital Implementation Strategy Plan May 2013 Table of Contents 1 Introduction... 1 2 Community Served by Straub Clinic and Hospital... 2 3 Community Benefit Planning Process... 3 3.1
Washoe County Community Health Needs Assessment EXECUTIVE SUMMARY
 2018 2020 Washoe County Community Health Needs Assessment EXECUTIVE SUMMARY The 2018-2020 Washoe County Community Health Needs Assessment was sponsored in full by the Washoe County Health District and
Redington-Fairview General Hospital Community Health Needs Assessment Annual Report
 Redington-Fairview General Hospital 2017 Community Health Needs Assessment Annual Report Original Community Needs Assessment: November 2007 Updated: January 2010; April 2012, September ; August 2015; July
Racial and Ethnic Health Disparities Report Card, 7th Edition
 Racial and Ethnic Health Disparities Report Card, 7th Edition September 2012 Department of Health 1190 South St. Francis Drive Santa Fe, NM 87502 www.nmhealth.org/opa/ Produced by the Office of Health
Community Health Profile: Minnesota, Wisconsin & Michigan Tribal Communities 2005
 Community Health Profile: Minnesota, Wisconsin & Michigan Tribal Communities 25 This report is produced by: The Great Lakes EpiCenter If you would like to reproduce any of the information contained in
The Kirwan Institute is entering its second decade of working to create a just and inclusive
 /KirwanInstitute www.kirwaninstitute.osu.edu Health Equity Program 2014 Development of the Kirwan Institute s Health Equity Program The Kirwan Institute is entering its second decade of working to create
Cover Sheet for Example Documentation
 Cover Sheet for Example Documentation Please complete the following form and submit along with your documentation. If you have any questions, please email us at accreditation@astho.org. The following documentation
Multnomah County Health Department
 Multnomah County Health Department Racial & Ethnic Health Disparities: 2011 Update Racial and Ethnic Health Disparities and Rate Trends Multnomah County: 1994- Healthy Birth Initiative African American
Mark B Horton, MD, MSPH 22 March 2011
 Mark B Horton, MD, MSPH 22 March 2011 Major Points Need for better data Focus on disparities Focus on social determinants Focus on healthy communities Focus on health care quality Public Health Data Sources
Chronic Disease Challenges and Solutions
 Chronic Disease Challenges and Solutions Janet Collins, PhD Director, Division of Nutrition, Physical Activity and Obesity, CDC Council of State Governments Kansas City, MO September 18, 2013 Centers for
Canarsie / Flatlands
 Keeping Brooklyn Healthy by Assessing Population Health and Driving Innovation 11234, 11236, 11239 Neighborhood at a glance Population: 195,027 TBHC Service Areas: Outside the Service Area for The Brooklyn
STAKEHOLDER ENGAGEMENT IN WISCONSIN S NEEDS ASSESSMENT PROCESS
 STAKEHOLDER ENGAGEMENT IN WISCONSIN S NEEDS ASSESSMENT PROCESS Association of Maternal and Child Health Programs Needs Assessment Training January 7, 2015 2 Wisconsin s Needs Assessment Stakeholder Groups
American Indian Initiative to Prevent and Reduce the Use of Commercial Tobacco Products
 American Indian Initiative to Prevent and Reduce the Use of Commercial Tobacco Products APRIL ROESELER, BRANCH CHIEF, CALIFORNIA TOBACCO CONTROL PROGRAM JENNY WONG, CHIEF, HEALTH EQUITY & LOCAL PROGRAMS
2012 Assessment of St. Lucie County s Social, Health, and Public Safety Services
 2012 Assessment of St. Lucie County s Social, Health, and Public Safety Services April 5, 2013 140 Intracoastal Pointe Drive, Suite 212 Jupiter, FL 33477-5064 561.744.5662 Fax: 561.575.7396 www.sra-researchgroup.com
New Mexico Department of Health. Racial and Ethnic Health Disparities Report Card
 New Mexico Department of Health Racial and Ethnic Health Disparities Report Card August 30, 2006 Acknowledgments Many individuals contributed to the production of this report card and the Office of Policy
Leading Together. Public Health & Mental Health Partners Collaborating to Address Health Disparities
 Leading Together Public Health & Mental Health Partners Collaborating to Address Health Disparities Association of State and Territorial Health Officials NAATPN, Inc. National Behavioral Health Network
Adventist HealthCare Washington Adventist Hospital Community Health Needs Assessment Implementation Strategy. Adopted May 15, 2017
 Adventist HealthCare Washington Adventist Hospital 2017-2019 Community Health Needs Assessment Implementation Strategy Adopted May 15, 2017 Implementation Strategy Development & Adoption Adventist HealthCare
HIP Year 2020 Health Objectives related to Perinatal Health:
 PERINATAL HEALTH Perinatal health is the health and wellbeing of mothers and babies before, during, and after child birth. As described by Healthy People 2020, Pregnancy can provide an opportunity to identify
HAMILTON COUNTY DATA PROFILE ADULT CIGARETTE SMOKING. North Country Population Health Improvement Program
 HAMILTON COUNTY DATA PROFILE ADULT CIGARETTE SMOKING North Country Population Health Improvement Program HAMILTON COUNTY DATA PROFILE: ADULT CIGARETTE SMOKING INTRODUCTION The Hamilton County Data Profile
Mission: To protect and improve the health and well-being of all Arkansans IMPACT OF POTENTIAL CUTS TO FEDERAL FUNDING
 nathaniel.smith@arkansas.gov (501) 1-00 ABOUT STATE PUBLIC HEALTH State health agencies are working across the country to actively protect the public s health, prevent avoidable diseases and conditions,
Research on Women s s Healthcare at the Agency for Healthcare Research and Quality
 Research on Women s s Healthcare at the Agency for Healthcare Research and Quality Shakeh J. Kaftarian, Ph.D. Senior Advisor, Women s s Health and Gender Research Meeting of the IOM Committee on Women
Oklahoma City-County WELLNESS SCORE: occhd.org
 Oklahoma City-County WELLNESS SCORE: 2014 OKLAHOMA COUNTY HEALTH INDICATORS Indicators of Health Crime Built Environment Socioeconomic Accessibility Disease Burden Chronic Disease Infectious Disease Maternal
Nutrition and Physical Activity
 Nutrition and Physical Activity Lifestyle choices made early in life have a significant impact on the patterns of chronic disease developed in adulthood. In the U.S., poor diet and physical inactivity
FLHealthCHARTS.com Update List
 Released = New data, statistical brief, or analytic report not previously posted on FLHealthCHARTS. Added = New features or indicators not previously posted on FLHealthCHARTS. Updated = Change to data
Table of Contents INTRODUCTION... 2 METHODOLOGY Appendix 1 Comparison of Peer Counties... 6
 Table of Contents INTRODUCTION... 2 METHODOLOGY... 4 Appendix 1 Comparison of... 6 Appendix 2 Key Findings from the MAPP Assessments... 7 BARRIERS TO HEALTHCARE ACCESS... 7 HEALTH STATUS... 9 DEATH INDICATORS...
Keeping Brooklyn Healthy by Assessing Population Health and Driving Innovation. Neighborhood Health Profiles Greenpoint 11211, 11222
 Keeping Brooklyn Healthy by Assessing Population Health and Driving Innovation 11211, 11222 Population: 127,051 TBHC Service Areas: Primary service area: 11211 Neighborhood Profiles 2015 : Williamsburg
Measuring Equitable Care to Support Quality Improvement
 Measuring Equitable Care to Support Quality Improvement Berny Gould RN, MNA Sr. Director, Quality, Hospital Oversight, and Equitable Care Prepared by: Sharon Takeda Platt, PhD Center for Healthcare Analytics
Hep B United National Summit Report July 27-29, 2016 Washington, D.C.
 Hep B United National Summit Report July 27-29, 2016 Washington, D.C. Introduction and Summit Goals The 4th Annual Hep B United National Summit was held in Washington, D.C. July 27-29, 2016, coinciding
University of Wisconsin School of Medicine and Public Health The County Health Rankings Model of Population Health
 University of Wisconsin School of Medicine and Public Health The County Health Rankings Model of Population Health Institute of Medicine January 21, 2010 Washington DC Outline Background and rationale
Executive Summary To access the report in its entirety, visit
 Executive Summary To access the report in its entirety, visit http://www.hpcswf.com/health-planning/health-planningprojects/. Demographic and Socioeconomic Characteristics Population Demographics has a
Chronic Diseases, Injury Kansas Department of Health and Environment, Bureau of Health Promotion
 Chronic Diseases, Injury Kansas Department of Health and Environment, Bureau of Health Promotion Topeka, Kansas Assignment Description The CDC/CSTE applied chronic disease epidemiology fellow position
Perinatal Health Strategic Plan Update
 Perinatal Health Strategic Plan Update Background and process Perinatal Health Committee, Child Fatality Task Force Preconception Health Strategic Plan Equity in Birth Outcomes Council CoIIN (Collaborative
2017 STATE OF THE COUNTY HEALTH REPORT
 2017 STATE OF THE COUNTY HEALTH REPORT Hyde County, NC From the Lodge to the Lighthouse We re striving for a healthier Hyde 1 About the Report The State of the County Health (SOTCH) Report is created during
Center for Health Disparities Research
 Center for Health Disparities Research EXHIBIT I Legislative Committee on Health Care Document consists of 23 pages. Entire document provided. Due to size limitations, pages provided. A copy of the complete
Tri-County Health Assessment Collaborative 2013 Community Health Needs Assessment Research Review
 Tri- Health Assessment Collaborative 2013 Community Health Needs Assessment Research Review The Tri- Collaborative Three counties Five health systems; 12 hospitals Three health departments Countless community
Overview of Health Disparities in Arkansas
 Overview of Health Disparities in Arkansas Annual Critical Access Hospital Conference August 9, 2018 Joyce Biddle, MPH, MPA Chronic Disease Epidemiologist Office of Minority Health and Health Disparities
Sarpy/Cass Department of Health and Wellness
 This 2012 Community Health Report Card is the product of many community surveys and agency recordkeeping. The staff at the Sarpy/ Department of Health and Wellness finds value in all of this community
Bassett Medical Center PPS Community Profile
 Bassett Medical Center PPS Community Profile Counties served: Delaware, Herkimer, Madison, Otsego, and Schoharie DEMOGRAPHICS 1 The Bassett Medical Center PPS s total population is 278,214. Age: Residents
STEPPING UP YOUR EFFORTS TO REDUCE MENTAL ILLNESS IN JAILS. February 2019
 STEPPING UP YOUR EFFORTS TO REDUCE MENTAL ILLNESS IN JAILS February 2019 Speaker: Nastassia Walsh Nastassia Walsh Program Manager, County Solutions and Innovation National Association of Counties #StepUp4MentalHealth
Nassau Queens PPS Community Profile
 Nassau Queens PPS Community Profile Counties served: Nassau and Queens DEMOGRAPHICS 1 The total population of the two counties served by the Nassau Queens (Nassau University Medical Center) PPS is 3,631,203.
Ten Years Later: How Far Have We Come In Reducing Health Disparities?
 Ten Years Later: How Far Have We Come In Reducing Health Disparities? Howard K. Koh MD, MPH Assistant Secretary for Health Department of Health and Human Services WHO Definition of Health: A state of complete
Health Status of New Mexico 2015
 Health Status of New Mexico 2015 New Mexico Health s Northwest Northeast Metro Southwest Southeast NM Urban-Rural County Classification Metropolitan Counties Small Metro Counties Mixed Urban/Rural Counties
Coney Island. Neighborhood Health Profiles Keeping Brooklyn Healthy by Assessing Population Health and Driving Innovation
 Keeping Brooklyn Healthy by Assessing Population Health and Driving Innovation 11223, 11224, 11229, 11235 Neighborhood at a glance Population: 285,502 TBHC Service Areas: Outside the Service Area for The
Health Profile Chartbook 2016 Kalkaska County
 Health Profile Chartbook 2016 Kalkaska County 2016 Chartbooks The 2016 Chartbooks provide a snapshot of the health status of the District Health Department #10 jurisdiction. Information is presented by
Health Profile Chartbook 2016 Mecosta County
 Health Profile Chartbook 2016 Mecosta County 2016 Chartbooks The 2016 Chartbooks provide a snapshot of the health status of the District Health Department #10 jurisdiction. Information is presented by
CityMatCH At the University of Nebraska Medical Center Curriculum Vitae. Omaha, NE 68104
 CityMatCH At the University of Nebraska Medical Center Curriculum Vitae PERSONAL DATA Name Home Address Campus Address Chad Abresch, MEd 5002 Corby St 68104 Department of Pediatrics CityMatCH University