KETOGENIC DIET DANGEROUS FAD OR MEDICAL MARVEL?
|
|
|
- Tracy Fisher
- 5 years ago
- Views:
Transcription

1 KETOGENIC DIET DANGEROUS FAD OR MEDICAL MARVEL?
2 CONFLICTS OF INTEREST I have no conflicts of interest to report
3 TANYA WILLIAMS MD Drake University BA Biology 1994 Drake University MA Biology 1996 University of Kansas School of Medicine MD 2000 Family Medicine residency completed at University of Kansa School of Medicine 2003 I have been a full time family physician in Dodge City for 15 years Married to David, a dentist 7 Children ranging in age from 21-6 Sports enthusiast
4 OBESITY A MODERN DAY AFFLICTION Dietary Guidelines for Americans were developed in Since that time, obesity rates have consistently risen. The rate of diabetes in 1960 was 1%. Today it is over 12% and that doesn t include the many that are prediabetic.
5 Prevalence of Self-Reported Obesity Among U.S. Adults by State and Territory Definitions Obesity: Body Mass Index (BMI) of 30 kg/m 2 or higher. Body Mass Index (BMI): A measure of an adult s weight in relation to his or her height, calculated by using the adult s weight in kilograms divided by the square of his or her height in meters.
6 Prevalence of Self-Reported Obesity Among U.S. Adults by State and Territory Source of the Data The data were collected through the Behavioral Risk Factor Surveillance System (BRFSS), an ongoing, statebased, telephone interview survey conducted by state health departments with assistance from CDC. Height and weight data used in the BMI calculations were self-reported.
7 Prevalence of Self-Reported Obesity Among U.S. Adults by State and Territory BRFSS Methodological Changes Started in 2011 New sampling frame that included both landline and cell phone households. New weighting methodology used to provide a closer match between the sample and the population.
8 Prevalence of Self-Reported Obesity Among U.S. Adults by State and Territory Exclusion Criteria Used Beginning with 2011 BRFSS Data Records with the following were excluded: Height: <3 feet or 8 feet Weight: <50 pounds or 650 pounds BMI: <12 kg/m 2 or 100 kg/m 2 Pregnant women
9 Prevalence of Self-Reported Obesity Among U.S. Adults by State and Territory, BRFSS, 2011 Prevalence estimates reflect BRFSS methodological changes started in These estimates should not be compared to prevalence estimates before *Sample size <50 or the relative standard error (dividing the standard error by the prevalence) 30%.
10 Prevalence of Self-Reported Obesity Among U.S. Adults by State and Territory, BRFSS, 2012 Prevalence estimates reflect BRFSS methodological changes started in These estimates should not be compared to prevalence estimates before *Sample size <50 or the relative standard error (dividing the standard error by the prevalence) 30%.
11 Prevalence of Self-Reported Obesity Among U.S. Adults by State and Territory, BRFSS, 2013 Prevalence estimates reflect BRFSS methodological changes started in These estimates should not be compared to prevalence estimates before *Sample size <50 or the relative standard error (dividing the standard error by the prevalence) 30%.
12 Prevalence of Self-Reported Obesity Among U.S. Adults by State and Territory, BRFSS, 2014 Prevalence estimates reflect BRFSS methodological changes started in These estimates should not be compared to prevalence estimates before *Sample size <50 or the relative standard error (dividing the standard error by the prevalence) 30%.
13 Prevalence of Self-Reported Obesity Among U.S. Adults by State and Territory, BRFSS, 2015 Prevalence estimates reflect BRFSS methodological changes started in These estimates should not be compared to prevalence estimates before *Sample size <50 or the relative standard error (dividing the standard error by the prevalence) 30%.

14 Prevalence of Self-Reported Obesity Among U.S. Adults by State and Territory, BRFSS, 2016 Prevalence estimates reflect BRFSS methodological changes started in These estimates should not be compared to prevalence estimates before *Sample size <50 or the relative standard error (dividing the standard error by the prevalence) 30%.

15 Prevalence of Self-Reported Obesity Among U.S. Adults by State and Territory, BRFSS, 2017 Prevalence estimates reflect BRFSS methodological changes started in These estimates should not be compared to prevalence estimates before *Sample size <50 or the relative standard error (dividing the standard error by the prevalence) 30%.
16 Prevalence of Self-Reported Obesity Among U.S. Adults by State and Territory, BRFSS, 2011 State Prevalence 95% Confidence Interval Alabama 32.0 (30.5, 33.5) Alaska 27.4 (25.3, 29.7) Arizona 25.1 (23.0, 27.3) Arkansas 30.9 (28.8, 33.1) California 23.8 (22.9, 24.7) Colorado 20.7 (19.7, 21.8) Connecticut 24.5 (23.0, 26.0) Delaware 28.8 (26.9, 30.7) District of Columbia 23.7 (21.9, 25.7) Florida 26.6 (25.4, 27.9) Georgia 28.0 (26.6, 29.4) Guam 27.4 (24.8, 30.2) Hawaii 21.8 (20.4, 23.4) Idaho 27.0 (25.3, 28.9) Illinois 27.1 (25.4, 28.9) Indiana 30.8 (29.5, 32.3) Iowa 29.0 (27.6, 30.3) Kansas 29.6 (28.7, 30.4) Kentucky 30.4 (28.9, 31.9) Louisiana 33.4 (32.0, 34.9) Maine 27.8 (26.8, 28.9) Maryland 28.3 (26.9, 29.7) Massachusetts 22.7 (21.8, 23.7) Michigan 31.3 (30.0, 32.6) Minnesota 25.7 (24.6, 26.8) Mississippi 34.9 (33.5, 36.3) State Prevalence 95% Confidence Interval Missouri 30.3 (28.6, 32.0) Montana 24.6 (23.3, 26.0) Nebraska 28.4 (27.6, 29.2) Nevada 24.5 (22.5, 26.6) New Hampshire 26.2 (24.7, 27.7) New Jersey 23.7 (22.7, 24.8) New Mexico 26.3 (25.1, 27.6) New York 24.5 (23.2, 25.9) North Carolina 29.1 (27.7, 30.6) North Dakota 27.8 (26.3, 29.4) Ohio 29.6 (28.3, 31.0) Oklahoma 31.1 (29.7, 32.5) Oregon 26.7 (25.2, 28.3) Pennsylvania 28.6 (27.3, 29.8) Puerto Rico 26.3 (25.0, 27.7) Rhode Island 25.4 (23.9, 27.0) South Carolina 30.8 (29.6, 32.1) South Dakota 28.1 (26.3, 30.1) Tennessee 29.2 (26.8, 31.7) Texas 30.4 (29.1, 31.8) Utah 24.4 (23.4, 25.5) Vermont 25.4 (24.1, 26.8) Virginia 29.2 (27.5, 30.9) Washington 26.5 (25.3, 27.7) West Virginia 32.4 (30.9, 34.0) Wisconsin 27.7 (25.8, 29.7) Wyoming 25.0 (23.5, 26.6) Prevalence estimates reflect BRFSS methodological changes started in These estimates should not be compared to prevalence estimates before Source: Behavioral Risk Factor Surveillance System, CDC.
17 Prevalence of Self-Reported Obesity Among U.S. Adults by State and Territory, BRFSS, 2012 State Prevalence 95% Confidence Interval Alabama 33.0 (31.5, 34.4) Alaska 25.7 (23.9, 27.5) Arizona 26.0 (24.3, 27.8) Arkansas 34.5 (32.7, 36.4) California 25.0 (23.9, 26.0) Colorado 20.5 (19.5, 21.4) Connecticut 25.6 (24.3, 26.9) Delaware 26.9 (25.2, 28.6) District of Columbia 21.9 (19.8, 24.0) Florida 25.2 (23.6, 26.7) Georgia 29.1 (27.4, 30.8) Guam 29.1 (26.3, 31.9) Hawaii 23.6 (22.0, 25.1) Idaho 26.8 (24.8, 28.8) Illinois 28.1 (26.4, 29.9) Indiana 31.4 (30.1, 32.7) Iowa 30.4 (29.1, 31.8) Kansas 29.9 (28.7, 31.0) Kentucky 31.3 (29.9, 32.6) Louisiana 34.7 (33.1, 36.4) Maine 28.4 (27.2, 29.5) Maryland 27.6 (26.3, 28.9) Massachusetts 22.9 (22.0, 23.8) Michigan 31.1 (29.8, 32.3) Minnesota 25.7 (24.7, 26.8) Mississippi 34.6 (33.0, 36.2) State Prevalence 95% Confidence Interval Missouri 29.6 (28.0, 31.2) Montana 24.3 (23.1, 25.5) Nebraska 28.6 (27.7, 29.6) Nevada 26.2 (24.3, 28.1) New Hampshire 27.3 (25.8, 28.8) New Jersey 24.6 (23.6, 25.6) New Mexico 27.1 (25.9, 28.3) New York 23.6 (22.0, 25.1) North Carolina 29.6 (28.5, 30.7) North Dakota 29.7 (27.9, 31.4) Ohio 30.1 (29.0, 31.2) Oklahoma 32.2 (30.8, 33.6) Oregon 27.3 (25.7, 29.0) Pennsylvania 29.1 (28.1, 30.1) Puerto Rico 28.4 (27.0, 29.7) Rhode Island 25.7 (24.1, 27.4) South Carolina 31.6 (30.4, 32.8) South Dakota 28.1 (26.5, 29.8) Tennessee 31.1 (29.6, 32.7) Texas 29.2 (27.8, 30.5) Utah 24.3 (23.3, 25.3) Vermont 23.7 (22.3, 25.1) Virginia 27.4 (26.0, 28.7) Washington 26.8 (25.8, 27.8) West Virginia 33.8 (32.2, 35.4) Wisconsin 29.7 (27.8, 31.6) Wyoming 24.6 (22.8, 26.4) Prevalence estimates reflect BRFSS methodological changes started in These estimates should not be compared to prevalence estimates before Source: Behavioral Risk Factor Surveillance System, CDC.
18 Prevalence of Self-Reported Obesity Among U.S. Adults by State and Territory, BRFSS, 2013 State Prevalence 95% Confidence Interval Alabama 32.4 (30.8, 34.1) Alaska 28.4 (26.5, 30.4) Arizona 26.8 (24.3, 29.4) Arkansas 34.6 (32.7, 36.6) California 24.1 (23.0, 25.3) Colorado 21.3 (20.4, 22.2) Connecticut 25.0 (23.5, 26.4) Delaware 31.1 (29.3, 32.8) District of Columbia 22.9 (21.0, 24.8) Florida 26.4 (25.3, 27.4) Georgia 30.3 (28.9, 31.8) Guam 27.0 (24.4, 29.8) Hawaii 21.8 (20.4, 23.2) Idaho 29.6 (27.8, 31.4) Illinois 29.4 (27.7, 31.2) Indiana 31.8 (30.6, 33.1) Iowa 31.3 (29.9, 32.7) Kansas 30.0 (29.2, 30.7) Kentucky 33.2 (31.8, 34.6) Louisiana 33.1 (31.1, 35.2) Maine 28.9 (27.5, 30.2) Maryland 28.3 (27.0, 29.5) Massachusetts 23.6 (22.5, 24.8) Michigan 31.5 (30.4, 32.6) Minnesota 25.5 (24.1, 26.8) Mississippi 35.1 (33.5, 36.8) State Prevalence 95% Confidence Interval Missouri 30.4 (28.8, 32.1) Montana 24.6 (23.4, 25.8) Nebraska 29.6 (28.4, 30.7) Nevada 26.2 (24.0, 28.6) New Hampshire 26.7 (25.3, 28.3) New Jersey 26.3 (25.1, 27.5) New Mexico 26.4 (25.1, 27.7) New York 25.4 (24.2, 26.6) North Carolina 29.4 (28.1, 30.7) North Dakota 31.0 (29.5, 32.5) Ohio 30.4 (29.2, 31.6) Oklahoma 32.5 (31.2, 33.9) Oregon 26.5 (24.9, 28.1) Pennsylvania 30.0 (28.9, 31.2) Puerto Rico 27.9 (26.4, 29.5) Rhode Island 27.3 (25.8, 28.8) South Carolina 31.7 (30.5, 33.1) South Dakota 29.9 (28.0, 31.8) Tennessee 33.7 (31.9, 35.5) Texas 30.9 (29.5, 32.3) Utah 24.1 (23.2, 25.1) Vermont 24.7 (23.4, 26.1) Virginia 27.2 (25.9, 28.5) Washington 27.2 (26.0, 28.3) West Virginia 35.1 (33.6, 36.6) Wisconsin 29.8 (28.0, 31.6) Wyoming 27.8 (26.2, 29.5) Prevalence estimates reflect BRFSS methodological changes started in These estimates should not be compared to prevalence estimates before Source: Behavioral Risk Factor Surveillance System, CDC.
19 Prevalence of Self-Reported Obesity Among U.S. Adults by State and Territory, BRFSS, 2014 State Prevalence 95% Confidence Interval Alabama 33.5 (32.1, 35.0) Alaska 29.7 (27.8, 31.7) Arizona 28.9 (27.7, 30.2) Arkansas 35.9 (33.8, 38.0) California 24.7 (23.5, 25.9) Colorado 21.3 (20.4, 22.2) Connecticut 26.3 (24.9, 27.7) Delaware 30.7 (28.6, 32.8) District of Columbia 21.7 (19.5, 24.0) Florida 26.2 (25.0, 27.5) Georgia 30.5 (28.9, 32.1) Guam 28.0 (25.6, 30.5) Hawaii 22.1 (20.7, 23.5) Idaho 28.9 (27.1, 30.8) Illinois 29.3 (27.6, 31.1) Indiana 32.7 (31.6, 34.0) Iowa 30.9 (29.6, 32.3) Kansas 31.3 (30.3, 32.2) Kentucky 31.6 (30.2, 33.1) Louisiana 34.9 (33.4, 36.4) Maine 28.2 (26.9, 29.5) Maryland 29.6 (28.1, 31.1) Massachusetts 23.3 (22.3, 24.4) Michigan 30.7 (29.4, 32.0) Minnesota 27.6 (26.8, 28.5) Mississippi 35.5 (33.4, 37.6) State Prevalence 95% Confidence Interval Missouri 30.2 (28.6, 31.9) Montana 26.4 (24.9, 27.9) Nebraska 30.2 (29.2, 31.3) Nevada 27.7 (25.4, 30.1) New Hampshire 27.4 (25.8, 29.1) New Jersey 26.9 (25.7, 28.1) New Mexico 28.4 (27.0, 30.0) New York 27.0 (25.6, 28.5) North Carolina 29.7 (28.4, 31.0) North Dakota 32.2 (30.5, 34.0) Ohio 32.6 (31.2, 34.1) Oklahoma 33.0 (31.7, 34.3) Oregon 27.9 (26.3, 29.6) Pennsylvania 30.2 (28.9, 31.4) Puerto Rico 28.3 (26.8, 29.8) Rhode Island 27.0 (25.4, 28.6) South Carolina 32.1 (30.9, 33.3) South Dakota 29.8 (27.9, 31.8) Tennessee 31.2 (29.3, 33.2) Texas 31.9 (30.6, 33.3) Utah 25.7 (24.9, 26.6) Vermont 24.8 (23.5, 26.1) Virginia 28.5 (27.2, 29.7) Washington 27.3 (26.0, 28.5) West Virginia 35.7 (34.2, 37.2) Wisconsin 31.2 (29.6, 32.8) Wyoming 29.5 (27.5, 31.5) Prevalence estimates reflect BRFSS methodological changes started in These estimates should not be compared to prevalence estimates before Source: Behavioral Risk Factor Surveillance System, CDC..
20 Prevalence of Self-Reported Obesity Among U.S. Adults by State and Territory, BRFSS, 2015 State Prevalence 95% Confidence Interval Alabama 35.6 (34.1, 37.2) Alaska 29.8 (27.5, 32.3) Arizona 28.4 (26.9, 30.0) Arkansas 34.5 (32.2, 36.9) California 24.2 (23.2, 25.2) Colorado 20.2 (19.1, 21.3) Connecticut 25.3 (24.1, 26.4) Delaware 29.7 (27.6, 31.8) District of Columbia 22.1 (19.7, 24.8) Florida 26.8 (25.5, 28.1) Georgia 30.7 (28.8, 32.6) Guam 31.6 (28.2, 35.1) Hawaii 22.7 (21.3, 24.1) Idaho 28.6 (26.9, 30.4) Illinois 30.8 (29.2, 32.4) Indiana 31.3 (29.5, 33.1) Iowa 32.1 (30.5, 33.8) Kansas 34.2 (33.4, 35.0) Kentucky 34.6 (32.9, 36.3) Louisiana 36.2 (34.3, 38.1) Maine 30.0 (28.6, 31.4) Maryland 28.9 (27.2, 30.7) Massachusetts 24.3 (23.0, 25.6) Michigan 31.2 (29.9, 32.4) Minnesota 26.1 (25.3, 27.0) Mississippi 35.6 (33.8, 37.5) State Prevalence 95% Confidence Interval Missouri 32.4 (30.8, 34.0) Montana 23.6 (22.1, 25.2) Nebraska 31.4 (30.3, 32.5) Nevada 26.7 (24.1, 29.5) New Hampshire 26.3 (24.8, 27.9) New Jersey 25.6 (24.3, 26.9) New Mexico 28.8 (27.1, 30.6) New York 25.0 (24.0, 26.1) North Carolina 30.1 (28.7, 31.5) North Dakota 31.0 (29.3, 32.8) Ohio 29.8 (28.4, 31.2) Oklahoma 33.9 (32.2, 35.6) Oregon 30.1 (28.4, 31.8) Pennsylvania 30.0 (28.4, 31.6) Puerto Rico 29.5 (28.0, 31.1) Rhode Island 26.0 (24.3, 27.7) South Carolina 31.7 (30.5, 33.0) South Dakota 30.4 (28.5, 32.3) Tennessee 33.8 (31.9, 35.7) Texas 32.4 (30.9, 33.9) Utah 24.5 (23.5, 25.5) Vermont 25.1 (23.8, 26.6) Virginia 29.2 (27.9, 30.6) Washington 26.4 (25.5, 27.4) West Virginia 35.6 (34.1, 37.1) Wisconsin 30.7 (29.0, 32.4) Wyoming 29.0 (27.0, 31.1) Prevalence estimates reflect BRFSS methodological changes started in These estimates should not be compared to prevalence estimates before Source: Behavioral Risk Factor Surveillance System, CDC..
21 Prevalence of Self-Reported Obesity Among U.S. Adults by State and Territory, BRFSS, 2016 State Prevalence 95% Confidence Interval Alabama 35.7 (34.2, 37.3) Alaska 31.4 (28.5, 34.4) Arizona 29.0 (27.5, 30.6) Arkansas 35.7 (33.3, 38.1) California 25.0 (23.9, 26.1) Colorado 22.3 (21.4, 23.2) Connecticut 26.0 (24.8, 27.2) Delaware 30.7 (28.7, 32.8) District of Columbia 22.6 (20.9, 24.3) Florida 27.4 (26.4, 28.5) Georgia 31.4 (29.7, 33.2) Guam 28.3 (25.1, 31.7) Hawaii 23.8 (22.5, 25.2) Idaho 27.4 (25.6, 29.3) Illinois 31.6 (29.9, 33.3) Indiana 32.5 (31.2, 33.8) Iowa 32.0 (30.5, 33.4) Kansas 31.2 (30.1, 32.3) Kentucky 34.2 (32.7, 35.6) Louisiana 35.5 (33.4, 37.7) Maine 29.9 (28.5, 31.3) Maryland 29.9 (28.9, 31.0) Massachusetts 23.6 (22.3, 24.9) Michigan 32.5 (31.4, 33.6) Minnesota 27.8 (26.9, 28.6) Mississippi 37.3 (35.4, 39.1) Missouri 31.7 (30.0, 33.4) State Prevalence 95% Confidence Interval Montana 25.5 (23.9, 27.2) Nebraska 32.0 (30.8, 33.2) Nevada 25.8 (23.9, 27.8) New Hampshire 26.6 (25.0, 28.2) New Jersey 27.4 (25.7, 29.1) New Mexico 28.3 (26.6, 30.1) New York 25.5 (24.6, 26.5) North Carolina 31.8 (30.4, 33.3) North Dakota 31.9 (30.3, 33.6) Ohio 31.5 (30.2, 32.8) Oklahoma 32.8 (31.2, 34.3) Oregon 28.7 (27.3, 30.3) Pennsylvania 30.3 (28.8, 31.8) Puerto Rico 30.7 (29.0, 32.5) Rhode Island 26.6 (24.9, 28.4) South Carolina 32.3 (31.0, 33.6) South Dakota 29.6 (27.6, 31.7) Tennessee 34.8 (33.0, 36.7) Texas 33.7 (31.9, 35.4) Utah 25.4 (24.2, 26.5) Vermont 27.1 (25.5, 28.7) Virgin Islands 32.5 (28.6, 36.6) Virginia 29.0 (27.7, 30.3) Washington 28.6 (27.6, 29.6) West Virginia 37.7 (36.3, 39.0) Wisconsin 30.7 (29.0, 32.5) Wyoming 27.7 (25.7, 29.8) Prevalence estimates reflect BRFSS methodological changes started in These estimates should not be compared to prevalence estimates before Source: Behavioral Risk Factor Surveillance System, CDC..
22 Prevalence of Self-Reported Obesity Among U.S. Adults by State and Territory, BRFSS, 2017 State Prevalence 95% Confidence Interval Alabama 36.3 (34.7, 38.0) Alaska 34.2 (31.4, 37.1) Arizona 29.5 (28.5, 30.5) Arkansas 35.0 (32.6, 37.5) California 25.1 (23.8, 26.4) Colorado 22.6 (21.6, 23.7) Connecticut 26.9 (25.6, 28.1) Delaware 31.8 (29.7, 34.0) District of Columbia 23.0 (21.4, 24.7) Florida 28.4 (27.0, 29.9) Georgia 31.6 (30.0, 33.2) Guam 34.3 (31.2, 37.6) Hawaii 23.8 (22.4, 25.2) Idaho 29.3 (27.5, 31.2) Illinois 31.1 (29.5, 32.7) Indiana 33.6 (32.5, 34.7) Iowa 36.4 (35.1, 37.7) Kansas 32.4 (31.5, 33.2) Kentucky 34.3 (32.6, 36.0) Louisiana 36.2 (34.4, 38.1) Maine 29.1 (27.7, 30.6) Maryland 31.3 (30.0, 32.6) Massachusetts 25.9 (24.1, 27.7) Michigan 32.3 (31.1, 33.4) Minnesota 28.4 (27.5, 29.4) Mississippi 37.3 (35.3, 39.3) Missouri 32.5 (30.9, 34.0) State Prevalence 95% Confidence Interval Montana 25.3 (23.8, 26.9) Nebraska 32.8 (31.6, 34.0) Nevada 26.7 (24.5, 29.0) New Hampshire 28.1 (26.3, 29.9) New Jersey 27.3 (25.8, 28.7) New Mexico 28.4 (26.8, 30.0) New York 25.7 (24.6, 26.9) North Carolina 32.1 (30.4, 34.0) North Dakota 33.2 (31.6, 34.7) Ohio 33.8 (32.5, 35.1) Oklahoma 36.5 (34.9, 38.1) Oregon 29.4 (27.9, 30.9) Pennsylvania 31.6 (30.0, 33.2) Puerto Rico 32.9 (31.0, 34.9) Rhode Island 30.0 (28.1, 31.9) South Carolina 34.1 (32.8, 35.4) South Dakota 31.9 (29.8, 34.1) Tennessee 32.8 (31.1, 34.6) Texas 33.0 (31.2, 34.9) Utah 25.3 (24.2, 26.4) Vermont 27.6 (26.0, 29.2) Virginia 30.1 (28.7, 31.4) Washington 27.7 (26.6, 28.7) West Virginia 38.1 (36.4, 39.7) Wisconsin 32.0 (30.3, 33.8) Wyoming 28.8 (27.1, 30.6) Prevalence estimates reflect BRFSS methodological changes started in These estimates should not be compared to prevalence estimates before Source: Behavioral Risk Factor Surveillance System, CDC..

23 Prevalence of Self-Reported Obesity Among U.S. Adults by State and Territory, BRFSS, 2017 Summary No state had a prevalence of obesity less than 20%. 2 states and the District of Columbia had a prevalence of obesity between 20% and <25%. 19 states had a prevalence of obesity between 25% and <30%. 22 states, Guam, and Puerto Rico had a prevalence of obesity between 30% and <35%. 7 states (Alabama, Arkansas, Iowa, Louisiana, Mississippi, Oklahoma, and West Virginia) had a prevalence of obesity of 35% or greater. Prevalence estimates reflect BRFSS methodological changes started in These estimates should not be compared to prevalence estimates before
24 LET S TAKE A LOOK BACK Ancel Keys was an American Physiologist in the 1950s who believed that dietary fat (specifically saturated fat) caused Coronary Heart Disease (CHD). He published the Six Countries Study showing an association between dietary fat and CHD. The problem was, the study failed to meet the three primary pillars of proof that a study is subjected to prove that it is a valid study
25 PROBLEMS WITH DR KEYS STUDY Just because two things are associated doesn t mean one causes the other. Dietary fat s association doesn t really make lots of sense. There were several other things associated with CHD that didn t get the blame. There were no studies to show that avoiding fat (Low Fat Diet) lowered the rate of CHD The new PURE study of 2017 in fact, showed just the opposite
26 WHAT DID PEOPLE EAT ONCE THEY DECIDED SATURATED FAT WAS BAD? Partially hydrogenated oils were altered so that they formed a solid fat which had a better shelf life and also gave processed foods a longer shelf life. We now know these from trans fats which everyone agrees are harmful and are now banned. That didn t stop Americans from eating them for over fifty years! The other replacement for natural saturated fats in our diets was sugar.
27 WHAT HAPPENED TO AMERICANS AS THEY BEGAN EATING A LOW FAT DIET? They ate more sugar. They ate much more refined carbohydrates like bread, pasta, cereal, etc WE GOT FATTER! Americans were told that we needed to eat low fat, healthy grains, and to eat less and move more. This has led us to where we are today.
28 WHAT IS A KETOGENIC DIET? A ketogenic diet is a diet low in carbohydrates such that the body moves away from glucose as a primary fuel source and begins to use fat, either in the form of fatty acids or from ketones, which are made as fat is broken down. Nutritional ketosis is defined as a blood ketone level of 0.5 mmol 5mmol This level is ketosis is benign and is MUCH lower than in diabetic ketoacidosis where ketones reach levels of mmol in the setting of very high blood sugars.
29 WHAT IS THE DIFFERENCE BETWEEN KETOGENIC AND LOW CARB? A ketogenic diet is one that produces ketones in the blood. The amount of carbohydrate in this diet varies from person to person but is typically less than 50 grams of carbs a day and often as low as grams of carbs a day. A ketogenic diet is a very low carbohydrate diet. There are varying terms that people use to describe low carb, but generally, it is considered less than around 100 grams of carbs a day.
30 THE THREE MACRONUTRIENTS Carbohydrate provides 4 calories of energy per gram. This is NOT a necessary macronutrient. The only cells in the body that require carbs can get an adequate supply from gluconeogenesis in the liver. Protein provides 4 calories of energy per gram. This is a required macronutrient. While guidelines vary, generally people need about 0.8 gram protein per kilogram of body weight Fat provides 9 calories of energy per gram. This is a required macronutrient.

31

32

33
34 MACRONUTRIENT CALCULATION OF KETOGENIC DIET Macronutrients 5% Fat 20% Protein Carbohydrate 75%
35 MACRONUTRIENT CALCULATION OF LCHF Macronutrient 10% 25% 65% Fat Protein Carbohydrate
36 BENEFITS OF KETOGENIC/LCHF DIET Mental clarity and focus Lower blood pressure Lower triglycerides Higher HDL Decreased level of inflammation (helps multiple issues IBS, inflammatory arthritis, eczema etc) Improved energy levels and sleep Improved digestion less gas and bloating Seizure prevention and control
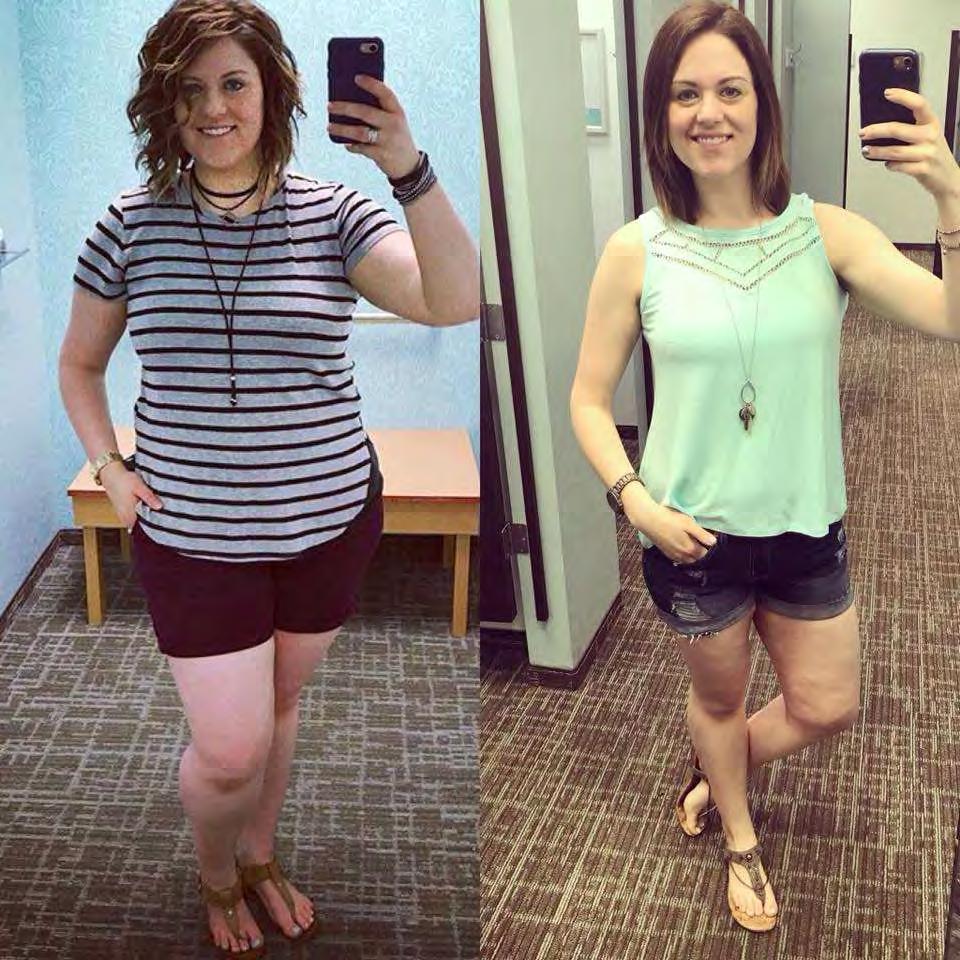
37 MORE BENEFITS OF KETOGENIC/LCHF DIET Improved fertility Improved body composition WEIGHT LOSS Reverse metabolic syndrome, fatty liver, insulin resistance Reverse Type 2 diabetes Better glucose control in Type I diabetes Improvement in depression, anxiety, chronic schizophrenia, chronic pain
38 DIABETES AND INSULIN RESISTANCE EPIDEMIC COMES AT A HUGE COST TO SOCEITY 52% of adults in the US have diabetes or prediabetes (insulin resistance). This number sharply increased in 1977 when dietary guidelines changed and continues to rise. Your chance of having diabetes is higher than not in your lifetime. Americans spend loads of money on diabetes medications which band-aid the problem but don t address the root cause Insulin is anabolic. Virta Health has helped their patients lose 12% body weight in their six month trial. Trigs down 72%. 56% were able to lower hgba1c below the diagnostic threshold for diabetes and 47% reversed their diabetes while coming off diabetic medications.
39
40 FOOD IS MEDICINE
41 ELIMINATE REFINED CARBS AND SUGARS Refined carbs like flour, bread etc trigger GIP (gastric inhibitory polypeptide) which then triggers insulin release to lower the blood sugar, which promotes weight gain. If fat is eaten with refined carbohydrates it is even worse. Insulin release shuts down fatty acid oxidation (utilizing fat for fuel) and causes fat to be stored. Those who eat lots of processed carbs and sugar are probably familiar with the sugar highs and lows. Blood sugar rises and falls are associated with symptoms such as lightheadedness, nausea, shakiness, or low energy.
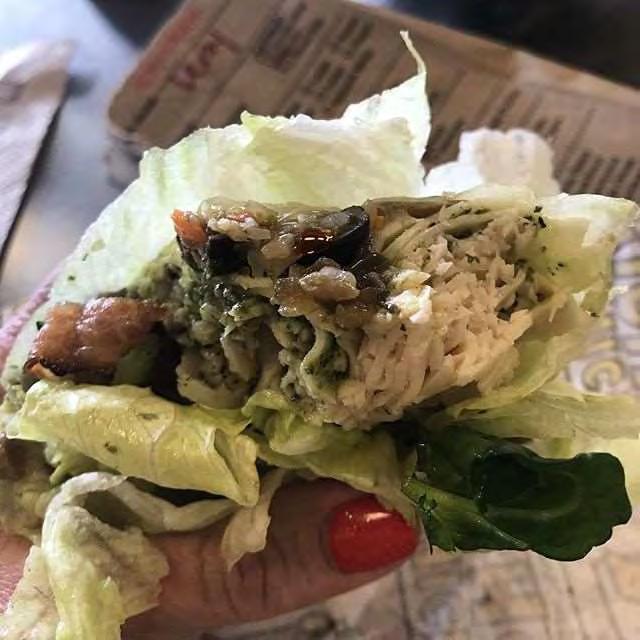
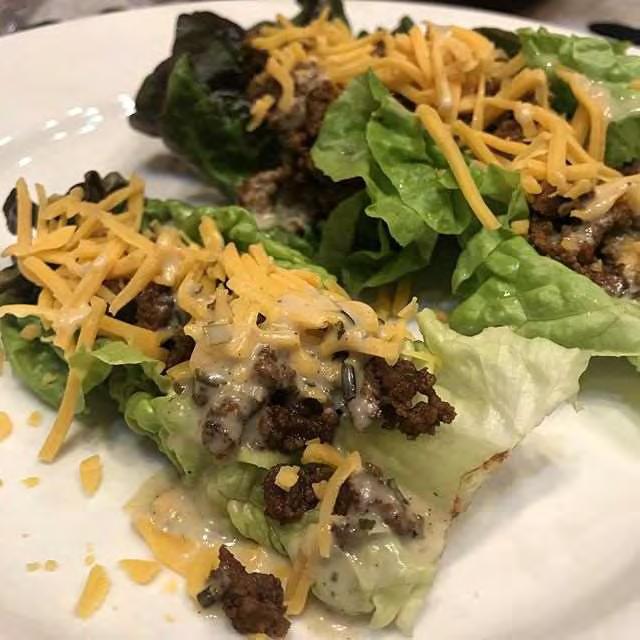
42 IMPROVE THE QUALITY OF CARBS EATEN Whether eating LCHF or ketogenic, goal should be to eat nutrient rich whole food carbs. This mostly means eating nonstarchy vegetables grown above the ground (broccoli, cauliflower, peppers, artichokes, avocado, spinach, zucchini etc)
43 EAT NUTRIENT DENSE SOURCES OF PROTEIN Quality protein in adequate amounts is important in maintaining muscle mass Minimum amount of protein needed is at least 0.6g/pound of lean body mass or about 20% of daily intake of calories. Ancestral animal proteins contain all the essential amino acids. There are some good sources of plant protein but there are a few amino acids missing.
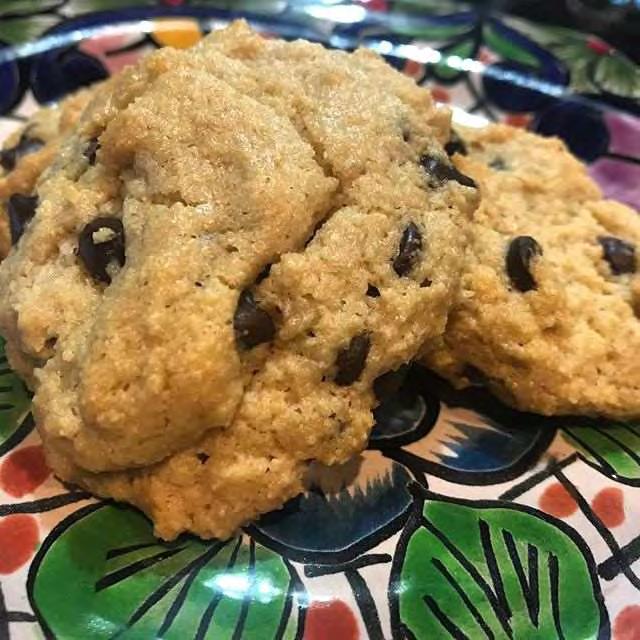
44 RESTRICT PROCESSED FOOD Its ok to eat some high quality processed foods such as sausage, bacon, etc but quantity should be limited. In general most processed foods like granola bars, cereal, breads etc contain lots of sugar, processed carbs, and unhealthy oils. Eat real food.
45 ELIMINATE REFINED VEGETABLE OILS In order to be palatable and maintain shelf life, many vegetable oils have to be highly processed and require lots of chemical changes. Don t be afraid of saturated fat Monounsaturated fats Avoid omega-6 fatty acids (rich in vegetable oil) which drive obesity Choose fats such as olive oil, meat fats, coconut oil, avocado oil, all of which are easy to extract from their source.
46 MOST OF THE DAILY CALORIES SHOULD COME FROM FAT While eating fat is not a goal, to maintain good energy it is necessary to eat about 60%-70% of the diet from fat. Fats are great for appetite control Fats are very energy dense
47 ONLY EAT WHEN HUNGRY Eat when hungry but be mindful about eating. Humans don t need three meals a day and two snacks, especially if eating a low carb diet. Time restricted eating is a great way to treat diabetes and insulin resistance. Fasting promotes healthy cell turnover and is felt to help prevent and treat some kinds of cancer. Eating fat is a great way to control food craving and food addiction issues.
48 LIVE WITH INTENTION AND BE MINDFUL Lots of other issues affect general wellness and weight Stress promotes weight gain. Poor sleep reduces insulin sensitivity and promotes weight gain Exercise and fresh air promote cardiovascular health and general wellness, even though exercise is not generally a great weight loss strategy. a

49
50 LOW CARB MISCONCEPTIONS
51 CALORIES IN EQUALS CALORIES OUT Maintaining weight and health is much more complicated than calories in-calories out. Lots of hormones are involved and the energy density of food matters a lot. Those who eat a low carb diet regularly eat less calories than those on a high carb diet because fat is satiating. Those on low carb diets typically self regulate and do not have to count calories. Those on low carb diets enjoy higher metabolic rates and ability to burn fat.
52 SATURATED FAT IS NOT ASSOCIATED WITH HEART DISEASE Unfortunately hysteria caused by Dr Keys was unnecessary Multiple RCT show that the rate of heat disease actually INCREASED when Americans began avoiding animal fats. These trials show no connection between heart disease and saturated fats Want more information?? Check out The Big Fat Surprise by investigative journalist Nina Teicholz
53 LOW CARB DIETS ARE NOT A FAD Low carb diets have been in use for over 150 years. The low fat diet is more of a fad. There is lots of science behind LCHF diets LCHF has been used to treat seizures in children who were resistant to medication in the 1950s Most humans of the past ate a diet rich in meat and vegetables. Farming grains is a relatively modern development.
54 PEOPLE WHO EAT LOW CARB IMPROVE BODY COMPOSITION. It is a common misconception that people who eat low carb lose muscle and water weight. Initially, there is a significant loss of water due to limited carb intake. After the first few days of carb restriction, water weight loss slows and the body begins to burn body fat, thus improving lean muscle mass. Unlike low calorie diets, muscle mass is maintained
55 CARBOHYDRATES ARE NOT NECESSARY Many people feel low carb diets are radical because they eliminate a whole food group Carbohydrates are only required by red blood cells and this amount of glucose can easily be made by the liver Carbohydrates are not needed for exercise. There are lots of studies showing improved performance of endurance athletes on a low carb diet.
56 LOW CARB DIETS IMPROVE LIPID PROFILES Eating fat doesn t make you fat. Eating fat may temporarily increase LDL (Bad cholesterol) but the triglycerides go down and the HDL goes up, thus lowering cardiac risk Calcium artery scanning shows this
57 KETONEMIA IS NOT THE SAME AS KETOACIDOSIS Ketoacidosis is seen in diabetics. This level of ketones is at least 10 times higher than nutritional ketosis Nutritional ketosis occurs with carbohydrate restriction Ketoacidosis occurs in the face of extremely high glucose levels Nutritional ketosis occurs in the face of increased fat breakdown and fatty acid delivery to the liver for fuel.
58 KETO FLU IS REAL Keto flu can occur early in a low carb diet. Symptoms include fatigue, weakness, lightheadedness, nausea, headache This will gradually resolve but can easily be treated The solution for keto flu is salt sodium, potassium, magnesium Adding extra table salt or No-Salt can be helpful, as can eating avocados, broth etc
59 LOW CARB DIETS ARE VERY SUSTAINABLE LONG TERM Many people have maintained weight loss and other medical benefits for years on a ketogenic diet or low carb diet. Food is not expensive. Cheaper cuts of meat are desirable The many medical benefits and general feelings of wellness are a good motivation to consider a low carb diet as a lifestyle. If you eat lots of carbs, you WILL gain weight back
60 LOW CARB DIETS DO NOT CAUSE NUTRIENT DEFICIENCY Eating a diet rich in healthy fat and protein full of whole foods like vegetables will contain all the necessary nutrients. Some who do a carnivore diet have adequate nutrition from eating a wide variety of meats, including organ meats.
61 LOW CARB DIETS DO NOT CAUSE KIDNEY FAILURE Many people believe that since protein is restricted in patients with renal failure it is because protein harms the kidneys. That is not true. Low carb diets recommend a similar amount of protein as other types of diets and they also recommend a similar amount of protein to what most Americans today eat.

62
63 LCHF AND RESPIRATORY ILLNESS Ketogenic diet decreases inflammation which has a positive effect for both asthma and COPD patients A high fat diet may be helpful in vent weaning and time required on vent for COPD patients. Van den Berg B, et al Intensive Care Med High Fat Low Carbohydrate Enteral Feeding in Patients Weaning From the Ventilator (LCHF reduced CO2 production during weaning from the vent) Al-Saady NM, et al Intensive Care Medicine 1989 High Fat Low Carbohydrate Enteral Feeding Lowers PaCO2 and Reduces the Period of Ventilation in Artificially Ventilated Patients (PaCO2 prior to weaning fell 16% In high fat group and increased by 4% In standard diet)
64 DIRECT RESPIRATORY BENEFITS TO LCHF/KETO Improves sleep apnea via weight loss Improves GERD Anti-inflammatory benefits to asthma and COPD patients Improves chronic hypoventilation in obese patients Check out copdathlete.com He is a real patient doing N=1 experiments. Improved PFTs for the first time since diagnosis.
65 LOW CARB RESOURCES Eat Rich Live Long by Ivro Cummins and Dr Jeffry Gerber The Art and Science of Low Carbohydrate Living by Jeff Volek PhD RD and Stephen Phinney MD PhD The Obesity Code by Dr Jason Fung The Big Fat Surpise by Nina Teicholz The Magic Pill (Netflix) documentary Dietdoctor.com free website operated by Dr Andreas Einfeldt Blog.virtahealth.com


66

67

68

69

70

71

72
73
74
75

76
77

78
79
80

81
Prevalence of Self-Reported Obesity Among U.S. Adults by State and Territory. Definitions Obesity: Body Mass Index (BMI) of 30 or higher.
 of 30 or higher.") Prevalence of Self-Reported Obesity Among U.S. Adults by State and Territory Definitions Obesity: Body Mass Index (BMI) of 30 or higher. Body Mass Index (BMI): A measure of an adult s weight in relation
Prevalence of Self-Reported Obesity Among U.S. Adults by State and Territory Definitions Obesity: Body Mass Index (BMI) of 30 or higher. Body Mass Index (BMI): A measure of an adult s weight in relation
Obesity Trends:
 Obesity Trends: 1985-2014 Compiled by the Centers for Disease Control and Prevention Retrieved from http://www.cdc.gov/obesity/data/prevalencemaps.html Organized into two groupings due to methodological
2012 Medicaid and Partnership Chart
 2012 Medicaid and Chart or Alabama $525,000.00 $4,800.00 Minimum: 25,000.00 Alaska $525,000.00 Depends on area of state; Minimum: $113,640 $10,000 in Anchorage $1,656 Minimum:$1838.75 Maximum:$2,841 Minimum:
ACEP National H1N1 Preparedness Survey Results
 1) On a scale from 1 to 10 (10 being totally prepared and 1 being totally unprepared), do you think your hospital is prepared to manage a surge of H1N1 flu patients this fall and winter? (totally prepared)
Peer Specialist Workforce. State-by-state information on key indicators, and links to each state s peer certification program web site.
 Peer Specialist Workforce State-by-state information on key indicators, and links to each state s peer certification program web site. Alabama Peer support not Medicaid-reimbursable 204 peer specialists
National Deaf Center on Postsecondary Outcomes. Data Interpretation Guide for State Reports: FAQ
 National Deaf Center on Postsecondary Outcomes Data Interpretation Guide for State Reports: FAQ This document was developed under a grant from the U.S. Department of Education, OSEP #HD326D160001. However,
Michigan Nutrition Network Outcomes: Balance caloric intake from food and beverages with caloric expenditure.
 DRAFT 1 Obesity and Heart Disease: Fact or Government Conspiracy? Grade Level: High School Grades 11 12 Subject Area: Mathematics (Statistics) Setting: Classroom and/or Computer Lab Instructional Time:
Percent of U.S. State Populations Covered by 100% Smokefree Air Laws April 1, 2018
 Defending your right to breathe smokefree air since 1976 Percent U.S. State Populations Covered by 100% Smokefree Air April 1, 2018 This table lists the percent each state s population covered by air laws
Cirrhosis and Liver Cancer Mortality in the United States : An Observational Study Supplementary Material
 Cirrhosis and Liver Cancer Mortality in the United States 1999-2016: An Observational Study Supplementary Material Elliot B. Tapper MD (1,2) and Neehar D Parikh MD MS (1,2) 1. Division of Gastroenterology
2018 HPV Legislative Report Card
 2018 HPV Legislative Report Card This report card is a snapshot of each state s documented efforts to enact or introduce HPV vaccine legislation to improve education and awareness, or provide access to
STATE RANKINGS REPORT NOVEMBER mississippi tobacco data
 STATE RANKINGS REPORT NOVEMBER 2017 mississippi tobacco data METHODS information about the data sources the youth risk behavior surveillance system The Youth Risk Behavior Surveillance System (YRBSS)
Georgina Peacock, MD, MPH
 Autism Activities at CDC Act Early Region IX Summit Sacramento, CA June 8, 2009 Georgina Peacock, MD, MPH National Center on Birth Defects and Developmental Disabilities Autism Activities at CDC Surveillance/Monitoring
States with Authority to Require Nonresident Pharmacies to Report to PMP
 States with Authority to Require Nonresident Pharmacies to Report to PMP Research current through May 2016. This project was supported by Grant No. G1599ONDCP03A, awarded by the Office of National Drug
-Type of immunity that is more permanent (WBC can Remember)
") -Type of immunity that is more permanent (WBC can Remember).Get disease- Your body produces its own antibodies (killer T cells) to attack a particular pathogen 2.Vaccination- Injection containing a dead
-Type of immunity that is more permanent (WBC can Remember).Get disease- Your body produces its own antibodies (killer T cells) to attack a particular pathogen 2.Vaccination- Injection containing a dead
Peer Specialist Workforce. State-by-state information on key indicators, and links to each state s peer certification program web site.
 Peer Specialist Workforce State-by-state information on key indicators, and links to each state s peer certification program web site. Alabama Peer support not Medicaid-reimbursable 204 peer specialists
Responses to a 2017 Survey on State Policies Regarding Community Health Workers: Home Visiting to Improve the Home Environment
 Responses to a 2017 Survey on State Policies Regarding Community Health Workers: Home Visiting to Improve the Home Environment The National Academy for State Health Policy (NASHP), with support from the
It's tick time again! Recognizing black-legged (deer ticks) and measuring the spread of Lyme disease
 and measuring the spread of Lyme disease") It's tick time again! Recognizing black-legged (deer ticks) and measuring the spread of Lyme disease Actual sizes: These guys below (Ixodes scapularis) spread Lyme and other tick born diseases. Ixodes
It's tick time again! Recognizing black-legged (deer ticks) and measuring the spread of Lyme disease Actual sizes: These guys below (Ixodes scapularis) spread Lyme and other tick born diseases. Ixodes
The Rural Health Workforce. Policy Brief Series. Data and Issues for Policymakers in: Washington Wyoming Alaska Montana Idaho
 The Rural Health Workforce Data and Issues for Policymakers in: Washington Wyoming Alaska Montana Idaho Policy Brief Series ISSUE #1: THE RURAL HEALTH WORKFORCE: CHALLENGES AND OPPORTUNITIES ISSUE #2:
CDC activities with Autism Spectrum Disorders
 CDC activities with Autism Spectrum Disorders Georgina Peacock, MD, MPH Centers for Disease Control and Prevention National Center on Birth Defects and Developmental Disabilities The findings and conclusions
DEPARTMENT OF DEFENSE (AFHSB)
") In NORTHCOM during week 48 Influenza activity continued to increase during week 48 and ranged from minimal to high, depending on the state. The percentage of outpatient visits due to ILI continued to increase
In NORTHCOM during week 48 Influenza activity continued to increase during week 48 and ranged from minimal to high, depending on the state. The percentage of outpatient visits due to ILI continued to increase
MetLife Foundation Alzheimer's Survey: What America Thinks
 MetLife Foundation Alzheimer's Survey: What America Thinks May 11, 2006 Conducted by: Harris Interactive 2005, Harris Interactive Inc. All rights reserved. Table of Contents Background and Objectives...
Plan Details and Rates. Monthly Premium Rate Schedule
 Basis of Reimbursement Plan Details and Rates MetLife Option 1 (Low) MetLife Option 2 (High) In-Network Out-of-Network In-Network Out-of-Network 70th percentile 70th percentile of Negotiated Negotiated
Geographical Accuracy of Cell Phone Samples and the Effect on Telephone Survey Bias, Variance, and Cost
 Geographical Accuracy of Cell Phone Samples and the Effect on Telephone Survey Bias, Variance, and Cost Abstract Benjamin Skalland, NORC at the University of Chicago Meena Khare, National Center for Health
NCQA did not add new measures to Accreditation 2017 scoring.
 2017 Accreditation Benchmarks and Thresholds 1 TO: Interested Organizations FROM: Patrick Dahill, Assistant Vice President, Policy DATE: August 2, 2017 RE: 2017 Accreditation Benchmarks and Thresholds
Trends in COPD (Chronic Bronchitis and Emphysema): Morbidity and Mortality. Please note, this report is designed for double-sided printing
: Morbidity and Mortality. Please note, this report is designed for double-sided printing") Trends in COPD (Chronic Bronchitis and Emphysema): Morbidity and Mortality Please note, this report is designed for double-sided printing American Lung Association Epidemiology and Statistics Unit Research
Trends in COPD (Chronic Bronchitis and Emphysema): Morbidity and Mortality Please note, this report is designed for double-sided printing American Lung Association Epidemiology and Statistics Unit Research
Average Number Citations per Recertification Survey
 10 Average Citations per Recertification Survey 201 201 2017 1Q 8 7.7 7.3 3 3.3 3..2 2 1 0..80.2.0.8.70.8.17.8.1 7.3 SRO SERO NERO NRO WRO WI 1 Source: WI DQA, March 31, 2017 3% Percentage of Recertification
CDC activities Autism Spectrum Disorders
 CDC activities Autism Spectrum Disorders Georgina Peacock, MD, MPH Centers for Disease Control and Prevention National Center on Birth Defects and Developmental Disabilities The findings and conclusions
DEPARTMENT OF DEFENSE (AFHSB)
") DEPARTMENT OF DEFENSE (AFHSB) Seasonal Influenza Surveillance Summary Northern Command -- Week 45 (03 November 10 November 2018) In NORTHCOM during week 45 Influenza activity was minimal to low for most
DEPARTMENT OF DEFENSE (AFHSB) Seasonal Influenza Surveillance Summary Northern Command -- Week 45 (03 November 10 November 2018) In NORTHCOM during week 45 Influenza activity was minimal to low for most
Medical Advisory Board. reviews medical issues for licensure regarding individual drivers. medical conditions. not specified. reporting encouraged,
 State Reporting Regulations for Physicians Adapted from the Physician s Guide to Assessing and Counseling Older Drivers 44 and Madd.org 45 State Physician/Medical Reporting (NOTE MERGED CELLS) Mandatory,
DEPARTMENT OF DEFENSE (AFHSB)
") DEPARTMENT OF DEFENSE (AFHSB) Seasonal Influenza Surveillance Summary Northern Command -- Week 42 (14 October 20 October 2018) In NORTHCOM during week 42 Influenza activity was minimal to low for NORTHCOM,
DEPARTMENT OF DEFENSE (AFHSB) Seasonal Influenza Surveillance Summary Northern Command -- Week 42 (14 October 20 October 2018) In NORTHCOM during week 42 Influenza activity was minimal to low for NORTHCOM,
DEPARTMENT OF DEFENSE (AFHSB) Seasonal Influenza Surveillance Summary Northern Command -- Week 17 (22 Apr 28 Apr 2018)
 Seasonal Influenza Surveillance Summary Northern Command -- Week 17 (22 Apr 28 Apr 2018)") DEPARTMENT OF DEFENSE (AFHSB) Seasonal Influenza Surveillance Summary Northern Command -- Week 17 (22 Apr 28 Apr 2018) In NORTHCOM during week 17 Influenza activity continued to be minimal for the majority
DEPARTMENT OF DEFENSE (AFHSB) Seasonal Influenza Surveillance Summary Northern Command -- Week 17 (22 Apr 28 Apr 2018) In NORTHCOM during week 17 Influenza activity continued to be minimal for the majority
Using Policy, Programs, and Partnerships to Stamp Out Breast and Cervical Cancers
 Using Policy, Programs, and Partnerships to Stamp Out Breast and Cervical Cancers National Conference of State Legislatures Annual Meeting J August 2006 Christy Schmidt Senior Director of Policy National
DEPARTMENT OF DEFENSE (AFHSB)
") DEPARTMENT OF DEFENSE (AFHSB) Seasonal Influenza Surveillance Summary Northern Command -- Week 13 (04 Mar 07 Apr 2018) In NORTHCOM during week 13 Influenza activity was minimal to low for the majority
DEPARTMENT OF DEFENSE (AFHSB) Seasonal Influenza Surveillance Summary Northern Command -- Week 13 (04 Mar 07 Apr 2018) In NORTHCOM during week 13 Influenza activity was minimal to low for the majority
B&T Format. New Measures. 2 CAHPS is a registered trademark of the Agency for Healthcare Research and Quality (AHRQ).
.") TO: Interested Organizations FROM: Patrick Dahill, Assistant Vice President, Policy DATE: February 4, 2018 RE: 2018 Accreditation Benchmarks and Thresholds This document reports national benchmarks and
TO: Interested Organizations FROM: Patrick Dahill, Assistant Vice President, Policy DATE: February 4, 2018 RE: 2018 Accreditation Benchmarks and Thresholds This document reports national benchmarks and
B&T Format. New Measures. Better health care. Better choices. Better health.
 1100 13th Street NW, Third Floor Washington, DC 20005 phone 202.955.3500 fax 202.955.3599 www.ncqa.org TO: Interested Organizations FROM: Patrick Dahill, Assistant Vice President, Policy DATE: August 13,
HIV/AIDS and other Sexually Transmitted Diseases (STDs) in the Southern Region of the United States: Epidemiological Overview
 in the Southern Region of the United States: Epidemiological Overview") HIV/AIDS and other Sexually Transmitted Diseases (STDs) in the Southern Region of the United States: Epidemiological Overview Prepared by The Henry J. Kaiser Family Foundation for Southern States Summit
HIV/AIDS and other Sexually Transmitted Diseases (STDs) in the Southern Region of the United States: Epidemiological Overview Prepared by The Henry J. Kaiser Family Foundation for Southern States Summit
B&T Format. New Measures. Better health care. Better choices. Better health.
 1100 13th Street NW, Third Floor Washington, DC 20005 phone 202.955.3500 fax 202.955.3599 www.ncqa.org TO: Interested Organizations FROM: Patrick Dahill, Assistant Vice President, Policy DATE: February
Autism Activities at CDC: The Public Health Model
 Autism Activities at CDC: The Public Health Model Act Early Region II Summit Bronx, NY March 26, 2009 Marshalyn Yeargin-Allsopp, MD Georgina Peacock, MD, MPH National Center on Birth Defects and Developmental
DEPARTMENT OF DEFENSE (AFHSB)
") In NORTHCOM during week 01 Northern Command -- Week 01 (31 Dec 2017 06 Jan 2018) Influenza activity continued to increase with the majority of states still experiencing moderate to high activity. The percentage
In NORTHCOM during week 01 Northern Command -- Week 01 (31 Dec 2017 06 Jan 2018) Influenza activity continued to increase with the majority of states still experiencing moderate to high activity. The percentage
MAKING WAVES WITH STATE WATER POLICIES. Washington State Department of Health
 MAKING WAVES WITH STATE WATER POLICIES Washington State Department of Health Lead poisoning is a public health problem. Health Effects of Lead Lead Exposures and Pathways HOME Paint Lead pipes Lead solder
DEPARTMENT OF DEFENSE (AFHSB)
") DEPARTMENT OF DEFENSE (AFHSB) Seasonal Influenza Surveillance Summary Northern Command -- Week 16 (15 Apr 21 Apr 2018) In NORTHCOM during week 16 Influenza activity continued to be minimal for the majority
DEPARTMENT OF DEFENSE (AFHSB) Seasonal Influenza Surveillance Summary Northern Command -- Week 16 (15 Apr 21 Apr 2018) In NORTHCOM during week 16 Influenza activity continued to be minimal for the majority
DEPARTMENT OF DEFENSE (AFHSB)
") DEPARTMENT OF DEFENSE (AFHSB) Seasonal Influenza Surveillance Summary Northern Command -- Week 9 ( 02 December 08 December 2018) In NORTHCOM during week 9 Influenza activity remained similar to last week
DEPARTMENT OF DEFENSE (AFHSB) Seasonal Influenza Surveillance Summary Northern Command -- Week 9 ( 02 December 08 December 2018) In NORTHCOM during week 9 Influenza activity remained similar to last week
Medical Marijuana Responsible for Traffic Fatalities Alfred Crancer, B.S., M.A.; Phillip Drum, Pharm.D.
 Medical Marijuana Responsible for Traffic Fatalities Alfred Crancer, B.S., M.A.; Phillip Drum, Pharm.D. Abstract In California, where only 25% of the drivers in fatal crashes are tested for drugs, 252
DEPARTMENT OF DEFENSE (AFHSB)
") DEPARTMENT OF DEFENSE (AFHSB) Seasonal Influenza Surveillance Summary Northern Command -- Week 8 (25 November December 1, 2018) In NORTHCOM during week 8 Influenza activity continued to increase throughout
DEPARTMENT OF DEFENSE (AFHSB) Seasonal Influenza Surveillance Summary Northern Command -- Week 8 (25 November December 1, 2018) In NORTHCOM during week 8 Influenza activity continued to increase throughout
The Chiropractic Pediatric CE Credit Program with Emphasis on Autism
 The Chiropractic Pediatric CE Credit Program with Emphasis on May 24-26, 2018- Lombard, IL The seminar meets all standards or is approved for 24 HOURS of Continuing Education credit in the following states
Save Lives and Money. Help State Employees Quit Tobacco
 Save Lives and Money Help State Employees Quit Tobacco 2009 Join These 5 Leading States Cover All the Treatments Your State Employees Need To Quit Tobacco 1 2 Follow these leaders and help your state employees
DEPARTMENT OF DEFENSE (AFHSB)
") DEPARTMENT OF DEFENSE (AFHSB) Seasonal Influenza Surveillance Summary Northern Command -- Week 15 (07 April 2019 013 April 2019) In NORTHCOM during week 15 Influenza activity returned to minimal or continued
DEPARTMENT OF DEFENSE (AFHSB) Seasonal Influenza Surveillance Summary Northern Command -- Week 15 (07 April 2019 013 April 2019) In NORTHCOM during week 15 Influenza activity returned to minimal or continued
West Nile virus and other arboviral activity -- United States, 2013 Provisional data reported to ArboNET Tuesday, January 7, 2014
 West Nile virus and other arboviral activity -- United States, 2013 reported to ArboNET Tuesday, This update from the CDC Arboviral Diseases Branch includes provisional data reported to ArboNET for January
DEPARTMENT OF DEFENSE (AFHSB)
") In NORTHCOM during week 50 DEPARTMENT OF DEFENSE (AFHSB) Seasonal Influenza Surveillance Summary Northern Command -- Week 50 (09 December 15 December 2018) Influenza activity decreased in many states,
In NORTHCOM during week 50 DEPARTMENT OF DEFENSE (AFHSB) Seasonal Influenza Surveillance Summary Northern Command -- Week 50 (09 December 15 December 2018) Influenza activity decreased in many states,
Forensic Patients in State Hospitals:
 Forensic Patients in State Hospitals: 1999-2016 Vera Hollen, M.A. Senior Director of Research & Consulting Director, Mental Health/Criminal Justice Research Center National Association of State Mental
DEPARTMENT OF DEFENSE (AFHSB)
") In NORTHCOM during week 05 DEPARTMENT OF DEFENSE (AFHSB) Seasonal Influenza Surveillance Summary Northern Command -- Week 05 (27 January 2019 02 February 2019) Influenza activity increased in several states
In NORTHCOM during week 05 DEPARTMENT OF DEFENSE (AFHSB) Seasonal Influenza Surveillance Summary Northern Command -- Week 05 (27 January 2019 02 February 2019) Influenza activity increased in several states
DEPARTMENT OF DEFENSE (AFHSB)
") In NORTHCOM during week 09 DEPARTMENT OF DEFENSE (AFHSB) Seasonal Influenza Surveillance Summary Northern Command -- Week 09 (24 February 2019 02 March 2019) Influenza activity continued to increase, especially
In NORTHCOM during week 09 DEPARTMENT OF DEFENSE (AFHSB) Seasonal Influenza Surveillance Summary Northern Command -- Week 09 (24 February 2019 02 March 2019) Influenza activity continued to increase, especially
ROAD SAFETY MONITOR. ALCOHOL-IMPAIRED DRIVING IN THE UNITED STATES Results from the 2017 TIRF USA Road Safety Monitor
 Background What is the context of alcohol-impaired driving in the U.S.? According to the National Highway Traffic Safety Administration (NHTSA), alcohol-impaired driving fatalities involving a driver with
Health Care Reform: Colorectal Cancer Screening Expansion, Before and After the Affordable Care Act (ACA)
") University of Arkansas for Medical Sciences From the SelectedWorks of Michael Preston April 9, 2014 Health Care Reform: Colorectal Cancer Screening Expansion, Before and After the Affordable Care Act (ACA)
University of Arkansas for Medical Sciences From the SelectedWorks of Michael Preston April 9, 2014 Health Care Reform: Colorectal Cancer Screening Expansion, Before and After the Affordable Care Act (ACA)
DEPARTMENT OF DEFENSE (AFHSB)
") In NORTHCOM during week 52 DEPARTMENT OF DEFENSE (AFHSB) Seasonal Influenza Surveillance Summary Northern Command -- Week 52 (23 December 29 December 2018) Influenza activity remained similar to last week
In NORTHCOM during week 52 DEPARTMENT OF DEFENSE (AFHSB) Seasonal Influenza Surveillance Summary Northern Command -- Week 52 (23 December 29 December 2018) Influenza activity remained similar to last week
DEPARTMENT OF DEFENSE (AFHSB)
") In NORTHCOM during week 02 DEPARTMENT OF DEFENSE (AFHSB) Seasonal Influenza Surveillance Summary Northern Command -- Week 02 (06 January 2019 12 January 2019) Influenza activity decreased in several states,
In NORTHCOM during week 02 DEPARTMENT OF DEFENSE (AFHSB) Seasonal Influenza Surveillance Summary Northern Command -- Week 02 (06 January 2019 12 January 2019) Influenza activity decreased in several states,
SUMMARY OF SYNTHETIC CANNABINOID BILLS
 SUMMARY OF SYNTHETIC CANNABINOID BILLS Alabama: H.B. 163, S.B. 235, S.B. 283 indefinitely postponed as of 6/1/2011 - amends existing statute regarding chemical compounds to add JWH-200 and CP 47,497 Alaska:
Quarterly Hogs and Pigs
 Quarterly Hogs and Pigs ISSN: 9- Released December 23,, by the National Agricultural Statistics Service (NASS), Agricultural Statistics Board, United s Department of Agriculture (USDA). United s Hog Inventory
Contents. Introduction. Acknowledgments. 1 Assisted Reproduction and the Diversity of the Modern Family 1. 2 Intrauterine Insemination 31.
 Introduction Acknowledgments xvii xix 1 Assisted Reproduction and the Diversity of the Modern Family 1 1.1 Assisted Reproduction Technology Today....1 1.2 ART and Marriage...5 1.3 Evolution of the Family...8
Health Care Reform: Colorectal Cancer Screening Disparities, Before and After the Affordable Care Act (ACA)
") University of Arkansas for Medical Sciences From the SelectedWorks of Michael Preston June 7, 2014 Health Care Reform: Colorectal Cancer Screening Disparities, Before and After the Affordable Care Act
University of Arkansas for Medical Sciences From the SelectedWorks of Michael Preston June 7, 2014 Health Care Reform: Colorectal Cancer Screening Disparities, Before and After the Affordable Care Act
The Wellbeing of America s Workforce, and Its Effects on an Organization s Performance
 The Wellbeing of America s Workforce, and Its Effects on an Organization s Performance 25-year commitment; initiated January 2, 2008. 1,000 completed surveys per day, 7 days per week, 350 days per year.
Instant Drug Testing State Law Guide
 Instant Drug Testing State Law Guide State Alabama Alaska Arizona POCT / Instant Testing Status Comment outside this voluntary law but not by companies that wish to qualify for the WC discount. FDA-cleared
DEPARTMENT OF DEFENSE (AFHSB)
") In NORTHCOM during week 01 DEPARTMENT OF DEFENSE (AFHSB) Seasonal Influenza Surveillance Summary Northern Command -- Week 01 (30 December 2018 05 January 2019) Influenza activity increased across the US,
In NORTHCOM during week 01 DEPARTMENT OF DEFENSE (AFHSB) Seasonal Influenza Surveillance Summary Northern Command -- Week 01 (30 December 2018 05 January 2019) Influenza activity increased across the US,
Exhibit 1. Change in State Health System Performance by Indicator
 Exhibit 1. Change in State Health System Performance by Indicator Indicator (arranged by number of states with improvement within dimension) Access and Affordability 0 Children ages 0 18 uninsured At-risk
If you suspect Fido's owner is diverting prescription pain meds meant for the pet, checking your state's drug monitoring database may not help
 Prescriptions If you suspect Fido's owner is diverting prescription pain meds meant for the pet, checking your state's drug monitoring database may not help by Ann M. Philbrick, PharmD, BCPS The Centers
Hawai i to Zero. Timothy McCormick Harm Reduction Services Branch Hawai i Department of Health. January 16, 2018
 HIV Prevention Efforts in Hawai i Hawai i to Zero Timothy McCormick Harm Reduction Services Branch Hawai i Department of Health January 16, 2018 People living with HIV who take HIV medicine as prescribed
Quarterly Hogs and Pigs
 Quarterly Hogs and Pigs ISSN: 9- Released December 22,, by the National Agricultural Statistics Service (NASS), Agricultural Statistics Board, United s Department of Agriculture (USDA). United s Hog Inventory
An Unhealthy America: The Economic Burden of Chronic Disease Charting a New Course to Save Lives and Increase Productivity and Economic Growth
 An Unhealthy America: The Economic Burden of Chronic Disease Charting a New Course to Save Lives and Increase Productivity and Economic Growth Ross DeVol Director, Center for Health Economics Director,
PETITION FOR DUAL MEMBERSHIP
 PLEASE PRINT: PETITION FOR DUAL MEMBERSHIP Bradenton, Florida this day of, AD. To the Master, Wardens and Members of Manatee Lodge No. 31, F&AM: (The Petitioner will answer the following questions) What
September 20, Thomas Scully Administrator Centers for Medicare and Medicaid Services 200 Independence Avenue SW Washington, DC 20201
 September 20, 2001 Thomas Scully Administrator Centers for Medicare and Medicaid Services 200 Independence Avenue SW Washington, DC 20201 Dear Mr. Scully: The medical organizations listed below would like
Opioid Deaths Quadruple Since 1999
 THE COUNCIL OF STATE GOVERNMENTS CAPITOL RESEARCH AUGUST 2017 HEALTH POLICY Opioid Deaths Quadruple Since 1999 Since 1999, the number of overdose deaths involving opioids (including prescription opioids
The 2004 National Child Count of Children and Youth who are Deaf-Blind
 The 2004 National Child Count of Children and Youth who are Deaf-Blind NTAC The Teaching Research Institute Western Oregon University The Helen Keller National Center Sands Point, New York The National
Supplement to Achieving a State of Healthy Weight
 Composition of Ratings of Practices 0 (Highest to Lowest) Fully Met Partially Met Not Addressed Contradicted IB: Feed infants on cue IA: No cow s milk < yr IB: Hold infant to feed IC: Plan solid introduction
Analysis of State Medicaid Agency Performance in Relation to Incentivizing the Provision of H1N1 Immunizations to Eligible Populations
 Analysis of State Medicaid Agency Performance in Relation to Incentivizing the Provision of H1N1 Immunizations to Eligible Populations Nancy Lopez, JD, MPH, Ross Margulies, JD/MPH [Cand.], and Sara Rosenbaum,
NM Coalition of Sexual Assault Programs, Inc.
 NM Coalition of Sexual Assault Programs, Inc. PREVALENCE OF SEXUAL VIOLENCE AMONG WOMEN IN NEW MEXICO: A SUMMARY OF THE FINDINGS FROM THE NATIONAL INTIMATE PARTNER AND SEXUAL VIOLENCE SURVEY 2010 2012
AAll s well that ends well; still the fine s the crown; Whate er the course, the end is the renown. WILLIAM SHAKESPEARE, All s Well That Ends Well
 AAll s well that ends well; still the fine s the crown; Whate er the course, the end is the renown. WILLIAM SHAKESPEARE, All s Well That Ends Well mthree TrEATMENT MODALITIES 7 ž 21 ATLAS OF ESRD IN THE
HIV in Prisons, 2000
 U.S Department of Justice Office of Justice Programs Bureau of Justice Statistics Bulletin October, NCJ HIV in Prisons, By Laura M. Maruschak BJS Statistician On December,,.% of State prison inmates, and.%
Perinatal Health in the Rural United States, 2005
 Perinatal Health in the Rural United States, 2005 Policy Brief Series #138: LOW BIRTH WEIGHT RATES IN THE RURAL UNITED STATES, 2005 #139: LOW BIRTH WEIGHT RATES AMONG RACIAL AND ETHNIC GROUPS IN THE RURAL
West Nile virus and other arboviral activity -- United States, 2016 Provisional data reported to ArboNET Tuesday, October 11, 2016
 West Nile virus and other arboviral activity -- United States, 2016 Provisional data reported to ArboNET Tuesday, October 11, 2016 This update from the CDC Arboviral Disease Branch includes provisional
DISCLAIMER: ECHO Nevada emphasizes patient privacy and asks participants to not share ANY Protected Health Information during ECHO clinics.
 DISCLAIMER: Video will be taken at this clinic and potentially used in Project ECHO promotional materials. By attending this clinic, you consent to have your photo taken and allow Project ECHO to use this
The Healthy Indiana Plan
 The Healthy Indiana Plan House Enrolled Act 1678 A Pragmatic Approach Governor Mitch Daniels July 16, 2007 Indiana s Fiscal Health is Good First Back-to-Back Balanced Budget in Eight Years $1,000.0 Revenue
The American Speech-Language-Hearing Association Noisy Environments Poll Summary
 The American Speech-Language-Hearing Association Noisy Environments Poll Summary Spring 2017 Contents Background and Objectives 2 Methodology 3 Executive Summary 4 Attitudes Towards Hearing 8 Current Leisure
Influenza (FLU) Update for Week #52 Week Ending
 Update for Week #52 Week Ending") Influenza (FLU) Update for Week #52 Week Ending 12-29-18 For week #52 (ending 12-29-18) the CDC reported that influenza (Flu) activity, which includes diagnosed flu as well as ILI (Influenza-Like-Illness),
Influenza (FLU) Update for Week #52 Week Ending 12-29-18 For week #52 (ending 12-29-18) the CDC reported that influenza (Flu) activity, which includes diagnosed flu as well as ILI (Influenza-Like-Illness),
HIV in Prisons,
 U.S. Department of Justice Office of Justice Programs Bureau of Justice Statistics Bureau of Justice Statistics BULLETIN HIV in Prisons, 2007-08 Laura M. Maruschak BJS Statistician Randy Beavers, BJS Intern
Cancer Prevention & Early Detection Facts & Figures. Tables and Figures 2018
 Cancer Prevention & Early Detection Facts & Figures Tables and Figures 2018 1 Table of Contents Tobacco Use Figure 1A. State Cigarette Excise Tax, 2018..... 3 Figure 1B. Proportion of Cancer Deaths Attributable
April 25, Edward Donnell Ivy, MD, MPH
 HRSA Hemoglobinopathies Programs: Sickle Cell Disease Newborn Screening Follow-Up Program(SCDNBSP) and Sickle Cell Disease Treatment Demonstration Regional Collaboratives Program (SCDTDP) April 25, 2017
Results from the Commonwealth Fund Scorecard on State Health System Performance. Douglas McCarthy. Senior Research Director The Commonwealth Fund
 AIMING HIGHER: Results from the Commonwealth Fund Scorecard on State Health System Performance EDITION APPENDIX David C. Radley Senior Scientist The Commonwealth Fund Douglas McCarthy Senior Research Director
Trends in Lung Cancer Morbidity and Mortality
 Trends in Lung Cancer Morbidity and Mortality American Lung Association Epidemiology and Statistics Unit Research and Program Services Division November 2014 Table of Contents Trends in Lung Cancer Morbidity
See this link for more details on Flu and ILI activity, including charts, graphs and maps:
 Influenza (FLU) Update for Week #02 Week Ending 1-12-19 The CDC reported that Influenza (Flu) activity, which includes diagnosed flu as well as ILI (Influenza-Like- Illness), remained elevated. The percentage
Overview of the States Pesticide Registration Process AAPCO Laboratory Committee
 Overview of the States Pesticide Registration Process AAPCO Laboratory Committee Feb 16 th, 2011 Ana Cristina Rodriguez Manager, State Registration/Regulatory Affairs DuPont Crop Protection March 6, 2017
ARE STATES DELIVERING?
 The Promise of Quality, Affordable Health Care for Women ARE STATES DELIVERING? A 50-State Report Card on Women s Health OCTOBER 2014 TAKING ACTION, MAKING CHANGE The Alliance for a Just Society s mission
2012 Asthma Summit Greenville SC, Aug. 9, 2012
 Burden of In South Carolina 2012 Asthma Summit Greenville SC, Aug. 9, 2012 Khosrow Heidari, M.A., M.S., M.S. State Chronic Disease Epidemiologist Director of Chronic Disease Epidemiology & Evaluation,
Tobacco Control Policy at the State Level. Progress and Challenges. Danny McGoldrick Institute of Medicine Washington, DC June 11, 2012
 Tobacco Control Policy at the State Level Progress and Challenges Danny McGoldrick Institute of Medicine Washington, DC June 11, 2012 The Tools of Tobacco Control Tobacco Taxes Smoke-free Laws Comprehensive
National and Regional Summary of Select Surveillance Components
 - 21-211 Influenza Season Week 9 ending March 5, 211 All data are preliminary and may change as more reports are received. Synopsis: During week 9 (February 27-March 5, 211), influenza activity in the
Women s health status is one of the strongest determinants of how women use the health care system. The
 Women s health status is one of the strongest determinants of how women use the health care system. The poorer their health, the more women need and benefit from high-quality, appropriate care. Overall,
Medical Marijuana
 Medical Marijuana 1999-2001 June 2003 Codebook ImpacTeen is part of the Bridging the Gap Initiative: Research Informing Practice for Healthy Youth Behavior, supported by The Robert Wood Johnson Foundation
CMS Oral Health Ini9a9ve - Goals
 6/28/12 CMS Oral Health Initiative: Update on Goals and Action Plans Photo 1 Photo 1 2012 MSDA National Medicaid and CHIP Oral Health Symposium: Designing Quality in High Definition Photo 2 Photo 2 Laurie
2003 National Immunization Survey Public-Use Data File
 SECTION 1. ID, WEIGHT AND FLAG VARIABLES Section 1 Variable Name SEQNUMC Label UNIQUE CHILD IDENTIFIER Frequency of Missing/Non-missing Values All Data 30930 21310 NON-MISSING CHARACTER STRING 000011 MINIMUM