Example 1. Students Mock exam Final exam. Bill Jane Jack Pat John Susan Anna Margret Peggy Joe William Ron Bob Sally Marry
|
|
|
- Bernard Baker
- 5 years ago
- Views:
Transcription
1 Regression analysis
2 Example 1 A teacher wants to find out if the results of a exam written earlier during the semester correlate with the results of the final exam. Perform a correlational analysis. Students Mock exam Final exam Bill Jane Jack Pat John Susan Anna Margret Peggy Joe William Ron Bob Sally Marry

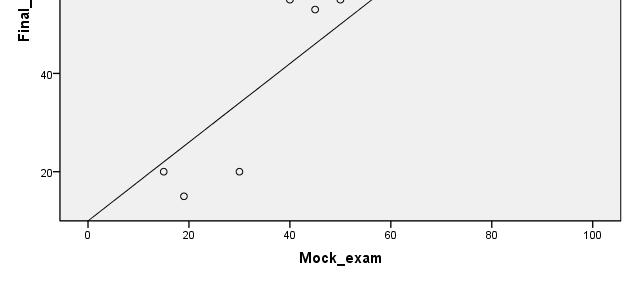
3 Outlier Example 1
4 Example 2 Is there a correlation between years of education, income and ethnic group? Black years of education Blacks income Black years of education Blacks income
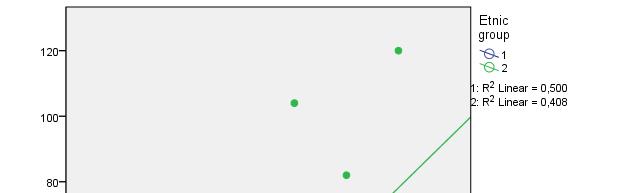
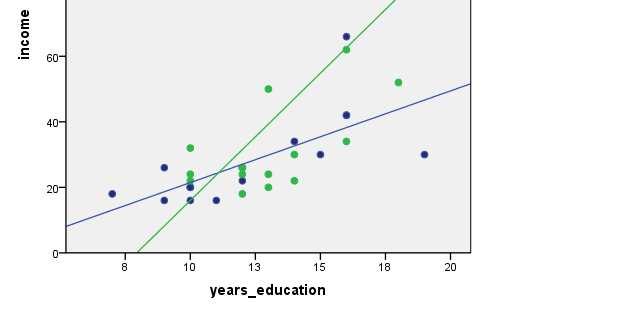
5 Example 2
6 Example 2
7 Bivariate linear regression
8 Correlation - Regression Correlational analysis gives us a measure that indicates how closely the data points are associated. Regression analysis measures the effect of the predictor variable x on the dependent variable (= criterion) y. How much does y change if you change x. A correlational analysis is purely descriptive, whereas a regression analysis allows us to make predictions.
9 Types of regression analysis Predictor variable Criterion (target) variable Linear regression 1 interval 1 interval Multiple regression Logistic regression Discriminant analysis 2+ (some of the variables can be categorical) 1 interval 1+ 1 categorical
10 Line of-best-fit 6,00 5,00 MLU 4,00 3,00 Residuals: difference between predicted and observed values 2,00 R-Quadrat linear = 0,786 20,00 30,00 40,00 50,00 60,00 Age
11 Linear regression y = bx + a y = x = b = a = variable to be predicted given value on the variable x value of the slope of the line the intercept (or constant), which is the place where the lineof-best-fit intercepts the y-axis
12 Linear regression Given a score of 20 on the x-axis, a slope of b = 2, and an interception point of a = 5, what is the predicted score? y = (2 20) + 5 y = 45
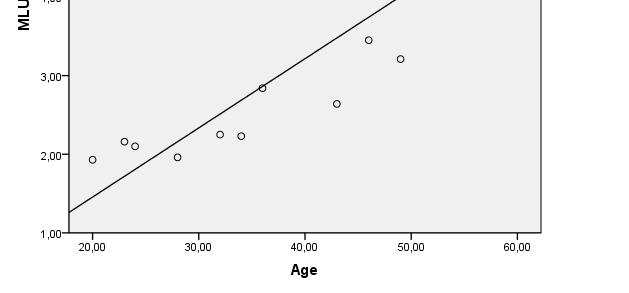
13 Example: Age and MLU Ein wichtiges Maß für den Entwicklungsstand eines Kindes ist die Mittlere Länge von Äußerungen (MLU = Mean length of Utterances). Danach nimmt die Anzahl der Wörter und/oder Silben in einer Äußerung mit dem Alter zu. Überprüfen Sie diese Hypothese an den folgenden Daten. Cases Children Age in months MLU 1 John Bill Sue Jane Ann Susan Jack William Mary Peter Pete Allan

14 Example: Age and MLU
15 Example: Age and MLU Effect size
16 Correlational coefficient and effect size Correlation coefficient Shared variance (effect size) r = Kein Zusammenhang r = (1%) Geringe Korrelation r = (4%) r = (9%) Mittlere Korrelation r = (16%) r = (25%) r = (36%) Hohe Korrelation r = (49%) r = (64%) Sehr hohe Korrelation r = (81%) r = (100%)
17 Example: Age and MLU
18 Example: Age and MLU Intercept Regression coefficient Sig of regression coefficient
19 Example: Age and MLU There is s strong association between age and MLU (R = 0.887). Specifically, it was found that the children s MLU increases by an average of.088 words each months (t = 6,069, p < 0.001), which amounts to about a word a year. Since the F-value (36,838, df = 1) is highly significant (p < 001), these results are unlikely to have arisen from sample error.
20 Multivariate regression
21 Multiple regression Several predictor variables influence the criterion. y = b 1 x 1 + b 2 x 2 + b 3 x 3 + a Plane-of-best-fit 1. Simultaneous multiple regression 2. Stepwise multiple regression
22 Multiple regression Eine Universität möchte wissen, welche Faktoren am besten dazu geeignet sind, den Lernerfolg ihrer Studenten vorherzusagen. Als Indikator für den Wissensstand der Studenten gilt die Punktzahl in einer zentralen Abschlussklausur. Als mögliche Faktoren werden in Betracht gezogen: (1) Punktzahl beim Eingangstest, (2) Alter, (3) IQ Test, (4) Punktzahl bei einem wissenschaftlichen Projekt.
23 Multiple regression Predictor: entrance exam age IQ Scientific project Criterion: final exam
24 Multiple regression
25 Multiple regression
26 Multiple regression Standardisierter Wert für Neigungswinkel (=b)
27 Multiple regression There is a strong association between the predictor variables and the result of the final exam (Multiple R = 0.875; F = 22,783, df = 4, p =.001). Together they account for 73% of the variation in the exam success. If we look at the four predictor variables individually we find that the result of the entrance exam (B =.576, t = 5.431, p =.001) and the IQ score (B =.447, t = 4.606, p =.001) make the strongest contributions (i.e. they are the best predictors). The predictive value of age (B =.099, t = 5.431, p =.327 and the score on the scientific project is not significant (B = 0.141, t = 1,417, p = ).
28 Multivariate regression
29 Exercise A researcher has carried out an experiment with 20 L2 learners of English testing their command of different types of relative clauses. Now he wants to find out if and to what extend the following factors influence the result of the experiment: years of foreign language education, time spent abroad (in month), and gender. Inspect the data (scatterplots), perform a multiple regression analysis and interpret the output in form of a written report.
30 Gender Years_learning Month_abroad Test_score
31 Results
32 Results
33 Results
34 Results
35 Results
36 Results There is a strong association between the predictor variables and the result of the final exam (Multiple R = 0.775; F = 8,033, df = 3, p =.002). Together they account for 60% of the variation in the exam success. However, if we look at the three predictor variables individually we find that the months spent abroad (B =.686, t = 3.813, p =.002) is the only significant predictor. The predictive value of gender (B = ) and years of learning are not significant (B = ).
37 Stepwise regression
38 Stepwise multiple regression Modell 1 2 (Konstante) Entrance (Konstante) Entrance IQ a. Abhängige Variable: Final Koeffizienten a Standardisiert Nicht standardisierte Koeffizienten e Koeffizienten B Standardf ehler Beta T Signifikanz -46,305 25,477-1,817,079 3,155,532,729 5,925, ,659 41,888-5,292,000 2,521,431,582 5,854,000 1,591,336,471 4,736,000
39 Assumptions of multiple regression 1. At least 15 cases/subjects 2. Interval data 3. Linear relationship between predictor variables and criterion. 4. No outliers (or delete them) 5. Predictor variables should be independent of each other
40 Logistic regression
41 Logistic regression Multiple predictor variables (continuous + categorical) A categorical dependent variable (with two or more levels)
42 Logistic regression What determines the order of object and particle in the English verb particle construction? (1) He looked the number up. (2) He looked up the number. Previous research suggests that the following factors may be relevant: the length and complexity of the direct object, the meaning and definiteness of the object, the NP type of the object (pronoun vs. lexical NP), and the occurrence of a locational PP at the end of the sentence.
43 Logistic regression complexity length meaning NP type V_NP_P V_P_NP PP definiteness
CHAPTER TWO REGRESSION
 CHAPTER TWO REGRESSION 2.0 Introduction The second chapter, Regression analysis is an extension of correlation. The aim of the discussion of exercises is to enhance students capability to assess the effect
CRITERIA FOR USE. A GRAPHICAL EXPLANATION OF BI-VARIATE (2 VARIABLE) REGRESSION ANALYSISSys
 REGRESSION ANALYSISSys") Multiple Regression Analysis 1 CRITERIA FOR USE Multiple regression analysis is used to test the effects of n independent (predictor) variables on a single dependent (criterion) variable. Regression tests
Multiple Regression Analysis 1 CRITERIA FOR USE Multiple regression analysis is used to test the effects of n independent (predictor) variables on a single dependent (criterion) variable. Regression tests
Class 7 Everything is Related
 Class 7 Everything is Related Correlational Designs l 1 Topics Types of Correlational Designs Understanding Correlation Reporting Correlational Statistics Quantitative Designs l 2 Types of Correlational
12/30/2017. PSY 5102: Advanced Statistics for Psychological and Behavioral Research 2
 PSY 5102: Advanced Statistics for Psychological and Behavioral Research 2 Selecting a statistical test Relationships among major statistical methods General Linear Model and multiple regression Special
INTERNATIONALES MARKENMANAGEMENT
 Chair for Marketing and Retailing INTERNATIONALES MARKENMANAGEMENT 5. Übung im Master WS 2015/2016 Spezialisierung: Handel und Internationales Marketing-Management Modul: Retail Management und Internationales
Simple Linear Regression
 Simple Linear Regression Assoc. Prof Dr Sarimah Abdullah Unit of Biostatistics & Research Methodology School of Medical Sciences, Health Campus Universiti Sains Malaysia Regression Regression analysis
Applications. DSC 410/510 Multivariate Statistical Methods. Discriminating Two Groups. What is Discriminant Analysis
 DSC 4/5 Multivariate Statistical Methods Applications DSC 4/5 Multivariate Statistical Methods Discriminant Analysis Identify the group to which an object or case (e.g. person, firm, product) belongs:
Biology 345: Biometry Fall 2005 SONOMA STATE UNIVERSITY Lab Exercise 5 Residuals and multiple regression Introduction
 Biology 345: Biometry Fall 2005 SONOMA STATE UNIVERSITY Lab Exercise 5 Residuals and multiple regression Introduction In this exercise, we will gain experience assessing scatterplots in regression and
Multiple Linear Regression Analysis
 Revised July 2018 Multiple Linear Regression Analysis This set of notes shows how to use Stata in multiple regression analysis. It assumes that you have set Stata up on your computer (see the Getting Started
Chapter 14: More Powerful Statistical Methods
 Chapter 14: More Powerful Statistical Methods Most questions will be on correlation and regression analysis, but I would like you to know just basically what cluster analysis, factor analysis, and conjoint
Daniel Boduszek University of Huddersfield
 Daniel Boduszek University of Huddersfield d.boduszek@hud.ac.uk Introduction to Multiple Regression (MR) Types of MR Assumptions of MR SPSS procedure of MR Example based on prison data Interpretation of
Daniel Boduszek University of Huddersfield
 Daniel Boduszek University of Huddersfield d.boduszek@hud.ac.uk Introduction to Logistic Regression SPSS procedure of LR Interpretation of SPSS output Presenting results from LR Logistic regression is
Regression Including the Interaction Between Quantitative Variables
 Regression Including the Interaction Between Quantitative Variables The purpose of the study was to examine the inter-relationships among social skills, the complexity of the social situation, and performance
POL 242Y Final Test (Take Home) Name
 Name") POL 242Y Final Test (Take Home) Name_ Due August 6, 2008 The take-home final test should be returned in the classroom (FE 36) by the end of the class on August 6. Students who fail to submit the final
POL 242Y Final Test (Take Home) Name_ Due August 6, 2008 The take-home final test should be returned in the classroom (FE 36) by the end of the class on August 6. Students who fail to submit the final
11/18/2013. Correlational Research. Correlational Designs. Why Use a Correlational Design? CORRELATIONAL RESEARCH STUDIES
 Correlational Research Correlational Designs Correlational research is used to describe the relationship between two or more naturally occurring variables. Is age related to political conservativism? Are
Business Statistics Probability
 Business Statistics The following was provided by Dr. Suzanne Delaney, and is a comprehensive review of Business Statistics. The workshop instructor will provide relevant examples during the Skills Assessment
Daniel Boduszek University of Huddersfield
 Daniel Boduszek University of Huddersfield d.boduszek@hud.ac.uk Introduction to Correlation SPSS procedure for Pearson r Interpretation of SPSS output Presenting results Partial Correlation Correlation
bivariate analysis: The statistical analysis of the relationship between two variables.
 bivariate analysis: The statistical analysis of the relationship between two variables. cell frequency: The number of cases in a cell of a cross-tabulation (contingency table). chi-square (χ 2 ) test for
MULTIPLE OLS REGRESSION RESEARCH QUESTION ONE:
 1 MULTIPLE OLS REGRESSION RESEARCH QUESTION ONE: Predicting State Rates of Robbery per 100K We know that robbery rates vary significantly from state-to-state in the United States. In any given state, we
Statistics for Psychology
 Statistics for Psychology SIXTH EDITION CHAPTER 12 Prediction Prediction a major practical application of statistical methods: making predictions make informed (and precise) guesses about such things as
1.4 - Linear Regression and MS Excel
 1.4 - Linear Regression and MS Excel Regression is an analytic technique for determining the relationship between a dependent variable and an independent variable. When the two variables have a linear
NORTH SOUTH UNIVERSITY TUTORIAL 2
 NORTH SOUTH UNIVERSITY TUTORIAL 2 AHMED HOSSAIN,PhD Data Management and Analysis AHMED HOSSAIN,PhD - Data Management and Analysis 1 Correlation Analysis INTRODUCTION In correlation analysis, we estimate
UNIVERSITY OF TORONTO SCARBOROUGH Department of Computer and Mathematical Sciences Midterm Test February 2016
 UNIVERSITY OF TORONTO SCARBOROUGH Department of Computer and Mathematical Sciences Midterm Test February 2016 STAB22H3 Statistics I, LEC 01 and LEC 02 Duration: 1 hour and 45 minutes Last Name: First Name:
Correlation and Regression
 Dublin Institute of Technology ARROW@DIT Books/Book Chapters School of Management 2012-10 Correlation and Regression Donal O'Brien Dublin Institute of Technology, donal.obrien@dit.ie Pamela Sharkey Scott
Auswertungsbericht Lehrveranstaltungsevaluation an die Lehrenden
 Bergische Universität Wuppertal UNISERVICE Qualität in Studium und Lehre Gaußstraße 0 9 Wuppertal Telefon: (00) 9 97 EMail: evasys@uniwuppertal.de Universität Wuppertal QSL Gaußstraße 0 9 Wuppertal Prof.
Biostatistics II
 Biostatistics II 514-5509 Course Description: Modern multivariable statistical analysis based on the concept of generalized linear models. Includes linear, logistic, and Poisson regression, survival analysis,
11/24/2017. Do not imply a cause-and-effect relationship
 Correlational research is used to describe the relationship between two or more naturally occurring variables. Is age related to political conservativism? Are highly extraverted people less afraid of rejection
Multiple Regression Using SPSS/PASW
 MultipleRegressionUsingSPSS/PASW The following sections have been adapted from Field (2009) Chapter 7. These sections have been edited down considerablyandisuggest(especiallyifyou reconfused)thatyoureadthischapterinitsentirety.youwillalsoneed
CHAPTER ONE CORRELATION
 CHAPTER ONE CORRELATION 1.0 Introduction The first chapter focuses on the nature of statistical data of correlation. The aim of the series of exercises is to ensure the students are able to use SPSS to
The effect of the refusal avoidance training experiment on final disposition codes in the German ESS-2 Schnell, Rainer; Trappmann, Mark
 www.ssoar.info The effect of the refusal avoidance training experiment on final disposition codes in the German ESS-2 Schnell, Rainer; Trappmann, Mark Veröffentlichungsversion / Published Version Arbeitspapier
Chapter 3: Describing Relationships
 Chapter 3: Describing Relationships Objectives: Students will: Construct and interpret a scatterplot for a set of bivariate data. Compute and interpret the correlation, r, between two variables. Demonstrate
Disclosure statement
 Early verbal working memory as a predictor of later language outcomes in late talkers Jayne Newbury, Thomas Klee, Stephanie Stokes and Catherine Moran University of Canterbury, New Zealand Disclosure statement
Simple Linear Regression One Categorical Independent Variable with Several Categories
 Simple Linear Regression One Categorical Independent Variable with Several Categories Does ethnicity influence total GCSE score? We ve learned that variables with just two categories are called binary
Study Guide #2: MULTIPLE REGRESSION in education
 Study Guide #2: MULTIPLE REGRESSION in education What is Multiple Regression? When using Multiple Regression in education, researchers use the term independent variables to identify those variables that
Logistic Regression Predicting the Chances of Coronary Heart Disease. Multivariate Solutions
 Logistic Regression Predicting the Chances of Coronary Heart Disease Multivariate Solutions What is Logistic Regression? Logistic regression in a nutshell: Logistic regression is used for prediction of
12.1 Inference for Linear Regression. Introduction
 12.1 Inference for Linear Regression vocab examples Introduction Many people believe that students learn better if they sit closer to the front of the classroom. Does sitting closer cause higher achievement,
Midterm STAT-UB.0003 Regression and Forecasting Models. I will not lie, cheat or steal to gain an academic advantage, or tolerate those who do.
 Midterm STAT-UB.0003 Regression and Forecasting Models The exam is closed book and notes, with the following exception: you are allowed to bring one letter-sized page of notes into the exam (front and
Introduction to Multilevel Models for Longitudinal and Repeated Measures Data
 Introduction to Multilevel Models for Longitudinal and Repeated Measures Data Today s Class: Features of longitudinal data Features of longitudinal models What can MLM do for you? What to expect in this
Chapter 3 CORRELATION AND REGRESSION
 CORRELATION AND REGRESSION TOPIC SLIDE Linear Regression Defined 2 Regression Equation 3 The Slope or b 4 The Y-Intercept or a 5 What Value of the Y-Variable Should be Predicted When r = 0? 7 The Regression
Chapter 3: Examining Relationships
 Name Date Per Key Vocabulary: response variable explanatory variable independent variable dependent variable scatterplot positive association negative association linear correlation r-value regression
AIC. Schweiz Suisse Svizzera Switzerland skyguide, swiss air navigation services ltd AIP services ch-8602 wangen bei dübendorf
 AIP services phone: +41 (0) 43 931 61 68 fax: +41 (0) 43 931 61 59 AFTN: LSSAYOYX aip@skyguide.ch AIC Schweiz Suisse Svizzera Switzerland skyguide, swiss air navigation services ltd AIP services ch-8602
2013 Supervisor Survey Reliability Analysis
 2013 Supervisor Survey Reliability Analysis In preparation for the submission of the Reliability Analysis for the 2013 Supervisor Survey, we wanted to revisit the purpose of this analysis. This analysis
SUMMER 2011 RE-EXAM PSYF11STAT - STATISTIK
 SUMMER 011 RE-EXAM PSYF11STAT - STATISTIK Full Name: Årskortnummer: Date: This exam is made up of three parts: Part 1 includes 30 multiple choice questions; Part includes 10 matching questions; and Part
STAT 201 Chapter 3. Association and Regression
 STAT 201 Chapter 3 Association and Regression 1 Association of Variables Two Categorical Variables Response Variable (dependent variable): the outcome variable whose variation is being studied Explanatory
CLASSICAL AND. MODERN REGRESSION WITH APPLICATIONS
 - CLASSICAL AND. MODERN REGRESSION WITH APPLICATIONS SECOND EDITION Raymond H. Myers Virginia Polytechnic Institute and State university 1 ~l~~l~l~~~~~~~l!~ ~~~~~l~/ll~~ Donated by Duxbury o Thomson Learning,,
Lecture 12: more Chapter 5, Section 3 Relationships between Two Quantitative Variables; Regression
 Lecture 12: more Chapter 5, Section 3 Relationships between Two Quantitative Variables; Regression Equation of Regression Line; Residuals Effect of Explanatory/Response Roles Unusual Observations Sample
Conditional Distributions and the Bivariate Normal Distribution. James H. Steiger
 Conditional Distributions and the Bivariate Normal Distribution James H. Steiger Overview In this module, we have several goals: Introduce several technical terms Bivariate frequency distribution Marginal
Cellular Biophysics SS Prof. Manfred Radmacher
 SS 20007 Manfred Radmacher Immune system has several layers 2 The immune system attacks pathogens macrophage attacking bacteria From: http://pathmicro.med.sc.edu/ghaffar/innate.htm 3 The immune system
Quantitative Methods in Computing Education Research (A brief overview tips and techniques)
") Quantitative Methods in Computing Education Research (A brief overview tips and techniques) Dr Judy Sheard Senior Lecturer Co-Director, Computing Education Research Group Monash University judy.sheard@monash.edu
Quantitative Methods in Computing Education Research (A brief overview tips and techniques) Dr Judy Sheard Senior Lecturer Co-Director, Computing Education Research Group Monash University judy.sheard@monash.edu
Assessing CI Trends - the facts behind the stats. Inga Kreiensiek & Adèle Groyer
 1 Assessing CI Trends - the facts behind the stats Inga Kreiensiek & Adèle Groyer 2 Presentation overview Background to the study Challenges Why it s not as simple as fitting a trend line through data
Introduction to Multilevel Models for Longitudinal and Repeated Measures Data
 Introduction to Multilevel Models for Longitudinal and Repeated Measures Data Today s Class: Features of longitudinal data Features of longitudinal models What can MLM do for you? What to expect in this
Summary & Conclusion. Lecture 10 Survey Research & Design in Psychology James Neill, 2016 Creative Commons Attribution 4.0
 Summary & Conclusion Lecture 10 Survey Research & Design in Psychology James Neill, 2016 Creative Commons Attribution 4.0 Overview 1. Survey research and design 1. Survey research 2. Survey design 2. Univariate
Applied Medical. Statistics Using SAS. Geoff Der. Brian S. Everitt. CRC Press. Taylor Si Francis Croup. Taylor & Francis Croup, an informa business
 Applied Medical Statistics Using SAS Geoff Der Brian S. Everitt CRC Press Taylor Si Francis Croup Boca Raton London New York CRC Press is an imprint of the Taylor & Francis Croup, an informa business A
Example of Interpreting and Applying a Multiple Regression Model
 Example of Interpreting and Applying a Multiple Regression We'll use the same data set as for the bivariate correlation example -- the criterion is 1 st year graduate grade point average and the predictors
isc ove ring i Statistics sing SPSS
 isc ove ring i Statistics sing SPSS S E C O N D! E D I T I O N (and sex, drugs and rock V roll) A N D Y F I E L D Publications London o Thousand Oaks New Delhi CONTENTS Preface How To Use This Book Acknowledgements
Business Research Methods. Introduction to Data Analysis
 Business Research Methods Introduction to Data Analysis Data Analysis Process STAGES OF DATA ANALYSIS EDITING CODING DATA ENTRY ERROR CHECKING AND VERIFICATION DATA ANALYSIS Introduction Preparation of
Data Analysis with SPSS
 Data Analysis with SPSS A First Course in Applied Statistics Fourth Edition Stephen Sweet Ithaca College Karen Grace-Martin The Analysis Factor Allyn & Bacon Boston Columbus Indianapolis New York San Francisco
THE UNIVERSITY OF SUSSEX. BSc Second Year Examination DISCOVERING STATISTICS SAMPLE PAPER INSTRUCTIONS
 C8552 THE UNIVERSITY OF SUSSEX BSc Second Year Examination DISCOVERING STATISTICS SAMPLE PAPER INSTRUCTIONS Do not, under any circumstances, remove the question paper, used or unused, from the examination
Preliminary Report on Simple Statistical Tests (t-tests and bivariate correlations)
") Preliminary Report on Simple Statistical Tests (t-tests and bivariate correlations) After receiving my comments on the preliminary reports of your datasets, the next step for the groups is to complete
Preliminary Report on Simple Statistical Tests (t-tests and bivariate correlations) After receiving my comments on the preliminary reports of your datasets, the next step for the groups is to complete
Regression CHAPTER SIXTEEN NOTE TO INSTRUCTORS OUTLINE OF RESOURCES
 CHAPTER SIXTEEN Regression NOTE TO INSTRUCTORS This chapter includes a number of complex concepts that may seem intimidating to students. Encourage students to focus on the big picture through some of
Bargaining about Time: Evidence from Dictator and Ultimatum Games. Roger Berger & Sandra Prade
 Bargaining about Time: Evidence from Dictator and Ultimatum Games Roger Berger & Sandra Prade Collaboration and funding: ETH Zurich, Dirk Helbing, Heiko Rauhut. Experimental work: LMU Munich (Chair Braun),
1. You want to find out what factors predict achievement in English. Develop a model that
 Questions and answers for Chapter 10 1. You want to find out what factors predict achievement in English. Develop a model that you think can explain this. As usual many alternative predictors are possible
Complex Regression Models with Coded, Centered & Quadratic Terms
 Complex Regression Models with Coded, Centered & Quadratic Terms We decided to continue our study of the relationships among amount and difficulty of exam practice with exam performance in the first graduate
Content. Basic Statistics and Data Analysis for Health Researchers from Foreign Countries. Research question. Example Newly diagnosed Type 2 Diabetes
 Content Quantifying association between continuous variables. Basic Statistics and Data Analysis for Health Researchers from Foreign Countries Volkert Siersma siersma@sund.ku.dk The Research Unit for General
Survey research (Lecture 1) Summary & Conclusion. Lecture 10 Survey Research & Design in Psychology James Neill, 2015 Creative Commons Attribution 4.
 Summary & Conclusion. Lecture 10 Survey Research & Design in Psychology James Neill, 2015 Creative Commons Attribution 4.") Summary & Conclusion Lecture 10 Survey Research & Design in Psychology James Neill, 2015 Creative Commons Attribution 4.0 Overview 1. Survey research 2. Survey design 3. Descriptives & graphing 4. Correlation
Summary & Conclusion Lecture 10 Survey Research & Design in Psychology James Neill, 2015 Creative Commons Attribution 4.0 Overview 1. Survey research 2. Survey design 3. Descriptives & graphing 4. Correlation
Survey research (Lecture 1)
") Summary & Conclusion Lecture 10 Survey Research & Design in Psychology James Neill, 2015 Creative Commons Attribution 4.0 Overview 1. Survey research 2. Survey design 3. Descriptives & graphing 4. Correlation
Summary & Conclusion Lecture 10 Survey Research & Design in Psychology James Neill, 2015 Creative Commons Attribution 4.0 Overview 1. Survey research 2. Survey design 3. Descriptives & graphing 4. Correlation
Describe what is meant by a placebo Contrast the double-blind procedure with the single-blind procedure Review the structure for organizing a memo
 Business Statistics The following was provided by Dr. Suzanne Delaney, and is a comprehensive review of Business Statistics. The workshop instructor will provide relevant examples during the Skills Assessment
STAT 135 Introduction to Statistics via Modeling: Midterm II Thursday November 16th, Name:
 STAT 135 Introduction to Statistics via Modeling: Midterm II Thursday November 16th, 2017 Name: 1 1 Short Answer a) For each of these five regression scenarios, name an appropriate visualization (along
Aufklärung Nr. 27: Pneumokokken (Konjugat) Englisch / English
 Englisch / English") On protective immunization against pneumococcal diseases in infants/small children with conjugate vaccine Pneumococcal infections are caused by Streptococcus pneumoniae bacteria. There are more than 90
On protective immunization against pneumococcal diseases in infants/small children with conjugate vaccine Pneumococcal infections are caused by Streptococcus pneumoniae bacteria. There are more than 90
Aufklärung Nr. 9: Hepatitis A Englisch / English
 On protective immunization against hepatitis A Hepatitis A is an acute liver inflammation, which is caused by infection with the hepatitis A virus (HAV). This pathogen is excreted in the stool of an infected
10. LINEAR REGRESSION AND CORRELATION
 1 10. LINEAR REGRESSION AND CORRELATION The contingency table describes an association between two nominal (categorical) variables (e.g., use of supplemental oxygen and mountaineer survival ). We have
SPSS Correlation/Regression
 SPSS Correlation/Regression Experimental Psychology Lab Session Week 6 10/02/13 (or 10/03/13) Due at the Start of Lab: Lab 3 Rationale for Today s Lab Session This tutorial is designed to ensure that you
TITLE: Acquisition and generalization responses in aphasia treatment: Evidence from sentence-production treatment
 TITLE: Acquisition and generalization responses in aphasia treatment: Evidence from sentence-production treatment INTRODUCTION Treatment of Underlying Forms (TUF) promotes not only acquisition of treated
Scatter Plots and Association
 ? LESSON 1.1 ESSENTIAL QUESTION Scatter Plots and Association How can you construct and interpret scatter plots? Measurement and data 8.11.A Construct a scatterplot and describe the observed data to address
Multiple Regression. James H. Steiger. Department of Psychology and Human Development Vanderbilt University
 Multiple Regression James H. Steiger Department of Psychology and Human Development Vanderbilt University James H. Steiger (Vanderbilt University) Multiple Regression 1 / 19 Multiple Regression 1 The Multiple
Overview of Lecture. Survey Methods & Design in Psychology. Correlational statistics vs tests of differences between groups
 Survey Methods & Design in Psychology Lecture 10 ANOVA (2007) Lecturer: James Neill Overview of Lecture Testing mean differences ANOVA models Interactions Follow-up tests Effect sizes Parametric Tests
Still important ideas
 Readings: OpenStax - Chapters 1 13 & Appendix D & E (online) Plous Chapters 17 & 18 - Chapter 17: Social Influences - Chapter 18: Group Judgments and Decisions Still important ideas Contrast the measurement
Psych 5741/5751: Data Analysis University of Boulder Gary McClelland & Charles Judd. Exam #2, Spring 1992
 Exam #2, Spring 1992 Question 1 A group of researchers from a neurobehavioral institute are interested in the relationships that have been found between the amount of cerebral blood flow (CB FLOW) to the
Lecture 6B: more Chapter 5, Section 3 Relationships between Two Quantitative Variables; Regression
 Lecture 6B: more Chapter 5, Section 3 Relationships between Two Quantitative Variables; Regression! Equation of Regression Line; Residuals! Effect of Explanatory/Response Roles! Unusual Observations! Sample
German Collegiate Programming Contest
 German Collegiate Programming Contest GCPC Jury gcpc@nwerc.eu 2. Juli 2011 GCPC Jury German Collegiate Programming Contest 2. Juli 2011 1 / 23 jury sample solutions Problem min. LOC max. LOC Faculty Dividing
WELCOME! Lecture 11 Thommy Perlinger
 Quantitative Methods II WELCOME! Lecture 11 Thommy Perlinger Regression based on violated assumptions If any of the assumptions are violated, potential inaccuracies may be present in the estimated regression
SIL Declaration of Conformity / SIL Konformitätserklärung
 SIL Declaration of Conformity / SIL Konformitätserklärung Product description: Produktbezeichnung Temperature transmitter / Temperaturmessumformer SITRANS TH200 / TH300 two-wire system, universal / Zweileitertechnik,
Detection of Differential Test Functioning (DTF) and Differential Item Functioning (DIF) in MCCQE Part II Using Logistic Models
 and Differential Item Functioning (DIF) in MCCQE Part II Using Logistic Models") Detection of Differential Test Functioning (DTF) and Differential Item Functioning (DIF) in MCCQE Part II Using Logistic Models Jin Gong University of Iowa June, 2012 1 Background The Medical Council of
Detection of Differential Test Functioning (DTF) and Differential Item Functioning (DIF) in MCCQE Part II Using Logistic Models Jin Gong University of Iowa June, 2012 1 Background The Medical Council of
Readings: Textbook readings: OpenStax - Chapters 1 13 (emphasis on Chapter 12) Online readings: Appendix D, E & F
 Online readings: Appendix D, E & F") Readings: Textbook readings: OpenStax - Chapters 1 13 (emphasis on Chapter 12) Online readings: Appendix D, E & F Plous Chapters 17 & 18 Chapter 17: Social Influences Chapter 18: Group Judgments and Decisions
Readings: Textbook readings: OpenStax - Chapters 1 13 (emphasis on Chapter 12) Online readings: Appendix D, E & F Plous Chapters 17 & 18 Chapter 17: Social Influences Chapter 18: Group Judgments and Decisions
5 To Invest or not to Invest? That is the Question.
 5 To Invest or not to Invest? That is the Question. Before starting this lab, you should be familiar with these terms: response y (or dependent) and explanatory x (or independent) variables; slope and
Dr. Kelly Bradley Final Exam Summer {2 points} Name
 {2 points} Name You MUST work alone no tutors; no help from classmates. Email me or see me with questions. You will receive a score of 0 if this rule is violated. This exam is being scored out of 00 points.
Is there an association between waist circumference and type 2 diabetes or impaired fasting glucose in US adolescents?
 Is there an association between waist circumference and type 2 diabetes or impaired fasting glucose in US adolescents? Meghann M. Moore, RD, CD Masters Thesis Maternal & Child Health Track School of Public
Introduction to regression
 Introduction to regression Regression describes how one variable (response) depends on another variable (explanatory variable). Response variable: variable of interest, measures the outcome of a study
Differential Item Functioning
 Differential Item Functioning Lecture #11 ICPSR Item Response Theory Workshop Lecture #11: 1of 62 Lecture Overview Detection of Differential Item Functioning (DIF) Distinguish Bias from DIF Test vs. Item
Chapter 11 Multiple Regression
 Chapter 11 Multiple Regression PSY 295 Oswald Outline The problem An example Compensatory and Noncompensatory Models More examples Multiple correlation Chapter 11 Multiple Regression 2 Cont. Outline--cont.
Effect of Sample Size on Correlation and Regression Coefficients
 Effect of Sample Size on Correlation and Regression Coefficients Swati Gupta 1 Research Scholar, Department of Education, Aligarh Muslim University, India Dr. Mamun Ali Naji Qasem 2 Faculty of Education,
Multiple Regression Analysis
 Multiple Regression Analysis Basic Concept: Extend the simple regression model to include additional explanatory variables: Y = β 0 + β1x1 + β2x2 +... + βp-1xp + ε p = (number of independent variables
Data Analysis Using Regression and Multilevel/Hierarchical Models
 Data Analysis Using Regression and Multilevel/Hierarchical Models ANDREW GELMAN Columbia University JENNIFER HILL Columbia University CAMBRIDGE UNIVERSITY PRESS Contents List of examples V a 9 e xv " Preface
The University of North Carolina at Chapel Hill School of Social Work
 The University of North Carolina at Chapel Hill School of Social Work SOWO 918: Applied Regression Analysis and Generalized Linear Models Spring Semester, 2014 Instructor Shenyang Guo, Ph.D., Room 524j,
SPSS output for 420 midterm study
 Ψ Psy Midterm Part In lab (5 points total) Your professor decides that he wants to find out how much impact amount of study time has on the first midterm. He randomly assigns students to study for hours,
Small Group Presentations
 Admin Assignment 1 due next Tuesday at 3pm in the Psychology course centre. Matrix Quiz during the first hour of next lecture. Assignment 2 due 13 May at 10am. I will upload and distribute these at the
MULTIPLE LINEAR REGRESSION 24.1 INTRODUCTION AND OBJECTIVES OBJECTIVES
 24 MULTIPLE LINEAR REGRESSION 24.1 INTRODUCTION AND OBJECTIVES In the previous chapter, simple linear regression was used when you have one independent variable and one dependent variable. This chapter
Reading Time [min.] Group
![Reading Time [min.] Group](/thumbs/93/111332220.jpg "Reading Time [min.] Group") The exam set contains 8 questions. The questions may contain sub-questions. Make sure to indicate which question you are answering. The questions are weighted according to the percentage in brackets. Please
The exam set contains 8 questions. The questions may contain sub-questions. Make sure to indicate which question you are answering. The questions are weighted according to the percentage in brackets. Please
Do Proposers Expect Groups to Play More "Rational" Than Individuals? Evidence From an Ultimatum Game Experiment
 Do Proposers Expect Groups to Play More "Rational" Than Individuals? Evidence From an Ultimatum Game Experiment Claudia Rößle (roessl09@stud.uni-passau.de) February 2011 Abstract Players in ultimatum games