Missouri Statewide Integrated HIV Prevention and Care Plan, including the Statewide Coordinated Statement of Need, CY
|
|
|
- Maximillian Austin
- 5 years ago
- Views:
Transcription
1 Missouri Statewide Integrated HIV Prevention and Care Plan, including the Statewide Coordinated Statement of Need, CY September 20, 2016 Developed through the collaborative efforts of the following Missouri HIV Prevention and Care Partners: -Missouri Department of Health and Senior Services -Kansas City Health Department -Kansas City TGA Planning Council -St. Louis City Health Department -St. Louis TGA Planning Council -Missouri Ryan White Grantees -CDC-funded HIV Prevention Service Providers -Missouri Statewide Community Prevention Planning Group -HIV Prevention and Care Consumers 1
2 Table of Contents Section I: Statewide Coordinated Statement of Need/Needs Assessment 3 Introduction 3 Epidemiologic Overview 4 HIV Care Continuum 38 Financial and Human Resources Inventory 44 Missouri Statewide Financial Resources Inventory 44 St. Louis TGA Financial Resources Inventory 50 Kansas City TGA Financial Resources Inventory 51 Missouri Prevention and Care Funding Distribution 52 HIV Workforce Capacity 53 Coordination of Funding 57 Assessment of Needs, Gaps and Barriers 60 Data: Access, Sources, and Systems 64 Section II: Integrated HIV Prevention and Care Plan 68 Integrated HIV Prevention and Care Plan: Goals, Objectives, Strategies, Activities and Resources 68 Collaborations, Partnerships, and Stakeholder Involvement 79 People Living with HIV and Community Engagement 80 Section III: Monitoring and Improvement 82 Appendix A: Letters of Concurrence 84 St. Louis TGA Planning Council Kansas City TGA Planning Council Missouri Statewide Ryan White Grantees Missouri Statewide Community Prevention Planning Group 2
3 Missouri Statewide Integrated HIV Prevention and Care Plan, Section I: Statewide Coordinated Statement of Need/Needs Assessment Introduction The Missouri Statewide Integrated HIV Prevention and Care Plan, including the Statewide Coordinated Statement of Need (Integrated Plan), provides a comprehensive and collaborative mechanism to identify and address existing resources and challenges that impact Missouri s ability to effectively meet the needs of people living with HIV (PLWH) and those at risk for HIV infection. Missouri s Integrated Plan provides a roadmap to maximize coordination, integration, and effective linkages at all points along the HIV Care Continuum. Missouri s Integrated Plan reflects input from a range of participants from across the state of Missouri, including, but not limited to: All Ryan White Grantees Ryan White Part A Planning Councils All directly funded and subcontracted HIV Prevention entities (inclusive of Education, Testing, and Disease Investigation staff) Statewide and Regional Community Prevention Planning Groups HIV Prevention and Care Consumers HIV Surveillance Staff Viral Hepatitis Prevention Staff STD Prevention Staff Non-traditional Stakeholders The Epidemiologic Overview section provides an overview of the burden of HIV in Missouri, including the socio-demographic characteristics of PLWH and those at risk for HIV infection. The HIV Care Continuum section provides a graphic description of outcomes along the Continuum, including potential areas for additional focus, as well as any significant disparities among individual populations. The Financial and Human Resources Inventory section discusses the health care workforce available to meet the needs of PLWH and those at risk of HIV infection in Missouri, as well as any needed resources that are not currently available in the state. 3
4 The Assessing Needs, Gaps, and Barriers section describes the needs assessment process undertaken in Missouri to inform the development and focus of the Integrated Plan. This section outlines service needs, gaps, and barriers to the effective delivery of HIV prevention and care services in Missouri, and is used to prioritize objectives, strategies, and activities to be undertaken in Missouri s efforts to meet the goals of the National HIV/AIDS Strategy (NHAS). The Data: Access, Sources, and Systems section describes existing data systems to be used in the development of the Integrated Plan, as well as in the implementation and monitoring of activities included in the Integrated Plan. This section also outlines additional data systems that could enhance Missouri s ability to effectively respond to the needs of PLWH and those at risk of HIV infection. A. Epidemiologic Overview Missouri Statewide Epidemiologic Profile The Division of HIV/AIDS Prevention at the Centers for Disease Control and Prevention (CDC) and the Health Resources and Services Administration (HRSA) released the revised Integrated Guidance for Developing Epidemiologic Profiles in August These guidelines are meant to assist states in creating standardized profiles that meet the planning needs of HIV prevention and care programs, while allowing freedom to portray unique situations within the state. The epidemiologic overview section serves to address the questions posed in the CDC/HRSA guidance. This section is derived from the 2014 Epidemiologic Profiles of HIV, STD, and Hepatitis in Missouri, which can be found at The 2014 epidemiologic profile is the most recent information available and provides a comprehensive overview of the burden of HIV in Missouri regarding socio-demographic, geographic, behavioral, and clinical characteristics of persons newly diagnosed and living with HIV. 4
5 Missouri State Summary Table 1. Population Counts, by HIV Care Region, Missouri, 2013 St. Louis HIV Care Region Kansas City HIV Care Region Northwest HIV Care Region Central HIV Care Region Southwest HIV Care Region Southeast HIV Care Region Missouri Total Sex Male 1,015, , , , , ,502 2,963,957 Female 1,088, , , , , ,524 3,080,214 Total 2,103,426 1,180, , ,004 1,155, ,026 6,044,171 Race/Ethnicity White 1,537, , , ,366 1,034, ,906 4,860,145 Black/African American 408, ,015 8,169 43,260 23,335 31, ,121 Hispanic 57,627 84,464 7,433 25,705 47,763 9, ,947 Asian/Pacific Islander 59,400 22,791 1,943 12,769 15,289 2, ,941 American Indian/Alaskan Native 4,271 4, ,218 9,995 1,904 25,168 Two or More Races 35,632 26,954 3,307 15,686 24,405 6, ,849 Total 2,103,426 1,180, , ,004 1,155, ,026 6,044,171 Race/Ethnicity-Males White Male 751, , , , , ,644 2,388,030 Black/African American Male 186,024 85,750 5,379 23,586 13,945 16, ,613 Hispanic Male 29,774 43,359 4,113 13,501 25,316 5, ,382 Asian/Pacific Islander Male 28,517 10, ,938 7,119 1,243 54,500 American Indian/Alaskan Native Male 2,123 2, ,698 5, ,699 Two or More Races Male 17,549 13,038 1,663 7,768 12,278 3,437 55,733 Total 1,015, , , , , ,502 2,963,957 Race/Ethnicity-Females White Female 786, , , , , ,262 2,472,115 Black/African American Female 222,671 97,265 2,790 19,674 9,390 14, ,508 Hispanic Female 27,853 41,105 3,320 12,204 22,447 4, ,565 Asian/Pacific Islander Female 30,883 12, ,831 8,170 1,506 60,441 American Indian/Alaskan Native Female 2,148 2, ,520 4, ,469 Two or More Races Female 18,083 13,916 1,644 7,918 12,127 3,428 57,116 Total 1,088, , , , , ,524 3,080,214 Age <2 51,399 31,378 5,384 20,668 28,779 12, , , ,005 30, , ,095 70, , ,383 93,570 17,162 67,060 91,687 38, , ,050 87,695 21,843 95, ,135 40, , , ,032 53, , , ,902 1,528, , ,709 59, , , ,694 1,615, , ,584 37, , ,371 83, ,777 Total 2,103,426 1,180, , ,004 1,155, ,026 6,044,171 Source: MDHSS, Bureau of Health Care Analysis and Data Dissemination 5

6 Figure 1. Population estimates and metropolitan statistical area classification, by county, Missouri, 2013 Figure 1 illustrates the classification of Missouri counties as metropolitan, micropolitan, or nonmetropolitan areas based on the population size of a core urban area, based on 2013 population estimates. For greater detail regarding Missouri s metropolitan statistical area classification, please refer to the 2014 Epidemiologic Profiles of HIV, STD, and Hepatitis in Missouri located at Key Highlights: What is the scope of the HIV disease epidemic in Missouri? Magnitude of the Problem and General Trends From 1982 to 2014, there have been a total of 19,878 persons diagnosed with HIV disease in Missouri and reported to the Missouri Department of Health and Senior Services (MDHSS). Of these individuals, 13,450 (68%) were subcategorized as stage 3 (AIDS) cases, and the remaining 6,428 (32%) were subcategorized as HIV cases. Of the cumulative number of persons diagnosed with HIV disease, 11,984 (60%) were presumed to be living at the end of
7 The number of new diagnoses has fluctuated slightly between 2005 and 2014, with no sustained upward or downward trend in new HIV diagnoses over this time period. However, the number of new cases in 2013 and 2014 was the lowest since 1986 (342 cases). In 2014, there were 485 persons newly diagnosed with HIV disease. However, this value has not been adjusted for reporting delays, and therefore is likely to change. The number of persons living with HIV disease continued to increase every year, from 8,787 persons in 2005 to 11,984 persons in The increase is primarily due to the fact that individuals are living longer with HIV as a result of improved treatment and medical care. Where HIV disease disproportionately impacts the state s two major metropolitan areas (St. Louis and Kansas City). The highest rates of new diagnoses and persons living with HIV disease were found in these two areas. The rate of persons newly diagnosed who remained classified as HIV cases at the end of 2014 was highest in St. Louis City (23.9 per 100,000). The second highest rate was in Kansas City (13.9 per 100,000). The rate of persons newly diagnosed who were classified as stage 3 (AIDS) cases at the end of 2014 was highest in Kansas City (7.3 per 100,000). Who Sex Males represented the majority of persons newly diagnosed (83%) and living with (83%) HIV disease. The rates of new diagnoses and persons living with HIV disease were around five times as high among males compared to females. Race/Ethnicity HIV disease continues to disproportionately impact minorities. The rate of newly diagnosed HIV disease cases among blacks/african Americans was 8.5 times as high as whites, and 2.0 times as high among Hispanics compared to whites. The disparity was even greater among black/african American females. While black/african American females represented only 12% of Missouri s female population, black/african American females accounted for 63% of new female HIV disease diagnoses. It should be emphasized that race/ethnicity in itself is not a risk factor for HIV infection; however, among many racial/ethnic minority populations, social, economic, and cultural factors are associated with high rates of HIV risk behavior. These factors also may be barriers to receiving HIV prevention information or accessing HIV testing, diagnosis, and treatment. Age The age of individuals living with HIV disease has increased over time. In 2005, the largest numbers of persons living with HIV disease were years of age, whereas in 2014 persons years old represented the largest number of living cases. Although the age of persons living with the disease has increased over time, the age of new diagnoses has decreased. In 2014, the largest numbers of persons newly diagnosed with HIV disease were between years of age, compared to
8 when the largest numbers of new diagnoses were years of age. The difference may be attributed to increased testing among younger individuals or due to a true increase in the number of new infections at a younger age. Exposure Category The majority of new diagnoses continue to be attributed to men who have sex with men (MSM). Among females, heterosexual contact was the primary mode of transmission. In 2014, there were six people less than 13 years of age diagnosed with HIV disease. All six of these cases were among children born outside of the United States (U.S.). Figure 2. HIV disease cases (living and deceased), by current HIV vs. stage 3 (AIDS) status, Missouri ,894 (39.7%) Deceased HIV Disease Cases Deceased HIV Cases 724 Deceased Stage 3 (AIDS) Cases 7,170 Living HIV Cases 5,704 11,984 (60.3%) Living HIV Disease Cases 19,878 Cumulative HIV Disease Cases 13,450 (67.7%) Stage 3 (AIDS) Cases 6,428 (32.3%) HIV Cases Living Stage 3 (AIDS) Cases 6,280 8
9 Figure 3. Living and new HIV disease cases and deaths by year, Missouri ,000 11,984 9,526 9,876 10,198 10,554 10,907 11,259 11,584 12,000 10,000 8,787 9,139 Number Living HIV Disease 8,000 New HIV Disease 6,000 Deaths 4,000 2, Year From 1982 to 2014, there have been a total of 19,878 HIV disease cases diagnosed in Missouri and reported to MDHSS (Figure 2). Of the cumulative cases reported, 60% were still presumed to be living with HIV disease at the end of Among those living with HIV disease, 5,704 were classified as HIV cases at the end of 2014 and 7,894 were classified as stage 3 (AIDS) cases. At the end of 2014, there were 11,984 persons living with HIV disease whose most recent diagnosis occurred in Missouri (Figure 3). The number of people living with HIV disease increased each year. There were 485 new HIV disease diagnoses in The number of new diagnoses from 2005 to 2014 has fluctuated, ranging from 472 cases in 2013 to 608 cases in The number of deaths among persons with HIV disease each year has remained generally steady. The lower number of deaths in 2014 was likely due to delays in death reporting. 9
10 Figure 4. HIV disease cases, by current status* and year of diagnosis**, Missouri, Stage 3 (AIDS) Cases*** HIV Cases**** Number of Cases Year of Diagnosis Figure 5. Reported HIV disease cases, by current status* and year of diagnosis**, Missouri, HIV Disease Cases 1000 Stage 3 (AIDS) Cases*** HIV Cases**** 800 Number of Cases Year of Diagnosis *HIV case vs. stage 3 (AIDS) case **Cases are indicated by year of initial diagnosis reported to MDHSS. (The year in which the first diagnosis of the person, whether as a HIV case or a stage 3 (AIDS) case, was documented by the Department). ***These cases were either: 1) initially reported as HIV cases and then later reclassified as stage 3 (AIDS) cases because they subsequently met the stage 3 (AIDS) case definition; or 2) initially reported as stage 3 (AIDS) cases. ****These cases were initially reported as HIV cases and have remained HIV cases. They have not met the case definition for stage 3 (AIDS) as of December 31, Between 2005 and 2014, the number of new HIV disease diagnoses has ranged from 472 cases in 2013, to 608 cases in 2007 (Figures 4 and 5). The number of new diagnoses has fluctuated slightly between 2005 and 2014, with no sustained upward or downward trend in new HIV diagnoses over this time period. However, the number of new cases in 2013 and 2014 was the lowest since 1986 (342 cases). Differences in the number of persons sub- 10
11 classified as stage 3 (AIDS) cases each year are due to the progression of the disease over time. For those diagnosed with HIV disease in 2005, a larger number are currently classified as stage 3 (AIDS) cases compared to those diagnosed in 2014 because they have been living with the virus longer. Figure 6. HIV disease deaths*, by selected race**, by year of death, Missouri, Number of Deaths Total Deaths** White Black/African American Year of Death *Includes deaths that have occurred among those diagnosed with HIV disease in Missouri. **Total deaths include persons of all races. Only includes deaths through December 31, 2014, and reported by February 28, Figure 7. Persons diagnosed with HIV disease by current vital status* and year of diagnosis**, Missouri Number of Cases Year of Diagnosis Deceased Living *Vital status on December 31, **Cases are indicated by year of initial diagnosis reported to MDHSS. 11
12 The number of deaths among persons with HIV disease was generally steady between 2005 and 2010 (Figure 6). The lower number of deaths in 2011 through 2014 is likely due to delays in death reporting. Of the 600 persons diagnosed with HIV disease in 2005, 91 (15%) were deceased by the end of 2014 (Figure 7). Among the 485 cases first diagnosed in 2014, 8 (2%) were deceased at the end of The difference in the proportion of cases that are deceased is due to the length of time individuals have been living with the disease. Table 2. Living HIV, stage 3 (AIDS), and HIV disease cases by sex, by race/ethnicity, by race/ethnicity and sex, and by current age, Missouri, 2014 Sex HIV* Stage 3 (AIDS)** HIV Disease*** Cases % Rate**** Cases % Rate**** Cases % Rate**** Male 4, % , % , % Female 1, % , % , % 67.1 Total 5, % , % , % Race/Ethnicity White 2, % , % , % Black/African American 2, % , % , % Hispanic % % % Asian/Pacific Islander % % % 66.1 American Indian/Alaskan Native 6 0.1% % % 47.7 Two or More Races/Unknown % % % -- Total 5, % , % , % Race/Ethnicity-Males White Male 2, % , % , % Black/African American Male 1, % , % , % Hispanic Male % % % Asian/Pacific Islander Male % % % American Indian/Alaskan Native Male 6 0.1% % % 94.5 Two or More Races/Unknown Male % % % -- Total 4, % , % , % Race/Ethnicity-Females White Female % % % 26.7 Black/African American Female % % , % Hispanic Female % % % 71.7 Asian/Pacific Islander Female 7 0.7% % % 26.5 American Indian/Alaskan Native Female 0 0.0% % % 0.0 Two or More Races/Unknown Female % % % -- Total 1, % , % , % 67.1 Current Age < % % % % % % % % % % % % , % , % , % , % , % , % % % % 63.3 Total 5, % , % , %
13 Table 3. Diagnosed HIV, stage 3 (AIDS), and HIV disease cases, by sex, by race/ethnicity, by race/ethnicity and sex, and current age, Missouri, 2014 HIV* Stage 3 (AIDS)** HIV Disease*** Cases % Rate**** Cases % Rate**** Cases % Rate**** Sex Male % % % 13.6 Female % % % 2.6 Total % % % 8.0 Race/Ethnicity White % % % 4.2 Black/African American % % % 35.5 Hispanic % % % 8.6 Asian/Pacific Islander 4 1.1% % % 6.1 American Indian/Alaskan Native 2 0.6% % % 7.9 Two or More Races/Unknown 3 0.8% % % 5.3 Total % % % 8.0 Race/Ethnicity-Males White Male % % % 7.4 Black/African American Male % % % 59.4 Hispanic Male % % % 13.2 Asian/Pacific Islander Male 4 1.3% % % 11.0 American Indian/Alaskan Native Male 2 0.7% % % 15.7 Two or More Races/Unknown Male 3 1.0% % % 10.8 Total % % % 13.6 Race/Ethnicity-Females White Female % % % 1.0 Black/African American Female % % % 13.9 Hispanic Female 3 5.0% % % 3.6 Asian/Pacific Islander Female 0 0.0% % % 1.7 American Indian/Alaskan Native Female 0 0.0% % % -- Two or More Races/Unknown Female 0 0.0% % % -- Total % % % 2.6 Current Age < % % % % % % % % % % % % % % % % % % % % % 0.8 Total % % % 8.0 Includes persons diagnosed with HIV disease in Missouri who are currently living, regardless of current residence. Includes persons diagnosed in Missouri correctional facilities. *Cases which remained HIV cases at the end of **Cases classified as stage 3 (AIDS) by December 31, ***The sum of HIV cases and stage 3 (AIDS) cases. ****Per 100,000 population based on 2013 MDHSS estimates. Based on age as of December 31, Note: Percentages may not total due to rounding. 13
14 Of the 11,984 PLWH at the end of 2014, 83% were males (Table 2). The rate of those living with HIV disease was 5.0 times as high among males compared to females. Although whites represented the largest proportion of living HIV disease cases (49%), the rate of those living with HIV disease was 6.5 times as high among blacks/african Americans compared to whites. The rate was 1.8 times as high among Hispanics compared to whites. Among males, the rate of living cases among blacks/african Americans was 5.8 times as high as the rate among whites, and 1.6 times as high among Hispanics compared to whites. Among females, the rate of those living with HIV disease among blacks/african Americans was 13.2 times as high as the rate among whites, and 2.7 times as high among Hispanics compared to whites. Of the 485 persons newly diagnosed with HIV disease in 2014, 25% were classified as stage 3 (AIDS) cases by the end of 2014 (Table 3). The rate of new HIV disease diagnoses was 5.2 times as high among males compared to females. The rate of new HIV disease cases was 8.5 times as high among blacks/african Americans compared to whites, and 2.0 times as high among Hispanics compared to whites. The rate of new HIV disease diagnoses was greatest among persons years of age at the end of 2014 (23.0 per 100,000). Figure 8. Distribution of new HIV disease cases by age at diagnosis and living HIV disease cases by current age in selected year, Missouri, 2005 and 2014 Percent New Cases, by Age at HIV Diagnosis 2005 (n=600) <13 <13 Percent Living Cases, by Current Age 2005 (n=8,787) 30% 25% 20% 15% 10% 5% 0% 0% 5% 10% 15% 20% 25% 30% 2014 (n=485) <13 < (n=11,984) 30% 25% 20% 15% 10% 5% 0% 0% 5% 10% 15% 20% 25% 30% 14
15 Changes have occurred in the distribution of the age at diagnosis among new HIV disease cases over time (Figure 8). In 2005, the greatest proportion of new diagnoses occurred among those ages (17%) and (16%). In 2014, the greatest proportion of new diagnoses occurred among those ages (26%). Although the age of new diagnoses has decreased, the age of individuals living with HIV has increased over time. In 2005, the greatest proportion of living cases was among those ages (24%). In 2014, the greatest proportion of living cases was between years old (19%). Figure 9. Persons diagnosed with HIV disease by HIV care region at time of diagnosis, Missouri, Number of Cases Year of Diagnosis St. Louis Region Kansas City Region Northwest Region Central Region Southwest Region Southeast Region Corr. Facilities The largest numbers of persons living with HIV disease in 2014 were most recently diagnosed in St. Louis City (3,280), Jackson County (3,063) and St. Louis County (2,067) (Figure 9). The St. Louis HIV Care Region has represented the largest number of new HIV disease diagnoses in each year from (Figure 10). In the St. Louis HIV Care Region new diagnoses decreased from 250 cases in 2013 to 228 cases in The 2014 new case count in the St. Louis HIV Care Region represented the lowest number of new cases in a year since The number of new diagnoses in the Kansas City Region, St. Louis Region, and the Southwest Region has been generally stable from 2005 to 2012 with a slight decrease in 2013 and In the remainder of the HIV care regions, the number of new diagnoses has been generally stable from 2005 to 2014, with slight fluctuations seen in select years. 15
16 Table 4. New and living HIV and stage 3 (AIDS) cases and rates, by geographic area, and by HIV care region, 2014 HIV Cases Stage 3 (AIDS) Cases Diagnosed 2014* Living with HIV Diagnosed 2014** Living with Stage 3 (AIDS) Location Cases % Rate*** Cases % Rate*** Cases % Rate*** Cases % Rate*** Geograhic Area St. Louis City % , % % 4.4 1, % St. Louis County % 8.8 1, % % 3.2 1, % Kansas City % , % % 7.3 1, % Outstate % 2.6 1, % % 1.0 1, % 36.5 Missouri Correctional Facilities % N/A % N/A 0 0.0% N/A % N/A Total % 6.0 5, % % 2.0 6, % HIV Region St. Louis HIV Care Region % 8.4 2, % % 2.5 2, % Kansas City HIV Care Region % 7.3 1, % % 3.9 2, % Northwest HIV Care Region 5 1.4% % % % 27.4 Central Care HIV Region % % % % 32.2 Southwest HIV Care Region % % % % 39.1 Southeast HIV Care Region % % % % 35.2 Missouri Correctional Facilities % N/A % N/A 0 0.0% N/A % N/A MISSOURI % 6.0 5, % % 2.0 6, % *HIV cases diagnosed and reported to the Department during 2014 which remained HIV cases at the end of the year. **Does not include HIV cases diagnosed prior to 2014 that progressed to stage 3 (AIDS) in ***Per 100,000 population based on 2013 MDHSS estimates. Does not include persons diagnosed in Missouri correctional facilities. Includes persons diagnosed in Missouri correctional facilities. Note: Percentages may not total due to rounding. There were differences in the proportion of persons newly diagnosed with HIV disease that were either concurrently diagnosed with stage 3 (AIDS) or progressed to stage 3 (AIDS) at the end of 2014 by geographic area and HIV care region (Table 4). In Kansas City, 34% of newly diagnosed HIV disease cases progressed to stage 3 (AIDS) at the end of In comparison, the proportion was 27%, 27%, 16%, and 0% for Outstate, St. Louis County, St. Louis City, and Missouri correctional facilities, respectively. In the Southeast HIV Care Region and Kansas City HIV Care Region, 35% of newly diagnosed HIV disease cases progressed to stage 3 (AIDS) at the end of 2014, whereas the proportion was 32%, 23%, 11%, 0%, and 0% for the HIV care regions of Southwest, St. Louis, Central, Northwest, and Missouri correctional facilities, respectively. The variation in the proportion of newly diagnosed individuals that progressed to stage 3 (AIDS) by the end of 2014 among the geographic areas may be related to differences in when individuals were tested in the course of their disease progression, or differences in active surveillance techniques. The rate of new stage 3 (AIDS) cases was greatest in Kansas City (Table 4). The rate of new and living HIV and living stage 3 (AIDS) cases were greatest in St. Louis City. The rate of new HIV case diagnoses in St. Louis City was 9.2 times as high as Outstate, and 5.3 times as high in Kansas City compared to Outstate. The rate of new stage 3 (AIDS) case diagnoses was 4.4 times as high in St. Louis City compared to Outstate and 7.3 times as high in Kansas City compared to Outstate. This demonstrates the disproportionate impact of HIV disease on the major metropolitan areas in Missouri. 16
17 Table 5. Diagnosed HIV cases and rates, by selected race/ethnicity, by geographic area, Missouri, 2014 White Black/African American Hispanic Total Area Cases % Rate* Cases % Rate* Cases % Rate* Cases** % Rate* St. Louis City % % % % 23.9 St. Louis County % % % % 8.8 Kansas City % % % % 13.9 Outstate Missouri % % % % 2.6 Missouri Correctional Facilities % N/A % N/A 0 0.0% N/A % N/A MISSOURI TOTAL % % % % 6.0 Table 6. Diagnosed HIV cases and rates, by selected race/ethnicity, by HIV care region, Missouri, 2014 White Black/African American Hispanic Total Area Cases % Rate* Cases % Rate* Cases % Rate* Cases** % Rate* St. Louis HIV Care Region % % % % 8.4 Kansas City HIV Care Region % % % % 7.3 Northwest HIV Care Region % % % % 2.2 Central HIV Care Region % % % % 3.6 Southwest HIV Care Region % % % % 2.4 Southeast HIV Care Region % % % % 2.6 Missouri Correctional Facilities % N/A % N/A 0 0.0% N/A % N/A MISSOURI TOTAL % % % % 6.0 *Per 100,000 population based on 2013 MDHSS estimates. **Includes cases in persons whose race/ethnicity is either unknown or not listed. Does not include persons diagnosed in Missouri correctional facilities. Includes persons diagnosed in Missouri correctional facilities. Note: Row percentages are shown. Percentages may not total due to rounding. The proportion of new HIV cases diagnosed in 2014 by race/ethnicity varied by geographic area (Table 5). Whites comprised 64% of new HIV case diagnoses in 2014 in Outstate, but only 18% of new HIV cases in St. Louis County. Differences in the general population distribution of each of these geographic areas likely explain some of the variation observed. The difference in the rate of new HIV case diagnoses by race/ethnicity also varied by geographic area. In Outstate, the rate of new HIV cases among blacks/african Americans was 9.0 times as high as the rate among whites, and 1.4 times as high among Hispanics compared to whites. In comparison, the rate of new HIV cases was 1.6 times as high in blacks/african Americans compared to whites, and the rate was lower for Hispanics compared to whites in St. Louis City. Similar patterns observed for the geographic areas were also present by HIV care region (Table 6). In the Southwest HIV Care Region, whites represented 79% of new HIV case diagnoses, whereas blacks/african Americans represented the majority of cases in the St. Louis HIV Care Region (68%) and Missouri correctional facilities (57%). 17
18 Table 7. Newly diagnosed and living HIV and stage 3 (AIDS) cases in men who have sex with men, by selected race/ethnicity, Missouri, 2014 HIV Cases* Stage 3 (AIDS) Cases Newly Diagnosed Living Newly Diagnosed** Living Race/Ethnicity Cases % Cases % Cases % Cases % White % 1, % % 2, % Black/African American % 1, % % 1, % Hispanic % % 0 0.0% % Other/Unknown 6 2.6% % 5 7.0% % MISSOURI TOTAL*** % 3, % % 3, % *Remained HIV cases at the end of the year. **Does not include HIV cases diagnosed prior to 2014 that progressed to stage 3 (AIDS) in ***Totals include persons diagnosed in Missouri correctional facilities. Note: Percentages may not total due to rounding. Table 8. Living HIV disease cases in men who have sex with men, by selected race/ethnicity, by current age group, Missouri, 2014 White Black/African American Hispanic Total* Age Group Cases %** Cases %** Cases %** Cases %** % 3 0.1% 0 0.0% 4 0.1% % % 8 2.7% % , % 1, % % 2, % , % 1, % % 3, % % % % % MISSOURI TOTAL 4, % 2, % % 7, % *Row totals and percentages include cases in persons whose race/ethnicity is either unknown or not listed. Totals include persons diagnosed in Missouri correctional facilities. **Percentage of cases per age group. Note: Percentages may not total due to rounding. There were a total of 301 new HIV disease diagnoses attributed to MSM in 2014 (Table 7). Although blacks/african Americans represented 1.3 times as many new HIV cases compared to whites, whites represented 1.1 times as many new stage 3 (AIDS) cases compared to blacks/african Americans in Whites represented a larger proportion of MSM living with both HIV and stage 3 (AIDS) compared to blacks/african Americans and Hispanics. Of the newly diagnosed cases among MSM, 24% progressed to stage 3 (AIDS) by the end of The distribution of living HIV disease cases by current age varied by race/ethnicity among MSM, with those who identify as non-white tending to be younger (Table 8). Among white MSM living with HIV disease, the majority (62%) were between years of age at the end of However, only 41% of living black/african American MSM and 45% of living Hispanic MSM with HIV disease were in this age group. The greatest numbers of black/african American and Hispanic MSM living with HIV disease were between 25-44, and black/african Americans represented the largest number of MSM under the age of 25 (318). For more detailed information regarding distribution of new and living HIV disease cases by additional exposure categories (men who have sex with men and inject drugs, injecting drug users, and heterosexual contact, please refer to the 2014 Epidemiologic Profiles of HIV, 18
19 STD, and Hepatitis in Missouri located at Table 9. Deaths* among HIV cases, by mode of transmission, by selected race and sex, Missouri, White Males Black/African American Males White Females Black/African American Females Total** Mode of Transmission Cases % Cases % Cases % Cases % Cases % MSM % % 0 0.0% 0 0.0% % MSM/IDU % % 0 0.0% 0 0.0% % IDU % % % % % Heterosexual Contact 8 2.4% % % % % No Indicated Risk (NIR) % % % % % MISSOURI TOTAL*** % % % % % *May or may not be due to HIV-related illnesses. **Totals include cases in persons whose race/ethnicity is either unknown or not listed. ***Total (numbers and percentages) include 10 cases (1.4%) with a mode of transmission not indicated on the table, such as hemophilia/coagulation disorder, blood transfusion or tissue recipient, etc. Totals include persons diagnosed in Missouri correctional facilities. Note: Percentages may not total due to rounding. Table 10. Deaths* among stage 3 (AIDS) cases, by mode of transmission, by selected race and sex, Missouri, White Males Black/African American Males White Females Black/African American Females Total** Mode of Transmission Cases % Cases % Cases % Cases % Cases % MSM 3, % 1, % 0 0.0% 0 0.0% 4, % MSM/IDU % % 0 0.0% 0 0.0% % IDU % % % % % Heterosexual Contact % % % % % No Indicated Risk (NIR) % % % % % MISSOURI TOTAL*** 4, % 1, % % % 7, % *May or may not be due to stage 3 (AIDS)-related illnesses. **Totals include cases in persons whose race/ethnicity is either unknown or not listed. ***Total (numbers and percentages) include 234 cases (3.3%) with a mode of transmission not indicated on the table, such as hemophilia/coagulation disorder, blood transfusion or tissue recipient, etc. Totals include persons diagnosed in Missouri correctional facilities. Note: Percentages may not total due to rounding. The number of deaths that have occurred among persons still classified as HIV cases at the time of death was small (724) in comparison to the number of deaths among persons classified as stage 3 (AIDS) (7,170) (Tables 9 and 10). The greatest proportion of deaths among HIV cases has occurred among white males (47%) (Table 9). There were differences in the distribution of deaths among HIV cases by mode of transmission among the race/ethnicity and sex categories. Among males, the majority of deaths occurred among cases attributed to MSM. Among female HIV cases, the largest number of deaths occurred among cases attributed to heterosexual contact. Similar patterns were observed for deaths among male stage 3 (AIDS) cases (Table 10). Among both white and black/african American female stage 3 (AIDS) cases, cases attributed to heterosexual contact represented the majority of deaths. The proportion of deaths among 19
20 those with no indicated risk among stage 3 (AIDS) cases was smaller than that among HIV cases, likely because there was more time to obtain exposure category information. Table 11. Newly diagnosed and living HIV and stage 3 (AIDS) cases with exposure category assignments for Missouri, 2014 Exposure category HIV cases 2014* Living Stage 3 (AIDS) cases 2014** Living Adult/Adolescent Men who have sex with men % 4, % % 4, % Men who have sex with men and inject drugs % % 5 4.1% % Injecting drug use % % % % Heterosexual contact % 1, % % 1, % Hemophilia/coagulation disorder 0 0.0% 9 0.2% 0 0.0% % Blood transfusion or tissue recipient 0 0.0% 3 0.1% 0 0.0% 8 0.1% No indicated risk (NIR) ADULT/ADOLESCENT SUBTOTAL % 5, % % 6, % Pediatric (<13 years old) PEDIATRIC SUBTOTAL % % 0 0.0% % TOTAL 363 5, ,280 *HIV cases reported during 2014 which remained HIV cases at the end of the year. **Does not include HIV cases diagnosed prior to 2014 that progressed to stage 3 (AIDS) in Includes 2 cases with a confirmed other exposure category among persons living with HIV and one case among persons living with stage 3 (AIDS). Note: Percentages may not total due to rounding. The data in Table 11 have been adjusted to proportionately re-distribute individuals with no indicated risk factor based on sex and race/ethnicity to known exposure categories. These data do not reflect the true counts of persons reported in each exposure category. Among both new and living HIV and stage 3 (AIDS) cases, MSM represented the greatest proportion of cases. The proportion of MSM cases was greater for new HIV and stage 3 (AIDS) cases compared to the proportion among their respective living cases. This proportion may indicate changes in how individuals are being infected over time. However, the observed pattern may also be related to the method used to re-distribute those with unknown risks. The method used to re-distribute new cases may weight those with no indicated risk more heavily than the MSM category. There were six new HIV cases diagnosed among children less than 13 years of age in All six of these cases were among children born outside of the U.S. The majority of HIV disease cases diagnosed in 2014 (89%) and those living with HIV disease (93%) were residents of a metropolitan area at the time of diagnosis (Table 12). The proportion of new HIV diagnoses in nonmetropolitan areas was slightly higher in 2014 compared to previous years. For a list of counties that were classified as a metropolitan area refer to the Appendix. There were differences in the proportion of living HIV disease cases by sex based on the population of the area of residence. The proportion of males living with HIV disease decreased as the population of the area of residence decreased. Whereas 83% of living HIV disease cases in metropolitan areas occurred among males, only 20
21 71% of living cases in nonmetropolitan areas were among males. There were differences in the distribution of living HIV disease cases by race/ethnicity based on the population of the area of residence. As the population of the area of residence became smaller, the proportion of living cases that occurred among whites increased. For example, only 48% of living HIV disease diagnoses were among whites in metropolitan areas compared to 78% in nonmetropolitan areas. There were also differences based on the population of area of residence in the distribution of living HIV disease cases by exposure category. As the population of the area of residence decreased, the proportion of cases attributed to MSM generally decreased. Among those living with HIV disease, the proportion of cases diagnosed between years of age increased as the population of the area of residence decreased. Table 12. Newly diagnosed and living HIV disease* cases, by population of area of residence at time of diagnosis, by sex, by race/ethnicity, by exposure category and age at diagnosis, Missouri, 2014 Newly Diagnosed Living Metropolitan Micropolitan Nonmetropolitan Metropolitan Micropolitan Nonmetropolitan Area** Area*** Area**** Area** Area*** Area**** Cases % Cases % Cases % Cases % Cases % Cases % Sex Male % % % 8, % % % Female % % % 1, % % % Total % % % 10, % % % Race/Ethnicity White % % % 4, % % % Black/African American % % 2 7.7% 4, % % % Hispanic % 1 4.0% 2 7.7% % % % Other/Unknown % 1 4.0% 1 3.8% % 6 1.4% 2 0.6% Total % % % 10, % % % Exposure Category Men who have sex with men % % % 6, % % % Men who have sex with men and inject drugs % 2 8.0% 0 0.0% % % % Injecting drug use % 1 4.0% 2 7.7% % % % Heterosexual contact % % % 1, % % % No Indicated Risk (NIR) % % % 1, % % % Other 0 0.0% 0 0.0% 0 0.0% % 3 0.7% 4 1.1% Pediatric 4 1.0% 2 8.0% 0 0.0% % % 8 2.2% Total % % % 10, % % % Age at Diagnosis < % 0 0.0% 0 0.0% % 4 0.9% 3 0.8% % 2 8.0% 0 0.0% % 6 1.4% 5 1.4% % 0 0.0% 0 0.0% % 8 1.8% % % % % 1, % % % % % % 6, % % % % 1 4.0% % 1, % % % % 1 4.0% 1 3.8% % 3 0.7% 2 0.6% Total % % % 10, % % % *Includes all individuals diagnosed with the HIV virus, regardless of current status (i.e., HIV or stage 3 (AIDS)) Does not include persons diagnosed in Missouri correctional facilities. **A metropolitan area contains a core urban area with a population of at least 50,000. It also includes adjacent counties that have a high degree of social and economic integration with the core urban area. Based on 2013 US Census estimates. See Appendix for map of included counties. ***A micropolitan area contains a core urban area with a population between 10,000-49,999. It also includes adjacent counties that have a high degree of social and economic integration with the core urban area. Based on 2013 US Census estimates. See Appendix for map of included counties. ****An area that does not meet the population requirements for the metropolitan or micropolitan area. Based on 2013 US Census estimates. See Appendix for map of included counties. Note: Percentages may not total due to rounding. 21
22 Table 13. Percent of adults and adolescents receiving at least one CD4 within 12 months of their HIV diagnosis and the median initial CD4 count, Missouri, % with CD4 within 12 months of HIV diagnosis Median of initial CD4 counts (cells/ µl) Number HIV Status HIV (not AIDS) % 476 Concurrent HIV and stage 3 (AIDS) diagnosis % 82 Stage 3 (AIDS) >1 month after HIV diagnosis % 158 Sex Male % 340 Female % 351 Race/Ethnicity White % 345 Black/African American % 340 Hispanic % 366 Other/Unknown % 239 Exposure Category MSM % 348 MSM/IDU % 341 IDU % 326 HRH % 388 Other NIR % 268 Age at HIV Diagnosis % % % % % 123 The percent of adults and adolescents receiving at least one CD4 within 12 months of their HIV diagnosis and the median initial CD4 count varied by sex, race/ethnicity, exposure category, and age at HIV diagnosis (Table 13). Of adults and adolescents newly diagnosed between 2012 and 2013, a greater proportion of females had a CD4 within 12 months of diagnosis (88%) compared to males (81%). The initial median CD4 count tended to be greater for females (351 cells/μl) compared to males (340 cells/μl). A greater proportion of Hispanics and whites tended to have a CD4 count within 12 months of diagnosis compared to blacks/african Americans, with Hispanics having the highest proportion (93%). Among those with a CD4 count within 12 months of diagnosis, the initial median CD4 count tended to be lower among blacks/african Americans (340 cells/μl). Among exposure categories, MSM and heterosexual contact cases had a lower proportion of adults and adolescents receiving an initial CD4 within 12 months of diagnosis compared to persons with other known exposure categories. The initial median CD4 tended to be lowest for persons with no indicated risk compared to all other exposure categories. The median initial CD4 count tended to decrease as the age at HIV diagnosis increased. These data may 22
23 be beneficial when determining groups that should be targeted for new testing initiatives to identify individuals earlier in their disease progression. Key Highlights: What are the indicators of HIV disease infection risk in Missouri? Primary and Secondary (P&S) Syphilis The number of reported P&S syphilis cases increased from 251 cases in 2013 to 352 cases in The increase observed was due to increases in the St. Louis, Kansas City, Central, and Southwest HIV Care Regions. The rate of reported cases was highest in St. Louis City (26 per 100,000). Blacks/African Americans were disproportionately impacted, with a case rate 8.7 times as high as the rate among whites. Early Latent Syphilis The number of early latent syphilis cases increased from 2013 (220 cases) to 2014 (240 cases). The increase was seen in the St. Louis, Kansas City, and Central HIV Care Regions. The number of reported cases in 2014 was highest in Jackson County (78). Males represented the majority (87%) of reported early latent syphilis cases. The case rate was 7.9 times as high among blacks/african Americans compared to whites. Gonorrhea The number of reported gonorrhea cases decreased from 2013 (7,546 cases) to 2014 (7,387 cases). The number of reported gonorrhea cases was lower in 2014 compared to 2013 in all HIV care regions except the Southwest and Central HIV Care Regions. St. Louis City had the highest rate of reported gonorrhea cases at 486 per 100,000 persons. A larger proportion of reported gonorrhea cases was diagnosed between 15 and 19 years of age among black/african American females (35%) compared to white females (18%), black/african American males (17%), and white males (10%). Chlamydia The number of reported chlamydia cases increased from 27,328 in 2013 to 27,981 in An increase in the number of reported chlamydia cases was observed in all HIV Care Regions. St. Louis City had the highest chlamydia rate in 2014 (1,255 per 100,000). Jackson County reported the second highest case rate of chlamydia (746 per 100,000). A larger proportion of reported chlamydia cases was diagnosed between 15 and 19 years old among black/african American females (37%) compared to white females (33%), black/african American males (24%) and white males (18%). Hepatitis B The number of reported hepatitis B cases in Missouri increased by 9 cases from 2013 (597) to 2014 (606). 23
24 St. Louis County had the greatest number of reported hepatitis B cases with 126 cases. Among females, the largest numbers of cases were years of age, while among males the largest numbers of cases were among persons years of age. Hepatitis C The number of reported hepatitis C cases in Missouri increased by 1,403 cases from 2013 (4,881) to 2014 (6,284). This large increase in hepatitis C cases was likely the result of the expansion of screening recommendations in 2012, increased knowledge and awareness among individuals at risk, and increased testing. St. Louis City had the greatest number of reported hepatitis C cases with 902 cases. Among both males and females, the largest numbers of cases were years of age. HIV, STD, Hepatitis, and Tuberculosis (TB) disease Co-infections There were 555 persons living with HIV who were reported with an STD in Of the 592 early syphilis cases reported in 2014, 35% were among individuals living with HIV. Only 3% of gonorrhea cases and less than 1% of chlamydia cases reported in 2014 were among PLWH. St. Louis residents represented 73% of all living HIV cases reported with multiple STD co-morbidities in 2014, 73% of those with a chlamydia co-morbidity, 50% of those with an early syphilis co-morbidity, and 67% of those with a gonorrhea comorbidity. Although blacks/african Americans represented only 46% of living HIV disease cases, they represented 63% of individuals diagnosed with an STD co-morbidity. Of the 11,984 individuals living with HIV disease, 83 were reported with a hepatitis co-morbidity in Three percent of chronic hepatitis B cases and 1% of chronic hepatitis C cases reported in 2014 were among persons living with HIV disease. Of the 11,984 individuals living with HIV disease, four were reported with TB disease in Table 14. HIV and STD co-infections, Missouri, 2014 Diagnosed with HIV Prior to 2014 Diagnosed with HIV in 2014 Total Co-infection N % N % N % Chlamydia % % % Gonorrhea % % % Syphilis* % % % Chlamydia and Gonorrhea % % % Chlamydia and Syphilis* 8 1.8% 4 4.0% % Gonorrhea and Syphilis* % 4 4.0% % Chlamydia, Gonorrhea, and Syphilis* 9 2.0% 2 2.0% % Total % % % *Only includes diagnoses of primary, secondary, and early latent syphilis. 24
25 Of the 11,984 individuals living with HIV disease, 555 were reported with an STD comorbidity in 2014 (Table 14). The majority of those reported with an STD co-morbidity were diagnosed with HIV prior to 2014 (82%). There were not significant differences in the type of STD co-morbidity diagnosed based on when the individual was diagnosed with HIV. The largest numbers of HIV co-morbidities were with early syphilis and gonorrhea alone. The proportion of reported STD infections in 2014 that were living with HIV varied by infection type. Of the 592 early syphilis cases reported in 2014, 35% were among PLWH. Only 3% of gonorrhea cases and less than 1% of chlamydia cases reported in 2014 were among PLWH. Table 15. Number of HIV testing events* and newly diagnosed positives** among HIV testing sites, by current gender, race/ethnicity, age, exposure category***, and test method, Missouri, 2014 Testing Events* Newly Diagnosed Positives** N N % Total 82, % Current Gender Male 37, % Female 42, % Transgender % Unknown 2, % Race/Ethnicity White 31, % Black 40, % Hispanic 4, % Other/Unknown 5, % Age at Test < % , % , % , % , % 65+ 1, % Unknown % Exposure Category*** MSM 2, % MSM/IDU % IDU % High Risk Heterosexual Contact % Other 11, % Unknown 66, % Test Method Rapid 32, % Conventional 49, % Unknown % 25
26 *A testing event is a single test or series of tests conducted to determine an individual's HIV status. For example, a preliminary positive rapid test with a confirmatory conventional test is one testing event. **Includes only tests where the individual did not self-report a previously positive HIV test and the individual did not have an existing HIV diagnosis in the HIV reporting system (enhanced HIV/AIDS Reporting System, ehars). ***Exposure information is typically only collected for positive testing events, therefore the percent of positive tests among specific exposure category is likely biased and should be interpreted with extreme caution. Includes males and females who reported no injection drug use and reported high risk heterosexual behaviors with the opposite gender; corresponds with the CDC definition of high risk heterosexual contact. Includes any gender, including unknown, who reported risk factors that do not meet the criteria of the above exposure categories. A rapid test method indicates a testing event where the initial test was conducted using rapid HIV testing technology but any subsequent testing within the event to confirm positive rapid results may have been done using conventional test technology. A conventional test method is a testing event where no rapid HIV testing technology was used in the event. Source: HIV Testing Database There were a total of 82,005 HIV testing events performed at all sites using MDHSS funds to conduct HIV testing in The total number of HIV testing events performed includes the 276 HIV tests for individuals who were previously diagnosed with HIV. Table 15 presents testing characteristics only among those tests where the results were available; there were 82,005 testing events that met these criteria. Overall, less than one percent of tests were newly positive for HIV disease. The positivity among transgender persons (2%) and individuals less than the age of 13 (5%) should be interpreted with caution due to the small number of tests performed among these groups. 26
27 Table 16. Percent of schools with policy and curriculum regarding HIV, STD, and pregnancy prevention, Missouri and 43 U.S. states, school year Grades Levels 6,7, or 8 9, 10, 11, or 12 Source: School Health Profiles Median % among Topic taught in a required course % Missouri Schools Schools in 43 States The differences between HIV and AIDS How HIV and other STDs are transmitted The relationship among HIV, other STDs, and pregnancy The relationship between alcohol and other drug use and risk for HIV, other STDs, and pregnancy How HIV and other STDs are diagnosed and treated The health consequences of HIV, other STDs, and pregnancy The benefits of being sexually abstinent How to prevent HIV, other STDs, and pregnancy How to access valid and reliable information, products, and services related to HIV, other STDs, and pregnancy The influences of media, family, and social and cultural norms on sexual behavior Communication and negotiation skills related to eliminating or reducing risk for HIV, other STDs, and pregnancy Efficacy of condoms (how well they work and don't work) Importance of using condoms consistently and correctly How to obtain condoms How to correctly use a condom The differences between HIV and AIDS How HIV and other STDs are transmitted The relationship among HIV, other STDs, and pregnancy The relationship between alcohol and other drug use and risk for HIV, other STDs, and pregnancy How HIV and other STDs are diagnosed and treated The health consequences of HIV, other STDs, and pregnancy The benefits of being sexually abstinent How to prevent HIV, other STDs, and pregnancy How to access valid and reliable information, products, and services related to HIV, other STDs, and pregnancy The influences of media, family, and social and cultural norms on sexual behavior Communication and negotiation skills related to eliminating or reducing risk for HIV, other STDs, and pregnancy Efficacy of condoms (how well they work and don't work) Importance of using condoms consistently and correctly How to obtain condoms How to correctly use a condom Teaching topics assessed at the sixth, seventh, and eighth grades were related to how to access valid and reliable information, products, and services related to HIV, other STDs, and pregnancy; the influences of media, family, and social and cultural norms on sexual 27
28 behavior; communication and negotiation skills related to eliminating or reducing risk for HIV, other STDs, and pregnancy; efficacy of condoms (how well they work and don t work); importance of using condoms consistently and correctly; how to obtain condoms; and how to correctly use a condom tended to be lower among Missouri schools compared to the survey median (Table 16). Of the other topics listed in the table regarding STD topics the percent of Missouri schools teaching those topics at the middle school level tended to be higher than the median percent of all 43 states surveyed. Among the topics assessed at the ninth, tenth, eleventh, and twelfth grade levels, teaching topics related to how to access valid and reliable information, products, and services related to HIV, other STDs, and pregnancy; communication and negotiation skills related to eliminating or reducing risk for HIV, other STDs, and pregnancy; efficacy of condoms (how well they work and don t work); importance of using condoms consistently and correctly; how to obtain condoms; and how to correctly use a condom tended to be lower among Missouri schools compared to the survey median. Of the other topics listed in the table regarding STD topics the percent of Missouri schools teaching those topics at the high school level tended to be higher than the median percent of all 43 states surveyed. Table 17. Select services provided by substance abuse treatment facilities, Missouri, 2011 N % Total Facilities Methadone therapy HIV Testing TB screening Hepatitis B screening Hepatitis C screening STD testing HIV/stage 3 (AIDS) education, counseling, or support Early intervention for HIV Program specifically for person living with HIV/stage 3 (AIDS) Source: SAMSHA, National Survey of Substance Abuse Treatment Services There were 289 substance abuse treatment facilities in Missouri that responded to the National Survey of Substance Abuse Treatment Services (N-SSATS) in 2011 (Table 17). Of responding facilities, only 11% offered STD testing; 14% offered HIV testing; 16% offered hepatitis B screening; 16% offered hepatitis C screening; and 24% offered TB screening. Although testing for HIV was not common among the facilities (14%), 51% of facilities offered HIV/stage 3 (AIDS) education, counseling or support. However, only 4% of facilities had a program designed specifically for persons living with HIV/stage 3 (AIDS). Given the strong body of evidence linking substance abuse with risky sexual behaviors, more widespread screening of STDs, hepatitis B and C, and HIV may be an important recommendation to substance abuse treatment facilities. 28
29 Key Highlights: What are the HIV service utilization patterns of individuals with HIV disease in Missouri? Magnitude of the Problem Overall, 68% of Missourians living with HIV disease had their primary care medical needs met (i.e., evidence of a CD4 lymphocyte or viral load test or diagnosis with an opportunistic infection in 2014). Persons enrolled in HIV medical case management were significantly more likely to have their primary care medical needs met. Of the 11,984 persons living with HIV disease in Missouri, 4,969 (42%) were enrolled in medical case management at some point in Ninety-six percent (96%) of individuals in case management had their primary care medical needs met in PLWH who were subcategorized as stage 3 (AIDS) cases in 2014 were more likely to have their medical needs met (75%) compared to persons subcategorized as HIV cases (61%). Similar patterns were seen regardless of whether the individuals were enrolled in HIV medical case management. Enrollment in HIV medical case management and current diagnostic status (i.e., HIV or stage 3 (AIDS)) were important factors influencing unmet need. Where Overall, the proportion of individuals with a met need was greatest in the Southeast and Northwest HIV Care Regions (70%), and lowest in the Central HIV Care Region (62%). Among those enrolled in HIV medical case management, the proportion with a met need ranged from 90% in the Northwest HIV Care Region to 98% in the Southwest HIV Care Regions. For those not enrolled in HIV medical case management, the proportion with a met need ranged from 37% in the Central HIV Care Region to 60% in the Northwest HIV Care Region. Who Sex Overall, there were no differences observed in unmet need by sex, after controlling for factors such as enrollment in HIV medical case management, and current diagnostic status (i.e., HIV or stage 3 (AIDS)). Race/Ethnicity Unmet need tended to be greater among minority populations, although factors such as case management and diagnostic status influenced the relationship between race and unmet need. Among persons diagnosed in , the likelihood of entering care was lower for blacks/african Americans than other races. Age There were differences in unmet need by current age among individuals enrolled in HIV medical case management. Unmet need was greatest among individuals years of age (10%). 29
30 There were differences in unmet need by current age among individuals not enrolled in HIV medical case management. Unmet need was greatest among individuals years of age (57%). Exposure Category Unmet need by exposure category varied depending upon enrollment in medical case management and current diagnosis status. Table 18. The impact of HIV case management on access to primary medical care by HIV care region* and race/ethnicity among individuals living with HIV disease as of December 31, 2014 HIV Care Region Total HIV Population Met Need** N (%) Unmet Need*** N (%) Enrolled in Case Management Met Need** N (%) 30 Unmet Need*** N (%) Not Enrolled in Case Management Met Need** N (%) Unmet Need*** N (%) St. Louis Region White 1,577 (66.9%) 780 (33.1%) 650 (95.2%) 33 (4.8%) 927 (55.4%) 747 (44.6%) Black/African American 2,247 (70.7%) 933 (29.3%) 1,541 (95.5%) 73 (4.5%) 706 (45.1%) 860 (54.9%) Hispanic 93 (59.2%) 64 (40.8%) 57 (98.3%) 1 (1.7%) 36 (36.4%) 63 (63.6%) Other/Unk. 57 (68.7%) 26 (31.3%) 38 (97.4%) 1 (2.6%) 19 (43.2%) 25 (56.8%) Total 3,974 (68.8%) 1,803 (31.2%) 2,286 (95.5%) 108 (4.5%) 1,688 (49.9%) 1,695 (50.1%) Kansas City Region White 1,196 (66.3%) 607 (33.7%) 562 (97.4%) 15 (2.6%) 634 (51.7%) 592 (48.3%) Black/African American 971 (66.8%) 482 (33.2%) 687 (95.0%) 36 (5.0%) 284 (38.9%) 446 (61.1%) Hispanic 128 (54.7%) 106 (45.3%) 75 (92.6%) 6 (7.4%) 53 (34.6%) 100 (65.4%) Other/Unk. 58 (72.5%) 22 (27.5%) 26 (92.9%) 2 (7.1%) 32 (61.5%) 20 (38.5%) Total 2,353 (65.9%) 1,217 (34.1%) 1,350 (95.8%) 59 (4.2%) 1,003 (46.4%) 1,158 (53.6%) Northwest Region White 70 (76.1%) 22 (23.9%) 31 (91.2%) 3 (8.8%) 39 (67.2%) 19 (32.8%) Black/African American 10 (55.6%) 8 (44.4%) 4 (100.0%) 0 (0.0%) 6 (42.9%) 8 (57.1%) Hispanic 0 (0.0%) 4 (100.0%) 0 (0.0%) 1 (100.0%) 0 (0.0%) 3 (100.0%) Other/Unk. 0 (N/A) 0 (N/A) 0 (N/A) 0 (N/A) 0 (N/A) 0 (N/A) Total 80 (70.2%) 34 (29.8%) 35 (89.7%) 4 (10.3%) 45 (60.0%) 30 (40.0%) Central Region White 254 (66.7%) 127 (33.3%) 158 (94.6%) 9 (5.4%) 96 (44.9%) 118 (55.1%) Black/African American 75 (50.0%) 75 (50.0%) 56 (90.3%) 6 (9.7%) 19 (21.6%) 69 (78.4%) Hispanic 18 (56.3%) 14 (43.8%) 16 (94.1%) 1 (5.9%) 2 (13.3%) 13 (86.7%) Other/Unk. 4 (66.7%) 2 (33.3%) 2 (100.0%) 0 (0.0%) 2 (50.0%) 2 (50.0%) Total 351 (61.7%) 218 (38.3%) 232 (93.5%) 16 (6.5%) 119 (37.1%) 202 (62.9%) Southwest Region White 534 (71.8%) 210 (28.2%) 365 (97.6%) 9 (2.4%) 169 (45.7%) 201 (54.3%) Black/African American 54 (54.5%) 45 (45.5%) 35 (97.2%) 1 (2.8%) 19 (30.2%) 44 (69.8%) Hispanic 32 (64.0%) 18 (36.0%) 22 (95.7%) 1 (4.3%) 10 (37.0%) 17 (63.0%) Other/Unk. 10 (55.6%) 8 (44.4%) 8 (100.0%) 0 (0.0%) 2 (20.0%) 8 (80.0%) Total 630 (69.2%) 281 (30.8%) 430 (97.5%) 11 (2.5%) 200 (42.6%) 270 (57.4%) Southeast Region White 163 (75.8%) 52 (24.2%) 101 (93.5%) 7 (6.5%) 62 (57.9%) 45 (42.1%) Black/African American 57 (58.2%) 41 (41.8%) 34 (94.4%) 2 (5.6%) 23 (37.1%) 39 (62.9%) Hispanic 3 (60.0%) 2 (40.0%) 2 (100.0%) 0 (0.0%) 1 (33.3%) 2 (66.7%) Other/Unk. 1 (50.0%) 1 (50.0%) 1 (100.0%) 0 (0.0%) 0 (0.0%) 1 (100.0%) Total 224 (70.0%) 96 (30.0%) 138 (93.9%) 9 (6.1%) 86 (49.7%) 87 (50.3%) Statewide (MO)**** White 3,958 (68.0%) 1,866 (32.0%) 1,954 (96.1%) 79 (3.9%) 2,004 (52.9%) 1,787 (47.1%) Black/African American 3,757 (68.7%) 1,713 (31.3%) 2,541 (95.2%) 129 (4.8%) 1,216 (43.4%) 1,584 (56.6%) Hispanic 280 (56.3%) 217 (43.7%) 174 (94.6%) 10 (5.4%) 106 (33.9%) 207 (66.1%) Other/Unk. 133 (68.9%) 60 (31.1%) 78 (95.1%) 4 (4.9%) 55 (49.5%) 56 (50.5%) Total 8,128 (67.8%) 3,856 (32.2%) 4,747 (95.5%) 222 (4.5%) 3,381 (48.2%) 3,634 (51.8%)
31 *Includes all individuals still living whose most recent diagnosis (i.e., HIV or stage 3 (AIDS)) occurred in the region. Does not reflect the number of individuals currently living in the region. **Evidence of a CD4+ T-lymphocyte or viral load laboratory test result or diagnosis with an opportunistic infection in the current year. *** No evidence of a CD4+ T-lymphocyte or viral load laboratory test result or diagnosis with an opportunistic infection in the current year. ****Statewide figures include living individuals whose most recent diagnosis occurred in a correctional facility or is unknown. Note: Percentages may not total to 100% due to rounding. Of the 11,984 persons living with HIV at the end of 2014, 68% had evidence of met primary care medical needs (i.e., met need) in 2014 (Table 18). The primary care medical need was considered to be met if an individual had a CD4 lymphocyte or viral load laboratory test; or diagnosis of an opportunistic infection in 2014 that was reported to MDHSS. There were differences in the proportion of individuals with met needs depending on whether the individual was enrolled in HIV medical case management in A significantly greater proportion of those enrolled in HIV medical case management had a met need (96%) in 2014 compared to those not enrolled (48%). Several factors may contribute to the differences observed. First, case management assists clients to locate and access medical care by referral. Second, case management clients receive health education and counseling to understand the nature of routine medical care. Third, case management assists clients in identifying appropriate payer sources to fund routine medical care. Finally, it is possible that those not enrolled in case management were less likely to be currently living in Missouri, and therefore indicators of primary medical care would not be reported to MDHSS. The data were presented based on individuals whose most recent diagnosis occurred in Missouri, not those known to be currently living in Missouri, as accurate data on current residence are difficult to collect. There were differences in the proportion of individuals with a met need by HIV Care Region. It is important to note that data presented by HIV Care Region represent those who currently have a met need that were most recently diagnosed with HIV or stage 3 (AIDS) in the selected HIV Care Region. It does not necessarily reflect where individuals are currently living and receiving care. Overall, the proportion of individuals with a met need was greatest in the Northwest and Southeast HIV Care Regions (70%), and lowest in the Central HIV Care Region (62%). The pattern was slightly different between the regions depending on whether individuals were enrolled in HIV medical case management. For those not enrolled in HIV medical case management, the proportion with a met need ranged from 37% in the Central HIV Care Region to 60% in the Northwest HIV Care Region. There were differences in the proportion of persons with a met need by race/ethnicity. Overall statewide, met need was lower among Hispanics (56%) compared to all other race/ethnicity groups presented. Within each region and depending on whether the individuals were enrolled in HIV medical case management, the patterns by race/ethnicity varied slightly. Among individuals not enrolled in case management, the proportion of blacks/african Americans with a met need was lower in all HIV Care Regions compared to whites, and the proportion of Hispanics with a met need was lower in all HIV Care Regions compared to whites. 31
32 Figure 10. Percent of individuals living with HIV having an unmet* primary medical care need in 2014 by enrollment in HIV case management and selected characteristics Percent Unmet Need 90% 80% 70% 60% 50% 40% 30% 20% 10% 0% In Case Mgmt By Sex Not In Case Mgmt Percent Unmet Need 90% 80% 70% 60% 50% 40% 30% 20% 10% 0% In Case Mgmt By Age Not In Case Mgmt Male Female < Percent Unmet Need 90% 80% 70% 60% 50% 40% 30% 20% 10% 0% In Case Mgmt By Race/Ethnicity Not In Case Mgmt White Black/African American MSM MSM/IDU IDU Hispanic Other/Unk Heterosexual NIR Other Adult Risk *No evidence of a CD4+ T-lymphocyte or viral load laboratory test result or diagnosis with an opportunistic infection in the current year. Figure 10 examines the proportion of cases with unmet need depending on whether the individuals were enrolled in HIV medical case management for selected characteristics. There were no differences in the proportion of individuals with unmet needs between the sexes, regardless of whether enrolled in HIV medical case management. There were differences in the proportion of individuals with unmet needs by current age among those not enrolled in case management. Unmet need was greatest among individuals years of age (57%). Those 2-12 years old had the lowest proportions of unmet need. There were differences in the proportion of individuals with unmet needs by current age among those enrolled in case management. Unmet need was greatest among year olds (10%). There were differences in the proportion of individuals with unmet needs by race/ethnicity among those not enrolled in case management. Among those not enrolled in case management, unmet need was greatest among Hispanics (66%) and lowest among whites (47%). There were not significant differences in the proportion of individuals with unmet need for individuals enrolled in case management by race/ethnicity. There were differences in the proportion of individuals with unmet need by exposure category regardless of whether enrolled in HIV medical case management. The denominator in the proportion of individuals enrolled in case management with an exposure category of other adult risk was small and unstable, causing the percent of unmet 32 Percent Unmet Need 90% 80% 70% 60% 50% 40% 30% 20% 10% 0% By Exposure Category In Case Mgmt Not In Case Mgmt
33 need for other adult risk to be interpreted with extreme caution. Unmet need was greatest among individuals enrolled in case management and among individuals not enrolled in case management for those who indicated injection drug use (IDU) as an exposure category (7% for individuals enrolled in case management, 57% for individuals not enrolled in case management). Table 19. Percent of individuals living with HIV having an unmet* primary medical care need in 2014 by current status**, enrollment in HIV case management, and selected characteristics Total Population Enrolled in Case Management Not Enrolled in Case Management HIV Cases with Unmet Need* % (N) Stage 3 (AIDS) Cases with Unmet Need* % (N) HIV Cases with Unmet Need* % (N) Stage 3 (AIDS) Cases with Unmet Need* % (N) HIV Cases with Unmet Need* % (N) Stage 3 (AIDS) Cases with Unmet Need* % (N) Sex Male 40.1% (1,872) 26.2% (1,374) 6.2% (104) 3.6% (81) 59.2% (1,768) 42.8% (1,293) Female 36.9% (381) 22.1% (229) 5.9% (29) 1.4% (8) 65.3% (352) 47.1% (221) Race/Ethnicity White 37.8% (1,054) 26.7% (812) 6.0% (54) 2.2% (25) 53.0% (1,000) 41.3% (787) Black/African American 40.2% (1,043) 23.3% (670) 6.2% (72) 3.8% (57) 67.9% (971) 44.7% (613) Hispanic 48.5% (114) 39.3% (103) 7.0% (6) 4.1% (4) 72.5% (108) 60.4% (99) Other/Unknown 47.2% (42) 17.3% (18) 3.4% (1) 5.7% (3) 68.3% (41) 29.4% (15) Current Age <2 -- (0) -- (0) -- (0) -- (0) -- (0) -- (0) % (8) 25.0% (2) 0.0% (0) 0.0% (0) 40.0% (8) 28.6% (2) % (13) 33.3% (3) 0.0% (0) 0.0% (0) 65.0% (13) 37.5% (3) % (112) 14.4% (18) 11.2% (31) 4.7% (4) 56.6% (81) 35.9% (14) % (979) 25.7% (503) 6.4% (75) 4.1% (40) 62.5% (904) 46.8% (463) % (1,027) 25.8% (988) 3.8% (26) 2.6% (43) 58.9% (1,001) 43.2% (945) % (114) 25.4% (89) 3.7% (1) 2.2% (2) 57.4% (113) 33.3% (87) Exposure Category Men who have sex with men 38.1% (1,352) 26.0% (1,012) 6.3% (86) 2.8% (47) 58.0% (1,266) 43.2% (965) Men who have sex with men and inject drugs 35.5% (81) 28.2% (104) 1.0% (1) 4.5% (8) 64.0% (80) 50.5% (96) Injecting drug use 44.9% (115) 27.6% (109) 7.7% (7) 7.3% (15) 65.5% (108) 49.7% (94) Heterosexual contact 38.9% (306) 23.6% (208) 6.1% (22) 2.1% (9) 66.5% (284) 44.6% (199) No indicated risk (NIR) 44.8% (368) 22.6% (146) 6.5% (16) 2.5% (7) 61.0% (352) 38.1% (139) Other Adult Risk 66.7% (8) 29.3% (12) 50.0% (1) 18.2% (2) 70.0% (7) 33.3% (10) Pediatric 43.4% (23) 22.6% (12) 0.0% (0) 5.9% (1) 59.0% (23) 30.6% (11) Total 39.5% (2,253) 25.5% (1,603) 6.1% (133) 3.2% (89) 60.1% (2,120) 43.4% (1,514) *No evidence of a CD4+ T-lymphocyte or viral load laboratory test result or diagnosis with an opportunistic infection in the current year. **HIV case vs. stage 3 (AIDS) case. Based on age as of December 31, Note: Rows with the percent marked - - indicates that there were no living persons in the selected category. Table 19 examines the proportion of cases reported with unmet need based on current status (i.e., HIV or stage 3 (AIDS)) and selected characteristics. Overall, the proportion of those with an unmet need was greater for those classified as HIV cases compared to stage 3 (AIDS) cases. The same trend was observed regardless of whether individuals were enrolled in HIV medical case management. Missouri includes two bi-state Transitional Grant Areas (TGAs) which include several counties in St. Louis (St. Louis TGA) and Kansas (Kansas City TGA). The following TGAspecific epidemiologic profiles are offered in addition to the Missouri statewide profile in 33
34 order to provide a comprehensive picture of the epidemiologic impact of HIV on PLWH and those at risk of infection who are served by Missouri stakeholders. St. Louis Transitional Grant Area Epidemiologic Profile Jurisdictional Profile The St. Louis TGA is a complex bi-state region of urban, suburban and rural communities, encompassing six counties, the independent City of St. Louis in Missouri, and five counties in Illinois. The population of 2.7 million spreads across 6,300 square miles, ranging from sparsely populated counties like Jersey (Illinois) with approximately 23,000 residents to densely populated St. Louis County (Missouri) with nearly one million residents. The St. Louis TGA has a relatively even composition of males (48%) and females (52%). Most residents are white/caucasian (76%), followed by black/african American (19%). Nearly 3% of the population is of Hispanic or Latino descent. Asian, American Indian/Alaskan Native, and other races make up slightly over 2% of the area s population. Individuals under 25 comprise 33% of the TGA, (13%), (13%), (16%), and individuals 55 and older account for the remaining 25% (US Census Bureau, 2010 Population Estimates). Residents in the Missouri counties encompass about 77% of the St. Louis TGA s total population, with more than half of these living in St. Louis City and St. Louis County. However, 84% of the people living with HIV disease (PLWH/A) in the St. Louis TGA reside in Missouri. This represents a much higher percentage than that represented in the general population. Table 20 displays the incidence and prevalence of HIV and Stage 3 (AIDS) from 2012 through 2014 in the St. Louis TGA. Table 20. Incidence and Prevalence of HIV and AIDS Table 20. Incidence and Prevalence of HIV/AIDS Incidence Prevalence Incidence Prevalence Incidence Prevalence HIV 311 3, , ,482 AIDS 107 3, , ,442 Total 418 6, , ,924 Data Sources: ehars, MDHSS, IDPH (2012, 2013, 2014) Epidemiological data were obtained from the HIV/AIDS Reporting Systems (ehars) through MDHSS and the Illinois Department of Public Health (IDPH). Missouri s ehars is a reliable source for reporting incidence, prevalence, and trends in HIV/AIDS for the Missouri counties of the St. Louis TGA. Missouri has used name-based AIDS reporting since 1983, and HIV name-based reporting since PLWH residing in the Missouri counties are tracked through physician contact, CD4 and viral load laboratory tests (mandated reporting by law), death certificates, and SCOUT (a client-level database used for all Ryan White services). Illinois has had an established AIDS reporting system since The Illinois HIV reporting system, which began in mid-1999, progressed from using a unique identifier to name based reporting in PLWH/A in Illinois counties of the TGA are tracked through CD4s with a 34
35 cell count of less than 200, a detectable viral load (mandated reporting by law), and death certificates. IDPH also tracks healthcare utilization and healthcare needs of Ryan White clients through the Provide database. Client-level data was included in all estimations and analyses when available. Given that 100% of PLWH/A in the St. Louis TGA live in counties with a mature reporting system, the estimates are considered accurate and reliable. HIV/AIDS Prevalence: During the period of , the St. Louis TGA experienced an increase in HIV and AIDS prevalence by 8% and 5% respectively (refer to Table 20 above). As of December 31, 2014; 3442 residents of the St. Louis TGA were living with AIDS and 3482 persons were living with HIV, resulting in an overall prevalence of HIV disease in the St. Louis TGA of 6924 (PLWH/AIDS), an increase of 192 cases (3 %) compared to the previous grant year. Living Cases of HIV Disease: Estimates of HIV (non-aids) and AIDS infection for the time periods of January 2012 to December 2014 and HIV (non-aids) and AIDS prevalence as of December 31, 2014 were provided by MDHSS and IDPH. Attachment 3 depicts the demographic and exposure category differences in the St. Louis TGA s HIV disease prevalence as of December 31, 2012 to December 31, It is important to note that Illinois and Missouri data are captured and reported using different mechanisms. - Age: Age of PLWH has stayed fairly consistent over the last several years. People ages years comprise the highest percentage (33%) of individuals living with HIV disease, followed by the age group years (21%), (17%), and (17%). Individuals under the age of 25 account for 6% of those living with HIV Disease. - Gender: HIV disease prevalence in the TGA continues to be consistently high among men (81%) and black/african Americans. Similar to nationwide trend, black/african Americans have the most severe burden of HIV disease compared to any other races. Black/African Americans account for a high proportion of both new HIV/AIDS infections and those living with HIV disease. - Exposure Category/Mode of Transmission (MOT): Similar to national trends, MSM is the most frequently reported exposure category for new and existing HIV/AIDS infections (61%), followed by persons reporting exposure via heterosexual sex (16%). - Disparities: Black/African Americans are disproportionately affected by HIV/AIDS, as they represent only 19% of the Region s population but 55% of PLWH. This disparity is even more striking among women. Of the 1330 women in the St. Louis TGA with HIV/AIDS, 73% are black/african American, much higher than the National data which show that approximately 23% of people living with HIV/AIDS in the U.S. are women with the vast majority being black/african American women and Hispanic/Latino (CDC HIV/AIDS Surveillance Report Vol. 23, 2011). AIDS Incidence: The St. Louis TGA had a total of 282 new cases of AIDS reported between January 1, 2012 and December 31, 2014; 173 (61%) of these cases were on the Missouri side of the St. Louis TGA. - Age: The age breakdown for AIDS incidence cases in the St. Louis TGA is as follows: (32%), (22%) (22%), (13%), (8%), and (3%). For those less than 35 years of age, black/african Americans represent up to 75% of the incident for AIDS cases. 35
36 - Race: Black/African Americans represent the majority (63%) of AIDS cases diagnosed followed by white/caucasians (32%), Hispanic (3%), and Other/Unknown (2%). - Gender: Males continue to account for the majority of new AIDS cases (82%). The percentage of new cases of AIDS among African American women is five times higher that of white women. Overall, the number of new AIDS infections has decreased over the past decade; however, the trend is not reaching black/african American women who make up approximately 83% ( ) of new cases of AIDS among women in the St. Louis TGA. - MOT: Over the past three years, the incidence of AIDS has decreased by 21%; however, it has remained the highest among MSM. The MSM subpopulation accounts for (59%) of AIDS incidence, followed by heterosexual exposure (15%) and IDU (2%). It is important to note that there is a large percentage of new AIDS cases that have an unknown risk factor (23%). Missouri and Illinois surveillance departments are working to accurately determine the risk factors of newly infected PLWH. This will improve the accuracy of incidence data and understanding of the risk factors for new cases of HIV/AIDS in the population. HIV Prevalence - Age: The age break down of PLWH is slightly different than people living with AIDS (PLWA); younger populations account for a higher percentage of cases. In the St. Louis TGA, those years old account for 26% of cases, years (21%), and years (24%). Adolescents and children age 18 years and under account for less than 2% and persons years old make up 9% of PLWH in the St. Louis TGA. Black/African Americans account for 73% of PLWH under age 35 (716 out of 977 cases). In Missouri this is an increase of 4% from Race: The racial/ethnic breakdown of HIV prevalence is very similar to AIDS prevalence: black/african Americans (51%), white/caucasians (43%), Hispanic (3%) and other (2%). - Gender: The majority of PLWH are men (80%). The remaining 20% are predominantly black/african American women (74% out of 635 cases). - MOT: The primary exposure category for HIV prevalence is MSM (60%), followed by unknown risk exposure (17%), heterosexual exposure (16%), IDU (4%), and MSM/IDU (3%). Less than 2% of prevalent HIV cases were due to the other/hemophilia/blood transfusion category. AIDS Prevalence - Age: Persons aged years account for the largest proportion of AIDS cases in the St. Louis TGA (41%). Adolescents and children age 18 years and under comprise less than 1%, and persons years old make up 2% of PLWA in the St. Louis TGA. Children and youth represent a small proportion of PLWA and are more likely to be minorities. Black/African Americans represent 75% of PLWA under age 35 in the St. Louis TGA (out of 459 cases). - Race: Black/African Americans are the largest racial/ethnic category represented in the AIDS prevalence data, accounting for 55% of PLWA cases even though they represent just 19% of the overall St. Louis TGA population. White/Caucasians account for 40%, Hispanics represent 3%, and Other/Unknown 3%. - Gender: Men currently comprise about 81% of all PLWA as has been the trend since early Black/African American women make up 73% of AIDS cases among women living with AIDS in the St. Louis TGA (out of 638 cases total). - MOT: The primary risk group for AIDS prevalence in the St. Louis TGA is MSM (62%), 36
37 followed by heterosexual exposure (17%), intravenous drug use (IDU, 5%), MSM/IDU (5%), and other/hemophilia/blood transfusion (1%). AIDS prevalence due to unknown risk factors was 11% in Black/African American women account for a majority of heterosexual transmission cases of AIDS (53%). In light of the increase in HIV/AIDS prevalence, significant need for Ryan White (RW) funding to accommodate the client growth within the care system continues. In particular, the St. Louis TGA has a need to expand programs that successfully build linkages between HIV testing and care to quickly connect newly diagnosed persons to the RW system. Given estimates from the CDC that up to 1.1 million persons in the United States are living with HIV infection and approximately 1 in 6 people are unaware of their HIV infection the St. Louis TGA has nearly 1,300 undiagnosed PLWH/A; which means that many more people may yet be entering the system. Disproportionate Impact of HIV/AIDS: Past trends have shown that new HIV cases tend to occur in the younger age categories (19-24 and 25-34). For example, out of a total of 557 new cases of HIV in the St. Louis TGA (Missouri only) for the period , 66% (366) were in persons of the age group years. On the other hand, new cases of AIDS tend to occur in the middle to older age categories (35-44 and 45-64). Out of a total of 203 new AIDS cases in the St. Louis TGA (Missouri only) for the period , 53% (107) occurred in persons in the age group years. This is cause for concern due to the additional healthcare needs of individuals living with AIDS compounded by the health issues associated with aging. Impacted Minority Communities: Black/African Americans are disproportionately impacted by HIV disease. Black/African Americans have the highest rate of HIV infection in the St. Louis TGA (737.2 per 100,000 persons), followed by Hispanic/Hispanics (271.3 per 100,000 persons), and white/caucasians (134.5 per 100,000 persons). Historically, males have been more extensively affected by HIV Disease than females. In 2014, the prevalence of HIV disease in males was almost fivefold higher than in females (425.6 cases per 100,000 versus 94.9 per 100,000 in the St. Louis TGA. Racial disparities become more pronounced when examining race and gender. For example, black/african American men in the St. Louis TGA (Missouri only) have an estimated HIV disease rate of per 100,000 persons, over four times the estimated rate among white/caucasian men (286.7 per 100,000 persons). The rate for black/african American females in the St. Louis TGA (Missouri only) is per 100,000 persons, about 14 times the rate among white/caucasian women (25.8 per 100,000). Within the St. Louis TGA, urban areas have significantly higher rates of HIV disease than rural areas. The St. Louis TGA s urban core (St. Clair County, St. Louis County, and St. Louis City) account for 58% of the St. Louis TGA s population but 88% of all PLWH. The average HIV disease rate in the urban areas of the St. Louis TGA is per 100,000 persons, with the highest rate being in St. Louis City ( per 100,000 persons). The average rural county has an HIV rate of 74.7 per 100,000 persons (just 1/14 of the rate in St. Louis City), ranging from a rate of per 100,000 persons in Clinton County to just 30.8 per 100,000 persons in Warren County. 37
38 Kansas City Transitional Grant Area Epidemiologic Profile The Kansas City TGA is a bi-state region consisting of urban, suburban, and rural communities, encompassing seven Missouri counties and four Kansas counties. The Kansas City TGA has a combined population of approximately two million. The range of populations per county is significant. Clinton County (Missouri) has a population of just over 21,000 residents, while Jackson County (Missouri) has a population of over 700,000 residents. HIV Disease Incidence As of December 31, 2013, there were 211 reported cases of HIV disease in the Kansas City TGA. Of the 211 newly reported HIV disease cases, 64 cases (30%) were reported as stage 3 (AIDS). The rate of newly reported HIV disease cases for the combined Kansas City TGA in 2013 was 10.5 persons per 100,000 population, with the highest rates in the urban areas of Jackson County (Missouri) (17.9 persons per 100,000 population) and Wyandotte County (Kansas) (11.6 persons per 100,000 population). There were no newly reported HIV disease cases in Ray, Clinton, and Lafayette counties in Missouri or in Miami County, Kansas. Of the newly reported cases with a known sex, 163 (77%) of newly reported cases in 2013 were among males, compared to 28 (13%) females. Among males, 76 (47%) were white; 64 (39%) were black/african American; and 20 (12%) were Hispanic. Among females, 18 (64%) were black/african American and 8 (29%) were white. The age distribution of newly reported HIV disease cases varied widely in Among males, the largest proportion of males were ages with 93 cases (57%), followed by persons ages 45 and older with 39 cases (24%) and persons ages with 31 cases (19%). The age distribution was similar among females, with 14 cases (50%) among persons ages 25-44; 10 cases (36%) among persons ages 45 and older; and 4 cases (14%) among persons ages Risk factors are different among males and females newly diagnosed with HIV disease in Among males, 124 persons (76%) were MSM. Among females, 23 persons (82%) reported heterosexual contact. Additional Kansas state epidemiologic data, including data for the four Kansas City TGA counties, is available at B. HIV Care Continuum In 2010, the White House released the National HIV/AIDS Strategy ( to address the HIV/AIDS epidemic and to outline goals for states to reduce new HIV infections, increase access to medical care for persons living with HIV disease to improve health outcomes, and to reduce HIV disease-related health inequities and disparities. The NHAS also seeks to increase coordination among all jurisdictions in monitoring and reporting progress toward achieving these goals. The continuum of care is one way each jurisdiction can monitor and 38
39 report progress toward achieving these goals. The continuum of care is a model that measures the proportion of persons living with HIV disease who are engaged in services throughout each stage of HIV medical care, from initial diagnosis to viral suppression, which is the ultimate goal for all persons living with HIV disease. The national continuum of care measures persons diagnosed with HIV among persons aware of (diagnosed) and estimated to be unaware of their status; persons newly diagnosed who are linked to medical care; persons living with HIV disease who are currently engaged in medical care; persons engaged in medical care who are prescribed antiretroviral therapy (ART); and persons who are engaged in medical care who have achieved the goal of viral suppression. In 2013, Missouri began development of a Missouri-specific diagnosis-based continuum of care to address the goals set forth in the NHAS. The Missouri continuum of care differs from the national continuum. Missouri does not have state-specific data available to calculate an estimate of HIV-infected persons unaware of their status. Therefore, Missouri does not provide a measure for persons diagnosed with HIV among persons aware of (diagnosed) and estimated to be unaware of their status. Also, Missouri does not currently collect data regarding ART prescriptions; therefore, this measure is not included in the Continuum. Lastly, Missouri provides an additional measure in the Continuum. The national Continuum provides a measure of persons who are virally suppressed only among persons who are currently engaged in medical care. Missouri also includes a measure of persons who are not currently engaged in care, but their most recent viral load indicated viral suppression. The continuum is provided for the state overall, and for each of the six HIV Care Regions. Figure 11. Missouri HIV Continuum of Care, Statewide Continuum and Continuum by Sex 100% 80% Total and By Sex 12,259 living with HIV disease, Missouri, 2015*: -2,120 females -10,139 males % 60% 40% 20% 0% 10% 11% 81% 87% 10% 79% 50% 52% 50% 42% 44% 42% Total Female Male Figure 11 provides estimates of engagement in HIV care among persons diagnosed and living with HIV whose most recent diagnosis of HIV or stage 3 (AIDS) occurred in Missouri. The first bar depicts the percentage of adults and adolescents ages 13 and older who were newly diagnosed with HIV disease in 2015 who were linked to medical care. The denominator, persons newly diagnosed with HIV disease in Missouri, is derived from the 39
40 HIV surveillance system, ehars. This number only includes the number of persons reported to MDHSS in 2015, regardless of status (HIV vs. stage 3 infection). The numerator, persons linked to medical care, is also derived from ehars. This is the number of adults and adolescents newly diagnosed with HIV disease in Missouri in 2015 with a CD4 or viral load lab result within three months of diagnosis. The second bar depicts the percentage of adults and adolescents living with HIV disease who were considered to be retained in medical care. The denominator is derived from ehars, and represents the number of adults and adolescents diagnosed with HIV disease through 2014 and living in 2015 who resided in Missouri at the time of their most recent diagnosis of HIV or stage 3 (AIDS). The numerator is also derived from ehars, and represents the number of persons living with HIV disease who had at least two CD4 or viral load laboratory results in 2015 which were collected at least three months apart. The third bar depicts the percentage of adults and adolescents living with HIV disease who have achieved the goal of viral suppression. The bar depicts the percentage of persons who are considered to be retained in medical care who are virally suppressed (bottom portion of the bar), as well as the percentage of persons who are not considered to be retained in care but who are virally suppressed (upper portion of the bar). For the bottom portion of the bar, the denominator is derived from ehars and represents the number of adults and adolescents diagnosed with HIV disease through 2014 and living in 2015 who resided in Missouri at the time of their most recent diagnosis of HIV or stage 3 (AIDS), who had at least two CD4 or viral load laboratory results in 2015 which were collected at least three months apart. The numerator is also derived from ehars, and represents the number of persons who were considered to be retained in care and whose most recent viral load laboratory result in 2015 was 200 copies/ml or less. For the upper portion of the bar, the denominator is derived from ehars and represents the number of adults and adolescents diagnosed with HIV disease through 2014 and living in 2015 who resided in Missouri at the time of their most recent diagnosis of HIV or stage 3 (AIDS), who had only one CD4 or viral load laboratory result in 2015 or who had two CD4 or viral load laboratory results in 2015 less than three months apart. The numerator is also derived from ehars, and represents the number of persons who were not considered to be retained in care, whose most recent viral load laboratory result in 2015 was 200 copies/ml or less. Figure 11 estimates the measures for the statewide totals and also by sex. Females newly diagnosed with HIV disease are more likely to be linked to medical care within three months of initial diagnosis (87%) than men (79%). There were not significant differences in the proportion of males and females considered to be retained in care and who have achieved the goal of viral suppression. 40
41 Figure 12. Missouri HIV Continuum of Care by Selected Age Groups 100% 80% By Selected Age Group Living with HIV disease, Missouri, 2015*: -559 persons years old -4,598 persons years old -7,071 persons 45+ years old % 60% 40% 20% 0% 12% 12% 9% 78% 81% 83% 51% 38% 46% 39% 53% 44% years old years old 45+ years Figure 12 estimates the measure of engagement in HIV care by select age groups: persons years old, years old, and persons 45 years and older. Persons are more likely to enter into medical care after initial diagnosis as age increases, although the differences aren t significant. Among persons ages 45 years and older, 83% were linked to medical care compared to 78% of persons ages 13 to 24. There were not significant differences in the proportion of age groups considered to be retained in medical care and who have achieved the goal of viral suppression; however, persons ages 25 to 44 were least likely to be retained in medical care (46%) compared to persons ages 45 and older (53%). Figure 13. Missouri HIV Continuum of Care by Selected Race/Ethnicity Categories 100% 80% By Selected Race/Ethnicity Living with HIV disease, Missouri, 2015*: -5,609 blacks/african Americans (AA) -511 Hispanics -5,922 whites % 60% 40% 20% 0% 10% 90% 11% 78% 9% 83% 51% 42% 50% 39% 43% 33% Black/AA Hispanic White Figure 13 estimates the measure of engagement of HIV care by select race/ethnicity categories: black/african Americans who are not Hispanic, whites who are not Hispanic, and Hispanics. Hispanics are more likely to be linked to medical care within three months of initial diagnosis (90%) compared to the other race/ethnicity categories. A significantly lower proportion of blacks/african Americans entered care (78%) compared to Hispanics. However, Hispanics were least likely to be retained in care and subsequently, they were the 41
42 least likely to achieve the goal of viral suppression. There were not significant differences in the proportion of whites and black/african Americans considered to be retained in care and who have achieved the goal of viral suppression. Figure 14. Missouri HIV Continuum of Care by Transmission Categories 100% 80% By Selected Transmission Category Living with HIV disease, Missouri, 2015*: -1,735 heterosexual contact (HRH) -661 injection drug use (IDU) -7,647 men who have sex with men (MSM) % 60% 40% 20% 0% 82% 11% 90% 9% 81% 11% 52% 49% 51% 44% 39% 43% HRH IDU MSM Figure 14 estimates the measure of engagement of HIV care by select transmission categories: heterosexual contact (HRH), IDU, and MSM. Injection drug users are more likely to be linked to medical care within three months of initial diagnosis (90%) compared to the other transmission categories. There were not significant differences in the proportion of persons indicating a risk of heterosexual contact and MSM who were linked to medical care within three months of initial diagnosis. There were not significant differences in the proportion of persons considered to be retained in care and who have achieved the goal of viral suppression. Missouri s HIV Care Continuum is shared with several partners in prevention and care planning, including the Comprehensive Prevention Planning Group (CPPG) and the Ryan White Grantees Group. The goal of the Continuum is that planning partners can monitor the measures along the continuum and identify any gaps that may exist in serving PLWH and those at risk of HIV infection, ensuring optimal health outcomes. The measures allow service providers, prevention planning partners, and policy makers to identify how successful Missouri service providers are in linking newly identified persons to medical care, how successful service providers are in retaining PLWH in care, and subsequently how many PLWH are able to achieve viral suppression as a result of the efforts of the service providers. By providing measures by certain demographic categories and geographic regions, prevention and care planning partners, service providers, and policy makers can identify what populations most commonly do not seek care or drop out of care. This knowledge can help Missouri improve systems and services in order to adequately support PLWH as they progress through the Continuum steps. HIV Care Continuum Use in Planning, Prioritization, and Outcome Monitoring The HIV Care Continuum is a valuable tool for Missouri HIV Prevention and Care partners, and is used throughout the planning process to inform discussions and decisions about 42
43 target populations, prioritized prevention and care interventions and strategies, notable disparities, and maximization of limited resources. The HIV Care Continuum is also used to monitor and evaluate progress along each stage of the Continuum, and to determine the efficacy of current strategies and activities. Missouri s HIV Care system, through its participation in the HIV Cross-part Care Continuum Collaborative (H4C) has implemented a statewide quality improvement initiative aimed at improving viral suppression outcomes for PLWH who are engaged in HIV Care system services. Quality improvement activities vary throughout the state based on regionallyidentified barriers to viral suppression. Missouri continues to prioritize additional investment in services and staff dedicated to improving linkage to care and retention in care rates among PLWH. Statewide H4C data (July 1, 2014 June 30, 2015) verifies 84.54% viral suppression overall for the cohort of clients included in H4C. Undoubtedly, the HIV Care Continuum has been instrumental in engaging a system-wide dialogue about each client s successful management of HIV and ultimately, achieving viral suppression. A preponderance of PLWH in the state are diagnosed in the St. Louis or Kansas City Part A TGAs. As part of their annual planning activities, each Part A Planning Council reviews HIV Care Continuum data for their regions, including trends among demographic subpopulations (e.g., race, gender, age, MOT). The results of regional discussions about care continuum trends were included in statewide integrated plan discussions and helped to inform the selection of target populations and health disparities that are to be addressed through this plan. St. Louis TGA HIV Care Continuum Utilization In the St. Louis TGA, the HIV Care Continuum is currently utilized in planning, prioritizing, targeting and monitoring resources for PLWH and those most at risk for infection. Planning Council and Regional Prevention Advisory Group (RPAG) members have been educated on the HIV Care Continuum and how and why it is integral in working to improve health outcomes and reduce new infections. The Planning Council specifically considered the HIV Care Continuum when allocating funds for core medical and supportive services, aligning services with expected outcomes across the HIV Care Continuum. Kansas City TGA HIV Care Continuum Utilization In the Kansas City TGA, the HIV Care Continuum is used to visually illustrate the HIV epidemic for the Kansas City TGA while comparing data to State outcomes. In 2014, the Kansas City TGA s Quality Manager presented HIV Care Continuum data to all local stakeholders to boost individual awareness about the application of the HIV Care Continuum and its relevance to Ryan White clients. Strategies to reduce disparities and drop offs as well as current and future quality improvement (QI) activities along the continuum were discussed. Actions taken as a result of HIV Care Continuum analysis include multiple QI initiatives focused on viral suppression across all sub-contractors including: 43
44 The application of tracking stages along the HIV Care Continuum by service category to identify if a particular service category can implement targeted efforts to address disparities along the Continuum Engaging in a cost-benefit analysis based on the number of clients with viral suppression Working in conjuncture with the Quality Advisory Council (QAC) to filter the HIV Care Continuum through housing status to evaluate potential drop-offs along the Continuum for those clients unstably housed vs. stably housed Reviewing other means of more detailed analysis to identify disparities. Recently, a viral suppression five-year trend analysis for two clinic sites showed an increase from 74% in 2010 to 85% in Kansas City s participation in the CDC s Care & Prevention in the US (CAPUS) Initiative plays a key role in moving PLWH through each stage of the Continuum. H4C participation as part of the MO Response Team improved viral suppression outcomes for PLWH accessing services through participating sites. The H4C experience is helping the Kansas City TGA refine local measures and processes to focus on viral suppression for RW clients. The initial goal for the MO H4C Project was to have at least 85% of patients achieve VLS by December 2015 from the baseline of 81% in December Reporting HIV Care Continuum data related to RW case management and other service categories continues to drive the conversation regarding quality, consumer voice and a coordinated system of care. The Kansas City TGA s percent of clients retained in care exceeds statewide and national retention in care percentages, although the Kansas City TGA has identified a drop off between linkage to care and retention in care. The Kansas City TGA s Quality Manager has created a report within the client level database (SCOUT) to identify trends for those who are not considered retained in care. On-going analysis and systematic adjustments will continue. All Part A funded agencies in the Kansas City TGA have focused their QI efforts toward viral suppression. The Kansas City TGA is working to track viral suppression by age, race and risk factor to identify disparities, particularly among black/african American PLWH between the ages 19-24, a Fiscal Year (FY) 2014 targeted Early Identification of Individuals with HIV/AIDS (EIIHA) population. C. Financial and Human Resources Inventory Funding Source HRSA Ryan White Part A Financial Resources Inventory- Missouri Statewide Funding Amount Funded Organization $9,973,347 City of St. Louis Department of Health Services Delivered* Outpatient/Ambulatory Medical Care Health Insurance Prevention Activity/ Care Continuum Step Impacted All steps of the HIV Care Continuum 44
45 HRSA Ryan White Part B/AIDS Drug Assistance Program (ADAP) HRSA Ryan White Part C Kansas City Health Department $13,222,434 Missouri Department of Health and Senior Services $2,619,693 Washington University Infectious Diseases Clinic Kansas City Care Clinic Premiums/Cost Sharing Mental Health Services Medical Case Management, Including Treatment Adherence Services Oral Health Substance Abuse Outpatient Care Emergency Financial Assistance Food Bank/Home Delivered Meals Health Education/Risk Reduction Housing Linguistic Services Medical Transportation Non-Medical Case Management Other Professional Services Psychosocial Support Services Quality Management Administration Outpatient/Ambulatory Medical Care ADAP Home and Community Based Health Services Mental Health Services Medical Case Management, Including Treatment Adherence Services Oral Health Substance Abuse Outpatient Care Emergency Financial Assistance Medical Transportation Non-Medical Case Management Quality Management Administration Outpatient/Ambulatory Medical Care AIDS Pharmaceutical Assistance Early Intervention Services Health Insurance Linkage to Care Retention in Care Viral Suppression All steps of the HIV Care Continuum 45
46 HRSA Ryan White Part D HRSA Ryan White Part F/AIDS Education and Training Centers (AETC) HRSA Ryan White Minority AIDS Initiative AIDS Project of the Ozarks Northwest Health Services $2,995,861 Washington University Project ARK/The SPOT Kansas City Care Clinic $260,438 Kansas City Care Clinic $719,641 City of St. Louis Department of Health Kansas City Premiums/Cost Sharing Mental Health Services Medical Case Management, Including Treatment Adherence Services Oral Health Substance Abuse Outpatient Care Health Education/Risk Reduction Linguistic Services Medical Transportation Non-Medical Case Management Other Professional Services Outreach Quality Management Administration Outpatient/Ambulatory Medical Care Medical Nutrition Therapy Mental Health Services Medical Case Management, Including Treatment Adherence Services Oral Health Child Care Services Emergency Financial Assistance Health Education/Risk Reduction Medical Transportation Non-Medical Case Management Outreach Psychosocial Support Services Quality Management Administration Licensed health care professional continuing education and practice transformation Outpatient/Ambulatory Medical Care Early Intervention Services Medical Nutrition All steps of the HIV Care Continuum All steps of the HIV Care Continuum All steps of the HIV Care Continuum 46
47 State and Local Funds (Match, Maintenance of Effort, General Revenue, Etc.) 340B Pharmaceutical Rebates Health Department $7,250,397 Missouri Department of Health and Senior Services Kansas City Health Department $31,064,293 Missouri Department of Health and Senior Services Washington University- Project Ark/The Spot AIDS Project of the Ozarks Therapy Medical Case Management, Including Treatment Adherence Services Housing Medical Transportation Psychosocial Support Services Quality Management Administration ADAP Outpatient/Ambulatory Medical Care Mental Health Services Medical Case Management, Including Treatment Adherence Services Oral Health Administration HIV Testing HIV Surveillance ADAP Outpatient/Ambulatory Medical Care Early Intervention Services Health Insurance Premiums/Cost Sharing Mental Health Services Medical Case Management, Including Treatment Adherence Services Oral Health Substance Abuse Outpatient Care Emergency Financial Assistance Food Bank/Home Delivered Meals Health Education/Risk Reduction Housing Linguistic Services Medical Transportation Non-Medical Case Management Other Professional Services Psychosocial Support Services All steps of the HIV Care Continuum All steps of the HIV Care Continuum 47
48 HUD Housing Opportunities for Persons with AIDS (HOPWA) $4,030,642 Missouri Department of Health and Senior Services Quality Management Administration Housing Administration Linkage to Care Retention in Care Kansas City Health Department Viral Suppression Barnes-Jewish Hospital Foundation Community AIDS Partnership/Design Industries Foundation Fighting AIDS CDC Comprehensive HIV Prevention Programs for Health Departments (P ) City of St. Louis Department of Health $19,000 Washington University Infectious Diseases Clinic $188,000 Kansas City Care Clinic Good Samaritan Project $3,978,273 Missouri Department of Health and Senior Services Emergency Financial Assistance Health Education/Risk Reduction HIV Testing Comprehensive Prevention and Care Services for HIV Positive Individuals and their Partners Condom Distribution Efforts to Align Public Policies to Optimize HIV Prevention, Care, and Treatment HIV Testing Comprehensive Prevention and Care Services for HIV Positive Individuals and their Partners Condom Distribution CDC National HIV Surveillance System (NHSS) (PS ) CDC Comprehensive High-Impact HIV $718,445 Missouri Department of Health and Senior Services $700,000 Community Wellness Project HIV Case Surveillance Data Linkage and Integration to Improve HIV Prevention Program Monitoring and Evaluation Targeted HIV Testing HIV Prevention for HIV- Positive Persons Efforts to Align Public Policies to Optimize HIV Prevention, Care, and Treatment HIV Case Surveillance Data Linkage and Integration to Improve HIV Prevention Program Monitoring and Evaluation HIV Testing Prevention with 48
49 Prevention Projects for Community- Based Organizations (PS ) CDC HIV Prevention Projects for Young Men of Color Who Have Sex with Men and Young Transgender Persons of Color (PS ) Kansas City Care Clinic $298,294 Kansas City Care Clinic HIV Prevention for High-Risk HIV-Negative Persons Condom Distribution HIV and Organizational Planning Pre-Exposure Prophylaxis Comprehensive HIV Prevention Services HIV Testing Comprehensive Risk Counseling Services Condom Distribution Positives Prevention with High-Risk Negatives Condom Distribution Client Recruitment HIV Testing Comprehensive Risk Counseling Services Condom Distribution CDC- Project I Am $323,842 Kansas City Care Clinic HIV Counseling and Testing Services HIV Prevention Services Linkage to Care HIV Testing Condom Distribution Prevention with High Risk Negatives Linkage to Care National Institutes of Health Missouri Foundation for Health $100,000 University of Missouri Kansas City School of Medicine $90,000 AIDS Project of the Ozarks United Way $39,939 Good Samaritan Project AIDS United/Elton $20,000 Kansas City Care John AIDS Clinic Foundation Comer Foundation $10,000 Kansas City Care Clinic HIV prevention education in schools APO Downtown HIV testing and condom distribution Prevention with Positives HIV Testing Condom Distribution HIV Prevention Services HIV Prevention Services Syringe Service Prevention with Programs Positives Syringe Service Programs Prevention with High-Risk Negatives Prevention with Positives Prevention with 49
50 University of Missouri $9,775 Kansas City Care Clinic HIV Testing Research in African American Churches High-Risk Negatives HIV Testing Total Missouri HIV Prevention and Care Funding $78,371,876 *Funded services may vary by organization/region. Additional detail regarding service availability is provided in the TGA-specific tables below. St. Louis TGA HIV Prevention and Care Funding HIV Care Core Services Funding % Outpatient/Ambulatory Medical Care $588, % AIDS Drug Assistance Program $14,335,700 69% Early Intervention Services $215,000 1% Health Insurance Premiums and Cost Sharing Assistance $25,000 <1% Home and Community Based Services $960 <1% Medical Nutrition Therapy $22,995 <1% Mental Health Services $65,960 <1% Medical Case Management, Including Treatment Adherence $3,707, % Oral Health $1,774, % Substance Abuse Outpatient Care $100,000 <1% Subtotal (Core) $20,835,598 71% HIV Care Support Services Funding % Emergency Financial Assistance $1,152,750 28% Food Bank/Home Delivered Meals $448, % Health Education/Risk Reduction $295, % Housing $1,675, % Linguistic Services $1,000 <1% Medical Transportation $113, % Non-Medical Case Management $304, % Other Professional Services $45, % Psychosocial Support Services $70, % Subtotal (Support) $4,107, % Other Funding % Quality Management $668, % Administration $813, % Subtotal (Other) $1,481,440 5% Prevention Services Comprehensive HIV Prevention Services $2,819, % Other HIV Prevention Services $294, % Subtotal (Prevention) $3,113, % Total St. Louis TGA HIV Prevention and Care Funding** $29,478, % **Additional funding generated from 340B Pharmaceutical Rebates will be allocated to allowable service categories/activities based on service needs, gaps, barriers, and priorities. 50
51 Kansas City TGA HIV Prevention and Care Funding HIV Care Core Services Funding % Outpatient/Ambulatory Medical Care $1,419, % AIDS Drug Assistance Program $8,959, Early Intervention Services $40,650 <1% Health Insurance Premiums and Cost Sharing Assistance $798, % Home and Community Based Services $600 <1% Mental Health Services $128,037 <1% Medical Case Management, Including Treatment Adherence $2,493, % Oral Health $481, % Substance Abuse Outpatient Care $185, % Subtotal (Core) $14,507, % HIV Care Support Services Funding % Emergency Financial Assistance $500, % Health Education/Risk Reduction $349, % Housing $2,189,450 68% Medical Transportation $67, % Non-Medical Case Management $112, % Subtotal (Support) $3,218, % Other Funding % Quality Management $421, % Administration $778, % Subtotal (Other) $1,199, % Prevention Services Comprehensive HIV Prevention Services $972, % Other HIV Prevention Services $327, % Subtotal (Prevention) $1,299, % Total Kansas City TGA HIV Prevention and Care Funding** $20,225, % **Additional funding generated from 340B Pharmaceutical Rebates will be allocated to allowable service categories/activities based on service needs, gaps, barriers, and priorities. 51
, with only a small portion of funds being allocated for HIV Prevention services (9%).")
, with the remainder of HIV Care funds designated for Support services (10%), Quality Management (2%), and")
52 Missouri HIV Prevention and Care Funding Distribution The majority of HIV funding in Missouri is allocated for HIV Care services for PLWH (91%), with only a small portion of funds being allocated for HIV Prevention services (9%). Of the funding allocated for HIV Care services, the vast majority is dedicated to the provision of Core medical services (86%), with the remainder of HIV Care funds designated for Support services (10%), Quality Management (2%), and Administration (2%). 52
53 HIV Workforce Capacity The Midwest AIDS Training + Education Center (MATEC) prepared a report of needs and gaps in the HIV clinical workforce for MDHSS to utilize in development of the Integrated HIV Prevention and Care Plan. The report was prepared following the guidelines in the Guidance for the Development of a Regional AIDS Education and Training Center (AETC) Needs Assessment provided by HRSA in November In addition, it included input from all Ryan White grantees in Missouri through a meeting hosted by MATEC in May The Missouri MATEC partner site, Kansas City CARE Clinic, provided data regarding clinical workforce participation in training and identified training needs. As of December 31, 2015, there are persons living with HIV disease in every county in Missouri except two rural counties in Northwest Missouri. As expected, the highest prevalence is in the Kansas City and St. Louis metropolitan areas which are both Ryan White Part A funded areas. There are 12 counties outside these metro areas with prevalence between 26 and 74. There are two counties outside these areas with prevalence of 242 and 412, respectively. Both of these are home to cities with a population greater than 100,000 persons. There are 13 rural counties that have been identified as being at high risk for HIV/HCV with currently low HIV prevalence. There are a total of 139 PLWH in these counties with 13 providers who are reporting CD4 and viral load values. Seven counties have no provider reporting CD4 or viral load values. A total of 352 providers reported CD4 and viral load values. Almost half of these providers are in Jackson or St. Louis counties. In general, the geographic distribution of providers matches the distribution of PLWH in Missouri, although there are clusters of counties in north, central and southern Missouri that have no providers reporting CD4 or viral load values. There are a total of 20 Federally Qualified Community Health Centers/Community Health Centers (FQHC/CHC) operating in Missouri. Most of these Centers are not providing HIV primary care although all do report, according to HRSA s Data Warehouse, conducting HIV testing. All counties with high reported prevalence of HIV have an FQHC/CHC in the county providing HIV care, with the exception of Jasper County, although there is a FQHC/CHC providing HIV care in the neighboring county. 53
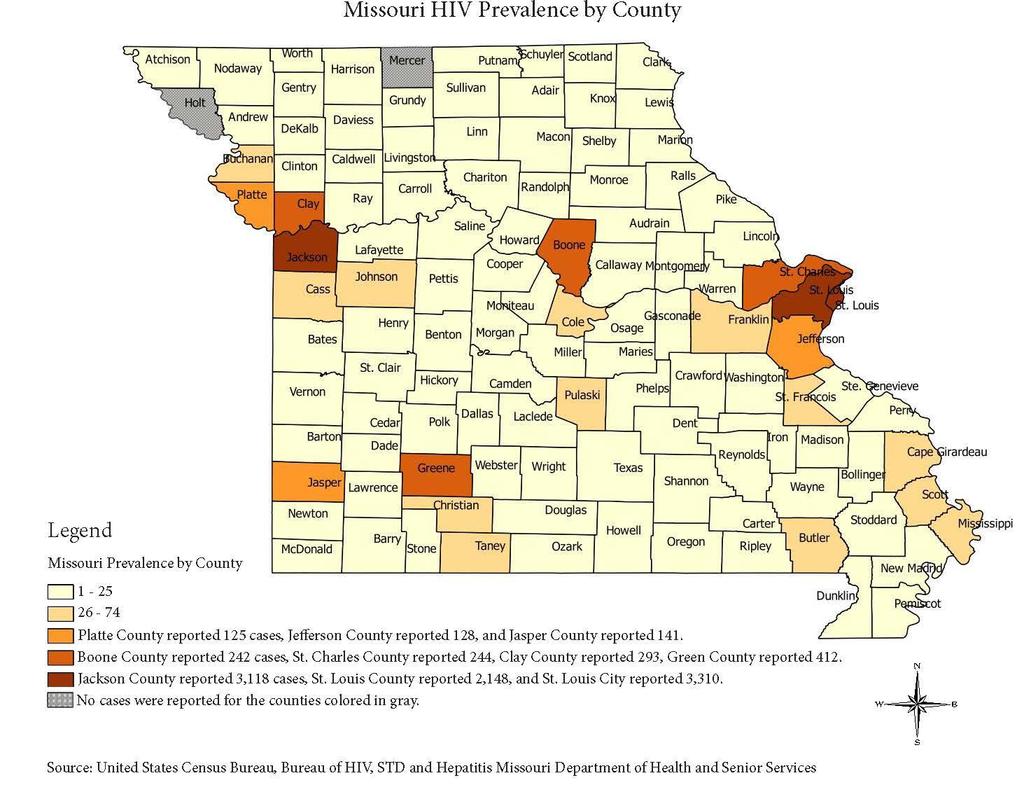
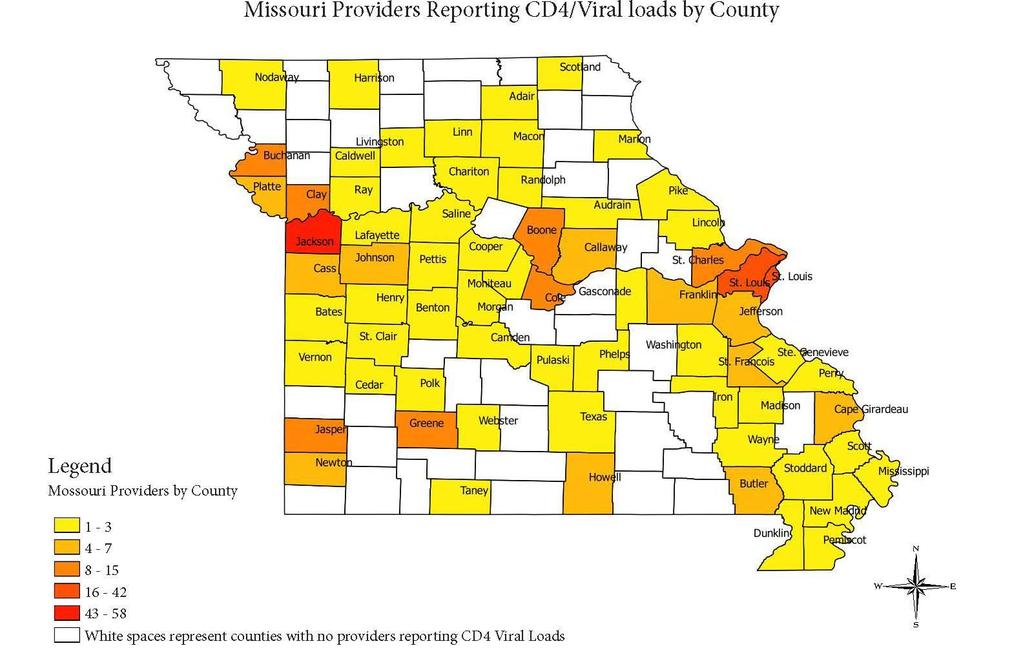
54 54
55 Training needs of the current HIV clinical workforce were identified through questionnaires distributed at MATEC-MO trainings and through the contracted Ryan White Benefits Administrator. The most common training topics identified included PrEP, Treatment as Prevention, Clinical Management of HIV, and Testing/Routine Screening. Additional topics mentioned included Cultural Competence with special populations (transgender clients, LGB, MSM, women), Sexually Transmitted Infections (STIs), Adherence, and Primary Care/Co-Morbidities. Providers in the low prevalence counties, particularly the 13 counties identified as high risk for HIV/HCV, did not participate in these surveys. These counties have a total of 101 physicians with only 13 providing HIV care as determined by those reporting CD4 and viral load labs. Almost half of all physicians and more than half of the reporting physicians are located in one county in the St. Louis region. Training needs of these providers are anticipated to be HIV/HCV routine testing, basic HIV disease/pathology/treatment, referral/linkage to care (including case management and social services), and primary care services for PLWH. Additionally, preparation for an Outbreak Response workgroup and plan is underway at the MDHSSs; MATEC-MO will provide education and capacity building as needed. Missouri, like many other jurisdictions throughout the nation, is mindful of an impending shortage of experienced clinicians due to the aging of the HIV clinical workforce, as discussed in the Institute of Medicine s 2011 HIV Screening and Access to Care examination of workforce needs. This examination estimated that nationally, 33 percent of physicians, 24 percent of pharmacists and 45 percent of nurses will likely reach retirement age by The National Alliance for HIV Education and Workforce Development (NAHWED) made recommendations regarding this issue: The early cohort of experienced HIV-care clinicians, who brought passion and commitment to patients early in the epidemic, entered the field 20 or more years ago and are nearing retirement. As they leave, a service gap will be created, and these providers will need to be replaced with well-educated, skilled clinicians who are able to provide comprehensive HIV care (NAHEWD, 2014, p. 8). Further investigation into retirement and its affects upon the Missouri workforce need to be examined. HIV Case Management Workforce In addition to the clinical provider workforce, Missouri s HIV Care System employs approximately 150 Case Managers who are tasked with meeting the varying needs of PLWH. Case Managers possess wide-ranging knowledge and skills in cultural competency, mental health, substance abuse, risk reduction, treatment adherence, housing support, and HIV related medical care. Case Managers must possess the ability to identify and utilize both Ryan White services and non-ryan White services to assist PLWH with their complex needs to gain and maintain access to needed services. Missouri prioritizes the ongoing training and professional development of Case Managers by offering online orientation and continuing education modules for all Case Managers. Inperson skills building trainings are also provided for all Case Managers to ensure that they maintain current knowledge of medical advancements, resources, and best practices. This initial and ongoing education is critical, as the length of HIV Case Management experience 55
56 for Missouri Case Managers ranges from less than one year to nearly twenty years, with an average of less than five years of experience. Missouri s Case Management System includes both medical and non-medical Case Managers, including a variety of Specialty Case Managers who provide intensive services for PLWH with specific needs. Special Case Management types include: Transitional Case Management- provides specialized re-entry focused services to PLWH who are incarcerated in Missouri Department of Corrections (DOC) facilities to ensure successful transition back into the community, including seamless re-engagement into HIV medical care; services are available for six months prior to release and six months post release from a Missouri DOC facility. Substance Abuse/Mental Health Case Management- intensive case management services for PLWH who require additional assistance due to unmanaged behavioral health conditions. Linkage to Care Case Management- intensive case management services for newly-diagnosed PLWH to ensure successful engagement in HIV medical care. These services are also available to PLWH who have never engaged in care or who were lost to care in some regions. Part D/Youth and Family Case Management- targeted case management services to assist youth and families with successful engagement in HIV medical care and associated supportive services. AIDS Waiver Case Management- available for PLWH with advanced medical needs who require assistance in the home with activities of daily living in order to remain independent and avoid nursing home placement. Resource and Referral Case Management- less intensive services available to PLWH who are able to consistently and independently meet personal and healthcare related needs with minimal assistance; provides limited access to financial services to ensure continued access to HIV medical care. Retention in Care/Lost to Care Case Management- intensive services targeted to PLWH who are at risk for falling out of HIV medical care or who require assistance with re-engagement in care following an extended period of unmet need. These services are typically offered in conjunction with Peer Navigation services. Peer Navigation Workforce Missouri s HIV Care System is working to expand and standardize the utilization of Peer Navigators to compliment the services available through Case Managers. Missouri s HIV Care System currently employs 21 Peer Navigators who are able to provide intensive services from the unique perspective of a PLWH. Missouri s Peer Navigators are currently located in the two metropolitan regions (St. Louis and Kansas City), and are focused primarily on Retention in Care, Lost to Care, Treatment Adherence, and Risk Reduction activities with PLWH who have struggled to maintain consistent engagement in HIV medical care. Peer Navigators work intensively with PLWH to identify and 56
57 resolve persistent barriers to engagement in care, treatment adherence, and/or viral suppression. HIV Prevention/Testing Workforce MDHSS contracts with six organizations throughout the state of Missouri to provide comprehensive HIV, STI and Hepatitis education and testing. These organizations and their subcontractors provide prevention interventions and approved behavioral risk reduction education, targeted to populations at highest risk for HIV. They also provide HIV, STI and Hepatitis C testing for those at risk for HIV. Additionally, MDHSS provides rapid HIV testing kits to the two metropolitan areas, allowing provision of HIV testing in hospital emergency rooms and urgent care centers. Disease Intervention Specialists Missouri s partner services program (PS) includes 28 Disease Intervention Specialists (DIS) who provide follow up on all newly diagnosed HIV and syphilis infections, as well as HIV-positive individuals with a new diagnosis of gonorrhea. DIS also investigate chlamydia and gonorrhea infections diagnosed in children under the age of 12 and assist medical providers with special situations, as requested. Missouri s PS for HIV is integrated with STI PS, which provides the same DIS to assess and refer as appropriate the infected individual to further STI and HIV testing that wasn t conducted during the initial provider encounter. HIV Surveillance Missouri s HIV Surveillance Program monitors and analyzes data on persons infected with HIV disease and identifies and tracks trends in disease incidence. Accurate identification and timely reporting are integral parts of successful disease control. Successful HIV disease surveillance enhances control efforts, such as developing prevention/control strategies and allocating resources for case management and care services. Missouri s HIV Surveillance Program consists of four full-time employees located in MDHSS dedicated to HIV surveillance and data analysis services, as well as seven additional MDHSS staff who assist with surveillance and data analysis activities as needed. In order to conduct HIV surveillance activities within high morbidity jurisdictions, MDHSS has a contractual agreement for HIV surveillance services with the Kansas City Missouri Health Department and the City of St. Louis Department of Health. The Kansas City Health Department employs three part-time employees who implement HIV surveillance activities for the Kansas City metropolitan area. The City of St. Louis Department of Health employs two full-time employees who conduct HIV surveillance activities for the St. Louis City and St. Louis County metropolitan areas. a. Funding Coordination to Ensure Continuity of Services Coordination of HIV Care Funding Missouri s Ryan White Grantees have a long history of collaboration in support of a coordinated and comprehensive service delivery system for PLWH throughout the state. This collaboration ensures access to a high quality, comprehensive, community-based system of care; coordination of funds to reduce duplication of efforts, increase efficiency, 57
58 and maximize resources; and prioritization of services aimed to maximize health outcomes and reduce health disparities for all PLWH in Missouri. Missouri Ryan White Grantees have agreed on funding specific services within their respective regions to avoid duplication and ensure accurate client tracking and expenditures reporting. This coordination and collaboration is consistent with the goals of the Integrated Plan and NHAS, and is achieved through regular, ongoing communication between Grantees and quarterly Missouri Ryan White Grantees meetings. Missouri Ryan White Grantees commitment to ongoing service and funding coordination is formally reflected in a jointly developed Memorandum of Understanding, signed by all Grantees in When possible, Part B supplements limited Part A funding in Missouri s two TGAs to ensure consistent, seamless availability of services for PLWH throughout the state. This coordination has been particularly effective in the administration of Missouri s statewide HIV case management system, ADAP, and Health Insurance Continuation programs. St. Louis TGA Funding Coordination The implementation of the Affordable Care Act (ACA) has yielded substantial cost savings to the St. Louis TGA Ryan White Part A Ambulatory Outpatient and Health Insurance Continuation service categories. Agreements with the state ADAP programs in Missouri and Illinois, in which they fund all insurance premiums and the secondary cost for all medications, medical, and dental services further relieves burden on Part A funds. In 2014, the majority of the reallocated funds were designated to the provision of Oral Health Services, increasing the budget and expected number of clients to be served by approximately 10%. In 2015, funding for Oral Health Services increased by an additional 8% on the Missouri side of the St. Louis TGA. Funding for Oral Health on the Illinois side of the St. Louis TGA decreased in 2015, due to Ryan White Part B funds being allocated to dental services. Increased funds were allocated to Housing Services to increase access to emergency housing and to assist with placement into permanent housing. Due to effective coordination of funding with Missouri and Illinois Part B programs, in FY 2015, the St. Louis TGA was able to allocate funds for the first time in several years to Emergency Financial Assistance to provide relief to clients struggling with heating bills from the unprecedented winter weather of 2013/2014. Kansas City TGA Funding Coordination Funding support and service coordination with the Missouri Ryan White Part B Program has greatly benefited the Kansas City TGA. As a result of 100% support for health insurance premium assistance and cost sharing for the seven Missouri counties in the Kansas City TGA, all Ryan White Part A funds allocated for health insurance support only clients in the four Kansas counties. In addition, the Missouri RW Part B Program provides approximately 40% of the operating budget for the Kansas City TGA Ryan White Case Management System. Ryan White Part A funding allocated to medical case management and Early Intervention Services ends up serving more Kansas clients. Lastly, as the Missouri Ryan White Part B Program expands support for services like oral health, emergency assistance and other services, Kansas City TGA Part A funds will disproportionately serve Kansas clients. 58
59 Coordination of HIV Prevention Funding Missouri s HIV Prevention Program contracts with agencies in each of the six regions in the state to serve as the regional lead agency for prevention efforts including HIV testing and risk reduction activities. Each lead agency is provided with a scope of work that is based on the CDC prevention grant objectives for the entire state and is required to coordinate the development of a regional plan that incorporates the statewide goals and priorities. Coordination with lead agencies ensures core prevention services are implemented in each region across the state while maximizing resources within those areas to address the specific needs and incidence within the region. The advantage of this approach also allows for lessons learned at the local and regional levels to be shared across the state and help influence the statewide plan. b. Description of Resources Needed but Not Currently Available Missouri has a wide variety of resources available to meet the needs of PLWH and those at risk of HIV infection. Additional coordination between HIV prevention and care programs may allow more expansion and maximization of prioritized services. In particular, the following resources and services are inadequate to effectively meet the most pervasive need of PLWH and those at risk of infection: Clinical workforce - Many providers within Missouri s clinical HIV workforce are approaching retirement age, resulting in an impending shortage of knowledgeable clinicians who are able to meet the needs of PLWH. Missouri stakeholders will need to take steps to increase the availability, HIV-specific expertise, and diversity of the state s clinical workforce. PrEP funding - In order to fully utilize PrEP as a key prevention tool for individuals who are at risk of HIV infection, Missouri will need to identify and/or obtain PrEP specific funding to ensure that PrEP is accessible and available. In order to track PrEP utilization and the effectiveness of PrEP promotion and education efforts, Missouri stakeholders will need to explore methods to track the number of individuals seeking and receiving PrEP services. Bilingual Staff - The lack of widespread availability of bilingual staff, particularly Spanish-speaking, to meet the prevention and care needs of PLWH and those at risk of infection impacts Missouri s ability to effectively serve individuals for whom English is not a primary language. The expansion of Missouri s bilingual workforce has been prioritized in Missouri s Integrated Plan strategies and activities. Federally Qualified/Community Health Center Engagement - Although Missouri has a large number of federally qualified and community-based health centers dispersed across the state, the ability to initiate and retain their involvement as community partners and engaged service providers varies widely by region. In areas where engagement has been most challenging, lack of skills and knowledge in HIV/AIDS treatment, capacity-related issues, frequent administrative and staff attrition and stigma related issues have been noted obstacles. As health centers, particularly in urban areas, are generally located in and/or near marginalized communities that are highly impacted by HIV, this is a much needed resource to expand provider 59
60 access to PLWH. Health Literacy - varying and often insufficient levels of health literacy serve as a significant barrier for PLWH and those at risk of infection. In order to ensure that these individuals receive a high level of care according to current standards, consumers of prevention and care services must be educated and empowered to advocate for themselves. Missouri will work to develop educational tools and system-level processes to ensure that individuals who utilize prevention and care service are able to adequately understand the information and/or instructions they receive from providers, and that they are empowered to be active participants in their own healthcare. Insurance Literacy - As more PLWH and those at risk for infection gain insurance coverage as a result of full implementation of the ACA, it is critical that the HIV prevention and care system ensure that these individuals are able to effectively utilize public and private health coverage for which they may be eligible. Because many individuals may begin to access services outside of traditional HIV prevention and care systems, consumer awareness of health coverage benefits, exclusions, and processes will be even more critical. In order to maximize the effective use of all available systems of care, Missouri s prevention and care system will work to develop educational materials to ensure that PLWH and those at risk of infections are able to successfully navigate complex and varying systems of care. D. Assessing Needs, Gaps and Barriers Identification of Service Needs The Integrated Plan Workgroup used multiple strategies to assess the service needs, gaps, and barriers faced by PLWH and those at risk of infection. Efforts were designed to obtain input from PLWH and those at risk of infection, including soliciting consumer participation in the Integrated Plan Workgroup, utilizing a wide variety of needs assessment tools (including surveys, focus groups, and key informant interviews of PLWH, those at risk of infection, clinical providers, and case managers). Results from these needs assessment tools were compiled and analyzed to determine the most commonly cited needs, gaps, and barriers, which are listed in the following tables. Service Needs Identified The following table outlines service needs that were commonly identified by participants throughout Missouri s various Needs Assessment processes. Many of the needs identified reflect new or expanded strategies for Missouri s HIV prevention and care system. These needs were assessed to determine the feasibility and/or level of priority for incorporation in Missouri s Statewide Integrated Plan strategies and activities. Needs not selected for inclusion in the Statewide Integrated Plan will be reviewed through regular regional priority setting and needs assessment processes and may be used to inform regional service planning. Several of the needs identified, particularly those related to HIV care service needs, represent existing services that are available throughout the state. The identification of these services highlights the need to more effectively inform PLWH of available services; this will be an ongoing priority for the HIV Care System. 60
61 Biomedical Interventions Social Marketing Stigma Reduction Expanded HIV Testing Options HIV, STI and Hepatitis Awareness Use of Technology Cultural Competency Condom Distribution and Skills Social Marketing Support Services Core Services Stigma Reduction HIV Prevention Service Needs Identified Increased awareness, education and availability of biomedical interventions including PrEP and PEP Expansion of the use of social marketing to promote testing, condom use, PrEP and other risk reduction messaging; use of social marketing to reduce HIV stigma and discrimination Increased focus/marketing campaigns to reduce HIV related stigma (clinical providers, social service providers, faith community, etc.) Promote opt-out testing in clinical settings; innovative testing options (mobile unit, in-home, non-traditional settings) General awareness and education re: HIV, STIs, and Hepatitis, including targeted efforts for youth, and substance users Expanded utilization of technology (mobile apps, text messaging, etc.) to promote prevention services/messaging Improve the competency and responsiveness of prevention service providers Increase efficacy of existing condom distribution programs with additional focus and education on condom skills (use, negotiation, etc.) HIV Care Service Needs Identified Expand use of social marketing to encourage engagement in HIV medical care; promote availability of various HIV care program services; education on the importance of medication adherence and viral suppression Expand availability of various support services including rental assistance, utility assistance, medical transportation (particularly outside of major metropolitan areas), emergency financial assistance, food bank/home delivered meals, residential substance abuse treatment, etc. Expand availability of various core services including outpatient/ambulatory medical care, oral health care, mental health care, outpatient substance abuse treatment, medical case management, etc. Increased focus and marketing campaigns related to reducing HIV related stigma (clinical providers, social 61
62 Peer Navigators Use of Technology Support Groups Resource Guides Disclosure Support Cultural Competency service providers, faith community, case managers, etc.) Expand use of Peers to assist PLWH with engagement in care, treatment adherence, viral suppression, risk reduction, disclosure, etc. Increased use of technology (text messaging, mobile apps, etc.) for marketing and messaging, appointment reminders, treatment adherence support, etc. Provide additional options for PLWH to participate in psychosocial support groups Increase use of resource guides to inform PLWH about services available within their communities Expand availability of services to equip PLWH with the skills to engage in discussions about disclosure of HIV status, including additional DIS support Increased focus on improving the cultural competency of the HIV prevention and care workforce Service Gaps Identified The following table summarizes the most commonly identified service gaps faced by PLWH and those at risk of infection in Missouri. The majority of these gaps have been incorporated into Missouri s Statewide Integrated Plan and will be addressed by the identified strategies and/or activities. Gaps that have not been prioritized for inclusion in the Missouri Statewide Integrated Plan will be reviewed and addressed at the regional level. PrEP HIV Testing Prevention/Risk Reduction Counseling for PLWH Marketing Campaigns Inadequate Sexual Health Education HIV Prevention Service Gaps Identified Lack of awareness, education and availability of PrEP; including financial assistance to facilitate access to medication and/or associated clinical care Limited adoption of CDC testing recommendations/opt out testing; lack of availability of innovative testing settings (mobile unit, in-home, etc.) Limited availability and/or awareness of prevention with positives activities, education, partner notification, etc. Lack of effective marketing campaigns regarding HIV prevention, risk, PrEP, impact of substance use on risk, etc. Inconsistent sexual health education available, particularly for youth 62
63 Transportation Location of Services Housing Services Behavioral Health Services Vocational Services Toiletries/household items HIV Care Service Gaps Identified Limited availability of access to transportation, particularly for rural PLWH or those who reside and/or access services outside of specific areas within urban centers; lack of transportation for non-medical needs Limited availability of medical and support services outside of metropolitan areas/urban centers Limited availability of emergency and long-term rental and/or utility assistance Lack of access to behavioral health services, including mental health counseling, psychiatry, outpatient substance abuse treatment, residential substance abuse treatment, etc. Limited availability of services to assist PLWH with preparing for and obtaining employment Lack of regular access to toiletries and household items, cleaning supplies, etc. Barriers to HIV Prevention and Care Services The following table summarizes the most commonly identified barriers to HIV Prevention and Care services, as identified during the needs assessment process. Missouri stakeholders will work to mitigate these barriers through implementation of selected Missouri Statewide Integrated Plan strategies and/or activities, as well as through expansion and/or promotion of existing services. Barriers not addressed in the Missouri Statewide Integrated Plan will be reviewed and addressed at the regional level. Social and Structural Barriers Federal, State, or Local Legislative/Policy Barriers Health Department Barriers Barriers to HIV Prevention and Care Services Stigma (external/societal) Poverty Incarceration MO HealthNet Spenddown Inadequate sexual health education (programming varies among schools, abstinence focused, etc.) HIV Criminalization Medicaid non-expansion Statutes pertaining to syringe exchange/possession Limited staff capacity/competing priorities Funding limitations (lack of flexibility, competing priorities, insufficient funding) Staff recruitment/retention (non-competitive wages, political climate, limited advancement opportunities) 63
64 Program Barriers Ryan White Case Management/Services Income Limitations Limited availability of housing assistance Lack of access to relevant data sources/systems Service Provider Barriers Limited availability of bilingual/spanish-speaking prevention and care staff (case managers, DIS, testing staff, etc.) Appointment wait times/scheduling challenges Lack of diversity/cultural competence Limited service provider availability in rural areas (HIV specialty, oral health, behavioral health, testing, etc.) Client Barriers Stigma (internal) Behavioral health needs (mental health/substance use) Transportation Denial (risk, HIV+ status, need for medical care, etc.) Co-occurring conditions Adherence to treatment/medications Homelessness/housing insecurity Sexual abuse/trauma Incarceration Health Literacy Health Insurance Literacy E. Data: Access, Sources, and Systems a. Data Sources and Systems The primary sources of data utilized to inform the Statewide Coordinated Statement of Need (SCSN)/Needs Assessment and HIV Care Continuum portions of Missouri s Integrated Plan include the following: Enhanced HIV/AIDS Reporting System (ehars) A browser-based application provided by the CDC used to collect, manage and report Missouri s HIV/AIDS case surveillance data to CDC. Missouri Health Surveillance Information System (WebSurv) WebSurv is a component of the Missouri Health Strategic Architecture and Information Cooperative. The online application is a centralized and integrated database that allows MDHSS and local public health agency staff the ability to enter and/or update surveillance report information regarding reportable communicable and sexually transmitted diseases. Youth Risk Behavior Surveillance System (YRBSS) Survey - The YRBSS survey is administered by the Missouri Department of Elementary and Secondary Education 64
65 to monitor specific behaviors among high school students that contribute to the leading causes of morbidity and mortality. The students who voluntarily participate in the survey (after local parental permission procedures are followed) constitute a valid sample of high school-age youth. The results may be used to make inferences about the health-risk behaviors of all Missouri public high school students. Behavioral Risk Factor Surveillance System (BRFSS) Survey - The BRFSS survey is an annual population-based, random-digit-dialed, telephone survey of the state s civilian, non-institutionalized, adult population, 18 years of age and older. The survey results are weighted by demographic characteristics and by selection probability, and are used in planning, implementing, and evaluating health promotion and disease prevention programs. For participants 18 years of age and older, the interview includes questions regarding HIV/stage 3 (AIDS)-related behaviors and testing. HIV Testing Database An Access database used to collect information related to HIV tests performed at publicly funded HIV testing sites in Missouri. The data collected include demographic information, behavioral risk information, and previous testing history, among other elements. Evaluation Web - The national CDC mandated reporting system that is used to collect data on HIV testing, Partner Services and Risk Reduction Activities. Testing data is used by the CDC to verify and monitor positivity rates. Risk reduction activity data is used to track implementation of prevention interventions included in the statewide HIV prevention plan. Partner Services data is used to evaluate the outcomes of disease intervention, including the number of patients interviewed and the number of partners elicited through those interviews. Securing Client Outcomes Using Technology (SCOUT) - A centralized client-level database used by Ryan White recipients and subrecipients in the state of Missouri and Kansas for tracking client demographics and utilization, as well as for mandatory data reporting. SCOUT is a web-based software that allows access to real time information. The data application allows system users to collect client demographics, eligibility for services, assessments and surveys, service plans, electronic referrals, documentation of utilization, and internal communication. Provide - A client-level database utilized by the Illinois portion of the St. Louis Part A TGA. Provide is the approved electronic, client-level database for HIV care and prevention services throughout the state of Illinois for entities receiving funds through IDPH. The basic function and purpose of Provide is the collection of client demographic and utilization data to meet reporting requirements. Comprehensive Prevention Planning Group (CPPG) Consumer Survey - This needs assessment survey solicited input from PLWH and those at risk of HIV infection. Survey responses included input from 491 respondents (PLWH=175, High Risk=298, 18 Sero-discordant Couples), representing a variety of diverse backgrounds (race, ethnicity, age, risk factor, etc.). Survey questions focused primarily on prevention-related behaviors and programming. Kansas City TGA 2016 HIV Care and HIV Prevention Needs Assessment - A qualitative study that investigated the needs of PLWH and those at risk of HIV infection, including an examination of barriers to accessing services. Responses 65
66 were gathered through a series of focus groups conducted with members of prioritized target populations. St. Louis TGA 2016 Needs Assessment Summary - This summary includes input compiled from the following surveys and focus groups: 2016 Provider Survey (MO and IL), 2016 Prevention Survey (MO), 2015 Client Survey MO and IL), 2015 Case Manager Survey (MO and IL), 2015 Veterans Survey (MO and IL), 2014 Newly Insured Client Survey (MO), 2014 Client Survey (MO and IL), 2016 Case Management Focus Group (MO and IL), 2014 Youth Housing Needs Focus Group (MO and IL), 2013 Beacon Project Client/Staff Focus Group (MO), 2013 PLWH over 50 Focus Group, and 2013 Psychosocial Support Group Focus Groups. Missouri HIV Case Management Survey- This survey was used to gather input, via focus groups, from Ryan White funded HIV Case Managers regarding ways to improve the delivery of services to PLWH in Missouri. The survey included questions related to Case Manager impressions of the Ryan White system of care, case management services, and the needs of PLWH who utilize these services. Bureau of HIV, STD, and Hepatitis (BHSH) Staff Brainstorming Session Recommendations were solicited from MDHSS/BHSH staff regarding service and programming needs to make progress toward NHAS goals. b. Policies Impacting Needs Assessment Data Missouri is fortunate to have a robust portfolio of data sources from which to gather needs assessment data. Although no specific policies exist that directly impact the availability of data, the following data-related challenges should be noted: Issues regarding reporting: The presence or suspected presence of state reportable diseases/conditions, including HIV and stage 3 (AIDS), is required to be reported to the appropriate local public health agency or to MDHSS by providers as mandated in Missouri s Code of State Regulations, Department of Health and Senior Services, rule 19 CSR ( While reporting by providers is mandated, MDHSS does not have the capacity to ensure that all providers are reporting HIV/AIDS cases or associated lab-work; therefore, it is likely that HIV/AIDS cases and associated lab-work are underreported. At this time, there are no penalties for providers who fail to comply with mandated reporting rules; therefore, it can be difficult for MDHSS to enforce corrective actions for non-compliant providers. Lack of integrated data systems: Timely access to quality data is one of the backbones of an effective surveillance program. The ability to accurately collect and analyze data in a timely fashion is a key part of making correct decisions regarding individual patient care and case management and, on a broader level, making effective programmatic decisions on issues such as prioritizing intervention activities and allocating scarce resources. A key part of the data collection and management process falls into the area of informatics, i.e. the use of information systems and technology to perform the critical tasks of data collection, management, and analysis. 66
67 Currently, different components of HIV/AIDS data are managed within different data systems. HIV care, partner services, surveillance, and testing services are each managed in separate data systems. This lack of data integration makes it difficult to share data among different programs, which impedes the ability to make effective programmatic decisions. Bi-State Data System Variations/Limitations: HIV Care Data - Although SCOUT and Provide are both electronic client-level databases, differences in data field availability, structure of the modules, and reports availability between the two databases can make direct client data comparisons challenging. St. Louis TGA Surveillance Data - Because the St. Louis TGA spans a bi-state region, it can be challenging to get complete St. Louis TGA surveillance data due to delays in obtaining Illinois data in a timely manner. The St. Louis TGA Grants Administrator has met with the Illinois state surveillance manager to negotiate terms for data exchange and a Memorandum of Understanding has been drafted. These meetings should result in accurate and timely reporting of data to create the Continuum, and to assure that community partners have the information they need to target interventions along the HIV Care Continuum. Kansas City TGA Surveillance Data - Some Kansas HIV surveillance data is now unavailable for routine review by Kansas City TGA Grantee and Planning Council. In 2014, KDHE determined that sharing individual-level HIV surveillance data with entities outside the state violated Kansas health data privacy laws. Despite the best efforts of the Grantee and KDHE staff, monthly reporting of HIV surveillance data from Kansas is no longer available. Because the Kansas portion of the Kansas City TGA represents approximately one-fourth of the local epidemic, this lack of data has an impact on local HIV planning activities. The Kansas City TGA Grantee received aggregate Kansas data for the FY 2016 Ryan White Part A application. Discussions with Kansas are ongoing to establish a better system for future reporting of aggregate HIV data. c. Unavailable Data and Information: The data and information sources listed below were not available during the current needs assessment process but would potentially provide valuable insight to inform service planning and assist in the development of Missouri s HIV Care Continuum. Missouri prevention and care partners have prioritized gaining access to the following data/information sources during the course of Missouri s Integrated Plan: Federally Qualified Health Center/Community Health Center (FQHC/CHC) HIV testing, engagement, and viral suppression data MO HealthNet (Missouri Medicaid) HIV testing, engagement, and viral suppression data Veteran s Administration (VA) HIV testing, engagement, and viral suppression data Department of Mental Health/Substance Abuse Treatment Facility demographic, 67
68 risk, and testing data Department of Corrections viral suppression data Comprehensive PrEP usage data Sexually Transmitted Infection data for non-publicly funded sites (multiple infections can serve as a reliable predictor of HIV risk); lack of extra-genital sitespecific data Prescription Drug Monitoring Program (PDMP) data - Missouri does not currently have a PDMP which could be utilized to monitor intravenous drug use associated HIV risk Statewide antiretroviral (ARV) prescribing data - Missouri s HIV Care Continuum does not include data related to ARV prescription rates; this information is currently only available for PLWH accessing Ryan White program funded ARVs Section 2: Integrated HIV Prevention and Care Plan A. Integrated HIV Prevention and Care Plan - Goals, Objectives, Strategies, Activities, and Resources The tables below provide an overview of the goals, objectives, strategies, and activities that Missouri stakeholders have agreed to prioritize for inclusion in the Missouri Statewide Integrated HIV Prevention and Care Plan. The items contained in the following tables are not inclusive of all Missouri HIV Prevention and Care objectives, strategies, and activities currently utilized or planned, but rather represent a concerted effort among all stakeholders to impact specific components and outcomes within Missouri s system. Because Missouri has opted to focus primarily on system-level change, items included below are intended to impact all populations, unless otherwise specified. Specific target/priority populations are noted where applicable. Goal #1: Reducing New HIV Infections Obj. 1A: By 2021, implement a multilevel approach in each region to increase the number of Missouri testing sites that concurrently offer HIV, STI, and Hepatitis screening by 25%. Strategies Activities Data Indicators 1A-1. Implement clinic based, social network, couples, and outreach testing, coupled with counseling as appropriate 1A-2. Identify, co-brand and implement an evaluated campaign on Explore the availability of social network and couples testing to include additional regions/populations where appropriate Explore statewide and regional priority testing populations to ensure all high-risk populations are addressed 68 Number of HIV, STI, and Hepatitis testing sites Number of sites offering clinic based, social network, couples, and outreach testing Number of anti-
69 reducing stigma related to testing in each of the six HIV Care/Prevention Planning Regions 1A-3. Ensure that HIV testing venues, as appropriate, will concurrently offer or provide referrals for STI and HCV testing, as well as HAV, HBV and HPV vaccinations Promote opt out testing among high-volume providers across Missouri Facilitate technical assistance for testing providers as needed to implement third party billing Educate general practitioners on recommendations for routine screening Provide education regarding full coverage of annual HIV, STI, and Hepatitis screening as part of ACA-required preventive care coverage Promote streamlined access to testing in clinical and non-clinical settings Expand technology-based options for accessing testing locations and events (with an emphasis on free testing sites) Explore ways to decrease testing stigma and other barriers to testing via various traditional and social marketing strategies Increase the number of bilingual/spanish-speaking testing providers Ensure availability of testing services to non-english speaking populations Promote collaboration among testing providers for large scale outreach events Collaborate with the MDHSS Bureau of Immunizations to create a directory of providers offering HAV, HBV, and HPV vaccination Create formal process to refer individuals who present for HIV testing to immunization providers Explore partnerships with external stakeholders to 69 stigma campaigns implemented Number of campaign materials distributed, if applicable Number of testing sites with bilingual/spanishspeaking testers Number of general practitioners who receive education about preventive testing coverage
70 implement testing in new settings Resources: HIV Prevention workforce; HIV Prevention Consumers; PS and future HIV Prevention funding; Hepatitis and STI prevention workforce; Immunizations program workforce Responsible Parties: State and Local HIV Prevention Program Coordinators Applicable HHS Core and/or NHAS Indicator(s): HIV Positivity - number of HIV positive tests in the 12 month measurement period (HHS Core) Increase the percentage of people living with HIV who know their serostatus to at least 90 percent (NHAS) Obj. 1B: By 2021, increase PrEP utilization by 25% (based on December 2016 baseline). Strategies Activities Data Indicators 1B-1. Implement statewide and/or regional marketing campaigns to the highest risk communities, promoting PrEP and its benefits, how to access PrEP, and addressing issues of stigma in utilizing PrEP 1B-2. Provide training and education to service providers regarding how to promote, educate and refer at-risk individuals to PrEP services to reduce infection 1B-3. Maintain and promote a statewide directory of PrEP providers and PrEP pharmacies Promote Provider Education (including FQHCs/CHCs) and Community PrEP Education Develop, maintain, and distribute PrEP Provider Directory Ensure availability of Missouri and region-specific PrEP payer source information Implement marketing campaigns to promote PrEP Identify and Promote Models for Linkage to PrEP Solicit and/or collect data on PrEP utilization in Missouri Conduct periodic surveys of clinical providers to assess PrEP knowledge and education needs Conduct periodic surveys of existing and potential PrEP users to assess PrEP knowledge and education needs Ensure PrEP marketing, education, and resource materials are available in Spanish Ensure provision of PrEP informational material with other prevention activities Develop processes to ensure referral of individuals for whom PrEP is not appropriate to other prevention services (condoms, PEP, etc.) 70 Number of providers who are educated about PrEP Number of PrEP marketing campaigns implemented Number of campaign materials distributed, if applicable Number of individuals referred to and linked to PrEP Number of individuals prescribed PrEP Number of provider surveys distributed/ completed Number of PrEP consumer/potential consumer surveys distributed/ completed Number of PrEP materials available in Spanish
71 Resources: HIV Prevention workforce; HIV Prevention consumers; PS and future HIV Prevention funding; MATEC; PrEP Taskforce Responsible Parties: State and local HIV Prevention Program Coordinators; MATEC-MO Coordinator Applicable HHS Core and/or NHAS Indicator(s): Reduce the number of new HIV diagnoses by at least 25 percent (NHAS) Obj. 1C: By 2021, increase the percentage of Missourians with diagnosed HIV infection who are virally suppressed from 53% (2015 baseline) to at least 65%. Strategies Activities Data Indicators 1C-1. Implement statewide and/or regionally based social marketing campaign to educate PLWH on the benefits of treatment adherence and viral suppression, including information regarding how to access HIV Care services 1C-2. Ensure all Prevention Outreach, Linkage to Care, Retention In Care, Lost to Care, and Peer Navigation staff are trained in motivational interviewing and effective approaches to promote medication adherence and viral suppression 1C-3. Ensure each Care/Prevention planning region has sufficient staff (including retention in care, lost to care, and peer navigation staff) to assist clients in staying in care and being medically adherent Utilize Peer Navigators to assist in the suppression of viral loads Identify, adapt, and distribute cobranded national materials Expand technology based options for promoting resources related to linkage and re-engagement in HIV care Educate health providers, including FQHCs/CHCs and hospitals about how to refer PLWH to Missouri s HIV Care system, when needed Provide education and/or consultation opportunities for health providers outside of the Ryan White system Continue and expand quality improvement activities aimed at increasing viral suppression rates Examine viral suppression rates among specific populations (ex: youth, persons who inject drugs (PWID), etc.; implement targeted QI activities as appropriate Explore performance based incentives for clinical providers Expand availability of Retention in Care and Lost to Care programs Increase availability of treatment adherence education Promote importance of viral suppression as both a healthpromoting and prevention 71 Number/ percentage of PLWH who are virally suppressed Number of viral suppression materials developed and distributed Number of providers who are provided HIV Care system referral information Number of providers who receive education and/or consultation regarding HIV Clinical Care Number of staff trained in motivational interviewing Number of staff employed Number of sites implementing QI activities Viral Suppression rates for sites implementing QI activities
72 1C-4. Implement and/or strategy continue QI activities aimed at increasing rates of viral suppression among PLWH Resources: HIV Care workforce (including Peer Navigators); HIV Care consumers; Ryan White Quality Improvement Team; HIV Prevention workforce; FQHC/CHC workforce Responsible Parties: Ryan White Grantees; MATEC-MO Coordinator Applicable HHS Core and/or NHAS Indicator(s): Viral Load Suppression Among Persons in HIV Medical Care - number of persons with an HIV diagnosis with a viral load <200 copies/ml at last test in the 12 month measurement period (HHS Core) Increase the percentage of persons with diagnosed HIV infection who are virally suppressed to at least 80 percent (NHAS) Increase the percentage of youth and persons who inject drugs with diagnosed HIV infection who are virally suppressed to at least 80 percent (NHAS) Obj. 1D: By 2017, ensure that 100% of prevention partner agencies implement High Impact Prevention activities in accordance with the Missouri Comprehensive Prevention Plan. Strategies Activities Data Indicators 1D-1. Expand efforts to prevent HIV infection using a combination of effective, evidence-based approaches 1D-2. Design and evaluate innovative prevention strategies and combination approaches for preventing HIV infection in high-risk populations and communities 1D-3. Expand prevention efforts that are tailored to persons living with HIV Include condom skills as a component of prevention activities Continue and/or expand condom distribution (traditional and as a structured intervention) Prevention with Positives Promote the importance of viral suppression as a prevention strategy Provide training for prevention staff that equips them to support PLWH engagement in care Explore and consider implementation of innovative prevention strategies 72 Number of individuals who receive education regarding condom skills Number of condoms distributed Number of Prevention with Positives interventions implemented/ number of participants served Number of prevention staff who receive training to promote engagement in care Resources: HIV Prevention workforce; HIV Prevention consumers; HIV Care workforce; PS and future HIV prevention funding; Hepatitis and STI Prevention workforce Responsible Parties: State and Local HIV Prevention Program Coordinators Applicable HHS Core and/or NHAS Indicator(s): Reduce the number of new HIV diagnoses by at least 25 percent (NHAS)
73 Reduce the percentage of young gay and bisexual men who have engaged in HIV-risk behaviors by at least 10 percent (NHAS) Goal #2: Increasing Access to Care & Improving Outcomes for People Living with HIV Obj. 2A: By 2021, increase the percentage of newly diagnosed persons linked to HIV medical care within one month of their HIV diagnosis from 69% to 79%. (Increase percentage linked within 90 days from 81% to 85%) Strategies Activities Data Indicators 2A-1. Establish seamless systems to link people to care immediately after diagnosis 2A-2. Establish standard monitoring and evaluation processes to assess effectiveness of linkage to care systems throughout the state. 2A-3. Support and strengthen capacity to implement innovative and culturally appropriate models to more effectively link newly diagnosed PLWH to care. Adapt and expand successful Linkage to Care programs throughout the state Assess the efficacy of Missouri s current Linkage to Care approach, including evaluation of outcomes of current programs Expand testing and clinical provider awareness of Linkage to Care services expedite referral and connection to medical care services Ensure Linkage to Care programs are responsive to the needs of disproportionately impacted and emerging populations Expand use of Early Intervention Services (EIS) model to engage PLWH in care 73 Number and percentage of PLWH linked to care within 30 days/90 days Linkage to Care rates for PLWH receiving Linkage to Care specialty case management vs. overall Linkage to Care rates Number of testing/ clinical sites who receive information regarding Linkage to Care services Resources: HIV Prevention workforce (including testing and partner services staff); HIV Care workforce; HIV Prevention and Care consumers; HIV Surveillance workforce; Ryan White program funding Responsible Parties: Ryan White Grantees Applicable HHS Core and/or NHAS Indicator(s): Linkage to HIV Medical Care - number of persons who attended a routine HIV medical care visit within three months of HIV diagnosis (HHS Core) Increase the percentage of newly diagnosed persons linked to HIV medical care within one month of their HIV diagnosis to at least 85% (NHAS) Obj. 2B: By 2021, increase the percentage of persons with diagnosed HIV infection who are retained in HIV medical care from 50% to 70%. Strategies Activities Data Indicators 2B-1. Establish seamless systems to support Identify improvements and assess efficacy of existing Number and percentage of PLWH
74 retention in care to achieve viral suppression to reduce transmission risk. 2B-2. Establish standard monitoring and evaluation processes to assess effectiveness of retention in care systems throughout the state. 2B-3. Support and strengthen capacity to implement innovative and culturally appropriate models to more effectively retain PLWH in care. Retention in Care and Lost to Care programs Leverage surveillance data to determine subpopulations who are disproportionately not retained in and/or lost to care Identify factors that influence retention among subpopulations of PLWH Ensure Retention in Care and Lost to Care programs are responsive to the needs of disproportionately impacted and emerging populations Identify and address barriers to continued engagement in care Implement quality improvement activities aimed at improving retention of PLWH in care Educate providers on Missouri reporting requirements with respect to all reportable conditions Support, strengthen and expand capacity to implement innovative and culturally appropriate models to more effectively deliver care along the care continuum Review eligibility criteria and enrollment processes for Ryan White services to determine if any changes can be made to improve retention in care 74 who had at least one medical visit in each six month period of the 24-month measurement period with a minimum of 60 days between the first medical visit in the prior six month period and the last medical visit in the subsequent six month period Number and percentage of PLWH who did not have an HIV medical visit in the last six months of the measurement year Number and percentage of PLWH who are retained in care Resources: HIV Care workforce; HIV Prevention and Care consumers; HIV Surveillance workforce; HIV Partner Services workforce; Ryan White program funding; Ryan White Quality Improvement Team Responsible Parties: Ryan White Grantees Applicable HHS Core and/or NHAS Indicator(s): Retention in HIV Medical Care - number of persons who had at least one HIV medical care visit in each 6 month period of the 24 month measurement period, with a minimum of 60 days between the first medical visit in the prior 6 month period and the last medical visit in the subsequent 6 month period (HHS Core) Increase the percentage of persons with diagnosed HIV infection who are retained in HIV medical care to at least 90 percent (NHAS)
75 Goal #3: Reducing HIV Related Health Disparities & Health Inequities Obj. 3A: By 2021, ensure that 100% of HIV prevention and care partner agencies will be trained in approaches to reduce stigma and increase cultural competency related to HIV status, race, gender identity, sexual orientation, and socio-economic status. Strategies Activities Data Indicators 3A-1. Develop an array of approaches that explore the relationship between HIV status and stigma which engage community dialogue 3A-2. Identify and promote strategies to reduce stigma and improve cultural competency related to HIV status, race, sexual orientation, gender identity, and socioeconomic status in clinical, care and prevention settings. 3A-3. Promote campaigns and initiatives in the faith community to reduce HIV stigma and promote engagement in HIV Care. Increase awareness of HIV criminalization laws and national efforts to repeal, including potential public health implications of the laws Expand Faith Based approaches to reduce HIV stigma and promote engagement in HIV prevention and care Incorporate PLWH and at-risk persons in the development and implementation of structural approaches to reduce stigma and discrimination related to HIV status, gender identity, sexual orientation, race, etc. Provide training related to Culturally and Linguistically Appropriate Services (CLAS) Standards Incorporate training for prevention and care providers on comorbidities, trauma informed care, and intersectionality Develop and expand programs that address HIV status disclosure 75 Number of agencies who receive training to reduce stigma and increase cultural competency Number of antistigma/engagement in care campaigns/ initiatives developed and promoted to the faith community Number of campaigns/ approaches developed with input from PLWH/ at-risk individuals Number of staff receiving CLAS Standard training Number of providers who receive training on comorbidities, trauma informed care, intersectionality, etc. Number of programs developed that address status disclosure Resources: HIV Care workforce; HIV Prevention workforce; HIV Prevention and Care consumers; Ryan White program funding; PS and future HIV Prevention funding; CLAS Standards Responsible Parties: Ryan White Grantees; State and Local HIV Prevention Program Coordinators Applicable HHS Core and/or NHAS Indicator(s):
76 Reduce disparities in the rate of new diagnoses by at least 15 percent in the following groups: gay and bisexual men, young black gay and bisexual men, black females, and persons living in the Southern United States (NHAS) Obj. 3B: By 2021, improve outcomes across the HIV Care Continuum among young black MSM, ages (YBMSM) as follows: Increase the HIV testing positivity count among YBMSM by 20% (from 71 to 85 individuals identified annually) Increase the percentage of YBMSM linked to HIV medical care o within 30 days: from 69% to 79% o within 90 days: from 72% to 85% Increase the percentage of YBMSM retained in HIV medical care from 49% to 70% Increase the percentage of YBMSM who are virally suppressed from 52% to 65% Strategies Activities Data Indicators 3B-1. Develop Data to Care models that help further define gaps in testing and care for the young black MSM population. 3B-2. Give priority to implementing a multilevel, coordinated prevention and care strategy that addresses key social determinants of health that impact access to prevention, testing, and care services in those areas identified by the data to care model 3B-3. Conduct targeted social marketing campaigns in identified areas promoting testing, care services, stigma reduction, and condom access 3B-4. Research and implement programs and models to promote optimum health Implement strategies to more effectively target YBMSM communities for prevention and testing activities Improve provider awareness of the connection between rectal STI screening and HIV seroconversion Expand the availability of rectal STI testing among YBMSM Expand utilization of Social Network and Express testing among the YBMSM population Provide education regarding data to care and its application for prevention and care activities Improve recruitment of YBMSM who may be able serve as peers to more effectively reach the YBMSM population Identify and reduce barriers to accessing prevention and care services among the YBMSM population, including hours of service, location, cost, etc. Research models that incorporate trauma-informed care into prevention and care programs serving YBMSM Engage YBMSM in program planning and quality 76 HIV positivity rate among target population Linked to care rate among target population Retention in care rate among target population Viral suppression rate among target population Number of targeted social marketing campaigns implemented Number of YBMSM serving as peers Number of programs/ QI activities developed with YBMSM input
77 outcomes for HIV+ and improvement activities high risk youth of color. Resources: HIV Care workforce; HIV Prevention workforce; HIV Prevention and Care consumers; HIV Surveillance workforce; Ryan White Program funding Responsible Parties: Ryan White Grantees; State and Local HIV Prevention Program Coordinators Applicable HHS Core and/or NHAS Indicator(s): Reduce disparities in the rate of new diagnoses by at least 15 percent in the following groups: gay and bisexual men, young black gay and bisexual men, black females, and persons living in the Southern United States (NHAS) Goal #4: Achieving a More Coordinated (State) Response to the HIV Epidemic Obj. 4A: By 2018, establish coordinated statewide HIV, STI, and Hepatitis Prevention and Care Planning processes. Strategies Activities Data Indicators 4A-1. Promote resource allocation that has the greatest impact on achieving NHAS goals. 4A-2. Ensure coordinated program planning and administration. 4A-3. Establish ongoing workgroup to drive, monitor, and report on progress toward achieving goals, objectives, strategies, and activities outlined in the Missouri Statewide Integrated HIV Prevention and Care Plan. Coordinate needs assessment efforts across care and prevention Improve coordination and/or integration of prevention and care staff roles and activities (no wrong door approach) Convene workgroup, including regional, care, and prevention representation to implement and monitor integrated plan 77 Number of goals, objectives, strategies, and activities monitored by workgroup for desired progress Resources: HIV Care workforce; HIV Prevention workforce; HIV Prevention and Care consumers; HIV Surveillance workforce; Ryan White program funding; PS and future HIV prevention funding Responsible Parties: Ryan White Grantees; Ryan White Planning Councils; State and local HIV Prevention Program Coordinators Applicable HHS Core and/or NHAS Indicator(s): No directly applicable indicator, though successful implementation of the strategies
78 listed above is expected to positively impact multiple indicators Obj. 4B: By 2021, streamline and maximize coordination of data by establishing linkages between data systems that contain data relevant to the effective delivery of prevention and care services. Strategies Activities Data Indicators 4B-1. Strengthen the timely availability and use of data. 4B-2. Strengthen coordination across data systems and the use of data to improve health outcomes by establishing linkages to relevant data systems (including, but not limited to HIV/STI/HCV testing, HIV prevention, HIV surveillance, DIS, HIV Care, MO HealthNet Division/MO Medicaid, Department of Mental Health, housing, VA, etc.) Streamline processes for clients to access services Increase availability of electronic eligibility determination Develop user-friendly, visually appealing reporting on plan progress Coordinate prevention and care data across funding streams when possible Establish connections with MO HealthNet Division/MO Medicaid, Department of Mental Health, housing providers and VA Number of additional data systems available for prevention and care planning and monitoring efforts Number of new partnerships established with non-traditional stakeholders Number of reports/ updates provided regarding integrated plan progress 4B-3. Provide regular public reporting on data and progress toward meeting Integrated Plan goals. Resources: HIV Care workforce; HIV Prevention workforce; HIV Surveillance workforce; PS and future HIV prevention funding; Non-traditional stakeholder Responsible Parties: Ryan White Grantees; Ryan White Planning Councils; State and Local HIV Prevention Programs Coordinators Applicable HHS Core and/or NHAS Indicator(s): No directly applicable indicator, though successful implementation of the strategies listed above should positively impact multiple indicators e. Describe any anticipated challenges or barriers in implementing the plan Missouri anticipates facing challenges in determining appropriate metrics to monitor strategies and activities that were selected based on information gathered through the needs assessment process. Because many of these strategies and activities are focused on system level interventions as opposed to individual consumer level interventions, it may be 78
79 challenging to directly correlate some approaches to HHS Core Indicators and NHAS Indicators. Additionally, obtaining participation and engagement from healthcare providers may be a challenge to the successful implementation of the Missouri Statewide Integrated Plan. Healthcare for PLWH in Missouri occurs through a vast network of private healthcare providers. This often makes it challenging to mobilize providers around a common goal. Determining how to more effectively coordinate prevention and care funding to ensure needs are met is another anticipated challenge. With multiple agencies including community agencies and local/state governments receiving funding for, at times, overlapping goals and objectives, it is a challenge to ensure coordination at both the local and state level. Finally, Missouri is committed to more effectively engaging PLWH, particularly those outside of the Ryan White system, as well as individuals at risk of HIV infection, in a meaningful, sustained manner in plan implementation and revision. While some formal systems exist to solicit PLWH and consumer input, additional work will be needed to ensure that the critical insight of impacted communities is adequately reflected in Missouri s activities. B. Collaborations, Partnerships, and Stakeholder Involvement a. Contributions of stakeholders and key partners to the development of the plan Missouri HIV Prevention and Care Partners began the Integrated Plan development process with a series of discussions in fall 2015 with a variety of stakeholder groups throughout the state. Stakeholders include, but are not not limited to Ryan White Grantees and Part A Planning Councils, directly funded and subcontracted CDC HIV Prevention programs, statewide and regional prevention planning groups, HIV surveillance staff, and HIV prevention and care program consumers. Through these discussions, Missouri stakeholders agreed to develop and submit a Statewide, Integrated State/City HIV Prevention and Care Plan in order to reflect the most comprehensive approach to the provision and improvement of prevention and care services within the state. Stakeholders tasked MDHSS, BHSH with facilitating the Integrated Plan development process. This was accomplished through the work of the Integrated Plan Workgroup, which began meeting regularly in November This group was created collaboratively by Ryan White Grantees, Statewide CPPG members, and both Part A Planning Councils in order to ensure that Missouri made progress toward the development and submission of the Integrated Plan. Workgroup members worked collaboratively on the development of many sections of the Integrated Plan, with individual members and stakeholders developing initial drafts of various Integrated Plan components for review, revision, and approval by all workgroup 79
80 members. The MDHSS Bureau of Reportable Disease Informatics (BRDI) prepared the Epidemiologic Overview and HIV Care Continuum portions of the plan. Ryan White Part A Planning Councils from each TGA and CPPG took the lead on Needs Assessment activities and ensured input and participation from PLWH and consumers in identifying needs, gaps, barriers, strategies, and activities to be included in the plan. Ryan White Part C Grantees, in collaboration with MATEC and the Contracted Benefits Administrator gathered and compiled input from clinical providers who serve PLWH in Missouri to inform the Integrated Plan from the healthcare perspective. Progress on the development of Missouri s Integrated Plan was communicated regularly to stakeholders throughout the plan development process. Updates were provided during quarterly CPPG and Ryan White Grantees meetings, and plan drafts were shared during various phases of the development period. Each update offered an opportunity for stakeholders to provide input or feedback on the direction and priorities of the plan. b. Stakeholders and partners not involved in the planning process who are needed to improve outcomes Missouri has identified several partners who will play crucial roles in the successful implementation of many of the strategies and activities included in the plan. Among these critical partners are the Missouri Department of Mental Health, Missouri DOC, Missouri Department of Social Services/MO HealthNet Division, VA, and statewide FQHCs/CHCs. While the majority of these organizations were not actively included in the development of the Integrated Plan, an opportunity for review of the final draft was provided to representatives of many of these organizations. Missouri plans to engage these additional stakeholders in implementation of plan, and will solicit participation in ongoing Integrated Plan Workgroup activities. c. Letters of concurrence- Letters of concurrence in support of Missouri s Statewide Integrated HIV Prevention and Care Plan were obtained from the following stakeholders: Missouri Comprehensive Prevention Planning Group Kansas City TGA Planning Council St. Louis TGA Planning Council Missouri Statewide Ryan White Grantees Group C. People Living with HIV and Community Engagement The Integrated Plan Workgroup sought several ways to include PLWH and those at risk of infection in the development of the plan. Efforts were designed to ensure broad participation both on the workgroup, as well as through consumer membership of various stakeholder groups. 80
81 Missouri s CPPG has more than 30 members in regular attendance, including approximately 26% members who are living with HIV. CPPG took the lead on the design and distribution of the statewide needs assessment survey that was used to solicit consumer input for the SCSN/Needs Assessment section of Missouri s Integrated Plan. The initial survey was reviewed by each of the six Regional Prevention Planning Groups, all of which include PLWH, for feedback and input on survey design and content. Of the 491 persons who completed the surveys, 193 persons were living with HIV (39%); 58% were persons of color (51% were black/african American). These participants represented each of the six Care/Prevention planning regions of the state, which offered the opportunity to examine any differing needs of PLWH and prevention consumers residing in urban, minor metropolitan, and predominantly rural areas of the state. Survey results were compiled and presented to CPPG in June, 2016 for regional prioritization of populations, services, and activities to be addressed within Missouri s Integrated Plan. These priorities were provided to the Integrated Plan Workgroup for incorporation into in plan objectives, strategies and activities. Further input was sought from the St. Louis Prevention and Care subcommittee, the Integrated Kansas City TGA Planning Council, and through a conference call with the statewide Prevention and Care Workgroup, all which include PLWH membership. Additionally, Needs Assessment subcommittees from both Part A Planning Councils conducted needs assessment activities that assisted in informing the plan s strategies and activities. Participants in each of the groups and committees described above represent both professionals working in HIV services and community members living with and/or affected by HIV. Feedback from these sessions was then shared during the Integrated Plan Workgroup meeting and many of the suggestions were incorporated into the draft plan. The Integrated Plan Workgroup includes limited PLWH representation, though efforts to engage additional PLWH during the Integrated Plan development phase proved to be more challenging than anticipated. Missouri will prioritize the inclusion of a larger percentage of PLWH and those at risk of infection in ongoing plan implementation to ensure that strategies and activities continue to meet the needs of communities most heavily impacted by HIV. Official approval of Missouri s Integrated Plan was obtained through concurrence votes and corresponding Letters of Concurrence from the following stakeholder groups, all of which include active participation of PLWH and those at risk of infection: Comprehensive Community Planning Group Missouri Ryan White Grantees Group Kansas City TGA Planning Council St. Louis TGA Planning Council 81
82 Section III: Monitoring and Improvement a. Process for regularly reporting progress on the plan and plan improvement, and communicating to stakeholders and engaging their feedback The Integrated Plan Implementation Workgroup will meet semi-annually to review progress on implementation of the Missouri Statewide Integrated Plan. Stakeholders responsible for individual plan components will submit reports outlining progress made towards implementing applicable components of the Plan. Reports will include both qualitative and quantitative information. The qualitative portion of the report will describe successes, challenges and plans to address goals and/or objectives, and will document any substantial changes to the plan with an explanation about the need for such changes. The quantitative portion of the report will include numeric findings and task accomplishments as outlined below. The progress report will be submitted to the Integrated Plan Implementation Workgroup twice a year through the duration of the Plan. The Integrated Plan Implementation Workgroup will review all submitted progress reports and will make recommendations to the respective planning bodies and parties identified in Section II of the Integrated Plan. The co-chairs of the Integrated Plan Implementation Workgroup will be responsible for communicating these decisions and recommendations to the responsible parties/planning bodies. Each Prevention and Care Planning Body in Missouri includes key providers, consumers and stakeholders in the jurisdiction. Facilitators of these groups will provide regular updates to their planning groups on progress, changes, recommendations/direction for implementation of the Integrated Plan. These bodies represent the primary mechanism through which feedback on the plan and its progress will be gathered. The Integrated Plan Implementation Workgroup will request that each prevention/care planning body submit a communication plan for Integrated Plan Implementation Workgroup review by October 2017 describing how the plan, its progress and other relevant information is to be communicated to their respective providers, consumers and stakeholders on an annual basis at minimum. b. Monitoring and evaluation of the Goals and SMART objectives Per the design of the Missouri Statewide Integrated Plan, the goals are attained through the implementation of the SMART objectives, supported by the specific strategies and activities under each objective. The process to determine if implementation of objectives is progressing appropriately will be conducted as follows: For Goals 1 3 specific numeric targets will be established for each objective on an annual basis throughout the time period covered by the plan ( ), which cumulatively will accomplish each goal and its respective SMART objectives. Targets will be adjusted annually, as appropriate, to assure the objective is met by the final target date in the plan. 82
83 For each year covered by the plan, the specific strategies and activities that were utilized to reach the numeric goal will be documented. For Goal 4, specific tasks will be established for each year covered by the plan to ensure the objective is met by the target date identified in the objective. For each of the plan years, the specific strategies and activities that were utilized to complete the specified tasks will be documented and described. c. Describe strategy to utilize surveillance/program data to assess/improve health outcomes along HIV Care Continuum Ongoing analysis of surveillance and program data will be used to develop strategies to reduce new infections and to assess health outcomes along the HIV Care Continuum. Additionally, this data will be used for program planning purposes, particularly to inform decisions regarding ongoing prioritization of programs, strategies, populations, and geographic regions. Surveillance and program data will be reviewed by the Integrated Plan Implementation Workgroup and other stakeholders, as appropriate, to assess the efficacy of various strategies, as well as to determine any adjustments needed to improve outcomes at each stage of the Continuum. Data will be used to focus efforts on populations who are experiencing disparate outcomes along the Continuum, as well as to conduct case finding activities to re-engage PLWH who are lost to care or who have never engaged in care following HIV diagnosis. HIV Care Program stakeholders will continue to utilize surveillance and program data to inform QI activities related to viral suppression. If possible, HIV Care Program staff will collaborate with DSS and DOC staff to promote the adoption of similar QI activities to improve rates of viral suppression among PLWH who access services exclusively through DSS or DOC. 83
84 Appendix A 84
85
86
87
88
89 September 7, 2016 HIV/AIDS Bureau Health Resources and Services Administration 5600 Fishers Lane Mail Stop 09SWH03 Rockville, MD Attn: Katherine Patterson, Division of State HIV/AIDS Programs Zaynab Major, Division of Metropolitan HIV/AIDS Programs Dear Colleagues: The Missouri Statewide Ryan White Grantees Workgroup concurs with the following submission by the Missouri Department of Health and Senior Services, the Kansas City Department of Health, and the City of St. Louis Department of Health in response to the guidance set forth for health departments and HIV Planning Groups funded by the CDC s Division of HIV/AIDS Prevention (DHAP) and HRSA s HIV/AIDS Bureau (HAB) for the development of an Integrated HIV Prevention and Care Plan. Missouri Grantees have reviewed the Missouri Statewide Integrated HIV Prevention and Care Plan submission to the CDC and HRSA to verify that it describes how programmatic activities and resources are being allocated to the most disproportionately affected populations and geographical areas that bear the greatest burden of HIV disease. The Missouri Ryan White Grantees Workgroup concurs that the Missouri Statewide Integrated HIV Prevention and Care Plan submission fulfills the requirements set forth by the funding opportunity Announcement PS and the Ryan White HIV/AIDS Program legislation and program guidance. Missouri Grantees provided significant input regarding Missouri s Integrated Plan and were provided drafts of the plan throughout its development. Additionally, several Grantees participated on the Integrated Plan Workgroup, which was tasked with developing the plan on behalf of Missouri HIV Prevention and Care stakeholders. Key findings from needs assessments conducted by several Grantees were utilized to inform the plan s assessment of needs, gaps, and barriers, as well as in the selection of the plan s objectives, strategies, and activities. The signatures below confirm the concurrence of the Missouri Ryan White Grantees Workgroup with the Missouri Statewide Integrated HIV Prevention and Care Plan, Part A Grantee (St. Louis) 9/19/16 Maggie Hourd-Bryant, Grants Administrator, Bureau of Communicable Disease Control date City of St. Louis Department of Health Part A Grantee (Kansas City) Frank Thompson, Manager of HIV Services, Administration Division Kansas City Department of Health 9/12/16 date
 Tawnya Brown, MSW, HIV Program Director Washington University Infectious Diseases Clinic 9/20/16 date Part C Grantee (Kansas City) Sally Neville, RN/MSN, Vice President of Clinical Specialty")
90 Patterson Page 2 of 2 Part B Grantee Nicole Massey, LCSW, Chief, Bureau of HIV, STD, and Hepatitis date Missouri Department of Health and Senior Services Part C Grantee (St. Louis) Tawnya Brown, MSW, HIV Program Director Washington University Infectious Diseases Clinic 9/20/16 date Part C Grantee (Kansas City) Sally Neville, RN/MSN, Vice President of Clinical Specialty Care Kansas City CARE Clinic date Part C Grantee (Springfield) Lynne Meyerkord, Executive Director AIDS Project of the Ozarks date Part C Grantee (Northwest) Eva Cook, LPN, Program Coordinator Northwest Health Services 9/21/16 date Part D Grantee (St. Louis) Kim Donica, LCSW, Executive Director Washington University Project ARK & The SPOT date Part D Grantee (Kansas City) Dennis Dunmyer, BBA, MSW, JD, VP of Behavioral Health and Community Programs date Kansas City CARE Clinic
Missouri St. Louis TGA 2016 HIV Epidemiological Profile
 Missouri St. Louis TGA 2016 HIV Epidemiological Profile St. Louis TGA Part A Planning Council Prepared by the City of St. Louis Department of Health Center for Health Information, Research, and Planning
Metro St. Louis HIV Epidemiological Profile
 Metro St. Louis HIV Epidemiological Profile Saint Louis TGA Part A Planning Council Prepared by the City of St. Louis Department of Health s Center for Health Information, Research, and Planning Table
SCOPE OF HIV/AIDS IN MINNESOTA
 SCOPE OF HIV/AIDS IN MINNESOTA National Perspective Compared to the rest of the nation, Minnesota is considered to be a low- to-moderate HIV/AIDS incidence state. In 2013 (the most recent year for which
FULTON COUNTY GOVERNMENT RYAN WHITE PART A PROGRAM. Atlanta Eligible Metropolitan Area HIV/AIDS Unmet Need Estimate
 FULTON COUNTY GOVERNMENT RYAN WHITE PART A PROGRAM Atlanta Eligible Metropolitan Area HIV/AIDS Unmet Need Estimate Southeast AIDS Training and Education Center Department of Family and Preventative Medicine
State of Alabama HIV Surveillance 2014 Annual Report
 State of Alabama HIV Surveillance 2014 Annual Report Prepared by: Division of STD Prevention and Control HIV Surveillance Branch Contact Person: Richard P. Rogers, MS, MPH richard.rogers@adph.state.al.us
State of Alabama HIV Surveillance 2012 Annual Report Finalized
 State of Alabama HIV Surveillance 2012 Annual Report Finalized Prepared by: Division of HIV/AIDS Prevention and Control HIV Surveillance Branch Contact Person: Allison R. Smith, MPH Allison.Smith@adph.state.al.us
State of Alabama HIV Surveillance 2013 Annual Report Finalized
 State of Alabama HIV Surveillance 2013 Annual Report Finalized Prepared by: Division of STD Prevention and Control HIV Surveillance Branch Contact Person: Allison R. Smith, MPH Allison.Smith@adph.state.al.us
HIV Surveillance in Urban and Nonurban Areas. National Center for HIV/AIDS, Viral Hepatitis, STD & TB Prevention Division of HIV/AIDS Prevention
 HIV Surveillance in Urban and Nonurban Areas National Center for HIV/AIDS, Viral Hepatitis, STD & TB Prevention Division of HIV/AIDS Prevention HIV Infection in Urban and Nonurban Areas Many ways to characterize
Palm Beach County Integrated Prevention and Patient Care Plan
 Palm Beach County Integrated Prevention and Patient Care Plan Introduction The Palm Beach County Coordinated Services Network (CSN) is a partnership of state and federal funding sources, planning authorities,
HIV/AIDS Epidemiology Partnership 10
 Bureau of HIV/AIDS Surveillance Section (85) 245-443, or SC 25-443 Incidence data as of 12/31/9 Prevalence and Death data as of 4/27/9 HIV/AIDS Epidemiology Partnership 1 Broward County Excluding Dept.
Epidemiology of HIV Among Women in Florida, Reported through 2014
 To protect, promote and improve the health of all people in Florida through integrated state, county, and community efforts. Created: 12/4/14 Revision: 1/27/15 Epidemiology of HIV Among Women in Florida,
Miami-Dade County HIV/AIDS Epidemiological Data. July 8, 2010
 Miami-Dade County HIV/AIDS Epidemiological Data July 8, 21 Data provided by the Florida Department of Health HIV/AIDS Surveillance Program Prepared by Behavioral Science Research EPI DATA HELPS US Fulfill
Improving HIV Prevention and Care in New Mexico Through Integrated Planning
 Improving HIV Prevention and Care in New Mexico Through Integrated Planning Andrew Gans, MPH HIV, STD and Hepatitis Section Manager National Goals 1 Goals in the National HIV/AIDS Strategy (NHAS) 1. Reduce
HIV Integrated Epidemiological Profile December 2011 State of Alabama
 HIV Integrated Epidemiological Profile December 2011 State of Alabama 12/31/2011 Alabama Department of Public Health Division of HIV/AIDS Prevention and Control TABLE OF CONTENTS List of Figures 3 List
New Jersey HIV/AIDS Epidemiologic Overview, 2017 (Data based upon the HIV/AIDS Reporting System ehars, unless otherwise noted.)
") New Jersey HIV/AIDS Epidemiologic Overview, 2017 (Data based upon the HIV/AIDS Reporting System ehars, unless otherwise noted.) New Jersey Department of Health Division of HIV, STD, TB Services INTRODUCTION
New Jersey HIV/AIDS Epidemiologic Overview, 2017 (Data based upon the HIV/AIDS Reporting System ehars, unless otherwise noted.) New Jersey Department of Health Division of HIV, STD, TB Services INTRODUCTION
New Jersey HIV/AIDS Epidemiologic Profile 2011
 New Jersey HIV/AIDS Epidemiologic Profile 2011 HIV/AIDS in New Jersey New Jersey ranks 5th among 46 states with long-term namebased reporting in the rate of HIV (not AIDS) infection among adults and adolescents
Bassett Medical Center PPS Community Profile
 Bassett Medical Center PPS Community Profile Counties served: Delaware, Herkimer, Madison, Otsego, and Schoharie DEMOGRAPHICS 1 The Bassett Medical Center PPS s total population is 278,214. Age: Residents
Organizational HIV Treatment Cascade Guidance for Construction. Introduction. Background
 Organizational HIV Treatment Cascade Guidance for Construction Introduction This guidance document provides organizations with the necessary tools and resources to construct their Organizational HIV Treatment
HIV/AIDS Epidemiology in Alameda County: State of the County Report
 Lake Merritt, Oakland,California HIV/AIDS Epidemiology in Alameda County: State of the County Report Muntu Davis, MD, MPH County Health Officer and Public Health Director Alameda County White House Office
Forsyth County, North Carolina 2013 HIV/STD Surveillance Report
 Forsyth County, North Carolina 2013 HIV/STD Surveillance Report Forsyth County Department of Public Health Division of Epidemiology and Surveillance 799 N. Highland Avenue Winston-Salem, NC 27102-0686
STD & HIV ANNUAL REPORT. An Annual Review of HIV and STD s reported in Oakland County, Michigan
 STD & HIV ANNUAL REPORT 2016 An Annual Review of HIV and STD s reported in Oakland County, Michigan Similar to numbers reported statewide, Oakland County saw an increase in the number of reported cases
BALTIMORE COUNTY HIV/AIDS EPIDEMIOLOGICAL PROFILE Fourth Quarter Data reported throuh December 31, 2007
 Fourth Quarter 2007 - Data reported throuh AIDS Administration Maryland Department of Health and Mental Hygiene www.dhmh.state.md.us/aids/ 1-800-358-9001 SPECIAL NOTE ON HIV REPORTING The Maryland HIV/AIDS
NEW JERSEY HIV/AIDS REPORT
 NEW JERSEY HIV/AIDS REPORT December 31, 2014 Chris Christie Governor Kim Guadagno Lt. Governor Public Health Services Branch Division of HIV, STD and TB Services preventing disease with care Mary E. O
NEW JERSEY HIV/AIDS REPORT
 NEW JERSEY HIV/AIDS REPORT December 31, 2009 Chris Christie Governor Kim Guadagno Lt. Governor Public Health Services Branch Division of HIV/AIDS Services preventing disease with care Poonam Alaigh, MD,
Forsyth County, North Carolina 2012 HIV/STD Surveillance Report
 Forsyth County, North Carolina 2012 HIV/STD Surveillance Report Forsyth County Department of Public Health Division of Epidemiology and Surveillance 799 N. Highland Avenue Winston-Salem, NC 27102-0686
HAWAII 2015 HIV CARE CONTINUUM
 HAWAII 2015 HIV CARE CONTINUUM Fenfang Li, PHD, MPH Communicable Disease and Public Health Nursing Division State of Hawaii Department of Health January 16, 2018 UPDATED NATIONAL HIV/AIDS STRATEGY (NHAS)
Central New York Care Collaborative, Inc. PPS Community Profile
 Central New York Care Collaborative, Inc. PPS Community Profile Counties served: Cayuga, Lewis, Madison, Oneida, Onondaga, and Oswego DEMOGRAPHICS 1 The total population of the Central New York Care Collaborative
Bruce D. Agins, MD MPH Medical Director, AIDS Institute Adherence 2017; Miami
 1 1 Bruce D. Agins, MD MPH Medical Director, AIDS Institute Adherence 2017; Miami 3 Defining the End of AIDS Reduce new infections to 750 annually by the end of 2020 Three Point Plan 1. Identify all persons
County of Orange Health Care Agency, Public Health Services HIV/AIDS Surveillance and Monitoring Program
 HIV DISEASE SURVEILLANCE STATISTICS 2010 County of Orange Health Care Agency, Public Health Services HIV DISEASE SURVEILLANCE STATISTICS, 2010 David L. Riley Director County of Orange, Health Care Agency,
Mortality Slide Series. National Center for HIV/AIDS, Viral Hepatitis, STD, and TB Prevention Division of HIV/AIDS Prevention
 Mortality Slide Series National Center for HIV/AIDS, Viral Hepatitis, STD, and TB Prevention Division of HIV/AIDS Prevention HIV Mortality Slides An analysis of trends in rates and distributions of deaths
Minneapolis Department of Health and Family Support HIV Surveillance
 Rate per 1, persons 2 21 22 23 24 25 26 27 28 29 21 Rate per 1, persons Minneapolis Department of Health and Family Support HIV Surveillance Research Brief, September 212 Human immunodeficiency virus (HIV)
2014 County of Marin Fact Sheet: HIV/AIDS in Marin County
 2014 County of Marin Fact Sheet: HIV/AIDS in Marin County HIV/AIDS epidemiology data is from the enhanced HIV/AIDS Reporting System (ehars) maintained by the Office of AIDS. The data presented here are
HIV/AIDS EPIDEMIOLOGY. Rachel Rivera, MD Assistant Professor Infectious Diseases UT Southwestern Medical Center November 14, 2014
 HIV/AIDS EPIDEMIOLOGY Rachel Rivera, MD Assistant Professor Infectious Diseases UT Southwestern Medical Center November 14, 2014 HOUSEKEEPING ANNOUNCEMENTS AUDIO Can you hear us? You will be accessing
Working with Health Departments: Ingredients for Effective Collaboration Between Health Departments and CFARs. Shanell L. McGoy, Ph.D.
 Working with Health Departments: Ingredients for Effective Collaboration Between Health Departments and CFARs Shanell L. McGoy, Ph.D. MPH HIV/AIDS in the Southeast: 2 nd Annual CFAR Workshop to Address
Needs Assessment of People Living with HIV in the Boston EMA. Needs Resources and Allocations Committee March 10 th, 2016
 Needs Assessment of People Living with HIV in the Boston EMA Needs Resources and Allocations Committee March 10 th, 2016 Presentation Overview 1. What is a Needs Assessment? 2. The Numbers o Epidemiological
Boston EMA Ryan White Part A Integrated HIV Prevention and Care Plan. September 8 th, 2016
 Boston EMA Ryan White Part A 2017-2021 Integrated HIV Prevention and Care Plan September 8 th, 2016 Presentation Overview Purpose of the Integrated Prevention and Care Plan Process of Developing the Plan
Rhode Island Department of Health. Division of Infectious Disease and Epidemiology. Office of HIV/AIDS & Viral Hepatitis
 Rhode Island Department of Health Division of Infectious Disease and Epidemiology Office of HIV/AIDS & Viral Hepatitis November 2013 Table of Contents 1) Introduction.....3 2) Surveillance Methods...3
Trends in U.S. HIV Diagnoses,
 CDC FACT SHEET Trends in U.S. HIV Diagnoses, 2005-2014 More than three decades after the first cases of AIDS were diagnosed in the United States, HIV continues to pose a substantial threat to the health
New Jersey HIV/AIDS Epidemiologic Profile 2010
 New Jersey HIV/AIDS Epidemiologic Profile 00 Estimated HIV/AIDS Cases, Deaths and Persons Living with HIV/AIDS -- New Jersey, 989-008 In 008, the latest complete year of diagnosis data, there were 350
Millennium Collaborative Care PPS Community Profile
 Millennium Collaborative Care PPS Community Profile Counties served: Allegany, Cattaraugus, Chautauqua, Erie, Genesee, Niagara, Orleans, and Wyoming DEMOGRAPHICS 1 Millennium Collaborative Care (MCC) PPS
Trends in HIV Incidence and Prevalence in the United States
 Trends in HIV Incidence and Prevalence in the United States Irene Hall, PhD, FACE 7th International Workshop on HIV Transmission Washington, DC, July 20, 2012 National Center for HIV/AIDS, Viral Hepatitis,
Florida s HIV Testing Efforts
 Florida s HIV Testing Efforts Mara Michniewicz, MPH Prevention Program Manager Florida Department of Health (DOH) Bureau of Communicable Diseases HIV/AIDS Section Florida Comprehensive Planning Network
Data: Access, Sources, and Systems
 EXEMPLARY INTEGRATED HIV PREVENTION AND CARE PLAN SECTIONS Data: Access, Sources, and Systems REGION PLAN TYPE JURISDICTIONS HIV PREVALENCE Midwest Integrated state-only prevention and care plan State
HIV Continuum of Care Connecticut, 2015
 HIV Continuum of Care Connecticut, 2015 Heidi Jenkins, Section Chief TB, HIV, STD & Viral Hepatitis Section Public Health Initiatives State of Connecticut Department of Public Health 05/25/2017 HIV Continuum
HIV MINORITY SERVING FAITH BASED COMMUNITIES NEEDS ASSESSMENT IN BATON ROUGE, LOUISIANA
 HIV MINORITY SERVING FAITH BASED COMMUNITIES NEEDS ASSESSMENT IN BATON ROUGE, LOUISIANA Project Partners: Malissa Jackson CEO, Eutopia of Louisiana Rev. A.J. Johnson CEO Baton Rouge AIDS Society Community
Acquired Immuno-Deficiency Syndrome (AIDS) and Human Immuno-Deficiency Virus (HIV) in Nevada Annual Surveillance Report (1999)
 and Human Immuno-Deficiency Virus (HIV) in Nevada Annual Surveillance Report (1999)") Community Health Sciences Faculty Publications School of Community Health Sciences 9-2001 Acquired Immuno-Deficiency Syndrome (AIDS) and Human Immuno-Deficiency Virus (HIV) in Nevada Annual Surveillance
Community Health Sciences Faculty Publications School of Community Health Sciences 9-2001 Acquired Immuno-Deficiency Syndrome (AIDS) and Human Immuno-Deficiency Virus (HIV) in Nevada Annual Surveillance
HIV Planning: From Guidance to Implementation. Joan Llanes Assistant Program Manager Division of Community Advancement and Leadership Strategies
 HIV Planning: From Guidance to Implementation Joan Llanes Assistant Program Manager Division of Community Advancement and Leadership Strategies Overview HIV Planning Guidance Implementing HIV Planning
Estimates of New HIV Infections in the United States
 Estimates of New HIV Infections in the United States CDC HIV/AIDS FactS A u g u s t 28 Accurately tracking the HIV epidemic is essential to the nation s HIV prevention efforts. Yet monitoring trends in
Moving Integrated HIV Prevention and Care Planning into Action: Integrated Funding for HIV Services. Wednesday, June 13, :00 p.m. 4:00 p.m.
 Moving Integrated HIV Prevention and Care Planning into Action: Integrated Funding for HIV Services Wednesday, June 13, 2018 3:00 p.m. 4:00 p.m. EDT Webinar Objectives Following the webinar, participants
WELCOME! PLANNING COUNCIL MEETING September 7, 2017
 WELCOME! PLANNING COUNCIL MEETING September 7, 2017 Moment of Silence INTRODUCTIONS Please state your name for the record. Please note: You do NOT have to disclose your status during the introduction if
State of Alabama AIDS Drug Assistance Program (ADAP) Quarterly Report
 Quarterly Report") State of Alabama AIDS Drug Assistance Program (ADAP) Quarterly Report This report reflects active clients currently enrolled in ADAP Full-pay Prescription Program (ADAP-Rx), Alabama s Insurance Assistance
State of Alabama AIDS Drug Assistance Program (ADAP) Quarterly Report This report reflects active clients currently enrolled in ADAP Full-pay Prescription Program (ADAP-Rx), Alabama s Insurance Assistance
Hartford Transitional Grant Area (TGA) Quality Management Plan
 Quality Management Plan") Hartford Transitional Grant Area (TGA) Quality Management Plan 2015-2017 1 Table of Contents Overview.. 2 Mission Core Values Purpose Quality Improvement Directions. 3 National HIV/AIDS Strategies for
Hartford Transitional Grant Area (TGA) Quality Management Plan 2015-2017 1 Table of Contents Overview.. 2 Mission Core Values Purpose Quality Improvement Directions. 3 National HIV/AIDS Strategies for
Alabama Department of Public Health. Sexually Transmitted Diseases
 Alabama Department of Public Health Sexually Transmitted Diseases Annual Report 29 August 16, 21 Dear Alabama Stakeholder: The Division of Sexually Transmitted Disease Prevention and Control of the Alabama
Estimates of New HIV Infections in the United States
 Estimates of New HIV Infections in the United States CDC HIV/AIDS FACT S A UGUS T 28 Accurately tracking the HIV epidemic is essential to the nation s HIV prevention efforts. Yet monitoring trends in new
HIV/AIDS in the Houston EMA and HSDA
 The HIV/AIDS epidemic has affected people of all gender, age and racial/ethnic groups in the Houston EMA and HSDA. This effect, however, has not been the same for all groups. In the beginning of the epidemic,
City and County of Denver Sexually Transmitted Infections Surveillance Report 2005
 City and County of Denver Sexually Transmitted Infections Surveillance Report 2005 Denver Public Health Department Sexually Transmitted Disease Control Program November 2006 This report was prepared by:
Nassau Queens PPS Community Profile
 Nassau Queens PPS Community Profile Counties served: Nassau and Queens DEMOGRAPHICS 1 The total population of the two counties served by the Nassau Queens (Nassau University Medical Center) PPS is 3,631,203.
State of Florida Integrated HIV Prevention and Care Plan, including the Statewide Coordinated Statement of Need, CY
 State of Florida Integrated HIV Prevention and Care Plan, including the Statewide Coordinated Statement of Need, CY 2017-2021 Prepared by The Florida Department of Health, HIV/AIDS Section The AIDS Institute
Epidemiologic Trends in HIV in Illinois. Prepared by Cheryl Ward for the 24 th Annual Illinois HIV/STD Conference
 Epidemiologic Trends in HIV in Illinois Prepared by Cheryl Ward for the 24 th Annual Illinois HIV/STD Conference October 28, 2015 Learning Objectives To describe epidemiologic trends in HIV/AIDS in Illinois
HRSA HIV/AIDS Bureau Updates
 HRSA HIV/AIDS Bureau Updates Minority AIDS Initiative (MAI): 15 Years Later What s Been Achieved? What Are the Ongoing Barriers to Success? October 2, 2014 Harold J. Phillips Deputy Director Division of
Estimated HIV/AIDS Newly Diagnosed Cases In New Jersey
 Introduction n As of 12/31/2009 there were more than 73,800 HIV/ AIDS cases in New Jersey including 1,353 pediatric HIV/AIDS cases. Over 4,000 children were also exposed to HIV. Over half of the cumulative
HIV/AIDS Surveillance Technical Notes
 HIV/AIDS Surveillance Technical Notes Surveillance of HIV/AIDS The Minnesota Department of Health (MDH) collects case reports of HIV infection and AIDS diagnoses through a passive and active HIV/AIDS surveillance
Sexually Transmitted Diseases, Hepatitis C and HIV Epidemiology in North Dakota
 Sexually Transmitted Diseases, Hepatitis C and HIV Epidemiology in North Dakota Sarah Weninger, MPH HIV.STD.Viral Hepatitis Prevention Coordinator Great Plains Area Indian Health Service Public Health
Human Immunodeficiency Virus and Acquired Immunodeficiency Syndrome Among Adults and Adolescents in New Mexico 2014
 Human Immunodeficiency Virus and Acquired Immunodeficiency Syndrome Among Adults and Adolescents in New Mexico 2014 HIV Epidemiology and Surveillance Program Infectious Disease Epidemiology Bureau Epidemiology
New Jersey Statewide Coordinated Statement of Need
 New Jersey Department of Health and Senior Services Division of HIV, STD and TB Services New Jersey Statewide Coordinated Statement of Need June 2013 Statewide Coordinated Statement of Need Introduction:
Outline. AIDS & HIV in the Travis County. Global estimates for adults & children end HIV incidence worldwide
 Outline AIDS & HIV in the Joshua Vest Epidemiologist Austin/ Health & Human Services Department Worldwide HIV/AIDS surveillance National Prevalence Trends Disparities Mortality Modes of exposure Risk factors
Ryan White Part A Overview Kimberlin Dennis Melissa Rodrigo March 21, 2018
 Ryan White Part A Overview Kimberlin Dennis Melissa Rodrigo March 21, 2018 Part A Program = Partnership Regional HIV Planning Council Cuyahoga County Board of Health One Purpose Ryan White Legislation
HIV & AIDS Cases in Alameda County
 HIV & AIDS Cases in Alameda County Presentation to the CCPC August 24, 2011 Elaine Bautista & Alex Marr What is Epidemiology? The study of the distributions (who, where and when) and determinants (what
NEW JERSEY HIV/AIDS REPORT
 NEW JERSEY HIV/AIDS REPORT June 30, 2009 Jon S. Corzine Governor Public Health Services Branch Division of HIV/AIDS Services preventing disease with care Heather Howard Commissioner 2 Division of HIV/AIDS
HIV/AIDS in Massachusetts
 HIV/AIDS in Massachusetts Challenges and Opportunities to Enhance the Public Health Response May 14, 2013 Fenway Community Health Center H. Dawn Fukuda, Director Office of HIV/AIDS Bureau of Infectious
TB/HIV/STD Epidemiology and Surveillance Branch. First Annual Report, Dated 12/31/2009
 TB/HIV/STD Epidemiology and Surveillance Branch First Annual Report, Dated 12/31/29 This Enhanced Perinatal Surveillance Report is the first annual report generated by the Texas Department of State Health
CHAPTER 29 HIV/AIDS BOARD OF HEALTH ROLE AT A GLANCE
 CHAPTER 29 HIV/AIDS BOARD OF HEALTH ROLE AT A GLANCE Have an understanding of who can be affected by HIV/AIDS in your community and be able to address any concerns of the general public as well as people
STD, HIV and Hepatitis C 2017 Data Release. April 24,2018
 STD, HIV and Hepatitis C 2017 Data Release April 24,2018 Acronyms MDH = Minnesota Department of Health STD = Sexually transmitted disease MSM = Men who have sex with men HCV = Hepatitis C virus HBV =Hepatitis
State of California Health and Human Services Agency Department of Health Services
 State of California Health and Human Services Agency Department of Health Services SANDRA SHEWRY Director ARNOLD SCHWARZENEGGER Governor TO: INTERESTED PARTIES SUBJECT: CALIFORNIA HIV SEROPREVALENCE ANNUAL
STIs in the Indian Country
 STIs in the Indian Country Multiple STI s and Risk for HIV Ryan Kreisberg, MPH Senior Epidemiologist, PRISM Data Manager Agenda STI/HIV Trends across the US and Arizona STIs in the Indian Country Multiple
Mortality Slide Series. National Center for HIV/AIDS, Viral Hepatitis, STD, and TB Prevention Division of HIV/AIDS Prevention
 Mortality Slide Series National Center for HIV/AIDS, Viral Hepatitis, STD, and TB Prevention Division of HIV/AIDS Prevention HIV Mortality Slides An analysis of trends in rates and distributions of deaths
HIV Infection in Alaska
 Department of Health and Social Services Division of Public Health Section of Epidemiology Karen Perdue, Commissioner Peter M. Nakamura, MD, MPH, Director John Middaugh, MD, Editor 3601 C Street, Suite
BALTIMORE CITY HIV/AIDS EPIDEMIOLOGICAL PROFILE Second Quarter Data reported through June 30, 2008
 BALTIMORE CITY HIV/AIDS EPIDEMIOLOGICAL PROFILE Second Quarter 2008 - Data reported through June 30, 2008 AIDS Administration Maryland Department of Health and Mental Hygiene www.dhmh.state.md.us/aids/
Persons Living with HIV/AIDS, San Mateo County Comparison
 Persons Living with HIV/AIDS, San Mateo County Comparison As of December 2008, there were 1,152 persons living with HIV or HIV/AIDS in San Mateo County (Table 1). Compared to California and the United
Addressing HCV among People Living with HIV November 29, 2017
 Addressing HCV among People Living with HIV November 29, 2017 Susan Robilotto, D.O. Medical Officer/ Clinical Consultant Health Resources and Services Administration (HRSA) HIV/AIDS Bureau (HAB) Division
Gonorrhea, Chlamydia, and Syphilis in Alaska
 Department of Health and Social Services Division of Public Health Section of Epidemiology Karen Perdue, Commissioner Karen Pearson, Director John Middaugh, MD, Editor 361 C Street, Suite 54, P.O. Box
HIV/AIDS IN MIAMI-DADE COUNTY THROUGH 2015
 HIV/AIDS IN MIAMI-DADE COUNTY THROUGH 2015 Florida Department of Health in Miami-Dade County, Epidemiology, Disease Control & Immunization Services, HIV/AIDS Surveillance Unit By Rodolfo Boucugnani Please
Table of Contents. 2 P age. Susan G. Komen
 RHODE ISLAND Table of Contents Table of Contents... 2 Introduction... 3 About... 3 Susan G. Komen Affiliate Network... 3 Purpose of the State Community Profile Report... 4 Quantitative Data: Measuring
HIV Incidence Report, Sexually Transmitted Diseases, HIV and Tuberculosis Section, Epidemiology and Surveillance Unit
 HIV Incidence Report, 2017 Sexually Transmitted Diseases, HIV and Tuberculosis Section, Epidemiology and Surveillance Unit Introduction (I) These two introduction slides provide a general context for the
Westchester Medical Center PPS Community Profile
 Westchester Medical Center PPS Community Profile Counties served: Delaware, Dutchess, Orange, Putnam, Rockland, Sullivan, Ulster, Westchester DEMOGRAPHICS 1 The eight counties served by the Westchester
Hudson Valley Collaborative PPS Community Profile
 Hudson Valley Collaborative PPS Community Profile Counties served: Dutchess, Orange, Putnam, Rockland, Sullivan, Ulster, and Westchester DEMOGRAPHICS 1 The total population of the counties served by the
HIV Epidemiology March 7, Stefanie Rhodes Inova Juniper Program
 HIV Epidemiology March 7, 2019 Stefanie Rhodes Inova Juniper Program Stefanie.Rhodes@inova.org Human Immunodeficiency Virus Virus that attacks and weakens immune system Can be treated, but not cured Transmitted
CHLAMYDIAL INFECTION
 CHLAMYDIAL INFECTION CRUDE DATA Number of Cases 20,191 Annual Incidence a LA County 227.4 California 191.3 United States 194.5 Age at Onset Mean 23.2 Median 21 Range 0-94 yrs Case Fatality LA County N/A
HIV EPIDEMIOLOGY IN NEW YORK CITY
 HIV EPIDEMIOLOGY IN NEW YORK CITY Ellen Weiss Wiewel, MHS HIV Epidemiology and Field Services Program New York City Department of Health and Mental Hygiene http://www.nyc.gov/html/doh/html/dires/hivepi.shtml
Estimate of the Number of Persons Living with HIV in Massachusetts
 Estimate of the Number of Persons Living with HIV in Massachusetts Christian Hague, MPH Supervisor, HIV Surveillance Massachusetts Department of Public Health 2016 NATIONAL RYAN WHITE CONFERENCE ON HIV
Sacramento Transitional Grant Area. Ryan White CARE Program Continuous Quality Improvement Plan
 Sacramento Transitional Grant Area Ryan White CARE Program Continuous Quality Improvement Plan July 2018 March 2020 Table of Contents Introduction... 3 Quality Statement... 5 Vision... 5 Mission... 5 Purpose...
2014 Epidemiologic Profile of HIV in Michigan
 2014 Epidemiologic Profile of HIV in Michigan HIV, Body Art, Tuberculosis, Viral Hepatitis Section Bureau of Disease Control, Prevention and Epidemiology Michigan Department of Community Health www.michigan.gov/hivstd
Viral Load Suppression/Any HIV Care 84%
 1 2 Viral Load Suppression/Any HIV Care 84% 3 Key Policy Advancements 4 Implementati on of 30% rent cap affordable housing project Expansion of data sharing Elimination of written consent for HIV Testing
Minnesota HIV Strategy: A Comprehensive Plan to End HIV/AIDS
 Minnesota HIV Strategy: A Comprehensive Plan to End HIV/AIDS 02/09/2018 Minnesota HIV Strategy: A Comprehensive Plan to End HIV/AIDS Minnesota Department of Health Infectious Disease Epidemiology, Prevention
BROWARD COUNTY SUBMITTED BY: RYAN WHITE PART A PROGRAM FLORIDA DEPARTMENT OF HEALTH- BROWARD HIV PREVENTION PROGRAM SEPTEMBER 29, 2016
 SUBMITTED BY: RYAN WHITE PART A PROGRAM FLORIDA DEPARTMENT OF HEALTH- BROWARD HIV PREVENTION PROGRAM BROWARD SEPTEMBER 29, 2016 COUNTY INTEGRATED CITY-ONLY HIV PREVENTION AND CARE PLAN 2017-2021 TABLE
San Francisco Department of Public Health. HIV/AIDS Epidemiology Annual Report HIV Epidemiology Section
 San Francisco Department of Public Health HIV/AIDS Epidemiology Annual Report 2007 HIV Epidemiology Section HIV/AIDS Epidemiology Annual Report 2007 SAN FRANCISCO Department of Public Health HIV Epidemiology
HIV/AIDS Bureau Update
 HIV/AIDS Bureau Update Ryan White HIV/AIDS Program Clinical Conference New Orleans, LA December 15, 2015 Laura Cheever, MD, ScM Associate Administrator Department of Health and Human Services Health Resources
HIV Viral Suppression, 37 States and the District of Columbia, 2014
 DOI 10.1007/s10900-017-0427-3 ORIGINAL PAPER HIV Viral Suppression, 37 States and the District of Columbia, 2014 Kristen L. Hess 1 H. Irene Hall 1 Published online: 18 September 2017 Springer Science+Business
Health Resources and Services Administration and HIV/AIDS Bureau Update
 Health Resources and Services Administration and HIV/AIDS Bureau Update Presented to the CDC/HRSA Advisory Committee on HIV, Viral Hepatitis and STD Prevention and Treatment Laura Cheever, MD ScM Associate
Unmet Oral Health Needs of Persons Living With HIV/AIDS in the United States
 Unmet Oral Health Needs of Persons Living With HIV/AIDS in the United States What Can We Do To Improve Services? Nicholas G. Mosca, DDS, DrPH CrescentCare Health/NO AIDS Task Force April 25, 2017 National