Metro St. Louis HIV Epidemiological Profile
|
|
|
- Bryce Glenn
- 5 years ago
- Views:
Transcription
1 Metro St. Louis HIV Epidemiological Profile Saint Louis TGA Part A Planning Council Prepared by the City of St. Louis Department of Health s Center for Health Information, Research, and Planning
2 Table of Contents Introduction St. Louis Transitional Grant Area Map HIV/AIDS Prevalence HIV/AIDS Unmet Need Summary 2
3 Table of Contents Introduction St. Louis Transitional Grant Area Map HIV/AIDS Prevalence HIV/AIDS Unmet Need Summary 3
4 Introduction: Purpose To create a better understanding of the HIV/AIDS epidemic in our area Compares trends in HIV/AIDS cases in the last few years To identify subpopulations disproportionately affected by the disease 4
5 Introduction: Sources Mandatory Reporting of HIV & AIDS Cases o Missouri Department of Health and Senior Services (MDHSS) o Illinois Department of Public Health (IDPH) HIV/AIDS Reporting System (ehars) o All positive test results o Demographic information 5
6 Introduction: Commonly used terms TGA - Transitional Grant Area PLWH/A People living with HIV or AIDS MOT Mode of Transmission o MSM Men who have sex with men (includes homosexual and bisexual) o IDU Intravenous drug user o MSM/IDU Men who have sex with men and are intravenous drug users o Hetero Persons infected by a partner of the opposite sex o Peds HIV infected child due to prenatal or perinatal exposure o NIR No indicated risk HIV Disease Categorization that includes those with HIV infection and AIDS disease (HIV/AIDS) 6
7 Introduction: Context WHO o o o People living with HIV (PLWH) People living with AIDS (PLWA) People living with HIV Disease (PLWH/A) WHAT o o Prevalence WHERE o St. Louis TGA 7
8 Table of Contents Introduction St. Louis Transitional Grant Area Map HIV Disease Prevalence HIV/AIDS Unmet Need Summary 8
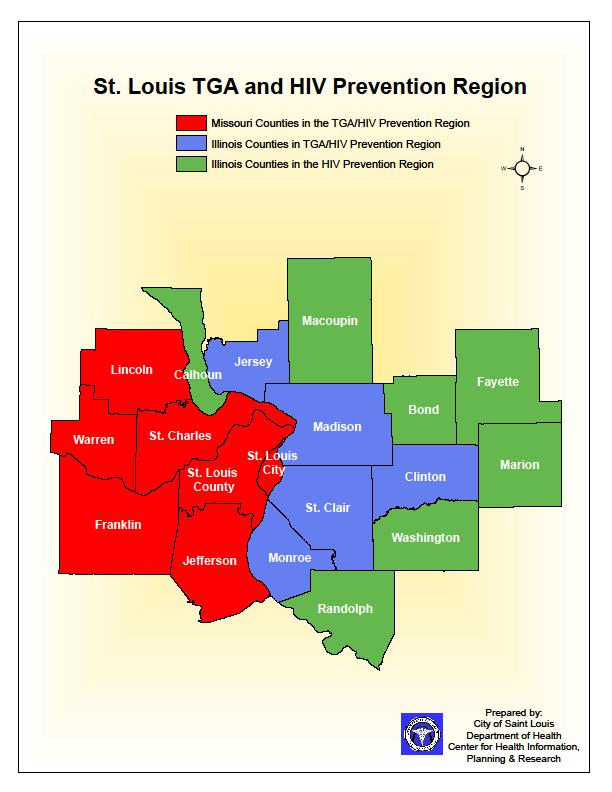
9 9
10 Table of Contents Introduction St. Louis Transitional Grant Area Map HIV/AIDS Prevalence HIV/AIDS Unmet Need Summary 10
11 HIV/AIDS Prevalence Those currently living with HIV or AIDS, this includes all cases that have been diagnosed as of 12/31/2012 (IL), or 12/31/2013 (MO)
12 HIV/AIDS Prevalence COUNTY RACE GENDER AGE GROUP MOT Subpopulations
13 HIV/AIDS Prevalence COUNTY RACE GENDER AGE GROUP MOT Subpopulations
14 HIV/AIDS Prevalence: County Total Living HIV Disease Rates County FRANKLIN CO JEFFERSON CO LINCOLN CO ST CHARLES CO ST LOUIS CITY ST LOUIS CO WARREN CO MO-TGA Total CLINTON JERSEY MADISON MONROE ST. CLAIR IL-TGA Total St. Louis TGA Rates *Rates are per 100,000 persons 14
15 Rate per 100,000 population HIV/AIDS Prevalence: County St. Louis TGA Rates of HIV Disease from Years MO-TGA Total IL-TGA Total 15
16 Rate per 100,000 persons HIV/AIDS Prevalence: County St. Louis TGA Rates of HIV Disease from , by County FRANKLIN CO. JEFFERSON CO. LINCOLN CO. ST CHARLES CO. ST LOUIS CITY ST LOUIS CO. WARREN CO. CLINTON JERSEY MADISON MONROE ST. CLAIR Years 16
17 HIV/AIDS Prevalence COUNTY RACE GENDER AGE GROUP MOT Subpopulations
 Other 2% (n=160) White 74% White 41% (n=2664) Black 55% (n=3610) Black White Hispanic Other Black White Hispanic")
18 HIV/AIDS Prevalence: Race Hispanic 3% Population By Race, St. Louis TGA, 2013 Black 19% Other 4% Hispanic 2% (n=153) PLWH/A by Race, St. Louis- TGA, 2012, 2013 (n=6688) Other 2% (n=160) White 74% White 41% (n=2664) Black 55% (n=3610) Black White Hispanic Other Black White Hispanic Other 18
19 HIV/AIDS Prevalence: Race Hispanic 3% Population By Race, St. Louis PLWH/A by Race, St. Louis- TGA, 2013 TGA, 2012, 2013 Other Disproportionate Impact: (n=6688) White 74% Black 19% Other 4% 2% (n=160) Blacks have the highest rate of HIV Disease prevalence Hispanic (Among blacks, the prevalence was 2% (n=153) cases per 100,000 persons in the TGA). White 41% (n=2664) Black 55% (n=3610) Black White Hispanic Other Black White Hispanic Other 19
20 HIV/AIDS Prevalence COUNTY RACE GENDER AGE GROUP MOT Subpopulations

")
 Male")
21 HIV/AIDS Prevalence: Gender Population by Gender, St. Louis TGA, 2013 PLWH/A by Gender, St. Louis TGA; 2012, 2013 (n=6688) Female 19% (n=1259) Female 52% Male 48% Male 81% (n=5391) Male Female Male Female 21
22 HIV/AIDS Prevalence: Gender Population by Gender, St. Louis TGA, 2013 PLWH/A by Gender, St. Louis TGA; 2012, 2013 (n=6688) Female 52% Disproportionate Impact: Male 48% Males have the highest rate of HIV disease prevalence in the TGA (410.2 per 100,000 males), which is more than FOUR AND A HALF times the rate of prevalence for females (89.7 per 100,000 females) Female 19% (n=1259) Male 81% (n=5391) Male Female Male Female 22
23 HIV/AIDS Prevalence COUNTY RACE GENDER AGE GROUP MOT Subpopulations

 65 & Older 4% (n=294)")
 25-44 40% (n=2683) 25-44 24% Under 13 13-25")
24 HIV/AIDS Prevalence: Age Population by Age, St. Louis TGA, & Older 12% Under 13 20% PLWH/A by Age, St. Louis TGA; 2012, 2013 (n=6688) 65 & Older 4% (n=294) % (n=434) % % % (n=3255) % (n=2683) % Under & Older Under & Older 24

25 HIV/AIDS Prevalence: Age Population by Age, St. Louis TGA, % 65 & Older 12% Disproportionate Under 13 20% Impact: year olds make up 89% of the PLWH/A population % PLWH/A by Age, St. Louis TGA; 2012, 2013 (n=6688) 65 & Older 4% (n=294) % (n=3255) % (n=2683) % (n=434) % Under & Older Under & Older 25
26 HIV/AIDS Prevalence COUNTY RACE GENDER AGE GROUP MOT Subpopulations

 Other/Unk/NR 17%")
 MSM 61% (n=4051)")
 MSM IDU MSM & IDU")
27 HIV/AIDS Prevalence: MOT PLWH/A by MOT, St. Louis TGA; 2012, 2013 (n=6688) Other/Unk/NR 17% (n=1113) Heterosexual 15% (n=1027) MSM 61% (n=4051) MSM & IDU 3% (n=203) IDU 4% (n=294) MSM IDU MSM & IDU Heterosexual Other/Unk/NR 27
28 HIV/AIDS Prevalence: MOT Trend 70% PLWH/A by MOT in St. Louis TGA, % 50% 40% 30% 20% 10% 0% , 2013 MSM IDU MSM & IDU Heterosexual Other/Unk/NR 28
29 HIV/AIDS Prevalence: MOT Trend 70% PLWH/A by MOT in St. Louis TGA, % 50% 40% 30% Continuing Trend: MSM exposure accounts for the majority of living HIV Disease cases; this trend has not changed since % 10% 0% , 2013 MSM IDU MSM & IDU Heterosexual Other/Unk/NR 29
30 HIV/AIDS Prevalence COUNTY RACE GENDER AGE GROUP MOT Subpopulations

31 Number of Cases HIV/AIDS Prevalence Subpopulation: Males, by Race HIV Disease Among Males by Race, St. Louis TGA; 2012, 2013 (n=5425) 60.0% 50.0% 49.8% 44.5% 40.0% 30.0% 20.0% 10.0% 0.0% 2.7% 2.9% Black White Hispanic Other/Unknown Race Missouri (as of 12/31/13) & Illinois (as of 12/31/12) 31
32 Percentage of Males HIV/AIDS Prevalence Subpopulation: Males by MOT & Race* 90.0% 80.0% 70.0% 60.0% 50.0% 40.0% 30.0% 20.0% 10.0% 0.0% HIV Disease Among Males by MOT & Race, St. Louis TGA; 2012, 2013 (n=5252) 69.6% 4.7% 82.5% 70.5% 14.2% 7.7% 9.4% 3.8% 5.5% 1.9% 3.8% 2.4% 3.4% 4.1% % % % Race, by Mode of Transmission MSM IDU MSM & IDU Heterosexual Other/Unk/NR 16.4% *Race category Other/Unknown was not stratified by Gender in this report 32
33 Number of Cases HIV/AIDS Prevalence Subpopulation: Females, by Race HIV Disease Among Females by Race, St. Louis TGA; 2012, 2013 (n=1263) 80.0% 70.0% 72.0% 60.0% 50.0% 40.0% 30.0% 20.0% 10.0% 0.0% 20.7% 2.8% 4.6% Black White Hispanic Other/Unknown Race Missouri (as of 12/31/13) & Illinois (as of 12/31/12) 33
34 Percentage of Females HIV/AIDS Prevalence Subpopulation: Females, by MOT & Race HIV Disease Among Females by MOT & Race, St. Louis TGA; 2012, 2013 (n=1205) 70.0% 60.0% 60.3% 60.5% 54.3% 50.0% 42.9% 40.0% 33.0% 30.0% 23.0% 20.0% 16.5% 10.0% 0.0% 6.7% 2.9% % % % Race, by MOT IDU Heterosexual Other/Unk/NR 34
35 Percentage of Males HIV/AIDS Prevalence 70.0% Subpopulation: Age & Race (MO) HIV Disease by Age & Race, St. Louis TGA; 2012, 2013 (n=6688) 60.0% 50.0% 40.0% 30.0% 45.1% 41.5% 31.6% 59.8% 53.6% 38.7% 50.5% 40.4% 20.0% 10.0% 0.0% 10.2% 7.0% 5.5% 6.4% 2.7% 0.5% 0.1% 1.6% 0.6% 1.7% 2.8% 0.0% % % % % Race, by Age Group Under & Older 35
36 Table of Contents Introduction St. Louis Transitional Grant Area Map HIV/AIDS Prevalence HIV/AIDS Unmet Need Summary 36
37 Table of Contents Introduction St. Louis Transitional Grant Area Map HIV/AIDS Prevalence HIV/AIDS Unmet Need Summary 37
38 HIV & AIDS is the number of newly diagnosed cases within a specific time period.
39 HIV & AIDS COUNTY RACE GENDER AGE GROUP MOT
40 HIV & AIDS COUNTY RACE GENDER AGE GROUP MOT
41 HIV/AIDS by County Overall Population HIV Disease HIV Disease HIV Disease in 2011 in 2012 in 2013 Cases Rate Cases Rate Cases Rate County (2010 Census) FRANKLIN CO JEFFERSON CO LINCOLN CO ST CHARLES CO ST LOUIS CITY ST LOUIS CO WARREN CO MO-TGA CLINTON JERSEY MADISON MONROE ST. CLAIR IL-TGA St. Louis TGA *2013 data is unavailable until July 2014 Significant rate change from 2012? 41
42 Persons per 100,000 HIV/AIDS by County 16.0 St. Louis TGA HIV Disease ( ) Years MO-TGA IL-TGA 42
43 HIV & AIDS COUNTY RACE GENDER AGE GROUP MOT
44 HIV/AIDS in the TGA - Race Missouri 2011 (n=164) 2012 (n=226) 2013 (n=180) 2011 (n=70) 2012 (n=60) 2013 (n=61) HIV (n=164) % HIV (n=226) % HIV (n=180) % AIDS (n=70) % AIDS (n=60) % AIDS (n=61) % Race/Ethnicity White % % % % % % Black % % % % % % Hispanic 2 1.2% 8 3.5% 7 3.9% 3 4.3% 3 5.0% 1 1.6% Other 2 1.2% 2 0.9% 4 2.2% 1 1.4% 0 0.0% 2 3.3% Unknown 1 0.6% 1 0.4% 1 0.6% 0 0.0% 0 0.0% 0 0.0% Total HIV (n=240) % HIV (n=146) % AIDS (n=122) % AIDS (n=127) % White % % % % Black % % % % Hispanic 6 2.5% 2 1.4% 4 3.3% 6 4.7% Other % 8 5.5% % % Unknown % % 5 4.1% 0 0.0% Total *2013 data is unavailable until July 2014 Illinois*
45 Percentage of Newly Diagnosed Cases HIV/AIDS Race -MO 80.0% HIV & AIDS Comparison, by Race - Missouri- TGA; % 60.0% 67.8% 62.3% 50.0% 40.0% 30.0% 20.0% 25.6% 32.8% 10.0% 0.0% 3.9% 1.6% 2.2% 3.3% 0.6% 0.0% White Black Hispanic Other Unknown Race HIV (n=180) AIDS (n=61) 45
46 Percentage of Newly Diagnosed Cases HIV/AIDS Race -MO 80.0% HIV & AIDS Comparison, by Race - Missouri- TGA; % 60.0% 50.0% 40.0% 32.8% 67.8% 62.3% Disproportionate impact: In Missouri-TGA, out of all the newly diagnosed cases of HIV or AIDS, the majority were Black. 30.0% 25.6% 20.0% 10.0% 0.0% 3.9% 1.6% 2.2% 3.3% 0.6% 0.0% White Black Hispanic Other Unknown Race HIV (n=180) AIDS (n=61) 46
47 Percentage of Newly Diagnosed Cases HIV/AIDS Race -IL HIV & AIDS Comparison, by Race - Illinois- TGA; % 50.0% 54.1% 54.3% 40.0% 30.0% 25.3% 26.8% 20.0% 14.2% 13.7% 10.0% 0.0% 4.7% 5.5% 1.4% 0.0% White Black Hispanic Other Unknown Race HIV (n=146) AIDS (n=127) 47
48 Percentage of Newly Diagnosed Cases HIV/AIDS Race -IL HIV & AIDS Comparison, by Race - Illinois- TGA; % 50.0% 40.0% 30.0% 25.3% 26.8% 54.1% 54.3% Disproportionate impact: In Illinois-TGA, out of all the newly diagnosed cases of HIV or AIDS, the majority were Black. 20.0% 14.2% 13.7% 10.0% 0.0% 4.7% 5.5% 1.4% 0.0% White Black Hispanic Other Unknown Race HIV (n=146) AIDS (n=127) 48
49 Percentage of Newly Diagnosed Cases HIV Comparison, Race - MO 80.0% 70.0% 60.0% HIV Comparison from , by Race - Missouri-TGA 66.8% 67.8% 64.0% 50.0% 40.0% 30.0% 20.0% 32.9% 28.3% 25.6% 10.0% 0.0% 1.2% 3.5% 3.9% 1.2% 0.9% 2.2% 0.6% 0.4% 0.6% White Black Hispanic Other Unknown Race 2011 (n=164) 2012 (n=226) 2013 (n=180) 49
50 Percentage of Newly Diagnosed Cases AIDS Comparison, Race - MO 70.0% 60.0% 50.0% 40.0% 30.0% AIDS Comparison from , by Race - Missouri-TGA 37.1% 41.7% 32.8% 57.1% 53.3% 62.3% 20.0% 10.0% 0.0% 4.3% 5.0% 3.3% 1.6% 1.4% 0.0% 0.0% 0.0% 0.0% White Black Hispanic Other Unknown Race 2011 (n=70) 2012 (n=60) 2013 (n=61) 50
51 HIV & AIDS COUNTY RACE GENDER AGE GROUP MOT
52 HIV/AIDS by Gender Missouri 2010 (n=229) 2011 (n=164) 2012 (n=226) 2013 (n=180) 2012 (n=71) 2013 (n=70) 2012 (n=60) 2013 (n=61) HIV (n=229) % HIV (n=164) % HIV (n=226) % HIV (n=180) % AIDS (n=71) % AIDS (n=70) % AIDS (n=60) % AIDS (n=61) % Age Male % % % % % % % % Female % % % % % % % % Illinois* Male % % Female % % Total

53 HIV/AIDS by Gender - Missouri HIV by Gender - Missouri-TGA, 2013 AIDS by Gender - Missouri-TGA, 2013 Female 16% Female 15% Male 84% Male 85% Male Female Male Female 53


54 HIV/AIDS by Gender - Illinois HIV by Gender - Illinois- TGA, 2012 AIDS by Gender - Illinois-TGA, 2012 Female 23% Female 32% Male 77% Male 68% Male Female Male Female 54
55 HIV & AIDS COUNTY RACE GENDER AGE GROUP MOT
56 HIV/AIDS in the TGA - Age Missouri 2010 (n=229) 2011 (n=164) 2012 (n=226) 2013 (n=180) 2010 (n=71) 2011 (n=70) 2012 (n=60) 2013 (n=61) HIV (n=229) % HIV (n=164) % HIV (n=226) % HIV (n=180) % AIDS (n=71) % AIDS (n=70) % AIDS (n=60) % AIDS (n=61) % Age Under % 1 0.6% 2 0.9% 1 0.6% 0 0.0% 0 0.0% 0 0.0% 0 0.0% % % % % % % % % % % % % % % % % % % % % % % % % 65 & Older 1 0.4% 3 1.8% 1 0.4% 0 0.0% 1 1.4% 2 2.9% 1 1.7% 2 3.3% Total HIV (n=56) % AIDS (n=47) % Under % 3 6.4% % % % % 65 & Older 0 0.0% 0 0.0% Total *2013 data is unavailable until July 2014 Illinois*
57 Percentage of Newly Diagnosed Cases HIV/AIDS, Age - MO HIV & AIDS Comparison, by Age - Missouri-TGA, % 45.0% 42.8% 41.7% 45.9% 40.0% 35.0% 32.8% 30.0% 25.0% 20.0% 15.0% 10.0% 18.0% 15.0% 5.0% 0.0% 3.3% 0.6% 0.0% 0.0% Under & Older Age Groups HIV (n=180) AIDS (n=61) 57

58 Percentage of Newly Diagnosed Cases HIV/AIDS, Age - MO HIV & AIDS Comparison, by Age - Missouri-TGA, % 45.0% 40.0% 35.0% 30.0% 42.8% Key point: The majority of newly diagnosed AIDS cases are in the older age groups. 41.7% 45.9% 32.8% 25.0% 20.0% 15.0% 10.0% 18.0% 15.0% 5.0% 0.0% 3.3% 0.6% 0.0% 0.0% Under & Older Age Groups HIV (n=180) AIDS (n=61) 58

59 Percentage of Newly Diagnosed Cases HIV/AIDS, Age - MO 50.0% 45.0% 40.0% 35.0% 30.0% 25.0% HIV & AIDS Comparison, by Age - Missouri-TGA, % 41.7% 45.9% Disproportionate impact: Over 80% of newly diagnosed 32.8% HIV cases are in the & age group. 20.0% 15.0% 10.0% 18.0% 15.0% 5.0% 0.0% 3.3% 0.6% 0.0% 0.0% Under & Older Age Groups HIV (n=180) AIDS (n=61) 59
 AIDS (n=47) 60")
60 Percentage of Newly Diagnosed Cases HIV/AIDS, Age - IL HIV & AIDS Comparison, by Age - Illinois-TGA, % 63.8% 60.0% 50.0% 40.0% 37.5% 35.7% 30.0% 26.8% 29.8% 20.0% 10.0% 0.0% 6.4% 0.0% 0.0% Under & Older Age Groups HIV (n=56) AIDS (n=47) 60
61 Percentage of Newly Diagnosed Cases HIV Comparison, Age - MO 60.0% HIV Comparison from , by Age - Missouri-TGA 50.0% 40.0% 30.0% 42.8% 37.2% 34.9% 34.1% 51.8% 47.2% 43.8% 41.7% 20.0% 10.0% 0.0% 16.6% 17.7% 15.0% 11.6% 0.9% 0.6% 0.9% 0.6% 1.8% 0.4% 0.4% 0.0% Under & Older Age Groups 2010 (n=229) 2011 (n=164) 2012 (n=226) 2013 (n=180) 61
62 Percentage of Newly Diagnosed Cases HIV Comparison, Age - MO 60.0% HIV Comparison from , by Age - Missouri-TGA 50.0% 40.0% 30.0% 20.0% 10.0% 42.8% 37.2% 34.9% 34.1% 47.2% 51.8% 43.8% 41.7% Disproportionate impact: From 2010 to 2013, this age group saw an increase in the number of newly diagnosed HIV cases. 16.6% 17.7% 15.0% 11.6% 0.0% 0.9% 0.6% 0.9% 0.6% 1.8% 0.4% 0.4% 0.0% Under & Older Age Groups 2010 (n=229) 2011 (n=164) 2012 (n=226) 2013 (n=180) 62
63 Percentage of Newly Diagnosed Cases AIDS Comparison, Age MO 60.0% AIDS Comparison from 2012 to 2013, by Age - Missouri-TGA 50.0% 40.0% 30.0% 51.7% 45.9% 40.8% 41.4% 38.0% 37.1% 35.0% 32.8% 20.0% 19.7% 18.6% 18.0% 10.0% 0.0% 11.7% 2.9% 3.3% 1.4% 1.7% 0.0% 0.0% 0.0% 0.0% Under & Older Age Groups 2010 (n=71) 2011 (n=70) 2012 (n=60) 2013 (n=61) 63
64 HIV & AIDS COUNTY RACE GENDER AGE GROUP MOT
65 HIV/AIDS in the TGA - MOT Missouri 2010 (n=164) 2011 (n=164) 2012 (n=226) 2013 (n=180) 2010 (n=71) 2011 (n=70) 2012 (n=60) 2013 (n=61) HIV (n=164) % HIV (n=164) % HIV (n=226) % HIV (n=180) % AIDS (n=71) % AIDS (n=70) % AIDS (n=60) % AIDS (n=61) % MOT MSM % % % % % % % % IDU 6 2.6% 4 2.4% 6 2.7% 3 1.7% 0 0.0% 2 2.9% 0 0.0% 0 0.0% MSM & IDU 2 0.9% 0 0.0% 4 1.8% 3 1.7% 1 1.4% 0 0.0% 0 0.0% 0 0.0% Heterosexual % % % % 4 5.6% % % % Other/NIR % % % % % % % % Total HIV (n=240) % HIV (n=146) % % AIDS (n=127) % MSM % % 39.3% % IDU % 7 4.8% 6.6% % MSM & IDU 1 0.4% 1 0.7% 1.6% 5 3.9% Heterosexual % % 20.5% % Other/NIR % % 32.0% % Total *2013 data is unavailable until July 2014 Illinois*
66 Percentage of Newly Diagnosed Cases HIV/AIDS, MOT - MO 70.0% 60.0% HIV & AIDS Comparison, by MOT - Missouri- TGA, % 55.7% 50.0% 40.0% 30.0% 31.1% 20.0% 16.1% 13.1% 18.9% 10.0% 0.0% 1.7% 0.0% 1.7% 0.0% MSM IDU MSM & IDU Heterosexual Other/NIR Mode of Transmission HIV (n=180) AIDS (n=61) 66
67 Percentage of Newly Diagnosed Cases HIV/AIDS, MOT - IL 50.0% HIV & AIDS Comparison, by MOT - Illinois-TGA, % 43.2% 40.0% 35.0% 38.6% 34.9% 30.0% 25.0% 26.8% 22.0% 20.0% 15.0% 10.0% 5.0% 0.0% 16.4% 8.7% 4.8% 3.9% 0.7% MSM IDU MSM & IDU Heterosexual Other/NIR Mode of Transmission HIV (n=146) AIDS (n=127) 67
68 Percentage of Newly Diagnosed Cases HIV Comparison, MOT - MO 70.0% 60.0% HIV Comparison from , MOT - Missouri-TGA 64.0% 62.4% 61.7% 59.0% 50.0% 40.0% 30.0% 20.0% 16.1% 30.1% 26.5% 23.2% 18.9% 10.0% 0.0% 10.4% 7.4% 6.6% 2.6% 2.4% 2.7% 1.7% 0.9% 1.8% 1.7% 0.0% MSM IDU MSM & IDU Heterosexual Other/NIR Mode of Transmission 2010 (n=164) 2011 (n=164) 2012 (n=226) 2013 (n=180) 68
69 Percentage of Newly Diagnosed Cases AIDS Comparison, MOT - MO 80.0% 70.0% AIDS Comparison from , MOT - Missouri-TGA 71.4% 60.0% 50.0% 40.0% 30.0% 50.7% 48.3% 55.7% 42.3% 41.7% 31.1% 20.0% 10.0% 0.0% 15.7% 13.1% 10.0% 10.0% 5.6% 2.9% 0.0% 0.0% 0.0% 1.4% 0.0% 0.0% 0.0% MSM IDU MSM & IDU Heterosexual Other/NIR Mode of Transmission 2010 (n=71) 2011 (n=70) 2012 (n=60) 2013 (n=61) 69
70 Table of Contents Introduction St. Louis Transitional Grant Area Map HIV/AIDS Prevalence HIV/AIDS Unmet Need Summary 70
71 Unmet Need Unmet Need is defined as the proportion of people living with HIV/AIDS in our region who do not have evidence of HIV medical care In 2013, the St. Louis TGA (Missouri) reported 2,861 people living with HIV and 2,777 people living with AIDS That same year, 23% of people living with AIDS and 43% living with HIV in our region did not have evidence of care. Therefore, unmet need among PLWH/A in 2013 was 35% *Missouri Data is for cases tested for CD4 or viral load 71
72 Unmet Need Missouri-TGA Race Trend line Black/African American Male 43.5% 34.6% 32.5% Black/African American Female 41.2% 28.9% 27.0% White Male 46.8% 37.2% 35.4% White Female 45.5% 25.5% 26.9% Hispanic 51.5% 42.8% 39.9% Other / UNKNOWN 43.2% 34.7% 31.3% Gender Male 45.3% 36.0% 34.1% Female 42.1% 28.7% 27.0% Mode of Exposure MSM 44.4% 35.8% 34.0% IDU 39.9% 34.1% 32.7% MSM/IDU 44.7% 32.3% 30.1% HRH 44.5% 31.2% 29.0% Pediatric Exposure 48.7% 41.5% 41.9% Other 57.7% 37.5% 36.0% Not Reported 47.4% 34.1% 31.9% Current Age 0-12 yrs 66.7% 57.9% 52.6% % 28.2% 28.6% % 34.9% 32.5% % 34.3% 32.7% 65 & older 58.1% 45.4% 42.3% Total 44.8% 34.8% 32.9% *Missouri Data is for cases tested for CD4 or viral load 72
73 Unmet Need Missouri-TGA Race Trend line Black/African American Male 43.5% 34.6% 32.5% Black/African American Female 41.2% 28.9% 27.0% White Male 46.8% 37.2% 35.4% White Female 45.5% 25.5% 26.9% Hispanic 51.5% 42.8% 39.9% Other / UNKNOWN 43.2% 34.7% 31.3% Gender Male 45.3% 36.0% 34.1% Female 42.1% 28.7% 27.0% Mode of Exposure MSM 44.4% 35.8% 34.0% IDU 39.9% 34.1% 32.7% MSM/IDU 44.7% 32.3% 30.1% HRH 44.5% 31.2% 29.0% Pediatric Exposure 48.7% 41.5% 41.9% Other 57.7% 37.5% 36.0% Not Reported 47.4% 34.1% 31.9% Current Age 0-12 yrs 66.7% 57.9% 52.6% % 28.2% 28.6% % 34.9% 32.5% % 34.3% 32.7% 65 & older 58.1% 45.4% 42.3% Total 44.8% 34.8% 32.9% *Missouri Data is for cases tested for CD4 or viral load 73
74 Table of Contents Introduction St. Louis Transitional Grant Area Map HIV/AIDS Prevalence HIV/AIDS Unmet Need Summary 74
75 HIV/AIDS Trends 5638 cases of HIV/AIDS in the MO-TGA as of 2013, an increase of 2.8% from 2012 (n=5482, 2012) 180 new cases of HIV in the MO-TGA in 2013, a decrease of 20.4% from 2012 (n=226, 2012) 61 new cases of AIDS in the MO-TGA in 2013, a increase of 1.7% from 2012 (n=60, 2012) 75
76 HIV/AIDS Trends COUNTY o The City of St. Louis has the highest rates of HIV Disease prevalence RACE o Blacks have the highest rate of HIV Disease prevalence (Among blacks, the prevalence was cases per 100,000 persons in the TGA) o Blacks make up the majority of newly diagnosed cases of HIV or AIDS GENDER o Males have the highest rate of HIV disease prevalence in the TGA (410.2 per 100,000 males), which is more than FOUR AND A HALF times the rate of prevalence for females (89.7 per 100,000 females) 76
77 HIV/AIDS Trends AGE GROUP o year olds make up 89% of the PLWH/A population o Over 80% of newly diagnosed HIV cases are in the & age group o From 2010 to 2013, the age group saw an increase in the number of newly diagnosed HIV cases MOT o MSM exposure accounts for the majority of living HIV Disease cases; this trend has not changed since 2009 Subpopulations: o The majority of males with HIV Disease are Black(50%), 45% are White o The majority of females with HIV Disease are Black (72.0%) o Blacks, Hispanics, and Other Races have higher prevalence rates of HIV Disease in the age group than the age group 77

78 Metro St. Louis HIV Epidemiological Profile Saint Louis TGA Part A Planning Council Prepared by the City of St. Louis Department of Health s Center for Health Information, Research, and Planning 05/14/2014
Missouri St. Louis TGA 2016 HIV Epidemiological Profile
 Missouri St. Louis TGA 2016 HIV Epidemiological Profile St. Louis TGA Part A Planning Council Prepared by the City of St. Louis Department of Health Center for Health Information, Research, and Planning
Missouri Statewide Integrated HIV Prevention and Care Plan, including the Statewide Coordinated Statement of Need, CY
 Missouri Statewide Integrated HIV Prevention and Care Plan, including the Statewide Coordinated Statement of Need, CY 2017-2021 September 20, 2016 Developed through the collaborative efforts of the following
State of Alabama HIV Surveillance 2014 Annual Report
 State of Alabama HIV Surveillance 2014 Annual Report Prepared by: Division of STD Prevention and Control HIV Surveillance Branch Contact Person: Richard P. Rogers, MS, MPH richard.rogers@adph.state.al.us
State of Alabama HIV Surveillance 2013 Annual Report Finalized
 State of Alabama HIV Surveillance 2013 Annual Report Finalized Prepared by: Division of STD Prevention and Control HIV Surveillance Branch Contact Person: Allison R. Smith, MPH Allison.Smith@adph.state.al.us
HIV/AIDS Epidemiology Partnership 10
 Bureau of HIV/AIDS Surveillance Section (85) 245-443, or SC 25-443 Incidence data as of 12/31/9 Prevalence and Death data as of 4/27/9 HIV/AIDS Epidemiology Partnership 1 Broward County Excluding Dept.
State of Alabama HIV Surveillance 2012 Annual Report Finalized
 State of Alabama HIV Surveillance 2012 Annual Report Finalized Prepared by: Division of HIV/AIDS Prevention and Control HIV Surveillance Branch Contact Person: Allison R. Smith, MPH Allison.Smith@adph.state.al.us
HIV/AIDS Epidemiology in Alameda County: State of the County Report
 Lake Merritt, Oakland,California HIV/AIDS Epidemiology in Alameda County: State of the County Report Muntu Davis, MD, MPH County Health Officer and Public Health Director Alameda County White House Office
Miami-Dade County HIV/AIDS Epidemiological Data. July 8, 2010
 Miami-Dade County HIV/AIDS Epidemiological Data July 8, 21 Data provided by the Florida Department of Health HIV/AIDS Surveillance Program Prepared by Behavioral Science Research EPI DATA HELPS US Fulfill
Epidemiologic Trends in HIV in Illinois. Prepared by Cheryl Ward for the 24 th Annual Illinois HIV/STD Conference
 Epidemiologic Trends in HIV in Illinois Prepared by Cheryl Ward for the 24 th Annual Illinois HIV/STD Conference October 28, 2015 Learning Objectives To describe epidemiologic trends in HIV/AIDS in Illinois
New Jersey HIV/AIDS Epidemiologic Overview, 2017 (Data based upon the HIV/AIDS Reporting System ehars, unless otherwise noted.)
") New Jersey HIV/AIDS Epidemiologic Overview, 2017 (Data based upon the HIV/AIDS Reporting System ehars, unless otherwise noted.) New Jersey Department of Health Division of HIV, STD, TB Services INTRODUCTION
New Jersey HIV/AIDS Epidemiologic Overview, 2017 (Data based upon the HIV/AIDS Reporting System ehars, unless otherwise noted.) New Jersey Department of Health Division of HIV, STD, TB Services INTRODUCTION
Epidemiology of HIV Among Women in Florida, Reported through 2014
 To protect, promote and improve the health of all people in Florida through integrated state, county, and community efforts. Created: 12/4/14 Revision: 1/27/15 Epidemiology of HIV Among Women in Florida,
Estimated HIV/AIDS Newly Diagnosed Cases In New Jersey
 Introduction n As of 12/31/2009 there were more than 73,800 HIV/ AIDS cases in New Jersey including 1,353 pediatric HIV/AIDS cases. Over 4,000 children were also exposed to HIV. Over half of the cumulative
BALTIMORE COUNTY HIV/AIDS EPIDEMIOLOGICAL PROFILE Fourth Quarter Data reported throuh December 31, 2007
 Fourth Quarter 2007 - Data reported throuh AIDS Administration Maryland Department of Health and Mental Hygiene www.dhmh.state.md.us/aids/ 1-800-358-9001 SPECIAL NOTE ON HIV REPORTING The Maryland HIV/AIDS
FULTON COUNTY GOVERNMENT RYAN WHITE PART A PROGRAM. Atlanta Eligible Metropolitan Area HIV/AIDS Unmet Need Estimate
 FULTON COUNTY GOVERNMENT RYAN WHITE PART A PROGRAM Atlanta Eligible Metropolitan Area HIV/AIDS Unmet Need Estimate Southeast AIDS Training and Education Center Department of Family and Preventative Medicine
Bassett Medical Center PPS Community Profile
 Bassett Medical Center PPS Community Profile Counties served: Delaware, Herkimer, Madison, Otsego, and Schoharie DEMOGRAPHICS 1 The Bassett Medical Center PPS s total population is 278,214. Age: Residents
HIV & AIDS Cases in Alameda County
 HIV & AIDS Cases in Alameda County Presentation to the CCPC August 24, 2011 Elaine Bautista & Alex Marr What is Epidemiology? The study of the distributions (who, where and when) and determinants (what
SCOPE OF HIV/AIDS IN MINNESOTA
 SCOPE OF HIV/AIDS IN MINNESOTA National Perspective Compared to the rest of the nation, Minnesota is considered to be a low- to-moderate HIV/AIDS incidence state. In 2013 (the most recent year for which
NEW JERSEY HIV/AIDS REPORT
 NEW JERSEY HIV/AIDS REPORT December 31, 2014 Chris Christie Governor Kim Guadagno Lt. Governor Public Health Services Branch Division of HIV, STD and TB Services preventing disease with care Mary E. O
NEW JERSEY HIV/AIDS REPORT
 NEW JERSEY HIV/AIDS REPORT December 31, 2009 Chris Christie Governor Kim Guadagno Lt. Governor Public Health Services Branch Division of HIV/AIDS Services preventing disease with care Poonam Alaigh, MD,
Outline. AIDS & HIV in the Travis County. Global estimates for adults & children end HIV incidence worldwide
 Outline AIDS & HIV in the Joshua Vest Epidemiologist Austin/ Health & Human Services Department Worldwide HIV/AIDS surveillance National Prevalence Trends Disparities Mortality Modes of exposure Risk factors
2017 HIV/AIDS Epidemiology Update 2016 Data. James Dowling Health Program Coordinator Division of Public Health
 2017 HIV/AIDS Epidemiology Update 2016 Data James Dowling Health Program Coordinator Division of Public Health Primary Sources Evaluation HIV/AIDS Reporting System (EHARS) Collects infection data from
Central New York Care Collaborative, Inc. PPS Community Profile
 Central New York Care Collaborative, Inc. PPS Community Profile Counties served: Cayuga, Lewis, Madison, Oneida, Onondaga, and Oswego DEMOGRAPHICS 1 The total population of the Central New York Care Collaborative
New Jersey HIV/AIDS Epidemiologic Profile 2010
 New Jersey HIV/AIDS Epidemiologic Profile 00 Estimated HIV/AIDS Cases, Deaths and Persons Living with HIV/AIDS -- New Jersey, 989-008 In 008, the latest complete year of diagnosis data, there were 350
HIV Incidence Report, Sexually Transmitted Diseases, HIV and Tuberculosis Section, Epidemiology and Surveillance Unit
 HIV Incidence Report, 2017 Sexually Transmitted Diseases, HIV and Tuberculosis Section, Epidemiology and Surveillance Unit Introduction (I) These two introduction slides provide a general context for the
New Jersey HIV/AIDS Epidemiologic Profile 2011
 New Jersey HIV/AIDS Epidemiologic Profile 2011 HIV/AIDS in New Jersey New Jersey ranks 5th among 46 states with long-term namebased reporting in the rate of HIV (not AIDS) infection among adults and adolescents
Minneapolis Department of Health and Family Support HIV Surveillance
 Rate per 1, persons 2 21 22 23 24 25 26 27 28 29 21 Rate per 1, persons Minneapolis Department of Health and Family Support HIV Surveillance Research Brief, September 212 Human immunodeficiency virus (HIV)
HIV Integrated Epidemiological Profile December 2011 State of Alabama
 HIV Integrated Epidemiological Profile December 2011 State of Alabama 12/31/2011 Alabama Department of Public Health Division of HIV/AIDS Prevention and Control TABLE OF CONTENTS List of Figures 3 List
2018 HIV/AIDS Epidemiology Update 2017 Data. James Dowling Health Program Coordinator Division of Public Health
 2018 HIV/AIDS Epidemiology Update 2017 Data James Dowling Health Program Coordinator Division of Public Health Primary Sources Evaluation HIV/AIDS Reporting System (EHARS) Collects infection data from
State of Alabama AIDS Drug Assistance Program (ADAP) Quarterly Report
 Quarterly Report") State of Alabama AIDS Drug Assistance Program (ADAP) Quarterly Report This report reflects active clients currently enrolled in ADAP Full-pay Prescription Program (ADAP-Rx), Alabama s Insurance Assistance
State of Alabama AIDS Drug Assistance Program (ADAP) Quarterly Report This report reflects active clients currently enrolled in ADAP Full-pay Prescription Program (ADAP-Rx), Alabama s Insurance Assistance
HIV MINORITY SERVING FAITH BASED COMMUNITIES NEEDS ASSESSMENT IN BATON ROUGE, LOUISIANA
 HIV MINORITY SERVING FAITH BASED COMMUNITIES NEEDS ASSESSMENT IN BATON ROUGE, LOUISIANA Project Partners: Malissa Jackson CEO, Eutopia of Louisiana Rev. A.J. Johnson CEO Baton Rouge AIDS Society Community
NEW JERSEY HIV/AIDS REPORT
 NEW JERSEY HIV/AIDS REPORT June 30, 2009 Jon S. Corzine Governor Public Health Services Branch Division of HIV/AIDS Services preventing disease with care Heather Howard Commissioner 2 Division of HIV/AIDS
Working with Health Departments: Ingredients for Effective Collaboration Between Health Departments and CFARs. Shanell L. McGoy, Ph.D.
 Working with Health Departments: Ingredients for Effective Collaboration Between Health Departments and CFARs Shanell L. McGoy, Ph.D. MPH HIV/AIDS in the Southeast: 2 nd Annual CFAR Workshop to Address
HIV/AIDS in the Houston EMA and HSDA
 The HIV/AIDS epidemic has affected people of all gender, age and racial/ethnic groups in the Houston EMA and HSDA. This effect, however, has not been the same for all groups. In the beginning of the epidemic,
Strategic Data Communication for HIV Prevention Programs. January 20, 2016
 Strategic Data Communication for HIV Prevention Programs January 20, 2016 Introduction o NASTAD Webinar Agenda HIV Prevention Program Data Quality Assurance o Nicole Kolm-Valdivia, Iowa Department of Public
2014 County of Marin Fact Sheet: HIV/AIDS in Marin County
 2014 County of Marin Fact Sheet: HIV/AIDS in Marin County HIV/AIDS epidemiology data is from the enhanced HIV/AIDS Reporting System (ehars) maintained by the Office of AIDS. The data presented here are
Linkage of hepatitis and HIV surveillance systems to improve completeness of injection drug use risk data for co-infected Floridians
 Linkage of hepatitis and HIV surveillance systems to improve completeness of injection drug use risk data for co-infected Floridians Shana Geary, MPH, CPH United States Conference on AIDS September 7,
Table 1. Number I and Rate II (per 100,000) of Persons Living with HIV (non-aids) and AIDS by Residence, Age, and Gender -- Minnesota, 2013
 of Persons Living with HIV (non-aids) and AIDS by Residence, Age, and Gender -- Minnesota, 2013") Table 1. Number I and Rate II (per 100,000) of Persons Living with HIV (non-) and by Residence, Age, and Gender -- Minnesota, 2013 Group HIV (non-) HIV/ Cases % Cases % Cases % Prevalence Rate Residence
Table 1. Number I and Rate II (per 100,000) of Persons Living with HIV (non-) and by Residence, Age, and Gender -- Minnesota, 2013 Group HIV (non-) HIV/ Cases % Cases % Cases % Prevalence Rate Residence
HAWAII 2015 HIV CARE CONTINUUM
 HAWAII 2015 HIV CARE CONTINUUM Fenfang Li, PHD, MPH Communicable Disease and Public Health Nursing Division State of Hawaii Department of Health January 16, 2018 UPDATED NATIONAL HIV/AIDS STRATEGY (NHAS)
New Jersey Statewide Coordinated Statement of Need
 New Jersey Department of Health and Senior Services Division of HIV, STD and TB Services New Jersey Statewide Coordinated Statement of Need June 2013 Statewide Coordinated Statement of Need Introduction:
Forsyth County, North Carolina 2013 HIV/STD Surveillance Report
 Forsyth County, North Carolina 2013 HIV/STD Surveillance Report Forsyth County Department of Public Health Division of Epidemiology and Surveillance 799 N. Highland Avenue Winston-Salem, NC 27102-0686
PREVENTION OF HIV IN THE TIMES OF PREP. Daniela Chiriboga, MD Florida Department of Health in Polk County
 PREVENTION OF HIV IN THE TIMES OF PREP Daniela Chiriboga, MD Florida Department of Health in Polk County MAKING THE CASE FOR PREVENTION The Epidemic in Florida Population in 2014: 19.6 million (3 rd in
HIV/AIDS EPIDEMIOLOGY. Rachel Rivera, MD Assistant Professor Infectious Diseases UT Southwestern Medical Center November 14, 2014
 HIV/AIDS EPIDEMIOLOGY Rachel Rivera, MD Assistant Professor Infectious Diseases UT Southwestern Medical Center November 14, 2014 HOUSEKEEPING ANNOUNCEMENTS AUDIO Can you hear us? You will be accessing
Uvalde HSDA Counties: Dimmitt, Edwards, Kinney, LeSalle, Maverick, Real, Uvalde, Val Verde, Zavala
 Uvalde HSDA Draft Uvalde HSDA Counties: Dimmitt, Edwards, Kinney, LeSalle, Maverick, Real, Uvalde, Val Verde, Zavala Epi Profile In the Uvalde HSDA, the number of new diagnoses has remained flat and stable
HIV & HCV in TN: State of the State
 HIV & HCV in TN: State of the State Vanderbilt CCC HIV Symposium Nashville, TN / November 2, 2018 Carolyn Wester, MD, MPH TDH HIV/STD/VH Program Outline HIV Epidemiology HIV Continuum of Care HIV Vulnerability
Palm Beach County Integrated Prevention and Patient Care Plan
 Palm Beach County Integrated Prevention and Patient Care Plan Introduction The Palm Beach County Coordinated Services Network (CSN) is a partnership of state and federal funding sources, planning authorities,
Forsyth County, North Carolina 2012 HIV/STD Surveillance Report
 Forsyth County, North Carolina 2012 HIV/STD Surveillance Report Forsyth County Department of Public Health Division of Epidemiology and Surveillance 799 N. Highland Avenue Winston-Salem, NC 27102-0686
Status of the HIV/AIDS Epidemic San Francisco
 Status of the HIV/AIDS Epidemic San Francisco Applied Research, Community Health, Epidemiology and Surveillance Branch Presented to HIV Health Services Planning Council July 2014 1 HIV/AIDS Surveillance
TABLE OF CONTENTS. Contributors Letter of Concurrence Executive Summary Introduction... 7
 TABLE OF CONTENTS Contributors... 3 Letter of Concurrence... 4 Executive Summary... 5 Introduction... 7 I. Description of the 2009 SCSN Process... 9 II. Ryan White HIV/AIDS Programs in Illinois... 10 III.
Nassau Queens PPS Community Profile
 Nassau Queens PPS Community Profile Counties served: Nassau and Queens DEMOGRAPHICS 1 The total population of the two counties served by the Nassau Queens (Nassau University Medical Center) PPS is 3,631,203.
HIV/AIDS IN MIAMI-DADE COUNTY THROUGH 2015
 HIV/AIDS IN MIAMI-DADE COUNTY THROUGH 2015 Florida Department of Health in Miami-Dade County, Epidemiology, Disease Control & Immunization Services, HIV/AIDS Surveillance Unit By Rodolfo Boucugnani Please
BALTIMORE CITY HIV/AIDS EPIDEMIOLOGICAL PROFILE Second Quarter Data reported through June 30, 2008
 BALTIMORE CITY HIV/AIDS EPIDEMIOLOGICAL PROFILE Second Quarter 2008 - Data reported through June 30, 2008 AIDS Administration Maryland Department of Health and Mental Hygiene www.dhmh.state.md.us/aids/
City and County of Denver Sexually Transmitted Infections Surveillance Report 2005
 City and County of Denver Sexually Transmitted Infections Surveillance Report 2005 Denver Public Health Department Sexually Transmitted Disease Control Program November 2006 This report was prepared by:
Millennium Collaborative Care PPS Community Profile
 Millennium Collaborative Care PPS Community Profile Counties served: Allegany, Cattaraugus, Chautauqua, Erie, Genesee, Niagara, Orleans, and Wyoming DEMOGRAPHICS 1 Millennium Collaborative Care (MCC) PPS
County of Orange Health Care Agency, Public Health Services HIV/AIDS Surveillance and Monitoring Program
 HIV DISEASE SURVEILLANCE STATISTICS 2010 County of Orange Health Care Agency, Public Health Services HIV DISEASE SURVEILLANCE STATISTICS, 2010 David L. Riley Director County of Orange, Health Care Agency,
Bronx Community Health Dashboard: HIV and AIDS
 Bronx Community Health Dashboard: HIV and AIDS Created: 5/4/17 Last Updated: 3//19 See last slide for more information about this project. 1 Overview of HIV/AIDS in the Bronx Disparities exist in early
Westchester Medical Center PPS Community Profile
 Westchester Medical Center PPS Community Profile Counties served: Delaware, Dutchess, Orange, Putnam, Rockland, Sullivan, Ulster, Westchester DEMOGRAPHICS 1 The eight counties served by the Westchester
HIV/AIDS Surveillance Technical Notes
 HIV/AIDS Surveillance Technical Notes Surveillance of HIV/AIDS The Minnesota Department of Health (MDH) collects case reports of HIV infection and AIDS diagnoses through a passive and active HIV/AIDS surveillance
Human Immunodeficiency Virus and Acquired Immunodeficiency Syndrome Among Adults and Adolescents in New Mexico 2014
 Human Immunodeficiency Virus and Acquired Immunodeficiency Syndrome Among Adults and Adolescents in New Mexico 2014 HIV Epidemiology and Surveillance Program Infectious Disease Epidemiology Bureau Epidemiology
Needs Assessment of People Living with HIV in the Boston EMA. Needs Resources and Allocations Committee March 10 th, 2016
 Needs Assessment of People Living with HIV in the Boston EMA Needs Resources and Allocations Committee March 10 th, 2016 Presentation Overview 1. What is a Needs Assessment? 2. The Numbers o Epidemiological
HIV EPIDEMIOLOGY IN NEW YORK CITY
 HIV EPIDEMIOLOGY IN NEW YORK CITY Ellen Weiss Wiewel, MHS HIV Epidemiology and Field Services Program New York City Department of Health and Mental Hygiene http://www.nyc.gov/html/doh/html/dires/hivepi.shtml
Sexually Transmitted Diseases, Hepatitis C and HIV Epidemiology in North Dakota
 Sexually Transmitted Diseases, Hepatitis C and HIV Epidemiology in North Dakota Sarah Weninger, MPH HIV.STD.Viral Hepatitis Prevention Coordinator Great Plains Area Indian Health Service Public Health
Clinical Quality Management Program. April 25th, 2018 Katie Cobb & K.C. D'Onfro Senior Quality Management Coordinators Ryan White Services Division
 Clinical Quality Management Program April 25th, 2018 Katie Cobb & K.C. D'Onfro Senior Quality Management Coordinators Ryan White Services Division 1 Learning Objectives Epidemiological profile of the EMA/Part
Ryan White Part A Overview Kimberlin Dennis Melissa Rodrigo March 21, 2018
 Ryan White Part A Overview Kimberlin Dennis Melissa Rodrigo March 21, 2018 Part A Program = Partnership Regional HIV Planning Council Cuyahoga County Board of Health One Purpose Ryan White Legislation
Persons Living with HIV/AIDS, San Mateo County Comparison
 Persons Living with HIV/AIDS, San Mateo County Comparison As of December 2008, there were 1,152 persons living with HIV or HIV/AIDS in San Mateo County (Table 1). Compared to California and the United
Sexually Transmitted Disease (STD) Surveillance Report, 2017
 Surveillance Report, 2017") This document is made available electronically by the Minnesota Legislative Reference Library as part of an ongoing digital archiving project. http://www.leg.state.mn.us/lrl/lrl.asp Sexually Transmitted
This document is made available electronically by the Minnesota Legislative Reference Library as part of an ongoing digital archiving project. http://www.leg.state.mn.us/lrl/lrl.asp Sexually Transmitted
Why Are We Concerned About Adolescents Particularly Adolescent Girls and Young Women and HIV?
 Why Are We Concerned About Adolescents Particularly Adolescent Girls and Young Women and HIV? Epidemiology of HIV in Adolescent & Young Women Lynne M. Mofenson MD Elizabeth Glaser Pediatric AIDS Foundation
TB/HIV/STD Epidemiology and Surveillance Branch. First Annual Report, Dated 12/31/2009
 TB/HIV/STD Epidemiology and Surveillance Branch First Annual Report, Dated 12/31/29 This Enhanced Perinatal Surveillance Report is the first annual report generated by the Texas Department of State Health
STD, HIV and Hepatitis C 2017 Data Release. April 24,2018
 STD, HIV and Hepatitis C 2017 Data Release April 24,2018 Acronyms MDH = Minnesota Department of Health STD = Sexually transmitted disease MSM = Men who have sex with men HCV = Hepatitis C virus HBV =Hepatitis
HIV Viral Suppression, 37 States and the District of Columbia, 2014
 DOI 10.1007/s10900-017-0427-3 ORIGINAL PAPER HIV Viral Suppression, 37 States and the District of Columbia, 2014 Kristen L. Hess 1 H. Irene Hall 1 Published online: 18 September 2017 Springer Science+Business
Alabama Department of Public Health. Sexually Transmitted Diseases
 Alabama Department of Public Health Sexually Transmitted Diseases Annual Report 29 August 16, 21 Dear Alabama Stakeholder: The Division of Sexually Transmitted Disease Prevention and Control of the Alabama
HIV/AIDS in Massachusetts
 HIV/AIDS in Massachusetts Challenges and Opportunities to Enhance the Public Health Response May 14, 2013 Fenway Community Health Center H. Dawn Fukuda, Director Office of HIV/AIDS Bureau of Infectious
In the Abilene HSDA, the number of new diagnoses has remained flat and stable for the past several years.
 DRAFT-Abilene HSDA Abilene HSDA Draft Abilene HSDA Counties: Brown, Callahan, Coleman, Comanche, Eastland, Fisher, Haskell, Jones, Kent, Knox, Mitchell, Nolan, Runnels, Scurry, Shackelford, Stephens, Stonewall,
Illustrating HIV/AIDS in the United States Update
 Illustrating HIV/AIDS in the United States 2016 Update About AIDSVu AIDSVu is a compilation of interactive, online maps that allows users to visually explore the HIV epidemic in the U.S. alongside critical
HIV SEMI ANNUAL SURVEILLANCE REPORT
 HIV SEMI ANNUAL SURVEILLANCE REPORT San Francisco Department of Public Health HIV Cases Reported Through December 2017 Contents Page Surveillance Summary... 1 Figure 1: Diagnoses of HIV infection, HIV
HIV SEMI ANNUAL SURVEILLANCE REPORT
 HIV SEMI ANNUAL SURVEILLANCE REPORT San Francisco Department of Public Health HIV Cases Reported Through June 2018 Contents Page Surveillance Summary... 1 Figure 1: Diagnoses of HIV infection, HIV deaths
HIV Surveillance in Urban and Nonurban Areas. National Center for HIV/AIDS, Viral Hepatitis, STD & TB Prevention Division of HIV/AIDS Prevention
 HIV Surveillance in Urban and Nonurban Areas National Center for HIV/AIDS, Viral Hepatitis, STD & TB Prevention Division of HIV/AIDS Prevention HIV Infection in Urban and Nonurban Areas Many ways to characterize
2016 Houston HIV Care Services Needs Assessment: Profile of African American Men Who Have Sex with Men (MSM)
") 2016 Houston HIV Care Services Needs Assessment: Profile of African American Men Who Have Sex with Men (MSM) Page 1 PROFILE OF AFRICAN AMERICAN MSM A recent analysis of national HIV diagnosis rates revealed
2016 Houston HIV Care Services Needs Assessment: Profile of African American Men Who Have Sex with Men (MSM) Page 1 PROFILE OF AFRICAN AMERICAN MSM A recent analysis of national HIV diagnosis rates revealed
HIV & AIDS in Colorado
 HIV & AIDS in Colorado Integrated Epidemiological Profile of HIV and AIDS Prevention and Care Planning reported through December 2009 April 2012 1 Table of Contents Acknowledgements... 1 Acronym List...
HIV and AIDS in the United States
 HIV and AIDS in the United States A Picture of Today s Epidemic More than 20 years into the AIDS epidemic, HIV continues to exact a tremendous toll in the United States. Recent data indicate that African
Organizational HIV Treatment Cascade Guidance for Construction. Introduction. Background
 Organizational HIV Treatment Cascade Guidance for Construction Introduction This guidance document provides organizations with the necessary tools and resources to construct their Organizational HIV Treatment
Behind the Cascade: Analyzing Spatial Patterns Along the HIV Care Continuum
 Behind the Cascade: Analyzing Spatial Patterns Along the HIV Care Continuum Kathleen Brady 1,2, M. Eberhart 1, A. Hillier 2, C. Voytek 2, M. Blank 2, I. Frank 2, D. Metzger, 2 B. Yehia 2 1 Philadelphia
Trends in U.S. HIV Diagnoses,
 CDC FACT SHEET Trends in U.S. HIV Diagnoses, 2005-2014 More than three decades after the first cases of AIDS were diagnosed in the United States, HIV continues to pose a substantial threat to the health
Hudson Valley Collaborative PPS Community Profile
 Hudson Valley Collaborative PPS Community Profile Counties served: Dutchess, Orange, Putnam, Rockland, Sullivan, Ulster, and Westchester DEMOGRAPHICS 1 The total population of the counties served by the
Disparities in HIV Care. Slides prepared by Kirk Fergus, Intern National Quality Center
 Disparities in HIV Care Slides prepared by Kirk Fergus, Intern National Quality Center At a glance At a glance MSM accounted for 61% of all new HIV infections in the U.S. in 2009, as well as nearly half
2.1 Increase 30 day linkage to 85% Statewide 83% (251/301) 84% Unknown 85% Ryan White (identified through EIS or Outreach) 84% (31/37) 90% (44/49) TBD
 84% Unknown 85% Ryan White (identified through EIS or Outreach) 84% (31/37) 90% (44/49) TBD") Objective Population Baseline (2016) 2017 2018 2019 2020 2021 Status 2021 Goal Goal 1: Reduce New HIV Infections Projected 1.1 Aware of HIV status Statewide 88% (1,100 people) 90% (1000 people) Met 90%
Objective Population Baseline (2016) 2017 2018 2019 2020 2021 Status 2021 Goal Goal 1: Reduce New HIV Infections Projected 1.1 Aware of HIV status Statewide 88% (1,100 people) 90% (1000 people) Met 90%
Trends in HIV Incidence and Prevalence in the United States
 Trends in HIV Incidence and Prevalence in the United States Irene Hall, PhD, FACE 7th International Workshop on HIV Transmission Washington, DC, July 20, 2012 National Center for HIV/AIDS, Viral Hepatitis,
WELCOME! PLANNING COUNCIL MEETING September 7, 2017
 WELCOME! PLANNING COUNCIL MEETING September 7, 2017 Moment of Silence INTRODUCTIONS Please state your name for the record. Please note: You do NOT have to disclose your status during the introduction if
Bruce D. Agins, MD MPH Medical Director, AIDS Institute Adherence 2017; Miami
 1 1 Bruce D. Agins, MD MPH Medical Director, AIDS Institute Adherence 2017; Miami 3 Defining the End of AIDS Reduce new infections to 750 annually by the end of 2020 Three Point Plan 1. Identify all persons
Rhode Island Department of Health. Division of Infectious Disease and Epidemiology. Office of HIV/AIDS & Viral Hepatitis
 Rhode Island Department of Health Division of Infectious Disease and Epidemiology Office of HIV/AIDS & Viral Hepatitis November 2013 Table of Contents 1) Introduction.....3 2) Surveillance Methods...3
Government of Canada Federal AIDS Initiative Milestones
 HIV in Canada: Trends and Issues for Advancing Prevention, Care, Treatment and Support Through Knowledge Exchange Michael R Smith, Senior Policy Advisor, Programs and Coordination Division, Centre for
Comprehensive HIV/AIDS Resources and Linkages for Inmates (CHARLI) and Care Coordination (CC) Collaborative. Care Coordination
 and Care Coordination (CC) Collaborative. Care Coordination") Comprehensive HIV/AIDS Resources and Linkages for Inmates (CHARLI) and Care Coordination (CC) Collaborative CHARLI CHARLI Contract Monitor Susan Carr HIV Prevention Unit Virginia Department of Health Susan.Carr@vdh.virginia.gov
Comprehensive HIV/AIDS Resources and Linkages for Inmates (CHARLI) and Care Coordination (CC) Collaborative CHARLI CHARLI Contract Monitor Susan Carr HIV Prevention Unit Virginia Department of Health Susan.Carr@vdh.virginia.gov
HIV & AIDS in Colorado
 HIV & AIDS in Colorado HIV/AIDS Epidemiology Annual Report For cases diagnosed through December 2015 Colorado Department of Public Health and Environment November 2016 Table of Contents Table of Contents
Sentinel Events: AIDS Mortality. HIV-Related vs. Not HIV-Related death as categorized in HIV surveillance
 Sentinel Events: AIDS Mortality HIV-Related vs. Not HIV-Related death as categorized in HIV surveillance March 20, 2017 Outline Based on NYC DOHMH Reverse Continuum Work (Braunstein et al.) Difference
STIs in the Indian Country
 STIs in the Indian Country Multiple STI s and Risk for HIV Ryan Kreisberg, MPH Senior Epidemiologist, PRISM Data Manager Agenda STI/HIV Trends across the US and Arizona STIs in the Indian Country Multiple
State of Florida Integrated HIV Prevention and Care Plan, including the Statewide Coordinated Statement of Need, CY
 State of Florida Integrated HIV Prevention and Care Plan, including the Statewide Coordinated Statement of Need, CY 2017-2021 Prepared by The Florida Department of Health, HIV/AIDS Section The AIDS Institute
HIV Epidemiology March 7, Stefanie Rhodes Inova Juniper Program
 HIV Epidemiology March 7, 2019 Stefanie Rhodes Inova Juniper Program Stefanie.Rhodes@inova.org Human Immunodeficiency Virus Virus that attacks and weakens immune system Can be treated, but not cured Transmitted
Estimate of the Number of Persons Living with HIV in Massachusetts
 Estimate of the Number of Persons Living with HIV in Massachusetts Christian Hague, MPH Supervisor, HIV Surveillance Massachusetts Department of Public Health 2016 NATIONAL RYAN WHITE CONFERENCE ON HIV
HIV / STI SURVEILLANCE REPORT
 HIV / STI SURVEILLANCE REPORT DECEMBER 2017 TABLE OF CONTENTS Commissioner's Letter 1 Executive & Data Summary 5 Section One: HIV and STIs in Chicago, 2016 6 HIV 8 Chlamydia 9 Gonorrhea 10 Primary& Secondary
Click to edit Master title style
 Public Health Click to edit Master title style Positively Hennepin: The County s Strategy to End HIV Positively Hennepin Strategy Coordinator Hennepin County Public Health Department Key Points HIV Strategy
2014 Epidemiologic Profile of HIV in Michigan
 2014 Epidemiologic Profile of HIV in Michigan HIV, Body Art, Tuberculosis, Viral Hepatitis Section Bureau of Disease Control, Prevention and Epidemiology Michigan Department of Community Health www.michigan.gov/hivstd