Therapeutic effect of baicalin on experimental autoimmune encephalomyelitis. is mediated by SOCS3 regulatory pathway
|
|
|
- Ira Arnold
- 5 years ago
- Views:
Transcription
1 Therapeutic effect of baicalin on experimental autoimmune encephalomyelitis is mediated by SOCS3 regulatory pathway Yuan Zhang 1,2, Xing Li 1,2, Bogoljub Ciric 1, Cun-gen Ma 3, Bruno Gran 4, Abdolmohamad Rostami 1, and Guang-Xian Zhang 1* 1 Department of Neurology, Thomas Jefferson University, Philadelphia, PA, USA 2 Key Laboratory of the Ministry of Education for Medicinal Resources and Natural Pharmaceutical Chemistry, Northwest China National Engineering Laboratory for Resource Development of Endangered Crude Drugs, College of Life Sciences, Shaanxi Normal University, Xi an, China 3 Institute of Brain Science, Department of Neurology, Shanxi Datong University Medical School, Datong, China 4 Clinical Neurology Research Group, Division of Clinical Neuroscience, University of Nottingham School of Medicine, UK Equal contribution * Correspondence: Guang-Xian Zhang, MD, PhD, Phone: , Guang- Xian.Zhang@jefferson.edu 1
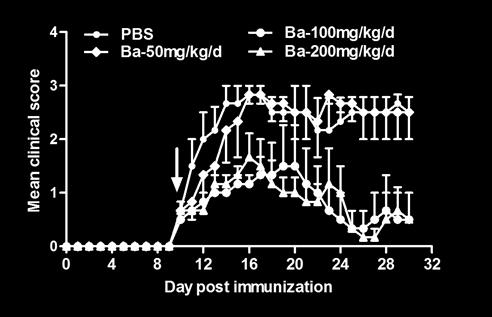
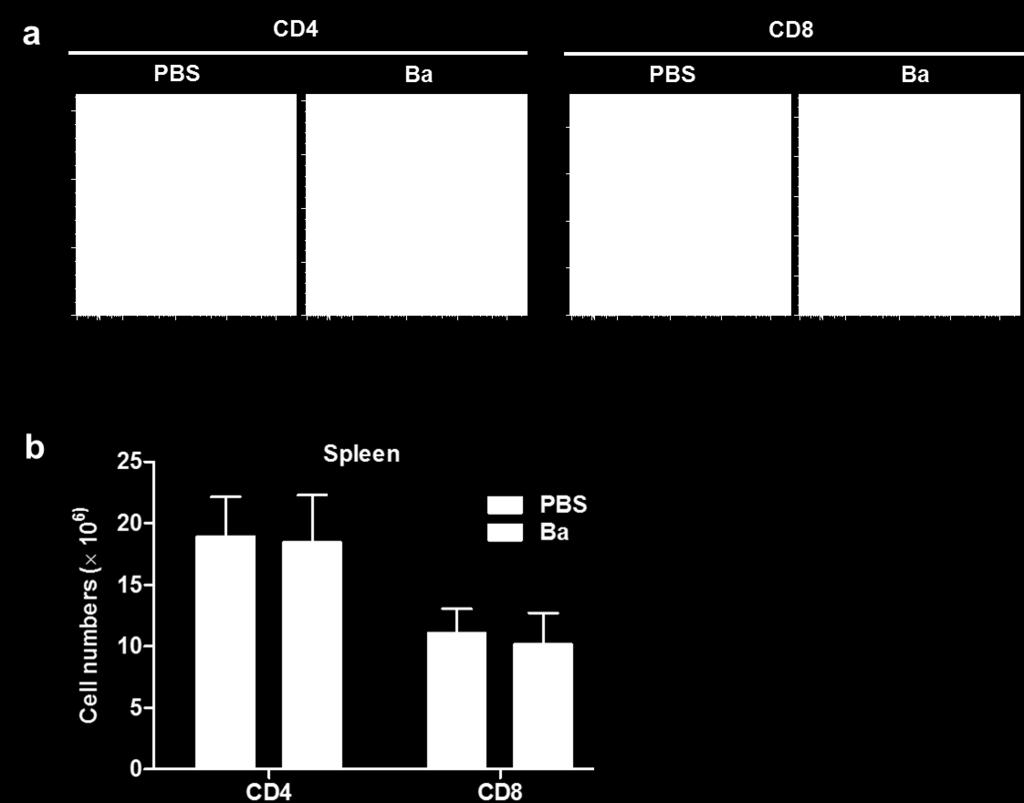
2 Supplementary Information Figure s1. Determination of the optimal dose of Ba in EAE suppression. C57BL/6 mice were immunized with MOG peptide/cfa to induce acute EAE as described in Materials and Methods. Ba in PBS was i.p. injected at 50, 100, or 200 mg/kg daily, starting at day 10 p.i. (disease onset). Results are shown as mean ± SEM (n = 5 each group). Figure s2. Ba treatment did not influence numbers and percentages of splenic CD4 + or CD8 + T cells. (a) The percentage of CD4 + or CD8 + cells in the lymphocyte gate from the spleen of Batreated or control EAE mice was analyzed by flow cytometry. (b) Absolute numbers of cells expressing these antigens were calculated by multiplying the total numbers of splenocytes and percentage of CD4 + or CD8 + T cells (Mean ± SE; n = 5 each group). One representative of three experiments is shown. Figure s3. In vitro effect of Ba on cytokine production of splenocytes from EAE mice. Splenocytes of untreated EAE mice were harvested at day 12 p.i. (disease onset) splenocytes/ml were cultured with MOG at 25 µg/ml in the presence of Ba (0, 5, 10, 20 µg/ml). Cytokine production was determined from 48 h culture supernatants by ELISA. Results are shown as mean ± SEM (n = 6 each group). ***P < One representative of three experiments is shown. Figure s4. Effects of Ba treatment on APCs. Splenocytes or CNS MNCs of Ba- or PBS-treated EAE mice were isolated at day 18 p.i. and incubated with MOG (25 μg/ml) for 72 h (for splenocytes) or overnight for (CNS MNCs). CD11b+ and CD11c+ cells were gated and their 2
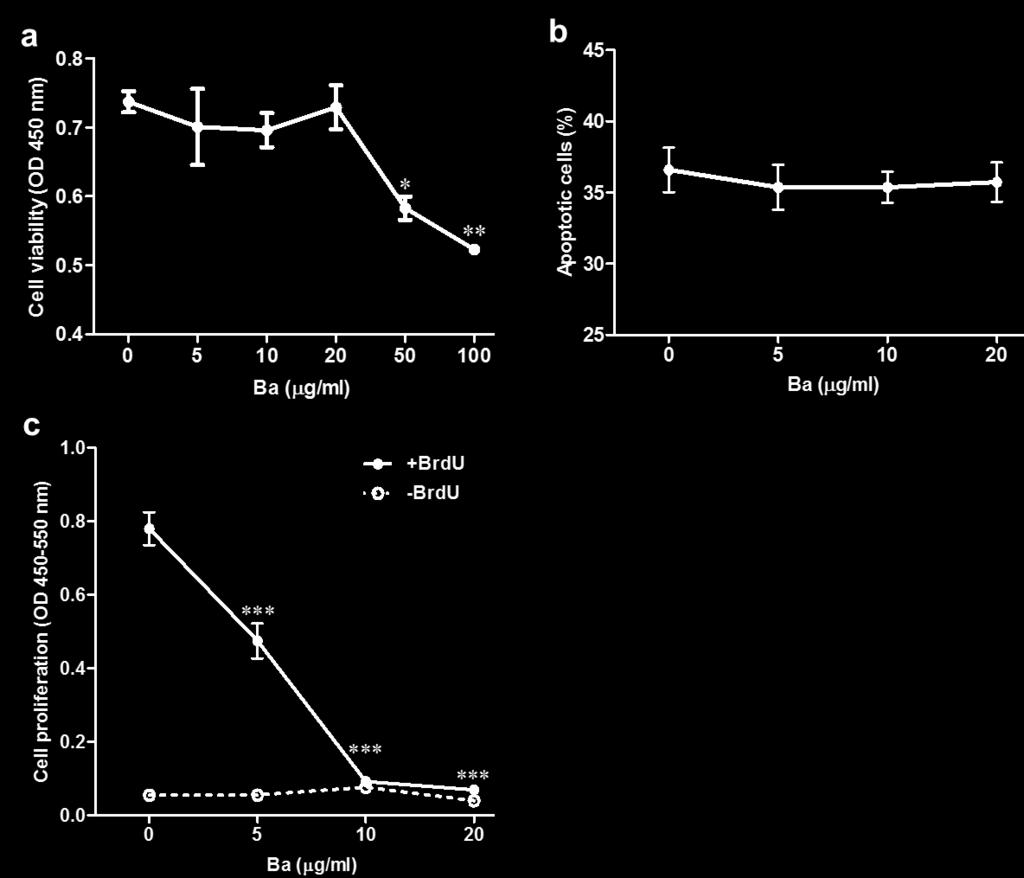
3 expression of CD80 and CD86 was analyzed by flow cytometry. One representative of three experiments is shown. Figure s5. Effect of Ba on naïve CD4 + cell viability, apoptosis, and proliferation in vitro. Purified CD4 + T cells from spleens of naïve C57BL/6 mice were stimulated with anti-cd3e and anti-cd28 at indicated concentrations of Ba for 24 h for cell viability assay and 72 h for cell proliferation and apoptosis assays. (a) Cell viability was determined using the MTS-based method. (b) To determine apoptosis, cells were stained with Annexin V and PI before being analyzed by flow cytometry. (c) Cell proliferation was determined by BrdU incorporation test. Data are expressed as mean ± SEM (n = 6 each group). *P < 0.05; **P < 0.01; ***P < One representative of three experiments is shown. Figure s6. Role of Ba in Th2 cell differentiation. Purified naïve CD4 + T cells were cultured with different concentrations of Ba under Th2 polarizing conditions and analyzed at 3 days of culture. (a) The percentage of Th2 cells in CD4 + T cells was analyzed by intracellular IL-4 secretion. (b) Percentages of IL-4 positive cells. (c) GATA3 mrna levels were analyzed by realtime PCR. Data are expressed as mean ± SEM (n = 5 each group). *P < 0.05; **P < 0.01; ***P < One representative of three experiments is shown. Figure s7. Safety consideration of Ba treatment. Naïve female C57BL/6 mice (6-8 weeks old) were injected i.p. daily with PBS or Ba at 100 mg/kg/day, the same dosage as treating EAE mice, and the administration continued for 28 d. (a) Body weights of mice were recorded every three days. (b) For ex vivo proliferation, splenocytes were isolated from PBS- and Ba-treated mice, and stimulated with or without Con A (5 μg/ml). (c) Blood examination was conducted on red blood cell count (RBC, 10 6 /μl), hemoglobin concentration (HGB, g/l), white blood cell count (WBC, 3
4 10 3 /μl) and platelet count (PLT, 10 3 /μl) by the automated hematologic analyzer after the last administration. Data are expressed as mean ± SEM (n = 5 each group). One representative of three experiments is shown. 4

5 Figure s1 5

6 Figure s2 6

7 Figure s3 7

8 Figure s4 8

9 Figure s5 9

10 Figure s6 10


11 Figure s7 11
12 Table s1. Clinical features of EAE in mice in the administration of PBS or Ba Group Disease incidence (%) Mean maximal score Cumulative disease score Average day of onset Prophylactic treatment regimen Therapeutic regimen (disease onset) Therapeutic regimen (disease peak) PBS ± ± ± 0.55 Ba ± 0.52** 15.8 ± 4.22** ± 1.21** PBS ± ± ± 1.32 Ba ± 0.76* 18.2 ± 9.54** ± 1.65 PBS ± ± ± 1.36 Ba ± 0.29* 32.1 ± 7.51** ± 1.6 Values are expressed as mean ± SEM *P < 0.05, **P < 0.01 compared with PBS control. 12
13 Table s2. Primers used for real-time quantitative RT-PCR analysis Primers Gene Forward (5-3 ) Rewards (5-3 ) CCL20 GTGGCAAGCGTCTGCTCT TGTACGAGAGGCAACAGTCG CXCL1 CTTGCCTTGACCCTGAAGCTC AGCAGTCTGTCTTCTTTCTCCGT CXCL2 CCCCCTGGTTCAGAAAATCA GCTCCTCCTTTCCAGGTCAGT CXCL9 TGCACGATGCTCCTGCA AGGTCTTTGAGGGATTTGTAGTGG CXCL10 CTCATCCTGCTGGGTCTGAG CCTATGGCCCTCATTCTCAC CXCL11 AACAGGGGCGCTGTCTTT CTTTGTCGCAGCCGTTACTC CXCL12 ACAAGTGTGCATTGACCCGA TACCGTCAGGTTTGAGCACC Foxp3 AGGAGCCGCAAGCTAAAAGC TGCCTTCGTGCCCACTGT inos ACCCACATCTGGCAGAATGAG AGCCATGACCTTTCGCATTAG GAPDH CCAATGTGTCCGTCGTGGATCT GTTGAAGTCGCAGGAGACAACC GATA-3 GGAGTCTCCAAGTGTGCGAA TGGAATGCAGACACCACCTC GFP ACAGCGTGATCTTCACCGAC ATGGCGCTCTTGAAGTGCAT GM-CSF GTGGTCTACAGCCTCTCAGCA GCATGTCATCCAGGAGGTTC IFN-γ ATGAACGCTACACACTGCATC CCATCCTTTTGCCAGTTCCTC IL-1β CTCTCCACCTCAATGGACAGA TGCTTGGGATCCACACTCTC IL-5 TGTCCCTACTCATAAAAATCACCAG TCCGTCTCTCCTCGCCACAC IL-6 ACACATGTTCTCTGGGAAATCGT AAGTGCATCATCGTTGTTCATACA IL-10 CTGAAGACCCTCAGGATGCG AGACACCTTGGTCTTGGAGC IL-11 CCTGGCAGACACACGGCAACT CTCGAAGCCTTGTCAGCACACC IL-12p35 CATCGATGAGCTGATGCAGT CAGATAGCCCATCACCCTGT IL-17A CTCAACCGTTCCACGTCAC ACACCCACCAGCATCTTCT IL-17F TGCTACTGTTGATGTTGGGAC AATGCCCTGGTTTTGGTTGAA IL-21 GATCCTGAACTTCTATCAGCTCCAC GGCATTTAGCTATGTGCTTCTGTT IL-22 GTGAGAAGCTAACGTCCATC GTCTACCTCTGGTCTCATGG IL-23p19 GACTCAGCCAACTCCTCCAG GGCACTAAGGGCTCAGTCAG IL-27p28 CAGATAGCCCATCACCCTGT GGGGCAGCTTCTTTTCTTCT MMP3 ATGAAGGGTCTTCCGGTCCT ACACCACACCTGGGCTTATG MMP9 CCAGATGATGGGAGAGAAGC GGCCTTTAGTGTCTGGCTGT RORγt GGAACCAGAACAGGGTCCAG TAGAAGGTCCTCCAGTCGCA SOCS3 TTTGACAAGCGGACTCTCCC AAGCGCAAACAAGTTCCAGC T-bet ATTGGTTGGAGAGGAAGCGG GCACCAGGTTCGTGACTGTA TGF-β CACTGATACGCCTGAGTG GTGAGCGCTGAATCGAAA TNFα GCCACAAGCAGGAATGAGAAG GCCACAAGCAGGAATGAGAAG 13
The encephalitogenicity of TH17 cells is dependent on IL-1- and IL-23- induced production of the cytokine GM-CSF
 CORRECTION NOTICE Nat.Immunol. 12, 568 575 (2011) The encephalitogenicity of TH17 cells is dependent on IL-1- and IL-23- induced production of the cytokine GM-CSF Mohamed El-Behi, Bogoljub Ciric, Hong
Supplemental Materials for. Effects of sphingosine-1-phosphate receptor 1 phosphorylation in response to. FTY720 during neuroinflammation
 Supplemental Materials for Effects of sphingosine-1-phosphate receptor 1 phosphorylation in response to FTY7 during neuroinflammation This file includes: Supplemental Table 1. EAE clinical parameters of
Supplemental Figure 1. Signature gene expression in in vitro differentiated Th0, Th1, Th2, Th17 and Treg cells. (A) Naïve CD4 + T cells were cultured
 Naïve CD4 + T cells were cultured") Supplemental Figure 1. Signature gene expression in in vitro differentiated Th0, Th1, Th2, Th17 and Treg cells. (A) Naïve CD4 + T cells were cultured under Th0, Th1, Th2, Th17, and Treg conditions. mrna
Supplemental Figure 1. Signature gene expression in in vitro differentiated Th0, Th1, Th2, Th17 and Treg cells. (A) Naïve CD4 + T cells were cultured under Th0, Th1, Th2, Th17, and Treg conditions. mrna
Supplementary Figure 1. Characterization of basophils after reconstitution of SCID mice
 Supplementary figure legends Supplementary Figure 1. Characterization of after reconstitution of SCID mice with CD4 + CD62L + T cells. (A-C) SCID mice (n = 6 / group) were reconstituted with 2 x 1 6 CD4
Supplementary Figure 1. IL-12 serum levels and frequency of subsets in FL patients. (A) IL-12
 IL-12") 1 Supplementary Data Figure legends Supplementary Figure 1. IL-12 serum levels and frequency of subsets in FL patients. (A) IL-12 serum levels measured by multiplex ELISA (Luminex) in FL patients before
1 Supplementary Data Figure legends Supplementary Figure 1. IL-12 serum levels and frequency of subsets in FL patients. (A) IL-12 serum levels measured by multiplex ELISA (Luminex) in FL patients before
Supplementary Figure 1. mrna expression of chitinase and chitinase-like protein in splenic immune cells. Each splenic immune cell population was
 Supplementary Figure 1. mrna expression of chitinase and chitinase-like protein in splenic immune cells. Each splenic immune cell population was sorted by FACS. Surface markers for sorting were CD11c +
SUPPLEMENTARY INFORMATION
 doi:1.138/nature1554 a TNF-α + in CD4 + cells [%] 1 GF SPF 6 b IL-1 + in CD4 + cells [%] 5 4 3 2 1 Supplementary Figure 1. Effect of microbiota on cytokine profiles of T cells in GALT. Frequencies of TNF-α
Cell isolation. Spleen and lymph nodes (axillary, inguinal) were removed from mice
 were removed from mice") Supplementary Methods: Cell isolation. Spleen and lymph nodes (axillary, inguinal) were removed from mice and gently meshed in DMEM containing 10% FBS to prepare for single cell suspensions. CD4 + CD25
Supplementary Methods: Cell isolation. Spleen and lymph nodes (axillary, inguinal) were removed from mice and gently meshed in DMEM containing 10% FBS to prepare for single cell suspensions. CD4 + CD25
Supplemental Table I.
 Supplemental Table I Male / Mean ± SEM n Mean ± SEM n Body weight, g 29.2±0.4 17 29.7±0.5 17 Total cholesterol, mg/dl 534.0±30.8 17 561.6±26.1 17 HDL-cholesterol, mg/dl 9.6±0.8 17 10.1±0.7 17 Triglycerides,
well for 2 h at rt. Each dot represents an individual mouse and bar is the mean ±
 Supplementary data: Control DC Blimp-1 ko DC 8 6 4 2-2 IL-1β p=.5 medium 8 6 4 2 IL-2 Medium p=.16 8 6 4 2 IL-6 medium p=.3 5 4 3 2 1-1 medium IL-1 n.s. 25 2 15 1 5 IL-12(p7) p=.15 5 IFNγ p=.65 4 3 2 1
SUPPLEMENTARY INFORMATION
 doi: 1.138/nature89 IFN- (ng ml ) 5 4 3 1 Splenocytes NS IFN- (ng ml ) 6 4 Lymph node cells NS Nfkbiz / Nfkbiz / Nfkbiz / Nfkbiz / IL- (ng ml ) 3 1 Splenocytes IL- (ng ml ) 1 8 6 4 *** ** Lymph node cells
W/T Itgam -/- F4/80 CD115. F4/80 hi CD115 + F4/80 + CD115 +
 F4/8 % in the peritoneal lavage 6 4 2 p=.15 n.s p=.76 CD115 F4/8 hi CD115 + F4/8 + CD115 + F4/8 hi CD115 + F4/8 + CD115 + MHCII MHCII Supplementary Figure S1. CD11b deficiency affects the cellular responses
Blocking antibodies and peptides. Rat anti-mouse PD-1 (29F.1A12, rat IgG2a, k), PD-
, PD-") Supplementary Methods Blocking antibodies and peptides. Rat anti-mouse PD-1 (29F.1A12, rat IgG2a, k), PD- L1 (10F.9G2, rat IgG2b, k), and PD-L2 (3.2, mouse IgG1) have been described (24). Anti-CTLA-4 (clone
Supplementary Methods Blocking antibodies and peptides. Rat anti-mouse PD-1 (29F.1A12, rat IgG2a, k), PD- L1 (10F.9G2, rat IgG2b, k), and PD-L2 (3.2, mouse IgG1) have been described (24). Anti-CTLA-4 (clone
Supplementary Figure 1.
 Supplementary Figure 1. Female Pro-ins2 -/- mice at 5-6 weeks of age were either inoculated i.p. with a single dose of CVB4 (1x10 5 PFU/mouse) or PBS and treated with αgalcer or control vehicle. On day
Nature Medicine doi: /nm.3957
 Supplementary Fig. 1. p38 alternative activation, IL-21 expression, and T helper cell transcription factors in PDAC tissue. (a) Tissue microarrays of pancreatic tissue from 192 patients with pancreatic
Supporting Information
 Supporting Information Stegbauer et al. 10.1073/pnas.0903602106 SI Methods Analysis of Plasma Renin Activity (PRA) and ACE Activity. PRA and serum ACE activity levels were determined by RIA (RENCTK, DiaSorin;
Supplementary Figure 1. Normal T lymphocyte populations in Dapk -/- mice. (a) Normal thymic development in Dapk -/- mice. Thymocytes from WT and Dapk
 Normal thymic development in Dapk -/- mice. Thymocytes from WT and Dapk") Supplementary Figure 1. Normal T lymphocyte populations in Dapk -/- mice. (a) Normal thymic development in Dapk -/- mice. Thymocytes from WT and Dapk -/- mice were stained for expression of CD4 and CD8.
Supplementary Figure 1. Normal T lymphocyte populations in Dapk -/- mice. (a) Normal thymic development in Dapk -/- mice. Thymocytes from WT and Dapk -/- mice were stained for expression of CD4 and CD8.
Supplementary Figure 1. Deletion of Smad3 prevents B16F10 melanoma invasion and metastasis in a mouse s.c. tumor model.
 A B16F1 s.c. Lung LN Distant lymph nodes Colon B B16F1 s.c. Supplementary Figure 1. Deletion of Smad3 prevents B16F1 melanoma invasion and metastasis in a mouse s.c. tumor model. Highly invasive growth
SUPPLEMENTARY FIGURES
 SUPPLEMENTARY FIGURES Supplementary Figure 1: Chemokine receptor expression profiles of CCR6 + and CCR6 - CD4 + IL-17A +/ex and Treg cells. Quantitative PCR analysis of chemokine receptor transcript abundance
Supplementary. presence of the. (c) mrna expression. Error. in naive or
 mrna expression. Error. in naive or") Figure 1. (a) Naive CD4 + T cells were activated in the presence of the indicated cytokines for 3 days. Enpp2 mrna expression was measured by qrt-pcrhr, infected with (b, c) Naive CD4 + T cells were activated
Figure 1. (a) Naive CD4 + T cells were activated in the presence of the indicated cytokines for 3 days. Enpp2 mrna expression was measured by qrt-pcrhr, infected with (b, c) Naive CD4 + T cells were activated
ECM1 controls T H 2 cell egress from lymph nodes through re-expression of S1P 1
 ZH, Li et al, page 1 ECM1 controls T H 2 cell egress from lymph nodes through re-expression of S1P 1 Zhenhu Li 1,4,Yuan Zhang 1,4, Zhiduo Liu 1, Xiaodong Wu 1, Yuhan Zheng 1, Zhiyun Tao 1, Kairui Mao 1,
Eosinophils are required. for the maintenance of plasma cells in the bone marrow
 Eosinophils are required for the maintenance of plasma cells in the bone marrow Van Trung Chu, Anja Fröhlich, Gudrun Steinhauser, Tobias Scheel, Toralf Roch, Simon Fillatreau, James J. Lee, Max Löhning
Supplemental Information. T Cells Enhance Autoimmunity by Restraining Regulatory T Cell Responses via an Interleukin-23-Dependent Mechanism
 Immunity, Volume 33 Supplemental Information T Cells Enhance Autoimmunity by Restraining Regulatory T Cell Responses via an Interleukin-23-Dependent Mechanism Franziska Petermann, Veit Rothhammer, Malte
Title of file for HTML: Supplementary Information Description: Supplementary Figures and Supplementary Table
 Title of file for HTML: Supplementary Information Description: Supplementary Figures and Supplementary Table Title of file for HTML: Peer Review File Description: Innate Scavenger Receptor-A regulates
Nature Immunology: doi: /ni Supplementary Figure 1. Production of cytokines and chemokines after vaginal HSV-2 infection.
 Supplementary Figure 1 Production of cytokines and chemokines after vaginal HSV-2 infection. C57BL/6 mice were (a) treated intravaginally with 20 µl of PBS or infected with 6.7x10 4 pfu of HSV-2 in the
Supplementary Figure 1. NAFL enhanced immunity of other vaccines (a) An over-the-counter, hand-held non-ablative fractional laser (NAFL).
 An over-the-counter, hand-held non-ablative fractional laser (NAFL).") Supplementary Figure 1. NAFL enhanced immunity of other vaccines (a) An over-the-counter, hand-held non-ablative fractional laser (NAFL). (b) Depiction of a MTZ array generated by NAFL. (c-e) IgG production
Supplementary Figure 1. NAFL enhanced immunity of other vaccines (a) An over-the-counter, hand-held non-ablative fractional laser (NAFL). (b) Depiction of a MTZ array generated by NAFL. (c-e) IgG production
NK cell flow cytometric assay In vivo DC viability and migration assay
 NK cell flow cytometric assay 6 NK cells were purified, by negative selection with the NK Cell Isolation Kit (Miltenyi iotec), from spleen and lymph nodes of 6 RAG1KO mice, injected the day before with
% of live splenocytes. STAT5 deletion. (open shapes) % ROSA + % floxed
 % ROSA + % floxed") Supp. Figure 1. a 14 1 1 8 6 spleen cells (x1 6 ) 16 % of live splenocytes 5 4 3 1 % of live splenocytes 8 6 4 b 1 1 c % of CD11c + splenocytes (closed shapes) 8 6 4 8 6 4 % ROSA + (open shapes) % floxed
Supp. Figure 1. a 14 1 1 8 6 spleen cells (x1 6 ) 16 % of live splenocytes 5 4 3 1 % of live splenocytes 8 6 4 b 1 1 c % of CD11c + splenocytes (closed shapes) 8 6 4 8 6 4 % ROSA + (open shapes) % floxed
Supplementary information. The proton-sensing G protein-coupled receptor T-cell death-associated gene 8
 1 Supplementary information 2 3 The proton-sensing G protein-coupled receptor T-cell death-associated gene 8 4 (TDAG8) shows cardioprotective effects against myocardial infarction 5 Akiomi Nagasaka 1+,
D CD8 T cell number (x10 6 )
") IFNγ Supplemental Figure 1. CD T cell number (x1 6 ) 18 15 1 9 6 3 CD CD T cells CD6L C CD5 CD T cells CD6L D CD8 T cell number (x1 6 ) 1 8 6 E CD CD8 T cells CD6L F Log(1)CFU/g Feces 1 8 6 p
IFNγ Supplemental Figure 1. CD T cell number (x1 6 ) 18 15 1 9 6 3 CD CD T cells CD6L C CD5 CD T cells CD6L D CD8 T cell number (x1 6 ) 1 8 6 E CD CD8 T cells CD6L F Log(1)CFU/g Feces 1 8 6 p
Supplementary Information:
 Supplementary Information: Follicular regulatory T cells with Bcl6 expression suppress germinal center reactions by Yeonseok Chung, Shinya Tanaka, Fuliang Chu, Roza Nurieva, Gustavo J. Martinez, Seema
Peer review correspondence
 Highly polarized Th17 cells induce EAE via a T-bet-independent mechanism Heather M. Grifka-Walk, Stephen J. Lalor and Benjamin M. Segal Corresponding author: Benjamin Segal, Holtom-Garrett Program in Neuroimmunology
B6/COLODR/SPL/11C/83/LAP/#2.006 B6/COLODR/SPL/11C/86/LAP/#2.016 CD11C B6/COLODR/SPL/11C/80/LAP/#2.011 CD11C
 CD3-specific antibody-induced immune tolerance and suppression of autoimmune encephalomyelitis involves TGF-β production through phagocytes digesting apoptotic T cells Sylvain Perruche 1,3, Pin Zhang 1,
SUPPORTING INFORMATIONS
 SUPPORTING INFORMATIONS Mice MT/ret RetCD3ε KO α-cd25 treated MT/ret Age 1 month 3 mnths 6 months 1 month 3 months 6 months 1 month 3 months 6 months 2/87 Survival 87/87 incidence of 17/87 1 ary tumor
Supplementary Figures. T Cell Factor-1 initiates T helper 2 fate by inducing GATA-3 and repressing Interferon-γ
 Supplementary Figures T Cell Factor-1 initiates T helper 2 fate by inducing GATA-3 and repressing Interferon-γ Qing Yu, Archna Sharma, Sun Young Oh, Hyung-Geun Moon, M. Zulfiquer Hossain, Theresa M. Salay,
Supplemental Figure 1
 Supplemental Figure 1 1a 1c PD-1 MFI fold change 6 5 4 3 2 1 IL-1α IL-2 IL-4 IL-6 IL-1 IL-12 IL-13 IL-15 IL-17 IL-18 IL-21 IL-23 IFN-α Mut Human PD-1 promoter SBE-D 5 -GTCTG- -1.2kb SBE-P -CAGAC- -1.kb
Supplementary Figure 1: TSLP receptor skin expression in dcssc. A: Healthy control (HC) skin with TSLP receptor expression in brown (10x
 skin with TSLP receptor expression in brown (10x") Supplementary Figure 1: TSLP receptor skin expression in dcssc. A: Healthy control (HC) skin with TSLP receptor expression in brown (10x magnification). B: Second HC skin stained for TSLP receptor in brown
Supplementary Figure 1: TSLP receptor skin expression in dcssc. A: Healthy control (HC) skin with TSLP receptor expression in brown (10x magnification). B: Second HC skin stained for TSLP receptor in brown
IMMUNOTOOLS: EFFECT OF NOTCH-DEFICIENT MACROPHAGES TO AUTOIMMUNE DISEASE WIPAWEE WONGCHANA
 IMMUNOTOOLS: EFFECT OF NOTCH-DEFICIENT MACROPHAGES TO AUTOIMMUNE DISEASE 22-02-2017 WIPAWEE WONGCHANA WHAT DO YOU SEE? Allergy Ref: http://carrington.edu/blog/medical/vaccines/smallpox-andsmallpox-vaccine/
CXCL11-dependent induction of FOXP3- negative regulatory T cells suppresses autoimmune encephalomyelitis
 Research article CXCL11-dependent induction of FOXP3- negative regulatory T cells suppresses autoimmune encephalomyelitis Yaniv Zohar, 1 Gizi Wildbaum, 1 Rostislav Novak, 1 Andrew L. Salzman, 2 Marcus
Targeting tumour associated macrophages in anti-cancer therapies. Annamaria Gal Seminar Series on Drug Discovery Budapest 5 January 2018
 Targeting tumour associated macrophages in anti-cancer therapies Annamaria Gal Seminar Series on Drug Discovery Budapest 5 January 2018 Macrophages: Professional phagocytes of the myeloid lineage APC,
Supplementary Figure S1. Flow cytometric analysis of the expression of Thy1 in NH cells. Flow cytometric analysis of the expression of T1/ST2 and
 Supplementary Figure S1. Flow cytometric analysis of the expression of Thy1 in NH cells. Flow cytometric analysis of the expression of T1/ST2 and Thy1 in NH cells derived from the lungs of naïve mice.
for six pairs of mice. (b) Representative FACS analysis of absolute number of T cells (CD4 + and
 Representative FACS analysis of absolute number of T cells (CD4 + and") SUPPLEMENTARY DATA Supplementary Figure 1: Peripheral lymphoid organs of SMAR1 -/- mice have an effector memory phenotype. (a) Lymphocytes collected from MLNs and Peyer s patches (PPs) of WT and SMAR1
SUPPLEMENTARY DATA Supplementary Figure 1: Peripheral lymphoid organs of SMAR1 -/- mice have an effector memory phenotype. (a) Lymphocytes collected from MLNs and Peyer s patches (PPs) of WT and SMAR1
and follicular helper T cells is Egr2-dependent. (a) Diagrammatic representation of the
 Diagrammatic representation of the") Supplementary Figure 1. LAG3 + Treg-mediated regulation of germinal center B cells and follicular helper T cells is Egr2-dependent. (a) Diagrammatic representation of the experimental protocol for the
Supplementary Figure 1. LAG3 + Treg-mediated regulation of germinal center B cells and follicular helper T cells is Egr2-dependent. (a) Diagrammatic representation of the experimental protocol for the
Relevant Disclosures
 6/18/215 Therapeutic developments for autoimmune demyelinating diseases: Musings from a MD (Mouse Doctor) Michael K. Racke, M.D. May 28, 215 Relevant Disclosures Editorial Boards for Journal of Neuroimmunology,
Supplementary figure 1. Systemic delivery of anti-cd47 antibody controls tumor growth in
 T u m o r v o lu m e (m m 3 ) P e rc e n t s u rv iv a l P e rc e n t s u rv iv a l Supplementary data a 1 8 6 4 2 5 1 1 5 2 2 5 3 3 5 4 T im e a fte r tu m o r in o c u la tio n (d ) b c 1 5 1 1 5 * *
Immunological alterations in mice irradiated with low doses
 Immunological alterations in mice irradiated with low doses "Frédéric Joliot-Curie" National Research Institute for Radiobiology and Radiohygiene, Budapest, Hungary The structure of the immune system INNATE
Intracellular MHC class II molecules promote TLR-triggered innate. immune responses by maintaining Btk activation
 Intracellular MHC class II molecules promote TLR-triggered innate immune responses by maintaining Btk activation Xingguang Liu, Zhenzhen Zhan, Dong Li, Li Xu, Feng Ma, Peng Zhang, Hangping Yao and Xuetao
Supplementary Materials for
 www.sciencetranslationalmedicine.org/cgi/content/full/8/352/352ra110/dc1 Supplementary Materials for Spatially selective depletion of tumor-associated regulatory T cells with near-infrared photoimmunotherapy
Supplemental Materials
 Supplemental Materials Programmed death one homolog maintains the pool size of regulatory T cells by promoting their differentiation and stability Qi Wang 1, Jianwei He 1, Dallas B. Flies 2, Liqun Luo
of whole cell cultures in U-bottomed wells of a 96-well plate are shown. 2
 Supplementary online material Supplementary figure legends Supplementary Figure 1 Exposure to T reg cells causes loss of T resp cells in co-cultures. T resp cells were stimulated with CD3+CD28 alone or
Therapeutic PD L1 and LAG 3 blockade rapidly clears established blood stage Plasmodium infection
 Supplementary Information Therapeutic PD L1 and LAG 3 blockade rapidly clears established blood stage Plasmodium infection Noah S. Butler, Jacqueline Moebius, Lecia L. Pewe, Boubacar Traore, Ogobara K.
NKTR-255: Accessing The Immunotherapeutic Potential Of IL-15 for NK Cell Therapies
 NKTR-255: Accessing The Immunotherapeutic Potential Of IL-15 for NK Cell Therapies Saul Kivimäe Senior Scientist, Research Biology Nektar Therapeutics NK Cell-Based Cancer Immunotherapy, September 26-27,
Nature Immunology: doi: /ni Supplementary Figure 1. Cellularity of leukocytes and their progenitors in naive wild-type and Spp1 / mice.
 Supplementary Figure 1 Cellularity of leukocytes and their progenitors in naive wild-type and Spp1 / mice. (a, b) Gating strategies for differentiated cells including PMN (CD11b + Ly6G hi and CD11b + Ly6G
Supplemental Figure Legends
 Supplemental Figure Legends Supplemental Figure 1. SemaB / mice have normal immune cell populations. Cells were prepared from the spleens of WT and SemaB / mice, stained with various antibodies and then
MicroRNA mir-326 regulates T H -17 differentiation and is associated with the pathogenesis of multiple sclerosis
 correction notice Nat. Immunol. 10, 1252 1259 (2009) MicroRNA mir-326 regulates T H -17 differentiation and is associated with the pathogenesis of multiple sclerosis Changsheng Du, Chang Liu, Jiuhong Kang,
Supplemental Figure 1. Activated splenocytes upregulate Serpina3g and Serpina3f expression.
 Relative Serpin expression 25 2 15 1 5 Serpina3f 1 2 3 4 5 6 8 6 4 2 Serpina3g 1 2 3 4 5 6 C57BL/6 DBA/2 Supplemental Figure 1. Activated splenocytes upregulate Serpina3g and Serpina3f expression. Splenocytes
Supplementary Figure S1. PTPN2 levels are not altered in proliferating CD8+ T cells. Lymph node (LN) CD8+ T cells from C57BL/6 mice were stained with
 CD8+ T cells from C57BL/6 mice were stained with") Supplementary Figure S1. PTPN2 levels are not altered in proliferating CD8+ T cells. Lymph node (LN) CD8+ T cells from C57BL/6 mice were stained with CFSE and stimulated with plate-bound α-cd3ε (10µg/ml)
Supplementary Figure S1. PTPN2 levels are not altered in proliferating CD8+ T cells. Lymph node (LN) CD8+ T cells from C57BL/6 mice were stained with CFSE and stimulated with plate-bound α-cd3ε (10µg/ml)
effect on the upregulation of these cell surface markers. The mean peak fluorescence intensity
 SUPPLEMENTARY FIGURE 1 Supplementary Figure 1 ASIC1 disruption or blockade does not effect in vitro and in vivo antigen-presenting cell activation. (a) Flow cytometric analysis of cell surface molecules
<10. IL-1β IL-6 TNF + _ TGF-β + IL-23
 3 ns 25 ns 2 IL-17 (pg/ml) 15 1 ns ns 5 IL-1β IL-6 TNF
SUPPLEMENTARY METHODS
 SUPPLEMENTARY METHODS Histological analysis. Colonic tissues were collected from 5 parts of the middle colon on day 7 after the start of DSS treatment, and then were cut into segments, fixed with 4% paraformaldehyde,
Supplementary Figures
 Supplementary Figures Supplementary Figure 1. NKT ligand-loaded tumour antigen-presenting B cell- and monocyte-based vaccine induces NKT, NK and CD8 T cell responses. (A) The cytokine profiles of liver
Supplementary Figure 1: Expression of NFAT proteins in Nfat2-deleted B cells (a+b) Protein expression of NFAT2 (a) and NFAT1 (b) in isolated splenic
 Protein expression of NFAT2 (a) and NFAT1 (b) in isolated splenic") Supplementary Figure 1: Expression of NFAT proteins in Nfat2-deleted B cells (a+b) Protein expression of NFAT2 (a) and NFAT1 (b) in isolated splenic B cells from WT Nfat2 +/+, TCL1 Nfat2 +/+ and TCL1 Nfat2
Supplementary Figure 1: Expression of NFAT proteins in Nfat2-deleted B cells (a+b) Protein expression of NFAT2 (a) and NFAT1 (b) in isolated splenic B cells from WT Nfat2 +/+, TCL1 Nfat2 +/+ and TCL1 Nfat2
ILC1 and ILC3 isolation and culture Following cell sorting, we confirmed that the recovered cells belonged to the ILC1, ILC2 and
 Supplementary Methods and isolation and culture Following cell sorting, we confirmed that the recovered cells belonged to the, ILC2 and subsets. For this purpose we performed intracellular flow cytometry
Supplementary Fig. 1 p38 MAPK negatively regulates DC differentiation. (a) Western blot analysis of p38 isoform expression in BM cells, immature DCs
 Western blot analysis of p38 isoform expression in BM cells, immature DCs") Supplementary Fig. 1 p38 MAPK negatively regulates DC differentiation. (a) Western blot analysis of p38 isoform expression in BM cells, immature DCs (idcs) and mature DCs (mdcs). A myeloma cell line expressing
Supplementary Fig. 1 p38 MAPK negatively regulates DC differentiation. (a) Western blot analysis of p38 isoform expression in BM cells, immature DCs (idcs) and mature DCs (mdcs). A myeloma cell line expressing
Simultaneous correlation of cytokine production with Treg and Th17 cell proliferation
 Simultaneous correlation of cytokine production with Treg and Th17 cell proliferation Jurg Rohrer, PhD Director, R&D BD Biosciences 23-11773-00 For Research Use Only. Not for use in diagnostic or therapeutic
- 1 - Cell types Monocytes THP-1 cells Macrophages. LPS Treatment time (Hour) IL-6 level (pg/ml)
 IL-6 level (pg/ml)") Supplementary Table ST1: The dynamic effect of LPS on IL-6 production in monocytes and THP-1 cells after GdA treatment. Monocytes, THP-1 cells and macrophages (5x10 5 ) were incubated with 10 μg/ml of
Supplementary Table ST1: The dynamic effect of LPS on IL-6 production in monocytes and THP-1 cells after GdA treatment. Monocytes, THP-1 cells and macrophages (5x10 5 ) were incubated with 10 μg/ml of
SUPPLEMENTARY MATERIAL
 SUPPLEMENTARY MATERIAL IL-1 signaling modulates activation of STAT transcription factors to antagonize retinoic acid signaling and control the T H 17 cell it reg cell balance Rajatava Basu 1,5, Sarah K.
ankylosing spondylitis Department of Clinical Immunology, Xijing Hospital, The Fourth Military
 Functional defects in CD4 + CD25 high FoxP3 + regulatory cells in ankylosing spondylitis Huifang Guo 1, 2, 3, Ming Zheng 1, 2, 3, Kui Zhang 1, 3, Fengfan Yang 1, 3, Xin Zhang 1, 3, Qing Han 1, 3, Zhi-Nan
Hua Tang, Weiping Cao, Sudhir Pai Kasturi, Rajesh Ravindran, Helder I Nakaya, Kousik
 SUPPLEMENTARY FIGURES 1-19 T H 2 response to cysteine-proteases requires dendritic cell-basophil cooperation via ROS mediated signaling Hua Tang, Weiping Cao, Sudhir Pai Kasturi, Rajesh Ravindran, Helder
Nature Immunology: doi: /ni Supplementary Figure 1. Cytokine pattern in skin in response to urushiol.
 Supplementary Figure 1 Cytokine pattern in skin in response to urushiol. Wild-type (WT) and CD1a-tg mice (n = 3 per group) were sensitized and challenged with urushiol (uru) or vehicle (veh). Quantitative
Nature Medicine: doi: /nm.3922
 Title: Glucocorticoid-induced tumor necrosis factor receptor-related protein co-stimulation facilitates tumor regression by inducing IL-9-producing helper T cells Authors: Il-Kyu Kim, Byung-Seok Kim, Choong-Hyun
IMO-8400, a novel TLR7, TLR8 and TLR9 antagonist, psoriasis
 IMO-8400, a novel TLR7, TLR8 and TLR9 antagonist, inhibits disease development in mouse models of psoriasis Weiwen e Ja Jiang, Fu-Gang Zhu, Dong Yu, Ekambar R. Kandimalla, a a, Nicola La Monica, and Sudhir
Supplementary Figure 1
 d f a IL7 b IL GATA RORγt h HDM IL IL7 PBS Ilra R7 PBS HDM Ilra R7 HDM Foxp Foxp Ilra R7 HDM HDM Ilra R7 HDM. 9..79. CD + FOXP + T reg cell CD + FOXP T conv cell PBS Ilra R7 PBS HDM Ilra R7 HDM CD + FOXP
Supplementary Figure 1. Antibiotic partially rescues mice from sepsis. (ab) BALB/c mice under CLP were treated with antibiotic or PBS.
 BALB/c mice under CLP were treated with antibiotic or PBS.") 1 Supplementary Figure 1. Antibiotic partially rescues mice from sepsis. (ab) BALB/c mice under CLP were treated with antibiotic or PBS. (a) Survival curves. WT Sham (n=5), WT CLP or WT CLP antibiotic
1 Supplementary Figure 1. Antibiotic partially rescues mice from sepsis. (ab) BALB/c mice under CLP were treated with antibiotic or PBS. (a) Survival curves. WT Sham (n=5), WT CLP or WT CLP antibiotic
The autoimmune disease-associated PTPN22 variant promotes calpain-mediated Lyp/Pep
 SUPPLEMENTARY INFORMATION The autoimmune disease-associated PTPN22 variant promotes calpain-mediated Lyp/Pep degradation associated with lymphocyte and dendritic cell hyperresponsiveness Jinyi Zhang, Naima
Supplementary Figure 1. Expression of CUGBP1 in non-parenchymal liver cells treated with TGF-β
 Supplementary Figures Supplementary Figure 1. Expression of CUGBP1 in non-parenchymal liver cells treated with TGF-β and LPS. Non-parenchymal liver cells were isolated and treated with or without TGF-β
SUPPLEMENTARY INFORMATION
 Supplemental Figure 1. Furin is efficiently deleted in CD4 + and CD8 + T cells. a, Western blot for furin and actin proteins in CD4cre-fur f/f and fur f/f Th1 cells. Wild-type and furin-deficient CD4 +
Supplemental Materials. Stromal Modulation Reverses Primary Resistance to Immune Checkpoint Blockade in. Pancreatic Cancer.
 Supplemental Materials Stromal Modulation Reverses Primary Resistance to Immune Checkpoint Blockade in Pancreatic Cancer Jun Zhao 1, Zhilan Xiao 2, 3, Tingting Li 1, 4, Huiqin Chen 5, Ying Yuan 5, Alan
Supplementary Figure 1. Repression of hepcidin expression in the liver of mice treated with
 Supplementary Figure 1. Repression of hepcidin expression in the liver of mice treated with DMN Immunohistochemistry for hepcidin and H&E staining (left). qrt-pcr assays for hepcidin in the liver (right).
Generation of ST2-GFP reporter mice and characterization of ILC1 cells following infection
 Supplementary Figure 1 Generation of ST2-GFP reporter mice and characterization of ILC1 cells following infection with influenza virus. (a) ST2-GFP reporter mice were generated as described in Methods.
Reviewers' comments: Reviewer #1 Expert in EAE and IL-17a (Remarks to the Author):
:") Reviewers' comments: Reviewer #1 Expert in EAE and IL-17a (Remarks to the Author): This study shows that the inducible camp early repressor (ICER) is involved in development of Th17 cells that are pathogenic
Reviewers' comments: Reviewer #1 Expert in EAE and IL-17a (Remarks to the Author): This study shows that the inducible camp early repressor (ICER) is involved in development of Th17 cells that are pathogenic
SUPPLEMENTARY INFORMATION
 Complete but curtailed T-cell response to very-low-affinity antigen Dietmar Zehn, Sarah Y. Lee & Michael J. Bevan Supp. Fig. 1: TCR chain usage among endogenous K b /Ova reactive T cells. C57BL/6 mice
Supplementary Figure 1. H-PGDS deficiency does not affect GI tract functions and anaphylactic reaction. (a) Representative pictures of H&E-stained
 Representative pictures of H&E-stained") 1 2 3 4 5 6 7 8 9 10 11 Supplementary Figure 1. H-PGDS deficiency does not affect GI tract functions and anaphylactic reaction. (a) Representative pictures of H&E-stained jejunum sections ( 200 magnification;
1 2 3 4 5 6 7 8 9 10 11 Supplementary Figure 1. H-PGDS deficiency does not affect GI tract functions and anaphylactic reaction. (a) Representative pictures of H&E-stained jejunum sections ( 200 magnification;
BCR-ABL - LSK BCR-ABL + LKS - (%)
") Marker Clone BCR-ABL + LSK (%) BCR-ABL + LKS - (%) BCR-ABL - LSK (%) P value vs. BCR-ABL + LKS - P value vs. BCR-ABL - LSK CD2 RM2-5 12.9 ± 3.6 36.7 ± 6.5 19.3 ± 2.4 0.01 0.10 CD5 53-7.3 13.9 ± 3.2 20.8
Marker Clone BCR-ABL + LSK (%) BCR-ABL + LKS - (%) BCR-ABL - LSK (%) P value vs. BCR-ABL + LKS - P value vs. BCR-ABL - LSK CD2 RM2-5 12.9 ± 3.6 36.7 ± 6.5 19.3 ± 2.4 0.01 0.10 CD5 53-7.3 13.9 ± 3.2 20.8
Optimizing Intracellular Flow Cytometry:
 Optimizing Intracellular Flow Cytometry: Simultaneous Detection of Cytokines and Transcription Factors An encore presentation by Jurg Rohrer, PhD, BD Biosciences 10.26.10 Outline Introduction Cytokines
Pearson r = P (one-tailed) = n = 9
 = n = 9") 8F4-Specific Lysis, % 1 UPN1 UPN3 8 UPN7 6 Pearson r =.69 UPN2 UPN5 P (one-tailed) =.192 4 UPN8 n = 9 2 UPN9 UPN4 UPN6 5 1 15 2 25 8 8F4, % Max MFI Supplementary Figure S1. AML samples UPN1-UPN9 show variable
8F4-Specific Lysis, % 1 UPN1 UPN3 8 UPN7 6 Pearson r =.69 UPN2 UPN5 P (one-tailed) =.192 4 UPN8 n = 9 2 UPN9 UPN4 UPN6 5 1 15 2 25 8 8F4, % Max MFI Supplementary Figure S1. AML samples UPN1-UPN9 show variable
Supplemental Information. CD4 + CD25 + Foxp3 + Regulatory T Cells Promote. Th17 Cells In Vitro and Enhance Host Resistance
 Immunity, Volume 34 Supplemental Information D4 + D25 + + Regulatory T ells Promote Th17 ells In Vitro and Enhance Host Resistance in Mouse andida albicans Th17 ell Infection Model Pushpa Pandiyan, Heather
Khosravi et al. Stem Cell Research & Therapy (2018) 9:273
 9:273") Khosravi et al. Stem Cell Research & Therapy (2018) 9:273 https://doi.org/10.1186/s13287-018-0991-1 RESEARCH Induction of CD4 + CD25 + FOXP3 + regulatory T cells by mesenchymal stem cells is associated
Khosravi et al. Stem Cell Research & Therapy (2018) 9:273 https://doi.org/10.1186/s13287-018-0991-1 RESEARCH Induction of CD4 + CD25 + FOXP3 + regulatory T cells by mesenchymal stem cells is associated
Potential Rebalancing of the Immune System by Anti-CD52 Therapy
 Potential Rebalancing of the Immune System by Anti-CD52 Therapy Johanne Kaplan, PhD VP Neuroimmunology Research Genzyme March 26, 2013 RESTRICTED USE SEE TRAINING MEMO 2011 DO Genzyme NOT 1COPY Corporation
Supplementary table I. Real-time primers used in the study. The fold change was obtained by
 Supplementary table I. Real-time primers used in the study. The fold change was obtained by normalizing the gene expression number to those of HPRT, then comparing the samples to untreated or naive mice.
Supporting Information
 Supporting Information Desnues et al. 10.1073/pnas.1314121111 SI Materials and Methods Mice. Toll-like receptor (TLR)8 / and TLR9 / mice were generated as described previously (1, 2). TLR9 / mice were
Suppl Video: Tumor cells (green) and monocytes (white) are seeded on a confluent endothelial
 and monocytes (white) are seeded on a confluent endothelial") Supplementary Information Häuselmann et al. Monocyte induction of E-selectin-mediated endothelial activation releases VE-cadherin junctions to promote tumor cell extravasation in the metastasis cascade
Supplementary Information Häuselmann et al. Monocyte induction of E-selectin-mediated endothelial activation releases VE-cadherin junctions to promote tumor cell extravasation in the metastasis cascade
SUPPLEMENTARY INFORMATION
 doi: 1.138/nature775 4 O.D. (595-655) 3 1 -ζ no antibody isotype ctrl Plated Soluble 1F6 397 7H11 Supplementary Figure 1 Soluble and plated anti- Abs induce -! signalling. B3Z cells stably expressing!
Human and mouse T cell regulation mediated by soluble CD52 interaction with Siglec-10. Esther Bandala-Sanchez, Yuxia Zhang, Simone Reinwald,
 Human and mouse T cell regulation mediated by soluble CD52 interaction with Siglec-1 Esther Bandala-Sanchez, Yuxia Zhang, Simone Reinwald, James A. Dromey, Bo Han Lee, Junyan Qian, Ralph M Böhmer and Leonard
Supplementary Figure 1. Efficiency of Mll4 deletion and its effect on T cell populations in the periphery. Nature Immunology: doi: /ni.
 Supplementary Figure 1 Efficiency of Mll4 deletion and its effect on T cell populations in the periphery. Expression of Mll4 floxed alleles (16-19) in naive CD4 + T cells isolated from lymph nodes and
BMDCs were generated in vitro from bone marrow cells cultured in 10 % RPMI supplemented
 Supplemental Materials Figure S1. Cultured BMDCs express CD11c BMDCs were generated in vitro from bone marrow cells cultured in 10 % RPMI supplemented with 15 ng/ml GM-CSF. Media was changed and fresh
Supplementary Information. Tissue-wide immunity against Leishmania. through collective production of nitric oxide
 Supplementary Information Tissue-wide immunity against Leishmania through collective production of nitric oxide Romain Olekhnovitch, Bernhard Ryffel, Andreas J. Müller and Philippe Bousso Supplementary
Supplementary Table 1 Clinicopathological characteristics of 35 patients with CRCs
 Supplementary Table Clinicopathological characteristics of 35 patients with CRCs Characteristics Type-A CRC Type-B CRC P value Sex Male / Female 9 / / 8.5 Age (years) Median (range) 6. (9 86) 6.5 (9 76).95
Defective STAT1 activation associated with impaired IFN-g production in NK and T lymphocytes from metastatic melanoma patients treated with IL-2
 Defective STAT1 activation associated with impaired IFN-g production in NK and T lymphocytes from metastatic melanoma patients treated with IL-2 SUPPLEMENTARY FIGURES AND TABLES Supplementary Figure S1:
TITLE: Harnessing GPR17 Biology for Treating Demyelinating Disease
 AD Award Number: W81XWH-10-1-0721 TITLE: Harnessing GPR17 Biology for Treating Demyelinating Disease PRINCIPAL INVESTIGATOR: Nitin Karandikar, M.D., Ph.D. CONTRACTING ORGANIZATION: University of Texas