ILC1 and ILC3 isolation and culture Following cell sorting, we confirmed that the recovered cells belonged to the ILC1, ILC2 and
|
|
|
- Noel Hart
- 5 years ago
- Views:
Transcription
1 Supplementary Methods and isolation and culture Following cell sorting, we confirmed that the recovered cells belonged to the, ILC2 and subsets. For this purpose we performed intracellular flow cytometry for the tracription factors t-bet, gata3 and rorγt, and assessed production of IFN-γ, IL-13 and 2 (Supp. Figs. 4A-G). To confirm that the CD56 + population was not lost following the preenrichment protocol, we evaluated CD56 and CD161 expression on the cell surface of cells and ILCs when pre-enriched with three different protocols: enrichment, ILC2 enrichment and. The latter separation, decreased the amount of contaminating cells prior to cell sorting but did not exclude the CD56 + expressing population in the lineage (Supp. Fig. 4H). For cell culture of and, all cytokines were added to the culture at 50 ng/ml, and media was topped up every 2/3 days (table 2). Cells were cultured at 37 o C, 5%CO2. Supplementary Results Group 1 and group 3 ILCs can be isolated from blood and activated in culture Despite our focus being on ILC2s throughout this study, our method of isolation also yielded high purity and populatio. We evaluated the phenotype of these cells via flow cytometry and assessed their effector function through the ability to produce cytokines, in the same way as for ILC2s. As with ILC2s, both s and s demotrated increased survival in SFEM II relative to IMDM media, but unlike ILC2s, their survival or proliferation was unaffected by the addition of cytokines (Supp. Fig. 5A,). Evaluation of surface phenotype revealed that both s and s maintained CD127 expression and that s remained CD117 + and s CD117 - (Supp. Fig 5D, E). s did show some modulation of CD161, with expression increasing marginally upon stimulation with and IL-12 (Supp. Fig. 5F).
2 Stimulation of and increased their production of effector cytokines significantly. Although neither produced IL-13, s produced high amounts of IFN-γ as expected (Supp. Fig. 6A) and s produced high levels of 2, TNF-α, GM-CSF (Supp. Fig. 4D,G and Supp. Fig 6) and moderate levels of IL-8 and IL-10 (Supp. Fig 4E,F). No IL-17A was detected in the supernatants of the sub-set cultures, however we did observe intracellular staining for both 2 (around 80% of cells) and IL-17 (around 50%) following activation with 3 and IL-1β, even in the absence of PMA/ionomycin activation (Supp. Fig. 6). It is possible that s were producing IL17-A, but that the levels of this cytokine were below the lower limit of quantitation in the ELISA, due to the limited number of cells per well, together with a lack of exteive proliferation. Granzyme production by these subsets was also evaluated, and although we found s to produce granzyme at baseline and up-regulate it following +IL-12 activation, due to the lack of positive markers in the isolation of this population it is still unclear whether this is a true feature of the population or if there is some cell contamination in the culture (or even potentially the presence of ILC2s that could have acquired an phenotype prior to cell sorting). We did not find evidence of CD94 or CD56 expression in this population after cell isolation or culture (data nor shown). s could also express granzyme but only in the presence of, as stimulation with 3+IL-1β only showed a minor effect (Supp. Fig. 6D).
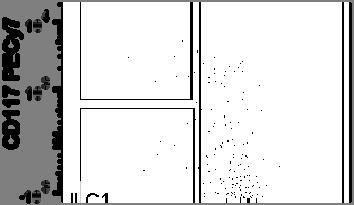
3 Supplementary Figure 1. Evaluation of different protocols for the selection of methodology providing the highest enrichment for all three ILC populatio. Several protocols were utilised to optimise conditio of enrichment for ILCs prior to cell sorting. (A) Representative figure showing dot-plots for gating on all ILC populatio based on their canonical markers and table comparing percentages of all populatio using each protocol. () Percentage of cells obtained after Easysep TM enrichment for each protocol, calculated based on the initial numbers of total PMCs and (C) purity of ILC2 or / per experiment. The lower the percentage of recovery from initial PMCs, the higher the purity of the ILC populatio. Each number on the x-axis represents one individual experiment, and each symbol represents one donor. (D) Number of ILCs obtained post-sort, as counted by trypan blue dye exclusion (each symbol represents one donor).(e) Purity check was performed after cell sorting by evaluating the percentage of cells within the lineage - CD127 + gate in the top dot-plots and confirming,2 and 3 phenotype by their expression of CD117 (y-axis) and CRTh2 (xaxis); bottom dot-plots. Data are representative of up to 7 independent experiments, with n=2/3 donors per experiment. Supplementary Figure 2. Comparative phenotype of ILC2s cultured in SFEM II media. ILC2s were cultured in SFEM II and their cell surface phenotype was evaluated by flow cytometry. (A) Percentage of CD117 + CD161 + ILC2s in SFEM II culture and mean fluorescence inteity for () CD127 and (C) CRTh2. (D) Percentage of cells double positive for IL-17R and R and (E) percentage of ST2 + ILC2s. Data is depicted as mean±sem from two independent experiments, with n=2/3 donors each. Significance was calculated using one way ANOVA, corrected for multiple compariso, to compare all treatment groups to each other where p<0.05; p<0.01, p<0.001, p< Statistics above bars represent comparison to media baseline; comparison between samples is represented by connecting line. Supplementary Figure 3. Dose respoe of ILC2s to cytokine stimulation. ILC2s were cultured for five days in the presence of epithelial cytokines alone, in double or triple combination or with +IL-1β using a 1:10 serial dilution. (A) IL-13 and () IL-5 were measured in cell supernatants of ILC2s cultured with different cytokine cocktails. Data is depicted as mean±sem from two independent experiments, with n=2 donors each. Significance was calculated using one way ANOVA, corrected for multiple compariso, to compare all treatment groups to each other where p<0.05; p<0.01, p<0.001, p< Statistics above bars represent comparison to media baseline; comparison between samples is represented by connecting line. (C) IL-13 and (D) IL-5 were measured in the cell supernatants following serial dilution of cytokines in order to evaluate an optimal concentration of stimulating cytokines. Data are representative of two independent experiments, n=1 donor per experiment. Supplementary Figure 4. Phenotypic analysis of PMC-derived ILC populatio Tracription factor staining for, ILC2, and cells following pre-enrichment protocol. ILCs were stained for tracription factors rorγt, gata3 and t-bet by flow cytometry. (A) Dot plots showing the gating strategy for all three ILC populatio and for cells, and histograms showing their relative expression of each tracription factor. Representative data for two experiment, n=2 donors., ILC2 and were then isolated and stimulated in vitro for 5 days, before supernatants were analysed for the cytokines: () IL-13, (C) IFN-γ, (D) TNF-α, (E) IL-8, (F) IL-10 and (G) 2. Data are shown as mean±sem from two independent experiments, with n=2/3 donors each. Significance was calculated using one way
4 NOVA followed by correction for multiple compariso, where p<0.05, p<0.01, p<0.001, p< Statistics above bars represent comparison to media baseline; comparison between samples is represented by connecting line. (H) Dot plots showing the gating strategy for both PMC-derived cells and ILCs and comparative expression of the CD161 and CD56 markers between three different pre-enrichment protocols. Data is representative of two independent experiments (n=2 donors per experiment). Supplementary Figure 5. Phenotypic changes following in vitro culture of s or s. Cell sorted s and s were cultured for five days in the presence of +IL- 12, or 3+IL-1β, respectively, in IMDM or SFEM II. Survival was measured for (A) and () in both IMDM or SFEM II and (C) cell number was calculated for both populatio. Cell surface phenotype was also evaluated for (D) CD127, (E) CD117 and (F) CD161 by quantification of the mean fluorescence inteity as compared to isotype control. Data are shown as mean±sem from two independent experiments, with n=2 or 3 donors each. Significance was calculated using one way ANOVA followed by correction for multiple compariso, where p<0.05, p<0.01, p<0.001, p< Statistics above bars represent comparison to media baseline; comparison between samples is represented by connecting line. Supplementary Figure 6. Modulation of and effector function following activation in vitro. Following isolation, s and s were cultured for 5 days in vitro and stimulated with different cytokine cocktails, as indicated, in IMDM baseline media. (A) IL-13 and IFN-γ and, () 2 and IL-17A expression were evaluated by intracellular flow cytometry, after incubation of s and s with brefeldin A±PMA/ionomycin. (D) Granzyme production was also evaluated for both cell types after intracellular staining and a 4 hour incubation with brefeldin A only. Data is representative of two independent experiments (n=2 donors/experiment).


 CD4 (n=3)")
 (% of")
 (% of")


")


5 No enrichment CD4 enrichment enrichment CD4 combination combination No enrichment (n=10) CD4 enrichment (n=5) enrichment (n=4) CD4 (n=3) (n=10) % total ILCs (live CD45 + ) (% of total ILC) ILC2 (% of total ILC) (% of total ILC) 0.14± ± ± ± ± ±8 56±26 25±16 45±24 22±6 14±6 25±17 50±11 42±23 59±9 6±3 10±8 21±9 7±4 16±5 CD4 enrichment enrichment CD4 C CD4 enrichment enrichment CD4 enrichment CD4 100 Purity of ILC2 (%) Experiments/sorts D E ILC2 Total number of ILCs (x10 4 ) Lin - CD127 + Lin - CD127 + Lin - CD127 + Supplementary Figure 1
6 C D E Supplementary Figure 2
7 C D Cell stimulation (ng/ml) IL-1 Supplementary Figure 3


 E F G H")
 400 300")


8 CD127 + ILC2 CD127 CD127 CD117 T-bet RORgt GATA3 Lineage CD56 CRTH2 ILC2 C D IL-10 (pg/ml) E F G H TNF- (pg/ml) 2 (pg/ml) IL-1 3 IL-1 3 IL-12 IL-12 5 ILC2 ILC2 5 enrichment ILC2 CD56 CD161 ILC2 CD56 CD161 ILC2 enrichment Supplementary Figure 4 CD56 CD161 ILC2
9 C 1000 % Live IL-12 IL-1 3 D E F Supplementary Figure 5
 Isotype control (IL-13) media 3")

10 media IL-12 refeldin A FMO PMA/ionomycin Isotype control (IFN-γ) Isotype control (IL-13) media 3 IL-1β refeldin A FMO PMA/ionomycin D media IL-12 media 3 IL-1β 3 IL-1β FMO Supplementary Figure 6
Supplementary Figure 1
 Supplementary Figure 1 Identification of IFN-γ-producing CD8 + and CD4 + T cells with naive phenotype by alternative gating and sample-processing strategies. a. Contour 5% probability plots show definition
Supplementary Figure 1. IL-12 serum levels and frequency of subsets in FL patients. (A) IL-12
 IL-12") 1 Supplementary Data Figure legends Supplementary Figure 1. IL-12 serum levels and frequency of subsets in FL patients. (A) IL-12 serum levels measured by multiplex ELISA (Luminex) in FL patients before
1 Supplementary Data Figure legends Supplementary Figure 1. IL-12 serum levels and frequency of subsets in FL patients. (A) IL-12 serum levels measured by multiplex ELISA (Luminex) in FL patients before
Generation of ST2-GFP reporter mice and characterization of ILC1 cells following infection
 Supplementary Figure 1 Generation of ST2-GFP reporter mice and characterization of ILC1 cells following infection with influenza virus. (a) ST2-GFP reporter mice were generated as described in Methods.
<10. IL-1β IL-6 TNF + _ TGF-β + IL-23
 3 ns 25 ns 2 IL-17 (pg/ml) 15 1 ns ns 5 IL-1β IL-6 TNF
Supplementary Figure 1. Characterization of basophils after reconstitution of SCID mice
 Supplementary figure legends Supplementary Figure 1. Characterization of after reconstitution of SCID mice with CD4 + CD62L + T cells. (A-C) SCID mice (n = 6 / group) were reconstituted with 2 x 1 6 CD4
Supplemental Information. CD4 + CD25 + Foxp3 + Regulatory T Cells Promote. Th17 Cells In Vitro and Enhance Host Resistance
 Immunity, Volume 34 Supplemental Information D4 + D25 + + Regulatory T ells Promote Th17 ells In Vitro and Enhance Host Resistance in Mouse andida albicans Th17 ell Infection Model Pushpa Pandiyan, Heather
CD4 + T cells recovered in Rag2 / recipient ( 10 5 ) Heart Lung Pancreas
 Heart Lung Pancreas") a CD4 + T cells recovered in Rag2 / recipient ( 1 5 ) Heart Lung Pancreas.5 1 2 4 6 2 4 6 Ctla4 +/+ Ctla4 / Ctla4 / Lung Ctla4 / Pancreas b Heart Lung Pancreas Ctla4 +/+ Ctla4 / Ctla4 / Lung Ctla4 / Pancreas
a CD4 + T cells recovered in Rag2 / recipient ( 1 5 ) Heart Lung Pancreas.5 1 2 4 6 2 4 6 Ctla4 +/+ Ctla4 / Ctla4 / Lung Ctla4 / Pancreas b Heart Lung Pancreas Ctla4 +/+ Ctla4 / Ctla4 / Lung Ctla4 / Pancreas
Supplemental Figure 1
 Supplemental Figure 1 1a 1c PD-1 MFI fold change 6 5 4 3 2 1 IL-1α IL-2 IL-4 IL-6 IL-1 IL-12 IL-13 IL-15 IL-17 IL-18 IL-21 IL-23 IFN-α Mut Human PD-1 promoter SBE-D 5 -GTCTG- -1.2kb SBE-P -CAGAC- -1.kb
Supplementary Figure 1. Efficiency of Mll4 deletion and its effect on T cell populations in the periphery. Nature Immunology: doi: /ni.
 Supplementary Figure 1 Efficiency of Mll4 deletion and its effect on T cell populations in the periphery. Expression of Mll4 floxed alleles (16-19) in naive CD4 + T cells isolated from lymph nodes and
Supplementary Materials for
 www.sciencesignaling.org/cgi/content/full/8/381/ra59/dc1 Supplementary Materials for Analysis of single-cell cytokine secretion reveals a role for paracrine signaling in coordinating macrophage responses
D CD8 T cell number (x10 6 )
") IFNγ Supplemental Figure 1. CD T cell number (x1 6 ) 18 15 1 9 6 3 CD CD T cells CD6L C CD5 CD T cells CD6L D CD8 T cell number (x1 6 ) 1 8 6 E CD CD8 T cells CD6L F Log(1)CFU/g Feces 1 8 6 p
IFNγ Supplemental Figure 1. CD T cell number (x1 6 ) 18 15 1 9 6 3 CD CD T cells CD6L C CD5 CD T cells CD6L D CD8 T cell number (x1 6 ) 1 8 6 E CD CD8 T cells CD6L F Log(1)CFU/g Feces 1 8 6 p
Defective STAT1 activation associated with impaired IFN-g production in NK and T lymphocytes from metastatic melanoma patients treated with IL-2
 Defective STAT1 activation associated with impaired IFN-g production in NK and T lymphocytes from metastatic melanoma patients treated with IL-2 SUPPLEMENTARY FIGURES AND TABLES Supplementary Figure S1:
MATERIALS AND METHODS. Neutralizing antibodies specific to mouse Dll1, Dll4, J1 and J2 were prepared as described. 1,2 All
 MATERIALS AND METHODS Antibodies (Abs), flow cytometry analysis and cell lines Neutralizing antibodies specific to mouse Dll1, Dll4, J1 and J2 were prepared as described. 1,2 All other antibodies used
NMED-A65251A. Supplementary Figures.
 NMED-A65251A Supplementary Figures. Sup. Fig. 1. ILC3 cells are the main source of in obese mice a. We gated on T cells (upper panels) or T cells (lower panels), and examined production. b. CD45 + - IL-13
Supplemental Information. Aryl Hydrocarbon Receptor Controls. Monocyte Differentiation. into Dendritic Cells versus Macrophages
 Immunity, Volume 47 Supplemental Information Aryl Hydrocarbon Receptor Controls Monocyte Differentiation into Dendritic Cells versus Macrophages Christel Goudot, Alice Coillard, Alexandra-Chloé Villani,
Low Avidity CMV + T Cells accumulate in Old Humans
 Supplementary Figure Legends Supplementary Figure 1. CD45RA expressing CMVpp65-specific T cell populations accumulate within HLA-A*0201 and HLA-B*0701 individuals Pooled data showing the size of the NLV/HLA-A*0201-specific
The encephalitogenicity of TH17 cells is dependent on IL-1- and IL-23- induced production of the cytokine GM-CSF
 CORRECTION NOTICE Nat.Immunol. 12, 568 575 (2011) The encephalitogenicity of TH17 cells is dependent on IL-1- and IL-23- induced production of the cytokine GM-CSF Mohamed El-Behi, Bogoljub Ciric, Hong
SUPPLEMENTARY INFORMATION
 doi:1.138/nature1554 a TNF-α + in CD4 + cells [%] 1 GF SPF 6 b IL-1 + in CD4 + cells [%] 5 4 3 2 1 Supplementary Figure 1. Effect of microbiota on cytokine profiles of T cells in GALT. Frequencies of TNF-α
Supplemental Figure 1. Signature gene expression in in vitro differentiated Th0, Th1, Th2, Th17 and Treg cells. (A) Naïve CD4 + T cells were cultured
 Naïve CD4 + T cells were cultured") Supplemental Figure 1. Signature gene expression in in vitro differentiated Th0, Th1, Th2, Th17 and Treg cells. (A) Naïve CD4 + T cells were cultured under Th0, Th1, Th2, Th17, and Treg conditions. mrna
Supplemental Figure 1. Signature gene expression in in vitro differentiated Th0, Th1, Th2, Th17 and Treg cells. (A) Naïve CD4 + T cells were cultured under Th0, Th1, Th2, Th17, and Treg conditions. mrna
Phenotype Determines Nanoparticle Uptake by Human
 Phenotype Determines Nanoparticle Uptake by Human Macrophages from Liver and Blood Sonya A. MacParland a,b,, Kim M. Tsoi c,d,, Ben Ouyang c, Xue-Zhong Ma a, Justin Manuel a, Ali Fawaz b, Mario A. Ostrowski
Supplementary Figure 1. Efficient DC depletion in CD11c.DOG transgenic mice
 Supplementary Figure 1. Efficient DC depletion in CD11c.DOG transgenic mice (a) CD11c.DOG transgenic mice (tg) were treated with 8 ng/g body weight (b.w.) diphtheria toxin (DT) i.p. on day -1 and every
Akt and mtor pathways differentially regulate the development of natural and inducible. T H 17 cells
 Akt and mtor pathways differentially regulate the development of natural and inducible T H 17 cells Jiyeon S Kim, Tammarah Sklarz, Lauren Banks, Mercy Gohil, Adam T Waickman, Nicolas Skuli, Bryan L Krock,
% of Cells A B C. Proliferation Index. T cell count (10 6 ) Division Index. % of Max CFSE. %Ki67+ cells. Supplementary Figure 1.
 Division Index. % of Max CFSE. %Ki67+ cells. Supplementary Figure 1.") A B C T cell count (1 6 ) 3. 2. 1.. * % of Max CFSE ormoxia ypoxia o Stim. Proliferation Index 2.5 2. 1.5 1. * Division Index 2. 1.5 1..5. D E %Ki67+ cells 1 8 6 4 2 % of Cells 8 ormoxia 6 ypoxia 4 2 *
A B C T cell count (1 6 ) 3. 2. 1.. * % of Max CFSE ormoxia ypoxia o Stim. Proliferation Index 2.5 2. 1.5 1. * Division Index 2. 1.5 1..5. D E %Ki67+ cells 1 8 6 4 2 % of Cells 8 ormoxia 6 ypoxia 4 2 *
HD1 (FLU) HD2 (EBV) HD2 (FLU)
 HD2 (EBV) HD2 (FLU)") ramer staining + anti-pe beads ramer staining a HD1 (FLU) HD2 (EBV) HD2 (FLU).73.11.56.46.24 1.12 b CD127 + c CD127 + d CD127 - e CD127 - PD1 - PD1 + PD1 + PD1-1 1 1 1 %CD127 + PD1-8 6 4 2 + anti-pe %CD127
ramer staining + anti-pe beads ramer staining a HD1 (FLU) HD2 (EBV) HD2 (FLU).73.11.56.46.24 1.12 b CD127 + c CD127 + d CD127 - e CD127 - PD1 - PD1 + PD1 + PD1-1 1 1 1 %CD127 + PD1-8 6 4 2 + anti-pe %CD127
Supplementary Figure 1. Example of gating strategy
 Supplementary Figure 1. Example of gating strategy Legend Supplementary Figure 1: First, gating is performed to include only single cells (singlets) (A) and CD3+ cells (B). After gating on the lymphocyte
% of live splenocytes. STAT5 deletion. (open shapes) % ROSA + % floxed
 % ROSA + % floxed") Supp. Figure 1. a 14 1 1 8 6 spleen cells (x1 6 ) 16 % of live splenocytes 5 4 3 1 % of live splenocytes 8 6 4 b 1 1 c % of CD11c + splenocytes (closed shapes) 8 6 4 8 6 4 % ROSA + (open shapes) % floxed
Supp. Figure 1. a 14 1 1 8 6 spleen cells (x1 6 ) 16 % of live splenocytes 5 4 3 1 % of live splenocytes 8 6 4 b 1 1 c % of CD11c + splenocytes (closed shapes) 8 6 4 8 6 4 % ROSA + (open shapes) % floxed
Nature Medicine: doi: /nm.2109
 HIV 1 Infects Multipotent Progenitor Cells Causing Cell Death and Establishing Latent Cellular Reservoirs Christoph C. Carter, Adewunmi Onafuwa Nuga, Lucy A. M c Namara, James Riddell IV, Dale Bixby, Michael
T H 1, T H 2 and T H 17 polarization of naïve CD4 + mouse T cells
 A complete workflow for cell preparation, isolation, polarization and analysis T H 1, T H 2 and T H 17 polarization of naïve CD4 + mouse T cells Introduction Workflow CD4 + T helper (T H) cells play a
Supplemental Figure 1. Protein L
 Supplemental Figure 1 Protein L m19delta T m1928z T Suppl. Fig 1. Expression of CAR: B6-derived T cells were transduced with m19delta (left) and m1928z (right) to generate CAR T cells and transduction
Blocking antibodies and peptides. Rat anti-mouse PD-1 (29F.1A12, rat IgG2a, k), PD-
, PD-") Supplementary Methods Blocking antibodies and peptides. Rat anti-mouse PD-1 (29F.1A12, rat IgG2a, k), PD- L1 (10F.9G2, rat IgG2b, k), and PD-L2 (3.2, mouse IgG1) have been described (24). Anti-CTLA-4 (clone
Supplementary Methods Blocking antibodies and peptides. Rat anti-mouse PD-1 (29F.1A12, rat IgG2a, k), PD- L1 (10F.9G2, rat IgG2b, k), and PD-L2 (3.2, mouse IgG1) have been described (24). Anti-CTLA-4 (clone
Supplementary Figure 1. mrna expression of chitinase and chitinase-like protein in splenic immune cells. Each splenic immune cell population was
 Supplementary Figure 1. mrna expression of chitinase and chitinase-like protein in splenic immune cells. Each splenic immune cell population was sorted by FACS. Surface markers for sorting were CD11c +
SDC (Supplemental Digital Content) Figure S1. Percentages of Granzyme B expressing CD8 + T lymphocytes
 Figure S1. Percentages of Granzyme B expressing CD8 + T lymphocytes") Figure S1. Percentages of Granzyme expressing D8 + T lymphocytes 13.5% 1.4%.6% 77% 21% 24% 76% 8 8 Granzyme + (%) 6 4 2 Granzyme + (%) 6 4 2 D8 + Tnaive Tcm Tem Temra D8 + D8 + D28 + D8 + D28 null We analyzed
Figure S1. Percentages of Granzyme expressing D8 + T lymphocytes 13.5% 1.4%.6% 77% 21% 24% 76% 8 8 Granzyme + (%) 6 4 2 Granzyme + (%) 6 4 2 D8 + Tnaive Tcm Tem Temra D8 + D8 + D28 + D8 + D28 null We analyzed
Supplementary Information. Tissue-wide immunity against Leishmania. through collective production of nitric oxide
 Supplementary Information Tissue-wide immunity against Leishmania through collective production of nitric oxide Romain Olekhnovitch, Bernhard Ryffel, Andreas J. Müller and Philippe Bousso Supplementary
Spleen. mlns. E Spleen 4.1. mlns. Spleen. mlns. Mock 17. Mock CD8 HIV-1 CD38 HLA-DR. Ki67. Spleen. Spleen. mlns. Cheng et al. Fig.
 C D E F Mock 17 Mock 4.1 CD38 57 CD8 23.7 HLA-DR Ki67 G H I Cheng et al. Fig.S1 Supplementary Figure 1. persistent infection leads to human T cell depletion and hyper-immune activation. Humanized mice
Supplementary Figures
 Supplementary Figures Supplementary Figure 1. NKT ligand-loaded tumour antigen-presenting B cell- and monocyte-based vaccine induces NKT, NK and CD8 T cell responses. (A) The cytokine profiles of liver
SUPPLEMENT Supplementary Figure 1: (A) (B)
 (B)") SUPPLEMENT Supplementary Figure 1: CD4 + naïve effector T cells (CD4 effector) were labeled with CFSE, stimulated with α-cd2/cd3/cd28 coated beads (at 2 beads/cell) and cultured alone or cocultured with
SUPPLEMENT Supplementary Figure 1: CD4 + naïve effector T cells (CD4 effector) were labeled with CFSE, stimulated with α-cd2/cd3/cd28 coated beads (at 2 beads/cell) and cultured alone or cocultured with
Supplemental Methods. CD107a assay
 Supplemental Methods CD107a assay For each T cell culture that was tested, two tubes were prepared. One tube contained BCMA-K562 cells, and the other tube contained NGFR-K562 cells. Both tubes contained
Dual Targeting Nanoparticle Stimulates the Immune
 Dual Targeting Nanoparticle Stimulates the Immune System to Inhibit Tumor Growth Alyssa K. Kosmides, John-William Sidhom, Andrew Fraser, Catherine A. Bessell, Jonathan P. Schneck * Supplemental Figure
Nature Immunology: doi: /ni Supplementary Figure 1. RNA-Seq analysis of CD8 + TILs and N-TILs.
 Supplementary Figure 1 RNA-Seq analysis of CD8 + TILs and N-TILs. (a) Schematic representation of the tumor and cell types used for the study. HNSCC, head and neck squamous cell cancer; NSCLC, non-small
Nature Medicine: doi: /nm.3922
 Title: Glucocorticoid-induced tumor necrosis factor receptor-related protein co-stimulation facilitates tumor regression by inducing IL-9-producing helper T cells Authors: Il-Kyu Kim, Byung-Seok Kim, Choong-Hyun
SUPPLEMENTARY INFORMATION
 Complete but curtailed T-cell response to very-low-affinity antigen Dietmar Zehn, Sarah Y. Lee & Michael J. Bevan Supp. Fig. 1: TCR chain usage among endogenous K b /Ova reactive T cells. C57BL/6 mice
NK cell flow cytometric assay In vivo DC viability and migration assay
 NK cell flow cytometric assay 6 NK cells were purified, by negative selection with the NK Cell Isolation Kit (Miltenyi iotec), from spleen and lymph nodes of 6 RAG1KO mice, injected the day before with
Supplementary Figure 1
 Supplementary Figure 1 Expression of apoptosis-related genes in tumor T reg cells. (a) Identification of FOXP3 T reg cells by FACS. CD45 + cells were gated as enriched lymphoid cell populations with low-granularity.
ndln NK Cells (x10 3 ) Days post-infection (A/PR/8) *** *** *** Liver NK Cells (x10 4 ) Days post-infection (MCMV)
 Days post-infection (A/PR/8) *** *** *** Liver NK Cells (x10 4 ) Days post-infection (MCMV)") A mln NK Cells(x ) 6 1 * ndln NK Cells (x ) ns C Lung NK Cells(x ) 1 1 7 * D LN NK Cells (x ) 1 7 1 7 Days post-infection (A/PR/8) * * E Liver NK Cells (x ) 1 7 Days post-infection (A/PR/8) * * * 1 7 Days
A mln NK Cells(x ) 6 1 * ndln NK Cells (x ) ns C Lung NK Cells(x ) 1 1 7 * D LN NK Cells (x ) 1 7 1 7 Days post-infection (A/PR/8) * * E Liver NK Cells (x ) 1 7 Days post-infection (A/PR/8) * * * 1 7 Days
Human and mouse T cell regulation mediated by soluble CD52 interaction with Siglec-10. Esther Bandala-Sanchez, Yuxia Zhang, Simone Reinwald,
 Human and mouse T cell regulation mediated by soluble CD52 interaction with Siglec-1 Esther Bandala-Sanchez, Yuxia Zhang, Simone Reinwald, James A. Dromey, Bo Han Lee, Junyan Qian, Ralph M Böhmer and Leonard
Human Immunodeficiency Virus Type-1 Myeloid Derived Suppressor Cells Inhibit Cytomegalovirus Inflammation through Interleukin-27 and B7-H4
 Human Immunodeficiency Virus Type-1 Myeloid Derived Suppressor Cells Inhibit Cytomegalovirus Inflammation through Interleukin-27 and B7-H4 Ankita Garg, Rodney Trout and Stephen A. Spector,,* Department
Table S1. Viral load and CD4 count of HIV-infected patient population
 Table S1. Viral load and CD4 count of HIV-infected patient population Subject ID Viral load (No. of copies per ml of plasma) CD4 count (No. of cells/µl of blood) 28 7, 14 29 7, 23 21 361,99 94 217 7, 11
PRIME-XV Dendritic Cell Maturation CDM
 PRIME-XV Dendritic Cell Maturation CDM Chemically defined, animal component-free medium for dendritic cell culture Optimized for differentiation of monocytes into immature dendritic cells (idcs) and subsequent
Eosinophils are required. for the maintenance of plasma cells in the bone marrow
 Eosinophils are required for the maintenance of plasma cells in the bone marrow Van Trung Chu, Anja Fröhlich, Gudrun Steinhauser, Tobias Scheel, Toralf Roch, Simon Fillatreau, James J. Lee, Max Löhning
Activated mast cells promote differentiation of B cells into effector cells
 Supplementary,information, Activated mast cells promote differentiation of B cells into effector cells Anna-Karin E. Palm 1, Gianni Garcia Faroldi 2, Marcus Lundberg 1, Gunnar Pejler 3, 2 and Sandra Kleinau
Supplementary information. The proton-sensing G protein-coupled receptor T-cell death-associated gene 8
 1 Supplementary information 2 3 The proton-sensing G protein-coupled receptor T-cell death-associated gene 8 4 (TDAG8) shows cardioprotective effects against myocardial infarction 5 Akiomi Nagasaka 1+,
ECM1 controls T H 2 cell egress from lymph nodes through re-expression of S1P 1
 ZH, Li et al, page 1 ECM1 controls T H 2 cell egress from lymph nodes through re-expression of S1P 1 Zhenhu Li 1,4,Yuan Zhang 1,4, Zhiduo Liu 1, Xiaodong Wu 1, Yuhan Zheng 1, Zhiyun Tao 1, Kairui Mao 1,
well for 2 h at rt. Each dot represents an individual mouse and bar is the mean ±
 Supplementary data: Control DC Blimp-1 ko DC 8 6 4 2-2 IL-1β p=.5 medium 8 6 4 2 IL-2 Medium p=.16 8 6 4 2 IL-6 medium p=.3 5 4 3 2 1-1 medium IL-1 n.s. 25 2 15 1 5 IL-12(p7) p=.15 5 IFNγ p=.65 4 3 2 1
Supplementary Figures
 Inhibition of Pulmonary Anti Bacterial Defense by IFN γ During Recovery from Influenza Infection By Keer Sun and Dennis W. Metzger Supplementary Figures d a Ly6G Percentage survival f 1 75 5 1 25 1 5 1
Supplementary Information
 Supplementary Information Memory-type ST2 + CD + T cells participate in the steroid-resistant pathology of eosinophilic pneumonia Naoko Mato 1, 2, Kiyoshi Hirahara 2, Tomomi Ichikawa 2, Jin Kumagai 2,
BD CBA on the BD Accuri C6: Bringing Multiplexed Cytokine Detection to the Benchtop
 BD CBA on the BD Accuri C6: Bringing Multiplexed Cytokine Detection to the Benchtop Maria Dinkelmann, PhD Senior Marketing Applications Specialist BD Biosciences, Ann Arbor, MI 23-14380-00 Cellular Communication
x Lymphocyte count /µl CD8+ count/µl 800 Calculated
 % Lymphocyte in CBC A. 50 40 30 20 10 Lymphocyte count /µl B. x10 3 2.5 1.5 C. 50 D. 1000 % CD3+CD8+ Cells 40 30 20 Calculated CD8+ count/µl 800 600 400 200 10 0 #61 #63 #64 #65 #68 #71 #72 #75 Figure
Chapter 13: Cytokines
 Chapter 13: Cytokines Definition: secreted, low-molecular-weight proteins that regulate the nature, intensity and duration of the immune response by exerting a variety of effects on lymphocytes and/or
Commercially available HLA Class II tetramers (Beckman Coulter) conjugated to
 conjugated to") Class II tetramer staining Commercially available HLA Class II tetramers (Beckman Coulter) conjugated to PE were combined with dominant HIV epitopes (DRB1*0101-DRFYKTLRAEQASQEV, DRB1*0301- PEKEVLVWKFDSRLAFHH,
Class II tetramer staining Commercially available HLA Class II tetramers (Beckman Coulter) conjugated to PE were combined with dominant HIV epitopes (DRB1*0101-DRFYKTLRAEQASQEV, DRB1*0301- PEKEVLVWKFDSRLAFHH,
Supplementary Table 1 Clinicopathological characteristics of 35 patients with CRCs
 Supplementary Table Clinicopathological characteristics of 35 patients with CRCs Characteristics Type-A CRC Type-B CRC P value Sex Male / Female 9 / / 8.5 Age (years) Median (range) 6. (9 86) 6.5 (9 76).95
Supplementary Materials for
 www.sciencesignaling.org/cgi/content/full/3/114/ra23/dc1 Supplementary Materials for Regulation of Zap70 Expression During Thymocyte Development Enables Temporal Separation of CD4 and CD8 Repertoire Selection
pro-b large pre-b small pre-b CCCP (µm) Rag1 -/- ;33.C9HCki
 Rag1 -/- ;33.C9HCki") a TMRM FI (Median) b TMRM FI (Median) c 20 15 10 5 0 8 6 4 2 0 pro-b large pre-b small pre-b 0 10 20 30 40 50 60 70 80 90 100 TMRM (nm) pro-b large pre-b small pre-b 0 1 2 4 8 16 32 64 128 256 CCCP (mm)
a TMRM FI (Median) b TMRM FI (Median) c 20 15 10 5 0 8 6 4 2 0 pro-b large pre-b small pre-b 0 10 20 30 40 50 60 70 80 90 100 TMRM (nm) pro-b large pre-b small pre-b 0 1 2 4 8 16 32 64 128 256 CCCP (mm)
Supplementary Information
 Supplementary Information Splenic red pulp macrophages are intrinsically superparamagnetic and contaminate magnetic cell isolates Lars Franken, arika Klein, arina Spasova, nna Elsukova, Ulf Wiedwald, eike
T-Cell Research. Novel multicolor flow cytometry tools for the study of CD4 + T-cell differentiation and plasticity
 T-Cell Research Novel multicolor flow cytometry tools for the study of CD4 + T-cell differentiation and plasticity A Solid Commitment to Research: Flexible Ways to Study CD4 T-Cell Differentiation and
Supplementary Information. A vital role for IL-2 trans-presentation in DC-mediated T cell activation in humans as revealed by daclizumab therapy
 Supplementary Information A vital role for IL-2 trans-presentation in DC-mediated T cell activation in humans as revealed by daclizumab therapy Simone C. Wuest 1, Jehad Edwan 1, Jayne F. Martin 1, Sungpil
Online supplement. Phenotypic, functional and plasticity features of classical and alternatively activated
 Online supplement Phenotypic, functional and plasticity features of classical and alternatively activated human macrophages Abdullah Al Tarique*, Jayden Logan *, Emma Thomas *, Patrick G Holt *, Peter
Therapeutic effect of baicalin on experimental autoimmune encephalomyelitis. is mediated by SOCS3 regulatory pathway
 Therapeutic effect of baicalin on experimental autoimmune encephalomyelitis is mediated by SOCS3 regulatory pathway Yuan Zhang 1,2, Xing Li 1,2, Bogoljub Ciric 1, Cun-gen Ma 3, Bruno Gran 4, Abdolmohamad
Endogenous TNFα orchestrates the trafficking of neutrophils into and within lymphatic vessels during acute inflammation
 SUPPLEMENTARY INFORMATION Endogenous TNFα orchestrates the trafficking of neutrophils into and within lymphatic vessels during acute inflammation Samantha Arokiasamy 1,2, Christian Zakian 1, Jessica Dilliway
Supplemental Materials
 Supplemental Materials Programmed death one homolog maintains the pool size of regulatory T cells by promoting their differentiation and stability Qi Wang 1, Jianwei He 1, Dallas B. Flies 2, Liqun Luo
Nature Medicine doi: /nm.3957
 Supplementary Fig. 1. p38 alternative activation, IL-21 expression, and T helper cell transcription factors in PDAC tissue. (a) Tissue microarrays of pancreatic tissue from 192 patients with pancreatic
Dendritic cell subsets and CD4 T cell immunity in Melanoma. Ben Wylie 1 st year PhD Candidate
 Dendritic cell subsets and CD4 T cell immunity in Melanoma Ben Wylie 1 st year PhD Candidate Melanoma Melanoma is the 4 th most common cancer in Australia. Current treatment options are ineffective resulting
Chronic variable stress activates hematopoietic stem cells
 SUPPLEMENTARY INFORMATION Chronic variable stress activates hematopoietic stem cells Timo Heidt *, Hendrik B. Sager *, Gabriel Courties, Partha Dutta, Yoshiko Iwamoto, Alex Zaltsman, Constantin von zur
Time after injection (hours) ns ns
 ns ns") Platelet life span (% iotinylated platelets) 1 8 6 4 2 4 24 48 72 96 Time after injection (hours) 6 4 2 IgG GPIα GPIβ GPII GPVI Receptor expression (GeoMean, fluorescence inteity) Supplementary figure
Platelet life span (% iotinylated platelets) 1 8 6 4 2 4 24 48 72 96 Time after injection (hours) 6 4 2 IgG GPIα GPIβ GPII GPVI Receptor expression (GeoMean, fluorescence inteity) Supplementary figure
Therapeutic PD L1 and LAG 3 blockade rapidly clears established blood stage Plasmodium infection
 Supplementary Information Therapeutic PD L1 and LAG 3 blockade rapidly clears established blood stage Plasmodium infection Noah S. Butler, Jacqueline Moebius, Lecia L. Pewe, Boubacar Traore, Ogobara K.
Supplementary Figure 1. Using DNA barcode-labeled MHC multimers to generate TCR fingerprints
 Supplementary Figure 1 Using DNA barcode-labeled MHC multimers to generate TCR fingerprints (a) Schematic overview of the workflow behind a TCR fingerprint. Each peptide position of the original peptide
Supporting Information
 Supporting Information Desnues et al. 10.1073/pnas.1314121111 SI Materials and Methods Mice. Toll-like receptor (TLR)8 / and TLR9 / mice were generated as described previously (1, 2). TLR9 / mice were
Crucial role for human Toll-like receptor 4 in the development of contact allergy to nickel
 Supplementary Figures 1-8 Crucial role for human Toll-like receptor 4 in the development of contact allergy to nickel Marc Schmidt 1,2, Badrinarayanan Raghavan 1,2, Verena Müller 1,2, Thomas Vogl 3, György
Supplementary Figure 1. Normal T lymphocyte populations in Dapk -/- mice. (a) Normal thymic development in Dapk -/- mice. Thymocytes from WT and Dapk
 Normal thymic development in Dapk -/- mice. Thymocytes from WT and Dapk") Supplementary Figure 1. Normal T lymphocyte populations in Dapk -/- mice. (a) Normal thymic development in Dapk -/- mice. Thymocytes from WT and Dapk -/- mice were stained for expression of CD4 and CD8.
Supplementary Figure 1. Normal T lymphocyte populations in Dapk -/- mice. (a) Normal thymic development in Dapk -/- mice. Thymocytes from WT and Dapk -/- mice were stained for expression of CD4 and CD8.
L1 on PyMT tumor cells but Py117 cells are more responsive to IFN-γ. (A) Flow
 Flow") A MHCI B PD-L1 Fold expression 8 6 4 2 Fold expression 3 2 1 No tx 1Gy 2Gy IFN Py117 Py117 Supplementary Figure 1. Radiation and IFN-γ enhance MHCI expression and PD- L1 on PyMT tumor cells but Py117 cells
A MHCI B PD-L1 Fold expression 8 6 4 2 Fold expression 3 2 1 No tx 1Gy 2Gy IFN Py117 Py117 Supplementary Figure 1. Radiation and IFN-γ enhance MHCI expression and PD- L1 on PyMT tumor cells but Py117 cells
Supplementary Materials for
 www.sciencesignaling.org/cgi/content/full/9/418/ra27/dc1 Supplementary Materials for The adhesion molecule PECAM-1 enhances the TGF- mediated inhibition of T cell function Debra K. Newman,* Guoping Fu,
Supplementary Figure 1 Protease allergens induce IgE and IgG1 production. (a-c)
") 1 Supplementary Figure 1 Protease allergens induce IgE and IgG1 production. (a-c) Serum IgG1 (a), IgM (b) and IgG2 (c) concentrations in response to papain immediately before primary immunization (day
1 Supplementary Figure 1 Protease allergens induce IgE and IgG1 production. (a-c) Serum IgG1 (a), IgM (b) and IgG2 (c) concentrations in response to papain immediately before primary immunization (day
Th17 and Th17/Treg ratio at early HIV infection associate with protective HIV-specific CD8 + T-cell responses and disease progression
 Th17 and Th17/Treg ratio at early HIV infection associate with protective HIV-specific CD8 T-cell responses and disease progression Juliana Falivene 1, Yanina Ghiglione 1, Natalia Laufer 1,3, María Eugenia
Type of file: PDF Title of file for HTML: Supplementary Information Description: Supplementary Figures
 Type of file: PDF Title of file for HTML: Supplementary Information Description: Supplementary Figures Type of file: MOV Title of file for HTML: Supplementary Movie 1 Description: NLRP3 is moving along
B220 CD4 CD8. Figure 1. Confocal Image of Sensitized HLN. Representative image of a sensitized HLN
 B220 CD4 CD8 Natarajan et al., unpublished data Figure 1. Confocal Image of Sensitized HLN. Representative image of a sensitized HLN showing B cell follicles and T cell areas. 20 µm thick. Image of magnification
Supplementary Table; Supplementary Figures and legends S1-S21; Supplementary Materials and Methods
 Silva et al. PTEN posttranslational inactivation and hyperactivation of the PI3K/Akt pathway sustain primary T cell leukemia viability Supplementary Table; Supplementary Figures and legends S1-S21; Supplementary
Supplementary Figure 1. BMS enhances human T cell activation in vitro in a
 Supplementary Figure 1. BMS98662 enhances human T cell activation in vitro in a concentration-dependent manner. Jurkat T cells were activated with anti-cd3 and anti-cd28 antibody in the presence of titrated
SUPPLEMENTARY INFORMATION
 Supplemental Figure 1. Furin is efficiently deleted in CD4 + and CD8 + T cells. a, Western blot for furin and actin proteins in CD4cre-fur f/f and fur f/f Th1 cells. Wild-type and furin-deficient CD4 +
SUPPLEMENTARY FIGURES
 SUPPLEMENTARY FIGURES 1 2 3 4 SUPPLEMENTARY TABLES Supplementary Table S1. Brain Tumors used in the study Code Tumor Classification Age Gender HuTuP51 Glioblastoma 57 Male HuTuP52 Glioblastoma 53 Male
Human Innate Lymphoid Cells: crosstalk with CD4 + regulatory T cells and role in Type 1 Diabetes
 Joint Lab Meeting 03/03/2015 Human Innate Lymphoid Cells: crosstalk with CD4 + regulatory T cells and role in Type 1 Diabetes Caroline Raffin Bluestone Lab ILCs: Definition - Common lymphoid progenitor
for six pairs of mice. (b) Representative FACS analysis of absolute number of T cells (CD4 + and
 Representative FACS analysis of absolute number of T cells (CD4 + and") SUPPLEMENTARY DATA Supplementary Figure 1: Peripheral lymphoid organs of SMAR1 -/- mice have an effector memory phenotype. (a) Lymphocytes collected from MLNs and Peyer s patches (PPs) of WT and SMAR1
SUPPLEMENTARY DATA Supplementary Figure 1: Peripheral lymphoid organs of SMAR1 -/- mice have an effector memory phenotype. (a) Lymphocytes collected from MLNs and Peyer s patches (PPs) of WT and SMAR1
Supplementary Figure 1.
 Supplementary Figure 1. Female Pro-ins2 -/- mice at 5-6 weeks of age were either inoculated i.p. with a single dose of CVB4 (1x10 5 PFU/mouse) or PBS and treated with αgalcer or control vehicle. On day
SUPPLEMENTARY INFORMATION
 doi:10.1038/nature10134 Supplementary Figure 1. Anti-inflammatory activity of sfc. a, Autoantibody immune complexes crosslink activating Fc receptors, promoting activation of macrophages, and WWW.NATURE.COM/NATURE
Supporting Information
 Supporting Information lpek et al. 1.173/pnas.1121217 SI Materials and Methods Mice. cell knockout, inos / (Taconic arms), Rag1 /, INγR /, and IL-12p4 / mice (The Jackson Laboratory) were maintained and/or
Supplemental Figure 1. IL-3 blockade with Fab CSL362 depletes plasmacytoid dendritic cells (pdcs), but not basophils, at higher doses.
, but not basophils, at higher doses.") Supplemental Figure 1. IL-3 blockade with Fab CSL362 depletes plasmacytoid dendritic cells (pdcs), but not basophils, at higher doses. Percentage of viable (A) pdcs (Sytox Blue-, Lin1-, HLADR+, BDCA2++)
Supplemental Figure 1. IL-3 blockade with Fab CSL362 depletes plasmacytoid dendritic cells (pdcs), but not basophils, at higher doses. Percentage of viable (A) pdcs (Sytox Blue-, Lin1-, HLADR+, BDCA2++)
Supplementary appendix
 Supplementary appendix This appendix formed part of the original submission and has been peer reviewed. We post it as supplied by the authors. Supplement to: Chandran SS, Somerville RPT, Yang JC, et al.
Supplementary Figure 1. Generation of knockin mice expressing L-selectinN138G. (a) Schematics of the Sellg allele (top), the targeting vector, the
 Schematics of the Sellg allele (top), the targeting vector, the") Supplementary Figure 1. Generation of knockin mice expressing L-selectinN138G. (a) Schematics of the Sellg allele (top), the targeting vector, the targeted allele in ES cells, and the mutant allele in
Supplementary Figure 1. Generation of knockin mice expressing L-selectinN138G. (a) Schematics of the Sellg allele (top), the targeting vector, the targeted allele in ES cells, and the mutant allele in
Supplementary Fig. 1: Ex vivo tetramer enrichment with anti-c-myc beads
 Supplementary Fig. 1: Ex vivo tetramer enrichment with anti-c-myc beads Representative example of comparative ex vivo tetramer enrichment performed in three independent experiments with either conventional
Supplementary Figure 1. Ex vivo IFNγ production by Tregs. Nature Medicine doi: /nm % CD127. Empty SSC 98.79% CD25 CD45RA.
 SSC CD25 1.8% CD127 Empty 98.79% FSC CD45RA CD45RA Foxp3 %IFNγ + cells 4 3 2 1 + IL-12 P =.3 IFNγ p=.9 %IL-4+ cells 3 2 1 IL-4 P =.4 c %IL-1 + cells IFNγ 4 3 2 1 Control Foxp3 IL-1 P =.41.64 4.76 MS 2.96
SUPPLEMENTARY INFORMATION
 doi: 1.138/nature775 4 O.D. (595-655) 3 1 -ζ no antibody isotype ctrl Plated Soluble 1F6 397 7H11 Supplementary Figure 1 Soluble and plated anti- Abs induce -! signalling. B3Z cells stably expressing!
Control GST GST-RAP. α2-mg. 170 kda. b-actin. 42 kda LRP-1
 % of max Supplementary Figure 1 Control GST GST-RP 17 kda α2-mg 42 kda b-actin Gate: CD11c+ (DCs) Gate: F4/8+ (Mfs) IgG Cd11cCre + Lrp1 fl/fl LRP-1 Supplementary figure 1. () MDCs were pretreated with