Bias Adjustment: Local Control Analysis of Radon and Ozone
|
|
|
- Oswald French
- 6 years ago
- Views:
Transcription
1 Bias Adjustment: Local Control Analysis of Radon and Ozone S. Stanley Young Robert Obenchain Goran Krstic NCSU 19Oct2016
2 Abstract Bias Adjustment: Local control analysis of Radon and ozone S. Stanley Young, CGStat LLC Robert L. Obenchain, Risk Benefit Statistics LLC Goran Krstic, Fraser Health Authority Large (observational) data sets typically present research opportunities, but also problems that can lead to false claims. In Big Data, the standard error of an average effect estimate goes to zero as sample size increases, so even small biases can lead to declared (but false) claims. In addition, the average of treatment can be almost meaningless when there are interactions with confounders that create local variation in effect-sizes. Data miners need statistical methods that can deal simply and efficiently with these sources of bias. Here, we demonstrate use of a JMP add-in, Moving Median, and a new JMP platform, Local Control, for the analysis of two data sets. Our first case study illustrates reduction of bias in an environmental epidemiology data set. Our second study uses Local Control on a time series air quality example. By detecting interactions, data miners can produce more realistic and more relevant analyses that reduce the bias typically implied by the variety and heterogeneity of Big Data. 2
3 Collaborators S. Stanley Young Robert Obenchain Goran Krstic 3
4 Key Analysis Steps 4
5 Plan for Radon Data Set 1. Radon background 2. Local Control analysis strategy 3. Analysis of 2,881 US counties 4. Local Control LTD Results 5. Summary 5


6 Figure 1. Spatial distribution of obesity, lung cancer, radon and smoking. Obesity Lung Cancer Source: Ever Smoking 6
 26")

7 EPA cited meta analysis (1) 26 authors! 2004 Low Dose Linear But see Cohen. 7

8 EPA cited meta analysis (2) 16 authors 2005 Low Dose Linear But see Cohen. 8
9 Bernard L. Cohen: Low-dose radon is protective 1. Cohen BL. (1989) Expected indoor 222Rn levels in counties with very high and very low lung cancer rates. Health Physics 57, Cohen BL. (1995) Test of the linear-no threshold theory of radiation carcinogenesis for inhaled radon decay products. Health Physics 68, Cohen BL. (1997) Lung cancer rate vs. mean radon level in U.S. counties of various characteristics. Health Physics 72, Cohen BL. (2008) The linear no-threshold theory of radiation carcinogenesis should be rejected. J. Amer. Physicians and Surgeons 13,
10 Local Control Analysis Process Large observational data set A vs B comparison (or LR) The steps 0. Variable selection 1. Aggregate cluster, LTDs 2. Confirm randomization test 3. Explore sensitivity analysis 4. Reveal modeling, MLR, RP 10

11 Step 0: Select clustering variables Predict Lung Cancer Mortality, Step-wise regression 11


12 Variables selected for clustering. NB: Regression coefficient for radon is NEGATIVE. 12
13 Local Control Analysis Radon Most Typical micro-aggregation of 2,881 US Counties on 3 primary X-confounders 1. Age Over 65 % 2. Obesity % 3. Currently Smoke % Y-outcome = Lung Cancer Mortality. Binary Treatment Indicator: Radon High ( > 2.1 pci/l ) vs. Low 13

14 Local Control Add-In Russ Wolfinger/Bob Obenchain 14
15 Step 1: Clustering Within cluster statistics 1. Local Treatment Difference, LTD 2. Local Linear Regression (slope and intercept) 3. Local Survival Analysis (Failure times) 4. Etc. 15
16 Local Treatment Difference at the centroid of an informative cluster E[ (Y t=1) - (Y t=0) X ] Single df comparison Given X, local effect. Fair Treatment Comparison 16
17 Aggregate Cycle Observed LTD Distribution (49 Informative Clusters) 17
18 Step 2: Confirm clustering matters Random Distribution Observed Distribution Observed LTD Distribution 18
19 Step 2: Confirm Cycle Observed LTD empirical Cumulative Distribution Function (CDF) LTD-like Random Permutation CDF 19
20 Step 3: Explore Cycles Tried using Complete Linkage as well as Fast Ward Tried using of 3 out of 5 potential X-confounders for clustering: Age Over 65 % Obesity % Currently Smoke % Ever Smoke % Median Household Income ($1,000s) Tried using between 50 and 100 clusters. 20
21 Reveal Cycle Fitted Supervised Learning Models for predicting observed LTDs: JMP 12 Modeling Platform -> Partition option single Tree (7 terminal nodes) Bootstrap Forest Model Average of 100 Trees JMP Fit Model Platform Multi-Variable Regression (Degree at most 2) Tried using 6 potential X-confounders for predicting observed LTDs: Age Over 65 % Obesity % Currently Smoke % Ever Smoke % Median Household Income ($1,000s) Radon ( or Ln[Rn] ) Level (as either ordinal or continuous measures) 21

22 Tree (LTD)
23 Node Summary Node N AvDiff Log Parent Worth
, R^2 =0.80 24")
24 Method Two (Bootstrap Forest), R^2 =

25 Regression Results Use LTD as y, Stepwise regression SLR R^2 =
26 Partial Correlations 26
27 Conclusions Radon 1. Low dose Radon is protective against lung cancer. 2. Cohen is supported. 3. EPA should make their data set public. 27
28 London, Ozone and Mortality 28

29 London Smog,

30 Singapore Haze

31 EPA and ozone Bad Good???? ppm 0.20 ppm Ozone Generators that are Sold as Air Cleaners Reviewed by EPA 31
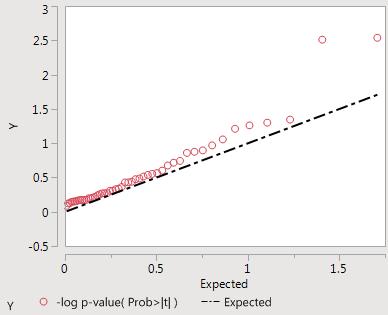
32 LC London Ozone 0. Variable selection 1. Cluster to MLR within cluster 3. Append to intercept and slopes to data set 4. P-value plots 5. Histograms 6. RP on intercepts and slopes (lag 0. lag 1)


33 London Time Series Mortality and Ozone 33

34 Time Series Smoother Add-In Paul Fogel Paris 34
35 Smoothed Time Series Smoothed Subtract Moving Median

36 Step 0: Variable selection 36

37 Clustering 37

38 50 Clusters N


39 t-tests, Int, D_Ozone, D_Ozone-1 39


40 D Ozone and D Ozone -1 40
41 RP For slope of D_mort/D_Ozone LogWorth for each split is large, 11.1 to Heterogeneity. 41

42 Slope D_Ozone

43 RP for slope of D_Ozone-1 LogWorth for each split is large, 11.5 to Heterogeneity. 43

44 RP for slope of D_Ozone

45 Regression Analysis 45

46 Possible Ozone Effect 46
47 Summary of ozone Local Control Analysis 1. NB: Outlier time period was removed. 2. Variables were de-trended. 3. Any possible effect of ozone depends on other variables; ozone is not causal of deaths. 4. Slope is heterogeneous, RP; one size does not fit all. 47
48 Key Analysis Steps 48

49 Contact Information S. Stanley Young Robert Obenchain Goran Krstic Offering protection against unreliable claims! 49
50 References 50

51 51

52 Outlier temperature period 52
53 Hazmat/Radon 53
Application of Local Control Strategy in analyses of the effects of Radon on Lung Cancer Mortality for 2,881 US Counties
 Application of Local Control Strategy in analyses of the effects of Radon on Lung Cancer Mortality for 2,881 US Counties Bob Obenchain, Risk Benefit Statistics, August 2015 Our motivation for using a Cut-Point
Abstract. Introduction
 Local Control Analysis of Radon and Ozone S. Stanley Young, CGStat LLC Robert L. Obenchain, Risk Benefit Statistics LLC Goran Krstic, Fraser Health Authority Abstract Large (observational) data sets typically
BY: Bernard L. Cohen University of Pittsburgh. Pittsburgh, PA ABSTRACT
 CORRELATION BETWEEN MEAN RADON LEVELS AND LUNG CANCER RATES IN U.S. COUNTIES A TEST OF THE LINEAR - NO THRESHOLD THEORY BY: Bernard L. Cohen University of Pittsburgh. Pittsburgh, PA 15260 ABSTRACT Mean
Business Statistics Probability
 Business Statistics The following was provided by Dr. Suzanne Delaney, and is a comprehensive review of Business Statistics. The workshop instructor will provide relevant examples during the Skills Assessment
Describe what is meant by a placebo Contrast the double-blind procedure with the single-blind procedure Review the structure for organizing a memo
 Business Statistics The following was provided by Dr. Suzanne Delaney, and is a comprehensive review of Business Statistics. The workshop instructor will provide relevant examples during the Skills Assessment
Readings: Textbook readings: OpenStax - Chapters 1 13 (emphasis on Chapter 12) Online readings: Appendix D, E & F
 Online readings: Appendix D, E & F") Readings: Textbook readings: OpenStax - Chapters 1 13 (emphasis on Chapter 12) Online readings: Appendix D, E & F Plous Chapters 17 & 18 Chapter 17: Social Influences Chapter 18: Group Judgments and Decisions
Readings: Textbook readings: OpenStax - Chapters 1 13 (emphasis on Chapter 12) Online readings: Appendix D, E & F Plous Chapters 17 & 18 Chapter 17: Social Influences Chapter 18: Group Judgments and Decisions
Chapter 1: Exploring Data
 Chapter 1: Exploring Data Key Vocabulary:! individual! variable! frequency table! relative frequency table! distribution! pie chart! bar graph! two-way table! marginal distributions! conditional distributions!
Still important ideas
 Readings: OpenStax - Chapters 1 13 & Appendix D & E (online) Plous Chapters 17 & 18 - Chapter 17: Social Influences - Chapter 18: Group Judgments and Decisions Still important ideas Contrast the measurement
WDHS Curriculum Map Probability and Statistics. What is Statistics and how does it relate to you?
 WDHS Curriculum Map Probability and Statistics Time Interval/ Unit 1: Introduction to Statistics 1.1-1.3 2 weeks S-IC-1: Understand statistics as a process for making inferences about population parameters
2.75: 84% 2.5: 80% 2.25: 78% 2: 74% 1.75: 70% 1.5: 66% 1.25: 64% 1.0: 60% 0.5: 50% 0.25: 25% 0: 0%
 Capstone Test (will consist of FOUR quizzes and the FINAL test grade will be an average of the four quizzes). Capstone #1: Review of Chapters 1-3 Capstone #2: Review of Chapter 4 Capstone #3: Review of
Describe what is meant by a placebo Contrast the double-blind procedure with the single-blind procedure Review the structure for organizing a memo
 Please note the page numbers listed for the Lind book may vary by a page or two depending on which version of the textbook you have. Readings: Lind 1 11 (with emphasis on chapters 10, 11) Please note chapter
Contents. Part 1 Introduction. Part 2 Cross-Sectional Selection Bias Adjustment
 From Analysis of Observational Health Care Data Using SAS. Full book available for purchase here. Contents Preface ix Part 1 Introduction Chapter 1 Introduction to Observational Studies... 3 1.1 Observational
Statistics and Probability
 Statistics and a single count or measurement variable. S.ID.1: Represent data with plots on the real number line (dot plots, histograms, and box plots). S.ID.2: Use statistics appropriate to the shape
Still important ideas
 Readings: OpenStax - Chapters 1 11 + 13 & Appendix D & E (online) Plous - Chapters 2, 3, and 4 Chapter 2: Cognitive Dissonance, Chapter 3: Memory and Hindsight Bias, Chapter 4: Context Dependence Still
From Biostatistics Using JMP: A Practical Guide. Full book available for purchase here. Chapter 1: Introduction... 1
 From Biostatistics Using JMP: A Practical Guide. Full book available for purchase here. Contents Dedication... iii Acknowledgments... xi About This Book... xiii About the Author... xvii Chapter 1: Introduction...
Statistics is the science of collecting, organizing, presenting, analyzing, and interpreting data to assist in making effective decisions
 Readings: OpenStax Textbook - Chapters 1 5 (online) Appendix D & E (online) Plous - Chapters 1, 5, 6, 13 (online) Introductory comments Describe how familiarity with statistical methods can - be associated
Basic Biostatistics. Chapter 1. Content
 Chapter 1 Basic Biostatistics Jamalludin Ab Rahman MD MPH Department of Community Medicine Kulliyyah of Medicine Content 2 Basic premises variables, level of measurements, probability distribution Descriptive
Readings: Textbook readings: OpenStax - Chapters 1 11 Online readings: Appendix D, E & F Plous Chapters 10, 11, 12 and 14
 Readings: Textbook readings: OpenStax - Chapters 1 11 Online readings: Appendix D, E & F Plous Chapters 10, 11, 12 and 14 Still important ideas Contrast the measurement of observable actions (and/or characteristics)
Describe what is meant by a placebo Contrast the double-blind procedure with the single-blind procedure Review the structure for organizing a memo
 Please note the page numbers listed for the Lind book may vary by a page or two depending on which version of the textbook you have. Readings: Lind 1 11 (with emphasis on chapters 5, 6, 7, 8, 9 10 & 11)
Fixed Effect Combining
 Meta-Analysis Workshop (part 2) Michael LaValley December 12 th 2014 Villanova University Fixed Effect Combining Each study i provides an effect size estimate d i of the population value For the inverse
1.4 - Linear Regression and MS Excel
 1.4 - Linear Regression and MS Excel Regression is an analytic technique for determining the relationship between a dependent variable and an independent variable. When the two variables have a linear
STATISTICS 8 CHAPTERS 1 TO 6, SAMPLE MULTIPLE CHOICE QUESTIONS
 STATISTICS 8 CHAPTERS 1 TO 6, SAMPLE MULTIPLE CHOICE QUESTIONS Circle the best answer. This scenario applies to Questions 1 and 2: A study was done to compare the lung capacity of coal miners to the lung
UNIVERSITY of PENNSYLVANIA CIS 520: Machine Learning Midterm, 2016
 UNIVERSITY of PENNSYLVANIA CIS 520: Machine Learning Midterm, 2016 Exam policy: This exam allows one one-page, two-sided cheat sheet; No other materials. Time: 80 minutes. Be sure to write your name and
Index. Springer International Publishing Switzerland 2017 T.J. Cleophas, A.H. Zwinderman, Modern Meta-Analysis, DOI /
 Index A Adjusted Heterogeneity without Overdispersion, 63 Agenda-driven bias, 40 Agenda-Driven Meta-Analyses, 306 307 Alternative Methods for diagnostic meta-analyses, 133 Antihypertensive effect of potassium,
STATISTICS & PROBABILITY
 STATISTICS & PROBABILITY LAWRENCE HIGH SCHOOL STATISTICS & PROBABILITY CURRICULUM MAP 2015-2016 Quarter 1 Unit 1 Collecting Data and Drawing Conclusions Unit 2 Summarizing Data Quarter 2 Unit 3 Randomness
Biostatistics II
 Biostatistics II 514-5509 Course Description: Modern multivariable statistical analysis based on the concept of generalized linear models. Includes linear, logistic, and Poisson regression, survival analysis,
Statistics is the science of collecting, organizing, presenting, analyzing, and interpreting data to assist in making effective decisions
 Readings: OpenStax Textbook - Chapters 1 5 (online) Appendix D & E (online) Plous - Chapters 1, 5, 6, 13 (online) Introductory comments Describe how familiarity with statistical methods can - be associated
STAT 201 Chapter 3. Association and Regression
 STAT 201 Chapter 3 Association and Regression 1 Association of Variables Two Categorical Variables Response Variable (dependent variable): the outcome variable whose variation is being studied Explanatory
C2 Training: August 2010
 C2 Training: August 2010 Introduction to meta-analysis The Campbell Collaboration www.campbellcollaboration.org Pooled effect sizes Average across studies Calculated using inverse variance weights Studies
Simple Linear Regression
 Simple Linear Regression Assoc. Prof Dr Sarimah Abdullah Unit of Biostatistics & Research Methodology School of Medical Sciences, Health Campus Universiti Sains Malaysia Regression Regression analysis
Unit 1 Exploring and Understanding Data
 Unit 1 Exploring and Understanding Data Area Principle Bar Chart Boxplot Conditional Distribution Dotplot Empirical Rule Five Number Summary Frequency Distribution Frequency Polygon Histogram Interquartile
Understandable Statistics
 Understandable Statistics correlated to the Advanced Placement Program Course Description for Statistics Prepared for Alabama CC2 6/2003 2003 Understandable Statistics 2003 correlated to the Advanced Placement
Testing the Predictability of Consumption Growth: Evidence from China
 Auburn University Department of Economics Working Paper Series Testing the Predictability of Consumption Growth: Evidence from China Liping Gao and Hyeongwoo Kim Georgia Southern University and Auburn
Predicting Breast Cancer Survival Using Treatment and Patient Factors
 Predicting Breast Cancer Survival Using Treatment and Patient Factors William Chen wchen808@stanford.edu Henry Wang hwang9@stanford.edu 1. Introduction Breast cancer is the leading type of cancer in women
Logistic regression. Department of Statistics, University of South Carolina. Stat 205: Elementary Statistics for the Biological and Life Sciences
 Logistic regression Department of Statistics, University of South Carolina Stat 205: Elementary Statistics for the Biological and Life Sciences 1 / 1 Logistic regression: pp. 538 542 Consider Y to be binary
Examining Relationships Least-squares regression. Sections 2.3
 Examining Relationships Least-squares regression Sections 2.3 The regression line A regression line describes a one-way linear relationship between variables. An explanatory variable, x, explains variability
Applied Medical. Statistics Using SAS. Geoff Der. Brian S. Everitt. CRC Press. Taylor Si Francis Croup. Taylor & Francis Croup, an informa business
 Applied Medical Statistics Using SAS Geoff Der Brian S. Everitt CRC Press Taylor Si Francis Croup Boca Raton London New York CRC Press is an imprint of the Taylor & Francis Croup, an informa business A
WELCOME! Lecture 11 Thommy Perlinger
 Quantitative Methods II WELCOME! Lecture 11 Thommy Perlinger Regression based on violated assumptions If any of the assumptions are violated, potential inaccuracies may be present in the estimated regression
Doing Thousands of Hypothesis Tests at the Same Time. Bradley Efron Stanford University
 Doing Thousands of Hypothesis Tests at the Same Time Bradley Efron Stanford University 1 Simultaneous Hypothesis Testing 1980: Simultaneous Statistical Inference (Rupert Miller) 2, 3,, 20 simultaneous
A revision of the number of radon-related lung cancers in Ireland: preliminary results
 A revision of the number of radon-related lung cancers in Ireland: preliminary results Paul M Walsh National Cancer Registry (NCRI) (in collaboration with EPA & others) Background / Rationale Radon is
George B. Ploubidis. The role of sensitivity analysis in the estimation of causal pathways from observational data. Improving health worldwide
 George B. Ploubidis The role of sensitivity analysis in the estimation of causal pathways from observational data Improving health worldwide www.lshtm.ac.uk Outline Sensitivity analysis Causal Mediation
Results & Statistics: Description and Correlation. I. Scales of Measurement A Review
 Results & Statistics: Description and Correlation The description and presentation of results involves a number of topics. These include scales of measurement, descriptive statistics used to summarize
bivariate analysis: The statistical analysis of the relationship between two variables.
 bivariate analysis: The statistical analysis of the relationship between two variables. cell frequency: The number of cases in a cell of a cross-tabulation (contingency table). chi-square (χ 2 ) test for
The North Carolina Health Data Explorer
 The North Carolina Health Data Explorer The Health Data Explorer provides access to health data for North Carolina counties in an interactive, user-friendly atlas of maps, tables, and charts. It allows
From Bivariate Through Multivariate Techniques
 A p p l i e d S T A T I S T I C S From Bivariate Through Multivariate Techniques R e b e c c a M. W a r n e r University of New Hampshire DAI HOC THAI NGUYEN TRUNG TAM HOC LIEU *)SAGE Publications '55'
Assessing publication bias in genetic association studies: evidence from a recent meta-analysis
 Psychiatry Research 129 (2004) 39 44 www.elsevier.com/locate/psychres Assessing publication bias in genetic association studies: evidence from a recent meta-analysis Marcus R. Munafò a, *, Taane G. Clark
Colon cancer subtypes from gene expression data
 Colon cancer subtypes from gene expression data Nathan Cunningham Giuseppe Di Benedetto Sherman Ip Leon Law Module 6: Applied Statistics 26th February 2016 Aim Replicate findings of Felipe De Sousa et
NORTH SOUTH UNIVERSITY TUTORIAL 2
 NORTH SOUTH UNIVERSITY TUTORIAL 2 AHMED HOSSAIN,PhD Data Management and Analysis AHMED HOSSAIN,PhD - Data Management and Analysis 1 Correlation Analysis INTRODUCTION In correlation analysis, we estimate
Lecture Outline. Biost 517 Applied Biostatistics I. Purpose of Descriptive Statistics. Purpose of Descriptive Statistics
 Biost 517 Applied Biostatistics I Scott S. Emerson, M.D., Ph.D. Professor of Biostatistics University of Washington Lecture 3: Overview of Descriptive Statistics October 3, 2005 Lecture Outline Purpose
11/18/2013. Correlational Research. Correlational Designs. Why Use a Correlational Design? CORRELATIONAL RESEARCH STUDIES
 Correlational Research Correlational Designs Correlational research is used to describe the relationship between two or more naturally occurring variables. Is age related to political conservativism? Are
Interpretation of Immunogenicity Results and Evaluation of Clinical Associations
 Interpretation of Immunogenicity Results and Evaluation of Clinical Associations V. Devanarayan, Ph.D. AbbVie, Inc. European Bioanalysis Forum (EBF) 9 th Open Meeting: Reaching Utopia - The Kaleidoscope
Evidence Based Medicine
 Course Goals Goals 1. Understand basic concepts of evidence based medicine (EBM) and how EBM facilitates optimal patient care. 2. Develop a basic understanding of how clinical research studies are designed
Objective: To describe a new approach to neighborhood effects studies based on residential mobility and demonstrate this approach in the context of
 Objective: To describe a new approach to neighborhood effects studies based on residential mobility and demonstrate this approach in the context of neighborhood deprivation and preterm birth. Key Points:
Score Tests of Normality in Bivariate Probit Models
 Score Tests of Normality in Bivariate Probit Models Anthony Murphy Nuffield College, Oxford OX1 1NF, UK Abstract: A relatively simple and convenient score test of normality in the bivariate probit model
investigate. educate. inform.
 investigate. educate. inform. Research Design What drives your research design? The battle between Qualitative and Quantitative is over Think before you leap What SHOULD drive your research design. Advanced
IMPACTS OF SOCIAL NETWORKS AND SPACE ON OBESITY. The Rights and Wrongs of Social Network Analysis
 IMPACTS OF SOCIAL NETWORKS AND SPACE ON OBESITY The Rights and Wrongs of Social Network Analysis THE SPREAD OF OBESITY IN A LARGE SOCIAL NETWORK OVER 32 YEARS Nicholas A. Christakis James D. Fowler Published:
AP Statistics Practice Test Ch. 3 and Previous
 AP Statistics Practice Test Ch. 3 and Previous Name Date Use the following to answer questions 1 and 2: A researcher measures the height (in feet) and volume of usable lumber (in cubic feet) of 32 cherry
Chapter 3 CORRELATION AND REGRESSION
 CORRELATION AND REGRESSION TOPIC SLIDE Linear Regression Defined 2 Regression Equation 3 The Slope or b 4 The Y-Intercept or a 5 What Value of the Y-Variable Should be Predicted When r = 0? 7 The Regression
Empirical Knowledge: based on observations. Answer questions why, whom, how, and when.
 INTRO TO RESEARCH METHODS: Empirical Knowledge: based on observations. Answer questions why, whom, how, and when. Experimental research: treatments are given for the purpose of research. Experimental group
Class 7 Everything is Related
 Class 7 Everything is Related Correlational Designs l 1 Topics Types of Correlational Designs Understanding Correlation Reporting Correlational Statistics Quantitative Designs l 2 Types of Correlational
Introduction to diagnostic accuracy meta-analysis. Yemisi Takwoingi October 2015
 Introduction to diagnostic accuracy meta-analysis Yemisi Takwoingi October 2015 Learning objectives To appreciate the concept underlying DTA meta-analytic approaches To know the Moses-Littenberg SROC method
Reminders/Comments. Thanks for the quick feedback I ll try to put HW up on Saturday and I ll you
 Reminders/Comments Thanks for the quick feedback I ll try to put HW up on Saturday and I ll email you Final project will be assigned in the last week of class You ll have that week to do it Participation
Health impact assessment in the framework of global and regional AQ modelling
 Health impact assessment in the framework of global and regional AQ modelling Rita Van Dingenen European Commission, Joint Research Centre Air pollution and health Ambient air pollution (individual) risk
Exploring and Validating Surrogate Endpoints in Colorectal Cancer. Center, Pittsburgh, USA
 Page 1 Exploring and Validating Surrogate Endpoints in Colorectal Cancer Tomasz Burzykowski, PhD 1,2, Marc Buyse, ScD 1,3, Greg Yothers PhD 4, Junichi Sakamoto, PhD 5, Dan Sargent, PhD 6 1 Center for Statistics,
Political Science 15, Winter 2014 Final Review
 Political Science 15, Winter 2014 Final Review The major topics covered in class are listed below. You should also take a look at the readings listed on the class website. Studying Politics Scientifically
LUNG CANCER IN OREGON
 Dose-Response: An International Journal Volume 9 Issue 3 Article 11 9-2011 LUNG CANCER IN OREGON John Hart Sherman College of Chiropractic Follow this and additional works at: http://scholarworks.umass.edu/dose_response
National Cancer Institute
 U.S. DEPARTMENT OF HEALTH AND HUMAN SERVICES Trends and patterns of childhood cancer incidence in the US, 1995 2010 Li Zhu National Cancer Institute Linda Pickle StatNet Consulting, LLC Joe Zou Information
UNIVERSITY OF TORONTO SCARBOROUGH Department of Computer and Mathematical Sciences Midterm Test February 2016
 UNIVERSITY OF TORONTO SCARBOROUGH Department of Computer and Mathematical Sciences Midterm Test February 2016 STAB22H3 Statistics I, LEC 01 and LEC 02 Duration: 1 hour and 45 minutes Last Name: First Name:
SUMMER 2011 RE-EXAM PSYF11STAT - STATISTIK
 SUMMER 011 RE-EXAM PSYF11STAT - STATISTIK Full Name: Årskortnummer: Date: This exam is made up of three parts: Part 1 includes 30 multiple choice questions; Part includes 10 matching questions; and Part
Policy Setting Considerations
 Radon Review and Update: How Good is the Science Mar 7, 2012 EPA Office of Radiation and Indoor Air (ORIA) Indoor Environments Division (IED) CAPT Susan Conrath, PhD, MPH, US Public Health Service conrath.susan@epa.gov
12/31/2016. PSY 512: Advanced Statistics for Psychological and Behavioral Research 2
 PSY 512: Advanced Statistics for Psychological and Behavioral Research 2 Introduce moderated multiple regression Continuous predictor continuous predictor Continuous predictor categorical predictor Understand
Meta-analysis: Advanced methods using the STATA software
 Page 1 sur 5 Wednesday 20 September 2017 - Introduction to meta-analysis Introduction I. Why do a meta-analysis? II. How does a meta-analysis work? Some concepts III. Definition of an «effect size» 1.
Regression Discontinuity Analysis
 Regression Discontinuity Analysis A researcher wants to determine whether tutoring underachieving middle school students improves their math grades. Another wonders whether providing financial aid to low-income
AP Statistics. Semester One Review Part 1 Chapters 1-5
 AP Statistics Semester One Review Part 1 Chapters 1-5 AP Statistics Topics Describing Data Producing Data Probability Statistical Inference Describing Data Ch 1: Describing Data: Graphically and Numerically
Modern Regression Methods
 Modern Regression Methods Second Edition THOMAS P. RYAN Acworth, Georgia WILEY A JOHN WILEY & SONS, INC. PUBLICATION Contents Preface 1. Introduction 1.1 Simple Linear Regression Model, 3 1.2 Uses of Regression
A Study of the Spatial Distribution of Suicide Rates
 A Study of the Spatial Distribution of Suicide Rates Ferdinand DiFurio, Tennessee Tech University Willis Lewis, Winthrop University With acknowledgements to Kendall Knight, GA, Tennessee Tech University
An Introduction to Statistical Thinking Dan Schafer Table of Contents
 An Introduction to Statistical Thinking Dan Schafer Table of Contents PART I: CONCLUSIONS AND THEIR UNCERTAINTY NUMERICAL AND ELEMENTS OF Chapter1 Statistics as a Branch of Human Reasoning Chapter 2 What
Online Supplementary Appendix
 Online Supplementary Appendix This appendix has been provided by the authors to give readers additional information about their work. Supplement to: Lehman * LH, Saeed * M, Talmor D, Mark RG, and Malhotra
Statistical reports Regression, 2010
 Statistical reports Regression, 2010 Niels Richard Hansen June 10, 2010 This document gives some guidelines on how to write a report on a statistical analysis. The document is organized into sections that
Standard Scores. Richard S. Balkin, Ph.D., LPC-S, NCC
 Standard Scores Richard S. Balkin, Ph.D., LPC-S, NCC 1 Normal Distributions While Best and Kahn (2003) indicated that the normal curve does not actually exist, measures of populations tend to demonstrate
Estimation of effect sizes in the presence of publication bias: a comparison of meta-analysis methods
 Estimation of effect sizes in the presence of publication bias: a comparison of meta-analysis methods Hilde Augusteijn M.A.L.M. van Assen R. C. M. van Aert APS May 29, 2016 Today s presentation Estimation
Survey research (Lecture 1) Summary & Conclusion. Lecture 10 Survey Research & Design in Psychology James Neill, 2015 Creative Commons Attribution 4.
 Summary & Conclusion. Lecture 10 Survey Research & Design in Psychology James Neill, 2015 Creative Commons Attribution 4.") Summary & Conclusion Lecture 10 Survey Research & Design in Psychology James Neill, 2015 Creative Commons Attribution 4.0 Overview 1. Survey research 2. Survey design 3. Descriptives & graphing 4. Correlation
Summary & Conclusion Lecture 10 Survey Research & Design in Psychology James Neill, 2015 Creative Commons Attribution 4.0 Overview 1. Survey research 2. Survey design 3. Descriptives & graphing 4. Correlation
Survey research (Lecture 1)
") Summary & Conclusion Lecture 10 Survey Research & Design in Psychology James Neill, 2015 Creative Commons Attribution 4.0 Overview 1. Survey research 2. Survey design 3. Descriptives & graphing 4. Correlation
Summary & Conclusion Lecture 10 Survey Research & Design in Psychology James Neill, 2015 Creative Commons Attribution 4.0 Overview 1. Survey research 2. Survey design 3. Descriptives & graphing 4. Correlation
An instrumental variable in an observational study behaves
 Review Article Sensitivity Analyses for Robust Causal Inference from Mendelian Randomization Analyses with Multiple Genetic Variants Stephen Burgess, a Jack Bowden, b Tove Fall, c Erik Ingelsson, c and
Nature Medicine: doi: /nm.3967
 Supplementary Figure 1. Network clustering. (a) Clustering performance as a function of inflation factor. The grey curve shows the median weighted Silhouette widths for varying inflation factors (f [1.6,
Correlation and Regression
 Dublin Institute of Technology ARROW@DIT Books/Book Chapters School of Management 2012-10 Correlation and Regression Donal O'Brien Dublin Institute of Technology, donal.obrien@dit.ie Pamela Sharkey Scott
11/24/2017. Do not imply a cause-and-effect relationship
 Correlational research is used to describe the relationship between two or more naturally occurring variables. Is age related to political conservativism? Are highly extraverted people less afraid of rejection
Critical Review Form Clinical Decision Analysis
 Critical Review Form Clinical Decision Analysis An Interdisciplinary Initiative to Reduce Radiation Exposure: Evaluation of Appendicitis in a Pediatric Emergency Department with Clinical Assessment Supported
Possible Consequences of Inhomogeneous Suborgan Distribution of Dose and the Linear No-Threshold Dose-Effect Relationship
 Possible Consequences of Inhomogeneous Suborgan Distribution of Dose and the Linear No-Threshold Dose-Effect Relationship Balázs G. Madas, Imre Balásházy Centre for Energy Research, Hungarian Academy of
Stepwise method Modern Model Selection Methods Quantile-Quantile plot and tests for normality
 Week 9 Hour 3 Stepwise method Modern Model Selection Methods Quantile-Quantile plot and tests for normality Stat 302 Notes. Week 9, Hour 3, Page 1 / 39 Stepwise Now that we've introduced interactions,
Outlier Analysis. Lijun Zhang
 Outlier Analysis Lijun Zhang zlj@nju.edu.cn http://cs.nju.edu.cn/zlj Outline Introduction Extreme Value Analysis Probabilistic Models Clustering for Outlier Detection Distance-Based Outlier Detection Density-Based
Introduction to Meta-analysis of Accuracy Data
 Introduction to Meta-analysis of Accuracy Data Hans Reitsma MD, PhD Dept. of Clinical Epidemiology, Biostatistics & Bioinformatics Academic Medical Center - Amsterdam Continental European Support Unit
An informal analysis of multilevel variance
 APPENDIX 11A An informal analysis of multilevel Imagine we are studying the blood pressure of a number of individuals (level 1) from different neighbourhoods (level 2) in the same city. We start by doing
CS2220 Introduction to Computational Biology
 CS2220 Introduction to Computational Biology WEEK 8: GENOME-WIDE ASSOCIATION STUDIES (GWAS) 1 Dr. Mengling FENG Institute for Infocomm Research Massachusetts Institute of Technology mfeng@mit.edu PLANS
Biostatistics for Med Students. Lecture 1
 Biostatistics for Med Students Lecture 1 John J. Chen, Ph.D. Professor & Director of Biostatistics Core UH JABSOM JABSOM MD7 February 14, 2018 Lecture note: http://biostat.jabsom.hawaii.edu/education/training.html
c. Construct a boxplot for the data. Write a one sentence interpretation of your graph.
 STAT 280 Sample Test Problems Page 1 of 1 1. An English survey of 3000 medical records showed that smokers are more inclined to get depressed than non-smokers. Does this imply that smoking causes depression?
Ecological Statistics
 A Primer of Ecological Statistics Second Edition Nicholas J. Gotelli University of Vermont Aaron M. Ellison Harvard Forest Sinauer Associates, Inc. Publishers Sunderland, Massachusetts U.S.A. Brief Contents
STATISTICAL METHODS FOR DIAGNOSTIC TESTING: AN ILLUSTRATION USING A NEW METHOD FOR CANCER DETECTION XIN SUN. PhD, Kansas State University, 2012
 STATISTICAL METHODS FOR DIAGNOSTIC TESTING: AN ILLUSTRATION USING A NEW METHOD FOR CANCER DETECTION by XIN SUN PhD, Kansas State University, 2012 A THESIS Submitted in partial fulfillment of the requirements
Treatment effect estimates adjusted for small-study effects via a limit meta-analysis
 Treatment effect estimates adjusted for small-study effects via a limit meta-analysis Gerta Rücker 1, James Carpenter 12, Guido Schwarzer 1 1 Institute of Medical Biometry and Medical Informatics, University
Lecture II: Difference in Difference and Regression Discontinuity
 Review Lecture II: Difference in Difference and Regression Discontinuity it From Lecture I Causality is difficult to Show from cross sectional observational studies What caused what? X caused Y, Y caused