EFFECTS OF ZINC AND FLUORIDE ON in CONDITIONS RELEVANT TO DENTAL CARIES
|
|
|
- Beryl Daniel
- 5 years ago
- Views:
Transcription
1 EFFECTS OF ZINC AND FLUORIDE ON in vitro ENAMEL DEMINERALISATION CONDITIONS RELEVANT TO DENTAL CARIES NASRINE RUMELA MOHAMMED MSci Pharm Chem Thesis submitted in fulfilment of the requirements for the degree of Doctor of Philosophy in the Faculty of Medicine, University of London August 2014 Centre for Oral Growth and Development Institute of Dentistry Queen Mary s School of Medicine and Dentistry Page i

2 University of London Declaration regarding plagiarism I declare that the coursework material attached herewith is entirely my own work and that I have attributed any brief quotations both at the appropriate point in the text and in the bibliography at the end of this piece of work. I also declare that I have not used extensive quotations or close paraphrasing and that I have neither copied from the work of another person, nor used the ideas of another person, without proper acknowledgement. Name: Nasrine Mohammed Course: PhD Title of work submitted: Effects of Zinc and Fluoride Ions on in vitro Enamel Demineralisation Conditions Relevant to Dental Caries Examination: A thesis submitted for the degree of Doctor of Philosophy, University of London Signature: Date: August 2014 Page ii
3 Acknowledgements This research would not have been possible without the studentship case award cofunded by GlaxoSmithKline and EPSRC. I am thankful to my academic supervisor, Dr Paul Anderson, for his supervision, sharing his expertise and helping me become an independent researcher. I cannot thank Prof Richard Lynch enough, my industrial supervisor, for his invaluable insights, kind support and patience in this thesis process. A special thanks to Prof Robert Hill, for his constant encouragement throughout, which was influential in my academic development. I would like to thank Stephen Figaro for not only his technical support during my Scanning Microradiography experiments, but for also being a mentor and friend to me, and helping me find clarity when I needed it the most. My PhD journey would not have been as enjoyable without all my colleagues in the Dental Physical Sciences Unit. For all the fun and memorable times we had in the PhD office and at conferences, I thank especially Samera Siddiqui, Navina Nallamutha and Niall Kent. I am deeply grateful to Mohammed Mneimne, for his constant support, motivation and belief in me. Last but not the least, my immense gratitude goes to my parents, Parveen and Yunus, my siblings, Pamela, Asif, and Affreen, for all their continued love, support and keeping me focused. Page iii
4 Abstract Zinc has been investigated extensively as an anti-plaque and calculus agent. However, its interaction with enamel and its putative role in demineralisation and remineralisation are considerably less understood. In comparison to zinc, the interactions between fluoride and enamel have been extensively reported in the literature. The overall aim was to understand the effects of zinc ions [Zn 2+ ] on enamel demineralisation (relevant to dental caries), whilst the effect of fluoride ions [F ] were similarly studied and used as a benchmark for the zinc investigations. The independent effects of varying concentrations of [Zn 2+ ] and [F ] on enamel demineralisation kinetics were investigated during in vitro caries-simulating conditions. Human enamel blocks were exposed to series of in vitro demineralising solutions consisting of 0.1 M acetic acid adjusted to ph 4.0, with increasing concentrations of [Zn 2+ ] or [F ]. Scanning Microradiography (SMR) obtained accurate, real-time quantitative measurements of changes in enamel mineral mass, as they were exposed to [Zn 2+ ] or [F ]-containing acid solutions. Further, amongst other characterisation techniques, ultralow Energy Secondary Ion Mass Spectrometry (ulesims) and 19 F MAS-NMR were used for determination of possible surface physical-chemical mechanisms of [Zn 2+ ] and [F ] on the enamel dissolution processes respectively. This study confirmed that zinc reduces enamel demineralisation during in vitro caries-simulating conditions. An overall log-linear relationship was observed between the reduction in demineralisation and increasing [Zn 2+ ] up to 3565 ppm. Fluoride showed this log-linear relationship up to 135 ppm, however, further reductions in demineralisation were minimal above this concentration. 19 F MAS- NMR established that fluorite (CaF 2 ) predominantly formed above 135 ppm [F ], whereas fluorohydroxyapatite (FHAp) largely formed below 135 ppm. ulesims indicated that zinc was largely concentrated at the near-surface region of enamel, which suggested that zinc acts predominantly at the enamel crystal surface in its mechanism of reducing demineralisation. Thus, at low concentrations, zinc appeared to act at PO 4 3 sites on enamel surfaces, possibly via an adsorption-type process and was confirmed to form an α-hopeite-like phase, once surface adsorption was complete at higher concentrations. These results have significant implications on the understanding of the fundamental chemical aspects of zinc in toothpastes and demonstrate its therapeutic potential in preventing tooth mineral loss. Page iv
5 THESIS CONTENT ACKNOWLEDGEMENTS... III ABSTRACT... IV EQUATION INDEX... IX FIGURE INDEX... X LIST OF ABBREVIATION... XVI CHAPTER 1: GENERAL INTRODUCTION HYPOTHESIS AIMS AND OBJECTIVES LITERATURE REVIEW CHAPTER 2: HYDROXYAPATITE & DENTAL ENAMEL CALCIUM ORTHOPHOSPHATES HAP CRYSTAL STRUCTURE Hexagonal and Monoclinic Habit MATURE DENTAL ENAMEL STRUCTURE Microstructure Physical Properties Chemical Gradients Incorporation of Ions into Enamel Apatite CHAPTER 3: HIERARCHIES IN ENAMEL DEMINERALISATION DENTAL CARIES Histological Features of a Carious Lesion Role of the Dental Biofilm and Saliva DISSOLUTION MECHANISMS AT THE MOLECULAR LEVEL Thermodynamic Solubility Principle Chemical Attack Diffusion and Surface-Controlled Processes ULTRASTRUCTURAL ASPECTS IN DEMINERALISATION Atomic-Level Structural Defects Polynuclear Model DISSOLUTION PHENOMENON AT THE NANO-SCALE Critical Conditions Self-Inhibition at the Nano-scale Enamel Preservation at the Nano-scale CHAPTER 4: FLUORIDE & ENAMEL DE- AND RE-MINERALISATION REMINERALISATION CRYSTAL NUCLEATION Thermodynamics Primary and Secondary Nucleation Calcium Phosphate Bulk Precipitation CRYSTAL GROWTH Crystal Growth Accelerators ANTI-CARIES AGENT Fluoride in the Apatite Lattice Structure Reaction Pathways of Fluoride Apatite Bound vs. Fluoride in Solution Page v
6 4.4.4 Oral Fluoride Reservoirs CHAPTER 5: ZINC INTERACTIONS WITH DENTAL ENAMEL AND HAP INTRODUCTION ZINC IN THE HUMAN BODY Zinc in the Teeth Zinc in Dental Plaque, Calculus and Saliva ANTI-PLAQUE/CALCULUS EFFECTS OF ZINC Zinc Salts used in Toothpastes and Rinses Bioavailability of Zinc in Saliva and Plaque MECHANISTIC INTERACTION BETWEEN ZINC AND HAP Incorporation of Zinc in HAp through Crystallisation Crystal Growth Inhibitor EFFECT OF ZINC ON APATITE DISSOLUTION Interactions of Zinc and Fluoride with Enamel TECHNIQUES AND MATERIALS & METHODS CHAPTER 6: SCANNING MICRORADIOGRAPHY (SMR) PRINCIPLES OF X-RAYS Nature of X-Rays X-RAY PRODUCTION Electron Impact X-ray source X-RAY INTERACTION WITH MATTER X-Ray Beam Attenuation X-RAY DETECTION: SEMICONDUCTOR COUNTERS Multi-Channel Analyser (MCA) ADVANTAGES OF SMR CHAPTER 7: OTHER EXPERIMENTAL TECHNIQUES NUCLEAR MAGNETIC RESONANCE (NMR) Chemical Shift Magic Angle Spinning Application of 19 F MAS NMR in Dental Research SECONDARY ION MASS SPECTROMETRY (SIMS) The SIMS Process Applications of SIMS for Depth Profiling Ultralow Energy SIMS (ulesims) X-RAY DIFFRACTION (XRD) Grazing Incidence XRD (GIXRD) CHAPTER 8: SMR EXPERIMENTAL METHODS MATERIALS Dental Enamel Blocks Demineralising Solutions SCANNING MICRORADIOGRAPHY X-Ray Generator X-Ray Detector X-Y Scanning Stage SMR Environmental Cell SMR Data Collection Area Scan of Sample Mineral Mass Measurements at Scan Position Page vi
7 8.2.8 SMR Data Analysis Determination of RML enamel at a Single Scan Position Changes in RML enamel at a Scan Position Percentage reduction in RML enamel EXPERIMENTAL STUDIES CHAPTER 9: EFFECT OF FLUORIDE ION CONCENTRATION ON ENAMEL DEMINERALISATION KINETICS IN VITRO: REAL-TIME SMR STUDY INTRODUCTION AIM MATERIALS AND METHODS Preparation of Human Enamel Blocks Preparation of [F ]-Containing Acid Solutions SMR Experiment Determination of RML enamel SMR RESULTS DISCUSSION CONCLUSION CHAPTER 10: EFFECTS OF FLUORIDE ION CONCENTRATION ON IN VITRO ENAMEL DEMINERALISATION CHARACTERISED BY 19 F MAS-NMR INTRODUCTION AIM MATERIALS AND METHODS Preparation of Human Enamel Blocks Preparation of [F ]-Containing Acid Solutions Demineralisation of Samples F MAS-NMR Analysis of Enamel Blocks ICP-OES Analysis of [F ]-Containing Acidic Solutions RESULTS F MAS-NMR ICP-OES Mineral Weight Loss DISCUSSION CONCLUSION CHAPTER 11: EFFECTS OF ZINC ION CONCENTRATION ON ENAMEL DEMINERALISATION IN VITRO: REAL-TIME SMR STUDY INTRODUCTION AIM MATERIALS & METHOD Preparation of Human Enamel Blocks Preparation of [Zn 2+ ]-Containing Acid Solutions SMR Experiment Determination of RML enamel RESULTS DISCUSSION CONCLUSION Page vii
8 CHAPTER 12: PHYSICAL CHEMICAL EFFECTS OF ZINC ON IN VITRO ENAMEL DEMINERALISATION INTRODUCTION AIM MATERIALS AND METHODS Preparation of Demineralising Solutions Preparation of Enamel Blocks ICP-OES Study XRD and ND Analysis of HAp ATR-FTIR Analysis of Enamel Blocks RESULTS ICP-OES XRD and Neutron Diffraction ATR-FTIR DISCUSSION CONCLUSION CHAPTER 13: EFFECTS OF ZINC ON ENAMEL DEMINERALISATION AT THE ULTRASTRUCTURAL LEVEL INTRODUCTION AIM MATERIALS AND METHODS ulesims GIXRD SEM RESULTS ulesims GIXRD SEM DISCUSSION CONCLUSION DISCUSSION, CLINICAL IMPLICATIONS, CONCLUSIONS & FUTURE WORK CHAPTER 14: DISCUSSION & CLINICAL IMPLICATIONS FLUORIDE STUDIES ZINC STUDIES COMPARISON OF ZINC & FLUORIDE MECHANISTIC ACTION CHAPTER 15: CONCLUSIONS & RECOMMENDED FUTURE WORK MAIN FINDINGS FROM STUDY FUTURE WORK REFERENCES 200 APPENDIX A: SMR DATA FOR ZINC STUDY 212 APPENDIX B: ADDITIONAL DATA 212 APPENDIX C: RESEARCH COMMUNICATION 218 APPENDIX D: RESEARCH PUBLICATIONS 220 Page viii
9 Equation Index [3.1] [3.2] [3.3] [3.4] [4.1] [4.2] [6.1] [6.2] [6.3] [7.1] [7.2] [7.3] [7.4] [7.5] [7.6] [7.7] [7.8] [7.9] [7.10] [8.1] [8.2] [8.3] [8.4] [8.5] [12.1] [13.1] [13.2] [13.3] Page ix
10 Figure Index Figure 2.1: Solubility curves of calcium orthophosphates Figure 2.2: Planar crystal structure of stoichiometric HAp: arrangement of calcium and phosphate ions around the central c-axis hydroxyl column. The crystal structure comprises many such repeating hexagonal units (adapted from (Robinson et al., 2000)) Figure 2.3: Relationship between the classical crystallographic unit cell (red lines) and hexagonal unit cell (adapted from (Robinson et al., 2000)) Figure 2.4: Crystal structure of HAp: relationship between hexagonal unit cell structure and the rhomboidal crystallographic unit cell (shown in heavier lines) (Robinson et al., 2000). 11 Figure 2.5: HAp crystallite is composed of millions of unit cells Figure 2.6: Structure of monoclinic HAp. The OH ions are orientated in rows parallel to the c-axis Figure 2.7: Diagram to represent the microstructure of enamel [adapted from (Wang and Nancollas, 2008)] Figure 2.8: Cross-section of dental enamel revealing the key-hole shaped structure of the enamel rod packed with elongated HAp crystallites Figure 2.9: Schematic of the arrangement of crystallites in an enamel rod Figure 2.10: HAp lattice showing substitution PO 4 3 by CO 3 2 observed in biological apatites. This introduces strain and crystal disorder in the apatite lattice structure (Robinson et al., 2000) Figure 2.11: HAp lattice showing substitution of OH by F. The closer fit of the fluoride ion in the Ca (II ) triangle has a stabilising effect to the crystal (Robinson et al., 2000, Bakaletz, 2004) Figure 2.12: HAp lattice showing possible positions of metal cation substitution (Robinson et al., 2000) Figure 3.1: Schematic representation of enamel rod microstructure of a) sound enamel b) demineralised enamel Figure 3.2: shows an illustration of the four zones starting from the outer enamel surface layer towards the EDJ. These zones are: surface, body of the lesion, dark and translucent Figure 3.3: shows the tooth surface is covered by an acquired pellicle comprised of lipids and proteins, including salivary glycoprotein. Dental plaque develops on the pellicle (Bakaletz, 2004) Figure 3.4: The dissolution process according to the reaction-diffusion theory Figure 3.5: Schematic representation of the initial dissolution of an hexagonal HAp crystallite, adapted from (Arends and Jongebloed, 1979). The prism and basal planes are indicated. Initial etch pit formation occurs followed by the removal of the center of crystal parallel to the c-axis Figure 3.6: TEM image of enamel crystal showing dissolution at the center of the crystal (Yanagisawa and Miake, 2003) Figure 3.7: Demineralisation of dental enamel rods at the cores and walls; a) well-organised rod structures on enamel surfaces showing numerous needle-like apatites. The crystallites in the cores are orientated perpendicular to the surface while those on the walls are inclined ; b) Enlargement of the rectangular area of wall in (a) (Wang et al., 2005).. 34 Page x
11 Figure 3.8: SEM images show demineralisation initiated at the core/wall of rods and development aniscotropically along the c-axis, with dissolution time a) 27 h; b) 40 h; c) 55 h and d) 120 h (Wang et al., 2005) Figure 3.9: Schematic representation of a screw dislocation. The Burgers vector b and the Burger circuit is indicated. The dashed circle represents the center of the active site Figure 3.10: TEM image of enamel showing screw dislocation. The crystal lattice is split into two (arrow) (Yanagisawa and Miake, 2003) Figure 3.11: TEM image of a cross-section of an enamel crystal c-axis. It shows an elongated hexagonal configuration with three sets of lattice striations (interval 8.17 Å) intersecting at 60 angles. A central dark line (arrow) with many white spots (arrowhead) in its vicinity is observable (Yanagisawa and Miake, 2003) Figure 3.12: AFM movie frames of brushite dissolution on (010) surfaces. The significant developments are only observed for the larger pit steps. The smaller ones are almost stationary (pit 1) in comparison with the larger pits (pit 2). Some of the small pits disappear (pit 3). The scale of the images is 5 µm (Tang et al., 2004a) Figure 3.13: Demineralisation of dental enamel rods at the cores (orange) and walls (yellow). a) well-organised rod structures on enamel surfaces showing numerous needlelike apatites. The crystallites in the cores are orientated perpendicular to the surface while those on the walls are inclined b) crystallites become smaller during dissolution and nano-sized apatite particles are formed on both walls and rods. c) the cores were emptied after 7 days of dissolution. d) nano-sized apatite particles were collected from the bulk solution after subjection to further dissolution. e) SEM of the wall at higher magnification show nano-sized apatite residues retained on the wall surfaces were protected against further dissolution Figure 4.1: Schematic representation of the stages involved in the precipitation of solids from solutions Figure 4.2: Free energy of nucleation (ΔG N resultant free energy) as a function of nuclei size Figure 4.3: Model to show the sequence of steps followed for the growth of crystals at a microscopic scale. K: kink, S: step, T: terrace (Valsami-Jones, 2004) Figure 4.4: Schematic diagram showing remineralisation of partially demineralised crystal leads to remineralised crystals with surfaces rich in fluoride and of low solubility Figure 4.5: Schematic drawing of FHAp showing H-bonding between adjacent F - and OH - are at maximum with 50 % substitution of OH - by F - (Moreno et al., 1974) Figure 5.1: Salivary clearance of zinc (Lynch, 2011) Figure 5.2: Schematic figure for the structure of Zn-doped HAp, where yellow, blue, red, black, green and grey refer to calcium 1 site, calcium 2 site, oxygen, hydrogen, zinc and phosphate groups respectively (Tang et al., 2009) Figure 5.3: Surface structures on an idealised crystal face: kinks (K); steps (S); terraces (T). Adsorbed impurities at each of these sites are illustrated (Valsami-Jones, 2004) Figure 6.1: Schematic of SMR X-Y scanning stage with SMR cells circulating solutions. An X- ray beam is fixed on a specimen and the attenuated X-ray photon is detected by a photon counting detector Figure 6.2: Electromagnetic spectra Figure 6.3: X-ray tube Figure 6.4: X-ray spectrum of tungsten target showing continuous and characteristic radiation Figure 6.5: Representation of the electronic structure of an atom and some characteristic energy transitions Page xi
12 Figure 6.6: Attenuation of a monochromatic X-ray beam of Intensity (I 0 ) by a homogeneous material of thickness x Figure 7.1: Diagram showing the change in energy between nuclear states, which is proportional to the strength of an applied magnetic field Figure 7.2: Diagram showing the change in energy between nuclear states, which is proportional to the strength of an applied magnetic field Figure 7.3: Schematic diagram representing the basic components in the SIMS instrumentation Figure 7.4: Schematic diagram showing the sputtering of the sample surface using a primary ion beam. The emitted charged particles are called the secondary ions Figure 7.5: Two beams with the same wavelength and phase strike a set of planes (with lattice-spacing of d) and are scattered off two different atoms within it. Constructive interference occurs when this length is equal to an integer multiple of the wavelength radiation Figure 7.6: Schematic of GIXRD showing the analysis of the surface region of an enamel sample. x is the path-length the X-ray beam travel, h is the penetration depth and α is the grazing incidence angle Figure 8.1: Preparation of enamel blocks from a tooth: a) parallel cut at the cementum, b and c) perpendicular cuts of the crown edge to obtain blocks, d) enamel block with dentine underside, e) enamel block with dentine polished away Figure 8.2: Schematic of SMR X-Y scanning stage with multiple SMR cells containing enamel blocks and HAp disc (reference). Test solutions are circulated in the cells. An X-ray beam is fixed on a specimen and the attenuated X-ray photon is detected by a photon counting detector Figure 8.3: Schematic diagram of SMR environmental cells showing top down and side views with dimensions Figure 8.4: Schematic diagram of SMR environmental cell containing an enamel block Figure 8.5: An approximate area scan of the enamel specimen and HAp disc (for standard measurements) in SMR cells Figure 8.6: High-resolution area scan of enamel sample. The coloured scale bar represents the mineral distribution in the enamel sample. X mark show the three scanning positions selected for mineral mass measurements Figure 8.7: Typical example of a SMR raw data plot showing the linear change in mineral mass loss per unit area plotted against time ( 40 h) during exposure to acidic conditions (ph 4.0) at a single scan position on an enamel sample. RML enamel was determined by linear regression fitting of the slope (4.579 x 10⁻⁴ g cm -2 h -1, SE = 8.02 x 10⁻⁶ g cm -2 h -1 ) Figure 8.8: Comparing the gradient of the measured slope (0 and X ppm [M + ]) measured at a single scan position on a sample Figure 9.1: Schematic diagram of SMR environmental cell containing an enamel block sample. The narrow X-ray beam repeatedly measures 3 fixed scan positions on a sample during the experiment, and the attenuated beam is detected by a solid-state detector Figure 9.2: Typical SMR raw data plot showing the mineral loss per unit area plotted against time ( 40 h) during exposure to acidic conditions (ph 4.0, [F ] = 0 ppm) at a single scan position on a sample. RML enamel was determined by linear regression fitting of the slope (y = a + bx), R 2 = Error bar shows the statistical error arising from the photon-counting statistics Figure 8.9.3: Typical SMR raw data plot showing the mineral loss per unit area plotted against time (~40 h) during exposure to acidic conditions (ph 4.0, [F ] = 0 ppm) at a single scan position on a sample. RML enamel was determined by linear regression fitting of the Page xii
13 slope (y = a + bx), R 2 = Error bar shows the statistical error arising from the photoncounting statistics Figure 9.4: The change in the mean of the PRML enamel plotted as a function of successively increasing [F ] (ppm) in the acidic solution. Error bars show the standard error Figure 10.1: 19 F MAS-NMR spectra of enamel samples immersed in increasing concentrations of fluoride in the acidic solutions for 96 h shown in the following order: Control enamel block not exposed to fluoride, fluorapatite (FAp) reference, enamel block in 11 ppm [F ], enamel block in 45 ppm [F ], enamel block in 136 ppm [F ], enamel block in 452 ppm [F ], enamel block in 656 ppm [F ], enamel block in 1357 ppm [F ], enamel block in 2262 ppm [F ], Calcium fluoride (CaF 2 ) reference. Asterisks mark spinning side bands Figure 10.2: ICP measurements of the calcium and phosphorus detected in reaction solutions containing increasing [F ]. =Phosphorus ions = Calcium ions. The dashed lines show the calcium and phosphorus in acidic solutions under control conditions (0 ppm [F ]). The error bars show the instrumentation error Figure 10.3: Ca/P ion ratio in solution as a function of [F ]. The dashed line shows the Ca/P ion ratio under control conditions Figure 10.4: The percentage enamel weight loss/mm 2 of samples with increasing [F ] ppm. The dashed line shows the % percentage enamel weight loss/mm 2 under control conditions. The error bars show the instrumentation error Figure 11.1: Each SMR cell contains an enamel block obtained from either tooth specimen A, B or C Figure 11.2 Each SMR cell containing a sample was circulated with a [Zn 2+ ]-containing acid solution (ph 4.0) for a period of 48 h. Initially an acid solution containing no zinc was circulated for 48 h, which was followed by 0.1 ppm [Zn 2+ ] and so on Figure 11.3: Typical SMR raw data plot showing the mineral loss per unit area plotted against time ( 50 h) during exposure to acidic conditions (ph 4.0, [Zn 2+ ] = 0 ppm) at a single scan position on a sample (A). RML enamel was determined by linear regression fitting of the slope (y = a + bx) Figure 11.4: compares the gradients of the measured slope (0, 356 and 3565 ppm [Zn 2+ ]) measured at a single scan position on a sample Figure 11.5: a) shows the relationship between the mean PRML enamel (n=9) and log [Zn 2+ ]. b) shows the relationship between the mean PRML enamel (n=9) and [Zn 2+ ]. A break in the x axis (between ppm) has been shown to enhance readability. Error bar shows the standard error in SMR measurements Figure 12.1: ICP-OES measurements showing the Ca and P detected for enamel blocks immersed in a range of [Zn 2+ ]-containing acidic solutions (96 h); a) the [Zn 2+ ] is plotted on a log-scale. The dashed lines show the Ca and P release for the control enamel (0 ppm [Zn 2+ ]); b) Shows the data in Figure 12.1a without logging the [Zn 2+ ]. The trend in the Ca and P release can be seen more clearly in this plot. The error bars show the Standard Error of the Mean (SEM) (n=3) Figure 12.2: ICP-OES measurements showing the Ca and P detected for HAp powder immersed in a range of [Zn 2+ ]-containing acidic solutions (96 h); a) the [Zn 2+ ] is plotted on a log-scale. The dashed lines show the Ca and P release for the control HAp sample (0 ppm [Zn 2+ ]); b) shows the data in Figure 12.2a without logging the [Zn 2+ ]. The trend in the Ca and P release can be seen more clearly in this plot. The error bars show the Standard Error of the Mean (SEM) (n=3) Figure 12.3: Ca/P ratio in solution as a function of [Zn 2+ ] in the acidic solutions shown for the enamel blocks. The dashed lines show the Ca/P ratio for the control enamel (0 ppm [Zn 2+ ]) Page xiii
14 Figure 12.4: Ca/P ratio in solution as a function of [Zn 2+ ] in the acidic solutions shown for HAp samples. The dashed lines show the Ca/P ratio for the control HAp (0 ppm [Zn 2+ ]) Figure 12.5: compares the [Zn 2+ ] uptake from solution with the [PO 3-4 ] released into solution for HAp powder samples. The error bars show the Standard Error of the Mean (SEM) (n=3) Figure 12.6: shows the XRD patterns for HAp immersed in a range of [Zn 2+ ]-containing acidic solutions for a) ppm [Zn 2+ ]; b) (0, 1782 and 3565 ppm) in the region 4-10 Å. A XRD pattern for α-hopeite is shown as a reference. The * show new diffraction peaks that are absent in the control sample Figure 12.7: shows the neutron diffraction analysis for HAp powder immersed in acidic solutions containing [Zn 2+ ] (0 and 3565 ppm). The * represents an additional peak in 3565 ppm[zn 2+ ] sample that is not present in the control sample (0 ppm [Zn 2+ ]) Figure 12.8: shows the ATR-FTIR spectra of enamel blocks immersed in a range of [Zn 2+ ]- containing acidic solutions for a) 0, 107, 356 and 3565 ppm [Zn 2+ ] in the region cm -1 ; b) 0, 356 and 3565 ppm in the region cm -1 ; c) 0, 356, 1782 and 3565 ppm in the region cm -1. The dashed line highlights the shift in band from 3500 cm -1 (in control sample) to 3300 cm -1 in the treated samples. A spectra for α-hopeite is shown as a reference Figure 12.9: shows the possible coordination of Zn at the PO 4 sites on the enamel surface Figure 13.1: ulesims depth profile of zinc in control sample (blue) and test sample (red). The depth profile (nm) has been plotted against relative ion yield for zinc. The insert shows the depth profiling of zinc up to 10 nm and the dashed line in this plot represents the depth of one unit cell for HAp crystal Figure 13.2: GIXRD patterns for the control (0 ppm [Zn 2+ ]) sample (blue), test sample (3565 ppm [Zn 2+ ]) (red) and α-hopeite reference (black) Figure 13.3: SEM images of GIXRD polished enamel samples: a) control (0 ppm [Zn 2+ ]) at low magnification b) control (0 ppm [Zn 2+ ]) at high magnification c) Test (3565 ppm [Zn]) at low magnification and d) Test (3565 ppm [Zn 2+ ]) at high magnification Figure 13.4: Schematic representation of dissolution pits (P) on enamel crystal surface. Adsorption of zinc ions at dissolution pit sites are illustrated Figure 14.1: Schematic illustration of adsorbed fluoride ions on the surface of dental enamel crystals. With increasing [F ], fewer calcium sites are available for binding which results in more and more fluoride ions competing for the few sites that are still available Figure 14.2: Schematic representation of fluoride ions adsorbed to the apatite crystal surface of dental enamel: a) at low [F ], the adsorbed fluoride ions attract calcium ions which then attract phosphate ions, to form a FAp-like remineralised veneer on the crystal surface. b) at high [F ], the saturation of fluoride ions at the enamel crystal surface promotes the formation of CaF Figure 14.3: Hierarchical structure of dental enamel showing different hierarchical levels from the microscale down to nano-scale Figure 14.4: Comparing the percentage reductions in enamel demineralisation (PRML enamel ) as a function of increasing [F ] or [Zn 2+ ] (ppm) in the acid solution for the SMR studies Page xiv
15 Table Index Table 2.1: Structure and composition of biologically relevant calcium phosphate phases Table 2.2: Analytical methods and information obtained (LeGeros, 1990) Table 9.1: Statistical analysis for the data in Figure 9.2, using SigmaPlot Table 9.2: Statistical analysis for the data in Figure 9.3, using SigmaPlot Table 9.3: RML enamel values with the associated standard error for all scan position measured on samples (A,B,C1 and C2). For every position, the RML enamel measurements at each [F ] were compared with those during acid demineralisation at 0 ppm [F ]. The difference in the demineralisation rates between 0 ppm [F ] and each test condition is shown as a PRML enamel. For every scan position, the RML enamel measurement at each [F ] was statistically different (P 0.05) when compared to the RML enamel measurement at acid demineralisation (0 ppm [F ]) Table 10.1: The percentage enamel weight loss of enamel blocks and the calcium and phosphorus ion release into acidic solution with increasing [F ] ppm Table 11.1: Statistical analysis for the data in Figure 11.4, using SigmaPlot Table 11.2: Statistical analysis for the data in Figure 11.5, using SigmaPlot Table 11.3: RML enamel values with the associated standard error for all scan position measured on samples (A,B, and C). For every position, the RML enamel measurements at each [Zn 2+ ] were compared with those during acid demineralisation at 0 ppm [Zn 2+ ]. The difference in the demineralisation rates between 0 ppm [Zn 2+ ] and each test condition is shown as a PRML enamel. For every scan position, the RML enamel measurement at each [Zn 2+ ] was statistically different (P 0.05) when compared to the RMLenamel measurement at acid demineralisation (0 ppm [Zn 2+ ]) Page xv
16 List of Abbreviation α-zn 3 (PO 4 ) 2.4H 2 O α-hopeite Al Aluminium C Degree Celsius Ca 2+ Calcium ion CaF 2 Calcium fluoride (fluorite) h Hour HAp Hydroxyapatite F Fluoride ion FAp Fluorapatite FHAp Fluorohydroxyapatite F s -HAp Fluoride-Substituted Apatite GIXRD Grazing Incidence XRD ICP-OES Inductively Coupled Plasma-Optical Emission Spectroscopy I Transmitted X-Rays Intensity Io Incident of X-rays intensity LAC Linear Attenuation Coefficient m Mass Per Unit Area MAC Mass Attenuation Coefficient MAS Magic Angle Spinning MCA min NMR 3- PO 4 RML enamel s SD SE SEM SMR ulesims Multiple Channel Analyser Minute Nuclear Magnetic Resonance Orthophosphate (Pi) Rate of Enamel Demineralisation Seconds Standard Deviation Standard Error Scanning Electron Microscopy Scanning Microradiography ultralow energy Secondary Ion Mass spectrometry WHO World Health Organisation XRD X-Ray Diffraction Zn 2+ Zinc ion μ LAC in cm -1 μ ρ Mass Attenuation Coefficient Page xvi
17 Chapter 1 k General Introduction Dental caries remains the most common global disease in both adults and children (Peterson et al., 2005). It is a disease of the hard tissues of the teeth caused by the interactions between microorganisms found in dental plaque and dietary fermentable carbohydrates, which produces organic acids that dissolves a defective carbonated hydroxyapatite, the main component of tooth enamel, in a process known as demineralisation (Robinson et al., 2000). Remineralisation is the reverse of the process, in which some of the mineral loss can be recovered to the molecular structure of the tooth from the ions in plaque fluid and saliva. Cavities result when the rate of demineralisation exceeds the rate of remineralisation (Cochrane et al., 2012). This may eventually result in pain, loss of teeth and can have a significant reduction on the overall quality of life (Sheiham, 2005). Zinc salts are formulated into oral health products to reduce malodour, and control plaque and calculus formation (Chapter 5). While the effects of zinc as an antiplaque and calculus agent have been investigated extensively, its interaction with enamel and its putative role in demineralisation and remineralisation is considerably less understood. Conversely, there are extensive studies on the effects of fluoride on enamel de- and re-mineralisation (Chapter 4). Although the cariostatic behaviour of fluoride is well understood, there is a continued interest in fluoride s therapeutic potential, in particular refining the understanding of its mechanistic action. Page 1
18 1.1 Hypothesis The hypothesis is that fluoride and zinc will retard the demineralisation of dental enamel under in vitro caries-like conditions in a concentration-dependent fashion by acting at the enamel surface. Page 2
19 1.2 Aims and Objectives The aims and objectives of this study can be outlined as follows: 1. To investigate the effects of fluoride and zinc ion concentration on the kinetics of enamel demineralisation under in vitro caries-simulating conditions. i. Scanning Microradiography (SMR) will be used to directly measure the effect of fluoride (Chapter 9) and zinc (Chapter 11) ion concentration on the real-time enamel dissolution. 2. To understand the physical and chemical mechanistic effects of fluoride and zinc on surface enamel dissolution. i. The mode of fluoride action will be investigated using 19 F MAS-NMR by characterising the fluoride-enamel interactions at the enamel surface during demineralisation (Chapter 10). ii. A variety of complimentary techniques including X-ray Diffraction (XRD) and ultralow energy SIMS (ulesims) will be used to understand the mechanistic action of zinc on surface enamel dissolution (Chapter 12 and 13). 3. To determine the potential role of zinc in the caries process by comparing to fluoride s cariostatic mode of action. i. The effects of zinc and fluoride ion concentration on enamel demineralisation will be compared for similarities and differences in terms of their mechanistic behaviours. Page 3
20 LITERATURE REVIEW Page 4
21 Chapter 2 k Hydroxyapatite & Dental Enamel 2.1 Calcium Orthophosphates Calcium orthophosphates are the main mineral constituents of bones and teeth and have been of considerable interest to biologists, mineralogists and industrial chemists for many years. Due to the many applications of calcium phosphates in industry, medicine and everyday life, there is a widespread interest to understand the physical mechanisms that underlie their growth, dissolution and phase stability. In oral biology, calcium phosphates are of particular interest because of the following reasons (LeGeros, 1991): their occurrence in normal (e.g., enamel, dentine, cementum, bone) and pathological (e.g., dental calculi, salivary stones) calcifications their relation with the formation, progression and prevention of enamel and dentine caries their use in preventive and restorative dentistry The three major structural classifications of the calcium phosphates (CaPs) are: 1) The apatite type, Ca 10 (PO 4 ) 6 X 2 this includes derivatives of hydroxyapatite (HAp) (X = OH) and fluorapatite (FAp) (X = F), and those related to apatitetype structures such as octacalcium phosphate (OCP, Ca 8 (HPO 4 ) 2 (PO 4 ) 4.5H 2 O) and tetracalcium phosphate (TTCP, Ca 4 (PO 4 ) 2 O). 2) The glaserite type, this includes all polymorphs of tricalcium phosphates (TCP, Ca 3 (PO 4 ) 2 ). Page 5
22 3) The Ca-PO 4 sheet-containing compounds, which include dicalcium phosphate dihydrate (DCPD, CaHPO 4. 2H 2 O), dicalcium phosphate anhydrous (DCPA, CaHPO 4,) and monocalcium phosphates (Ca(H 2 PO 4 ) 2. H 2 O and Ca(H 2 PO 4 ) 2 ). Below, Table 2.1 shows the structure and compositions of biologically relevant calcium phosphate phases. Calcium Phosphate Abbreviation Empirical Formula Molar Ca/P ratio Crystal Habit Dicalcium phosphate dihydrate (Brushite) Dicalcium phosphate (Moneite) DCPD CaHPO 4. 2H 2 O 1.00 monoclinic DCPA CaHPO triclinic Octacalcium phosphate OCP Ca 8 H 2 (PO 4 ) 6. 5H 2 O 1.33 triclinic Tricalcium phosphate (Whitlockite) β-tcp Ca 3 (PO 4 ) hexagonal Amorphous calcium phosphate ACP Ca 9 (PO 4 ) 6. XH 2 O 1.50 NA Hydroxyapatite HAp Ca 10 (PO 4 ) 6 (OH) hexagonal Fluorapatite FAp Ca 10 (PO 4 ) 6 F hexagonal Table 2.1: Structure and composition of biologically relevant calcium phosphate phases. Most calcium phosphates are sparingly soluble in water, but all dissolve in acids; the calcium to phosphate molar ratios (Ca/P) (Table 2.1) and the solubilities (Figure 2.1) are important parameters to distinguish between the different calcium phosphate phases (Wang and Nancollas, 2008). Page 6
23 Figure 2.1: Solubility curves of calcium orthophosphates. Figure 2.1 shows that HAp is the most stable phase with respect to the other calcium phosphate phases above ph 5, whereas DCPD is the least stable phase above ph 6. Below, Table 2.2 lists physical techniques that are useful in identifying the apatite phases. As each compound has a unique crystal structure, X-ray Diffraction (XRD) is one of the most conclusive techniques for CaP phase identification (LeGeros, 1990). Analytical Method X-ray Diffraction (XRD) Information Identification; purity; presence of mixed phases; crystallinity (crystallite size and/or strain); lattice parameters (reflecting type and amount of substitution in the structure) Infrared Spectroscopy (IR) Presence of functional groups (e.g. CO 3, PO 4, OH),; manner of substitution; purity; crystallinity (degree of perfection) Scanning Electron Microscopy (SEM) Nuclear Magnetic Resonance (NMR) Atomic Absorption (AA) Electron Probe Crystal morphology (size and shape) H-bonding effect Elemental analysis of cations (e.g Ca 2+, Mg 2+, Na +, K +, Sr 2+, Zn 2+ etc.) Qualitative distribution of elements; Ca/P molar ratios Table 2.2: Analytical methods and information obtained (LeGeros, 1990). Page 7

24 2.2 HAp Crystal Structure The inorganic component of teeth is essentially impure calcium phosphates occurring predominantly in crystalline form as biological apatite. In this section the crystal structure of HAp is considered in detail as dental enamel constitutes predominantly of an impure form of this material. A description of a crystal focuses on the smallest repeating unit, which is termed the unit cell. The HAp unit cell has the chemical formula Ca 10 (PO 4 ) 6 (OH) 2, and four different types of crystallographic sites: 1) tetrahedral sites for six P 5+ -ions, each in 4-fold coordination with oxygen 2) Ca (I) sites for four of the Ca 2+ ions 3) Ca (II) sites for the six other Ca 2+ ions 4) channel site, which is typically occupied by two mono-valent anions (most commonly OH, F, and/or Cl ) per unit cell The apatite structure consists of an array of PO 3 4 tetrahedra held together by Ca 2+ ions interspersed among them. The Ca 2+ ions occur in two structurally distinct sites, in accurately aligned columns (Ca (I)) and in equilateral triangles (Ca (II)) centred on the screw axis. The OH ions occur in columns on the screw axis, and the adjacent OH groups point in opposite directions (Ma and Liu, 2009). PO 4 tetrahedron Orthophosphates are the salts of H 3 PO 4, which include H 2 PO 4, HPO and PO 4 ionic species. In apatite, the phosphorus occurs in a tetrahedral coordination. Adjacent Ca(I) and Ca(II) polyhedral are linked through 3 oxygen atoms of the PO 4 tetrahedral. A prominent feature is that the PO 3 4 groups are approximately hexagonally close-packed, which leads to the formation of channels though the structure, and is probably responsible for the stability of the apatite lattice (Chadwick and Cardew, 1997). Page 8
 is coordinated to nine oxygen atoms in the arrangement of a tricapped trigonal prism.")
 ions form triangles on the planes at z = ¼ and z = ¾. All three Ca(II) atoms at the corners of the triangles are bonded to the central anion.")
 and Cl ions, lies on the planes at z = ¼, ¾ in the most symmetric position in the channel (i.e., on mirror planes perpendicular to the c-axis).")
25 Ca(I)O 9 polyhedron In the apatite structure, the ten calcium ions in the unit cell exist in two polyhedral. Four of the Ca(I) is coordinated to nine oxygen atoms in the arrangement of a tricapped trigonal prism. Ca(II)O 6 X polyhedron Six of the Ca(II) is coordinated to six oxygen atoms and one column anion (X), and are arranged in such a way that they form a channel along the c axis, the anion-channel. Channel site The Ca(II) ions form triangles on the planes at z = ¼ and z = ¾. All three Ca(II) atoms at the corners of the triangles are bonded to the central anion. Structurally, this polyhedron is affected the most in response to substitution of column anions, F, Cl, OH. Fluoride (1.36 Å), having a smaller ionic radius than OH (1.40 Å) and Cl ions, lies on the planes at z = ¼, ¾ in the most symmetric position in the channel (i.e., on mirror planes perpendicular to the c-axis). The larger OH and Cl ions are too big to lie on the rigid plane formed by Ca(II) atoms, and the OH and Cl is displaced above or below the plane (Kohn et al., 2002). Thus HAp has a lower symmetry than FAp. Page 9
 schematically represented the planar crystal structure of stoichiometric HAp viewed down the OH column, which is a useful visual aid for understanding its structure (Figure 2.2).")
26 In the late 1960s, the molecular structure of apatite was determined by Kay, Posner and Young using single crystal X-ray and neutron diffraction (Kay et al., 1964). Robinson et al. (2000) schematically represented the planar crystal structure of stoichiometric HAp viewed down the OH column, which is a useful visual aid for understanding its structure (Figure 2.2). This shows the planar arrangement of Ca 2+ and PO 3 4 ions around the central OH ion, which extends throughout the crystal in the direction of the c-axis. The crystal structure can be most easily understood as a series of hexagonal plates superimposed on one another, with each plate rotated by 60 degrees. It should be noted that this arrangement is not the crystallographic unit cell. Figure 2.2: Planar crystal structure of stoichiometric HAp: arrangement of calcium and phosphate ions around the central c-axis hydroxyl column. The crystal structure comprises many such repeating hexagonal units (adapted from (Robinson et al., 2000)). Figure 2.3: Relationship between the classical crystallographic unit cell (red lines) and hexagonal unit cell (adapted from (Robinson et al., 2000)). Page 10
s of the outer hexagon are shared between three adjacent similar hexagons. Figure 2.")
27 Figure 2.3 shows the relationship between the classical rhomboidal crystallographic unit (red) and hexagonal unit cell. This shows the Ca (I)s of the outer hexagon are shared between three adjacent similar hexagons. Figure 2.4: Crystal structure of HAp: relationship between hexagonal unit cell structure and the rhomboidal crystallographic unit cell (shown in heavier lines) (Robinson et al., 2000). Figure 2.4 shows that the crystallographic unit cell i.e. (Ca 10 (PO 4 ) 6 OH 2 ) shown in heavier lines, consists of four columnar calciums (Ca Is), six screw calciums (Ca IIs) and six phosphates located around the OH group. Many of the ions are shared with the surrounding unit cells to give an average stoichiometry with ten calcium atoms per crystallographic cell. Figure 2.5: HAp crystallite is composed of millions of unit cells. Page 11
28 The HAp crystal structure (also called crystallite) is composed of millions of HAp unit cells (Figure 2.5). Due to the ionic nature of its constituents, the surfaces of these HAp crystals are extremely polar. The reported concentration of the lattice ions existing on the surface of HAp were equal to 2.57, 3.02 and 4.50 ions/nm 2 for OH, PO 3 4 and Ca 2+, respectively (Kukura et al., 1972). In the crystal lattice structure, the 3 PO 4 groups are bulky and consume a large portion of the lattice volume, and are probably the most important contributor to the lattice integrity. Substitutions can occur within the interstices between the PO 3 4 groups without great disturbances, and is also the reason why PO 3 4 groups themselves can be replaced by a variety of polyatomic ions Hexagonal and Monoclinic Habit The unit cells are monoclinic in stoichiometric HAp and are hexagonal in HAp of a non-stoichiometric nature (Elliott, 1994). The major structural difference between the two types of unit cells is the orientation of the OH ions, which is sufficient to impact the physicochemical properties of the HAp crystal (Reyes-Gasga et al., 2012). The monoclinic unit cell has parameters a = Å, b = 2a, c = Å and ϒ = 120 (Elliott et al., 1973). This is the most ordered and thermodynamically stable form of HAp, even at room temperature. In the monoclinic form, all of the OH ions within a given column have the same direction of displacement, and the direction reverses in the adjacent column (Ma and Liu, 2009). Thus in one column all the OH ions point upward, while those in the next column point downwards (Figure 2.6). Therefore, there is no disordering of the OH ions in the monoclinic form. The monoclinic form is formed only under favourable thermal conditions (Mathew and Takagi, 2001). The hexagonal form of HAp exists in biological apatites. The hexagonal unit cell has lattice parameters a = b = Å, c = Å and ϒ = 120 and resembles that of the monoclinic form, but with columns of Ca 2+ and OH ions located in parallel channels. Unlike the monoclinic form, the OH ions are more disordered within each row either pointing upward or downwards in the lattice structure. However, diffraction studies have shown that there is some short range ordering of these ions Page 12
29 into columns OH OH OH HO HO HO otherwise the hydrogen atoms would be in too close proximity and give H-bonding. The reversal of the OH direction can be achieved by substitution of an OH by F or Cl or by a vacancy; therefore any strains that are induced in the structure are usually nearly always compensated by substitution or ion vacancies, thus hexagonal HAp is probably never strictly stoichiometric (Kay et al., 1964). H Ca (II) O a b c Figure 2.6: Structure of monoclinic HAp. The OH ions are orientated in rows parallel to the c-axis. Page 13
. The teeth are composed of three mineralised tissues - enamel, dentine and cementum.")
30 2.3 Mature Dental Enamel Structure Dental enamel is a highly mineralised acellular tissue and is often described as an inorganic-organic two-phase system. It consists of 98 wt. % non-stoichiometric defective HAp, and 2 wt. % non-collagenous protein and water (Elliott, 1997). The teeth are composed of three mineralised tissues - enamel, dentine and cementum. The enamel is supported on dentine, a more resilient collagen-apatite composite, which forms the bulk of the tooth Microstructure The organisation of the apatite mineral in enamel follows a hierarchy of structural levels from the microscopic to the atomic (Boyde, 1997). The largest structural unit of tooth enamel is the enamel rod that is in the order of 4-5 µm in thickness and up to 3 mm in length. Each rod is densely packed with arrays of elongated carbonated apatite crystallites arranged in characteristic patterns (Figure 2.7). The crystallites are long and lath-like with a reported average diameter of 40 nm for sound enamel. In the literature, the reported values for the crystallite length varies between nm (Jongebloed et al., 1975). Cross-sections show they have the form of elongated, irregular hexagons. The enamel rods are orientated perpendicular to the Enamel-Dentine Junction (EDJ), and the enamel crystallites arranged within the rods run from the EDJ toward the tooth surface (Robinson et al., 2000). Enamel CaP Nuclei Composite Nanoparticles Building Blocks Figure 2.7: Diagram to represent the microstructure of enamel [adapted from (Wang and Nancollas, 2008)]. Page 14
.")
31 Figure 2.8: Cross-section of dental enamel revealing the key-hole shaped structure of the enamel rod packed with elongated HAp crystallites. A cross-section of demineralised enamel would show that each individual rod has a key-hole shape, in which the component parts are referred to as the head and the tail (Figure 2.8). Throughout the enamel, most of the rods are arranged so that their heads are directed toward the crown of the tooth, and their tails toward the Cemento-Enamel Junction (CEJ) (Scott et al., 1974). Organic matrix HAp crystallite Figure 2.9: Schematic of the arrangement of crystallites in an enamel rod. At the rod boundaries or junctions, the crystallites are present at quite divergent angles, which cause discontinuities in the otherwise continuous structure (Figure 2.9). These locations acquire a more concentrated organic matrix during maturation, and they are both crack stoppers and crack propagation tracks in Page 15
32 the adult tissue (Boyde, 1997). The organic substance surrounding each rod is predominantly a protein matrix of enamelins (enamel-specific proteins). The space between rods is called the inter-rod enamel, and by acting as its border enhances the key-hole appearance. Although the crystal composition is the same, the crystal orientation differs, thus distinguishing the rods from inter-rod enamel. In the enamel rods, the majority of the crystals are tightly packed in the direction of the crystal c-axis, however, they are more randomly orientated with respect to the a-axis. This disorientation in the crystals results in pores with polygonal crosssections (diameter 1-10 nm) in the enamel structure. Essentially, these are the intercrystalline spaces separating crystals that are filled with water and organic material, and account for 1-5 volume% of enamel. An increase in the amount of porosity is usually found at the enamel rod junctions, or boundaries, due to imperfections in the packing of enamel crystallites in this region (Hamilton et al., 1973, Orams et al., 1974). In the tooth structure regions of high porosity are found near the EDJ, whereby a cross section of the rod structure would show smaller and more widely dispersed crystals with an increase in the abundance of proteins (Weatherell et al., 1968) Physical Properties Largely due to its unique structural organisation, enamel possesses exceptional mechanical properties that combine high hardness with remarkable resilience. The high rigidity and density would make enamel a very brittle material if this wasn t compensated by the support from the underlying softer dentine tissue. In the 1960s, it was thought that the composition of enamel was equivalent to HAp, and therefore the mineral density of enamel would be equal to that of HAp ( 3.15 g/cm 3 ). In later studies, Elliott (1997) confirmed that enamel is an impure form of HAp that contains multiple impurities, such as the inclusion of carbonate ions, which significantly reduces the enamel density (between 2.99 and 3.02 g/cm 3 ) in comparison to the density of HAp. Another characteristic feature that affects the physical properties of the enamel is the presence of pores in its structure. Quantitative microradiography studies have Page 16
33 demonstrated that the mineral content, and hence the porosity, varies markedly with enamel (Weidmann et al., 1967). Mineral content decreases from the outer surface towards the EDJ, and the volume that is unoccupied by mineral is significantly greater in inner enamel than in outer enamel. The inner enamel is abundant in both protein and water, due to the increase in enamel permeability to ions, water and small organic molecules (Lowe et al., 1971; Meeting Abstract). The number of available pores, the pore size and the inter-connectivity between the pores influence the diffusion of ions, water and small organic molecules. The charge of the diffusing ion also affects the partial acceptance or rejection of the transport of ion through the enamel pores. Although to a lesser extent, the organic matrix also controls the permeability and transport processes through enamel, for example, ionic diffusion is limited in the presence of proteins (Shellis and Dibdin, 2000) Chemical Gradients While enamel is physically strong, it is chemically rather vulnerable. The natural variability in chemical composition occurs both between teeth and within the same tooth, not only as a result of environmental exposure, but also as a consequence of developmental factors (Dowker et al., 1999). Furthermore, the gradients in porosity occurring in the enamel tissue also allow for the entry of material into and out of the apatite structure. Minor constituents of whole teeth include typically 3.0 wt. % CO 2, 0.4 wt. % Cl, 0.2 wt. % Mg, 0.01 wt. % F and many other trace elements (Elliott, 1994). Chemical gradients exist in enamel extending from the surface towards the EDJ. For example, the concentration gradients of carbonate and magnesium show increases from the enamel surface towards the EDJ, whereas, the concentration of fluoride is generally higher at the surfaces and decreases towards the EDJ (Robinson et al., 2000). The presence of foreign ions in the apatite structure affects the lattice parameters, crystallinity (reflecting crystal size and crystal strain), stoichiometry (Ca/P molar ratio) and the chemical stability of the apatite crystal. Therefore inevitably, the chemical behaviour of enamel will vary with depth in the tooth structure. Page 17
34 2.3.4 Incorporation of Ions into Enamel Apatite CARBONATE The incorporation of carbonate (CO 2 3 ) seems to occur during tissue development. In the apatite lattice, CO 2 3 can substitute either for the OH or the PO 3 4 sites in the apatite structure (Figure 2.10). Ca I Ca I PO 4 Ca II Ca II Ca I OH Ca I CO 3 2- PO 4 Ca I Ca II Ca I Figure 2.10: HAp lattice showing substitution PO 4 3 by CO 3 2 observed in biological apatites. This introduces strain and crystal disorder in the apatite lattice structure (Robinson et al., 2000). These two substitutions have the opposite effects on the lattice parameter. Substitution for the OH group causes a systematic expansion in the a-axis and 3 contraction in the c-axis with increasing CO 3 content, whereas substitution of PO 4 causes a systematic contraction in the a-axis and expansion in the c-axis with increasing CO 3 content (Elliott, 1994). Synthetic carbonated HAp have been classified as type A or type B depending on the mode of substitution, CO 3 -for-oh (type A), or CO 3 -for-po 4 (type B). In the type B substitution, sodium is thought to exchange for calcium in order to compensate for charge balance. In biological apatites, it is now generally accepted that CO predominantly replaces PO 4 groups (type B) (Figure 2.10). This type of substitution causes a decrease in the overall crystallite size, and an increase in crystal strain and solubility. The higher solubility of carbonate-containing apatite compared to carbonate-free apatite is partially due to the fact that the Ca-CO bonds are weaker than the Ca-PO 4 bonds, thus making the carbonated apatite far more susceptible to dissolution Page 18
35 (Elliott, 2002). The poorer fit of the carbonate in the lattice induces crystalline disorder, which generates a less stable and more acid-soluble apatite phase. Together with ion vacancies, CO 2 3 substitution is probably a major reason for the much higher solubility product of enamel compared with that of stoichiometric apatite. FLUORIDE Ca I Ca I PO 4 Ca II Ca II Ca I F Ca I PO 4 PO 4 Ca I Ca II Ca I Figure 2.11: HAp lattice showing substitution of OH by F. The closer fit of the fluoride ion in the Ca (II ) triangle has a stabilising effect to the crystal (Robinson et al., 2000, Bakaletz, 2004). Fluoride (F ) content is concentrated at the enamel surface, due to the accumulation of fluoride by the unerupted enamel, during development. In the lattice structure, F is thought to either fill a vacant OH site or displace OH ions (Figure 2.11) resulting in a contraction in the a-axis without changing the c-axis. If fluoride ions substitute completely for OH on the c-axis, they give rise to fluorapatite (Ca 10 (PO 4 ) 6 F 2, FAp). In this crystal lattice, F (ionic radius, 1.36 Å) is able to have a closer fit in the centre of Ca(II) triangle than OH (1.40 Å), due to its high charge density and symmetry. As a result, the substitution of F for OH brings about a reduction in the volume of the unit cell, the lattice becomes denser, and its chemical stability is greatly enhanced due to the electrostatic bond between fluoride and the adjacent ion (Aoba, 1997). Furthermore, the resulting crystallite sizes are bigger and the lattice energy is reduced. It is widely accepted that the Page 19
36 formation of fluoridated apatite phases increases the chemical stability and acidresistance of the tooth mineral. Featherstone and Nelson, (1980) reported that during apatite formation or remineralisation, the presence of fluoride compensates for the crystalline disorder induced by carbonate in the apatite lattice structure. METAL CATIONS Ca I Ca I PO 4 PO 4 Sr 2+ Pb 2+ Zn 2+ Ca I Ca II OH Ca II Mg PO 4 PO 4 Ca II Ca I Ca I Figure 2.12: HAp lattice showing possible positions of metal cation substitution (Robinson et al., 2000). The calcium sites (I and II) are considered as the most prevalent position for metal ion substitution, primarily due to the size of the available atomic spacing around the calcium ions. A variety of metal cations (Na 2+, K +, Mg 2+, Sr 2+, Ba 2+, Mn 2+, Zn 2+ and Pb 2+ ) are thought to substitute at the calcium sites (Figure 2.12). The lattice parameters are affected by both the ionic size, and, the amount of the substituting cations. The incorporation of magnesium, because of its charge density, has a destabilising effect on the apatite lattice. It is speculated that larger cations (e.g. Sr 2+ ) substitute preferentially for the Ca(I) position, since Ca(I) (coordination number = 9) site consumes more lattice volume than Ca (II) (coordination number = 7) site. The differences in Ca site coordination within the apatite structure will influence the substituting cation for exhibiting a preference of one site over another, albeit such preferences are not yet fully understood. Page 20
37 Chapter 3 k Hierarchies in Enamel Demineralisation 3.1 Dental Caries Dental caries is a multifactorial disease involving bacteria, salivary components and dietary sources of fermentable carbohydrates (Featherstone, 2008). Over time, the interaction between microorganisms existing in dental plaque and dietary fermentable carbohydrates produces organic acids that dissolve carbonated HAp in a process known as demineralisation (Robinson et al., 2000). All three types of dental tissues, i.e., enamel, dentine, and cementum can become affected. The disease develops beneath the bacteria-rich plaque and can build-up at sites where the saliva turnover is low or where oral surfaces cannot be cleaned adequately. Remineralisation is the reversal process, in which some of the mineral loss can be recovered to the molecular structure of the tooth from the ions in saliva. Cavities occur when the rate of demineralisation exceeds the rate of remineralisation, and may result in the lesion extending into the pulp. Any fermentable carbohydrates such as glucose, sucrose, fructose or cooked starch can be metabolised by acidogenic bacterium (e.g. mutans streptococci and lactobacilli) with the evolution of organic acids (e.g. acetic, lactic, propionic) as by-products (Featherstone, 1999). Page 21

38 a) b) Figure 3.1: Schematic representation of enamel rod microstructure of a) sound enamel b) demineralised enamel. The inward diffusion of these acids through the plaque and into the porous structure of enamel dissolves carbonated HAp crystals, which are more susceptible to dissolution. This causes the release of Ca 2+ and PO4 3 ions from the tooth structure out into plaque fluid and saliva (Figure 3.1a). If the demineralisation process continues with thousands of acidic challenges, the tooth gradually dissolves over an extended depth, while still maintaining it overall structural integrity. However over time, the dissolution of mineral can cause the enamel rods to lose its alignment, thus resulting in the overall structure to weaken and the remaining tissue to collapse resulting in the formation of a cavity (Figure 3.1b). Typically, a clinician would fix the cavity by drilling and filling rather than intervening therapeutically before the cavitation occurs, and while the demineralisation process is still reversible, or can be at least arrested Histological Features of a Carious Lesion The initial stages of an incipient carious lesion are characterised by a partial demineralisation of the enamel tissue. An extraordinary histological feature of the lesion is the presence of a relatively sound surface layer of enamel (2 50 µm thick) overlying the demineralised zone, which is where the bulk of the mineral loss occurs. Clinically, the lesion appears to the human eye as a white spot and is recognised as an early sign of dental caries, yet by this time the process has been going on for months (Featherstone, 2008). At this stage in the process, prior to Page 22

39 cavitation, therapeutic intervention can reverse or arrest the process by remineralisation (Featherstone, 2000). The histological changes in the enamel carious lesion have been categorised into zones that are in accordance to the porosity levels and amount of mineral lost. These zones are: translucent, dark, body of the lesion and surface (Figure 3.2). (Darling, 1956, Darling, 1961, Silverstone, 1968) Figure 3.2: shows an illustration of the four zones starting from the outer enamel surface layer towards the EDJ. These zones are: surface, body of the lesion, dark and translucent. TRANSLUCENT ZONE The first detectable carious changes in the enamel are in the translucent zone, and are thought to precede the formation of a surface layer. This zone shows the presence of a small number of relatively large pores, and accounts for approximately 1 2 % mineral loss, namely mineral that is abundant in carbonate and magnesium. DARK ZONE Similar to the translucent zone, the dark zone also shows porosity and mineral loss. Although, in the dark zone there is approximately 5 10 % loss of mineral and the Page 23
40 pore sizes appear to be smaller. This is a characteristic feature observed in this zone. It has been speculated that there are some remineralisation occurring in this region, which could be a possible explanation for the occlusion of some of the larger pores in the translucent zone. Therefore the dark zone could represent the region where both demineralisation and remineralisation occur. BODY OF THE LESION The body of the lesion is formed when there is continuous enlargement of the pores, which ultimately leads to the collapsing of the enamel structure. This is therefore the final stage of enamel destruction. SURFACE ZONE The surface zone (or layer) develops after the initial attack (in the translucent zone). It is the outermost layer in the lesion with a thickness of approximately 40 μm. The porosity of the surface zone is 1 2 % (similar to sound tissue), which is mainly due to the re-deposition of a fluoride-enriched mineral occurring after the initial dissolution of carbonate and magnesium components in the enamel surfaces. The accumulation of fluoride results in the surface to become more resistant to acid attack. Quite often, the surface zone is described as the relatively intact layer of enamel as less than 1 % mineral loss occurs in this region. The presence of the pellicle (organic material) on the enamel surface may act as a perm-selective barrier which reduces mineral loss at the surface (see Section 3.1.2). However, preferential demineralisation of deeper enamel layers can continue below the surface zone, resulting in the formation of a subsurface lesion. The diffusion of acids into the porous enamel microstructure to deeper more soluble layers would result in the removal of interior mineral in preference to the outer less soluble enamel tissue (Robinson et al., 2000). If the surface zone remains intact, than sub-surface remineralisation can be facilitated though this surface layer to deeper portions of the main body of the lesion. However, if this surface layer collapses, than there is a permanent loss in the enamel structural integrity (Figure 3.1b). Page 24

41 3.1.2 Role of the Dental Biofilm and Saliva The caries process occurs along the interface between the dental biofilm (acquired enamel pellicle and dental plaque) and the enamel surface. The enamel pellicle is a protein film layer (0.1 1 μm in thickness) on the surfaces of teeth, and is developed as substances derived from saliva, such as statherins and proline-rich glycoproteins, bind selectively onto the surface (Hicks et al., 2003). Acquired enamel pellicle is evident within minutes after a tooth is cleaned. The pellicle layer has a protective function against caries by slowing the diffusion of calcium and phosphate ions away from the tooth surface (Hara et al., 2006). It also prevents the dehydration of oral tissues and provides a lubricating layer to allow for mastication. Late colonisers Early colonisers Salivary glycoprotein Tooth surface Acquired pellicle Figure 3.3: shows the tooth surface is covered by an acquired pellicle comprised of lipids and proteins, including salivary glycoprotein. Dental plaque develops on the pellicle (Bakaletz, 2004). The proteins in the pellicle layer allow bacterial adhesion, thereby providing a base for the subsequent development of dental plaque, which is composed of Page 25
42 predominantly microorganisms and extracellular matrix (Marsh, 2004). Thus the pellicle acts as an important interface between bacteria and the tooth surface (Figure 3.3). Several different types of bacteria may colonise in the pellicle layer to synthesise proteins that result in a sticky environment, which facilitates the attachment of more bacteria to the initial colonies. As the primary colonisers begin to divide and multiply the amount of plaque on the teeth increases. This process of plaque formation can take between several days to weeks. In a healthy oral environment that is not undergoing an acid challenge, the plaque fluid and saliva are saturated with respect to enamel. In saliva, Ca 2+ and PO 3-4 are held in a supersaturated state by statherins, which complex Ca 2+ and hold it in solution in a readily available reversible fashion. Statherins and proline-rich proteins also inhibit crystal growth of CaP salts from supersaturated solutions (Lamkin and Oppenheim, 1993). During an acid challenge, the ph of plaque fluid and saliva decreases below the critical ph ( ) (i.e. the ph at which the oral fluids are just saturated with respect to tooth enamel) resulting in the undersaturation of oral fluids which promotes the dissolution of enamel. The critical ph does not have a fixed value, but in fact may vary over a wide range, and is dependent on the concentrations of Ca 2+ and PO 3 4 ions in the solution (Dawes, 2003). The duration of the demineralisation process is dependent on the time required for the saliva and plaque fluid ph to rise above the lowered ph. This is governed primarily by the amount and composition of saliva. As dental plaque is in direct contact to the tooth surface, it can restrict the access of salivary fluids to enamel (Garcia-Godoy and Hicks, 2008). Therefore, the saturation level in plaque fluid is important, especially since the plaque fluid loses its saturation more rapidly in response to sucrose exposure. Frequent exposures to sucrose causes the ph of the dental plaque fluid to fluctuate up and down repeatedly, which can quickly deplete Ca 2+ and PO 3 4 reservoirs in plaque. This is perhaps why the frequency of sugar intake is considered more destructive than total sugar consumption as a contributing factor in caries. Page 26
43 3.2 Dissolution Mechanisms at the Molecular Level Despite the substantial body of work over the last four decades, there is still no clear consensus regarding the dissolution mechanism of dental enamel. Recently, Dorozhkin reviewed the literature on the various mechanisms involved in enamel demineralisation, yet none of the described mechanisms were able to provide a general answer for how this process occurs (Dorozhkin, 2012), rather provided clues which helps to explain this phenomena Thermodynamic Solubility Principle Hydroxyapatite is a crystal in which the nature of the bonds is mostly of an ionic character, although the P O bonds in the orthophosphates groups are of a covalent nature (Williams and Elliott, 1989). By dissolution, it is simply meant that the ions lose their ordered arrangement that is characteristic of the solid mineral phase to become free in aqueous solution. When HAp is in contact with water, the following reaction occurs: [(Ca 10 (PO 4 ) 6 (OH) 2 ] (s) 10Ca 2+ aq + 6PO 4 3 (aq) + 2OH (aq) [3.1] Water molecules are responsible for disrupting the crystal lattice bonds. Because of its high dielectric constant, water can decrease the attractive forces between positive and negative ions that prevent the apatite crystal from dissolving. At the crystal surface, water can reduce the attractive forces between ions, increasing their inherent tendency to escape by thermal agitation. Also, hydration of the ions in solution facilitates the process energetically. A small amount of HAp dissolves, releasing Ca 2+ 3, PO 4 and OH ions. This process continues until equilibrium is established for HAp, and the rate of the forward reaction (dissolution) is equal to the rate of the backward reaction (precipitation). Thus a saturated solution is in a state of dynamic equilibrium between the dissolved, dissociated, ionic compound and the undissolved solid (Equation 3.1). Solubility product constants are used to describe saturated solutions of ionic compounds of relatively low solubility. The solubility of HAp is characterised by its Page 27
44 solubility product constant, which is calculated from the solubility of each ion i.e. Ksp = [Ca 2+ ][PO 3 4 ][OH ] (mol 9 /L 9 ). The more a substance dissolves the higher the Ksp value it possesses. For HAp, the measured value of Ksp is very small (on the order of ). For dental enamel, a calculation for the Ksp is more complex because of the various impurities in the apatite structure, and several approximations exist to represent its chemical formula (Ca 5-x-y (HPO 4 ) v (CO 3 ) w (PO 4 ) 3- x(oh) 1-x-2y, 0 x 2, y (1 - x/2) and v + w = x) (Elliott, 1994). Assigning a single number to the solubility product constant would therefore be misleading as each region in the enamel structure has a spectrum of solubilities. Indeed, it is widely accepted that ionic substitutions that disrupt the crystal lattice structure or induce strain (e.g. CO 2 3 ) (Pan and Darvell, 2010) will increase the Ksp, whereas those that do the opposite (e.g. F ) will decrease the Ksp (Aoba, 2004). Based on the Ca 2+, PO 3 4 and OH concentrations in a solution, such as saliva and plaque fluid, the ion activity product (I HAp ) is determined by the product of the concentrations of the component ions, raised to the appropriate power (Equation 3.2) where {} indicate activities (Shellis and Wilson, 2004). I HAp ={Ca 2+ } 5 {PO 4 3 } 3 {OH } [3.2] If the IAP = Ksp, the solution is just saturated with respect to HAp. If the IAP > Ksp, the solution is supersaturated and remineralisation is favoured. If IAP < Ksp, the solution is unsaturated and demineralisation is favoured. In acid dissolution, H + removes OH ions already in the bulk solution to form H 2 O. The product of [H + ][OH ] in water always equals (mol/l). Therefore, as the [H + ] increases in an acid solution, the [OH ] must decrease in a reciprocal manner. The concentration of PO 3 4 is also reduced in acid. Although the Ca 2+ concentration is unaffected, the concentrations of both OH and PO 3 4 are reduced and so, therefore, is the IAP, often to a value less than the Ksp Chemical Attack According to the theory mentioned above, the dissolution of HAp is governed by a response to a shift in relevant ion concentrations in solution. A mechanism based Page 28
45 on the direct attack of H + as the primary crystal lattice-disrupting agent, rather than water molecules, has also been proposed. According to this theory, H + in solution acts directly at the apatite crystal surface and react with PO 3 4 and OH. The conversion to HPO 2 4 and H 2 O causes a disruption of lattice bonds and release of ions into solution (Equation 3.3): [(Ca 10 (PO 4 ) 6 (OH) 2 ] (s) 10Ca 2+ (aq) + H 2 PO 4 (aq) + H 2 O (aq) [3.3] In principle, the phosphate ion is probably the most important component of HAp both inside and outside the lattice. Its state of protonation significantly affects the stability and/or dissolution of the crystal (Robinson et al., 1995). With a decrease in ph, some of the PO 3 4 ions, most likely those situated at the accessible surfaces of the crystals, becomes protonated to form HPO 2 4. This renders the mineral s surface to adopt properties of the more soluble calcium phosphate phase, DCPD (CaHPO 4.2H 2 O) (see Figure 2.1 which shows that DCPD is the least stable CaP phase above ph 6.0). Furthermore, the Ca 2+ in the lattice structure are held in place by the PO 3 4 ions, and the conversion of some PO 3 4 to HPO 2 4 will weaken this bond to result in some Ca 2+ release from the apatite structure. This will further promote solubility characteristics of DCPD and dissolution of mineral. Protonation of some of the OH ions to H 2 O has minimal effect on the nature of the lattice since the OH ion is a small and not such an integral part of the structure. In demineralising enamel, the release of HPO 2 4 outside the crystallite lattice into the aqueous phase of the porous enamel can have a somewhat of a protective effect against demineralisation. With a decrease in ph, the PO 3 4 groups will be increasingly present as the doubly protonated form (H 2 PO 4 ), which will act to buffer the solution and slow down the rate that the ph falls within the lesion. Page 29

46 3.2.3 Diffusion and Surface-Controlled Processes Figure 3.4: The dissolution process according to the reaction-diffusion theory. A modification of the above concepts proposes that the reaction of H +, OH and PO 3-4 ions occurs in a diffusion layer surrounding the crystal, rather than in the bulk solution. This model assumes that the enamel surface exposed to the solution is Ca 10 (PO 4 ) 6 (OH) 2, and the solution immediately adjacent to the interface is in equilibrium with HAp phase. In the diffusion-controlled theory, crystals are considered to dissolve by the building units and their subsequent transfer into the bulk solution (Figure 3.4). The reaction rates are diffusion-controlled and is dependent on the transport rates of chemical reagents (H + and anions of acids) from solution towards the HAp crystal surface across a diffusion layer, and, the transport of the dissolution products away from the HAp crystal surface and out of the diffusion layer to the bulk solution (Ca 2+ and PO 3 4 ). The rate of transport depends on the concentration difference between the crystal surface and the bulk solution. In the surface-controlled theory, the kinetics of the chemical transformations on the surface is the rate-limiting factor. Since the dissolution process takes place in two steps: 1) de-attachment of ions from the crystal surface and 2) transport into the bulk solution, means that if step 1 is rate-controlling, the ph of the solution would be an important factor to consider, especially if the de-attachment of ions from the crystal surface does involve H + attack. In contrast, the degree of undersaturation would play an important role if step 2 is rate-controlling, whereby a greater degree of undersaturation would allow for faster transport of ions from the saturated solution at the crystal surface to the Page 30
47 bulk solution. Whether the dissolution is surface-controlled or diffusion-controlled is dependent on various experimental parameters, some of which include ph, ionic strength, solution undersaturation, and temperature and crystal surface area. Earlier studies, for example White and Nancollas, (1977) and Higuchi et al., (1965), describe the dissolution of HAp as a diffusion-controlled process. Other more recent studies suggest that the dissolution of HAp is not limited purely by diffusion and that surface processes play an important role in controlling the overall reaction kinetics (Anderson et al., 2004). Page 31
.")
.")
48 3.3 Ultrastructural Aspects in Demineralisation Studies at the crystal structure level using high-resolution microscopic technologies show evidence for the development of tiny holes (etch pits) in the central region of the enamel rods during the initial stages of enamel dissolution (Featherstone et al., 1979, Takuma, 1980). Many studies have observed the preferential dissolution of enamel crystallites in the central rod areas to proceed with the formation of holes with approximately hexagon symmetry (Simmelink et al., 1974, Yanagisawa and Miake, 2003). Prolonged treatments of enamel to acid results in the hollowing of the enamel rod structure (Poole and Johnson, 1967), revealing the keyhole shape of a rod which is comprised of rounded heads and narrow tails (described in section 2.3.1). basal face Prism face Figure 3.5: Schematic representation of the initial dissolution of an hexagonal HAp crystallite, adapted from (Arends and Jongebloed, 1979). The prism and basal planes are indicated. Initial etch pit formation occurs followed by the removal of the centre of crystal parallel to the c-axis. Arends and Jongebloed (1979), showed that the dissolution of synthetic HAp behaves in a similar way. Figure 3.5 shows a schematic representation of the typical behaviour for dissolution of an hexagonal HAp crystallite. The initial attack of an acid on a HAp single crystallite is extremely anisotropic, beginning with one etch pit in the basal plane (Figure 3.5) at the crystallite ends, which is the preferred dissolution spot or active site. Subsequently, the acid forms a longitudinal hole parallel to the c-axis (Jongebloed et al., 1974). The prism faces of the crystallites are Page 32
 image showing central perforation of enamel. Figure 3.")
49 less susceptible to acid attack. Figure 3.6 is a Transmission Electron Microscopy (TEM) image showing central perforation of enamel. Figure 3.6: TEM image of enamel crystal showing dissolution at the centre of the crystal (Yanagisawa and Miake, 2003) Additionally, a narrow band of crystallites at the periphery of rods are seen to be resistant to further acid attack, and are somewhat larger and more equilaterally hexagonal than the crystallites within the bodies of the rods. An important question is - what controls this dissolution mechanism? One explanation is that in the central part of the rod heads, the enamel crystallites lie predominantly parallel to the c- axis, whereas in the peripheral region and the in the tail, the crystallites are inclined away from the long c-axis of the rod (Figure 3.7) (Poole and Johnson, 1967, Johnson et al., 1971). Thus this dissolution phenomenon is probably a combined effect of greater chemical reactivity on the c-axis (i.e. the longest direction of the crystallite) than perpendicular to it, and also the fact the external crystallite is coated with a protecting layer of organic matter or a fluoridated apatite phase. It is also a possibility that the crystallites in the rod centre are chemically different from the bulk, however there has been no real direct evidence for this. Some authors suggest that the rapidly crystallised interior of the crystals is less perfectly Page 33

. The crystallites themselves are separated by small amounts of inter-crystalline space that are filled with some sort of organic matter.")
50 formed than its slowly crystallised exterior, and this could explain the increased central solubility (Scott et al., 1974). This is a sensible suggestion as natural minerals contain variations in solubility due to different rates in formation, and this could also apply to enamel crystals. The first nuclei of mineral produced most likely contain inclusions such as HPO 2 4, CO 2 3 and H 2 O, and possibly the basis for crystal lattice dislocations that are present at the central core (Ingram, 1979). The crystallites themselves are separated by small amounts of inter-crystalline space that are filled with some sort of organic matter. The space between crystallites varies between 16 and 40 Å, and this space can also be considered a pathway for diffusion. TEM studies reveal the central portion of the crystallite is lost within a few minutes after an acid treatment, whereas the periphery of the needles has a considerable resistance against acid attack. Johnson et al. (1971) reported intercrystalline penetration of the acid between crystallites in one rod, resulting in narrowing clefts in particular near rod junctions. Interestingly, synthetic HAp crystals exhibited the same type of effect. Therefore, this phenomenon cannot be attributed solely to the organic and fluoride coatings on the crystallites. Figure 3.7: Demineralisation of dental enamel rods at the cores and walls; a) well-organised rod structures on enamel surfaces showing numerous needle-like apatites. The crystallites in the cores are orientated perpendicular to the surface while those on the walls are inclined ; b) Enlargement of the rectangular area of wall in (a) (Wang et al., 2005) Atomic-Level Structural Defects The surface irregularities (e.g. steps, missing ions, and dislocation outlets) of apatite crystals and structural defects inside the bulk crystals (e.g. dislocations) are Page 34
.")
51 important when explaining demineralisation processes at the fundamental level. Many authors have shown that the presence of dislocations in the enamel apatite crystal plays an imperative role in its dissolution (Arends, 1973, Voegel and Frank, 1977). Dislocations are lattice imperfections on an atomic scale and are thought to be the starting-points of acid dissolution, proceeding along dislocation-lines, sometimes inducing a splitting of the crystals. The occurrence of dislocations in a material generally increases the chemical reactivity at the point where the dislocation line emerges from the surface (active sites). Dislocations in apatite, preferentially parallel to the c-axis, are likely to be a predominant reason for the development of central core lesions during enamel dissolution (Figure 3.8) (Jongebloed et al., 1973). Figure 3.8: SEM images show demineralisation initiated at the core/wall of rods and development aniscotropically along the c-axis, with dissolution time a) 27 h; b) 40 h; c) 55 h and d) 120 h (Wang et al., 2005). A dislocation can be defined with the aid of a Burgers circuit. This is any atom-toatom path made in a crystal that forms a closed loop. In an ideal dislocation-free crystal, the vector to complete the circuit is zero. However, if the Burgers circuit Page 35

52 encloses a dislocation, the closure-failure is the so-called Burgers vector b (Figure 3.9). atom b Dislocation Line Figure 3.9: Schematic representation of a screw dislocation. The Burgers vector b and the Burger circuit is indicated. The dashed circle represents the centre of the active site. The angle between b and the dislocation line determines the dislocation type. If b is parallel to the dislocation line, it is a screw dislocation whereas if b is perpendicular than it is an edge dislocation. Figure 3.10: TEM image of enamel showing screw dislocation. The crystal lattice is split into two (arrow) (Yanagisawa and Miake, 2003). Based on energy considerations, screw dislocations with b parallel to the c-axis are more favourable in apatites (Figure 3.10), and each dislocation outlet is reported to Page 36
 the hexagonal dissolution steps; 2) the formation of etch pits; 3) the dissolution of the core following precise crystallographic planes; 4) the")
53 be a hollow core with radius within Å (Arends and Jongebloed, 1977). The evidence for the presence of dislocations are: 1) the hexagonal dissolution steps; 2) the formation of etch pits; 3) the dissolution of the core following precise crystallographic planes; 4) the screw character of the defect and 5) blocking (poisoning) of the active site can be achieved at inhibitor concentrations that are far too low to cover the complete surface (Arends and Jongebloed, 1979). Figure 3.11: TEM image of a cross-section of an enamel crystal c-axis. It shows an elongated hexagonal configuration with three sets of lattice striations (interval 8.17 Å) intersecting at 60 angles. A central dark line (arrow) with many white spots (arrowhead) in its vicinity is observable (Yanagisawa and Miake, 2003). The presence of carbonate in the apatite lattice is thought to generate a local strain field around the dislocation line (Cabrera and Levine, 1956). Carbonate-rich HAp can strongly increase the Burgers vector compared to low-carbonate HAp (Arends and Jongebloed, 1979). The observation of a central dark line running through the length of apatite crystals in the direction of the c-axis (Figure 3.11) has been associated with the preferential dissolution of this part of crystal, which has been considered to be an area of particular strain, possibly due to the increase in CO 3 content (Marshall and Lawless, 1981). Cabrera and Levine (1956) demonstrated that in dislocation with a large Burgers vector, the reduction in strain energy that is obtained by the removal of material (to Page 37
54 form a hollow tube along the dislocation line) most probably outweighs the energy to create the tube surface. The hollow-core diameter has been calculated to be in the order of nm if the burgers vector is large (Arends and Jongebloed, 1977). The term hollow-core does not imply that there is no material in the core, and is most likely to consist of loosely bound and highly reactive apatite material. Around the point of where a dislocation emerges from the surface, a few ions are shifted from their original positions of minimum energy and therefore are considerably more susceptible to chemical attack than the rest of the surface. Cabrera and Levine (1956), described dislocations as regions of undersaturation and, thus, dissolution is preferential at dislocations relative to the perfect lattice. If the undersaturation exceeded some critical value (ΔG crit ), they showed that the strain field of the dislocation would open up the hollow core to form an etch pit. However if the undersaturation was low (i.e ΔG < ΔG crit ), etch pits would not open up and defect sites will not lead to stepwaves forming from the localised etch pit. The result is a slow dissolution rate (e.g. spiral dissolution). A main consequence for the presence of dislocations is that the transport and diffusion along the dislocation line, where the orderliness is slightly disturbed, is much faster and easier than in the bulk material, and therefore preferential dissolution is likely to occur in this region. The velocity with which the dislocation(s) are etched out should be considered when explaining demineralisation at this level Polynuclear Model Christoffersen et al., (1978) used constant composition (CC) techniques, by which the undersaturation is maintained at pre-determined levels, to study the rate of HAp crystal dissolution. They showed that the transport of material between the volume adjacent to the crystal surface and the bulk solution always took place, which is associated with the dissolving HAp crystals and the sedimentation by convective diffusion (Christoffersen and Christoffersen, 1984). The rate of dissolution at ph 7 was explained by a polynuclear model together with a surface free energy. This involves the detachment of material from the crystal surface, Page 38
55 which forms a microscopic hole with a depth equivalent to the diameter of an ion in the crystal surface, otherwise known as the dissolution nuclei, i.e. collections of vacant sites for Ca 2+, PO 3 4 and OH ions. If the rate of formation of dissolution nuclei is low and the crystal surface is small, each nucleus may spread over the entire surface on which the nucleus is formed. The driving force for the formation of a dissolution nuclei is the increase in the Gibbs free energy of the system, whereby the holes must be bigger than the critical size in order for growth. Page 39
56 3.4 Dissolution Phenomenon at the Nano-scale Earlier studies on dissolution pit formation and growth were investigated when their dimensions were at the very least µm and larger, as smaller dimensions of pits were out of range for old microscopes, thus the initial stages of etch pit formation was unclear for a long time. However, recent studies using atomic force microscopy (AFM) and related technologies provide new information on dissolution pits at the nano-level. Historically, the science of crystal growth has made more progress than that of crystal dissolution. The general mechanism involved in crystal growth is related to the generation of growth steps that can advance, resulting in overall crystal growth. More recent studies present a concept in which the crystal dissolution process is analogous to crystal growth, and here the formation and growth of pits are the principle elements of the dissolution process of sparingly soluble calcium phosphates (Wang and Nancollas, 2008). In this concept, the dissolution process is induced by the formation of these pits, and continues with spreading of their stepwaves. These pits are thought to provide dissolution sites, and it is the steps within these pits that act as the dislocation lines, with the spreading of their stepwaves contributing to the overall dissolution reaction (Tang et al., 2004a). Thus the entire reaction proceeds via nucleation and growth of the pits accompanying step flow. The presence of dislocations accelerates the dissolution process, because dislocations give rise to continuous steps on the surface and the strain they cause in crystals favours the etch pit formation. The authors of these studies believe that the microscopic critical size effects should be embodied in any macroscopic dissolution model under similar experimental conditions. Although this theory is widely accepted in the geological and mineralogy field, it is not well established in dental research Critical Conditions Similar principles of critical conditions in crystal growth mechanisms have been applied to the dissolution pit process. In crystallisation theories, the spreading of dislocation steps from two-dimensional growth nuclei on a crystal surface does not Page 40

57 occur spontaneously but until the nucleus reaches a critical value, r*, or the driving force (supersaturation) is sufficiently large (see Section 4.2.2). Similarly, the pit dissolution mechanism has been viewed analogous to that of crystal growth, taking into consideration certain particle-size-dependent critical conditions of energetic control at the molecular level that must be attained in order for dissolution to occur (Tang et al., 2003c). CRITICAL PIT SIZE A critical pit size or radius (r*) must be attained on the crystallite surface in order for the two-dimensional pit/dissolution step to be a spontaneous process. The spreading of stepwaves within the pits only occurs when the pit size is greater than the critical value, r*: r* = Ƴ SL 2Ω / G G = ktlns [3.4] where Ƴ SL is interfacial tension, k the Boltzmann constant, T the absolute temperature, Ω the area occupied by each dissolution unit and G the Gibbs free energy for dissolution (Tang et al., 2001) min Figure 3.12: AFM movie frames of brushite dissolution on (010) surfaces. The significant developments are only observed for the larger pit steps. The smaller ones are almost stationary (pit 1) in comparison with the larger pits (pit 2). Some of the small pits disappear (pit 3). The scale of the images is 5 µm (Tang et al., 2004a). Critical dissolution behaviour was only observed when the magnitude of pit size is greater than about 20r*. Further, only larger pits are active and contribute to the dissolution process, i.e. of size greater than r*. Smaller pit sizes existing on the Page 41
58 crystal surface are almost stationary making minute contributions, and are likely to be removed from the dissolving surface by other, active, dissolution steps stemming from neighbouring larger pits. Figure 3.12 illustrates the dissolution of brushite (010 face), close to equilibrium, proceeds by the initiation and growth of pits, where only the spreading of large pit steps (> µm) contribute to the process. The spreading velocity of the dissolution steps is also a function of step sizes, where the movement of steps decreases with decreasing pit sizes. SURFACE TENSION Interfacial free energies (surface tension) are considered an important parameter in crystal nucleation and growth (see Section 4.2.1), however are often ignored in demineralisation models. Recent studies by Nancollas and co-workers demonstrate that the critical pit size is proportional to the surface energy (Equation 3.4) (Wu and Nancollas, 1999). There is a close relationship between solubility and the surface tension. During dissolution, an interface is formed between the solid and aqueous phase where the neighbouring ions on the surface escape into the bulk solution (see section 3.2.3). Higher values of interfacial energies bring about a greater difficulty in forming such an interface between solid and liquid phase. For example, the thermodynamically more stable calcium phosphate phases such as OCP and HAp have much higher values of Ƴ SL compared to the more soluble DCPD, which has a low Ƴ SL. Surface tension plays an important role in dissolution as the initial pit formation results in an increase in the surface energy. Pit formation on a smooth crystal surface causes the surface to become rougher resulting in an increase in the crystal/solution interfacial area and thus the surface energy. The critical conditions are directly related to Ƴ SL, which for soluble salts, is much smaller, resulting in a much smaller r* (usually in the order of a few nanometers), even at low undersaturation (Wu and Nancollas, 1998) Self-Inhibition at the Nano-scale Using constant-composition (CC) methods, Nancollas and co-workers demonstrated that the dissolution rates of DCPD seeds decreased considerably with time and the Page 42
59 reaction was effectively suppressed, even though the solutions remained undersaturated (Tang et al., 2004b). Further, the sizes of DCPD seeds (8-12 µm) were substantially reduced during dissolution. However quite remarkably, when the sizes of pits and crystallites were about the same order of magnitude, further pit development becomes limited by the crystallite sizes, resulting in decreases in pit density and size which ultimately decreases the dissolution rate (Tang et al., 2003c). This dissolution phenomenon demonstrates self-inhibition, i.e. when the size of the crystallites is reduced to the same order of magnitude as the pit size always at the nano-scale, there are no active pits present on the surface. When the particle size approaches the critical value, it is difficult for any existing pits on the crystal surface to contribute to dissolution since their displacement rates are extremely slow. In such conditions, the pits are unstable and the creation of new active pits is difficult. At this point, the remaining solid residues are dynamically stabilised in the undersaturated solutions, and only if sufficient time is allowed can dissolution resume. Further, it was confirmed by SEM imaging that the remaining dissolution residues all had nano-sized distributions, even though the initial seed crystals used were not uniform in size. This dissolution suppression phenomenon was also observed with β-tcp, OCP and carbonated apatites (Tang et al., 2003b, Tang et al., 2003a) Enamel Preservation at the Nano-scale The self-inhibition phenomenon of dissolution at the nano-scale was also observed in the in vitro demineralisation of tooth enamel (Tang et al., 2005). Dissolution of enamel rod walls and cores at an intermediate stage of the dissolution process showed residues of apatite nanoparticles, nm in size, on both cores and walls (Figure 3.13). These nanoparticles were resistant to further dissolution during CC experiments (Tang et al., 2004c). Page 43

60 a) b) c) d) e) Figure 3.13: Demineralisation of dental enamel rods at the cores (orange) and walls (yellow). a) wellorganised rod structures on enamel surfaces showing numerous needle-like apatites. The crystallites in the cores are orientated perpendicular to the surface while those on the walls are inclined b) crystallites become smaller during dissolution and nano-sized apatite particles are formed on both walls and rods. c) the cores were emptied after 7 days of dissolution. d) nano-sized apatite particles were collected from the bulk solution after subjection to further dissolution. e) SEM of the wall at higher magnification show nano-sized apatite residues retained on the wall surfaces were protected against further dissolution. These studies demonstrate that the size of the apatite crystal give biominerals such as bone and teeth notable characteristics. The dissolution of crystallites may be inhibited or even suppressed when their sizes fall into the same range as that of a certain critical value always at the nano-scale. Thus as the mineral size falls below a critical length scale, the strength of a perfect mineral is maintained despite structural defects, and it seems that the weakening effect of structural flaws disappears and the crystals are preserved. This unusual dissolution phenomenon provides a very unique perspective to the more conventional understanding of biological demineralisation (Wang et al., 2005). Page 44
61 Chapter 4 k Fluoride & Enamel De- and Re-mineralisation 4.1 Remineralisation Remineralisation is an important natural repair process, countering cariogenic challenges, to maintain the balance between processes of enamel mineral loss and gain. In this process, partially dissolved crystals are induced to grow by deposition of calcium and phosphate ions from saliva. The driving force for the remineralisation or precipitation of any new solid phase is the degree of saturation of the fluid environment with respect to the enamel, i.e. the medium at the tooth-plaque interface must be saturated with respect to the tooth mineral (ten Cate, 1999). Fluoride promotes enamel remineralisation in demineralised areas, by driving the precipitation of fluoridated apatite from calcium and phosphates in saliva (Section 4.4). Page 45
62 4.2 Crystal Nucleation Nucleation and crystal growth are the two principle stages that take place in the precipitation of a salt. Figure 4.1 describes the overall process. Increase of salt concentration in the aqueous phase Supersaturation Supersaturation exceeds a critical value NO Stable supersaturated solution YES Crystal growth Secondary nucleation Formation of large crystals and particles Formation of supercritical nuclei, Crystallites Aggregation, Coagulation Figure 4.1: Schematic representation of the stages involved in the precipitation of solids from solutions. The formation of a new crystalline entity from a solution begins via the nucleation process. This is a series of atomic or molecular processes by which the atoms or molecules of a reactant phase rearrange into a nucleus of the product phase large enough to have the ability to grow irreversibly to a macroscopically larger size. A stable nucleus can only form from a solution that is supersaturated with respect to the ions in the crystal (i.e. the ionic product is greater than the solubility product for the given crystal). Supersaturation is defined as the difference in chemical potential between a molecule in solution and that in the bulk crystal phase: Δµ = µ s - µ c [4.1] where µ s is the chemical potential of a molecule in solution and µ c is the chemical potential of the molecule in the bulk crystal. When Δµ > 0 the solution is said to be Page 46
63 supersaturated, promoting nucleation and/or crystal growth, whereas when Δµ< 0 the solution will be undersaturated promoting dissolution. Salivary fluids are metastable or supersaturated with respect to HAp, providing a driving force for remineralisation (De Yoreo and Vekilov, 2003) Thermodynamics The thermodynamic driving force for the formation of a stable crystal nucleus is the free energy (ΔG V ) released by bond formation within the crystal lattice (bulk free energy). Opposing this is the energy required to create a solid/liquid interface (ΔG SL ). The greater the surface energy, the less stable is the forming cluster. Therefore, the driving force for crystal nucleation (ΔG N ) is the change in free energy associated with the energy released by the formation of lattice bonds, and, the energy adsorbed in the creation of a surface (Equation 4.2). ΔG N = ΔG SL ΔG V [4.2] The smaller the radius of a forming cluster, the bigger is its surface area relative to its volume. Therefore, a nucleus must attain a certain radius (critical nuclei size r*) before the free energy released by lattice bond formation can exceed that of the energy absorbed at the surface. Hence, the size of the nucleus will determine whether the new mineral will grow or dissolve. Clusters/embryos greater than the r* will tend to grow macroscopically, as additional increments release more energy. Embryos smaller than the critical size will dissolve. Thus the r* is the nucleation barrier that controls the probability of a nucleus forming, and can be viewed as the rate-limiting step in crystal formation (De Yoreo and Vekilov, 2003). Figure 4.2 shows the free energy of nucleation plotted as a function of nucleus size. Page 47
64 Figure 4.2: Free energy of nucleation (ΔG N resultant free energy) as a function of nuclei size Primary and Secondary Nucleation Nucleation is homogeneous, in the absence of foreign particles or crystals in the solution, or heterogeneous, in the presence of foreign particles in the solution. Both types of nucleation are collectively known as primary nucleation. The presence of a foreign substance decreases the surface free energy thus reducing the activation energy and r* (at constant supersaturation), making nucleation more favourable. A greater reduction in surface energy is observed when a good match between substrate and the crystallising substance is achieved. When nucleation is induced by the presence of crystals of the same substance, it is known as secondary nucleation. This mechanism is more favourable than primary nucleation and thus can occur at lower supersaturation. In enamel apatite nucleation, the partially demineralised enamel crystal acts as a template for remineralisation or accretion of new apatite lattice components (Larsen, 1986). Thus, the epitaxial growth of one calcium phosphate phase upon another plays an important role in the remineralisation of tooth components in vivo. Page 48
65 4.2.3 Calcium Phosphate Bulk Precipitation When the aqueous concentrations of calcium and phosphates are high, a number of calcium phosphates with variable stoichiometries of the constituent ions may form. The tendency for a particular calcium phosphate phase to form in aqueous supersaturated conditions may be determined from the solubility phase diagram in Figure 2.1. For example, low temperature and ph favours the formation of DCPD and OCP, whereas higher ph favours HAp. Depending on the solution ph and temperature, a number of calcium phosphate phases may initially form as metastable precursor phases, to ultimately transform into the thermodynamically more stable HAp. According to Ostwald s rule of stages, this predicts that the least stable phase having the highest solubility is formed preferentially during a stepwise precipitation process. Therefore, the likelihood of precipitation of a particular calcium phosphate phase is determined by the thermodynamic driving force, whereas kinetic factors are considered important in controlling the nature and characteristics of the solids formed (Valsami-Jones, 2004). Biomineralisation reactions of tooth enamel is believed to proceed through metastable precursor phases such as amorphous calcium phosphate (ACP) (LeGeros, 2001) or octacalcium phosphate (OCP), before conversion to the thermodynamically more stable apatite phase (Brown et al., 1987). The nucleation rate of OCP was shown to be theoretically faster than HAp, despite the solution being more saturated with respect to HAp. Studies carried out at physiological conditions suggest that the initial precipitation of OCP provides a scaffold for the nucleation of HAp, resulting in a lower energy barrier for HAp nucleation and in turn, quicker rate of its formation (Wang and Nancollas, 2008). 4.3 Crystal Growth Crystal growth theories are based on the considerations of surface structure. Essentially, the growth of crystals occurs via a series of processes by which an atom or a molecule is incorporated into the crystal surface, resulting in an increase in its size. These processes are either transport or surface controlled, and can be summarised into three steps (Figure 4.3): Page 49
66 1. transport of building blocks to the surface on crystal terraces (step 1) 2. adsorption at a step representing the emergence of a lattice dislocation at the crystal surface (step 2) 3. migration along the step, integration at a kink site on the step (step 3) 1 H K S 3 2 T Figure 4.3: Model to show the sequence of steps followed for the growth of crystals at a microscopic scale. K: kink, S: step, T: terrace (Valsami-Jones, 2004). These different steps usually occur in a series, whereby the slowest process will control the overall crystal growth. According to the Kossel model, a number of inhomogeneities are present on the crystal surface. These are flat terraces which are atomically smooth, steps which separate terraces and kink sites. Kinks are formed as a result of incomplete regions on steps, and are the sites with the lowest energy (highest binding energy) whereas terraces are sites of highest energy (lowest binding energies). Thus integration of growth units is most likely at kink sites. Also, molecules that attach at the kink site make more bonds to neighboring molecules than ones that attach to the terraces or to flat step edges, hence it is likely to stick. Broadly speaking, crystal faces that are atomically rough i.e. contain numerous kink sites, grow more rapidly (De Yoreo and Vekilov, 2003) Crystal Growth Accelerators Fluoride is a promoter of apatite crystal growth. During an acid challenge, the presence of low F concentrations in the oral fluids will ensure a concurrent Page 50
67 supersaturation with respect to FAp, theoretically in the ph range of , so that demineralisation of enamel apatite competes with simultaneous FAp formation (Larden and Thorsen, 1974). Hence, low levels of fluoride can accelerate remineralisation by driving the equilibrium for crystal growth of a fluoridated apatite mineral phase, whilst reducing net enamel demineralisation. It should be noted that carious enamel is more reactive with fluoride than sound enamel, as partially dissolved crystals act as nucleators for remineralisation. Fluoride accelerates the remineralisation process by adsorbing to the crystal surface and attracting calcium ions so that the newly acquired mineral is concentrated in fluoride and excludes carbonate (Featherstone, 2008). This F rich outer coating has a composition somewhere in between HAp and FAp, and therefore the crystals will behave like low solubility FAp rather than the high solubility carbonated HAp of the original crystal surface (Figure 4.4). Thus, subsequent acid challenges must be very strong and prolonged to dissolve the remineralised mineral (ten Cate and Featherstone, 1991, Takagi et al., 2000). Enamel crystal (carbonated HAp) Acid Partially dissolved crystal Ca 2+ + PO F - (remineralization) FAp-like coating on crystals Crystal nucleus Figure 4.4: Schematic diagram showing remineralisation of partially demineralised crystal leads to remineralised crystals with surfaces rich in fluoride and of low solubility. 4.4 Anti-Caries Agent The global decline in the prevalence of dental caries has been attributable to fluoride (F ) treatments, which is used as a key control for the prevention and development of the disease (Featherstone, 1999). Fluoride can be found in various forms and concentrations ranging from 0.5 to 1 ppm in drinking water (Rugg-Gunn Page 51
68 and Murray, 1981), ppm in dentifrices, ppm in mouthwashes, and >5000 ppm in gels and varnishes (Ripa, 1991). A whole range of fluoride delivery vehicles are available for inhibiting net enamel demineralisation, enhancing remineralisation and thus caries formation and development. The residual amount of F remaining in the mouth after rinsing with fluoride-containing product is approximately <10 % of what was originally in the product (Duckworth and Morgan, 1991). Recently, there is a perception that the more the better and thus a number of products incorporate very high levels of fluoride up to ppm F (Tavss et al., 1997). These products can provide short-term fluoride exposure such as fluoride-containing gels, and longer-term fluoride release and exposure, such as fluoride varnishes. Tooth restorative materials, in particular glass ionomer (polyalkenoate) cements, have properties that enable relatively long periods of fluoride release (ten Cate and Vanduinen, 1995, Mitra et al., 2011). As caries occurs at inaccessible stagnation sites where plaque removal is difficult, the penetration of fluoride through plaque is likely to be critical for preventing caries progression. In effect, current models for increasing the anticaries efficacy of fluoride now emphasise the importance of maintaining a cariostatic concentration of fluoride in the oral fluids, in particular the fluid phase of plaque (Arends and Christoffersen, 1990, ten Cate, 1997, Vogel, 2011). Many studies have shown the ability of low fluoride concentrations to protect enamel from demineralisation and enhance remineralisation. The ability of fluoride to remineralise subsurface lesions at plaque-fluid concentrations (1-5 ppm) under demineralising conditions was found by Lynch et al., (2006) Fluoride in the Apatite Lattice Structure In pure hydroxyapatite (Ca 10 (PO 4 ) 6 OH, HAp), the complete substitution of F for OH on the c-axis forms fluorapatite (Ca 10 (PO 4 ) 6 F 2, FAp). This replacement of OH (1.40 Å) by the smaller F (1.36 Å) forms a more stable crystal structure (section 2.3.4). In human enamel, such complete substitution is never achieved even in severely fluorosed enamel. However, the F OH exchange at the enamel surface-solution interface is thermodynamically favourable and occurs readily even at low fluoride Page 52
69 concentrations (de Leeuw, 2004). This would lead to the partial replacement of the hydroxyl positions by fluoride in the surface enamel to form fluorohydroxyapatite (Ca 10 (PO 4 ) 6 (OH) 2 -xfx, FHAp) i.e. a mineral phase with the degree of F substitution in the apatite mineral is less than that of FAp. The closer fit of F in the Ca (II) triangle results in a reduction in the volume and lattice energy of the unit cell, an increase in crystallinity, and a reduction in the solubility of fluoridated crystals. Moreno et al., (1974) investigated the solubility behaviour of HAp with various levels of fluoride substitution. They reported that the stability of the lattice structure was optimised at around 50 % substitution of OH groups with F, and that this apatite phase was less soluble than pure FAp (i.e. FHAp > FAp > HAp). At around this level of fluoride substitution in the hydroxyl column (approx. 50 %), hydrogen bonding between neighbouring F and OH ions are maximum, thus stabilising the lattice structure (Figure 4.5) (Van der Lugt et al., 1970). [0,0,z] OH F Ca(II) Figure 4.5: Schematic drawing of FHAp showing H-bonding between adjacent F - maximum with 50 % substitution of OH - by F - (Moreno et al., 1974). and OH - are at Page 53
70 4.4.2 Reaction Pathways of Fluoride Previous research has identified several reaction pathways for fluoride with calcium phosphate minerals in the teeth, some of which include: 1) Iso-ionic exchange of F with OH in the apatite: Ca 10 (PO 4 ) 6 OH 2 + 2F Ca 10 (PO 4 ) 6 F 2 + 2OH 2) Direct precipitation of FAp mineral from supersaturated solutions: 10Ca PO F Ca 10 (PO 4 ) 6 F 2 3) Demineralisation/recrystallisation of apatite mineral with F incorporation in the form of FAp or calcium fluoride (CaF 2 ): Ca 10 (PO 4 ) 6 OH F 10CaF 2 + 6PO OH Reaction 1 may occur via fluoride penetration into the interior of the apatite crystals, and conversion of the enamel crystallites to FAp or FHAp by solid-state diffusion. Because the two apatites types are iso-stuctural, the conversion of HAp to FAp requires the diffusion of F and OH ions through the solid (Aoba, 1997). Solidstate diffusion is known to be an extremely slow process under normal temperatures and pressures. Thus, during topical applications of fluoride, the conversion of enamel apatite to FAp probably does not occur to a significant extent beyond the surface of the crystallites. The formation of FAp might be enhanced by a recrystallisation process (reaction 2). Both reactions 1 and 2 may occur during long-term exposure to low F levels in the solution ( ppm). With increasing F concentrations an additional chemical reaction (reaction 3) with the formation of calcium fluoride (CaF 2 ) begins to dominate ( ppm). These concentrations are present in topicals, such as fluoride gels and varnishes or over the counter toothpastes and mouthrinses (Buzalaf, 2011). Page 54
71 4.4.3 Apatite Bound vs. Fluoride in Solution Although the anti-caries effectiveness of fluoride is well recognised, the dominant mechanism of action of fluoride is still a matter of controversy. From the 1940s to the 1970s, it was originally believed that the cariostatic mechanism of F relied mainly on the uptake of F during tooth development via systemic sources (e.g. ingestion of fluoride). This would promote the formation of FHAp at the enamel surface, and would therefore increase the resistance of the tooth to acid dissolution (Brown et al., 1977, Featherstone, 1999). In non-fluoridated areas, this is typically around 2000 ppm (6 % replacement of OH by F in surface enamel), and 3000 ppm (8 % replacement of OH by F in surface enamel) in fluoridated areas. However, these concentrations decline considerably after the first µm of the enamel surface enamel to around ppm (Isaac et al., 1958). More recent views are that fluoride incorporated developmentally into the normal tooth mineral is insufficient to have a measurable effect on acid solubility (ten Cate and Featherstone, 1991). Moreover, even high levels of incorporated F (e.g ppm) in the outer few micrometers of enamel are not directly responsible for the anti-caries effect of fluoride. In an oral human caries model, it was found that shark enamel consisting of almost pure FAp, had a limited resistance to acid attack. Conversely, fluoride in solution (NaF rinse) surrounding the apatite crystals exhibited a much higher degree of enamel protection (Øgaard et al., 1988). Even the presence of sub-ppm concentrations of F in solution surrounding enamel crystals can significantly protect dissolution of tooth mineral by acid (Yamazaki et al., 2007). Thus currently, the predominant caries-preventive mechanisms of action of F are thought to be post-eruptive through topical effects, including 1) inhibition of demineralisation and 2) enhancement of remineralisation at the crystal surfaces. These topical sources of F include drinking water, milk and oral-healthcare products. However, this concept does not invalidate that F rich mineral is still considerably more resistant to demineralisation than F deficient mineral. It has been reported that apatically bound F in the lesion area can result in the following effects (Chow, 1990): Page 55
72 reduction of tooth mineral solubility reduction of mineral diffusion from lesion interactions between structurally bound and ambient fluoride Oral Fluoride Reservoirs It is now widely believed that small but protracted elevations of oral fluoride concentrations are the predominant means by which fluoride exerts its anticaries effects. Typically, fluoride pharmacokinetic studies have focused on fluoride disposition in saliva, whole plaque and plaque fluid. Since caries initiation progresses beneath a layer of cariogenic plaque, it is the fluoride concentration in plaque, and specifically the plaque fluid (i.e. the extracellular phase of plaque in intimate contact with the tooth surface) that has the major influence on de- and remineralisation. However, it is important to consider the route that fluoride follows from toothpaste to this plaque fluid. Duckworth and Morgan (1991) found that following a single brushing with F toothpaste, the salivary fluoride level decreased in two distinct phases. There was an initial rapid phase (40-80 minutes) followed by a slow phase that lasted for several hours, during which fluoride concentrations remained elevated compared with baseline concentrations. It was thought that this bimodal clearance behaviour was the result of rapid clearance of the so-called loosely-bound fluoride followed by slow but sustained release of fluoride from an oral reservoir, and that repeated regular brushing led to elevated baseline fluoride concentrations. Zero et al., (1992) proposed that the oral mucosal tissues are the major oral fluoride reservoir. They reported that the salivary fluoride concentrations following applications from toothpaste were, if anything, higher in edentulous subjects, when compared to dentate subjects, suggesting that the teeth play only a minor role. A likely explanation lies in the findings of Collins and Dawes (1987), who measured the relative surface area of teeth and oral mucosa in the mouth. The total surface area of the oral mucosal tissues was substantially greater than surface area of teeth. However, as stated above, it is the fluoride concentration in plaque fluid that ultimately influences caries. While only a small amount of fluoride is delivered Page 56
73 directly to the plaque during application (Watson et al., 2005), data from intra-oral studies, where the enamel insert was removed from the mouth during brushing with F toothpaste and yet still underwent substantial remineralisation, suggest that the residual concentrations of fluoride in saliva are responsible for elevated concentrations of fluoride in plaque and subsequent fluoride efficacy (Zero et al., 2014, Lynch, 2014; Personal Communication). This proposition is supported by the observation that fluoride concentration in plaque fluid and saliva correlate well. Broadly speaking, there appear to be two types of plaque fluoride reservoir: 1) mineral deposits, in particular CaF 2 or CaF 2 -like deposits; 2) bacterially bound calcium-fluoride (Ca-F) deposits. There seem to be two schools of thoughts concerning the potential role of CaF 2 ; 1) CaF 2 deposits formed on the surface of teeth and within plaque serves as a potential F reservoir for FAp formation; 2) CaF 2 is an undesirable labile form of fluoride with reduced efficacy for caries prevention. The stability of CaF 2 has long been a matter of debate. Under cariogenic conditions, CaF 2 solubility is not influenced by ph to any meaningful degree, unlike HAp and FAp, whose solubility s are strongly ph dependent. This would suggest that CaF 2 is an effective cariostatic agent as CaF 2 could act as a protective barrier on enamel surfaces. However, since caries formation is a slow and gradual process, enamel must be protected continuously against demineralisation and CaF 2 is speculated to be far more soluble under normal oral ph conditions. Based on the free calcium ion concentration in the resting oral fluids, Vogel (2011), suggested that, theoretically, CaF 2 deposits should dissolve rapidly in oral fluids within a short period after the topical applications of a fluoride dentifrice (Larsen and Pearce, 2003). Further, Vogel et al. (2010) demonstrated that CaF 2 -like deposits did not form in plaque following applications of a sodium fluoride mouthrinse (228 ppm [F ]), and if formed they were rapidly lost. More recently, it was reported that a calcium rinse used before a fluoride rinse would induce the formation of CaF 2 -like deposits in human dental plaque (Vogel et al., 2014). Therefore, increasing the calcium concentration in plaque can enhance the formation of CaF 2 -like deposits. From the aforementioned studies, it seems rather unlikely that calcium fluoride Page 57
74 deposits forms from a standard fluoride 1400 ppm toothpaste, but would be more likely to form from high fluoride containing dentifrices like fluoride gels and varnishes. The retention of CaF 2 is probably far shorter than the average time required for the development of caries and one view is that the protection provided by CaF 2 is short-term with limited effectiveness (Gron, 1977). Further, the release of F from CaF 2 reservoirs during an acid challenge is also questionable as CaF 2 is quite stable at low ph. It is widely accepted that fluoride ions in solution surrounding enamel provides substantial protection against dissolution (see section 3.3.3). The term calcium-fluoride-like is used to describe CaF 2 containing phosphates, not only on the surface, but also inside the crystal which is thought to improve its durability (Øgaard, 2001). Further, these phosphate-containing CaF 2 is speculated to be far more soluble than pure CaF 2, and to release fluoride at a moderately rapid rate than pure CaF 2 at low ph conditions. In fact many studies propose that CaF 2 - like deposits are the most labile source of fluoride and may act as a ph-controlled reservoir for fluoride (Larsen and Ravnholt, 1994). A model proposed by Rose and co-workers (1996) described biological reservoirs of fluoride, in which F is held to bacteria or bacterial fragments via Ca-F bonds. An important feature of this model is that fluoride breaks the bi-dentate inter- and intracellular bonds between calcium and bacteria. The addition of F was seen to break calcium bonds and expose new binding sites resulting in an increase in F and Ca 2+ uptake. It was demonstrated that the bacterial Ca-F binding was quite unlike the binding of fluoride by the mineral deposits. This was a continuous function of the [Ca 2+ ] and [F - ] which is also dependent on the number of binding sites on the bacteria and ph. At low ph, the increase in H + displaces Ca 2+ and F - which in turn releases fluoride ions into the oral fluids. Page 58
75 Chapter 5 k Zinc Interactions with Dental Enamel and HAp 5.1 Introduction Zinc salts are commonly formulated into oral health products as a key active ingredient for reducing malodour, and controlling plaque and calculus formation (Harrap et al., 1983, Phan et al., 2004). Oral malodour (halitosis) arises from bacterial metabolism of proteins in saliva, sloughed oral tissue and food debris which results in the formation of amines, alcohol and particularly volatile sulphur compounds such as hydrogen sulfide (H 2 S) (Young et al., 2001, Young et al., 2003). Zinc salts are extremely effective in reducing H 2 S through chemical neutralisation (Bradshaw et al., 1993). The antibacterial action of zinc salts is due to their ability to inhibit bacteria adhesion, metabolic activity and growth (Saxton et al., 1986, Young et al., 2003, Fedorowicz et al., 2008). Additionally, zinc is known to inhibit the crystal-growth of hydroxyapatite (HAp) and its precursors dicalcium phosphate dihydrate (DCPD) and octacalcium phosphate (OCP) (Chow and Eanes, 2001). This ability of zinc to modify the crystal-growth pathways of calcium phosphates has been exploited to control calculus formation (LeGeros et al., 1999). A mechanism of adsorption or incorporation of zinc ions into the lattice structure has been proposed. 5.2 Zinc in the Human Body Zinc is one of the most abundant of the essential trace elements in the human body. Its concentration in soft tissues is in the same range as that of iron (Schroeder Page 59
76 et al., 1967). The human body contains about 2 g of zinc, of which approximately 60 % is found in muscle tissue, 30 % in bone and 5 % in skin (Thomas, 1988). Zinc is essential for growth and development in humans (Burch et al., 1975) and has functions in enzyme regulation, cell division, and bone formation (Report, 1973, Christianson, 1991). It is a critical component of several hundred enzymes and proteins (Sandstead, 1994). The human body can be exposed to extrinsic zinc through both environmental and dietary factors. Protein-rich foods such as meat and marine organisms contain high concentrations of zinc (10 50 mg/kg wet weight), whereas grains, vegetables and fruits are low in zinc concentration (below 5 mg/kg) (Trumbo et al., 2001). Uptake and release of zinc are mediated by the bone reservoir. Zinc has stimulatory effects on bone formation in vitro and in vivo and inhibitory effects on osteoblastic bone resorption in vivo (Yamaguchi et al., 1987). Furthermore, zinc can promote bone metabolism and growth, increase bone density and inhibit mineral loss in bone. Trace amounts of zinc substituted into HAP can improve the composition of synthetic HAp to enhance its solubility, bioactivity and osteoinductivity (Yamaguchi and Yamaguchi, 1986) Zinc in the Teeth Zinc is naturally present in the teeth, saliva and dental plaque. It is one of the many trace elements present in human teeth and shows a distribution pattern similar to that of fluoride and lead (Robinson et al., 1995). Zinc is present in smaller quantities in the bulk of enamel, between ppm, while it can be found in higher concentrations, between ppm at the enamel surfaces. Cross-sections analyses of the tooth crown show the highest zinc concentration in the enamel surface layer, and this decreases towards the EDJ. Prior to eruption, relatively large amounts of zinc are incorporated into enamel. After eruption, the zinc concentration at the enamel surface increases further, suggesting that some incorporation does occur during post-eruptive exposure to the oral fluids (Brudevold et al., 1963). Generally the zinc content declines markedly Page 60
77 with ageing in a similar fashion to fluoride (Weatherell et al., 1972, Weatherell et al., 1973). A zinc concentration gradient also exists in the dentine with a higher concentration occurring near the pulp, where zinc concentrations increase sharply and approach levels of external enamel Zinc in Dental Plaque, Calculus and Saliva Zinc is found naturally in dental plaque and saliva. In the literature, the concentration of zinc has been reported for both wet and dry plaque, which makes comparison between reported values difficult. In a literature review, Lynch (2011) reported values for background concentrations of zinc in saliva and plaque. The reported values for dry plaque was between 6 ppm 31 ppm [Zn 2+ ], these values were reduced sevenfold to facilitate comparison (Lynch, 2011). The difference in concentrations between the dry and wet plaque is permissible assuming that drying increases the apparent concentration (Tatevossian, 1978, Agus et al., 1980, Duckworth et al., 1987). The reported values for saliva ranged between ppm (Bales et al., 1990, Özdemir et al., 1998, Watanabe et al., 2005, Burguera-Pascu et al., 2007). Zinc also exists in small amounts (up to 500 ppm) in human dental calculus (Knuuttila et al., 1980). 5.3 Anti-Plaque/Calculus Effects of Zinc The mechanistic action of zinc in reducing plaque growth is thought to occur by zinc binding to the oral bacterial surface and altering its surface potential to reduce the bacterial adhesion to teeth (Skjörland et al., 1978). Or, zinc could inhibit bacterial acid production in plaque (Oppermann et al., 1980, Oppermann and Rölla, 1980, Harrap et al., 1983) by altering the metabolic activity of the oral bacteria hence reducing bacterial growth (Afseth, 1983, Afseth et al., 1983a, Afseth et al., 1983b, Saxton et al., 1986, Hall et al., 2003). Calculus is essentially an incrustation on the surfaces of teeth consisting of plaque that has become hardened by the deposition of mineral salts. Therefore by inhibiting plaque growth (see section 3.1.2), zinc can also reduce the base matrix for Page 61
78 calculus formation. Zinc exhibits anti-calculus/tartar properties by acting as a crystal poison and inhibiting further growth of calcium phosphate minerals. It does this by adsorbing to the surface of the growing crystal and restricting the attachment of calcium ions (Gilbert and Ingram, 1988). At relatively low concentrations and below a ph-threshold, zinc inhibits the crystal growth of HAp and its precursors, DCPD and OCP. At higher concentrations and above a phthreshold, zinc promotes the formation of ACP and β-tcp. These effects of zinc were reported to be both ph and concentration dependent (LeGeros et al., 1999). The binding of zinc to calcium phosphate crystals has been proven to be reversible and can be inhibited by raising the local calcium ion concentration (Brudevold et al., 1963). This suggests that calcium can compete for binding sites in the crystal lattice to displace zinc. Mouthwashes containing zinc salts were first reported to reduce dental plaque growth in the early 1970s (Picozzi et al., 1972, Fischman et al., 1973), whereas the role of zinc as a suppressor of calculus formation was established in later work which emphasised the importance of the use of high zinc concentrations and sufficient frequency of applications for this effect (Harrap et al., 1984). Prolonged retention of zinc in the mouth was suggested to be critical for its activity (Bonesvoll and Gjermo, 1978, Afseth et al., 1983a), Zinc Salts used in Toothpastes and Rinses Zinc citrate and zinc chloride are the two commonly used salts for anti plaque/calculus activity. They are usually used in combination with tricolsan or stannous salts or on their own. The chloride salt is readily soluble, whereas the citrate salt is only sparingly soluble. Zinc salts are strongly astringent and their metallic taste is difficult to cover. In dentifrices, zinc citrate is used up to 2 % w/w, whereas zinc chloride s upper limit is approximately 0.5 % w/w. Zinc salts are incompatible with condensed phosphates, as the resulting zinc phosphate would be insoluble. Studies show that the clinical effectiveness of zinc chloride ( %) at reducing calculus in toothpastes was %, whereas for zinc citrate ( %) this was % (Loveren, 2013). Page 62
79 5.3.2 Bioavailability of Zinc in Saliva and Plaque Figure 5.1: Salivary clearance of zinc (Lynch, 2011). For zinc to exhibit its anti-plaque/calculus properties, it must be present at the site of action at an effective concentration for sufficient time in the oral cavity. Accordingly, zinc pharmacokinetic data for both plaque and saliva, following applications from toothpastes and rinses, have been well documented (Özdemir et al., 1998). There are differences in experimental protocols (e.g. different zinc salts, doses and rinsing regimes) all of which may affect zinc delivery and release, however despite this, some general trends can be acknowledged. Good oral substantitivity was shown by Gilbert and Ingram (1988), who demonstrated that following application of zinc from a toothpaste, of the remaining 30 % remaining in the oral cavity, only a further 6 % was removed by rinsing three times (Gilbert and Ingram, 1988). Other studies have also confirmed the retention of a relatively large dosage of zinc in the oral cavity following application, with reported values typically between % (Harrap et al., 1984, Tanwalker and Gilbert, 1989). Figure 5.1 shows that the salivary clearance of zinc occurs in a bimodal fashion, with relatively high post-application concentrations falling rapidly over minutes, after which low concentrations (quite significantly elevated compared to baseline values) may persist for many hours. A similar pattern is seen in plaque, but elevated concentrations may persist for at least 12 hours after Page 63
80 application (Addy et al., 1980). Repeated application of zinc has shown a build-up effect occurs in plaque, as for fluoride. 5.4 Mechanistic Interaction between Zinc and HAp In the HAp lattice, the calcium sites are where metal cations are usually thought to substitute. The smaller ionic radius of zinc, as compared with that of calcium, enables it to compete for cation positions in the apatite crystal lattice (Brudevold et al., 1963). However, it is not clear what the selection criteria is which determines the choice between the two structurally different Ca (I) and Ca (II) sites. Wherever the substitution, it is inevitable that the physiochemical and structural properties of HAp (e.g. lattice constants, crystal sizes, crystallinity, solubility and thermal stability) will be altered by the presence of foreign metal ions. This occurs not only as a result of the size of the substituting ion, but also due to the amount of substituting metal ion. The replacement of calcium with the smaller zinc ion is believed to distort the lattice structure, and could possibly introduce a Ca 2+ vacancy to lower the (Ca+Zn)/P molar ratio (Bigi et al., 1995). In dental enamel, the presence of a high carbonate (CO 2 3 ) content and deficiencies in calcium in the apatite lattice structure could affect the mechanistic action of zinc and influence its site of binding Incorporation of Zinc in HAp through Crystallisation Experimental studies investigating the effect of zinc incorporation into HAp structure (Ingram et al., 1992, Bigi et al., 1995) are made complex by the fact that not only can zinc potentially substitute into two different Ca sites, but zinc can also occur in multiple coordination environments. Many studies have investigated the synthesis of zinc-substituted HAp via wet-chemistry precipitation routes (Miyaji et al., 2005). Page 64

81 Figure 5.2: Schematic figure for the structure of Zn-doped HAp, where yellow, blue, red, black, green and grey refer to calcium 1 site, calcium 2 site, oxygen, hydrogen, zinc and phosphate groups respectively (Tang et al., 2009). Tang et al., (2009) investigated the local coordination structure of zinc substituted into HAp during a wet synthesis procedure, using theoretical modelling. They suggested that zinc prefers calcium sites to phosphorus sites as the Ca+Zn/P ratio was 1.67, the same as pure phase HAp. Also, they proposed that zinc energetically favours the Ca (II) sites over Ca (I), in a tetrahedral coordination, and bonds to one hydroxyl group and three adjacent phosphate groups (Figure 5.2). One could argue that the Ca (II) site exists in 7-fold geometry (see Section 2.2) in the HAp lattice, and that it would be unfavourable for zinc to adopt this configuration. In the synthesis of HAp via a direct wet-chemistry precipitation route, Bigi et al., (1997) reported that the presence of zinc in solution inhibited the crystal growth of HAp. However, the formation of an amorphous phase was observed which contained only a maximum of 25 mol% zinc concentration. In this phase, it appeared that zinc preferred the crystal structure of β-tricalcium phosphate (β- TCP), which formed at high temperatures and at low ph (5 or 6) conditions. The lattice parameters showed a contraction in the unit cell relative to pure β-tcp, and this would suggest a partial substitution of calcium by zinc ions. Strontium on the other hand, was observed to enter the crystal structure of β-tcp up to 80 mol%, Page 65
82 causing a linear enlargement of the unit cell, which is in agreement with its greater ionic radius compared to that of calcium. LeGeros et al., (1999) studied the effects of incorporating low concentrations of zinc in the apatite structure, and in agreement with Bigi and co-workers (1997), they also found an evident reduction in the degree of crystallinity of the apatite phase, in which the structure could not host large amounts of zinc. It was assumed that the presence of zinc ions affects the type and amount of calcium phosphate phases formed. At low concentrations, zinc inhibited the crystal growth of DCPD, OCP and apatite phases; and, at higher concentrations, promoted the formation of amorphous calcium phosphates, or Zn-substituted β-tcp depending on the reaction ph and temperature. Miyaji et al., (2005) reported that zinc-substituted apatite could only be formed at a limited zinc fraction (up to 15 mol% maximum). The X-ray Diffraction (XRD) data confirmed that apatite peaks became broader with increasing Zn fraction, indicating the formation of smaller crystals. At 70 mol% Zn, only a parascholzite (CaZn 2 (PO 4 ) 2.2H 2 O) phase was observed. The size and amount of the substituting ion will affect the lattice parameters. Several studies have observed contractions in the a and c lattice parameters with increasing zinc fraction in the HAp structure, which is a reflection on the smaller ionic radius in Zn 2+ (0.074 nm) than in Ca 2+ (0.099 nm). Consequently, a reduction in the crystallinity is observed with zinc-substituted HAp, and the general crystallite size is noticeably smaller (Miyaji et al., 2005). The possibility of small amounts of zinc substituting for calcium is feasible, but it would seem that the majority is situated at the surface or is present in the amorphous phase. Some authors disagree with the concept that zinc substitutes for calcium sites in the HAp structure, rather propose that the majority of zinc adsorbs to HAp crystal surface inhibiting its crystal growth and consequently forming smaller crystals (Wang and Nancollas, 2008). Page 66
83 5.4.2 Crystal Growth Inhibitor Zinc is also known as a crystal poison for its ability to inhibit HAp crystal growth by adsorption processes on HAp surfaces and subsequent blocking of the active growth sites. In constant composition studies of HAp crystal growth affected by Zn 2+ and Mg 2+, the adsorption of Mg 2+ continued with increasing concentrations and eventually reached a plateau with very little further uptake. In contrast, Zn 2+ binding increased monotonically with increasing concentrations beyond the point of monolayer coverage. This was attributed to a Langmuir type adsorption of the additive at active growth sites on HAp surfaces, thus altering nucleating properties and inhibiting crystal growth. Above 1 ppm zinc in solution, the formation of hopeite (α-zn 3 (PO 4 ) 2.4H 2 O) was observed to dominate the surface properties blocking active growth sites (Fuierer et al., 1994). At low ph conditions especially, adsorbed zinc can promote the precipitation of hopeite as the dominant uptake mechanism with increasing zinc concentration. In general, growing crystals have steps present on their surfaces, which usually originate from a source such as imperfections or dislocations in the crystal lattice. The steps move away from the source leading to the growth of crystals by layers. However, the presence of a trace amount of impurities, such as Zn 2+, may inhibit or terminate crystal growth processes by acting at key growth sites on the crystals. It is possible to poison the kinks which have a dramatic effect on crystal growth kinetics. The adsorption of the impurities and their specific effect on growth processes depends on the chemical bonds between the impurity, the solvent and the surface. The forming bond controls whether the impurity will ultimately adsorb on terraces, steps or kinks. Figure 5.3 shows that surface adsorbed impurities reduces the rate of crystal growth by hindering the movement of steps on the crystals. Page 67
84 H K S T S T S T Figure 5.3: Surface structures on an idealised crystal face: kinks (K); steps (S); terraces (T). Adsorbed impurities at each of these sites are illustrated (Valsami-Jones, 2004). 5.5 Effect of Zinc on Apatite Dissolution In experimental studies modelling biological apatites, synthetic carbonated hydroxyapatite (CHA) (at 2 4 %) is used as an analogue for dental enamel. Mayer and Featherstone (2000) reported that the dissolution rates of zinc-containing CHA was markedly lower than the absence of zinc in the apatite structure. This effect of zinc was observed within 5 % carbonate content in the apatite structure, which is the amount typically present in biological apatites. In the precipitation reaction of CHA, zinc was thought to substitute at the calcium position in the apatite structure. It was suggested that the incorporation of zinc into carbonated apatite reduced the crystalline disorder, and promoted the formation of larger crystals with fewer structural defects. Page 68
85 5.5.1 Interactions of Zinc and Fluoride with Enamel The incorporation of a combination of F and Zn 2+ into the HAp crystal lattice was more effective in reducing the paracrystalline disorder caused by carbonate inclusion, when compared with fluoride alone, or to other combinations of fluoride and other metal ions (Featherstone and Nelson, 1980). However, given concentrations found in the mouth, it is not clear if sufficient zinc would be incorporated to achieve a similar effect. When carious enamel lesions were remineralised under simulated plaque-fluid conditions, in the presence of zinc and fluoride, they contained relatively little zinc (Lynch et al., 2011), and in the region of maximum remineralisation, only background concentrations were found, suggesting displacement of zinc by calcium. Alternatively, a synergy between zinc and fluoride in enhancing remineralisation was proposed. This involved the idea of zinc maintaining surface zone porosity (see section 3.1.1), under conditions that would otherwise leads to F-induced lesion arrest, by blocking active growth sites facilitating the prolonged ingress of fluoride mineral into deeper parts of the lesion (Lynch et al., 2011). Lippert, (2012), also reported this synergistic action between zinc and fluoride that enhanced deeper lesion remineralisation, however this effect was only observed for a combination of low zinc and high fluoride concentrations. They specified that Zn not just F was driving the remineralisation process. Fluoride exerts its cariostatic effects predominantly via retarding demineralisation and promoting remineralisation of dental enamel. Whilst the interactions between fluoride and enamel are well established, for zinc it is not so clear. Zinc is able to inhibit both demineralisation and remineralisation of hydroxyapatite. As mentioned previously in Sections and 5.4.2, zinc inhibits crystal growth of HAp and its precursors OCP and brushite, however promotes deposition of more soluble calcium phosphate phases such as amorphous calcium phosphates (Legeros et al., 1999). Brudevold et al. (1963) established long ago that zinc reduces the solubility of enamel, whereas more recently, data from a pilot study on the effect of physiologically-relevant zinc concentrations, added to acid-gel demineralising Page 69
86 systems, showed that zinc reduced demineralisation markedly (Lynch 2011). Further, an in situ study demonstrated a reduction in enamel demineralisation with the use of zinc-containing fluoride toothpastes (ten Cate, 1993). Thus, similar to fluoride, zinc has the potential to modify the so-called caries balance in a number of ways. However, in a rat caries study, zinc did not impair the anticaries effect of fluoride (Ingram et al., 1984) and subsequently, in a 3-year caries clinical trial, when zinc was added to fluoride toothpastes containing 1000, 1500 and 2500 ppm fluoride (as sodium monofluorophosphate, SMFP) the same finding was reported, with zinc having no effect on caries, either positive or detrimental, at any of the fluoride concentrations, when compared to the non-zinc control toothpastes (Stephen et al., 1988). However, the zinc toothpastes did reduce calculus formation during the same trial (Stephen et al., 1987), suggesting that remineralisation should also have been affected. Ripa et al., (1990) reported that during a further caries clinical trial, there was no significant difference in anticaries effectiveness between two anticalculus toothpastes, both of which contained zinc, one containing fluoride as SMFP and the other as sodium fluoride, and an SMFP control toothpaste. An apparent contradiction exists between clinical and in vitro findings, and therefore more work is needed to understand the possible effect of the use of zinccontaining toothpastes on caries. Page 70
87 TECHNIQUES Page 71
88 Chapter 6 k Scanning Microradiography (SMR) Scanning microradiography (SMR) is an X-ray attenuation technique which was originally developed by (Elliott et al., 1981) to improve conventional (contact) microradiography. SMR has evolved to become a directly quantitative technique, allowing precise measurements in mineral mass and is one of the main techniques used in this research to carry out a range of dissolution studies, particularly in relation to the physico-chemical mechanisms of dental caries. X-ray detector OUT IN SMR cell Y-axis Solution X-axis Figure 6.1: Schematic of SMR X-Y scanning stage with SMR cells circulating solutions. An X-ray beam is fixed on a specimen and the attenuated X-ray photon is detected by a photon counting detector. Page 72

89 The SMR system apparatus is comprised of three main entities: X-Y scanning stage which holds the environmental cells containing the samples, X-ray detector and X- ray generator. Figure 6.1 is a schematic of the current apparatus. In this chapter, the underlying principles of SMR, which include the nature of X-rays, its production, attenuation through sample and detection, are described in detail. 6.1 Principles of X-rays X-rays are electromagnetic radiation of high energy and extremely short wavelengths of around 0.1 nm (Figure 6.1). For all X-ray techniques, the common entity is the controlled X-ray beam of known energy and quantity. X-ray diffraction, X-ray spectroscopy, computed tomography and microradiography are just few of the X-ray techniques used in research and diagnostic radiology today. In the complete electromagnetic spectrum, X-rays occupy the region between gamma and ultraviolet rays (Figure 6.2). Electromagnetic radiation is described as periodic cyclic waves that contain both electrical and magnetic fields with amplitude (peak value from the average) and period (time between repeating portions of the wave). The length of time that 1 cycle occupies is the period. The number of cycles per second (s -1 ) is the frequency, f, and frequency and period are inversely equal f = 1/period. Electromagnetic radiation travels at a velocity, C, of 3.0 x 10 8 ms -1 in a vacuum, but will vary slightly in other materials. Wavelength,, is the distance travelled by 1 cycle (10-9 m). C = f describes the relationship between velocity, frequency and wavelength (Seibert, 2004). Figure 6.2: Electromagnetic spectra Page 73
.")
90 6.1.1 Nature of X-Rays According to the classical theory, electromagnetic radiation is considered as wave motion. However in quantum theory, electromagnetic radiation can also be considered as a stream of particles called quanta or photons (Cullity, 1978). Each photon has associated with it an amount of energy hv, where h is Plank s constant (6.6 x Js). X-rays are known as ionising radiation because an X-ray photon with sufficient energy can interact with and remove electrons bound to an atom. X-rays are created as a result of energy conversion by interactions outside of the atomic nucleus. 6.2 X-Ray Production Laboratory generated X-rays are usually obtained using impact sources, in which electrically charged particle of sufficient kinetic energy (usually electrons) are subject to rapid deceleration. The X-ray radiation is produced in an X-ray tube that contains two metal electrodes, a heated tungsten filament (source of electrons) and a metallic target (Seibert, 2004). Heated filament emits electrons by thermionic emission Electron are accelerated by high voltage anode (+) cathode (-) X-rays produced when high speed electrons hit the metal target Figure 6.3: X-ray tube Figure 6.3 shows the cathode and anode are situated a small distance apart in a tube housing called the insert, made of either glass or metal. Cathode: Also known as the source, is the negatively charged electrode typically made of a tungsten filament that produces free electrons as a result of heating by electrical resistance. Page 74
91 Anode: the anode is a target embedded in a copper block that is usually cooled. It is the positively charged electrode where the free electrons strike to subsequently produce X-rays. The target material consists of an element that has a high atomic number, high melting and low vapour pressure. This is imperative as heat is produced when electrons are stopped at the target surface. The steps involved in X-ray production are: 1) Activation of the filament circuit. This causes intense heating of the filament due to its electrical resistances, and a process known as thermionic emission releases electrons. 2) X-ray generator supplies a high voltage ( kv) to the cathode and anode in the X-ray tube. 3) Upon activation, electrons are immediately accelerated to the electrically positive anode. Each electron carries a kinetic energy (in kev) equal to the applied tube voltage. 4) X-ray production occurs when the highly energetic electrons interact with the target (Seibert, 2004) Electron Impact X-Ray Source When the accelerated electrons collide with the target, they are capable of producing two different types of radiation; bremsstrahlung and characteristic (Figure 6.4) (Cullity, 1978). Relative intensity of X-rays characteristic radiation bremsstrahlung Maximum photon energy Photon energy / kev Figure 6.4: X-ray spectrum of tungsten target showing continuous and characteristic radiation. Page 75
92 Bremsstrahlung Radiation Bremsstrahlung radiation results from the deceleration of electrons in the vicinity of the electric field of an atomic nucleus of the target. The kinetic energy lost is converted into a photon with equivalent energy. If the interaction of the electron with the nucleus is in close proximity, there is a greater deceleration of the electron resulting in higher X-ray photon energy. Maximum X-ray energy is possible only if the incident electron loses all its kinetic energy when hit by the nucleus, but note this occurs in extremely rare instances (Cullity, 1978). Characteristic Radiation Characteristic radiation is emitted from heavy elements via transition of electrons with lower binding energies to fill vacancies in the inner shell (Seibert, 2004). The electron-impact ionisation of atoms in the target with an incoming electron of a high energy can result in an inner shell vacancy. This interaction leaves an energetically unstable atom. In order to regain stability, an outer electron with a lower binding energy will readily occupy the vacancy, releasing a photon of energy corresponding to the energy difference between the two shells. The emitted X-ray radiation is always characteristic of the atom from which it emanates, and the energy levels. Some of these energy transitions are illustrated in Figure 6.5. Lα Kβ Kα L-shell M-shell Nucleus K-shell Figure 6.5: Representation of the electronic structure of an atom and some characteristic energy transitions. Page 76
93 6.3 X-Ray Interaction with Matter X-rays commonly interact with matter by elastic scattering (coherent), inelastic scattering (incoherent), or photoelectric absorption (Seibert and Boone, 2005). Photoelectric Absorption Photoelectric absorption involves the interaction of an incident X-ray photon with an inner shell electron in the absorbing atom that has a binding energy similar to but less than the energy of the incident photon. The incident X-ray photon energy is transferred to the electron, resulting in the ejection of the electron from its shell. The vacant inner orbital is subsequently filled with an electron from the outer shell, producing a characteristic X-ray equal to the energy difference of the two atomic shells. Rayleigh scattering Rayleigh scattering includes both coherent and elastic scattering, in which incident X-ray photon interact with strongly bound electrons (inner shell) resulting in the reemission of the photon with no loss in energy. This is simply because the incident photon energy is much less than the binding energy of the electron in the atom. Therefore the energy of the electron is temporarily raised without it being removed from the atom. Compton Scattering Compton scattering includes both incoherent and inelastic scattering. This interaction results in the total or partial transfer of incident X-ray photon energy to a loosely bounded electron. Typically, there is re-emission of a photon of lesser energy. Partial energy transfer to the electron causes a recoil and removal from the atom at an angle. Pair Production Pair production can only occur for high-energy incident X-ray photons greater than 1.02 MeV. The interaction of the incident photon with the electric field of the nucleus results in the conversion of energy to electron (e ) positron (e + ) charged particles. Any photon energy excess of 1.02 MeV is transferred to the kinetic Page 77
94 energy of the e - /e + pair equally. This is a case of energy being converted to mass. This interaction is not very common or relevant in this study. The occurrences of these mechanisms will be dependent upon the energy of the incident X-ray photon and the nature of the target material (Seibert and Boone, 2005). In the SMR studies, the incident photon energy is predominantly AgKα (22.1 kev) and the specimen is either enamel or HAp. Under these conditions, the predominant interaction will be photoelectric absorption X-Ray Beam Attenuation The term attenuation refers to the decreases in the beam intensity (or flux of photons) due to the presence of a material in the X-ray path (Seibert and Boone, 2005). This interference in the X-ray path results in the incoming X-ray photons to lose its energy in the material through absorption and scattering. In absorption, the energy of the X-ray photon is transferred to the atoms of the material, whereas in scattering the X-ray photon continues with a displacement in direction with or without a loss in energy. The absorption and scattering of attenuating X-rays at energies used in the laboratory is affected by three main factors: The energy of the incoming X-ray photons The density and nature of the attenuating material The atomic number (Z) of the material The amount of attenuation due to material is obtained by measuring the incident (I 0 ) and transmitted (I) beam intensities, or photon counts per unit time. For materials of a homogeneous composition subjected to monochromatic X-rays, an exponential relationship between the incident and transmitted beam energies as it passes through the medium is expressed by the Beer-Lambert Law (Cullity, 1978): I = I 0 e µx [6.1] Where x is the thickness of the medium in the X-ray path and µ is the linear attenuation coefficient (LAC). The LAC describes the probability of absorption or Page 78
 by a homogeneous material of thickness x.")
95 scatter of an X-ray photon of a given energy per unit thickness the material (Figure 6.6) and typically expressed in units of cm - 1 (Gerward, 1993). Figure 6.6: Attenuation of a monochromatic X-ray beam of Intensity (I 0 ) by a homogeneous material of thickness x. A large attenuation coefficient shows that the beam is quickly attenuated as it passes through the medium, whereas a small attenuation coefficient shows that the medium is relatively easier for the beam to pass through. For example in water, the linear attenuation for water vapour is much lower than it is for ice because the molecules are more dispersed in vapour and therefore the probability of a photon encounter with a water particle is less. At a given photon energy, the LAC can vary significantly for the same material if it exhibits differences in physical density. The mass attenuation coefficient (MAC), µ ρ, compensates for these variations by normalising the linear attenuation by the density of the material. The MAC describes the attenuation per unit area density of material (Gerward, 1993): μ ρ = μ ρ [6.2] where µ is the LAC, and ρ is the density of the material. It is typically expressed in units of cm 2 g -1. Values for the MAC (µ ρ ) for various characteristic wavelengths are reported in the International Tables for Crystallography (Creagh and Hubbell, 1992). It is necessary to know the MAC of a substance containing more than one element. For a substance like HAp, the MAC is simply its weighted average of the mass absorption coefficients of its constituent elements. If w 1, w 2 etc., are the weight Page 79
96 fractions of elements Ca, P, etc., in HAp and (µ/ρ) Ca, (µ/ρ) P, etc., their mass absorption coefficients, then the mass absorption coefficient of the substance is given by: μ = w ρ 1 ( μ ) + w ρ 2 ( μ ) + Ca ρ P [6.3] The reported mass attenuation coefficient for stoichiometric HAp is 4.69 g/cm 2 calculated for AgKα radiation (22.1 kev) (Creagh and Hubbell, 1992). 6.4 X-Ray Detection: Semiconductor Counters There are several types of X-ray detection systems, some of which include: solidstate semiconductors, X-ray films, gas detectors and scintillation detectors (Singh, 1994). The efficiency of an X-ray detector depends primarily on the detector material, the radiation energy, the physical thickness of the detector in the direction of the incident radiation, in addition to the source to detector distance and geometry (Singh, 2000). This section will describe semiconductor detectors, as the SMR system uses this type of detector. Semiconductors produce pulses proportional to the adsorbed X-ray energy with better energy resolution than any other counter. The main types of solid-state semiconductor materials are high purity germanium (HPGe), as used in SMR, and lithium drifted silicon detectors (Si(Li)). It is advantageous to use germanium (atomic number, Z, of 32) rather than silicon (atomic number, Z, of 14), as it is more likely for an incident X-ray beam to lose all its energy in germanium, and the intrinsic peak efficiency for germanium will be several order of magnitudes larger. The intrinsic efficiency of a detector is defined as the ratio of the number of pulses recorded in the detector to the number of radiation quanta incident on it (Singh, 2001). In semiconductors and insulators, the electrons are confined to energy bands (valence and conduction bands) and according to the law of quantum mechanics, are forbidden from other regions. The energy difference between the valence and conduction bands is represented by the band gap. For semiconductors the band gap Page 80
97 is generally quite small, but is not zero and has an upper limit of 4 ev, whereas for insulators the band gap is large (Neamen, 2003). The basic principle behind the operation of semiconductor detectors is that as the X-ray photon passes through the detector, and an electron-hole pair is created. This occurs when the electron in the valence band acquires enough energy to overcome the band gap and jump to the conduction band. Subsequently, a nearby electron can move into the vacancy or hole formed. The vacancy moves within the valance band in the direction of the electric field, whereas the electrons move in the opposite direction in the conduction band. Thus the conduction occurs via electron and holes in semi-conductors and the electron-hole pairs are considered the basic information carriers in solid state detectors (Neamen, 2012). Thermally generated charge carriers are of a potential problem in germanium because of the small band gap, which is much smaller than the band gap in silicon (Singh, 2001). Therefore to avoid this problem, the germanium detectors are cooled to liquid-nitrogen temperature (77 K = -196 C) during the SMR experiments. The germanium crystal is sealed inside a vacuum enclosure, that provides thermal contact with a storage dewar of liquid nitrogen. Even when not operating, the counter should not be allowed to warm too often to room temperature, as electronic noise increases with temperature and reduces the resolution of the technique (Cullity, 1978) Multi-Channel Analyser (MCA) X-ray photon counters are devices that convert X-rays into a pulsating electric current. In SMR, the preamplifier converts the charge into a voltage pulse, and a Multi-Channel Analyser (MCA) is used to convert the voltage pulses from the detector preamplifier into digital pulses. The amount of charge in the pulse produced by the detector is proportional to the energy of the photon. The pulses are electronically sorted out according to their amplitude into one of the large number of channels of the MCA. Each channel corresponds to signal pulses of a specific narrow amplitude range. As the pulses are sorted into the channels Page 81
98 matching their amplitude, a pulse-height spectrum is accumulated. Thus MCAs take their input from an analogue amplifier and digitise the incoming pulse heights placing the accumulated data into memory and displaying this pulse height distribution in a histogram. The histogram X-axis is the pulse height and the Y-axis is the number of counts. The MCA s typically consist or a Multi-Channel Buffer (MCB) which has an Analog-to-Digital Converter (ADC) and a histogramming memory is interfaced to a computer for display. Software (MAESTRO) is required to run the MCB units using the computer to make a complete MCA. The number of channels in the ADC can determine the digital resolution which should be chosen to suit the detector type and energy range. Signal processing does take time and the time the system is available to receive a signal is considered live time while all the time consumed with signal processing is dead time. MCA systems can receive logic signals to determine this dead time in order to ensure any quantitative data is correct. When the measurements are completed, the sum of all the counts that have been recorded in the channels equals the total number of pulses produced by the detector over the measurement period. In order to maintain this correspondence at high counting rates, corrections must be applied to account for the dead time of the recording system or the pileup of two pulses spaced so closely in time that they appear to be only one pulse to the MCA (Cullity, 1978). 6.5 Advantages of SMR A solid-state photon detector coupled to a digital spectrometer overcomes the issues encountered with photographic emulsions used in conventional microradiography techniques. This includes the inhomogeneity of the film emulsion due to manufacture variations, saturation of the film emulsion in addition to nonlinear response and noise at low X-ray exposures. The advantages of using a photon detector include: The sample does not need to be in close contact with the X-ray detector and can be located within environmental cells i.e. no damage to specimen. Page 82
99 Method is quantitative and accuracy is only limited by counting statistics. Photon counting can be selected to only those quanta that fall within a certain energy range, thus allowing electronic monochromatisation of the X- ray beam. As a result of the working distance between specimen and detector in SMR, the samples can be fixed into individual environmental cells and placed between the X- ray source and the detector. The cells can be circulated with a reacting solution, so that samples are subjected to different reaction conditions during the X-ray measurements. Each individual cell can hold a different environment for the sample it contains, for example, different ph conditions, degree of saturation, chemical composition and circulating rate of the solution. A reaction condition in one cell is independent to that of another cell, therefore multiple cells can be set up investigating various factors. SMR allows precise measurements in mineral mass of the specimen, and as it is a fully automated system, real-time experiments can be executed without disrupting the scanning apparatus or the samples. Anderson and Elliott (1985), have used SMR for real-time studies of the physical and chemical changes in enamel and HAp demineralisation (Anderson and Elliott, 1992, Anderson et al., 1998, Shah et al., 2011). Page 83
100 Chapter 7 k Other Experimental Techniques 7.1 Nuclear Magnetic Resonance (NMR) NMR is a powerful characterisation technique that is widely used to obtain structural information of a molecule at the atomic level. The nuclei of different elements have their own characteristic magnetic field. Each nuclei has an electric charge that allows it the ability to spin. When atoms are placed in a strong magnetic field, their nuclei behave like tiny bar magnets and align themselves with the field. Electrons behave like this also, and therefore both electron and nuclei are said to possess spin, since any spinning electric charge has an associated magnetic field. The principles of NMR are based on the magnetic properties of nuclei. Nuclei with odd numbers of protons and/or neutrons such as 1 H, 13 C, 19 F and 31 P possess a characteristic spin or angular momentum. I, the spin quantum number, depending on the nuclei may have integral or half-integral values (Atkin and Mann, 2000). If: No. of neutrons and protons are both even, the nucleus has no spin No. of neutrons + protons = odd, then the nucleus has a half-integer spin (i.e. ½, 3/2, 5/2) No. of neutrons and protons are both odd, then the nucleus has an integer spin (i.e. 1,2,3). Page 84
101 According to quantum mechanics, a nucleus of spin I will have 2I + 1 states, i.e. a nucleus with spin ½ will have two possible states. Nuclei with spin also have a magnetic moment (μ) with the following relationship: μ= ϒħI [7.1] where ħ is Plank s constant divided by 2π, and ϒ is the gyromagnetic ratio which has a characteristic value for each magnetically active nucleus. In the absence of an externally applied magnetic field, the spin states of a nuclei are of equal energy (degenerate). If the nucleus is placed in a magnetic field, however, the interaction between the nuclear magnetic moment and the external magnetic field causes the spin states to possess different energy values and the energy levels split. For 1 H, 13 C and 19 F, which have a spin of ½, there are two spin states (+ ½ and ½). The lower energy +½ would be in the direction of the applied magnetic field, B 0, whereas the higher energy ½ would oppose the direction of the applied magnetic field (Figure 7.1). ΔE (the change in energy) depends on the magnetic spin of the nuclei and the strength of the applied magnetic field, and can be described by the following relationship: [7.2] ΔE = μb 0 / I This relationship also demonstrates the dependence of ΔE on the magnetic moment, which is the fundamental principle that NMR is reliant on. Page 85
102 E -½ ΔE +½ B x Chemical Shift Applied Magnetic Field /B 0 Figure 7.1: Diagram showing the change in energy between nuclear states, which is proportional to the strength of an applied magnetic field. Furthermore, ΔE is also proportional to the resonance frequency (v): ΔE = hv [7.3] Therefore, for a given field strength, ΔE and v are characteristic of a given nuclei as every nuclide has a characteristic μ. However, v is also dependent on the chemical environment of the nuclei used. In molecules, the electrons in surrounding shells can exert a shielding effect, which reduces the magnetic field at the nucleus. As a result the ΔE is reduced, and the frequency required to achieve resonance is also reduced. This shift in the NMR frequency due to the electronic molecular orbital coupling to the external magnetic field is called chemical shift. The amount of shift is dependent upon the type of nucleus and the electron motion in adjacent atoms and molecules. If a nucleus is shielded to a higher degree by the electron density distribution in the corresponding molecular orbitals, then its NMR frequency will be shifted "upfield" (that is, a lower chemical shift), whereas if it is less shielded by such surrounding electron density, then its NMR frequency will be shifted "downfield" (that is, a higher chemical shift) (Atkin and Mann, 2000). Page 86
103 7.1.2 Magic Angle Spinning In solid-state NMR, magic angle spinning (MAS) is used. This technique involves spinning a sample in a ceramic rotor at a speed of up to 75 KHz at the magic angle of with respect to the applied magnetic field. Applying NMR to solids can produce broad spectra, which mask peaks from chemical shifts, thus making it difficult to obtain structural information. Furthermore, nuclear spin in solid materials experience interactions that contribute to line broadening. This magic angle makes the broader lines of NMR narrower and thus increasing the resolution of the spectrum. At this angle, the nuclear dipolar interaction between the magnetic moments of nuclei average to zero. This causes the signal to become much narrower, giving rise to the isotropic value (which is of interest for structural determination of solid materials and compounds) and spinning side bands which occur at multiples of the spinning speed and can be used to determine the chemical shift of the nuclei (Atkin and Mann, 2000) Application of 19 F MAS NMR in Dental Research 19 F MAS-NMR has been previously used to characterise fluoride-hydroxyapatite interactions. (Yesinowski and Mobley, 1983), demonstrated the ability of this technique to distinguish between fluorapatite (Ca 10 (PO 4 ) 6 F 2, FAp), fluorohydroxyapatite (Ca 10 (PO 4 ) 6 (OH) 2-x F x, FHAp), and calcium fluoride (CaF 2 ) both in the bulk phase and on hydroxyapatite surfaces. Figure 7.2 shows FAp has a 19 F chemical shift of -101 ppm, which corresponds to the F-Ca(3) triangle in the apatite structure, whilst CaF 2 has a chemical shift of -106 ppm corresponding to the F-Ca(4) site (spectra was referenced to CaF 2 ). Advantages of the 19 F MAS-NMR are that; 1) it selectively probes the local environment of only the fluorine atoms in the sample permitting direct identification of the possible structural forms in which F may exist within the enamel; 2) it detects all fluorine present, whether crystalline, amorphous, or adsorbed. The range of 19 F chemical shifts and the sensitivity of 19 F chemical shifts to the local fluorine environment are extremely high; 3) it can measure very low concentrations of fluoride in the order of 0.1%. Fluorine-19 is a spin ½ nucleus and Page 87
104 at 100% natural abundance, all F atoms in a sample can be detected. Figure 7.2: Diagram showing the change in energy between nuclear states, which is proportional to the strength of an applied magnetic field. Although the potential of 19 F MAS-NMR as a spectroscopic tool for studying the fluoridation of apatitic surfaces was recognised over two decades ago, there have been few studies applying this technique to determine fluoride-enamel interactions in dental research (White et al., 1988). A reason for this could be that a specialised fluorine-free MAS-NMR probe is required as fluorine present in the probe introduces additional signals into the spectra potentially disguising any fluorine signals generated from the sample. Such probes are not widely accessible (Brauer et al., 2009). In the present study, 19 F MAS-NMR instrument at QMUL was used to characterise the fluoride mineral phase formed in enamel during exposure to an in vitro demineralisation system with varying fluoride concentration (see Chapter 10). Page 88

105 7.2 Secondary Ion Mass Spectrometry (SIMS) Secondary ion mass spectrometry (SIMS) is an extremely sensitive method for surface analyses. It provides elemental data and a certain degree of molecular information, whilst also allowing depth profiling, mapping or imaging to be carried out. SIMS permits a wide elemental range to be investigated with excellent detection limits (in the range atoms cm -3 ), and the information obtained may also be quantifiable. The technique is divided into two branches, static and dynamic SIMS, which is distinguished by the applications and instrumentation. Static SIMS is used to analyse the top mono-atomic or mono-molecular layer, whereas dynamic SIMS is used for micro-volume sampling and imaging, and depth profiling (Williams, 1985) The SIMS Process Figure 7.3 illustrates the main components of the SIMS instrument: Primary beam source (usually O + 2, O -, Cs +, Ar +, Ga + or neutrals) A target / sample that must be solid and stable in a ultra-high vacuum A method of collecting the ejected secondary ions A mass analyser to isolate the ion of interest (quadrupole, magnetic sector or time of flight) An ion detection system to record the magnitude of the secondary ion signal (photographic plate, Faraday cup, electron multiplier of a CCD camera and imaging plate). Figure 7.3: Schematic diagram representing the basic components in the SIMS instrumentation. Page 89
. These incoming particles are called primary ions, which are able to deposit energy into the surface layers.")
106 In SIMS analysis, the surface of the sample is bombarded with a beam of charged particles (this may be a negative or positive charge depending on which elements are to be detected) with energies in the 1-25 kev range (Figure 7.4). These incoming particles are called primary ions, which are able to deposit energy into the surface layers. At the site of impact, many bonds are broken and as a result there is much random displacement and movement of atoms. This region is called the collision cascade. Collisions resulting in translational energy being directed back to the surface layer will lead to ejection of material. This process is known as the sputtering of the surface. The emitted charged particles are called secondary ions, and typically have kinetic energies in the order of 20 ev, however different ions have different energy distributions. Prior to detection, the emitting secondary ions are collected and filtered according to their masses. Three types of mass filter (or mass analyser) are used in SIMS magnetic sector, quadrupole and time-of-flight (Griffiths, 2008). Figure 7.4: Schematic diagram showing the sputtering of the sample surface using a primary ion beam. The emitted charged particles are called the secondary ions Applications of SIMS for Depth Profiling Since the SIMS technique itself relies upon the removal of atoms from the surface, it is by its very nature a destructive technique, but also, ideally suited for depth Page 90
107 profiling applications. The aim of depth profiling is to obtain information on the variation of composition with depth below the initial surface - such information is particularly useful for the analysis of layered structures such as dental enamel, which varies naturally in composition with increasing depth (as described in Section 2.3.3). In depth profiling, the surface is continuously eroded with the primary ion beam, whilst the emitted secondary ions are counted with a mass analyser as a function of sputtering time, which corresponds to the depth at which the ions are located. Thus a depth profile of a sample may be obtained simply by recording sequential SIMS spectra as the surface is progressively eroded away by the incident primary ion beam. A plot of the intensity of a given mass signal as a function of time, is a direct reflection of the variation of its abundance/concentration with depth below the surface. The sputtering rate can be determined by the following equation: Sputter rate (nm/min) = crater depth (nm) profile time (mins) [7.4] A profilometer is used to measure the depth of the sputtered crater. This is a separate instrument that determines the depth by dragging a stylus across the crater and recording the vertical deflections. In a SIMS plot, to convert the time data points to a depth value on the x-axis, the time data points must be multiplied by the sputter rate: Depth (nm) = Time points (mins) sputter rate (nm /min) [7.5] One of the main advantages that SIMS offers over other depth profiling techniques is its sensitivity to very low (sub-ppm, or ppb) concentrations of elements. The depth resolution is dependent upon a number of factors which include (Liebl, 1975): the uniformity of etching by the primary incident ion beam the absolute depth below the original surface to which etching was carried out the nature of the ion beam utilised (i.e. the mass & energy of the ions ) Page 91
108 as well as effects related to the physics of the sputtering process itself (e.g. ionimpact induced burial). A disadvantage of SIMS is that ion yields vary markedly across the periodic table, depending on the ionisation potential (for positive SIMS) or electronegativity (for negative SIMS) of the analyte element (Liebl, 1975) Ultralow Energy SIMS (ulesims) In this study, ultralow energy Secondary Ion Mass Spectrometry (ulesims) was used to depth profile zinc in demineralised enamel surfaces with nano-level resolution, providing a direct reflection of the variation of its concentration with depth below the surface (Chapter 13). This work was executed at Warwick University on the ulesims instrument developed by Dowsett et al., (2003), and pioneers the application of ulesims to investigate dental enamel chemistry. In the ulesims experiment, the sample is bombarded by a primary ion beam with an ultralow energy (0.1-1 kev) so that the penetration depth of the primary ions is in the order of several nanometres. Ultra-low energy SIMS was originally developed to overcome some of the issues found with the conventional dynamic SIMS technique. From its development in the early 1960s until 1990, dynamic SIMS routinely employed primary beam energies of 5-20 kev, and was predominantly used by the semiconductor industry for analysis of doping implants. However, with the growth of shallow implantations meant that the beam energies 5 kev then available were too high to provide near-surface analysis, since a significant amount of the implanted species resided within the 30 nm region closest to the implanted surface. To overcome this limitation, the SIMS instrumentation was further developed to work routinely with beam energies as low as 250 ev using a new source. This was a floating low energy ion (FLIG) gun that enabled SIMS profiling to be carried out for energies in the range kev, delivering high current, small spot beams at low energy. By attaining a usable primary beam of energy 1 kev, the phrase ultralow energy SIMS (ulesims) was adopted. The technique was developed to deal with the low energy secondary ion sputtering whilst retaining the large dynamic range and high detection sensitivities. Page 92
109 Thus since ulesims is capable of delivering sub-kev ion beams with sufficient current density, it is routinely used for nanometer-resolution depth-profiling in applications in semiconductor research and development (Dowsett, 2003). Page 93
110 7.3 X-Ray Diffraction (XRD) X-ray diffraction (XRD) can be used to determine the arrangement of atoms in a crystalline solid. As X-rays have a wavelength of around 0.1 nm, which is the same order of magnitude as the spaces between atoms in a solid, X-rays get bent or diffracted when they pass between atoms arranged periodically on a lattice. More precisely, X-rays diffract when they interact with the electron cloud surrounding the atoms of the crystalline solid (Cullity, 1978). θ θ A θθ C d B Figure 7.5: Two beams with the same wavelength and phase strike a set of planes (with latticespacing of d) and are scattered off two different atoms within it. Constructive interference occurs when this length is equal to an integer multiple of the wavelength radiation. As X-ray's hit the surface of the crystal at an angle θ, some of the rays will be diffracted at an equivalent angle away from the solid (Figure 7.5). The X-ray beams travel different path lengths before hitting the various planes of the crystal. The diffracted rays have definite phase relations between them. It is constructive interference when the rays scattered by all the atoms in all planes are completely in phase and reinforce one another to form a diffracted beam. Whereas if the scattered beams are out of phase and annul one another in all other directions of space, it is destructive interference. Where the scattered rays interfere constructively, they remain in phase since the path length of each wave is equal to an integer multiple of the wavelength. In Figure 7.5, the difference in path lengths Page 94
111 of the beam striking the first plane and the beam striking the second plane is equal to AB + BC. So, the two diffracted beams will interfere constructively only if AB + BC = nλ. Basic trigonometry shows that the two segments are equal to one another with the lattice spacing (d) times the sine of the angle θ, and therefore AB = BC = dsinθ, for half the scattered angle. Thus, 2dsin θ = nλ [7.6] This equation is known as the Bragg s law, showing the path difference between two waves undergoing constructive interference. Two geometrical facts should always be considered when applying the Bragg s law: 1) the incident beam, the normal to the reflecting plane, and the diffracted beam are always coplanar, 2) the angle between the diffracted beam and the transmitted beam is always 2θ. This is known as the diffraction angle, and it is this angle, rather than θ, which is usually measured experimentally (Cullity, 1978). For the purpose of this study, XRD is used as a powder diffraction technique to characterise the apatite phase of reacted HAp powder and powdered dental enamel (Chapter 12) Grazing Incidence XRD (GIXRD) X-ray radiation has a large penetration depth into any matter, and because of this property XRD (described above) is not a surface sensitive technique. X-rays with large incidence angles will penetrate a few to several hundred µm s inside the material under study, whereby the beam penetration depth may be much greater than the sample thickness. Hence, conventional XRD is not suitable for detailed investigation of sub-surface layers in a sample. Grazing Incidence X-ray Diffraction (GIXRD), however, uses small incident angles (typically 0.3 3) for the incoming X- ray beam, so that the diffraction can be made surface sensitive. It is used to study surfaces and layers because the wave penetration is limited, and distances are in the order of nanometres. Also, grazing incidence angles increases the path length of the X-ray beam through the sample, which helps to increase the diffracted intensity Page 95
112 and minimise substrate contribution, so that conventional phase identification can be performed at the near-surface region. α x α h β β Near-surface region Bulk Enamel Figure 7.6: Schematic of GIXRD showing the analysis of the surface region of an enamel sample. x is the path-length the X-ray beam travel, h is the penetration depth and α is the grazing incidence angle. The specific X-ray penetration depth can be calculated based on the incident angle and material parameters. When X-rays penetrate a solid material, the beam intensity is absorbed by the material and the intensity reduces exponentially as given by: I = I 0 e( µx) [7.7] where µ is the linear absorption coefficient and x is the distance the X-ray beam travels. The intensity of the transmitted X-ray beam will decay to almost zero after traveling through the specimen for a certain distance. This depth is known as the penetration depth, at which the intensity of the radiation inside the material falls to 1/e (about 37%) of its original value, just beneath the surface. Therefore, the measured diffracted beam intensity will only be from the material above this depth. In Figure 7.6, the incident X-ray beam (I 0 ) gives a diffracted intensity of I 0d, after Page 96
113 travelling through the surface layer (I h ). The penetration depth, h, can be calculated by the distance the incident X-ray beam travels (1/e), x, and the grazing incidence angle (α) (see below). α x h If: I I 0 = e 1 = e -1 [7.8] x 1 μ [7.9] By trigonometry: sin(α) = h x and therefore the estimated penetration depth is: h = x. sin(α) [7.10] For the purpose of this study, GIXRD was used to identify the mineral phase formed on dental enamel in the near-surface region (Chapter 13). Page 97
114 MATERIALS & METHODS Page 98
115 Chapter 8 k SMR Experimental Methods 8.1 Materials The main materials and techniques used in the experiments are described briefly in this chapter. More specific details on materials and methods used in a particular experiment are described within each individual experimental study (Chapters 9 13). Scanning Microradiography (SMR) was the main technique used in this study and therefore the methodology for this instrument will be described in greater detail in Section Dental Enamel Blocks Anonymised caries-free permanent molars extracted for orthodontic purposes (stored in normal saline at room temperature) were randomly selected for experiments. Ethical approval was obtained from Queen Mary Research Ethics Committee (QMREC 2011/99). An annular diamond blade (Microslice annular blade- Ultratec, USA) mounted on the Microslice 2 (Malvern Instruments Ltd., UK) was used to cut blocks of enamel from a tooth. Firstly, the root was removed and discarded by a cut at the cementum, which is parallel to the tooth surface (Figure 8.1). The remaining crown part of the tooth was cut perpendicular to the natural tooth surface near the edges to obtain several blocks, and the centre part of the crown containing grooves and fissures was discarded. The enamel blocks have dimensions that are approximately 5 mm x 4 mm with a thickness of approximately 2 mm. Any dentine present was polished off using a P600 grit silicon carbide paper. Page 99
 parallel cut at the cementum, b and c) perpendicular cuts of the crown edge to obtain blocks, d) enamel block with dentine underside, e) enamel block")
 is commonly used in demineralisation studies of enamel.")
.")
116 a) b) c) d) 1.5 mm e) 4 mm 5 mm 2 mm Figure 8.1: Preparation of enamel blocks from a tooth: a) parallel cut at the cementum, b and c) perpendicular cuts of the crown edge to obtain blocks, d) enamel block with dentine underside, e) enamel block with dentine polished away Demineralising Solutions The demineralising solutions used in these studies consisted of 0.1 mol/l acetic acid (ph 4.0) to simulate caries-like conditions. Acetic acid (CH 3 CO 2 H) is commonly used in demineralisation studies of enamel. In clinical situations, carious lesions develop and progress in response to organic acids, in particular lactic acid, produced by plaque bacteria during fermentation of dietary carbohydrates (as described in Section 3.1). Therefore, ideally, lactic acid is a more desirable chemical to resemble in vitro caries conditions, however, since lactic acid is quite costly and difficult to obtain in high purity, acetic acid was used. Previous studies have shown that acetic acid exhibits a similar role to lactic acid and is equally as important in the demineralisation of enamel (Margolis and Moreno, 1992). A large batch of acid solution was prepared using 0.1 mol/l acetic acid from 100 % acetic acid (AnalaR NORMAPUR, VWR International Ltd., France) and deionised water, as a large 10.0 L acid stock. No additional calcium or phosphate was added and the ph of the solution was adjusted to 4.0 using NaOH pellets and a ph meter (Orion-pH/ISE meter Model 710). The 10.0 L acid stock was divided into 1.0 L acid reservoirs, to which was added the zinc or fluoride salts to prepare a range of Page 100
117 concentrations. Details of the specific demineralisation solution used in an experiment are given in the material and methods section of each specific study. In every study, the acid solution was made in a large batch (usually 10.0 L) so that the acid reservoirs (1 L) all consisted of the same acid strength but only differed in the concentration of zinc or fluoride salt. Page 101
118 8.2 Scanning Microradiography The SMR system apparatus is comprised of three main entities: X-Y scanning stage which holds the environmental cells, X-ray detector and X-ray generator (Figure 8.2). Solutions out X-ray beam Detector Y Solutions in X Figure 8.2: Schematic of SMR X-Y scanning stage with multiple SMR cells containing enamel blocks and HAp disc (reference). Test solutions are circulated in the cells. An X-ray beam is fixed on a specimen and the attenuated X-ray photon is detected by a photon counting detector X-Ray Generator SMR requires a very stable X-ray source that demands a high voltage power supply. SMR uses a 15- m X-ray beam from a microfocus X-ray generator (BRUKER AXS B.V., The Netherlands) with a PANalytical X-ray tube with a silver (Ag) target that gives a characteristic Kα peak at 22.1 kev. An approximately 15 µm aperture consisting of 90 % gold and 10 % platinum was used to produce an X-ray beam of approximately 15 µm diameter X-Ray Detector The X-ray beam is attenuated as it passes through the specimen and transmitted X- ray photons are counted by a high purity germanium detector (Ametek, PA, USA). The detector was coupled to a MCA analyser and digital spectrometer (DSPEC PLUS TM (Digital Gamma-Ray Spectrometer, ORTEC, Ametec, PA, USA), which allows spectrum capture, so that electronic monochromatisation could be achieved. Page 102
119 12.5 mm 50.0 mm 12.5 mm X-Y Scanning Stage The environmental cells containing the samples were mounted on the SMR X-Y scanning stage, which is fitted with a 0.1 µm resolution linear encoder and driven by stepper motors controlled by a computer software. This permits the positioning of the stage in the X and Y directions with absolute micrometer precision to bring the specimen in line with the X-ray beam. The dimensions of the X-Y stage are 600 mm (horizontal) and 200 mm (vertical) in length and can hold up to 30 cells. The software was designed so that the experiments can be pre-programmed with different scanning parameters (i.e. time, step size, number of steps, standards etc.) for each specimen SMR Environmental Cell SMR environmental cells are made of Perspex (polymethyl methacrylate-pmma) (Figure 8.3). The cell dimensions are 4.0 x 5.0 cm. Each cell has a chamber located at the centre of the cell that is 2.5 cm in diameter and 4.0 mm in depth. The cover for each cell is also made of Perspex, it has the same dimension as the cell itself but with 1.0 mm thickness. The sample was fixed inside the centre of the chamber using acid-resistant nail varnish, and the cell was securely sealed by attaching the cover on top with screws and silicon glue (Figure 8.4). Once the cell was dry, it was mounted on to the SMR X-Y scanning stage. 1.0 mm 4.0 mm 25.0 mm 6.0 mm 40.0 mm 1.0 mm cover thickness Figure 8.3: Schematic diagram of SMR environmental cells showing top down and side views with dimensions. Page 103


. Figure 8.")
120 Solution Out Inner chamber Enamel block Solution In Figure 8.4: Schematic diagram of SMR environmental cell containing an enamel block SMR Data Collection The procedure for SMR data acquisition requires the following sequence of steps: 1. Finding the location of sample in SMR cell 2. High resolution area scan of sample 3. Selection of scan positions on sample 4. Collection of mineral mass measurements at scan positions Area Scan of Sample Before the main experiment, an approximate area scan was performed to find the location of the sample in the SMR cells (Figure 8.5). Figure 8.5: An approximate area scan of the enamel specimen and HAp disc (for standard measurements) in SMR cells. Once the positions of the samples were located in the SMR cells, the sample was scanned with a very small step size (i.e. between mm) in both the x and y Page 104

121 directions. This produces a high resolution area scan of the enamel sample which shows the different mineral density levels (Figure 8.6). Three co-ordinates were chosen on a horizontal line on the sample and at a region of the highest mineral distribution. These co-ordinates were the scan positions i.e. the location on the sample that is measured throughout the experiment for changes in enamel mineral mass. Each scan position was 0.5 mm apart on the sample. x x x Series16 Series15 Series14 Series13 Series12 Series11 Series10 Series9 Series8 Series7 Series6 Series5 Series4 Series3 Series2 Series Figure 8.6: High-resolution area scan of enamel sample. The coloured scale bar represents the mineral distribution in the enamel sample. X mark show the three scanning positions selected for mineral mass measurements Mineral Mass Measurements at Scan Position Each scan position was repeatedly measured during the course of the experiment with a count time of 60 seconds. The transmitted photon counts at the chosen scan positions on the sample were standardised against a standard measurement, which was a position outside the specimen. Standardisation is used to compensate for any fluctuation in the generation of X-rays or instability of the photon-counting detection system. The standard measurement was taken at a scan position on a synthetic HAp compressed disc (standard material) that was located in a SMR cell adjacent to the SMR cell containing the sample for study (see Figure 8.5). The static HAp has a homogenous composition and is unaffected by changes in the Page 105
122 experimental setup, therefore measurements taken in the HAp standard material can be used as a reference (I 0 ) value. The first and last SMR measurement was always in the HAp standard, and during the course of the experiment every 10 measurements were in the HAp standard, which had a count time for 30 seconds. A large number of data points ( ) were obtained resulting in good statistical accuracy SMR Data Analysis For the duration of the SMR experiment, the 3 scan positions were repeatedly measured and real time counts are detected by the photon counter. Data analysis began by standardising the counts at the chosen scan positions on the specimen against a standard measurement in the HAp reference material, to correct for variations in X-ray counting. By introducing the density of the material (ρ), the Beer s Law (Section 6.3.1) can be written as: I = I 0 e μ ρ m [8.1] where I is the transmitted X-ray intensity, I 0 is the incident X-ray intensity, and m is the mass per unit area of material (g/cm 2 ) in the path of the beam. The mass per unit area is obtained by multiplying the thickness t by the density ρ, i.e., m = ρt. Equation 8.1 can also be written as: m = 1 μ ρ [ln 1 N ln 1 N 0 ] [8.2] where N is the number of transmitted photons, and N 0 is the number of incident X- ray photons from measurements taken in the HAp standard material. From Equation 8.2, the integrated mass per unit, at a point, can be determined for a material of known MAC, by measuring the intensity of the incident and transmitted X-ray beams, for monochromatic radiation. Differentiating Equation 8.2 gives the error of m as: Page 106
123 δm = 1 μ ρ [ 1 N + 1 N 0 ] [8.3] 1 can be neglected as the number of incident X-ray photons, N 0, is very high N 0 ( 500,000). N, the number of transmitted X-ray photons, is typically 50,000, which give a fractional error in m of ±0.5 %. Using Equation 8.2, the mineral mass of enamel per unit area (g/cm 2 ) can be calculated by using the mass attenuation coefficient for stoichiometric HAp (4.69 g/cm 2 ) calculated for AgKα radiation. Therefore, at the selected scan position, the X- ray attenuation value can be converted to a mass value of enamel per unit area (g/cm 2 ) Determination of RML enamel at a Single Scan Position Mineral mass per unit area (gcm -2 ) Time (h) Figure 8.7: Typical example of a SMR raw data plot showing the linear change in mineral mass per unit area plotted against time ( 40 h) during exposure to acidic conditions (ph 4.0) at a single scan position on an enamel sample. RML enamel was determined by linear regression fitting of the slope (4.579 x 10⁻⁴ g cm -2 h -1, SE = 8.02 x 10⁻⁶ g cm -2 h -1 ). Figure 8.7 is an example of a typical SMR raw data plot at a scan position showing the change in the enamel mineral mass per unit area plotted as a function of time, Page 107
124 during exposure to acidic solutions (0.1 M acetic acid, ph 4.0). Based on the assumption that the change in the mineral mass loss per unit area is linear with time, the demineralisation rate can then be calculated as: y = a + bx [8.4] where y is the projected mineral mass of enamel per unit area, x is the time, b is the rate of enamel demineralisation, and a is the intercept with the Y-axis. The rate of enamel mineral loss (RML enamel ) value and associated statistical error were calculated from the slope by linear regression fitting using SigmaPlot 10.0 (Systat Software, California, USA). The accuracy of the linear regression fitting was ensured by using a large number of data time-points measured at a scan position. The standard error (SE) of each rate measurement at a scan position was the SE of the slope coefficient of the fitted straight line. Figure 8.7 shows that the change in enamel mineral mass over 40 h is 4 % and the RML enamel is 4.58 x 10⁻⁴ g/cm 2 /h Changes in RML enamel at A Scan Position The SMR cell containing the sample was mounted on the X-Y stage, which was moved and repositioned with high precision (±0.5 µm) under computer control. Mineral mass measurements were taken repeatedly at 3 fixed scan positions 0.5 mm apart, every 60 s on a sample throughout the experiment. Initially, a 1.0 L acidic solution (0.1 M acetic acid, ph 4.0) was circulated through the SMR cell for a period of 40 h whilst continuously taking SMR measurements at each scan position. All experiments were carried out at room temperature, in a thermostatically controlled laboratory (at 22 ± 1 C). After the initial demineralisation period, the SMR cell was circulated with an equivalent composition of acidic stock solution containing a specific concentration (X ppm) of an ion M 2+, [M 2+ ] ( 40 h). Subsequently, each [M 2+ ]-containing acid solution was circulated for 40 h through the SMR cell at sequentially increasing [M 2+ ]. SMR was used to measure mineral mass throughout all the demineralisation periods. Figure 8.8 is an example demonstrating how the gradient of the measured slope at a single scan position on a sample changes with X ppm [M + ] in the acidic Page 108
125 solution. More specific details on the SMR experiments are described in the individual studies for fluoride (Chapter 9) and zinc (Chapter 11) Mineral loss per unit area (gcm -2 ) Control (0 ppm [M 2+ ]) Reduction in RML enamel Test (X ppm [M 2+ ]) Time (h) Figure 8.8: Comparing the gradient of the measured slope (0 and X ppm [M + ]) measured at a single scan position on a sample Percentage Reduction in RML enamel For an individual scan position, the RML enamel value obtained at 0 ppm [M 2+ ], i.e. acidic condition, was the control RML enamel for that position. Accordingly, the test RML enamel value obtained for each X ppm [M 2+ ] test condition was compared with the control RML enamel value for that scan position. The differences in the demineralisation rates between control and each test RML enamel value was calculated as a percentage, i.e. the percentage reduction in RML enamel (PRML enamel ). This is described by the Equation below: PRML enamel = Control RML enamel Test RML enamel Control RML enamel x 100 [8.5] As enamel is naturally variable in its composition, the rate of enamel demineralisation (RML enamel ) will differ significantly between teeth and for different positions within the same tooth. Likewise, the demineralisation rate will vary at different locations on the sample, and hence the RML enamel values for different scan positions will also vary. One great advantage of the SMR system is that it allows the Page 109
126 accurate micro-repositioning of a sample for repeated measurements, and therefore permits each individual scan position on a sample to act as its own control for RML enamel. Page 110
127 EXPERIMENTAL STUDIES Page 111
128 Chapter 9 k Effect of Fluoride Ion Concentration on Enamel Demineralisation Kinetics in vitro: Real-Time SMR Study 9.1 Introduction Although the incidence of dental caries has declined in the past forty years, it remains the most common global disease in both adults and children (Peterson et al., 2005). The increasing preference for more western diets high in carbohydrates and refined sugars is a leading cause for this (section 3.1). Fluoride (F ), the most effective preventive measure, can be found in various forms and concentrations (see section 4.4). There is continued interest in fluoride s therapeutic potential, in particular refining the understanding of its mechanistic action. Whilst most studies have focused on the more general cariostatic action of fluoride, there are very few which measure the direct physical effects of fluoride on the demineralisation of enamel in real-time. Most in vitro systems involve indirect discontinuous analysis methods, e.g. solution Ca 2+ are quantified (Margolis et al., 1986). Additionally, it is difficult to fully replicate the complex nature of the oral environment, or allow for the strict chemical control of individual variables of a multi-factorial disease, this includes the salivary pellicle. Furthermore, significant variations exist naturally in human enamel tissue composition, and therefore demineralisation rates can vary significantly between different teeth specimens, and, at different locations in the same tooth specimen. Page 112
129 9.2 Aim The aim of this in vitro study was to measure the direct physical effects of fluoride concentration [F ] on the real-time demineralisation of enamel during exposure to caries simulating conditions using Scanning Microradiography (SMR). SMR was used to measure mineral mass changes in enamel blocks during exposure to in vitro acid solutions simulating caries (ph 4.0) in real-time, whilst the subsequent [F ] of the acid challenge was successively increased and SMR measurements continued for periods of 48 h. Thus, real-time measurements of the effects of [F ] (in the range ppm) on the rate of enamel demineralisation were obtained, on the same sample and at the same location. * The study described in this chapter was published in Journal of Dentistry (December 2013). See Appendix D. Page 113
 with a thickness of 2 mm were cut from each tooth (see section 8.1.1).")

130 9.3 Materials and Methods Preparation of Human Enamel Blocks Anonymised caries-free permanent molars (teeth A, B and C) extracted for orthodontic purposes were randomly selected. Enamel blocks ( 5 x 5 mm) with a thickness of 2 mm were cut from each tooth (see section 8.1.1). One enamel block was obtained from tooth A (block A), one from tooth B (block B), and two enamel blocks were cut from a third tooth specimen C (block C1 and block C2) at different sites on the same molar. Each block was located in a separate SMR environmental cell. The cut internal surfaces of the enamel blocks were coated with acid-resistant varnish, leaving only the natural surface perpendicular to the X-ray beam. Figure 9.1 shows an enamel block enclosed in an SMR cell (volume 2 cm 3 ) through which acid solutions were circulated at ml min -1, whilst the narrow X-ray beam is targeted at a fixed position on the sample. Figure 9.1: Schematic diagram of SMR environmental cell containing an enamel block sample. The narrow X-ray beam repeatedly measures 3 fixed scan positions on a sample during the experiment, and the attenuated beam is detected by a solid-state detector. Page 114
131 9.3.2 Preparation of [F ]-Containing Acid Solutions A series of acidic solutions were made from analytical grade reagents. A 10.0 L stock of 0.1 mol/l acetic acid (AnalaR NORMAPUR, VWR International, France) was prepared with deionised water and adjusted with NaOH to ph 4.0. Subsequently, this was divided into ten 1.0 L flasks. Sodium fluoride (NaF) (Sigma-Aldrich) was added to the acid reservoirs to prepare solutions containing: 0, 0.1, 0.5, 2.3, 11.3, 45.2, 135.7, 452.5, , ppm [F ] respectively. This concentration range was used to mimic those found in dentifrices (see Section 4.4) and in the oral environment post-application, which is typically a 1/4 dilution of the original concentration in the product SMR Experiment The SMR cells containing the enamel blocks were mounted on the X-Y stage. Mineral mass measurements were taken repeatedly at 3 fixed scan positions 0.5 mm apart, every 60 s on each sample (sample A, B, C1 and C2) throughout the experiment (see Section 8.2 for SMR methodology). Initially, a 1.0 L acidic solution (0 ppm [F ]) was circulated through the SMR cell for a period of 48 h whilst continuously taking SMR measurements. After the initial demineralisation period, each cell was then circulated with an equivalent composition of acidic stock solution but containing 0.1 ppm [F ] for 48 h. Subsequently, each [F ]-containing acidic solution was circulated for 48 h through the SMR cell at sequentially increasing [F ]. SMR was used to measure mineral mass throughout all the demineralisation periods. All measurements were carried out at 23.0 ±1.0 C Determination of RML enamel The mineral mass loss per unit area was plotted as a function of time and the rate of enamel mineral loss (RML enamel ) values and associated statistical errors were calculated from the slope by linear regression fitting using SigmaPlot (see Section 8.2.9). Page 115
132 The RML enamel measurements at each [F ] were compared with those during acid demineralisation (0 ppm [F ]) for every scan position. The difference in the demineralisation rates between 0 ppm [F ] and each test condition is shown as the percentage reduction in RML enamel (PRML enamel ). Due to the natural variability in the composition of enamel, the RML enamel will differ significantly between teeth and for different positions within the same tooth. However, as the SMR system allows accurate repositioning of samples for repeated measurements, each position on each sample acted as its own control for RML enamel (0 ppm [F ]). For reproducibility, 3 different scan positions were measured on each enamel sample (A, B, C1 and C2) from 3 different tooth specimens. In total, the RML enamel was measured at a total of 12 different scan positions. Page 116
133 9.4 SMR Results Mineral mass loss per unit area (gcm -2 ) Time (h) Figure 9.2: Typical SMR raw data plot showing the mineral loss per unit area plotted against time ( 40 h) during exposure to acidic conditions (ph 4.0, [F ] = 0 ppm) at a single scan position on a sample. RML enamel was determined by linear regression fitting of the slope (y = a + bx), R 2 = Error bar shows the statistical error arising from the photon-counting statistics. [F - ] Value SE t-value a (10-4 g cm -2 ) b (10-4 g cm -2 h -1 ) Table 9.1: Statistical analysis for the data in Figure 9.2, using SigmaPlot Figure 9.2 shows a typical SMR measurement taken at a single scan position on a sample during the initial 48 h demineralisation period (0 ppm [F ]). The mineral mass loss was approximately linear with time at each measured scan position. During this demineralisation period, the overall decrease in mineral mass was 4 % with an accuracy of ±0.08 % demonstrating the high sensitivity of SMR to very small changes in mineral. The slight deviations from linearity observed have been previously attributed to local changes in the enamel and/or mineral structure due to natural variability in enamel composition as a function of depth (Anderson et al., Page 117
134 1998, Dowker et al., 1999). Table 9.1 summarises the linear regression and statistical analysis Mineral loss per unit area/gcm ppm [F - ] 0.45 ppm [F - ] Time (h) 4524 ppm [F - ] Figure 9.3: Comparing the gradient of the measured slope (0, 0.5 and 4525 ppm [F - ]) measured at a single scan position on a sample. [F ] b (10-4 g cm -2 h -1 ) SE (10-4 g cm -2 s -1 ) t-value 0 ppm ppm ppm Table 9.2: Statistical analysis for the data in Figure 9.3, using SigmaPlot Figure 9.3 compares the RML enamel for 0 ppm, 0.5 ppm and 4525 ppm [F ], measured at a single scan position. The different gradients of the lines demonstrate that increasing [F ] in the acidic solution significantly reduced the RML enamel. Table 9.2 summarises the linear regression and statistical analysis for each slope in Figure 9.3. Page 118
135 PRML enamel (%) [F - (ppm)] Figure 9.4: The change in the mean of the PRML enamel plotted as a function of successively increasing [F ] (ppm) in the acidic solution. Error bars show the standard error. Figure 9.4 shows the mean PRML enamel values plotted as a function of log [F ]. There appears to be a log-linear increase in the mean PRML enamel as a function of log [F ] in the range ppm [F ], but above 135 ppm [F ] the mean PRML enamel remained at about 90 %. The RML enamel values with the associated standard errors for all scan positions measured on enamel blocks (A, B, C1 and C2) are shown below in Table 9.3. The PRML enamel values calculated for each scan position are also shown. Although the RML enamel values were different in each sample, the percentage reductions compared to 0 ppm [F ] were remarkably similar. Page 119
136 F CONCENTRATION (ppm) ENAMEL BLOCK SCAN POSITION A 1 RML enamel (10-4 g cm -2 h -1 ) / SE (10-4 g cm -2 s -1 ) PRML enamel (%) A 2 RML enamel (10-4 g cm -2 h -1 ) / SE (10-4 g cm -2 s -1 ) PRML enamel (%) A 3 RML enamel (10-4 g cm -2 h -1 ) / SE (10-4 g cm -2 s -1 ) PRML enamel (%) B 1 RML enamel (10-4 g cm -2 h -1 ) / SE (10-4 g cm -2 s -1 ) PRML enamel (%) B 2 RML enamel (10-4 g cm -2 h -1 ) / SE (10-4 g cm -2 s -1 ) PRML enamel (%) B 3 RML enamel (10-4 g cm -2 h -1 ) / SE (10-4 g cm -2 s -1 ) PRML enamel (%) Page 120
137 C1 1 RML enamel (10-4 g cm -2 h -1 ) / SE (10-4 g cm -2 s -1 ) PRML enamel (%) C1 2 RML enamel (10-4 g cm -2 h -1 ) / SE (10-4 g cm -2 s -1 ) PRML enamel (%) C1 3 RML enamel (10-4 g cm -2 h -1 ) / SE (10-4 g cm -2 s -1 ) PRML enamel (%) C2 1 RML enamel (10-4 g cm -2 h -1 ) / SE (10-4 g cm -2 s -1 ) PRML enamel (%) C2 2 RML enamel (10-4 g cm -2 h -1 ) / SE (10-4 g cm -2 s -1 ) PRML enamel (%) C2 3 RML enamel (10-4 g cm -2 h -1 ) / SE (10-4 g cm -2 s -1 ) PRML enamel (%) Table 9.3: RML enamel values with the associated standard error for all scan position measured on samples (A,B,C1 and C2). For every position, the RML enamel measurements at each [F ] were compared with those during acid demineralisation at 0 ppm [F ]. The difference in the demineralisation rates between 0 ppm [F ] and each test condition is shown as a PRML enamel. For every scan position, the RML enamel measurement at each [F ] was statistically different (P 0.05) when compared to the RML enamel measurement at acid demineralisation (0 ppm [F ]) (see Section 9.3.3). Page 121
138 9.5 Discussion Although the in vitro model used in the present study does not fully replicate the complex nature of the oral environment, it does provide a strategic approach for the strict chemical control of individual variables of a multi-factorial disease. A tooth-pellicle-plaque-saliva interface was not simulated in this study to ensure direct measurements of enamel demineralisation as effected by [F ]. The presence of an acquired pellicle would likely protect enamel surfaces from an acid challenge to some extent, reducing the magnitude of the fluoride effect but probably not the observed log-linear dependency of [F ] on reducing demineralisation (Figure 9.4), at least to any substantial effect (Garcia-Godoy and Hicks, 2008). The composition of enamel is naturally variable between teeth, even within the same tooth as a result of many factors which will significantly influence demineralisation rates. Nevertheless, the results show that at each scan position the mineral mass loss was approximately linear with time (Figure 9.2). To ensure reproducibility, demineralisation studies were conducted on samples obtained from different teeth. Numerous samples were not necessary in this study as each scan position acted as its own control. The RML enamel values at 0 ppm [F ] did not vary considerably between adjacent positions (0.5 mm apart) on the same sample, but did differ markedly between samples, demonstrating the influence of natural variability between teeth (Table 9.1, 0 ppm [F ]). Enamel samples C1 and C2 obtained from different sites on the same tooth also showed considerable variation in RML enamel (0 ppm [F ]) between the two sets of 3 scan positions measured on each sample. These results highlight the variability in solubility properties of enamel both between teeth, and, at different locations within the same tooth. Despite these differences, the PRML enamel in all samples were modified similarly when subjected to [F ]-containing acidic solutions. Enamel is a sufficiently porous tissue, and permits the inward diffusion of acidic protons into its structure, promoting chemical reactions that remove mineral. Several studies have shown that fluoride present in solution can markedly inhibit the dissolution of enamel, even at very low concentrations that range from Page 122
139 2.0 ppm.(ten Cate and Duijsters, 1983, Yamazaki et al., 2007). In the present study, a 15 % reduction in the RML enamel was measured with as little as 0.1 ppm [F ]. In general, the continuous SMR data shows that enamel demineralisation was increasingly reduced with successive increases in [F ] in the acidic solutions. In the range ppm, there was a log-linear relationship between [F ] and reduction in demineralisation (Figure 9.4). A log-linear dependency of [F ] on inhibition of the initial demineralisation rate of carbonated-hap powder has previously been reported and the authors suggested this is due to the direct effects of F adsorption on dissolution sites at the crystal surfaces (Featherstone et al., 1990). The result of this log-linear dependency is that fluoride exhibits a greater change in reducing demineralisation at lower [F ] compared to higher [F ] ranges; for example, 11 ppm [F ] resulted in an 70 % decrease in RML enamel, whereas for 135 ppm [F ] there was an 90 % decrease. This effect of fluoride, especially at these low background concentrations could have significant clinical implications relevant to those levels typically present in saliva and plaque fluid. There is overwhelming evidence that low [F ] found in saliva can significantly reduce enamel demineralisation, and the higher values typically found in plaque have the potential to remineralise, even at ph values typically regarded as demineralising (Lynch et al., 2006). The thermodynamic driving force for enamel demineralisation and remineralisation is dependent upon the local degree of under- or super- saturation. Solutions undersaturated with respect to HAp would promote demineralisation, whereas supersaturated solutions would promote remineralisation of enamel. It should be emphasised that the acid solutions used in the current study did not contain any additional calcium or phosphate ions, and it was ensured there were no build-up effects of these ions due to the large volume of stock reservoir used. Fluoride is added in dentifrices at a range of concentrations (see section 3.4) with the primary aim of inhibiting net enamel demineralisation and enhancing remineralisation. The residual amount of F remaining in the mouth after rinsing is approximately <10 % of what was originally in the product (Duckworth and Page 123
140 Morgan, 1991). It was reported that regular, twice-daily brushing with a fluoride toothpaste typically elevates fluoride levels by twofold in resting saliva and even more so in plaque 12 h after application (Lynch et al., 2004). The current study demonstrates that under the constant acidic conditions studied, [F ] up to 135 ppm does significantly reduce demineralisation; however, there is no further significant reduction in demineralisation >135 ppm [F ]. Although these values are based on an in vitro dissolution model and cannot be directly translated to the oral environment, the findings substantiate that near-optimum effects can be achieved at quite low [F ]. It has been reported that sub-ppm [F ] are sufficient for preventing the initiation of caries in sound enamel, but considerably higher concentrations are required once a carious lesion has formed (Margolis et al., 1986, Yamazaki et al., 2007). Therefore the availability of adequate [F ] in the oral fluids is critical to decrease net demineralisation during an acidic challenge and to promote remineralisation in a potential caries initiation sites. 9.6 Conclusion This study demonstrated a log-linear relationship between the reduction in enamel demineralisation and [F ] up to 135 ppm. The ability of fluoride to significantly decrease demineralisation, particularly at lower background concentrations, should not be neglected. Under the conditions used, a local [F] < 135 ppm provided somewhat optimum protection of enamel against dissolution, which may suggest these concentrations of F in the oral fluids are sufficient to prevent demineralisation during a cariostatic challenge. Page 124
141 Chapter 10 k Effects of Fluoride Ion Concentration on in vitro Enamel Demineralisation Characterised by 19 F MAS-NMR 10.1 Introduction Topical applications of fluoride (e.g. fluoride toothpastes, gels, varnishes and mouthwashes) are considered a more effective measure for caries prevention than systemic use of fluorides (see Section 4.4.3) (Ripa, 1991). Fluoride incorporated into the enamel apatite structure has been shown to enhance the resistance of the tooth to acidic challenges and thus reduce lesion development (ten Cate and Featherstone, 1991, Takagi et al., 2000). In addition, the anti-caries effect of topically applied fluoride has also been attributed to calcium-fluoride-like deposits formed on dental hard tissues, which is thought to act as a protective barrier on the surface, and serve as a reservoir for fluoride (see Section 4.4.4) (ten Cate, 1997). Given the large number of caries preventative dental products available containing highly variable fluoride concentrations, it is perhaps surprising that few experimental studies have been undertaken to establish the effects of increasing fluoride concentration on the resulting mineral phases formed on enamel. Likewise, there is continued interest in fluoride s therapeutic potential particularly its optimum concentration for anti-caries efficacy. Page 125
142 10.2 Aim The aim of this study was to investigate the mechanistic action of varying fluoride concentration ( ppm [F ]) on the reduction of enamel demineralisation during caries-simulating conditions. 19 F MAS-NMR (see section 7.1) was used to characterise the fluoride-enamel interactions under acidic conditions as a function of [F ]. The secondary aim was to investigate FAp formation on enamel in the mechanism of fluoride anti-caries efficacy. The 19 F MAS-NMR results were corroborated by measuring the calcium and phosphorus ions released from the enamel during these reactions using Inductively Coupled Plasma Optical Emission Spectroscopy (ICP-OES), and by measuring the changes in weight of the enamel blocks. * The study described in this chapter was published in Caries Research (February 2013). See Appendix D for a full version of the paper. Page 126
143 10.3 Materials and Methods Preparation of Human Enamel Blocks Caries-free permanent molars were used to cut blocks of enamel ( 5 x 5 mm) with a maximum thickness of 2 mm (details on the preparation of the enamel blocks were described in section 8.1.1). The location of cut in each tooth was recorded. The linear dimensions and weights of each block were also recorded Preparation of [F ]-Containing Acid Solutions A series of acid solutions were made from analytical grade reagents. A 10.0 L stock of 0.1 mol/l acetic acid (AnalaR NORMAPUR, VWR International, France) was prepared with deionised water and adjusted with NaOH to ph 4.0. Subsequently, this was divided into ten 1.0 L flasks. Sodium fluoride (NaF) (Sigma-Aldrich) was added to the acid reservoirs to prepare acid solutions containing: 0, 0.45, 7, 11, 29, 45, 136, 452, 656, 1357 and 2262 ppm [F ] respectively, selected to include concentrations of topically available fluoride Demineralisation of Samples Each enamel block was placed in a container with 50 ml of acidic solution (0 ppm [F ]) at 37 C in a shaking incubator (KS 4000i control, IKA, UK) at 60 RPM for 24 h. Subsequently, each sample was immersed in 50 ml of a [F ]-containing acid solution at 37 C for 96 h. Samples were dried and weighed using a balance accurate to ± g (Mettler HK, Switzerland) before and after immersion to calculate the percentage mineral weight loss of each sample after 96 h F MAS-NMR Analysis of Enamel Blocks Each sample was dried and grounded to a fine powder for solid-state 19 F MAS-NMR analysis. 19 F MAS-NMR was carried out using a 600 MHz (14.1 T) spectrometer (Bruker, Bremen, Germany) at a Larmor frequency of MHz under spinning conditions of 15 khz in a 2.5 mm rotor. The spectra were acquired using a low fluorine background probe in a single pulse experiment of 30 s recycle duration. The 19 F chemical shift scale was referenced using the 120 ppm peak of 1 M NaF Page 127
144 solution, with a secondary reference of CFCl 3. Typically spectra were acquired for h depending on the fluoride level and are an accumulation of between 600 and 1440 scans ICP-OES Analysis of [F ]-Containing Acidic Solutions After reaction with enamel, the fluoride-containing demineralising solutions were diluted by a factor of 1:20 to lower the background Na levels (for analysis of phosphorus and calcium), with an acidification of 1 % (0.1 ml of 69 % nitric acid in 10 ml) and quantitatively analysed by ICP-OES (ICP; Varian Vista-PRO, Varian Ltd., Oxford, UK). Each measurement was replicated. Calibration solutions were demineralising solutions (0.1 M acetic acid, ph 4.0) with the same ionic strength as a sample reaction solution, but diluted by a factor of 1:20 and also with an acidification of 1 % using 69 % nitric acid. Calcium and phosphorus standards were used in the concentration range ppm. The instrumentation error was determined by repeated measurements of 1.0 ppm calcium and 1.0 ppm phosphorus containing standard solutions. Page 128
145 10.4 Results F MAS-NMR Figure 10.1 shows a series of 19 F MAS-NMR spectra of the enamel demineralised in the presence of a range of [F ] F Chemical shift, ppm CaF 2 reference 2262 ppm [F - ] 1357 ppm [F - ] 656 ppm [F - ] 452 ppm [F - ] 136 ppm [F - ] 45 ppm [F - ] 11 ppm [F - ] FAp reference 0 ppm [F - ] Figure 10.1: 19 F MAS-NMR spectra of enamel samples immersed in increasing concentrations of fluoride in the acidic solutions for 96 h shown in the following order: Control enamel block not exposed to fluoride, fluorapatite (FAp) reference, enamel block in 11 ppm [F ], enamel block in 45 ppm [F ], enamel block in 136 ppm [F ], enamel block in 452 ppm [F ], enamel block in 656 ppm [F ], enamel block in 1357 ppm [F ], enamel block in 2262 ppm [F ], Calcium fluoride (CaF 2 ) reference. Asterisks mark spinning side bands. 19 F MAS-NMR spectra obtained for the enamel section exposed to no F exhibited a flat baseline with no detectable fluoride present. The FAp reference spectra showed a characteristic peak at 102 ppm corresponding to the triangles F Ca(3) in the apatite structure, whilst the CaF 2 reference showed a characteristic peak at 108 ppm corresponding to the F Ca(4) site. For the samples demineralised in the presence of F, 19 F chemical shift peaks were identified by comparison with reference spectra, and formation of fluoride-substituted apatite (Ca 10 (PO 4 ) 6 F 2 x (OH) x, F s -HAp) (see Section 4.4.1) and calcium fluoride (CaF 2 ) was Page 129
146 observed from the peaks. Signals from both the F s -HAp and CaF 2 environment are clearly observed in approximately equal proportions in the spectrum of the 45 ppm [F ] sample. At [F ] above 45 ppm, less F s -HAp forms and instead there is an increased CaF 2 signal. For the 136 ppm [F ] sample, the predominant mineral phase formed is CaF 2, however F s -HAp is also evidently present. At 452 ppm [F ], the peak is asymmetric which indicates the presence of some F s -HAp although CaF 2 is the major phase formed. For [F ] above 452 ppm, the spectra are nearly identical and demonstrate mostly a CaF 2 -like environment ICP-OES Figure 10.2 shows the Ca 2+ and PO 4 3 released into the reaction solution following demineralisation of enamel samples [Ions], ppm/mm Ca P [F - ], ppm Figure 10.2: ICP measurements of the calcium and phosphorus detected in reaction solutions containing increasing [F ]. =Phosphorus ions = Calcium ions. The dashed lines show the calcium and phosphorus in acidic solutions under control conditions (0 ppm [F ]). The error bars show the instrumentation error. The Ca 2+ and PO 4 3- released into the demineralising solutions decreased markedly as the [F ] was increased from 0 45 ppm. Further, the PO 4 3 release was lower than the Ca 2+ release. Above 100 ppm [F ], there was substantially lower Ca 2+ release. Above 452 ppm [F ], no further decrease in the Ca 2+ release was detected, however, Page 130
147 the PO 4 3 release increased as the F in the demineralising solution increased in the range ppm. Figure 10.3 shows the Ca/P ratio calculated from the ion release data Ca/P ratio in solution [F - ] (ppm) Figure 10.3: Ca/P ion ratio in solution as a function of [F ]. The dashed line shows the Ca/P ion ratio under control conditions Mineral Weight Loss [F ] (ppm) % weight loss [Ca] (ppm) [P] (ppm) Ca/P ± ± ± ± ± ± ± ± ± ± ± ± ± ± ± ± ± ± ± ± ± ± ± ± ± ± ± ± ± ± ± ± ± Table 10.1: The percentage enamel weight loss of enamel blocks and the calcium and phosphorus ion release into acidic solution with increasing [F ] ppm. Page 131
148 Table 10.1 shows the percentage weight loss of the enamel blocks and the calcium and phosphorus ions measured in solution as a function of [F ]. 0.8 Percent weight loss/mm [F - ] ppm Figure 10.4: The percentage enamel weight loss/mm 2 of samples with increasing [F ] ppm. The dashed line shows the % percentage enamel weight loss/mm 2 under control conditions. The error bars show the instrumentation error. Mineral loss was measured by comparing the weight loss per unit area of enamel samples before and after immersion into acidic solutions. Figure 10.4 shows the percentage weight loss of the enamel blocks per unit area with increasing [F ]. For the control sample (0 ppm [F ]) there is a weight loss of 0.74 % mm -2. However, the addition of 0.45 ppm [F ] reduced mineral loss to 0.47 % mm -2. For the solution with 11 ppm [F ], demineralisation further decreased down to 0.15 % mm -2 and did not change substantially up until 452 ppm [F ]. However, the % mineral weight loss increased above 136 ppm [F ]. Page 132
149 10.5 Discussion The 19 F MAS-NMR spectra (Figure 10.1) showed the formation of calcium fluoride (CaF 2 ) and fluoride-substituted apatite (Ca 10 (PO 4 ) 6 F 2-x (OH) x, F s -HAp) as the main chemical species on the enamel samples, that were demineralised with the addition of varying fluoride concentrations. Below 45 ppm [F ], fluoride is predominantly present as F s -HAp with smaller amounts of CaF 2 present. At 136 ppm [F ] and above, CaF 2 is the predominant mineral phase. Larsen and Jensen (1994) reported that in solutions saturated with enamel apatite, CaF 2 formation was initiated with as little as 100 ppm [F ] present in solution at low ph conditions, in agreement with this study. The spectra are identical for all the concentrations of fluoride above 136 ppm, demonstrating mostly a CaF 2 -like environment. Deconvolution of the spectra showed that there may be a variety of F s -HAp phases present and further work is required to support this, however was beyond the scope of this study. In the present study the type of F s -HAp could not be identified. White et al., (1988) first addressed the reaction products formed on powdered dental enamel under conditions of mineral fluoridation at neutral ph in 1988, and later studied these effects using high-resolution NMR (White et al., 1994). They reported a peak which was ascribed to non-specifically adsorbed fluoride that was suggested to be fluoride which is hydrogen-bonded to the phosphate protons on the apatite surface. Furthermore, a relatively small peak for FHAp was reported, although no peak for CaF 2 was observed. Their use of powdered enamel increased the surface area, which allows for greater ionic interactions between fluoride and apatite. Whereas, in the present study, bulk enamel samples were used, subjected to longer equilibration periods (96 h), and, under demineralising conditions (ph 4). This method mimics the oral environment more closely as the changes occurring in the enamel are limited to the interactions at the natural enamel surface with fluoride and could also explain why CaF 2 precipitation was observed in this study with increasing [F ]. Page 133
150 ICP-OES analysis showed a decrease in the PO 3 4 and Ca 2+ release with increasing [F ] in the demineralising solution (Figure 10.2). Above 45 ppm, the Ca 2+ release was lower than PO 3 4 release. At lower [F ] ( 45 ppm) (Figure 10.3), the Ca/P ratio decreased from 1.8 to 1.4 suggesting incongruent dissolution of the mineral. However, at [F ] above 45 ppm, this ratio decreases sharply to below 0.2, which may be due to calcium being used to form CaF 2 and as a result there being insufficient available Ca 2+ to form FAp. A decrease in demineralisation rate was also seen from the weight loss data with increasing [F ] (Figure 10.4). In the present study, [F ] above 136 ppm does not substantially decrease demineralisation further, and in fact a slight increase in demineralisation was observed. This change in behaviour is consistent with the ICP-OES data, which shows an increase in PO 3 4 released for [F ] of 136 ppm and above (Figure 10.2). This finding suggests that at higher [F ], there is preferential release of phosphate from the apatite structure, i.e. a slight increase in the rate of enamel demineralisation. The 19 F MAS-NMR spectra show that CaF 2 is formed in greater proportions relative to F s -HAp with 45 ppm [F ] in the demineralising solutions, but does not alter significantly with further increases in [F ]. ICP-OES shows a reduction in the Ca 2+ release into solution with increasing [F ] due to CaF 2 formation. As the Ca 2+ released into solution decreases due to the precipitation of CaF 2, PO 3 4 are unable to react to form apatite and are therefore released into solution. Previous studies have reported that the formation of CaF 2 may exhibit anticaries effects by forming a physical barrier on the enamel surface thereby slowing the demineralisation process, as well as serving a reservoir for fluoride (Saxegaard and Rølla, 1988, Ganss et al., 2007). However, the 19 F MAS-NMR, ICP-OES and weight loss results of this study demonstrate that the formation of CaF 2 is potentially detrimental to the structural integrity of enamel as its formation reduces the available Ca 2+ required for remineralisation of apatite. This in turn causes the loss of PO 3 4, thereby decreasing the mineral content in the tooth. The present findings suggest that the formation of a fluoridated- Page 134
151 apatite phase is favourable as this retains the apatitic structure and lowers the solubility of enamel (Featherstone, 1999). The ICP-OES and weight loss data (Figures ) showed that dissolution of enamel was increasingly inhibited up until 136 ppm of [F ], above which little further inhibition of demineralisation was observed, and, the 19 F NMR data showed that CaF 2 was the predominant species formed. This suggests that any benefit associated with the formation of CaF 2 at [F ] > 136 ppm is offset by the disturbances caused to the structural integrity of the enamel. Although a static rather than a cycling model was used in this study, these conditions could mimic salivary conditions at night after brushing with a fluoride-containing dentifrice where the salivary flow rate is low and therefore elevated fluoride levels may persist for longer time periods. It has been proposed that CaF 2 formed on dental hard-tissues, and within plaque, may act as a reservoir providing fluoride release under acidic conditions (Fischer et al., 1995). Calcium fluoride has a very low solubility product constant and is relatively stable under low ph conditions (Øgaard et al., 1983). However, it appears that the terminology CaF 2 -like has been implemented in the literature to overcome the point that CaF 2 is, in fact, not very soluble. The term CaF 2 -like is sometimes referred to as a phosphate-containing CaF 2 (Rølla and Saxegaard, 1990), which these authors suggest is more soluble than pure CaF 2 and may thus release fluoride at a higher rate than pure CaF 2 (Christoffersen et al., 1988). It has also been suggested that CaF 2 formed at low ph contains less internal phosphate and is therefore less soluble (Øgaard, 2001). In the presence of salivary PO 3 4 it is possible that a CaF 2 -like material is formed in the biofilm. However, Vogel et al., (2010) reported that CaF 2 -like deposits did not form in plaque after exposure to fluoride (228 ppm [F ]), and if formed they were rapidly dissolved. Therefore, it may be that these CaF 2 -like materials are nanocrystals of fluoridated apatite, which are more soluble than CaF 2 at low ph. This would explain the release of fluoride from these CaF 2 -like materials at Page 135
152 low ph conditions. It has also been suggested that phosphate-containing CaF 2 is formed on enamel during the treatment of enamel with acidified solutions of high fluoride content, which would then act as a reservoir for fluoride at low ph (Rølla et al., 1993). However, the present study shows that under these conditions, there was no 19 F NMR evidence of a phosphate-containing CaF 2 present, rather, CaF 2 was the main mineral phase formed. The present study demonstrates that the addition of fluoride produces fluoridesubstituted apatite as a major chemical species only at low concentrations of fluoride. There is overwhelming evidence that low fluoride levels found in saliva can significantly reduce enamel demineralisation, and those found in plaque have the potential to remineralise, even at ph values typically regarded as demineralising (Fox et al., 1983, Lynch et al., 2006). The potential of enamel remineralised in the presence of fluoride to both resist a caries challenge and to release fluoride into the oral fluids during dissolution, has been somewhat ignored of late. The former effect is potentially quite important in terms of enamel solubility (Koulourides et al., 1980), while the latter effect may be sufficient to tip the caries balance in their favour in low caries-risk individuals. The speculated slow dissolution of CaF 2 -like deposits is viewed as a potential slow-release vehicle for the widespread availability of fluoride in the oral fluid. However, fluorohydroxyapatite (FHAp) may also be an important fluoride reservoir but previously, its importance has been considered mainly in the context of reduced solubility when compared with HAp (Moreno et al., 1974) Conclusion In conclusion, this study confirms that under the conditions used, the cariostatic effect of fluoride is due to the formation of fluoride-substituted apatite and calcium fluoride, depending on the [F ] in solution. Below 45 ppm, the F from the solution forms a fluorohydroxyapatite phase on the enamel surface. At 45 ppm [F ], nearly equal amounts of F s -HAp and CaF 2 phases form, whereas, above 45 ppm CaF 2 is the main phase formed on the enamel surface. Page 136
153 Chapter 11 k Effects of Zinc Ion Concentration on Enamel Demineralisation in vitro: Real-Time SMR Study 11.1 Introduction Typical concentrations of zinc range between ppm in toothpastes and ppm in mouthwashes and rinses (see Section 5.3.1). A good oral substantivity is exhibited by zinc, with around 15-40% retention of the applied zinc dose (Afseth et al., 1983a, Tanwalker and Gilbert, 1989). Some zinc is also present naturally in both plaque and saliva, with reported background concentrations of ppm in saliva, and 5-30 ppm in plaque (Harrap et al., 1984). Following applications, zinc is cleared from saliva bi-modally, with relatively high post-application concentrations falling rapidly over the first hour (Section 5.3.2). Thereafter, lower concentrations, still significantly elevated when compared to baseline, may persist for many hours. A similar trend is seen in plaque. Here, elevated concentrations can persist for at least 12 hours after usage. Considering the oral disposition of zinc, particularly following applications from zinc-containing dentifrices, it is of great interest to investigate the effect of a range of zinc ion concentration on demineralisation rate of dental enamel. Page 137
154 11.2 Aim The aim of this in vitro study was to measure the direct physical effects of zinc ion concentration [Zn 2+ ] on the real-time demineralisation of enamel during exposure to in vitro caries simulating conditions using Scanning Microradiography (SMR). SMR was used to measure mineral mass loss in enamel blocks during exposure to in vitro acid solutions, whilst the subsequent [Zn 2+ ] of the acidic challenge was successively increased and SMR measurements continued for periods of 48 h. Thus, real-time measurements of the effects of [Zn 2+ ] (in the range ppm) on the rate of enamel demineralisation were obtained, on the same sample and at the same location. Page 138
155 11.3 Materials & Method Preparation of Human Enamel Blocks Anonymised caries-free permanent molars (tooth A, B and C) were randomly selected. Enamel blocks ( 5 x 5 mm) with a thickness of 2 mm were cut from each tooth (details on the preparation of the enamel blocks were described in Section 8.1.1). An enamel block was obtained from tooth A (block A), tooth B (block B), and tooth C (block C). As each block was located in a separate SMR environmental cell, as shown in Figure 11.1 (details on the preparation of an SMR cell was described in Chapter 8). Tooth A Tooth B Tooth C Figure 11.1: Each SMR cell contains an enamel block obtained from either tooth specimen A, B or C Preparation of [Zn 2+ ]-Containing Acid Solutions A series of acidic solutions were made from analytical grade reagents. A 10.0 L stock of 0.1 mol/l acetic acid (AnalaR NORMAPUR, VWR International, France) was prepared with deionised water and adjusted to ph 4.0. Subsequently, this was divided into ten 1.0 L flasks. Zinc acetate (Zn(O 2 CCH 3 ) 2 ) was added to the acid reservoirs to prepare solutions containing: 0, 0.1, 0.4, 1.8, 9, 36, 107, 356, 1782, 3565 ppm [Zn 2+ ] respectively. This concentration range was used to mimic those found in dentifrices, plaque fluid and saliva. The lower concentration Page 139
156 range was typical of those present in saliva at some considerable time after application, whereas the upper concentration range might be typical of immediate post-application SMR Experiment The SMR cells containing the samples were mounted on the X-Y stage, which can be moved and repositioned with high precision (±0.5 µm) under computer control. Mineral mass measurements were taken repeatedly at 3 fixed scan positions 0.5 mm apart, every 60 s on each block (A, B and C) throughout an experiment. Peristaltic Pump ppm [Zn 2+ ] 0.1 ppm [Zn 2+ ] 0.4 ppm [Zn 2+ ] 1.8 ppm [Zn 2+ ] 9 ppm [Zn 2+ ] 36 ppm [Zn 2+ ] 107 ppm [Zn 2+ ] 356 ppm [Zn 2+ ] 1782 ppm [Zn 2+ ] 3565 ppm [Zn 2+ ] Figure 11.2 Each SMR cell containing a sample was circulated with a [Zn 2+ ]-containing acid solution (ph 4.0) for a period of 48 h. Initially an acid solution containing no zinc was circulated for 48 h, which was followed by 0.1 ppm [Zn 2+ ] and so on. Initially, a 1.0 L acidic solution (0 ppm [Zn 2+ ]) was circulated through the SMR cell for a period of 48 h whilst continuously taking SMR measurements. After the initial demineralisation period, each cell was circulated with an equivalent composition of acidic stock solution containing 0.1 ppm [Zn 2+ ] for 48 h. Subsequently, each [Zn 2+ ]-containing acidic solution up to 3565 ppm was circulated through the SMR cell at sequentially increasing [Zn 2+ ] for 48 h Page 140
157 periods (Figure 11.2). SMR was used to measure mineral mass throughout all the demineralisation periods. All measurements were carried out at 23.0 ±1.0 C Determination of RML enamel The mineral mass per unit area was plotted as a function of time and the rate of enamel mineral loss (RML enamel ) values and associated statistical errors were calculated from the slope by linear regression fitting using SigmaPlot 10.0 (Systat Software, California, USA). The RML enamel measurements at each [Zn 2+ ] test condition were compared with those during the initial demineralisation period (0 ppm [Zn 2+ ]) for every scan position. The difference in the demineralisation rates between 0 ppm [Zn 2+ ] and each [Zn 2+ ] test condition is shown as the percentage reduction in RML enamel (PRML enamel ). For reproducibility, 3 different scan positions were measured on each enamel block (A, B, and C) obtained from 3 different anonymous specimens. In total, RML enamel was measured at a total of 9 different scan positions (n = 9). Page 141
158 11.4 Results % Confidence Band 95% Prediction Band Mineral mass per unit area (gcm -2 ) Y = 5.58E E-4x R 2 = Time (h) Figure 11.3: Typical SMR raw data plot showing the mineral per unit area plotted against time ( 50 h) during exposure to acidic conditions (ph 4.0, [Zn 2+ ] = 0 ppm) at a single scan position on a sample (A). RML enamel was determined by linear regression fitting of the slope (y = a + bx). Value SE t-value a (10-4 g cm -2 ) b (10-4 g cm -2 h -1 ) Table 11.1: Statistical analysis for the data in Figure 11.4, using SigmaPlot Figure 11.3 shows a typical SMR raw data data plot over 50 h during exposure to acid solution (ph 4.0) ([Zn 2+ ] = 0 ppm). The graph shows the mineral mass decrease was approximately linear with time at all [Zn 2+ ] used, but with slight deviations from linearity attributable to the local changes in the enamel and/or mineral structure in the specimen due to the presence of natural variability in hard-tissue composition (Anderson et al., 1998). Table 11.1 summarises the linear regression and statistical analysis. Page 142
159 0.025 Mineral mass loss per unit area (g cm -2 ) ppm [Zn 2+ ] 356 ppm [Zn 2+ ] 3565 ppm [Zn 2+ ] Time (h) Figure 11.4: compares the gradients of the measured slope (0, 356 and 3565 ppm [Zn 2+ ]) measured at a single scan position on a sample. [Zn 2+ ] b (10-4 g cm -2 h -1 ) SE (10-4 g cm -2 s -1 ) t-value 0 ppm ppm ppm Table 11.2: Statistical analysis for the data in Figure 11.5, using SigmaPlot Figure 11.4 compares the gradient of the measured slope measured at a single scan position on an enamel block at 0, 356 and 3565 ppm [Zn 2+ ] in the acidic solutions. The different gradients of the lines clearly illustrates that increasing the [Zn 2+ ] in the acidic solution reduces the rate of enamel mineral demineralisation. Table 11.2 summarises the linear regression and statistical analysis for each slope in Figure Page 143
160 a) PRML enamel b) [Zn 2+ ] / ppm PRML enamel (%) [Zn 2+ ] / ppm Figure 11.5: a) shows the relationship between the mean PRML enamel (n=9) and log [Zn 2+ ]. b) shows the relationship between the mean PRML enamel (n=9) and [Zn 2+ ]. A break in the x axis (between ppm) has been shown to enhance readability. Error bar shows the standard error in SMR measurements. Page 144
161 Figure 11.5a shows the mean PRML enamel values plotted as a function of [Zn 2+ ], where the [Zn 2+ ] is plotted on a log-scale. There appears to be a log-linear increase between the mean PRML enamel and [Zn 2+ ]. At 10 ppm [Zn 2+ ] there is approximately a 60 % reduction measured in the rate of demineralisation. Figure 11.5b shows the mean PRML enamel values plotted as a function of [Zn 2+ ]. A break in the x axis (between ppm) has been shown to enhance readability. A rapid increase in the rate of PRML enamel is observed up to 10 ppm [Zn 2+ ], however, above this concentration there is a substantial decline in the rate of PRML enamel. Table 11.3 shows the RML enamel values with the associated standard error for a scan position (1,2 or 3) measured on a sample (block A, B and C). For every scan position on a sample, the RML enamel measurements at each [Zn 2+ ]-test condition were compared with those during acid demineralisation (0 ppm [Zn 2+ ]). The SMR raw data plots measured for all zinc concentrations at a single scan position on a sample can be found in Appendix A. Page 145
162 [Zn 2+ ] Concentration (ppm) SAMPLE SCAN POSITION RML enamel (10-4 g cm -2 h -1 ) / SE (10-4 g cm -2 s -1 ) PRML enamel (%) A B C 2 3 RML enamel (10-4 g cm -2 h -1 ) / SE (10-4 g cm -2 s -1 ) PRML enamel (%) RML enamel (10-4 g cm -2 h -1 ) / SE (10-4 g cm -2 s -1 ) PRML enamel (%) RML enamel (10-4 g cm -2 h -1 ) / SE (10-4 g cm -2 s -1 ) PRML enamel (%) RML enamel (10-4 g cm -2 h -1 ) / SE (10-4 g cm -2 s -1 ) PRML enamel (%) RML enamel (10-4 g cm -2 h -1 ) / SE (10-4 g cm -2 s -1 ) PRML enamel (%) RML enamel (10-4 g cm -2 h -1 ) / SE (10-4 g cm -2 s -1 ) PRML enamel (%) RML enamel (10-4 g cm -2 h -1 ) / SE (10-4 g cm -2 s -1 ) PRML enamel (%) RML enamel (10-4 g cm -2 h -1 ) / SE (10-4 g cm -2 s -1 ) PRML enamel (%) Table 11.3: RML enamel values with the associated standard error for all scan position measured on samples (A,B, and C, see Section ). For every position, the RML enamel measurements at each [Zn 2+ ] were compared with those during acid demineralisation at 0 ppm [Zn 2+ ]. The difference in the demineralisation rates between 0 ppm [Zn 2+ ] and each test condition is shown as a PRML enamel. For every scan position, the RML enamel measurement at each [Zn 2+ ] was statistically different (P 0.05) when compared to the RMLenamel measurement at acid demineralisation (0 ppm [Zn 2+ ]). Page 146
163 11.5 Discussion This in vitro study investigated the effects of varying zinc ion concentration [Zn 2+ ] on the rate of dental enamel demineralisation during caries-simulating conditions using SMR. A concentration range of ppm [Zn 2+ ] was used to mimic those found in dentifrices, plaque fluid and saliva (Lynch, 2011). The lower concentration range was typical of those present in saliva at some considerable time after application of zinc-containing toothpaste, whereas the upper concentration range might be typical of immediate post-application. In general, the SMR study confirmed that increasing [Zn 2+ ] in the acid solution reduces the rate of enamel demineralisation. The specimens used in these studies are naturally variable in its tissue composition and would therefore differ in solubility (Robinson et al., 1995), which might invariably influence the RML enamel values. To ensure reproducibility, demineralisation studies were conducted on samples obtained from different teeth. Numerous samples were not necessary in this study as each scan position acted as its own control. The difference in the demineralisation rates between 0 ppm [Zn 2+ ] and each test condition is shown as a percentage reduction in RML enamel (PRML enamel ). The PRML enamel values are not absolute values, rather an indication of how much demineralisation is modified with the presence of increasing [Zn 2+ ]. Although the RML enamel values for all three scan positions measured on samples (block A, B and C) were different in each sample, the overall PRML enamel in each sample showed similar trends with increasing [Zn 2+ ]. For the SMR study, the natural enamel surface was subjected to continuous acid conditions (ph 4.0) during which the [Zn 2+ ] was sequentially increased in the acid solutions at fixed time periods ( 48 h) (Mohammed et al., 2013). At a lower concentration range ( ppm [Zn 2+ ]), a rapid increase in the rate of PRML enamel was observed, and quite a substantial reduction in enamel dissolution was measured (up to 70 % PRML enamel ). This rapid modification in the demineralisation rate could be explained by the almost instantaneous occupancy of the abundant PO 4 3 binding sites by zinc, and as these sites become occupied the rate of Page 147
164 demineralisation is effectively reduced. The HAp crystal structure was described in Section 2.2, and Figure 2.5 showed that the HAp crystal surfaces are polar with a reported concentration of 3.02 ions/nm 2 3 of PO 4 lattice ions exist on the surface of HAp (Kukura et al., 1972). The greater occupancy of zinc at active dissolution sites (Fuierer et al., 1994) on the enamel surface with increasing concentration could also explain the log-linear trend observed between [Zn 2+ ] and PRML enamel (Figure 11.5a). This relationship between [Zn 2+ ] and inhibition in demineralisation shows characteristic features of a saturation-binding exponential curve (Figure 11.5b), and indicates a surface phenomenon between zinc and enamel. The ability of zinc to substantially reduce enamel demineralisation at these sorts of concentrations could, potentially, have significant clinical implications relevant to those levels typically present in saliva and plaque fluid (see Section 5.2.2). Above 9 ppm [Zn 2+ ], an overall linear increase was observed between the PRML enamel, and although the rate of increase was lower, a PRML enamel value of approximately 90 % was measured >1782 ppm. The smaller differences between the PRML enamel values measured with increasing [Zn 2+ ] also suggests the accumulation / adsorption of zinc on the enamel surface, with increasing levels of exposure. The apparent changes in gradients is indicative that the mechanistic behaviour of zinc is concentration dependent, and that more than one mechanism is probably occurring between increasing [Zn 2+ ] and tooth enamel surface under acid conditions. The rapid increase in the rate of PRML enamel is probably due to abundant availability of active dissolution sites (Arends, 1973, Voegel and Frank, 1977) and/or PO 3 4 sites on the enamel surface, and with the gradual occupancy of these sites, the adsorption becomes less efficient and therefore there is a slower rate of increase in PRML enamel Conclusion This study confirmed the ability of zinc to reduce enamel demineralisation during in vitro caries simulating conditions. Increasing [Zn 2+ ] in the acid solution showed significant reductions in the rate of enamel demineralisation. The general relationship observed between [Zn 2+ ] and PRML enamel suggests that there is a Page 148
165 surface phenomenon of zinc, which could be limited to its accumulation on the enamel surface (i.e. [Zn 2+ ]) and/or the available surface area or binding sites on the enamel. From a caries prevention perspective, zinc ions present in the oral fluids, in particular the plaque fluid would provide a degree of protection of enamel during a cariostatic challenge. Page 149
166 Chapter 12 k Physical Chemical Effects of Zinc on in vitro Enamel Demineralisation 12.1 Introduction The antibacterial properties of zinc salts are due to their ability to inhibit bacterial adhesion, metabolic activity and growth (Saxton et al., 1986, Young et al., 2003, Fedorowicz et al., 2008). In addition, zinc is known to inhibit the crystal-growth of hydroxyapatite (HAp) and its reported precursors dicalcium phosphate dihydrate (DCPD) and octacalcium phosphate (OCP) (Chow and Eanes, 2001). This ability of zinc to modify the crystal-growth pathways of calcium phosphates has been exploited to control calculus formation (LeGeros et al., 1999). A mechanism of adsorption or incorporation of zinc ions into the apatite lattice structure has been proposed (Shepherd and Best, 2013). While the effects of zinc as an anti-plaque and calculus agent have been investigated extensively, its interaction with enamel and its putative role in demineralisation and remineralisation is considerably less well understood. In the early sixties, Brudevold et al., (1963) reported that zinc reduces the solubility of enamel, but were not clear on the fundamental chemistry of this mechanism (see Chapter 5 for more detail). Page 150
167 12.2 Aim The aim of this in vitro study was to investigate the effect of zinc ion concentration [Zn 2+ ] on the calcium [Ca 2+ ] and phosphate [PO 3 4 ] dissolution of dental enamel and synthetic hydroxyapatite (Ca 10 (PO 4 ) 6 (OH) 2, HAp), during exposure to acidic solutions simulating caries (ph 4.0). Furthermore, the possible mechanistic action of zinc with enamel and HAp was determined under the conditions used. Synthetically pure HAp was also investigated alongside dental enamel due to the significant variability that exists naturally in the composition of human enamel. Inductively coupled plasmaoptical emission spectroscopy (ICP-OES) was used to quantitatively measure the concentration of calcium and phosphorus ions released into solution. The treated HAp powders were characterised by X-Ray Diffraction (XRD) and Neutron Diffraction (ND). Furthermore, the surfaces of the enamel blocks were analysed using Attenuated Total Reflectance-Fourier Transform Infrared Spectroscopy (ATR-FTIR) to obtain structural information on the mineral phases formed on enamel surfaces as a function of [Zn 2+ ] in the acidic conditions. * The study described in this chapter was in Journal of Dentistry (April 2014). See Appendix D for a full version of the paper. Page 151
168 12.3 Materials and Methods Preparation of Demineralising Solutions A series of acid solutions were made from analytical grade reagents. A 10.0 L stock of 0.1 mol/l acetic acid (AnalaR NORMAPUR, VWR International, France) was prepared with deionised water and adjusted to ph 4.0. Subsequently, this was divided into ten 1.0 L flasks. Zinc acetate (Zn(O 2 CCH 3 ) 2, Sigma-Aldrich, Dorset) was added to the acid reservoirs to prepare solutions containing: 0, 9, 36, 107, 356, 1782, 3565 ppm [Zn 2+ ] respectively. This concentration range was used to mimic those found in dentifrices, plaque fluid and saliva. The lower concentration range bracketed those typical of saliva at some considerable time after application of a zinc-containing toothpaste, whereas the upper concentration range might be typical of immediate post-application Preparation of Enamel Blocks Anonymised caries-free permanent molars extracted for orthodontic purposes were randomly selected. Ethical approval was obtained from Queen Mary Research Ethics Committee (QMREC 2011/99). Enamel blocks ( 5 x 5 mm) with a thickness of 2 mm were cut from each tooth (3 teeth in total, n=3) using an annular diamond blade (Microslice 2, Malvern Instruments, UK) and dentine was polished off using a P600 grit silicon carbide paper ICP-OES Study Enamel blocks 6 x enamel blocks were placed in a container with 50 ml of demineralising solution (0 ppm [Zn 2+ ]) at 37 C in a shaking incubator (KS 4000i control, IKA, UK) at 60 rpm for 24 h. Subsequently, each sample was immersed in 50 ml of a [Zn 2+ ]-containing demineralising solution (0, 36, 107, 356, 1782 and 3565 ppm) at 37 C for 96 h. HAp powder 1 g of HAp powder (Biotal-R HAP, surface area 20 m 2 /g) was immersed directly in 50 ml of a [Zn 2+ ]-containing demineralising solution (9, 36, 107, 356, 1782 and 3565 ppm) at 37 C for 9 h. The solution was centrifuged to remove any HAp powder. The resulting suspensions were dried at 37 C for 48 h. Page 152
169 After reaction with enamel and HAp powders, the [Zn 2+ ]-containing demineralising solutions were prepared for ICP-OES analysis by 1/4, 1/10, 1/20 and 1/200 dilutions with the original demineralising acid stock solution. These dilutions were used to analyse the Ca, P and Zn levels at a detectable range. Each measurement was replicated three times (n = 3). Calibration solutions were also prepared with the same original demineralising acid stock solution to give the same background Na levels and similar ionic strengths to the test samples. All test samples and calibration solutions were prepared with an acidification of 1% (0.1 ml of 69% nitric acid in 10 ml) for analysis using ICP-OES (ICP; Varian Vista-PRO, Varian Ltd., Oxford, UK). Calcium and phosphorus standards were used in the concentration range 1 50 ppm, whereas zinc standards were in the ppm range XRD and ND Analysis of HAp X-Ray Diffraction The zinc treated HAp powders ( ppm) were analysed by XRD (X Pert PRO MPD, PANalytical, Cambridge, UK; 40 kv/40 ma, Cu Kα). Data was collected at room temperature with a θ step size and a count rate of 99.6 s step -1, from 2θ values of 10 to 60. Neutron Diffraction For the control (0 ppm [Zn 2+ ]) and 3565 ppm [Zn 2+ ] treated HAp, neutron powder diffraction data were collected on the Near and InterMediate Range Order Diffractometer (NIMROD), at the ISIS neutron Facility (Rutherford Appleton Laboratory, Didcot, Oxon, United Kingdom). Approximately 1 g of each sample was loaded into a thin-walled titanium-zirconium alloy container (2 mm thickness) and data were collected at room temperature for 2 h. The time-of-flight neutron diffraction data were collected with a wavelength range of 0.5 to 14 Å, which gave a continual working Q range of 0.02 to 50Å -1. The beam size used was 30 x 30 mm ATR-FTIR Analysis of Enamel Blocks The enamel blocks were analysed by ATR-FTIR (Spectrum GX, Perkin-Elmer, Waltham, MA, USA) without any further sample preparation. This enabled direct analysis of zinc treated surfaces without the bulk of the samples contributing to the spectra. Page 153
170 12.4 Results ICP-OES Enamel Blocks a) 2.5 Ca P Ca 2.0 [Ions] (ppm / mm 2 ) P [Zn 2+ ] ppm b) [Ions] (ppm / mm 2 ) [Zn 2+ ] ppm Figure 12.1: ICP-OES measurements showing the Ca and P detected for enamel blocks immersed in a range of [Zn 2+ ]-containing acidic solutions (96 h); a) the [Zn 2+ ] is plotted on a log-scale. The dashed lines show the Ca and P release for the control enamel (0 ppm [Zn 2+ ]); b) Shows the data in Figure 12.1a without logging the [Zn 2+ ]. The trend in the Ca and P release can be seen more clearly in this plot. The error bars show the Standard Error of the Mean (SEM) (n=3). Page 154
171 HAp Powder a) 800 Ca P Ca 600 [Ions] (ppm ) P [Zn 2+ ] ppm b) [Ions] (ppm ) [Zn 2+ ] ppm Figure 12.2: ICP-OES measurements showing the Ca and P detected for HAp powder immersed in a range of [Zn 2+ ]-containing acidic solutions (96 h); a) the [Zn 2+ ] is plotted on a log-scale. The dashed lines show the Ca and P release for the control HAp sample (0 ppm [Zn 2+ ]); b) shows the data in Figure 12.2a without logging the [Zn 2+ ]. The trend in the Ca and P release can be seen more clearly in this plot. The error bars show the Standard Error of the Mean (SEM) (n=3). Page 155
172 Figures 12.1 and 12.2 show the [Ca 2+ ] and [PO 3 4 ] release into the acidic solution following demineralisation of enamel and HAp samples respectively. The [Zn 2+ ] was plotted on a log-scale for Figures 12.1a and 12.2a, and the concentration range of [Ca 2+ ] and [PO 3 4 ] was plotted between ppm for HAp, whereas for enamel it was plotted between ppm / mm 2. This difference was predominantly due to the differences in surface areas between the enamel and HAp used. In general, the [Ca 2+ ] and [PO 3 4 ] release decreased markedly as the [Zn 2+ ] was increased in the acidic solution. Further, the [PO 3 4 ] release was considerably lower than the [Ca 2+ ] release for both enamel and HAp. Figures 12.1b and 12.2b shows a rapid decrease in the rate of Ca and P release up to 356 ppm [Zn 2+ ], however, above this concentration the demineralisation rate plateaus. Page 156
173 2.3 Enamel 2.2 Ca/P ratio in the solution [Zn 2+ ] ppm Figure 12.3: Ca/P ratio in solution as a function of [Zn 2+ ] in the acidic solutions shown for the enamel blocks. The dashed lines show the Ca/P ratio for the control enamel (0 ppm [Zn 2+ ]). 25 HAp powder 20 Ca/P ratio in the solution [Zn 2+ ] ppm Figure 12.4: Ca/P ratio in solution as a function of [Zn 2+ ] in the acidic solutions shown for HAp samples. The dashed lines show the Ca/P ratio for the control HAp (0 ppm [Zn 2+ ]). Figure 12.3 and 12.4 shows the Ca/P ratio in the acidic solution as a function of log [Zn 2+ ] for enamel and HAp samples respectively. The Ca/P ratio rises as the [Zn 2+ ] in the acidic solution increases. This indicates that the solution is calcium-rich with respect to phosphorus, and therefore less PO 4 3 apatite structure with increasing [Zn 2+ ]. groups are released from the Page 157
174 10000 [Zn 2+ ] uptake [PO 4 3- ] release 1000 [Zn 2+ ] uptake from solution (ppm) [PO 4 3- ] in solution (ppm) [Zn 2+ ] (ppm) Figure 12.5: compares the [Zn 2+ ] uptake from solution with the [PO 4 3- ] released into solution for HAp powder samples. The error bars show the Standard Error of the Mean (SEM) (n=3). Figure 12.5 compares the [Zn 2+ ] uptake from the solution by the HAp powder, and the [PO 3 4 ] released into solution as a function of increasing [Zn 2+ ] in the acidic solutions. The graph illustrates that as there is an increase in zinc removed from the aqueous solution by the apatite, there is a bigger reduction in [PO 3 4 ] detected in the solution. Page 158
175 XRD and Neutron Diffraction a) * * * * α-hopeite reference 3565 ppm [Zn 2+ ] 1782 ppm [Zn 2+ ] 356 ppm [Zn 2+ ] 107 ppm [Zn 2+ ] 36 ppm [Zn 2+ ] 9 ppm [Zn 2+ ] 0 ppm [Zn 2+ ] d-spacing / Å b) * α-hopeite reference * 3565 ppm [Zn 2+ ] * * 1782 ppm [Zn 2+ ] 0 ppml [Zn 2+ ] d-spacing / Å Figure 12.6: shows the XRD patterns for HAp immersed in a range of [Zn 2+ ]-containing acidic solutions for a) ppm [Zn 2+ ]; b) (0, 1782 and 3565 ppm) in the region 4-10 Å. A XRD pattern for α-hopeite is shown as a reference. The * show new diffraction peaks that are absent in the control sample. Page 159
176 F (Q) Figure 12.6a displays the XRD patterns for HAp powders treated with acidic solutions containing a range of [Zn 2+ ]. All the samples show well-resolved diffraction patterns for HAp (typical apatite peaks appear at , 3.4 and 8 Å). Above 356 ppm [Zn 2+ ], new diffraction peaks appear at 9.1 and 4.5 Å (Figure 12.6b) which corresponds with the two strongest peaks in the α-hopeite reference (Pawlig and Trettin, 1999). The third strongest peak for α-hopeite is at 2.86 Å; however, this peak was not visible in the [Zn 2+ ] treated HAp due to overlap with the apatite peaks. * ppm ppm Zinc [Zn 2+ ] Control d-spacing / Å Figure 12.7: shows the neutron diffraction analysis for HAp powder immersed in acidic solutions containing [Zn 2+ ] (0 and 3565 ppm). The * represents an additional peak in 3565 ppm[zn 2+ ] sample that is not present in the control sample (0 ppm [Zn 2+ ]). Figure 12.7 shows the neutron diffraction data for the HAp samples treated with acidic solutions containing no [Zn 2+ ] (0 ppm) and a high [Zn 2+ ] (3565 ppm). The zinctreated sample (3565 ppm [Zn 2+ ]) possesses an additional peak at 9 Å which corresponds to the (020) reflection in the XRD pattern of the α-hopeite reference. Page 160
177 ATR-FTIR a) cm cm 1108 cm cm cm cm cm cm -1 α-hopeite reference 1068 cm cm cm cm cm ppm [Zn 2+ ] 1221 cm cm ppm [Zn 2+ ] 1148 cm cm cm cm cm cm cm ppm [Zn 2+ ] 0 ppm [Zn 2+ ] Wavenumber (cm -1 ) b) 1640 cm cm cm cm -1 α-hopeite reference 1454 cm cm cm cm ppm [Zn 2+ ] 1453 cm cm ppm [Zn 2+ ] 0 ppm [Zn 2+ ] 1640 cm cm cm cm Wavenumber (cm -1 ) Page 161
178 c) 3233 cm cm -1 Zinc phosphate reference α-hopeite reference 3565 mg/l ppm [Zn 2+ ] 2652 cm cm cm mg/l ppm [Zn [Zn ] 2649 cm mg/l ppm [Zn [Zn ] 3411 cm -1 0 mg/l ppm [Zn 2+ ] Wavenumber (cm -1 ) Figure 12.8: shows the ATR-FTIR spectra of enamel blocks immersed in a range of [Zn 2+ ]-containing acidic solutions for a) 0, 107, 356 and 3565 ppm [Zn 2+ ] in the region cm -1 ; b) 0, 356 and 3565 ppm in the region cm -1 ; c) 0, 356, 1782 and 3565 ppm in the region cm -1. The dashed line highlights the shift in band from 3500 cm -1 (in control sample) to 3300 cm -1 in the Figures 12.8a c show the ATR-FTIR spectra of enamel blocks treated in a range of [Zn 2+ ]-containing acidic solutions. In Figure 12.8a, the split band at 560 and 600 cm -1 are characteristic for apatitic PO 4 3 groups and is the most characteristic region for apatite. It corresponds to the P-O bonding vibrations in a PO 4 3 tetrahedron and indicates the presence of crystalline calcium phosphates including carbonated HAp (Elliott, 2002). In Figure 12.8a, the apatite bands (963, 1026 and 1087 cm -1 ) characteristic for PO 4 3 groups are progressively distorted with increasing [Zn 2+ ] in the acidic solutions, indicating that there is a new mineral phase forming on enamel surfaces that is less apatite-like. The bands observed at 876, 1413, 1455 and 1549 cm -1 correspond to the CO 3 2 groups in enamel (Figures 12.8a and 12.8b) (Elliott, 1994). At 356 ppm [Zn 2+ ] and above, the absorption bands show characteristic features for a mineral phase that resembles α-hopeite (α-zn 3 (PO 4 ) 2.4H 2 O). Figure 12.8b shows the broad band at 1640 cm -1 grows in sharpness and intensity whereas Figure 12.8c shows the band at 3400 cm -1 becomes shifted to a lower wavenumber centred around 3300 cm -1. Page 162
179 12.5 Discussion The present study investigated the physical chemical effects of zinc ion concentrations on the in vitro demineralisation of enamel, during exposure to caries-simulating conditions, where the system was adjusted to ph 4.0 and the temperature was maintained at 37 C). At a fundamental level, the dissolution mechanism of biological apatite mineral is highly complex, not only due to gradients existing with depth in solubility and porosity, but also due to the available surface area for reaction. Therefore, the demineralisation of enamel is not a onedimensional process, but one that involves simultaneous processes or steps that is not limited to the diffusion of H + from bulk solution to the solid/liquid interface, adsorption of ions or chemical species onto the apatite surface, desorption of products (ions of calcium and orthophosphate) from the crystal surface and their diffusion into the bulk solution (see Chapter 3). Although the in vitro model described in the present study does not fully replicate the intricacies that exist in the oral environment, it does provide a strategic approach for the strict chemical control of individual variables of a multi-factorial disease. Quantitative analysis of ions released into solution following demineralisation of samples confirmed that zinc reduces the rate of demineralisation as a function of concentration (Figure ). An overall decrease in the [Ca 2+ ] and [PO 3 4 ] in solution was observed with increasing [Zn 2+ ], whereby a greater reduction was measured at higher [Zn 2+ ] ( 1782 ppm). Further, the [PO 3 4 ] release was considerably lower than the [Ca 2+ ] release, particularly at 1782 ppm [Zn 2+ ] and above. Additionally the Ca/P ratio in solution increased as a function of [Zn 2+ ] i.e. the solution was more phosphorus-deficient with respect to the apatite stoichiometry (1.67) (Figure 12.3 and 12.4). These findings are indicative that zinc interacts predominantly at the PO 3 4 sites on the apatite structure during its mechanism in reducing demineralisation, which further suppresses the [PO 3 4 ] ion release. This is also supported by the relationship observed between the [PO 3 4 ] ion released from the HAp structure and the amount of [Zn 2+ ] taken up from solution (Figure 12.5). With increasing [Zn 2+ ] in solution, there is a rise in the Page 163
180 amount of zinc taken up by the apatite, which corresponded with the substantial decrease in the [PO 3 4 ] released. The XRD analysis of the zinc treated HAp confirmed the formation of a zinc phosphate species above 356 ppm [Zn 2+ ] (Figures 12.6a and 12.6b). Previous studies found the concentration of the lattice PO 3-4 ions available on HAp surfaces as 3.02 ions/nm 2, and show that most of the surface is covered by oxygen ions of the orthophosphate groups (Kukura et al., 1972, Okazaki et al., 1995). In this study, the HAp material has a larger specific surface area (20 m 2 /g) than the enamel blocks and it is therefore less limited by binding sites available to the zinc ions on the apatite surface. Earlier studies have suggested that the amount of zinc adsorbed is directly proportional to the HAp surface area, whereby a Langmuir-type adsorption of zinc was observed exhibiting monolayer coverage (Ingram et al., 1992). Furthermore, data from mechanistic studies show that the surface adsorption of zinc is also concentration-dependent (Fuierer et al., 1994). The neutron diffraction patterns from the HAp sample treated with 3565 ppm [Zn 2+ ] also showed the formation of zinc phosphate, which maybe present within the apatite, or in amongst the apatite crystals (Figure 12.7). Neutron diffraction data provides similar crystallographic information as X-ray diffraction. It is useful to compare diffraction patterns from both sources since neutrons can probe all atoms in a large sample due to their weak interaction with matter, and therefore unlike X- rays can penetrate the entire bulk of the sample eliminating surface effects. Thus the neutron diffraction results suggest that zinc is not only forming a zinc phosphate species at the HAp surface, but could also potentially diffuse into the bulk apatite lattice structure. ATR-FTIR, a vibrational spectroscopic technique, was used with a view to obtain structural information about the physical and chemical changes taking place on the enamel surface ( 5-10 µm) during demineralisation in the presence of [Zn 2+ ]. Above 107 ppm [Zn 2+ ], the apatite bands characteristic for PO 3 4 groups (963, 1026 and 1087 cm -1 ) become progressively distorted with increasing [Zn 2+ ] in the acidic solutions, indicating the formation of a new mineral phase on the enamel surfaces Page 164
181 which is less apatite-like (Figure 12.8a). In the control sample, the broad band at 1640 cm -1 (Figure 12.8b) is characteristic for absorbed water and the broad band at 3400 cm -1 (Figure 12.8c) corresponds to OH stretch in the apatite structure. With increasing [Zn 2+ ] above 107 ppm, the broad band at 1640 cm -1 grows in sharpness and intensity whereas the band at 3400 cm -1 becomes shifted to a lower wavenumber centred around 3300 cm -1. These bands have been previously reported (Frost, 2004) for α-hopeite (α-zn 3 (PO 4 ) 2.4H 2 O), in which the largest peak around 1640 cm -1 corresponds to the internal bending vibration of water molecules, while the broad, very strong band centred around 3300 cm -1 represents OH stretching. Also above 356 ppm [Zn 2+ ], a shoulder at 1068 cm -1 and 1148 cm -1 3 appears that are characteristic absorptions due to the PO 4 group in α-hopeite (Figure 12.8a) (Pawlig and Trettin, 1999). Additionally, a side band at 2649 cm -1 is seen to emerge with 36 ppm [Zn 2+ ] and above (Figure 12.8c). This band has been previously assigned to librations of the hydrate H 2 O molecules in α-hopeite (Pawlig et al., 2001). The structure of α-hopeite consists of ZnO 2 (H 2 O) 4 octahedra, ZnO 4 tetrahedra, and PO 4 tetrahedra, none of which are regular; these polyhedra share corners and edges. Previous studies have reported the growth of crystals of α- hopeite on the outermost surfaces of zinc-containing dental cements, which is in direct contact to enamel and dentine (Crisp et al., 1978). Many studies have demonstrated that HAp can bind to a variety of divalent metal cations and has a high capacity for the removal of Zn 2+ and other metal cations in aqueous solutions (Xu et al., 1994, Cheung et al., 2002, Lee et al., 2005). One could also perceive it as metal cations bind to surface sites on HAp. Whichever way round it may be, the uptake of zinc from aqueous solution to coexist on the apatite surface may occur non-exclusively by three main processes: 1) surface adsorption or complexation, which is limited to the accumulation of sorbate on the external surface of the apatite; 2) absorption, ion exchange or diffusion into the solid; and 3) dissolution of HAp and precipitation of metal phosphates or coprecipitation (substitution of Ca in HAp by metals during recrystallisation) (Xu et al., 1994, Corami et al., 2008). The interaction of zinc with HAp/enamel is very likely to occur by more Page 165
182 than one mechanism, and would most certainly vary depending on the ph conditions of reaction and saturation levels with respect to HAp of the system used. 3Zn H 2 PO 4 + 4H 2 O Zn 3 (PO 4 ) 2.4H 2 O + 4H + [12.1] In the context of the present study, the low ph condition releases dissolved calcium and phosphate ions into the aqueous solution, however in the presence of zinc ions, the precipitation of a hopeite-like phase is promoted on enamel surfaces, which in turn suppresses the release of further phosphate ions from the apatite structure (Equation 12.1). This dissolution/re-precipitation mechanism would also explain the reduction in free [PO 3 4 ] measured in solution with increasing zinc ions. Nevertheless, it does appear that with increasing [Zn 2+ ] in the acid solutions, the driving force for the formation of a zinc phosphate species is much greater than the dissolution of apatite, and reduction in demineralisation is observed as a function of [Zn 2+ ]. The results indicate that the formation of a hopeite-like phase is very dependent on ph and a high zinc concentration. O O P O O O Zn O O O P O O O O Zn O O Ca Enamel Surface Ca Figure 12.9: shows the possible coordination of Zn 2+ at the PO 4 3- sites on the enamel surface. The adsorption of zinc and formation of a complex at the apatite surfaces is also a possibility in zinc s mechanistic interaction with enamel. Figure 12.9 is a schematic model illustrating the possible coordination geometry of Zn 2+ 3 at the exposed PO 4 sites on enamel surfaces, in which it is more energetically favourable for zinc to adopt a tetrahedral configuration. The formation of these zinc adsorption complexes would be dependent on the zinc concentration and the surface area for reaction i.e. the availability of PO 3 4 binding sites on the apatite surfaces. As the PO 3 4 binding sites become saturated with zinc ions, there is a significant reduction in tooth mineral loss. In principle, the phosphate ion is probably the most important Page 166
183 component of HAp both inside and outside the lattice. Its state of protonation significantly affects the stability and/or dissolution of the crystal. With a decrease in ph, some of the PO 3 4 ions, most likely those situated at the accessible surfaces of the crystals, becomes protonated to form H 2 PO 4, thus lowering the solubility of the mineral (Robinson et al., 1995) Conclusion This study demonstrates the ability of zinc to reduce the demineralisation of enamel during in vitro caries-simulating conditions. Under the conditions used, zinc acts at the PO 3 4 sites on enamel surfaces to form an α-hopeite-like phase. Zinc phosphates have a low solubility product constant (-log 10 (35.2)) (Nriagu, 1973), and therefore these phases formed on enamel surfaces are unlikely to be very soluble under acidic conditions. Page 167
184 Chapter 13 k Effects of Zinc on Enamel Demineralisation at the Ultrastructural Level 13.1 Introduction Previous studies described in Chapters 11 and 12 confirmed the ability of zinc to reduce enamel demineralisation during exposure to caries-simulating acid solutions (ph 4.0). To study these processes, enamel demineralisation kinetic measurements were obtained using SMR (Chapter 11), and, the calcium and phosphate concentrations in the bulk solution phase were analysed during apatite dissolution (Chapter 12). Although bulk enamel and solution characterisation methods are useful, as they can provide information on the enamel dissolution processes whilst simulating oral conditions, they do not provide information regarding crystal surface phenomena Aim The aim of the present study was to use the surface sensitive technologies of ulesims (see section 7.2.3), and GIXRD (see 7.3.1) combined with Scanning Electron Microscopy (SEM) on treated enamel to provide information regarding the effects of zinc on the enamel surface chemistry. Page 168
185 13.3 Materials and Methods ulesims Preparation of [Zn 2+ ]-Containing Acid Solutions A 2.0 L stock of 0.1 mol/l acetic acid (AnalaR NORMAPUR, VWR International, France) was prepared with deionised water and adjusted to ph 4.0. Subsequently, this was divided into two 1.0 L flasks. Zinc acetate (Zn(O 2 CCH 3 ) 2 ) was added to one flask of the acid reservoir to prepare a solution containing 3565 ppm [Zn 2+ ] (test solution). The acid solution containing no added zinc (0 ppm [Zn 2+ ]) was the control solution. Sample Preparation Four anonymised caries-free permanent molars, extracted for orthodontic purposes, were randomly selected. Two enamel blocks ( 5 x 5 mm) with a thickness of 2 mm were cut from each tooth to obtain a set of test and control sample from a tooth. The dentine was polished off each sample using a P600 grit silicon carbide paper, and the underlying side was varnished. For each set, the control and test samples were immersed in independent containers with 100 ml of acid solution (0 ppm [Zn 2+ ]) at 37 C in a shaking incubator (KS 4000i control, IKA, UK) at 60 rpm for 24 h. Afterwards, each enamel block was transferred to either 100 ml of a 0 ppm [Zn 2+ ] (control) or 3565 ppm [Zn 2+ ] (test) containing acid solution, for a further 96 h. ulesims Experimentation The ulesims measurements were performed with an Atomika 4500 quadrupole SIMS instrument. The samples were bombarded using an O + 2 primary beam of 500 ev, an incident of 30 to the surface normal, while a profile time of 450 minutes was used. An O + 2 primary ion beam was used because it enhances secondary ion yields, especially Zn +. Determining the Sputter Rate and Crater Depth The sputtering rate of enamel at 500 ev (incident at 30 ) must be known in order to determine the profile depth. It was not possible to determine the sputtering rate of Page 169
186 enamel at 500 ev due to the topography of the enamel surface masking the sputter crater size. However, the sputter rate of enamel at 3 kev (n=4) was achieved because it produced a larger crater depth that could be measured using profilometry [DekTak 3030 stylus]. The sputter rate for a standard HAp pellet disc (Plasma-Biotal Ltd, UK) at 3KeV and 500 ev (n=4) was also determined, in this case the smooth surface enabled 500 ev to be measured. The ratio between the sputtering rate of enamel and HAp at 3 KeV was determined (Equation 13.1) and this ratio then used to estimate a sputter rate of 2 nm/min for enamel at 500 ev based on the sputter rate measured from the 500 ev HAp pellet (Equation ). This calculated sputter rate was then used to obtain the depth scale i.e. the profile time scale was multiplied by the sputter rate. HAp Enamel = 6.25 (μm) (μm) = [13.1] For HAp profiled with a 500 ev beam with a profile time of 450 minutes, the sputter rate was: Sputter rate (HAp) = 495 (nm) 450 (mins) = 1. 1 nm/min [13.2] For enamel profiled with a 500 ev beam with a profile time of 450 minutes, the sputter rate was determined using the HAp/Enamel ratio in Equation 12.1: Sputter rate (enamel) = 1.1 (nm /min) = nm/min [13.3] Therefore a sputtering rate of 2 nm/min was used for the depth profile analyses. Page 170
187 GIXRD Sample Preparation Enamel blocks ( 8 x 5 mm) were cut from a tooth to obtain a control and test sample. Dentine was removed using a P600 grit silicon carbide paper. The samples were polished flat on the sides of the natural enamel surface using P800, P1000, P2400 and P4000 to obtain a smooth and level surface, with 1 mm thickness, for GIXRD analysis. The amount of mineral polished/removed at the enamel surface was on the order of sub-microns. The underlying dentine sides were varnished so that only the enamel surface was exposed to reaction solutions. The samples (control and test) were immersed in independent containers with 100 ml of acid solution (0 ppm [Zn 2+ ]) at 37 C in a shaking incubator (KS 4000i control, IKA, UK) at 60 rpm for 24 h. The varnished side of the sample was placed so that is always faced the bottom of the container. Subsequently, each sample was transferred to either 100 ml of a 0 ppm [Zn 2+ ] acid solution (control), or 3565 ppm [Zn 2+ ] acid solution (test), for a further 96 h. Determining the Penetration Depth The specimens were analysed with an incident angle of 3. The specific X-ray penetration depth (h) can be calculated based on the incident angle and material parameters (described in section 7.3.1). The linear attenuation coefficient for HAp (µhap = 273 cm -1 ) was used to estimate that x, the distance that the X-ray beam travels (1/e), was µm. The estimated penetration depth (h) can be calculated using x and the grazing incident angle, α: h = x. sin(α) h = sin(3) = μm Therefore, a penetration depth of 20 nm was measured in the samples. Page 171
188 SEM SEM was carried out on the control and test samples of the GIXRD samples. Once enamel samples were air dried, they were attached to SEM stubs for imaging preparation. Silver dag (detail) was applied between the edges of all the samples and edge of the stubs, and all samples were gold coated for 9 minutes to minimise charging and improve the imaging resolution. Samples were imaged on a Zeiss Crossbeam FIB-SEM (Carl Zeiss Microscopy GmbH, Jena Germany) under a 2 KeV beam voltage and a 30 micron aperture, using a secondary electron detector. Images were taken at a working distance of approximately 8 mm and at magnifications of x50 to x20 k, with random images selected that were representative of the entire samples. Page 172
189 Relative ion yield (c.p.s) 13.4 Results ulesims Test (3565 ppm [Zn 2+ ]) Control (0 ppm [Zn 2+ ]) Depth profile of zinc (nm) Figure 13.1: ulesims depth profile of zinc in control sample (blue) and test sample (red). The depth profile (nm) has been plotted against relative ion yield for zinc. The insert shows the depth profiling of zinc up to 10 nm and the dashed line in this plot represents the depth of one unit cell for HAp crystal. Figure 13.1 shows the ulesims depth profile measured for Zn 2+ in the control and test samples (plotted up to 50 nm).the insert is the same graph but plotted up to 10 nm to enhance the near surface region. The depth profile (nm) shows the Zn + yield as a function of depth. The dashed line represents the depth of one unit cell of hydroxyapatite. In the control sample, no significant zinc was detected and probably attributable to background noise. The test sample however shows a ten-fold increase in zinc concentration at the enamel surface and was measured into the surface up to 1 nm. The zinc depth profile shows a sharp decline concentration from the first point of measurement to penetration depths of 5 nm. Beyond the first 5nm, the zinc concentration measured in the test sample plateaus out at a low level, although it remains slightly above the zinc signal that was measured in the control sample. Page 173
190 GIXRD C o n tr o l ( 0 p p m [Z n 2+ ]) T e s t ( p p m [Z n 2+ ]) H o p e ite r e fe r e n c e th e ta ( d e g r e e s ) Figure 13.2: GIXRD patterns for the control (0 ppm [Zn 2+ ]) sample (blue), test sample (3565 ppm [Zn 2+ ]) (red) and α-hopeite reference (black). Figure 13.2 shows the GIXRD patterns for the control (0 ppm [Zn 2+ ]) and test (3565 ppm [Zn 2+ ]) enamel samples. The control sample shows well-resolved diffraction patterns for apatite (typical apatite peaks appear at 10, 26 and θ). In the test sample, new diffraction peaks appear (in the range θ) that are identical to the diffraction peaks in the α-hopeite reference patterns. Page 174
 control (0 ppm [Zn 2+ ]) at low magnification b) control (0 ppm [Zn 2+ ]) at high magnification c) Test (3565 ppm [Zn]) at low magnification and d)")
191 SEM a)) b)) c)) d)) Figure 13.3: SEM images of GIXRD polished enamel samples: a) control (0 ppm [Zn 2+ ]) at low magnification b) control (0 ppm [Zn 2+ ]) at high magnification c) Test (3565 ppm [Zn]) at low magnification and d) Test (3565 ppm [Zn 2+ ]) at high magnification. SEM micrographs of the control and test GIXRD samples are shown in Figure The control sample show characteristic features for demineralised enamel. For instance, the enamel cores and walls are visible in Figure 13.3a due to an etched prism structure, whereas needle-like enamel crystallites are evident in Figure 13.3b. The treated samples show crystals of α-hopeite on the enamel surface in Figures 13.3c and d. These are distributed evenly on the enamel surface. Page 175
192 13.5 Discussion The previous studies (Chapters 11 and 12) demonstrated the ability of zinc to reduce bulk enamel demineralisation. This was shown by measuring the calcium and phosphate ion dissolution (ICP-OES) and directly measuring the physical changes in enamel mineral mass (SMR) as a function of [Zn 2+ ]. Whilst these studies measured structural changes in bulk enamel at the micro-level, ulesims was used in this study for the direct measure of zinc in the enamel crystal surface. The application of a primary ion beam with an ultralow energy provides atomic information about zinc at enamel surfaces by directly measuring its concentration as a function of depth just below the surface. Since ultralow primary ion beam energies have a penetration depth in the order of nanometres or less, only the uppermost atomic layers of the material s surface is investigated. The high sensitivity of ulesims for the measurement of zinc at the apatite surface, or in amongst the apatite crystals is strategically useful, and contributes to understanding the role of zinc in dental enamel caries. Furthermore, this study describes the first application of this novel technique for depth profiling zinc in dental enamel with nano-level resolution. To obtain the zinc depth profile, the sputtering rate of enamel by the primary ion beam is required. For this, the sputter crater depth in the enamel surface, which is present as a result of the primary ion beam, must be measured. As it was not possible to determine the exact sputtering rate of enamel at ultralow beam energy (500 ev) due to the topography of the enamel surface masking the small sputter crater size, the sputter rate was also determined for a standard HAp pellet disc. It would be misleading to assume that the synthetic HAp pellet has the same sputter rate as human enamel, as the latter has greater porosity that is structurally nonuniform, and is naturally rather variable in chemical composition. Moreover, the SIMS sputter rate is known to vary between different matrix materials (Morris et al., 2012). Thus, from the ratio between sputter rates of enamel and HAp taken at a higher beam energy (3 KeV) a sputter rate of 2 nm/min for enamel at 500 ev was estimated. Page 176
193 Within 5 nm of the enamel surface, a ten-fold increase in [Zn 2+ ] was measured for the zinc-treated sample (at 3565 ppm [Zn 2+ ]) compared to the control sample (0 ppm [Zn 2+ ]) (Figure 13.1). This equates to 67 atoms of zinc. Above 5 nm, a low [Zn 2+ ] level persists in demineralised enamel surfaces for hundreds of nanometres, which was slightly above the measured [Zn 2+ ] for the control sample. The ulesims depth profile illustrates that the majority of zinc is concentrated at the near-surface region, suggesting that zinc acts predominantly at the enamel crystal surface in its mechanism in reducing enamel demineralisation. A trace amount of zinc could also react with a small proportion of the enamel surface, and according to the zinc depth profile this would be approximately 2-3 unit cells of the apatite crystal lattice structure. This may be feasible via absorption, ion exchange or diffusion mechanism. It should be pointed out here that zinc is present naturally in teeth with reported concentrations between ppm at the enamel surfaces (see Section 4.2.1) and therefore it is entirely plausible that zinc could become incorporated into the enamel during the dissolution process. GIXRD was also used to determine the crystallographic identification of the zinc mineral phase formed on the demineralised enamel. The grazing incidence configuration increases the sensitivity of XRD measurement to surface phase of the sample and minimises the substrate contribution. Here, the X-ray penetration depth in the samples was around 20 nm, thus there was minimal substrate contribution on the diffraction response from the bulk enamel. GIXRD confirmed that the crystallographic phase present on the enamel surface was α-hopeite (α- Zn 3 (PO 4 ) 2.4H 2 O) (Figure 13.2). In the literature, structural analysis of α-hopeite crystals has shown an orthorhombic crystal habit with cell dimensions a = Å, b = Å, c = Å (Herschke et al., 2004). In order to perform GIXRD analysis, the samples were polished flat at the natural surface prior to demineralisation and treatment in acid solutions containing high [Zn 2+ ]. From SEM observations, it is evident that these α-hopeite crystals are evenly distributed on the enamel surface (Figure 13.3). Whilst these were extreme conditions used, as one does not expect such large crystals ( 170 µm in length and 9 µm in width) to form on enamel Page 177
194 surfaces in the oral environment in vivo, it did permit the direct identification of the crystallographic phase using GIXRD. The polishing/etching of enamel greatly enhanced the formation of α-hopeite crystals on exposure to high [Zn 2+ ] in the acid solution, most likely, as this particular treatment would increase the number of nucleation sites on the enamel surfaces (Larsen, 1986). Thus, the required activation energy for the initial nucleation of α- hopeite is reduced, and the surface energy for subsequent crystal growth is also reduced due to the presence of structural defects/flaws in the enamel crystal surface (Wang and Nancollas, 2008) (see Section 4.3). In this in vitro demineralisation system, the enamel substrate forms a template and facilitates the precipitation of α-hopeite. Here the dissolving enamel apatite is the source for phosphate in the formation of α-hopeite, which appears to happen epitaxially. In the unpolished enamel samples that were subjected to the same acid reaction condition (i.e. samples used in the ulesims experiment), large crystals of α-hopeite were not present on the enamel surfaces when observed under SEM (images not shown). Since the ulesims depth profile confirmed that zinc is concentrated at the near-surface region of enamel, the possibility of nano-crystals of α-hopeite forming on the enamel surface cannot be ruled out. Thus accordingly, approximately 10 unit cells of α-hopeite would be equivalent to the highest zinc concentration region in the ulesims depth profile. Although the previous studies demonstrate that zinc exhibits an inhibitory effect on apatite mineral dissolution, it should be noted that zinc is also a crystal growth poison of hydroxyapatite. Zinc is known to bind at active growth sites on crystal surfaces via a Langmuir-type adsorption, beyond the point of monolayer coverage, which inhibits HAp crystal growth (Section 5.4.2). In a similar fashion, it is possible that zinc blocks the active dissolution sites such as dissolution pits on enamel crystals via an adsorption mechanism at lower [Zn 2+ ], and precipitates α-hopeite at higher [Zn 2+ ], thus ultimately suppressing the enamel crystal dissolution (Fuierer et al., 1994). Figure 13.4 illustrates zinc ions blocking dissolution pits present on crystal surfaces. Of course this is speculative and further studies are required to investigate Page 178
195 the molecular events occurring on enamel surfaces during dissolution and in the present of zinc using techniques such as Atomic Force Microscopy. P S T Zn 2+ S Zn 2+ T Figure 13.4: Schematic representation of dissolution pits (P) on enamel crystal surface. Adsorption of zinc ions at dissolution pit sites are illustrated Conclusion The present study reports interesting preliminary data on the application of novel techniques to investigate the surface effects of zinc on enamel demineralisation which provided information on its mode of action. Further, a unique approach for studying the effect of metal cations on surface enamel dissolution was demonstrated, which has scope for further development in future studies. Page 179
196 DISCUSSION & CLINICAL IMPLICATIONS Page 180
197 Chapter 14 k Discussion & Clinical Implications The studies presented in this thesis describe the effects of increases in fluoride and zinc ion concentration on enamel demineralisation, with a key focus on caries control and prevention. The anti-demineralisation potential of zinc was investigated to gain an indication of its possible protective effects during a caries challenge. Human dental enamel samples were subjected to ph adjusted acetic acid solutions to simulate a cariogenic challenge. An in vitro demineralisation model was used, which excluded additional calcium or phosphate ions, to ensure that any reduction in demineralisation was due to the ion under investigation. Although in vivo many variables influence the development and progression of dental caries, such as the salivary pellicle and biofilm, these factors were eliminated in order to assess only the direct physical effect of Zn 2+ and F ions on the demineralisation of enamel. Thus, a strictly controlled in vitro system allowed the mechanistic interaction between zinc and fluoride on enamel to be determined under the specified conditions. This in vitro study provides the fundamental basis for developing in vivo or in situ studies that are necessary to achieve more conclusive clinical findings. Scanning Microradiography (SMR) was used to measure how the real-time dissolution of bulk enamel was modified by increasing the concentration of zinc or fluoride ions in the acid solutions. Whilst SMR has been used previously in apatite dissolution studies (Anderson and Elliott, 1992, Anderson et al., 1998, Shah et al., 2011), this was the first application of the technique to investigate human enamel demineralisation effected by fluoride or zinc ion concentration. Further, the Page 181
198 application of a range of sophisticated, and some novel, techniques provided some perspective into the possible surface physical chemical mechanisms that are involved during the dissolution process. Page 182
199 14.1 Fluoride Studies The effect of [F ] on the in vitro demineralisation of dental enamel under acid conditions simulating dental caries was investigated using SMR (Chapter 9) and 19 F MAS-NMR (Chapter 10). During demineralisation, the highly electro-negative fluoride ion strongly adsorbs at the Ca 2+ sites on the enamel crystal surface, which provides substantial protection against tooth mineral loss (Featherstone et al., 1990). A log-linear relationship (see Figure 9.4) was observed between the reduction in enamel demineralisation and increasing [F ] up to 135 ppm, thus as the F uptake increased, the amount of mineral loss during demineralisation was correspondingly reduced. However, the log-linear relationship is of particular interest because it suggests there is competitive interaction between local fluoride ions for fewer available Ca 2+ sites on the enamel surface as they become gradually occupied, with increasing fluoride ion concentration in the solution (Figure 14.1). This log-linear trend shows characteristics of a saturation exponential function, which is common in ligand-receptor interactions in biochemical responses (Hulme and Trevethick, 2010). Increasing [F ] F - F - F - F - Ca 2+ Ca 2+ Ca 2+ Ca 2+ Ca 2+ Ca 2+ Ca 2+ Ca 2+ Ca 2+ Ca 2+ Ca 2+ Ca 2+ F - F - F - F - F - F - F - F - F - F - F - F - F - F - F - F - Ca 2+ Ca 2+ Ca 2+ Ca 2+ Ca 2+ Ca 2+ Ca 2+ Ca 2+ Ca 2+ Ca 2+ Ca 2+ Ca 2+ F - F- F - F - F - F- F - F - F - F - F - F - F - F - F - F - F - F - F - F - F - F - F - F - F - Ca 2+ Ca 2+ Ca 2+ Ca 2+ Ca 2+ Ca 2+ Ca 2+ Ca 2+ Ca 2+ Ca 2+ Ca 2+ Ca 2+ Crystals of dental enamel Figure 14.1: Schematic illustration of adsorbed fluoride ions on the surface of dental enamel crystals. With increasing [F ], fewer calcium sites are available for binding which results in more and more fluoride ions competing for the few sites that are still available. An important feature of this log-linear dependency is that fluoride exhibits a greater change in reducing demineralisation at lower [F ] ( 135 ppm) compared to higher Page 183
200 [F ] ranges. For example, 11 ppm [F ] resulted in an 70 % decrease in enamel mineral loss, whereas for 135 ppm [F ] there was an 90 % decrease. Therefore, the ability of fluoride to significantly decrease demineralisation, particularly at lower background concentrations, should not be neglected. Above 135 ppm [F ], very little further reduction in demineralisation was measured by SMR most likely due to the formation of CaF 2 on enamel surfaces, which reduced any further mineral loss. This threshold effect was confirmed by 19 F MAS- NMR that under the conditions studied, a fluorohydroxyapatite (Ca 10 (PO 4 ) 6 (OH) 2-x F x, FHAp) mineral phase formed on the enamel surface at [F ] ( 45 ppm), and 135 ppm [F ] CaF 2 was the predominant mineral phase. a) b) PO 3 4 Ca 2+ Ca2+ Ca 2+ Ca2+ F - F - F - F - F - F - F - Ca 2+ Ca 2+ Ca 2+ Ca 2+ Ca 2+ Ca 2+ Ca 2+ Ca 2+ Figure 14.2: Schematic representation of fluoride ions adsorbed to the apatite crystal surface of dental enamel: a) at low [F ], the adsorbed fluoride ions attract calcium ions which then attract phosphate ions, to form a FAp-like remineralised veneer on the crystal surface. b) at high [F ], the saturation of fluoride ions at the enamel crystal surface promotes the formation of CaF 2. Below a certain concentration (for the conditions used here this was 135 ppm [F ]) it is likely that the surrounding solution is saturated with respect to FAp, with local Ca 2+ and PO 4 3 ions available from the dissolved enamel, which would drive the deposition of a fluoridated apatite mineral. Substitution of OH by F in the surface of the enamel is also likely to occur at sub-ppm fluoride concentrations (Section 3.4.2). Above 135 ppm, the solution is supersaturated with respect to CaF 2 promoting its formation (Figure 14.2). Additionally, the Ksp of FAp (2.51 x ) is much smaller than CaF 2 (3 x ) (McCann, 1968), and therefore the preferential formation of a fluoridated apatite might be expected. Although very little further reduction in demineralisation was observed >135 ppm [F ], the formation of CaF 2 could be potentially detrimental to the structural Page 184
201 integrity of enamel. The excessive formation of fluorite reduces the available Ca 2+ 3 ions required for remineralisation, which in turn, promotes the loss of PO 4 ions thereby decreasing the mineral content in the tooth. The present findings suggest that the formation of a fluoridated-apatite mineral phase is more favourable, as this mineral phase would be more resistant to acid dissolution than the natural carbonated apatite enamel. These results suggest that there is an optimum range ( ppm) of local [F ] for inhibiting demineralisation, and promoting the formation of a fluorohydroxyapatite phase Clinical Significance The 135 ppm threshold in the studies described may be particularly relevant to the case of fluoride applied topically from standard (i.e. < 1500 ppm [F ]) dentifrices and mouth rinses. During studies where a fluoride mouth rinse was used, and whose concentration simulated salivary fluoride concentration during brushing with fluoride dentifrices, Vogel and co-workers reported that plaque fluid concentrations were more than an order of magnitude lower than 135 ppm (Vogel et al., 2000b), even following acidification and concomitant fluoride release (Vogel et al., 2000a) (Section 4.4.4). Ekstrand (1997) reported that when 912 ppm [F ] (as both sodium fluoride and sodium monofluorophosphate) mouthrinses were used, plaque fluid fluoride concentrations did not approach 135 ppm. Thirty minute values for all subjects were less than 15 ppm. These authors did not report plaque fluid fluoride concentrations immediately after the application of fluoride, which would almost certainly have been higher than, for example, the thirty minute values. However, these thirty minute values do make it very difficult to imagine values close to 135 ppm immediately following application. Regardless, the available data suggest that for most of the day, fluoride concentrations will be more than an order of magnitude lower. The current work demonstrates that under the constant acidic conditions studied, [F ] of up to 135 ppm significantly reduces enamel demineralisation; however, there is no further significant reduction in demineralisation >135 ppm [F ]. Although these values are based on an in vitro demineralisation model and cannot be directly Page 185
202 translated to the oral environment, the findings substantiate that near-optimum effects can be achieved at quite low [F ] and under certain conditions, no substantial benefit in further increases in fluoride concentration is observed. It has been previously reported that sub-ppm [F ] are sufficient for preventing the initiation of caries in sound enamel, but considerably higher concentrations are required once a carious lesion has formed (Margolis et al., 1986, Yamazaki et al., 2007). Therefore, the availability of sufficient fluoride in the oral fluids is critical to decrease net demineralisation during an acidic challenge and to promote remineralisation at potential caries initiation sites. According to the present findings, to provide optimal protection at a low ph environment (ph 4.0), a local [F ] 135 ppm should be present in the oral fluids in order to both reduce demineralisation and promote deposition of a fluoridated apatite mineral phase that has a lower solubility than natural enamel apatite. Ideally, low fluoride concentrations should be constantly available in the oral fluids through slow releasing mechanisms such as the oral F reservoirs, in order to sustain long-term anti-caries effects. Page 186
203 14.2 Zinc Studies The present study demonstrated the ability of zinc ions to reduce the rate of enamel demineralisation under in vitro acid conditions simulating dental caries (Chapters 11-13). This surface phenomenon effect is conjectured to occur via more than one mechanism, and shows a dependency on the zinc ion concentration. In brief, the putative mechanism is likely to be an adsorption-type process of zinc at PO 3-4 sites on enamel surfaces at lower concentrations ( ppm), whereas the formation of an α-hopeite-like phase occurs (>1782 ppm) once surface adsorption is completed (Fuierer et al., 1994, Davey et al., 1997). All things considered, it should be noted that the uptake of zinc ions from aqueous solution to the apatite surface may occur non-exclusively by three main processes: 1) surface adsorption or complexation at PO 3 4 sites, which is limited to the accumulation of Zn 2+ on the external surface of the enamel apatite; 2) incorporation of Zn 2+ into the apatite lattice at Ca (II) sites or Ca vacancies; and 3) dissolution of HAp and precipitation of α-hopeite or co-precipitation (substitution of Ca 2+ in HAp by Zn 2+ during recrystallisation). An overall log-linear relationship was observed between the reduction in enamel demineralisation and increasing [Zn 2+ ] up to 3565 ppm, however between ppm [Zn 2+ ] a rapid increase in the rate of reduction was measured. This rapid modification of the demineralisation rate could be explained by the almost instantaneous occupancy of the abundant PO 3 4 binding sites by zinc ions, and as these sites become occupied the rate of demineralisation is effectively reduced. Further, the log-linear trend suggests that with increasing [Zn 2+ ], there are fewer available PO 3 4 sites and therefore more and more zinc ions are competing for a smaller number of unoccupied PO 3 4 sites on the enamel surface. For instance, above 100 ppm [Zn 2+ ], smaller decreases in demineralisation were measured with subsequent increases in zinc ion concentration. Therefore, further increases in the reduction of demineralisation is limited by surface adsorption of zinc ions and the zinc ion concentration of the solution. Page 187
204 Bulk solution analysis of ion release from enamel blocks showed an overall decrease in the [Ca 2+ ] and [PO 3 4 ] dissolution with increasing [Zn 2+ ], however there was considerably less PO 3 4 released than Ca 2+ (Figure 12.1a). Further, the Ca/P ratio in solution increased as a function of [Zn 2+ ] i.e. the solution was always more phosphorus-deficient with respect to the apatite stoichiometry (1.67). This strongly indicated that zinc acts at PO 3 4 sites on the enamel surface, which in turn, effectively supresses its dissolution. However, in previous work by Brudevold et al. (1963), the uptake of zinc to HAp was postulated to involve a simple ion exchange between zinc ions and surface calcium ions, and was further supported by Gilbert and Ingram (1988), who reported the concomitant release of calcium when zinc was adsorbed. The current findings contradict the aforementioned studies as an overall decrease in the calcium ion dissolution was observed, indicating that the exchange of zinc with surface calcium does not occur extensively under the conditions used in this study. These differences may be explained by the dissimilar experimental procedures used. For instance, the earlier mentioned studies used treated synthetic HAp powder equilibrated at different zinc concentrations whereas the current study used human enamel treated to acid solutions and zinc-containing acid solutions. Neutron diffraction data on the HAp sample treated with 3565 ppm [Zn 2+ ] suggested that zinc is not only forming a zinc phosphate species at the HAp surface, but could also potentially diffuse into the bulk apatite lattice structure (section ). There are conflicting views reported on the incorporation of zinc into the HAp structure, and according to some authors, zinc may substitute at Ca (II) sites to a very small degree via passive diffusion. Conversely, a larger amount of zinc can be incorporated into the apatite lattice via a wet-chemistry precipitation method, however this is likely to distort the apatite lattice due to the smaller ionic radius of zinc (0.74 Å) compared to calcium (0.99 Å) (Section 5.4.1). Page 188
 showed the presence of a zinc concentration gradient within 5 nm of the enamel surface, as a result of the condition used in the study.")

205 0.69 nm Surface Crosssections Dentine Enamel mm Rods Thickness: ~4-5 µm Length: ~3mm µm Crystallites Thickness: ~26 nm Width: ~68 nm Length: ~ nm nm Hydroxyapatite (Ca 10 (PO 4 ) 6 (OH) 2 ) 0.94 nm Ca 2+ OH - PO 4 3- Figure 14.3: Hierarchical structure of dental enamel showing different hierarchical levels from the microscale down to nano-scale. The ulesims study (Section ) showed the presence of a zinc concentration gradient within 5 nm of the enamel surface, as a result of the condition used in the study. This is perhaps the most compelling evidence that zinc acts predominantly at the enamel crystal surfaces in its mechanism in reducing demineralisation. If one considers the hierarchical structure and surface features of dental enamel at the nano-level, it consists of highly crystalline nanorod-like HAp crystallites that are arranged parallel to each other (Hannig and Hannig, 2010) (Figure 14.3). These HAp crystallites are composed of millions of HAp unit cells and the ulesims depth profile indicates that zinc acts within 4-5 unit cells of the enamel crystal surface. Therefore, an important feature of this study is that zinc exhibits an effect on the enamel structure at the nano-level which as a result modifies the chemical properties of the enamel surface layer. Enamel dissolution is conventionally studied at the microscopic level. However, in principle at the nano-level, the surfaces can dominantly determine the material properties, and often plays the critical role to how the bulk enamel may behave during dissolution. Therefore, if dissolution is being suppressed by zinc at the nano-level, by possible forming a nano-hopeite like crystals and/ or blocking dissolution pits, the resulting surface structure may enhance the resistance of the bulk mineral to acid challenges. Page 189
206 Clinical Significance All these reported findings are clinically significant, particularly when considering the oral desposition of zinc following application from, for example, mouth-rinses and toothpastes. Typical concentrations of zinc range between ppm in toothpastes and ppm in mouthwashes and rinses. Some zinc is also present naturally in both plaque and saliva, with reported background concentrations of ppm in saliva, and 5 30 ppm in plaque (Section 5.2.2). Following application, zinc is cleared from saliva bi-modally, (Cummins and Creeth, 1992) with relatively high post-application concentrations falling rapidly over the first hour. Thereafter, lower concentrations, still significantly elevated when compared to baseline, may persist for many hours. A similar trend is seen in plaque. Here, elevated concentrations can persist for at least 12 hours after application (Afseth et al., 1983b). Thus a good oral substantivity is exhibited by zinc, with around % retention of the applied zinc dose (Afseth et al., 1983a, Tanwalker and Gilbert, 1989). However, in order to influence enamel demineralisation under cariogenic conditions, zinc must be available in the plaque-fluid at a concentration sufficient to reduce or inhibit tooth mineral loss. Pharmacokinetic data relating to zinc concentrations in plaque-fluid following application are apparently almost absent from the literature, with only one reported value (15.2 ppm) for plaque-fluid measured one hour after use of a mouth-rinse containing zinc citrate at 0.5 % (Saxton et al., 1986). This was substantially higher than the background value (0.2 ppm), and the data from the present study suggest that this increased zinc concentration over background would effect a substantial reduction in demineralisation. It is also likely that higher plaque-fluid zinc concentrations than this one-hour value might occur. While the mouthwash contained 0.5 % zinc citrate, toothpastes containing 2.0 % are widely available (Adams et al., 2003). Assuming that the efficiency of zinc delivery is at least broadly similar for mouth-rinses and toothpastes, it seems probable that a substantial increase in plaque-fluid zinc citrate concentration would result following application of zinc at this higher concentration. Also, as stated above, zinc concentrations in whole plaque fall Page 190
207 rapidly in the hour following application, so it is likely that zinc concentration in plaque-fluid follow a similar trend i.e. concentrations are considerably higher in the hour following application. Further, zinc binds to lipoteichoic acid (LTA) associated with plaque bacteria in model biofilms in the same way as calcium, and it has been proposed that half of the bound zinc would be released under cariogenic conditions, largely through protonation of carboxylate and phosphate groups in LTA (Rose, 1996). This mechanism can elevate the zinc ion concentration in the oral fluids to provide protection of enamel against further demineralisation, which from a caries prevention perspective is when it is the most critical. Page 191
208 14.3 Comparison of Zinc & Fluoride Mechanistic Action An important finding from this study was demonstrated by comparing the mechanisms of zinc and fluoride ion concentration on enamel demineralisation. The log-linear trends observed for both fluoride and zinc implied there are some similarities in their mechanism for reducing demineralisation (Figure 14.4). Fluoride showed a log-linear increase up to 135 ppm [F ], above which very there were little further increases in reduction in demineralisation and a plateau-effect was apparent. For zinc, a log-linear increase was observed up to 3565 ppm [Zn 2+ ] with PRML enamel values approaching >100 %. If the [Zn 2+ ] was increased above 3565 ppm in this study, it would also be likely to observe this plateau-effect. Thus, saturation of surface sites on enamel was observed more quickly for fluoride ( 135 ppm) than for zinc ( 3565 ppm) indicating fluoride is more efficacious than zinc at inhibiting enamel dissolution. 100 Fluoride 100 Zinc Reduction in Demineralization (%) Reduction in Demineralization (%) [F - (ppm)] [Zn 2+ ] / ppm Figure 14.4: Comparing the percentage reductions in enamel demineralisation (PRML enamel ) as a function of increasing [F ] or [Zn 2+ ] (ppm) in the acid solution for the SMR studies. Although there was a continuous circulation in the SMR cell to maintain pseudoconstant composition in bulk solution, concentration gradients will exist close to the enamel surface (except in extreme conditions e.g. constant composition studies (Tang et al., 2003a) see Section 3.4.2). However, calculations for the degree of saturation (see Appendix B) of the demineralisation solution with respect to FAp and hopeite shows that either the degree of undersaturation for FAp is less than for hopeite, or that the degree of supersaturation is higher for FAp than for hopeite, at Page 192
209 any given combination of across a range of calcium and phosphate concentrations that might be found at the enamel surface in this system. This may explain why considerably less fluoride is needed to exert the same effect of zinc at higher concentrations. Despite these differences, fluoride and zinc exhibited a greater change in reducing demineralisation per unit ppm at lower concentration ranges. This was between ppm for fluoride, whereas for zinc this was between ppm, although the overall PRML enamel values were generally higher for zinc than fluoride. This result is interesting as zinc was marginally more effective at reducing demineralisation at lower concentrations than fluoride, under the conditions used in the study. For lower concentrations of fluoride (< 135 ppm), it was confirmed that a fluorohydroxyapatite phase formed at enamel surfaces, which could occur by a precipitation or iso-exchange mechanism, whereas it is speculated that zinc adsorbs at PO 3 4 sites on the enamel crystal surface. Thus at low concentrations, fluoride forms a surface layer of fluoridated apatite mineral which has a lower solubility than the natural enamel mineral, whereas zinc is likely to act at phosphate sites to suppress its dissolution from the apatite structure. At higher concentrations, fluoride forms CaF 2 ( 135 ppm) predominantly, whereas zinc forms α-hopeite-like (α-zn 3 (PO 4 ) 2.4H 2 O) phase (>1782 ppm). The formation of CaF 2 is dependent on the local calcium and fluoride ion concentration in solution, by which a high [F ] drives the precipitation of CaF 2 on enamel surfaces. Similarly, the formation of α-hopeite is to be expected once surface adsorption of Zn 2+ at phosphate sites are completed on enamel surfaces, whereby increasing [Zn 2+ ] increases the likelihood of the precipitation of this zinc phosphate species on the enamel surfaces. Page 193
210 CONCLUSIONS & FUTURE WORK Page 194
211 Chapter 15 k CONCLUSIONS & RECOMMENDED FUTURE WORK 15.1 Main Findings From Study The following conclusions were delineated for the conditions used in the present study: 1. The ability of zinc to reduce enamel demineralisation during in vitro caries simulating conditions was confirmed. Increasing [Zn 2+ ] in the acid solution significantly reduced the rate of enamel demineralisation. The log-linear relationship between [Zn 2+ ] and PRML enamel suggests that the reduction in enamel dissolution is limited by the saturation of surface sites on the enamel surface. 2. The putative mechanism for the ability of zinc to reduce enamel demineralisation during in vitro caries simulating conditions was that zinc acts predominantly at the PO 3 4 sites on enamel surfaces most likely via an adsorption-type process at lower concentrations, and forms an α-hopeitelike phase once surface adsorption is completed. The ulesims depth profile indicated that the majority of zinc is concentrated at the near-surface region of dental enamel, suggesting that zinc acts predominantly at the enamel crystal surface in its mechanism of reducing enamel demineralisation. Accordingly, zinc could potentially block active dissolution sites on the apatite crystal thus suppressing dissolution at the atomic level. Page 195
212 3. The results from this study suggest that zinc in plaque-fluid and saliva, following post-applications of a zinc-containing dentifrice, could effect a substantial protection against enamel demineralisation during an acidic challenge. Therefore in light of the current findings, it would appear there is scope for exploring and optimising the therapeutic potential of zinc, not only as an antibacterial agent but also as a possible preventive treatment for dental caries. Thus, these results have a significant implication on the understanding of the fundamental chemistry aspects of zinc in toothpastes and demonstrate its therapeutic potential in reducing tooth mineral loss. 4. A log-linear relationship between the reduction in enamel demineralisation and fluoride concentration was observed up to 135 ppm [F ]. An important feature of this log-linear dependency was that the incremental antidemineralisation benefit per unit increase in [F ] was greater at the lower [F ] ranges compared to that at higher [F ] ranges. Therefore, the ability of fluoride to significantly inhibit enamel mineral loss, particularly at lower background concentrations ( 0.1 ppm), should not be neglected. 5. The anti-demineralisation mechanism of fluoride was concentration dependent. Below 45 ppm [F ], a fluorohydroxyapatite mineral phase was predominantly formed on enamel surfaces, whereas above 45 ppm, CaF 2 was the main phase formed. The formation of CaF 2 at high [F ] was found to be potentially detrimental to the enamel structural integrity. The excessive formation of fluorite reduces the available Ca 2+ ions required for 3 remineralisation, which in turn promotes the loss of PO 4 ions from the apatite lattice structure thereby decreasing the mineral content in the tooth. Hence, formation of a fluoridated apatite phase was more favourable than fluorite. 6. To provide optimal protection of dental enamel during a cariostatic challenge, a local [F ] 135 ppm should be bioavailable in the oral fluids in order to both reduce demineralisation and promote remineralisation of a Page 196
213 fluorohydroxyapatite mineral phase, which has a lower solubility than carbonated apatite and could therefore more effectively resist subsequent acid challenges whilst sustaining enamel structure. Ideally, low fluoride concentrations should be constantly available in the oral fluids through slow releasing mechanisms such as the oral F reservoir, in order to confer longterm anti-caries effects. These studies confirmed the hypothesis. Fluoride and zinc were effective at reducing the demineralisation of dental enamel during in vitro caries-simulating conditions, and both their mechanistic behaviours were concentration-dependent. Page 197
214 15.2 Future Work The in vitro system used in this study was not intended to reproduce the complex intraoral conditions, rather it allowed a strategic approach for the strict chemical control of individual variables of a multi-factorial disease. The in vivo situation is complicated by dietary eating habits, the presence of physiologically secreted saliva, plaque of varying composition and thickness, and a pellicle-coated tooth surface. The focus of this study was to investigate the effect of zinc ions on enamel demineralisation, and by eliminating these physiological factors it was possible to successfully determine the concentration effects of this ion on the enamel demineralisation process. In order to improve our understanding of the role of zinc in dental caries, further studies are required to investigate the additional effects of calcium and phosphate ions on this in vitro demineralisation system. Additionally, a dynamic ph cycling system is necessary to model the demineralisation and remineralisation balance to mimic the in situ environment. Whilst human teeth are clinically relevant, they are however quite variable in composition, whereas bovine enamel has more uniform composition and provides a less variable response to both cariogenic challenge and anti-caries treatments (Mellberg, 1992). Further SMR studies on bovine enamel would allow better comparison between samples with less variability. Although something to consider with bovine enamel is that it is more porous than human enamel and therefore demineralises faster, hence the rates would differ but overall trends would be comparable to human enamel (Featherstone and Mellberg, 1981). The studies described in this thesis were carried out on sound enamel that had been partially demineralised (surface softened), with subsequent measurements on the extent of further demineralisation in response to zinc or fluoride ions. Quite often, in vitro studies are conducted on artificially induced subsurface lesions rather than evaluating the early surface changes in the enamel. In the clinical situation, subsurface lesions are targeted because it is at a reversible stage of the caries process and is clinically detectable. However, subsurface lesion formation does not necessarily precede cavity formation. In fact, many early lesions have been Page 198
215 described as surface-softening that progresses to loss of surface material and eventually clinical caries (Zero, 1995). At an early stage of the caries process, therapeutic intervention is difficult as the lesion is not clinically observable. Whilst this may be the case clinically, it is essential to understand the early changes in surface enamel during the in vitro demineralisation process, as prevention at this stage is potentially critical in inhibiting further caries development. Nonetheless, to build on the results obtained from this study, it is necessary to model the antidemineralisation effects of zinc ion concentration on a whole range of substrates, including carious lesions, and different conditions. A possible synergistic action between zinc and fluoride for enhancing remineralisation in artificial carious lesions was described in Section The authors of this study demonstrated that a low zinc concentration enhanced the potential cariostatic action of fluoride, possible by maintaining enamel surface porosity, which facilitated deeper penetration of F into the lesion thus increasing subsurface remineralisation. Although these were elegant studies, the use of acidgels presents a number of challenges such as the difficulty to standardise, even under well-controlled in vitro conditions. Whilst the use of acid-gels simulate conditions at caries prone stagnation sites, for example by facilitating the development of ionic concentration gradients, as found in plaque, it is difficult to know exactly what conditions prevail at the gel-enamel interface. Also, it is only possible to measure net demineralisation or remineralisation using destructive techniques such as TMR, at discrete time intervals, after several cycles of de- and remineralisation, rather than monitor the effect of fluoride/zinc on lesion progression in real time. Hence it would be interesting to repeat these studies and measure the synergistic effect of zinc and fluoride on enamel demineralisation kinetics using SMR and the in vitro model used in the present study. The present study suggests that the interaction of zinc with enamel under acid conditions may result in a protective layer on the enamel surface, predominantly due to an adsorption-type mechanism. The resulting modification of the enamel surface layer may generate a more electropositive surface, which could potentially facilitate the diffusion of fluoride ions into the porous enamel structure, down a Page 199
216 concentration gradient. It is possible that an excessive zinc concentration could antagonise the effects of fluoride by adsorbing at surface sites. Further work is required to investigate the combined effects of a range of zinc and fluoride concentrations, using a similar demineralisation model as in the current study. Fluoride exhibits its anti-caries effect by preventing demineralisation from occurring and/or enhancing remineralisation. Whilst this is true, fluoride s efficacy is also related to the stage of the caries lesion. Clinical and mechanistic studies have shown that fluoride concentrations in dentifrices are more effective in inhibiting the initiation of caries and much less effective in inhibiting the progression of a lesion (Bjarnason and Finnbogason, 1991, Yamazaki et al., 2007). Conversely, in situ and in vitro studies by Lynch (2014) (Personal Communication) suggested that zinc was more effective at inhibiting the progression of the carious lesion. Therefore, it would appear there is scope for optimising the therapeutic potential of zinc and fluoride in toothpaste formulations, in particular to understand the efficacy of these ions independently and when combined together. Further studies are needed to look at a range of different conditions which includes the ratio of fluoride and zinc in toothpastes. Page 200
217 REFERENCES Page 201
218 The Multichannel Pulse-Height Analyzer [Online]. ORTEC. Available: [Accessed]. ADAMS, S. E., THEOBALD, A. J., JONES, N. M., BRADING, M. G., COX, T. F., MENDEZ, A., CHESTERS, D. M., GILLAM, D. G., HALL, C. & HOLT, J The Effect of a Toothpaste Containing 2% Zinc Citrate and 0.3% Triclosan on Bacterial Viability and Plaque Growth in vivo Compared to a Toothpaste Containing 0.3% Triclosan and 2% Copolymer. International Dental Journal, 53, ADDY, M., RICHARDS, J. & WILLIAMS, G Effects of a zinc citrate mouthwash on dental plaque and salivary bacteria. Journal of Clinical Periodontology, 7, AFSETH, J Some aspects of the dynamics of Cu and Zn retained in plaque as related to their effect on plaque ph. European Journal of Oral Sciences, 91, AFSETH, J., HELELAND, K. & BONESVOLL, P. 1983a. Retention of Cu and Zn in the oral cavity following rinsing with aqueous solutions of copper and zinc salts. European Journal of Oral Sciences, 91, AFSETH, J., OPPERMANN, R. & RØLLA, G. 1983b. Accumulation of Cu and Zn in human dental plaque in vivo. Caries research, 17, AGUS, H. M., UN, P. S. H., COOPER, M. & SCHAMSCHULA, R Ionized and bound fluoride in resting and fermenting dental plaque and individual human caries experience. Archives of Oral Biology, 25, ANDERSON, P., BOLLET-QUIVOGNE, F. R. G., DOWKER, S. E. P. & ELLIOTT, J. C Demineralization in Enamel and Hydroxyapatite Aggregates at Increasing Ionic Strengths. Archives of Oral Biology, 49, ANDERSON, P. & ELLIOTT, J. C Scanning-X-Ray Microradiographic Study of the Formation of Caries-Like Lesions in Synthetic Apatite Aggregates. Caries Research, 19, ANDERSON, P. & ELLIOTT, J. C Subsurface Demineralization in Dental Enamel and Other Permeable Solids during Acid Dissolution. Journal of Dental Research, 71, ANDERSON, P., LEVINKIND, M. & ELLIOTT, J. C Scanning Microradiographic Studies of Rates of in vitro Demineralization in Human and Bovine Dental Enamel. Archives of Oral Biology, 43, AOBA, T The Effect of Fluoride on Apatite Structure and Growth. Critical Reviews in Oral Biology & Medicine, 8, AOBA, T Solubility Properties of Human Tooth Mineral and Pathogenesis of Dental Caries. Oral Diseases, 10, ARENDS, J Dislocations and Dissolution of Enamel. Theoretical Considerations. Caries Research, 7, ARENDS, J. & CHRISTOFFERSEN, J Nature and Role of Loosely Bound Fluoride in Dental Caries. Journal of Dental Research, 69 Spec No, ; discussion ARENDS, J. & JONGEBLOED, W. L Dislocations and Dissolution in Apatites - Theoretical Considerations. Caries Research, 11, ARENDS, J. & JONGEBLOED, W. L Ultrastructural Studies of Synthetic Apatite Crystals. Journal of Dental Research, 58, ATKIN, J. W. & MANN, B. E NMR and Chemistry: An Introduction to Modern NMR Spectroscopy, Stanley Thorne. BAKALETZ, L. O Developing Animal Models for Polymicrobial Diseases. Nature Reviews Microbiology, 2, BALES, C., FREELAND-GRAVES, J., ASKEY, S., BEHMARDI, F., POBOCIK, R., FICKEL, J. & GREENLEE, P Zinc, magnesium, copper, and protein concentrations in human saliva: age-and sexrelated differences. The American Journal of Clinical Nutrition, 51, 462. BIGI, A., FORESTI, E., GANDOLFI, M., GAZZANO, M. & ROVERI, N Inhibiting Effect of Zinc on Hydroxylapatite Crystallization. Journal of Inorganic Biochemistry, 58, BIGI, A., FORESTI, E., GANDOLFI, M., GAZZANO, M. & ROVERI, N Isomorphous Substitutions in Beta-Tricalcium Phosphate: The Different Effects of Zinc and Strontium. Journal of Inorganic Biochemistry, 66, BJARNASON, S. & FINNBOGASON, S. Y Effect of Different Fluoride Levels in Dentifrice on the Development of Approximal Caries. Caries Research, 25, BONESVOLL, P. & GJERMO, P A comparison between chlorhexidine and some quaternary ammonium compounds with regard to retention, salivary concentration and plaque- Page 202
219 inhibiting effect in the human mouth after mouth rinses. Archives of Oral Biology, 23, BOYDE, A Microstructure of Enamel. Dental Enamel, 205, BRADSHAW, D., MARSH, P., WATSON, G. & CUMMINS, D The effects of triclosan and zinc citrate, alone and in combination, on a community of oral bacteria grown in vitro. Journal of Dental Research, 72, 25. BRAUER, D. S., KARPUKHINA, N., LAW, R. V. & HILL, R. G Structure of Fluoride-Containing Bioactive Glasses. Journal of Materials Chemistry, 19, BROWN, W. E., EIDELMAN, N. & TOMAZIC, B Octacalcium Phosphate as a Precursor in Biomineral Formation. Advances in dental research, 1, BROWN, W. E., GREGORY, T. M. & CHOW, L. C Effects of Fluoride on Enamel Solubility and Cariostasis. Caries Research, 11, BRUDEVOLD, F., STEADMAN, L. T., SPINELLI, M. A., AMDUR, B. H. & GRON, P A Study of Zinc in Human Teeth. Archives of Oral Biology, 8, BURCH, R. E., HAHN, H. K. & SULLIVAN, J. F Newer Aspects of the Roles of Zinc, Manganese, and Copper in Human Nutrition. Clinical Chemistry, 21, BURGUERA-PASCU, M., RODRÍGUEZ-ARCHILLA, A., BURGUERA, J. L., BURGUERA, M., RONDÓN, C. & CARRERO, P Flow injection on-line dilution for zinc determination in human saliva with electrothermal atomic absorption spectrometry detection. Analytica Chimica Acta, 600, BUZALAF, M. A. R Fluoride and the Oral Environment, Basel, Karger. CABRERA, N. & LEVINE, M. M On the Dislocation Theory of Evaporation of Crystals. Philosophical Magazine a-physics of Condensed Matter Structure Defects and Mechanical Properties, 1, CHADWICK, D. & CARDEW, G Dental Enamel, Chichester ; New York, Wiley. CHEUNG, C. W., PORTER, J. F. & MCKAY, G Removal of Cu(II) and Zn(II) Ions by Sorption onto Bone Char using Batch Agitation. Langmuir, 18, CHOW, L. C Tooth-Bound fluoride and Dental Caries. Journal of Dental Research, 69 Spec No, ; discussion CHOW, L. C. & EANES, E. D Octacalcium phosphate, Basel ; London, Karger. CHRISTIANSON, D. W Structural Biology of Zinc. Advances in Protein Chemistry, 42, CHRISTOFFERSEN, J. & CHRISTOFFERSEN, M. R Kinetics of Dissolution of Calcium Hydroxyapatite. Faraday Discussions, CHRISTOFFERSEN, J., CHRISTOFFERSEN, M. R., KIBALCZYC, W. & PERDOK, W. G Kinetics of Dissolution and Growth of Calcium-Fluoride and Effects of Phosphate. Acta Odontologica Scandinavica, 46, CHRISTOFFERSEN, J., CHRISTOFFERSEN, M. R. & KJAERGAARD, N Kinetics of Dissolution of Calcium Hydroxyapatite in Water at Constant Ph. Journal of Crystal Growth, 43, COCHRANE, N. J., ANDERSON, P., DAVIS, G. R., ADAMS, G. G., STACEY, M. A. & REYNOLDS, E. C An X-Ray Microtomographic Study of Natural White-Spot Enamel Lesions. Journal of Dental Research, 91, COLLINS, L. M. C. & DAWES, C The Surface-Area of the Adult Human Mouth and Thickness of the Salivary Film Covering the Teeth and Oral-Mucosa. Journal of Dental Research, 66, CORAMI, A., MIGNARDI, S. & FERRINI, V Cadmium Removal from Single- and Multi-Metal (Cd plus Pb plus Zn plus Cu) Solutions by Sorption on Hydroxyapatite. Journal of Colloid and Interface Science, 317, CREAGH, D. C. & HUBBELL, J. H X-Ray Absorption (or Attenuation) Coefficients. In: WILSON, A. J. C. (ed.) International Tables for Crystallography. Kluwer Academic Publishers, Dordrecht. CRISP, S., O'NEILL, I. K., PROSSER, H. J., STUART, B. & WILSON, A. D Infrared Spectroscopic Studies on the Development of Crystallinity in Dental Zinc Phosphate Cements. Journal of Dental Research, 57, CULLITY, B. D Elements of X-Ray Diffraction, Reading, Mass;London, Addison-Wesley. CUMMINS, D. & CREETH, J Delivery of Anti-Plaque Agents from Dentifrices, Gels and Mouthwashes. Journal of Dental Research, 71, DARLING, A. I Studies of the Early Lesion of Enamel Caries with Transmitted Light, Polarised Light and Radiography. British Dental Journal, 101, Page 203
220 DARLING, A. I The Selective Attack of Caries on the Dental Enamel. Annals of The Royal College of Surgeons of Englamd 29, DAVEY, H. P., EMBERY, G. & CUMMINS, D Interaction of Zinc with a Synthetic Calcium Phosphate Mineral. Caries Research, 31, DAWES, C What is the Critical ph and Why Does a Tooth Dissolve in Acid? Journal of the Canadian Dental Association, 69, DE LEEUW, N. H Resisting the Onset of Hydroxyapatite Dissolution Through the Incorporation of Fluoride. Journal of Physical Chemistry B, 108, DE YOREO, J. J. & VEKILOV, P. G Principles of Crystal Nucleation and Growth. Biomineralization, 54, DOROZHKIN, S. V Dissolution Mechanism of Calcium Apatites in Acids. World Journal Methodology, 1, DOWKER, S. E. P., ANDERSON, P., ELLIOTT, J. C. & GAO, X. J Crystal Chemistry and Dissolution of Calcium Phosphate in Dental Enamel. Mineralogical Magazine, 63, DOWSETT, M. G Depth Profiling using Ultra-Low-Energy Secondary Ion Mass Spectrometry. Applied Surface Science, 203, DUCKWORTH, R., MORGAN, S. & MURRAY, A Fluoride in saliva and plaque following use of fluoride-containing mouthwashes. Journal of Dental Research, 66, DUCKWORTH, R. M. & MORGAN, S. N Oral Fluoride Retention after Use of Fluoride Dentifrices. Caries Research, 25, EKSTRAND, J Fluoride in Plaque Fluid and Saliva After NaF or MFP Rinses. European Journal of Oral Sciences, 105, ELLIOTT, J. C Structure and Chemistry of the Apatites and Other Calcium Orthophosphates., Elsevier. ELLIOTT, J. C Structure, Crystal Chemistry and Density of Enamel Apatites. Ciba Found Symp, 205, 54-67; discussion ELLIOTT, J. C Calcium Phosphate Biominerals. Phosphates: Geochemical, Geobiological, and Materials Importance, 48, ELLIOTT, J. C., DOWKER, S. E. & KNIGHT, R. D Scanning X-ray microradiography of a section of a carious lesion in dental enamel. J Microsc, 123, ELLIOTT, J. C., MACKIE, P. E. & YOUNG, R. A Monoclinic Hydroxyapatite. Science, 180, FEATHERSTONE, J. D Dental Caries: A Dynamic Disease Process. Australian Dental Journal, 53, FEATHERSTONE, J. D., GLENA, R., SHARIATI, M. & SHIELDS, C. P Dependence of in vitro Demineralization of Apatite and Remineralization of Dental Enamel on Fluoride Concentration. Journal of Dental Research, 69 Spec No, 620-5; discussion FEATHERSTONE, J. D. B Prevention and Reversal of Dental Caries: Role of Low Level Fluoride. Community Dentistry and Oral Epidemiology, 27, FEATHERSTONE, J. D. B The Science and Practice of Caries Prevention. Journal of the American Dental Association, 131, FEATHERSTONE, J. D. B., GOODMAN, P. & MCLEAN, J. D Electron-Microscope Study of Defect Zones in Dental Enamel. Journal of Ultrastructure Research, 67, FEATHERSTONE, J. D. B. & MELLBERG, J. R Relative Rates of Progress of Artificial Carious Lesions in Bovine, Ovine and Human-Enamel. Caries Research, 15, FEATHERSTONE, J. D. B. & NELSON, D. G. A The Effect of Fluoride, Zinc, Strontium, Magnesium and Iron on the Crystal-Structural Disorder in Synthetic Carbonated Apatites. Australian Journal of Chemistry, 33, FEDOROWICZ, Z., ALJUFAIRI, H., NASSER, M., OUTHOUSE, T. L. & PEDRAZZI, V Mouthrinses for the Treatment of Halitosis. Cochrane Database of Systematic Reviews. FISCHER, C., LUSSI, A. & HOTZ, P The Cariostatic Mechanisms of Action of Fluorides. A Review. Schweiz Monatsschr Zahnmed, 105, FISCHMAN, S., PICOZZI, A., CANCRO, L. & PADER, M The inhibition of plaque in humans by two experimental oral rinses. Journal of Periodontology, 44, 100. FOX, J. L., IYER, B. V., HIGUCHI, W. I. & HEFFERREN, J. J Solution Activity Product (KFAP) and Simultaneous Demineralization-Remineralization in Bovine Tooth Enamel and Hydroxyapatite Pellets. Journal of Pharmaceutical Sciences, 72, Page 204
221 FROST, R. L An Infrared and Raman Spectroscopic Study of Natural Zinc Phosphates. Spectrochimica Acta Part a-molecular and Biomolecular Spectroscopy, 60, FUIERER, T. A., LORE, M., PUCKETT, S. A. & NANCOLLAS, G. H A Mineralization Adsorption and Mobility Study of Hydroxyapatite Surfaces in the Presence of Zinc and Magnesium Ions. Langmuir, 10, GANSS, C., SCHLUETER, N. & KLIMEK, J Retention of KOH-Soluble Fluoride on Enamel and Dentine under Erosive Conditions - A Comparison of in vitro and in situ Results. Archives of Oral Biology, 52, GARCIA-GODOY, F. & HICKS, M. J Maintaining the Integrity of the Enamel Surface - The Role of Dental Biofilm, Saliva and Preventive Agents in Enamel Demineralization and Remineralization. Journal of the American Dental Association, 139, 25s-34s. GERWARD, L X-Ray Attenuation Coefficients - Current State of Knowledge and Availability. Radiation Physics and Chemistry, 41, GILBERT, R. J. & INGRAM, G. S The Oral Disposition of Zinc Following the Use of an Anticalculus Toothpaste Containing 0.5% Zinc Citrate. Journal of Pharmacy and Pharmacology, 40, GRIFFITHS, J Secondary Ion Mass Spectrometry. Analytical Chemistry, 80, GRON, P Chemistry of Topical Fluorides. Caries Research, 11, HALL, P. J., GREEN, A. K., HORAY, C. P., DE BRABANDER, S., BEASLEY, T. J., CROMWELL, V. J., HOLT, J. S. & SAVAGE, D. J Plaque antibacterial levels following controlled food intake and use of a toothpaste containing 2% zinc citrate and 0.3% Triclosan. International dental journal, 53, HAMILTON, W. J., JR., JUDD, G. & ANSELL, G. S Ultrastructure of Human Enamel Specimens Prepared by Ion Micromilling. Journal of Dental Research, 52, HANNIG, M. & HANNIG, C Nanomaterials in Preventive Dentistry. Nature Nanotechnology, 5, HARA, A. T., ANDO, M., GONZALEZ-CANBEZAS, C., CURY, J. A., SERRA, M. C. & ZERO, D. T Protective Effect of the Dental Pellicle Against Erosive Challenges in situ. Journal of Dental Research, 85, HARRAP, G., SAXTON, C. & BEST, J Inhibition of plaque growth by zinc salts. Journal of Periodontal Research, 18, HARRAP, G. J., BEST, J. S. & SAXTON, C. A Human Oral Retention of Zinc from Mouthwashes Containing Zinc Salts and Its Relevance to Dental Plaque Control. Archives of Oral Biology, 29, HERSCHKE, L., ENKELMANN, V., LIEBERWIRTH, I. & WEGNER, G The Role of Hydrogen Bonding in the Crystal Structures of Zinc Phosphate Hydrates. Chemistry-A European Journal, 10, HICKS, J., GARCIA-GODOY, F. & FLAITZ, C Biological Factors in Dental Caries: Role of Saliva and Dental Plaque in the Dynamic Process of Demineralization and Remineralization (Part 1). Journal of Clinical Pediatric Dentistry 28, HIGUCHI, W. I., GRAY, J. A., HEFFERREN, J. J. & PATEL, P. R Mechanisms of Enamel Dissolution in Acid Buffers. Journal of Dental Research, 44, HULME, E. C. & TREVETHICK, M. A Ligand Binding Asssays at Equilibrium: Validation and Interpretation. The British Pharmacological Society, 161, INGRAM, G. S Enamel Crystal Chemistry - Where Do We Go From Here? Journal of Dental Research, 58(B), INGRAM, G. S., BAKER, A. G., BEST, J. S. & MELLORCHRIMES, C. P The Influence of Zinc Citrate in a Fluoride Dentifrice on Rat Caries and Fluoride Content of Molar Enamel Invivo. Journal of Dental Research, 63, INGRAM, G. S., HORAY, C. P. & STEAD, W. J Interaction of Zinc with Dental Mineral. Caries Research, 26, ISAAC, S., BRUDEVOLD, F., SMITH, F. A. & GARDNER, D. E Solubility Rate and Natural Fluoride Content of Surface and Subsurface Enamel. Journal of Dental Research, 37, JOHNSON, N. W., POOLE, D. F. & TYLER, J. E Factors Affecting the Differential Dissolution of Human Enamel in Acid and EDTA. A Scanning Electron Microscope Study. Archives of Oral Biology, 16, Page 205
222 JONGEBLOED, W. L., MOLENAAR, I. & ARENDS, J Orientation-Dependent Etchpit Penetration and Dissolution of Fluoroapatite. Caries Research, 7, JONGEBLOED, W. L., MOLENAAR, I. & ARENDS, J Morphology and Size-Distribution of Sound and Acid-Treated Enamel Crystallites. Calcified Tissue Research, 19, JONGEBLOED, W. L., VAN DEN BERG, P. J. & ARENDS, J The Dissolution of Single Crystals of Hydroxyapatite in Citric and Lactic Acids. Calcified Tissue Research, 15, 1-9. KAY, M. I., YOUNG, R. A. & POSNER, A. S Crystal Structure of Hydroxyapatite. Nature, 204, KNUUTTILA, M., LAPPALAINEN, R. & KONTTURINARHI, V Effect of Zn and Mg on the Formation of Whitlockite in Human Subgingival Calculus. Scandinavian Journal of Dental Research, 88, KOHN, M. J., RAKOVAN, J. F. & HUGHES, J. M Phosphates : Geochemical, Geobiological, and Materials Importance, Washington, D.C., Mineralogical Society of America. KOULOURIDES, T., KELLER, S. E., MANSONHING, L. & LILLEY, V Enhancement of Fluoride Effectiveness by Experimental Cariogenic Priming of Human-Enamel. Caries Research, 14, KUKURA, M., BELL, L. C., POSNER, A. M. & QUIRK, J. P Radioisotope Determination of the Surface Concentrations of Calcium and Phosphorus on Hydroxyapatite in Aqueous Solution. The Journal of Physical Chemistry 76, LAMKIN, M. S. & OPPENHEIM, F. G Structural Features of Salivary Function. Critical Reviews in Oral Biology & Medicine, 4, LARDEN, M. J. & THORSEN, A Fluoride and Enamel Solubility. Scandinavian Journal of Dental Research, 82, LARSEN, M. J An Investigation of the Theoretical Background for the Stability of the Calcium- Phosphate Salts and Their Mutual Conversion in Aqueous-Solutions. Archives of Oral Biology, 31, LARSEN, M. J Ion Products and Solubility of Calcium Phosphates. Royal Dental College. LARSEN, M. J. & JENSEN, S. J Experiments on the Initiation of Calcium-Fluoride Formation with Reference to the Solubility of Dental Enamel and Brushite. Archives of Oral Biology, 39, LARSEN, M. J. & PEARCE, E. I. F Saturation of Human Saliva with Respect to Calcium Salts. Archives of Oral Biology, 48, LARSEN, M. J. & RAVNHOLT, G Dissolution of Various Calcium-Fluoride Preparations in Inorganic Solutions and in Stimulated Human Saliva. Caries Research, 28, LEE, Y. J., ELZINGA, E. J. & REEDER, R. J Sorption Mechanisms of Zinc on Hydroxyapatite: Systematic Uptake Studies and EXAFS Spectroscopy Analysis. Environmental Science & Technology, 39, LEGEROS, R. Z Calcium Phosphates in Oral Biology and Medicine, Basel ; Farmington, CT, Karger. LEGEROS, R. Z Calcium Phosphates in Oral Biology and Medicine, Basel, Karger. LEGEROS, R. Z Formation and Transformation of Calcium Phosphates: Relevance to Vascular Calcification. Zeitschrift Fur Kardiologie, 90 Suppl 3, LEGEROS, R. Z., BLEIWAS, C. B., RETINO, M., ROHANIZADEH, R. & LEGEROS, J. P Zinc Effect on the in vitro Formation of Calcium Phosphates: relevance to Clinical Inhibition of Calculus Formation. American Journal of Dentistry 12, LIEBL, H Secondary Ion Mass Spectrometry and its Use in Depth Profiling. Journal of Vacuum Science & Technology 12, 385. LIPPERT, F Dose-Response Effects of Zinc and Fluoride on Caries Lesion Remineralization. Caries Research, 46, LOVEREN, C. V Toothpastes, Amsterdad, Karger. LOWE, N. R., AUTY, J. R. & ROBINSON, C Changes in Protein of Mineralizing Enamel. Journal of Dental Research, 50, 693. LYNCH, R. J. M Zinc in the Mouth, its Interactions with Dental Enamel and Possible Effects on Caries; A Review of the Literature. International Dental Journal, 61, LYNCH, R. J. M RE: Personal Communication. Page 206
223 LYNCH, R. J. M., CHURCHLEY, D., BUTLER, A., KEARNS, S., THOMAS, G. V., BADROCK, T. C., COOPER, L. & HIGHAM, S. M Effects of Zinc and Fluoride on the Remineralisation of Artificial Carious Lesions under Simulated Plaque Fluid Conditions. Caries Research, 45, LYNCH, R. J. M., MONY, U. & TEN CATE, J. M The Effect of Fluoride at Plaque Fluid Concentrations on Enamel De- and Remineralisation at Low ph. Caries Research, 40, LYNCH, R. J. M., NAVADA, R. & WALIA, R Low-Levels of Fluoride in Plaque and Saliva and Their Effects on the Demineralisation and Remineralisation of Enamel; Role of Fluoride Toothpastes. International Dental Journal, 54, MA, G. B. & LIU, X. Y Hydroxyapatite: Hexagonal or Monoclinic? Crystal Growth & Design, 9, MARGOLIS, H. C. & MORENO, E. C Kinetics of Hydroxyapatite Dissolution in Acetic, Lactic, and Phosphoric Acid Solutions. Calcified Tissue International, 50, MARGOLIS, H. C., MORENO, E. C. & MURPHY, B. J Effect of Low Levels of Fluoride in Solution on Enamel Demineralization in vitro. Journal of Dental Research, 65, MARSH, P. D Dental Plaque as a Microbial Biofilm. Caries Research, 38, MARSHALL, A. F. & LAWLESS, K. R TEM Study of the Central Dark Line in Enamel Crystallites. Journal of Dental Research, 60, MATHEW, M. & TAKAGI, S Structures of Biological Minerals in Dental Research. Journal of Research of the National Institute of Standards and Technology, 106, MAYER, I. & FEATHERSTONE, J. D. B Dissolution Studies of Zn-Containing Carbonated Hydroxyapatites. Journal of Crystal Growth, 219, MCCANN, H. G The Solubility of Fluorapatite and its Relationship to that of Calcium Fluoride. Archives of Oral Biology, 13, MELLBERG, J. R Hard-Tissue Substrates for Evaluation of Cariogenic and Anti-Cariogenic Activity in situ. Journal of Dental Research, 71 Spec No, MITRA, S. B., OXMAN, J. D., FALSAFI, A. & TON, T. T Fluoride Release and Recharge Behavior of a Nano-Filled Resin-Modified Glass Ionomer Compared with that of Other Fluoride Releasing Materials. American Journal of Dentistry, 24, MIYAJI, F., KONO, Y. & SUYAMA, Y Formation and Structure of Zinc-Substituted Calcium Hydroxyapatite. Materials Research Bulletin, 40, MOHAMMED, N. R., LYNCH, R. J. & ANDERSON, P Effects of Fluoride Concentration on Enamel Demineralization Kinetics in vitro. Journal of Dentistry. MORENO, E. C., KRESAK, M. & ZAHRADNI, R. T Fluoridated Hydroxyapatite Solubility and Caries Formation. Nature, 247, MORRIS, R. J. H., DOWSETT, M. G., BEANLAND, R., DOBBIE, A., MYRONOV, M. & LEADLEY, D. R Overcoming Low Ge Ionization and Erosion Rate Variation for Quantitative Ultralow Energy Secondary Ion Mass Spectrometry Depth Profiles of Si1-xGex/Ge Quantum Well Structures. Analytical Chemistry, 84, NEAMEN, D. A Semiconductor Physics and Devices : Basic Principles, Dubuque, IA, McGraw- Hill. NEAMEN, D. A Semiconductor Physics and Devices : Basic Principles, New York, McGraw-Hill. NRIAGU, J. O Solubility Equilibrium Constant of Alpha-Hopeite. Geochimica Et Cosmochimica Acta, 37, ÖZDEMIR, A., SAYAL, A., AKCA, E. & AYDIN, A The Determination of Salivary Zinc Level Following Delivery from Zinc Containing Toothpaste. Turkish Journal of Medical Sciences, 28, ØGAARD, B CaF2 formation: Cariostatic Properties and Factors of Enhancing the Effect. Caries Research, 35, ØGAARD, B., RØLLA, G. & HELGELAND, K Uptake and Retention of Alkali-Soluble and Alkali- Insoluble Fluoride in Sound Enamel in vivo After Mouthrinses with 0.05% or 0.2% NaF. Caries Research, 17, ØGAARD, B., RØLLA, G., RUBEN, J., DIJKMAN, T. & ARENDS, J Microradiographic Study of Demineralization of Shark Enamel in a Human Caries Model. Scandinavian Journal of Dental Research, 96, OKAZAKI, M., SATO, M. & TAKAHASHI, J Space-Cutting Model of Hydroxyapatite. Biomaterials, 16, Page 207
224 OPPERMANN, R. & RÖLLA, G Effect of Some Polyvalent Cations on the Acidogenicity of Dental Plaque in vivo. Caries Research, 14, OPPERMANN, R. U. I. V., RØLLA, G., JOHANSEN, J. A. N. R. & ASSEV, S Thiol groups and reduced acidogenicity of dental plaque in the presence of metal ions in vivo. European Journal of Oral Sciences, 88, ORAMS, H. J., PHAKEY, P. P., RACHINGER, W. A. & ZYBERT, J. J Visualisation of Micropore Structure in Human Dental Enamel. Nature, 252, PAN, H. B. & DARVELL, B. W Effect of Carbonate on Hydroxyapatite Solubility. Crystal Growth & Design, 10, PAWLIG, O., SCHELLENSCHLAGER, V., LUTZ, H. D. & TRETTIN, R Vibrational Analysis of Iron and Zinc Phosphate Conversion Coating Constituents. Spectrochimica Acta Part a-molecular and Biomolecular Spectroscopy, 57, PAWLIG, O. & TRETTIN, R Synthesis and Characterization of Alpha-Hopeite, Zn3(PO4)(2).4H2O. Materials Research Bulletin, 34, PETERSON, P. E., BOURGEOIS, D., OGAWA, H., ESTUPINAN-DAY, S. & NDIAYE, C The Global Burden of Oral Diseases and Risks to Oral Health. Bulletin of the World Health Organization, 83, PHAN, T. N., BUCKNER, T., SHENG, J., BALDECK, J. D. & MARQUIS, R. E Physiological Actions of Zinc Related to Inhibition of Acid and Alkali Production by Oral Streptococci in Suspensions and Biofilms. Oral Microbiololgy and Immunology, 19, PICOZZI, A., FISCHMAN, S., PADER, M. & CANCRO, L Calculus inhibition in humans. Journal of Periodontology, 43, 692. POOLE, D. F. & JOHNSON, N. W The Effects of Different Demineralizing Agents on Human Enamel Surfaces Studied by Scanning Electron Microscopy. Archives of Oral Biology, 12, REPORT, W Trace Elements in Human Nutrition. Report of a WHO Expert Committee. World Health Organization Technical Report Series, 532, REYES-GASGA, J., MARTINEZ-PINEIRO, E. L. & BRES, E. F Crystallographic Structure of Human Tooth Enamel by Electron Microscopy and X-Ray Diffraction: Hexagonal or Monoclinic? Journal of Microscopy, 248, RIPA, L. W A Critique of Topical Fluoride Methods (Dentifrices, Mouthrinses, Operator- Applied, and Self-Applied Gels) in an Era of Decreased Caries and Increased Fluorosis Prevalence. Journal of Public Health Dentistry, 51, RIPA, L. W., LESKE, G. S., TRIOL, C. W. & VOLPE, A. R Clinical Study of the Anticaries Efficacy of Three Fluoride Dentifrices Containing Anticalculus Ingredients: Three-Year (Final) Results. Journal of Clinical Dentistry, 2, ROBINSON, C., KIRKHAM, J. & SHORE, R Dental Enamel : Formation to Destruction, Boca Raton, Fla. ; London, CRC. ROBINSON, C., SHORE, R. C., BROOKES, S. J., STRAFFORD, S., WOOD, S. R. & KIRKHAM, J The Chemistry of Enamel Caries. Critical Reviews in Oral Biology & Medicine, 11, RØLLA, G., ØGAARD, B. & CRUZ RDE, A Topical Application of Fluorides on Teeth. New Concepts of Mechanisms of Interaction. Journal of Clinical Periodontology, 20, RØLLA, G. & SAXEGAARD, E Critical Evaluation of the Composition and Use of Topical Fluorides, with Emphasis on the Role of Calcium Fluoride in Caries Inhibition. Journal of Dental Research 69, ROSE, R. K Competitive Binding of Calcium, Magnesium and Zinc to Streptococcus Sanguis and Purified S-Sanguis Cell Walls. Caries Research, 30, ROSE, R. K., SHELLIS, R. P. & LEE, A. R The Role of Cation Bridging in Microbial Fluoride Binding. Caries Research, 30, RUGG-GUNN, A. J. & MURRAY, J. J An Updated Review of the Effectiveness of Artificial Water Fluoridation Throughout the World. Journal of Dental Research, 60, SANDSTEAD, H. H Understanding Zinc: Recent Observations and Interpretations. Journal of Laboratory and Clinical Medicine, 124, SAXEGAARD, E. & RØLLA, G Fluoride Acquisition on and in Human Enamel During Topical Application in vitro. Scandinavian Journal of Dental Research, 96, SAXTON, C., HARRAP, G. & LLOYD, A The effect of dentifrices containing zinc citrate on plaque growth and oral zinc levels. Journal of Clinical Periodontology, 13, Page 208
225 SCHROEDER, H. A., NASON, A. P., TIPTON, I. H. & BALASSA, J. J Essential Trace Metals in Man: Zinc in Relation to Environmental Cadmium. Journal of Chronic Disease, 20, SCOTT, D. B., SIMMELIN, J. W. & NYGAARD, V Structural Aspects of Dental-Caries. Journal of Dental Research, 53, SEIBERT, J. A X-Ray Imaging Physics for Nuclear Medicine Technologists. Part 1: Basic principles of X-Ray Production. Journal of Nuclear Medicine Technology, 32, SEIBERT, J. A. & BOONE, J. M X-Ray Imaging Physics for Nuclear Medicine Technologists. Part 2: X-Ray Interactions and Image Formation. Journal of Nuclear Medicine Technology, 33, SHAH, S., KOSORIC, J., HECTOR, M. P. & ANDERSON, P An in vitro Scanning Microradiography Study of the Reduction in Hydroxyapatite Demineralization Rate by Statherin-Like Peptides as a Function of Increasing N-Terminal Length. European Journal of Oral Sciences, 119, SHEIHAM, A Oral Health, General Health and Quality of Life. Bulletin of the World Health Organization, 83, SHELLIS, R. P. & DIBDIN, G Development, Function and Evolution of Teeth. SHELLIS, R. P. & WILSON, R. M Apparent Solubility Distributions of Hydroxyapatite and Enamel Apatite. Journal of Colloid and Interface Science, 278, SHEPHERD, D. & BEST, S. M Production of Zinc Substituted Hydroxyapatite using Various Precipitation Routes. Biomedical Materials, 8. SILVERSTONE, L. M The Surface Zone in Caries and in Caries-Like Lesions Produced in vitro. British Dental Journal, 125, SIMMELINK, J. W., NYGAARD, V. K. & SCOTT, D. B Theory for the Sequence of Human and Rat Enamel Dissolution by Acid and by EDTA: a Correlated Scanning and Transmission Electron Microscope Study. Archives of Oral Biology, 19, SINGH, J Semiconductor Devices : An Introduction, New York ; London, McGraw-Hill. SINGH, J Semiconductor Devices : Basic Principles, New York, John Wiley. SINGH, J Semiconductor Devices : Basic Principles, New York ; Chichester, Wiley. SKJÖRLAND, K., GJERMO, P. & RÖLLA, G Effect of some polyvalent cations on plaque formation in vivo. European Journal of Oral Sciences, 86, STEPHEN, K. W., BURCHELL, C. K., HUNTINGTON, E., BAKER, A. G., RUSSELL, J. I. & CREANOR, S. L in vivo Anticalculus Effect of a Dentifrice Containing 0.5% Zinc Citrate Trihydrate. Caries Research, 21, STEPHEN, K. W., CREANOR, S. L., RUSSELL, J. I., BURCHELL, C. K., HUNTINGTON, E. & DOWNIE, C. F A 3-Year Oral Health Dose-Response Study of Sodium Monofluorophosphate Dentifrices with and without Zinc Citrate: Anti-Caries Results. Community Dentistry and Oral Epidemiology 16, TAKAGI, S., LIAO, H. & CHOW, L. C Effect of Tooth-Bound Fluoride on Enamel Demineralization/Remineralization in vitro. Caries Research, 34, TAKUMA, S Demineralization and Remineralization of Tooth Substance - an Ultrastructural Basis for Caries Prevention. Journal of Dental Research, 59, TANG, R. K., HASS, M., WU, W. J., GULDE, S. & NANCOLLAS, G. H. 2003a. Constant Composition Dissolution of Mixed Phases II. Selective Dissolution of Calcium Phosphates. Journal of Colloid and Interface Science, 260, TANG, R. K., HENNEMAN, Z. J. & NANCOLLAS, G. H. 2003b. Constant Composition Kinetics Study of Carbonated Apatite Dissolution. Journal of Crystal Growth, 249, TANG, R. K., NANCOLLAS, G. H. & ORME, C. A Mechanism of Dissolution of Sparingly Soluble Electrolytes. Journal of the American Chemical Society, 123, TANG, R. K., ORME, C. A. & NANCOLLAS, G. H. 2003c. A New Understanding of Demineralization: The Dynamics of Brushite Dissolution. Journal of Physical Chemistry B, 107, TANG, R. K., ORME, C. A. & NANCOLLAS, G. H. 2004a. Dissolution of Crystallites: Surface Energetic Control and Size Effects. ChemPhysChem, 5, TANG, R. K., WANG, L. J. & NANCOLLAS, G Nano Demineralization Kinetics of Dental Enamel. Abstracts of Papers of the American Chemical Society, 229, U883-U883. TANG, R. K., WANG, L. J. & NANCOLLAS, G. H. 2004b. Size-Effects in the Dissolution of Hydroxyapatite: An Understanding of Biological Demineralization. Journal of Materials Chemistry, 14, Page 209
226 TANG, R. K., WANG, L. J., ORME, C. A., BONSTEIN, T., BUSH, P. J. & NANCOLLAS, G. H. 2004c. Dissolution at the Nanoscale: Self-Preservation of Biominerals. Angewandte Chemie- International Edition, 43, TANG, Y. Z., CHAPPELL, H. F., DOVE, M. T., REEDER, R. J. & LEE, Y. J Zinc Incorporation into Hydroxylapatite. Biomaterials, 30, TANWALKER, R. L. B. & GILBERT, R. J Oral Delivery of Zinc from Slurries and Separated Supernatant Fractions of Dentifrices. Journal of Dental Research, 68, TATEVOSSIAN, A Distribution and kinetics of fluoride ions in the free aqueous and residual phases of human dental plaque. Archives of Oral Biology, 23, TAVSS, E. A., BONTA, C. Y., JOZIAK, M. T., FISHER, S. W. & CAMPBELL, S. K High-Potency Sodium Fluoride: A Literature Review. Compendium of Continuing Education in Dentistry 18, TEN CATE, J. M The Caries Preventive Effect of a Fluoride Dentifrice Containing Triclosan and Zinc Citrate, A Compilation of in vitro and in situ Studies. International Dental Journal, 43, TEN CATE, J. M Review on Fluoride, with Special Emphasis on Calcium Fluoride Mechanisms in Caries Prevention. European Journal of Oral Sciences, 105, TEN CATE, J. M Current Concepts on the Theories of the Mechanism of Action of Fluoride. Acta Odontologica Scandinavica, 57, TEN CATE, J. M. & DUIJSTERS, P. P. E Influence of Fluoride in Solution on Tooth Demineralization: 2. Microradiographic Data. Caries Research, 17, TEN CATE, J. M. & FEATHERSTONE, J. D. B Mechanistic Aspects of the Interactions between Fluoride and Dental Enamel. Critical Reviews in Oral Biology and Medicine, 2, TEN CATE, J. M. & VANDUINEN, R. N. B Hypermineralization of Dentinal Lesions Adjacent to Glass-Ionomer Cement Restorations. Journal of Dental Research, 74, THOMAS, B Manual of Dietetic Practice. Community Health Studies, 12, TRUMBO, P., YATES, A. A., SCHLICKER, S. & POOS, M Dietary Reference Intakes: Vitamin A, Vitamin K, Arsenic, Boron, Chromium, Copper, Iodine, Iron, Manganese, Molybdenum, Nickel, Silicon, Vanadium, and Zinc. Journal of the American Dietetic Association, 101, VALSAMI-JONES, E Phosphorus in Environmental Technology: Principles and Applications., IWA Publishing. VAN DER LUGT, W., KNOTTNERUS, D. I. & YOUNG, R. A NMR Determination of Fluorine Position in Mineral Hydroxyapatite. Caries Research, 4, VOEGEL, J. C. & FRANK, R. M Stages in the Dissolution of Human Enamel Crystals in Dental Caries. Calcified Tissue Research, 24, VOGEL, G. L Oral Fluoride Reservoirs and the Prevention of Dental Caries. Monographs in Oral Science, 22, VOGEL, G. L., MAO, Y., CHOW, L. C. & PROSKIN, H. M. 2000a. Fluoride in Plaque Fluid, Plaque, and Saliva Measured for 2 Hours After a Sodium Fluoride Monofluorophosphate Rinse. Caries Research, 34, VOGEL, G. L., TENUTA, L. M., SCHUMACHER, G. E. & CHOW, L. C A Calcium Prerinse Required to Form Calcium Fluoride in Plaque from a Sodium Fluoride Rinse. Caries Research, 48, VOGEL, G. L., TENUTA, L. M. A., SCHUMACHER, G. E. & CHOW, L. C No Calcium-Fluoride-Like Deposits Detected in Plaque Shortly after a Sodium Fluoride Mouthrinse. Caries Research, 44, VOGEL, G. L., ZHANG, Z., CHOW, L. C., CAREY, C. M., SCHUMACHER, G. E. & BANTING, D. W. 2000b. Effect of in vitro Acidification on Plaque Fluid Composition with and without A NaF or A Controlled-Release Fluoride Rinse. Journal of Dental Research, 79, WANG, L. J. & NANCOLLAS, G. H Calcium Orthophosphates: Crystallization and Dissolution. Chemical Reviews, 108, WANG, L. J., TANG, R. K., BONSTEIN, T., ORME, C. A., BUSH, P. J. & NANCOLLAS, G. H A New Model for Nanoscale Enamel Dissolution. Journal of Physical Chemistry B, 109, WATANABE, M., ASATSUMA, M., IKUI, A., IKEDA, M., YAMADA, Y., NOMURA, S. & IGARASHI, A Measurements of several metallic elements and matrix metalloproteinases (MMPs) in saliva from patients with taste disorder. Chemical Senses, 30, 121. Page 210
227 WATSON, P. S., PONTEFRACT, H. A., DEVINE, D. A., SHORE, R. C., NATTRESS, B. R., KIRKHAM, J. & ROBINSON, C Penetration of Fluoride into Natural Plaque Biofilms. Journal of Dental Research, 84, WEATHERELL, J., HALLSWORTH, A. & ROBINSON, C The effect of tooth wear on the distribution of fluoride in the enamel surface of human teeth. Archives of Oral Biology, 18, , IN5. WEATHERELL, J. A., ROBINSON, C. & HALLSWORTH, A. S Changes in the fluoride concentration of the labial enamel surface with age. Caries Research, 6, WEATHERELL, J. A., WEIDMANN, S. M. & EYRE, D. R Histological Appearance and Chemical Composition of Enamel Proteins from Mature Human Molars. Caries Research, 2, WEIDMANN, S. M., WEATHERELL, J. A. & HAMM, S. M Variations of Enamel Density in Sections of Human Teeth. Archives of Oral Biology, 12, WHITE, D. J., BOWMAN, W. D., FALLER, R. V., MOBLEY, M. J., WOLFGANG, R. A. & YESINOWSKI, J. P F MAS-NMR and Solution Chemical Characterization of the Reactions of Fluoride with Hydroxyapatite and Powdered Enamel. Acta Odontologica Scandinavica, 46, WHITE, D. J., NELSON, D. G. & FALLER, R. V Mode of Action of Fluoride: Application of New Techniques and Test Methods to the Examination of the Mechanism of Action of Topical Fluoride. Advances in Dental Research, 8, WHITE, W. & NANCOLLAS, G. H Quantitative Study of Enamel Dissolution under Conditions of Controlled Hydrodynamics. Journal of Dental Research, 56, WILLIAMS, P Secondary Ion Mass Spectrometry. Annual Review of Materials Science, 15, WILLIAMS, R. A. D. & ELLIOTT, J. C Chemistry of the Calcium Phosphates. In: ELLIOTT, J. C. (ed.) Chemistry of the Calcium Phosphates. Edinburgh London and New York: Churchill. WU, W. & NANCOLLAS, G. H The Dissolution and Growth of Sparingly Soluble Inorganic Salts: A Kinetics and Surface Energy Approach. Pure and Applied Chemistry, 70, XU, Y., SCHWARTZ, F. W. & TRAINA, S. J Sorption of Zn2+ and Cd2+ on Hydroxyapatite Surfaces. Environmental Science & Technology, 28, YAMAGUCHI, M., OISHI, H. & SUKETA, Y Stimulatory Effect of Zinc on Bone-Formation in Tissue-Culture. Biochemical Pharmacology, 36, YAMAGUCHI, M. & YAMAGUCHI, R Action of Zinc on Bone Metabolism in Rats. Increases in Alkaline Phosphatase Activity and DNA Content. Biochemical Pharmacology, 35, YAMAZAKI, H., LITMAN, A. & MARGOLIS, H. C Effect of Fluoride on Artificial Caries Lesion Progression and Repair in Human Enamel: Regulation of Mineral Deposition and Dissolution Under in vivo-like Conditions. Archives of Oral Biology, 52, YANAGISAWA, T. & MIAKE, Y High-Resolution Electron Microscopy of Enamel-Crystal Demineralization and Remineralization in Carious Lesions. Journal of Electron Microscopy, 52, YESINOWSKI, J. P. & MOBLEY, M. J F-19 MAS-NMR of Fluoridated Hydroxyapatite Surfaces. Journal of the American Chemical Society, 105, YOUNG, A., JONSKI, G. & RØLLA, G Inhibition of Orally Produced Volatile Sulfur Compounds by Zinc, Chlorhexidine or Cetylpyridinium Chloride - Effect of Concentration. European Journal of Oral Sciences, 111, YOUNG, A., JONSKI, G., RØLLA, G. & WÅLER, S Effects of metal salts on the oral production of volatile sulfur containing compounds (VSC). Journal of Clinical Periodontology, 28, ZERO, D. T In Situ Caries Models. Advances in Dental Research, 9, ; discussion ZERO, D. T., KELLY, S. A., A.T., H., MARTINEZ-MIER, E. A., BOSMA, M. L., NEWBY, E. E. & CREEETH, J. E. Year. in situ Remineralization Potential of NaF and MFP Retained Post-Toothbrushing In: IADR 92nd General Session, 2014 Cape Town, South Africa. Journal of Dental Research. ZERO, D. T., RAUBERTAS, R. F., FU, J., PEDERSEN, A. M., HAYES, A. L. & FEATHERSTONE, J. D. B Fluoride Concentrations in Plaque, Whole Saliva, and Ductal Saliva after Application of Home-Use Topical Fluorides. Journal of Dental Research, 71, Page 211
228 Appendix A k SMR DATA FOR ZINC STUDY Page 212
229 ppm [Zn 2+ ] Mineral mass per unit area (g/cm 2 ) y = 5.52E E-04x R 2 = 9.34E Time (h) A.1: SMR raw data plot showing the mineral mass per unit area plotted against time ( 40 h) during exposure to acid ([Zn 2+ ] = 0 ppm) at a single scan position on a sample ppm [Zn 2+ ] Mineral mass per unit area (g/cm 2 ) y = 4.46E E-04x R 2 = 9.32E Time (h) A.2: SMR raw data plot showing the mineral mass per unit area plotted against time ( 40 h) during exposure to acid ([Zn 2+ ] = 0.4 ppm) at a single scan position on a sample. Page 213
230 ppm [Zn 2+ ] Mineral mass per unit area (g/cm 2 ) y = 4.47E E-04x R 2 = 9.58E Time (h) A.3: SMR raw data plot showing the mineral mass per unit area plotted against time ( 40 h) during exposure to acid ([Zn 2+ ] = 1.8 ppm) at a single scan position on a sample ppm [Zn 2+ ] Mineral mass per unit area (g/cm 2 ) y = 3.94E E-04 R 2 = 9.29E Time (h) A.4: SMR raw data plot showing the mineral mass per unit area plotted against time ( 40 h) during exposure to acid ([Zn 2+ ] = 35.6 ppm) at a single scan position on a sample. Page 214
231 ppm [Zn 2+ ] Mineral mass per unit area (g/cm 2 ) y = 4.46E E-04x R 2 = 9.30E Time (h) A.5: SMR raw data plot showing the mineral mass per unit area plotted against time ( 40 h) during exposure to acid ([Zn 2+ ] = ppm) at a single scan position on a sample ppm [Zn 2+ ] Mineral mass per unit area (g/cm 2 ) y = 3.60E E-05x R 2 = 9.04E Time (h) A.6: SMR raw data plot showing the mineral mass per unit area plotted against time ( 40 h) during exposure to acid ([Zn 2+ ] = ppm) at a single scan position on a sample. Page 215
232 ppm [Zn 2+ ] Mineral mass per unit area (g/cm 2 ) y = 3.48E E-06x R 2 = 4.65E Time (h) A.7: SMR raw data plot showing the mineral mass per unit area plotted against time ( 40 h) during exposure to acid ([Zn 2+ ] = ppm) at a single scan position on a sample ppm [Zn 2+ ] Mineral mass per unit area (g/cm 2 ) y = 3.47E E-05x R 2 = 2.90E Time (h) A.8: SMR raw data plot showing the mineral mass per unit area plotted against time ( 40 h) during exposure to acid ([Zn 2+ ] = ppm) at a single scan position on a sample. Page 216
233 Appendix B k ADDITIONAL RESULTS [Ca] [Pi] DS(FAp) DS(Hopeite) Table B1: Calculation of saturation with respect to FAp and hopeite using a range of Ca and Pi concentrations that may be found at the enamel surface. A dedicated computer programme (Larsen, 2001) was used to determine DS FAp and DS Hopeite, with respective solubility product constants of 2.51 x mol 9 l -9 for FAp and 1 x mol 5 l -5 for hopeite (a median was used for a range of reported Ksp values for hopeite i.e. between ). Further, the orthophosphate activity was assumed to be the same in the FAp/Hopeite systems. The reduction in the calcium activity was similar to zinc, as both are divalent cations. Page 217
234 Appendix C k RESEARCH COMMUNICATION Mohammed, NRM; Lynch, RJM; Anderson, P (April 2011) The Chemical and Physical Influences of Zinc Ions on Enamel Dissolution: Preliminary Baseline Study - Effect of F ions on Enamel Demineralisation under Caries - Simulating Conditions using Scanning Microradiography. GSK Science Symposium, Weybridge, UK. * Awarded GSK Poster Prize Award Mohammed, NRM; Lynch, RJM; Anderson, P (September 2011) Influence of F on Enamel Demineralisation Real-Time in vitro Study. BSODR Conference, Sheffield, UK. Mohammed, NRM; Lynch, RJM; Anderson, P (October 2011) Influence of F on Enamel Demineralisation: Real- Time in vitro Scanning Microradiography Study. William Harvey Day, Barts and The London School of Medicine & Dentistry, UK. Mohammed, NRM; Lynch, RJM; Anderson, P (May 2012) Physical and Chemical Influences of Zinc and Fluoride on Surface Enamel Dissolution Kinetics. GSK Science Symposium, Weybridge, UK. Mohammed, NRM; Lynch, RJM; Kent, N; Hill, R; Karpukhina, N; Anderson, P (July 2012) 19 F MAS NMR Characterisation of Fluoridated Apatite Phases Formed on Enamel During in vitro Demineralisation. 59 th Annual OCRA Congress, Cabo Frio, Brazil. *Awarded the Nathan Cochrane Junior Scientist's Award Mohammed, NRM; Lynch, RJM; Anderson, P (June 2012) In vitro Study of Influence of Zn 2+ Enamel Demineralisation Rates. IADR Conference, Iguacu Falls, Brazil. Mohammed, NRM; Lynch, RJM; Anderson, P (September 2012) ICP-OES Study of [F ] Effects on Enamel in vitro Demineralisation. PER/IADR Congress, Helsinki, Finland. *Awarded GSK-Mintig Prize Award Page 218
235 Mohammed, NRM; Lynch, RJM; Anderson, P (October 2012) 19 F MAS-NMR Study of the Effect of Fluoride and Strontium on Demineralisation of Enamel in vitro. 25 th Indian Society for Dental Research (ISDR) Conference, Chennai, India. Mohammed, NRM; Lynch, RJM; Anderson, P (March 2013) In-vitro Effects of Combined Zn 2+ and F on Enamel Demineralisation Rates. IADR Conference, Seattle, USA. Mohammed, NRM; Lynch, RJM; Anderson, P (May 2013) Physical and Chemical Effects of Zn 2+ on in vitro Enamel Demineralisation. GSK Science Symposium, Weybridge, UK. Mohammed, NRM; Lynch, RJM; Anderson, P (July 2013) Physical and Chemical Influences of Zinc on Surface Enamel Dissolution. 60 th Annual OCRA Congress, Liverpool, UK. Mohammed, NRM; Lynch, RJM; Anderson, P (September 2013) Physical and Chemical Effects of Zinc Ions on Surface Enamel Demineralisation: ulesims Study. BSODR Conference, Bath, UK. Mohammed, NRM; Lynch, RJM; Anderson, P (November 2013) Effects of Zinc on Surface Enamel Demineralisation. Oral Biology Club, King s College London, UK. Mohammed, NRM; Lynch, RJM; Anderson, P (June 2014) Mechanistic Action of Zinc on Enamel Demineralisation in vitro. IADR Conference, Cape Town, South Africa. Conference Contribution (Published Communication) External or Internal Presentation (Unpublished Communication) Page 219
236 Appendix D k RESEARCH PUBLICATIONS Page 220
237
238
239
240
241
242
243
244
245
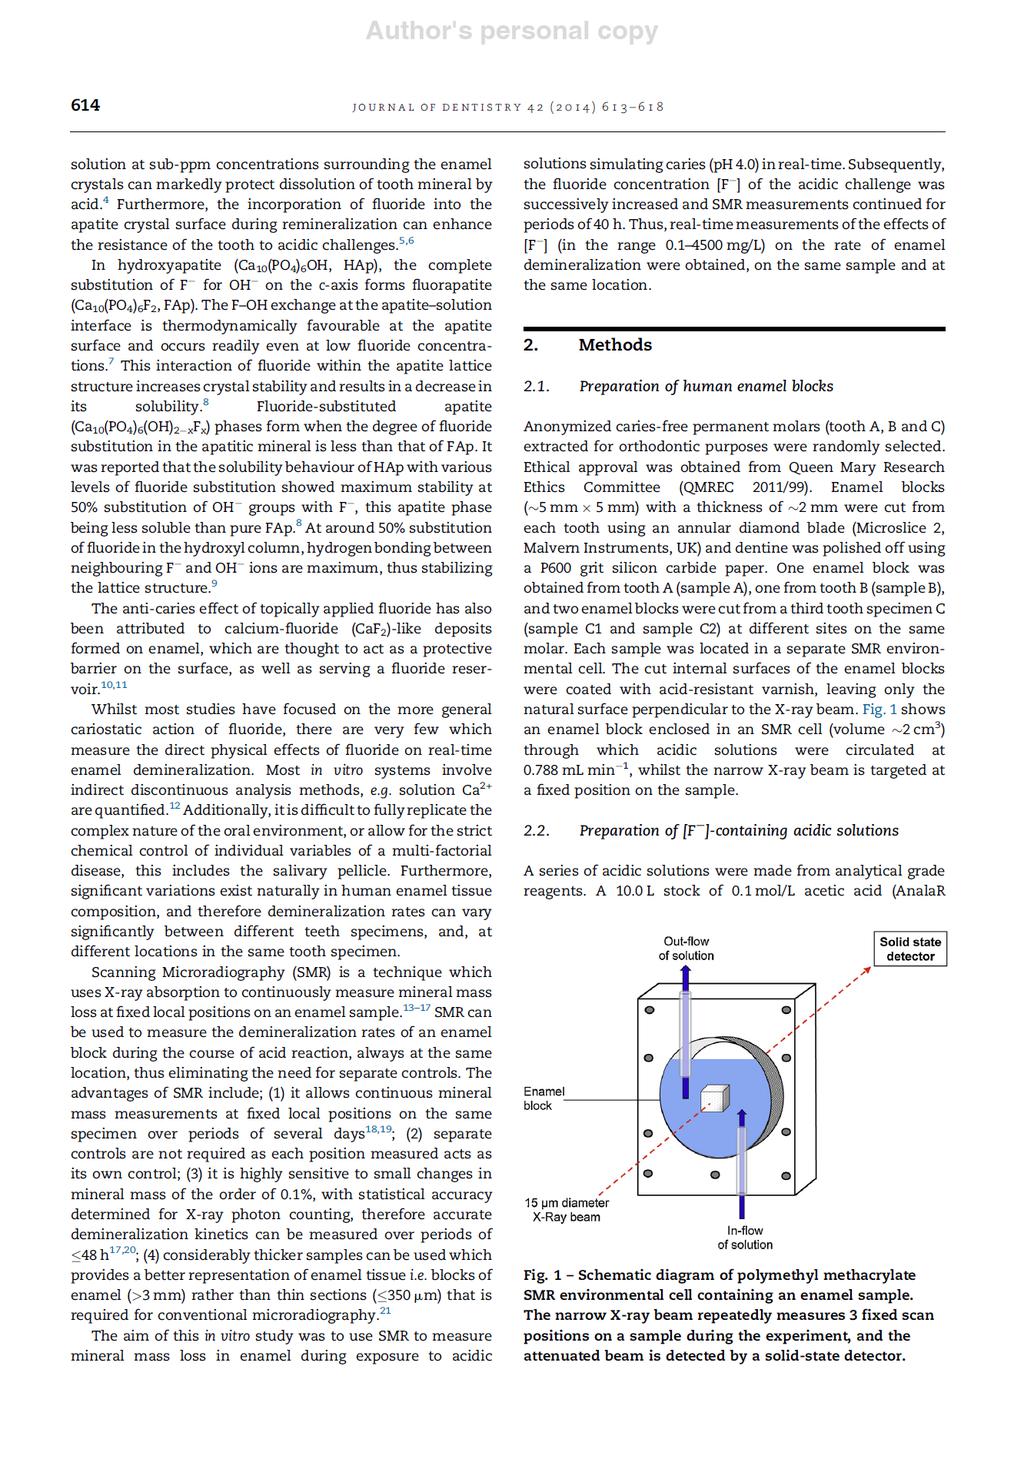
246
247
248
249
250
251
252
253
254
255
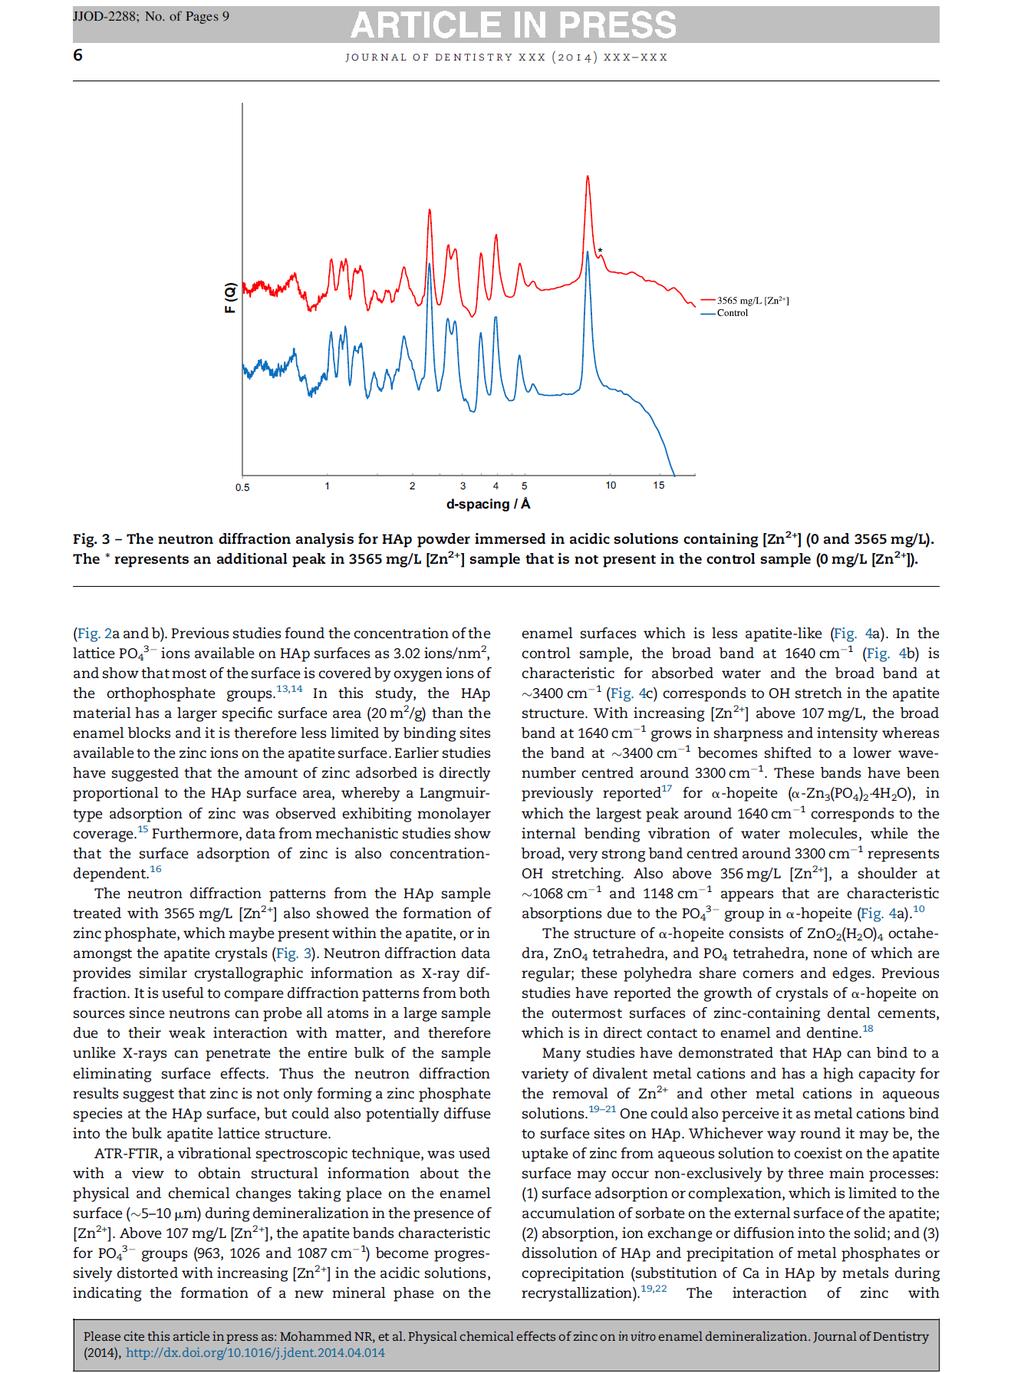
256
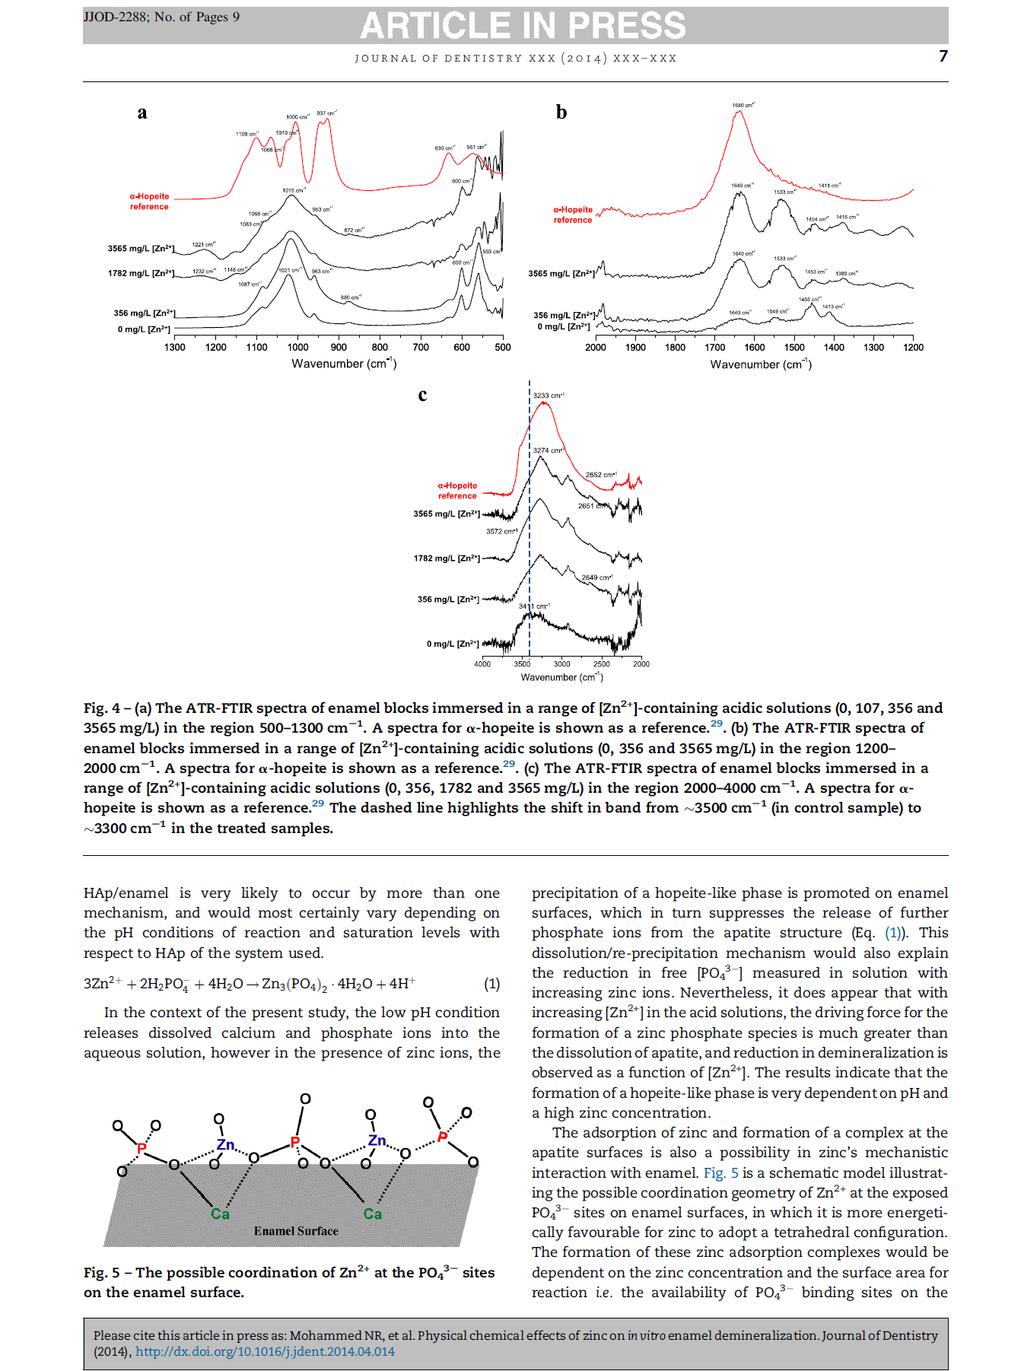
257
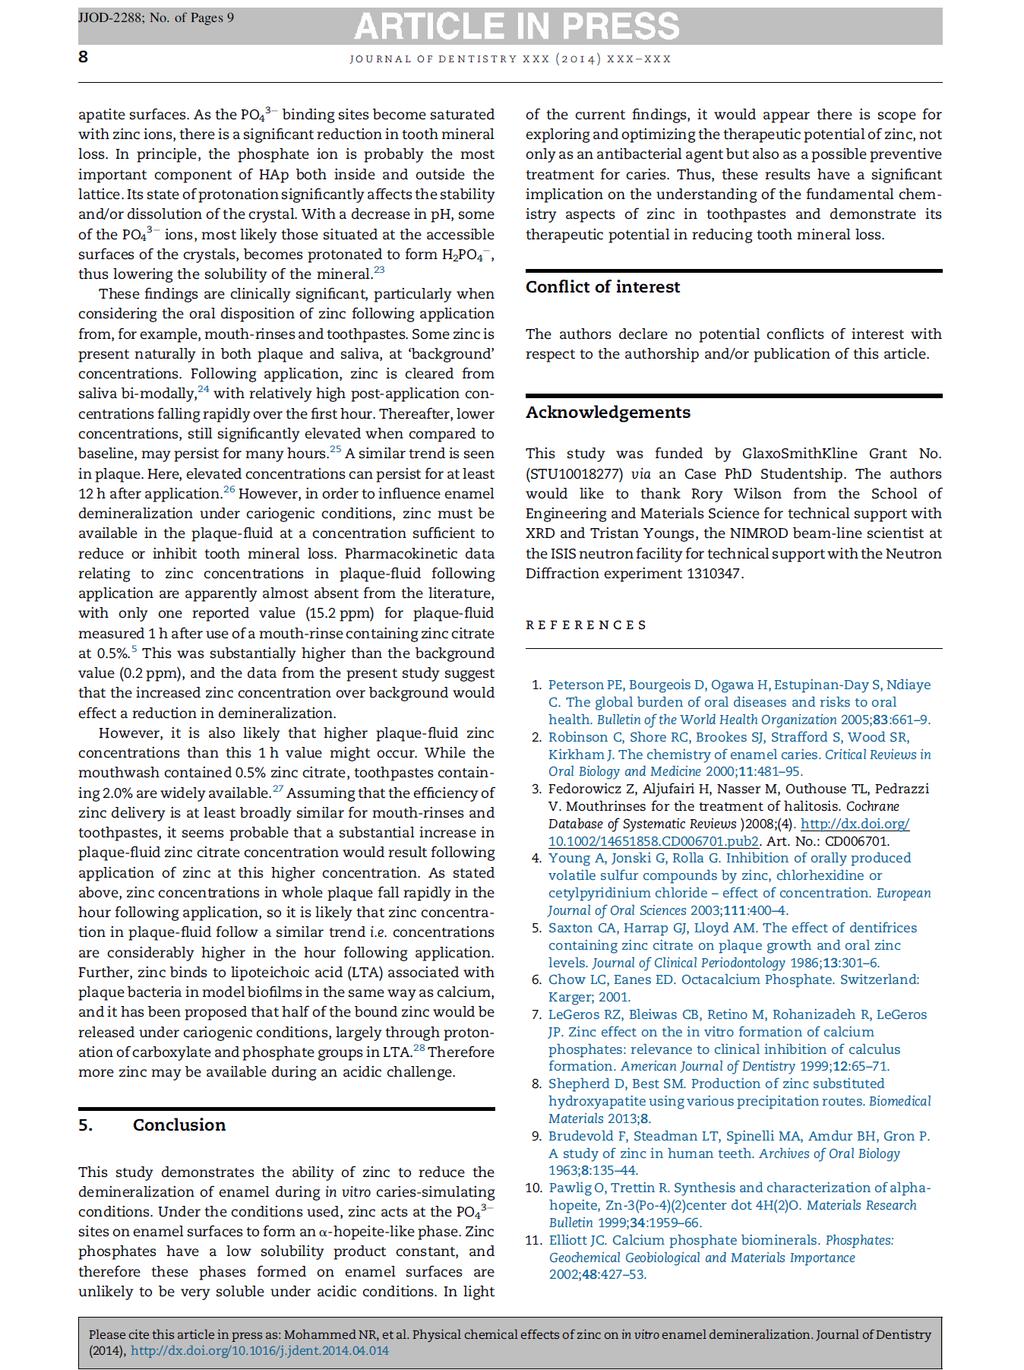
258
259
Bioapatites. BeátaKerémi DMD, PhD Department of Oral Biology
 Bioapatites BeátaKerémi DMD, PhD Department of Oral Biology Mineralized ( hard ) tissues: Bones Teeth Enamel Cementum Dentin Hydroxy(l)-apatite Data correspond to 100 g dry weight. Composition of hard
XPS surface analysis of human tooth samples with EnviroESCA
 Application Note #000396 KeyWords XPS, Human Tissue, Tooth, Measurements, Surface Analysis XPS surface analysis of human tooth samples with EnviroESCA Human teeth from an adult and a baby were studied
CHAPTER 6. BLUE GREEN AND UV EMITTING ZnO NANOPARTICLES SYNTHESIZED THROUGH A NON AQUEOUS ROUTE
 71 CHAPTER 6 BLUE GREEN AND UV EMITTING ZnO NANOPARTICLES SYNTHESIZED THROUGH A NON AQUEOUS ROUTE 6.1 INTRODUCTION Several techniques such as chemical vapour deposition, electrochemical deposition, thermal
CHAPTER 8 SUMMARY AND FUTURE SCOPE
 CHAPTER 8 SUMMARY AND FUTURE SCOPE The potential of room temperature ferromagnetism in many diluted magnetic semiconductors has opened up a new route for realization of spintronic devices. Based on the
CHAPTER 5 CHARACTERIZATION OF ZINC OXIDE NANO- PARTICLES
 88 CHAPTER 5 CHARACTERIZATION OF ZINC OXIDE NANO- PARTICLES 5.1 INTRODUCTION This chapter deals with the characterization of ZnO nano-particles using FTIR, XRD, PSA & SEM. The results analysis and interpretations
SAXS on lipid structures
 Practical Course in Biophysics, Experiment R2b SAXS on lipid structures Summer term 2015 Room: Advisor: X-ray lab at LS Rädler, NU111 Stefan Fischer Tel: +49-(0)89-2180-1459 Email: stefan.f.fischer@physik.lmu.de
Supplementary Fig. 1.
 Supplementary Fig. 1. (a,b,e,f) SEM and (c,d,g,h) TEM images of (a-d) TiO 2 mesocrystals and (e-h) NiO mesocrystals. The scale bars in the panel c, d, g, and h are 500, 2, 50, and 5 nm, respectively. SAED
Is there any clinical evidence?
 Current treatment objectives Anticariogenic capacity of restorative materials in paediatric dentistry: in vitro evidence vs. clinical efficiency Prof. Lisa Papagianoulis Restoration with minimal intervention
Supplementary Figures
 Supplementary Figures Supplementary Figure 1: Predicted structure of the most stable {110} antiphase boundary defect in magnetite (model APB-I). a) The same structure as that shown in Fig. 1b (main text)
Nano-analytical electron microscopy reveals fundamental insights into human cardiovascular tissue calcification
 Nano-analytical electron microscopy reveals fundamental insights into human cardiovascular tissue calcification Supplementary table 1: Aortic valve donor information (n=32). Patient age (yr) 57±11 (range:
Supplementary Figure S1. Statistical measurements on particle size and aspect ratio of
 Supplementary Figure S1. Statistical measurements on particle size and aspect ratio of as-prepared Cd 0.5 Zn 0.5 S nanocrystals. a,b,c, Histograms of the particle size distribution of the three-type of
CHAPTER 3. EFFECT OF PRASEODYMIUM DOPING ON THE STRUCTURAL AND OPTICAL PROPERTIES OF ZnO NANORODS
 46 CHAPTER 3 EFFECT OF PRASEODYMIUM DOPING ON THE STRUCTURAL AND OPTICAL PROPERTIES OF ZnO NANORODS 3.1 INTRODUCTION Zinc oxide, one of the most promising materials, has been demonstrated to be applicable
Evidence of intrinsic ferromagnetism in individual dilute magnetic semiconducting nanostructures O-K. (a) Zn-L Zn-L 2,3
 Zn-L Zn-L 2,3") SUPPLEMENTARY INFORMATION Evidence of intrinsic ferromagnetism in individual dilute magnetic semiconducting nanostructures O-K (a) O-K Fe-L Co-L 2,3 2,3 Zn-L Zn-L 2,3 2,3 (b) Intensity (a. u.) 500 750
SUPPLEMENTARY INFORMATION Evidence of intrinsic ferromagnetism in individual dilute magnetic semiconducting nanostructures O-K (a) O-K Fe-L Co-L 2,3 2,3 Zn-L Zn-L 2,3 2,3 (b) Intensity (a. u.) 500 750
Zinc Oxide. & Springer. Jean Geurts. Claus R Klingshirn. Andreas Waag Axel Hoffmann. Bruno K. Meyer. Towards Novel Applications
 Claus R Klingshirn Bruno K. Meyer Axel Hoffmann Jean Geurts Zinc Oxide From Fundamental Properties Towards Novel Applications With 226 Figures & Springer Contents 1 Introduction 1 I. I History of ZnO Research
Anisotropy of Tensile Strengths of Bovine Dentin Regarding Dentinal Tubule Orientation and Location
 Original paper Dental Materials Journal 21 (1): 32-43, 2002 Anisotropy of Tensile Strengths of Bovine Dentin Regarding Dentinal Tubule Orientation and Location Toshiko INOUE, Hidekazu TAKAHASHI and Fumio
Chapter 5. Investigation of in vitro Dental Erosion by Optical Techniques
 Chapter 5 Investigation of in vitro Dental Erosion by Optical Techniques 5.1 INTRODUCTION 5 Dental erosion is becoming an increasing predicament in dentistry and can be attributed to either exogenous
Polarization and Circular Dichroism (Notes 17)
") Polarization and Circular Dichroism - 2014 (Notes 17) Since is vector, if fix molec. orient., E-field interact (absorb) with molecule differently when change E-orientation (polarization) Transitions can
Polarization and Circular Dichroism - 2014 (Notes 17) Since is vector, if fix molec. orient., E-field interact (absorb) with molecule differently when change E-orientation (polarization) Transitions can
PREPARATION AND CHARACTERIZATION OF METAL OXIDE NANOPOWDERS BY MICROWAVE- ASSISTED COMBUSTION METHOD FOR GAS SENSING DEVICES
 i PREPARATION AND CHARACTERIZATION OF METAL OXIDE NANOPOWDERS BY MICROWAVE- ASSISTED COMBUSTION METHOD FOR GAS SENSING DEVICES THESIS SUBMITTED TO ALAGAPPA UNIVERSITY IN PARTIAL FULFILMENT FOR THE AWARD
Abstract. Keywords: Zinc Oxide, Eu doped ZnO, Dy doped ZnO, Thin film INTERNATIONAL JOURNAL OF INFORMATION AND COMPUTING SCIENCE ISSN NO:
 Synthesis and Structural study of Rare Earth activated ZnO Thin film Pawan Kumar Department of Physics, University Institute of Sciences, Chandigarh University, Gharuan (Mohali), Punjab (India) e-mail-pawan.uis@cumail.in
"The Evaluation Nano Calcium Silicate Cements Performance for Palpation"
 "The Evaluation Nano Calcium Silicate Cements Performance for Palpation" Delaram Amini* Bachelor Student, Department of Medical Islamic Azad University Of Tehran Medical Branch Tehran,Iran Maryam Chenani
Supplementary Figures
 Supplementary Figures Spatial arrangement Variation in the morphology of central NCs (shape x size) x Variation in the morphology of satellite NCs (shape x size) x Variations in the spatial arrangement
CHAPTER 4 EFFECT OF OXALIC ACID ON THE OPTICAL, THERMAL, DIELECTRIC AND MECHANICAL BEHAVIOUR OF ADP CRYSTALS
 67 CHAPTER 4 EFFECT OF OXALIC ACID ON THE OPTICAL, THERMAL, DIELECTRIC AND MECHANICAL BEHAVIOUR OF ADP CRYSTALS 4.1 INTRODUCTION Oxalic acid is a hydrogen-bonded material. It is the only possible compound
Reagent-Free Electrophoretic Synthesis of Few-Atom- Thick Metal Oxide Nanosheets
 Supporting Information Reagent-Free Electrophoretic Synthesis of Few-Atom- Thick Metal Oxide Nanosheets Chengyi Hou,*,, Minwei Zhang, Lili Zhang, Yingying Tang, Hongzhi Wang, and Qijin Chi*, State Key
Influence of Lead Substitution in Zinc Oxide Thin Films
 Chemical Science Transactions DOI:10.7598/cst2013.33 ISSN/E-ISSN: 2278-3458/2278-3318 RESEARCH ARTICLE Influence of Lead Substitution in Zinc Oxide Thin Films I. INIGO VALAN a, S. RAJA b, K. RAMAMURTHI
DENTIN It a hard vital tissue, surrounds the pulp & underlies the enamel on the crown & the cementum on the roots of the teeth.
 Lec. 7 Dr. Ali H.Murad DENTIN It a hard vital tissue, surrounds the pulp & underlies the enamel on the crown & the cementum on the roots of the teeth. Physical properties: 1-Dentin is pale yellow in color,
International Journal of ChemTech Research CODEN (USA): IJCRGG ISSN: Vol.8, No.6, pp , 2015
: IJCRGG ISSN: Vol.8, No.6, pp , 2015") International Journal of ChemTech Research CODEN (USA): IJCRGG ISSN: 0974-4290 Vol.8, No.6, pp 297-302, 2015 Effect on Annealing Temperature on Zno Nanoparticles Sugapriya S* 1, Lakshmi S 1, Senthilkumaran
International Journal of ChemTech Research CODEN (USA): IJCRGG ISSN: 0974-4290 Vol.8, No.6, pp 297-302, 2015 Effect on Annealing Temperature on Zno Nanoparticles Sugapriya S* 1, Lakshmi S 1, Senthilkumaran
A low magnification SEM image of the fabricated 2 2 ZnO based triode array is
 Chapter 6 Characteristics of Field Emission Triode 6.1 Planar Gated Field Emission Triode 6.1.1 Structural and Electrical Analysis A low magnification SEM image of the fabricated 2 2 ZnO based triode array
Dentin Formation(Dentinogenesis)
") Lecture four Dr. Wajnaa Oral Histology Dentin Formation(Dentinogenesis) Dentinogenesis begins at the cusp tips after the odontoblasts have differentiated and begin collagen production. Dentinogenesis growth
Lecture four Dr. Wajnaa Oral Histology Dentin Formation(Dentinogenesis) Dentinogenesis begins at the cusp tips after the odontoblasts have differentiated and begin collagen production. Dentinogenesis growth
CHAPTER 8 SYNTHESIS, STRUCTURAL, OPTICAL AND ELECTRICAL PROPERTIES OF. TRANSITION METAL (TM) DOPED ZnO NANORODS. (TM=Mn, Co, Ni AND Fe).
 DOPED ZnO NANORODS. (TM=Mn, Co, Ni AND Fe).") 190 CHAPTER 8 SYNTHESIS, STRUCTURAL, OPTICAL AND ELECTRICAL PROPERTIES OF TRANSITION METAL (TM) DOPED ZnO NANORODS (TM=Mn, Co, Ni AND Fe). 8.1 Introduction The important and fundamental work for developing
190 CHAPTER 8 SYNTHESIS, STRUCTURAL, OPTICAL AND ELECTRICAL PROPERTIES OF TRANSITION METAL (TM) DOPED ZnO NANORODS (TM=Mn, Co, Ni AND Fe). 8.1 Introduction The important and fundamental work for developing
LECTURE 13. Dr. Teresa D. Golden University of North Texas Department of Chemistry
 LECTURE 13 Dr. Teresa D. Golden University of North Texas Department of Chemistry Goniometer circle - centered at the sample, with the x-ray source and detector on the circumference of the circle. Focusing
Supplementary Figure 1. Sample preparation schematic. First (Stage I), square islands of MoO 3 are prepared by either photolithography followed by
, square islands of MoO 3 are prepared by either photolithography followed by") Supplementary Figure 1. Sample preparation schematic. First (Stage I), square islands of MoO 3 are prepared by either photolithography followed by thermal evaporation and liftoff or by a process where
Supplementary Figure 1. Sample preparation schematic. First (Stage I), square islands of MoO 3 are prepared by either photolithography followed by thermal evaporation and liftoff or by a process where
ZnO Thin Films Generated by Ex-Situ Thermal Oxidation of Metallic Zn for Photovoltaic Applications
 Macalester Journal of Physics and Astronomy Volume 4 Issue 1 Spring 2016 Article 12 May 2016 ZnO Thin Films Generated by Ex-Situ Thermal Oxidation of Metallic Zn for Photovoltaic Applications Kovas Zygas
Continually Fluoride Releasing Aesthetic Dental Restorative Material
 Continually Fluoride Releasing Aesthetic Dental Restorative Material Research is our best product Image provided by Dr. Sushil Koirala BEAUTIFIL II More than just filling BEAUTIFIL II stands out for its
Fe-doped ZnO synthesized by parallel flow precipitation process for improving photocatalytic activity
 IOP Conference Series: Materials Science and Engineering PAPER OPEN ACCESS Fe-doped ZnO synthesized by parallel flow precipitation process for improving photocatalytic activity To cite this article: Q
H 2 O. Liquid, solid, and vapor coexist in the same environment
 Water H 2 O Liquid, solid, and vapor coexist in the same environment WATER MOLECULES FORM HYDROGEN BONDS Water is a fundamental requirement for life, so it is important to understand the structural and
DEVELOPMENT OF TERNARY PHASE DIAGRAM: OPTICAL AND MECHANICAL CHARACTERIZATION OF WATER/TAPIOCA STARCH/TRITON X-100 LIQUID CRYSTAL
 DEVELOPMENT OF TERNARY PHASE DIAGRAM: OPTICAL AND MECHANICAL CHARACTERIZATION OF WATER/TAPIOCA STARCH/TRITON X-100 LIQUID CRYSTAL By Muhd Fazreel B Muhammad Rosli A thesis submitted in partial fulfillment
Chapter CHAPTER 7. ELECTRICAL PROPERTIES OF ZnO DOPED MAGESIUM ALUMIUM SILICATE GLASS-CERAMICS
 Chapter 7 102 CHAPTER 7 ELECTRICAL PROPERTIES OF ZnO DOPED MAGESIUM ALUMIUM SILICATE GLASS-CERAMICS Chapter 7 103 CHAPTER 7 ELECTRICAL PROPERTIES OF ZnO DOPED MAGNESIUM ALUMINUM SILICATE GLASS-CERAMICS
The main biological functions of the many varied types of lipids include: energy storage protection insulation regulation of physiological processes
 Big Idea In the biological sciences, a dehydration synthesis (condensation reaction) is typically defined as a chemical reaction that involves the loss of water from the reacting molecules. This reaction
Frictional Behavior and Surface Failure of Human Enamel
 Frictional Behavior and Surface Failure of Human Enamel J. M. POWERS, R. G. CRAIG, and K. C. LUDEMA School of Dentistry, University of Michigan, Ann Arbor, Michigan 48104, USA, and College of Engineering,
Hydrogen-Sensing Characteristics of Palladium-Doped Zinc-Oxide Nanostructures
 Hydrogen-Sensing Characteristics of Palladium-Doped Zinc-Oxide Nanostructures Undergraduate Researcher Saranya Sathananthan University of Tennessee, Knoxville Faculty Mentor Vinayak P. Dravid Department
Chapter 12: Mass Spectrometry: molecular weight of the sample
 Structure Determination: hapter 12: Mass Spectrometry- molecular weight of the sample; formula hapter 12: Infrared Spectroscopy- indicated which functional groups are present hapter 13: Nuclear Magnetic
Structural, Optical & Surface Morphology of Zinc Oxide (ZnO) Nanorods in Molten Solution
 Nanorods in Molten Solution") Journal of Materials Science and Engineering B 6 (3-4) (2016) 68-73 doi: 10.17265/2161-6221/2016.3-4.002 D DAVID PUBLISHING Structural, Optical & Surface Morphology of Zinc Oxide (ZnO) Nanorods in Molten
Journal of Materials Science and Engineering B 6 (3-4) (2016) 68-73 doi: 10.17265/2161-6221/2016.3-4.002 D DAVID PUBLISHING Structural, Optical & Surface Morphology of Zinc Oxide (ZnO) Nanorods in Molten
Chemical Surface Transformation 1
 Chemical Surface Transformation 1 Chemical reactions at Si H surfaces (inorganic and organic) can generate very thin films (sub nm thickness up to µm): inorganic layer formation by: thermal conversion:
The Histology of Dentin
 The Histology of Dentin Pauline Hayes Garrett, D.D.S. Department of Endodontics, Prosthodontics, and Operative Dentistry University of Maryland, Baltimore This material was taken from: Essentials of Oral
Supplementary Figures
 Supplementary Figures Supplementary Fig. 1. Current density profiles for backside-plating configuration cells and the cycle stability curve with and without carbon coating. Current density profiles of
Noninvasive Blood Glucose Analysis using Near Infrared Absorption Spectroscopy. Abstract
 Progress Report No. 2-3, March 31, 1999 The Home Automation and Healthcare Consortium Noninvasive Blood Glucose Analysis using Near Infrared Absorption Spectroscopy Prof. Kamal Youcef-Toumi Principal Investigator
CHAPTER 3. PHOTOCATALYTIC DEGRADATION OF METHYLENE BLUE AND ACID RED 18 DYES BY Bi-Au-ZnO
 CHAPTER 3 PHOTOCATALYTIC DEGRADATION OF METHYLENE BLUE AND ACID RED 18 DYES BY Bi-Au-ZnO In this chapter, characterization of Bi-Au-ZnO and its photocatalytic activity on the degradation of Methylene Blue
Deposition of aluminum-doped zinc oxide films by RF magnetron sputtering and study of their surface characteristics
 Surface and Coatings Technology 174 175 (2003) 187 192 Deposition of aluminum-doped zinc oxide films by RF magnetron sputtering and study of their surface characteristics a b b a a, S.H. Jeong, S. Kho,
Introduction to proteins and protein structure
 Introduction to proteins and protein structure The questions and answers below constitute an introduction to the fundamental principles of protein structure. They are all available at [link]. What are
bio-mof-1 DMASM Wavenumber (cm -1 ) Supplementary Figure S1 FTIR spectra of bio-mof-1, DMASMI, and bio-mof-1 DMASM.
 Supplementary Figure S1 FTIR spectra of bio-mof-1, DMASMI, and bio-mof-1 DMASM.") bio-mof-1 Transmittance bio-mof-1 DMASM DMASMI 2000 1500 1000 500 Wavenumber (cm -1 ) Supplementary Figure S1 FTIR spectra of bio-mof-1, DMASMI, and bio-mof-1 DMASM. Intensity (a.u.) bio-mof-1 DMASM as
bio-mof-1 Transmittance bio-mof-1 DMASM DMASMI 2000 1500 1000 500 Wavenumber (cm -1 ) Supplementary Figure S1 FTIR spectra of bio-mof-1, DMASMI, and bio-mof-1 DMASM. Intensity (a.u.) bio-mof-1 DMASM as
SDS-Assisted Protein Transport Through Solid-State Nanopores
 Supplementary Information for: SDS-Assisted Protein Transport Through Solid-State Nanopores Laura Restrepo-Pérez 1, Shalini John 2, Aleksei Aksimentiev 2 *, Chirlmin Joo 1 *, Cees Dekker 1 * 1 Department
Ultrastructure of Mycoplasmatales Virus laidlawii x
 J. gen. Virol. (1972), I6, 215-22I Printed in Great Britain 2I 5 Ultrastructure of Mycoplasmatales Virus laidlawii x By JUDY BRUCE, R. N. GOURLAY, AND D. J. GARWES R. HULL* Agricultural Research Council,
Structural and luminescent properties of ZnO flower-like microstructures synthesized using the chemical bath deposition method
 Structural and luminescent properties of ZnO flower-like microstructures synthesized using the chemical bath deposition method LF Koao 1, FB Dejene 1* and HC Swart 2 1 Department of Physics, University
List of Figure. Figure 1.1. Selective pathways for the metabolism of arachidonic acid
 List of Figure Figure 1.1. Selective pathways for the metabolism of arachidonic acid Figure 1.2. Arachidonic acid transformation to ω and ω-1 hydroxylase 14 19 reaction mediated by cytochrome P450 enzyme
ZnO nanostructures epitaxially grown on ZnO seeded Si (100) substrates by chemical vapor deposition
 substrates by chemical vapor deposition") ZnO nanostructures epitaxially grown on ZnO seeded Si (100) substrates by chemical vapor deposition Zhuo Chen 1, T. Salagaj 2, C. Jensen 2, K. Strobl 2, Mim Nakarmi 1, and Kai Shum 1, a 1 Physics Department,
ZnO nanostructures epitaxially grown on ZnO seeded Si (100) substrates by chemical vapor deposition Zhuo Chen 1, T. Salagaj 2, C. Jensen 2, K. Strobl 2, Mim Nakarmi 1, and Kai Shum 1, a 1 Physics Department,
TABLE OF CONTENT CHAPTER CONTENT PAGE
 vii TABLE OF CONTENT CHAPTER CONTENT PAGE TITLE PAGE DECLARATION DEDICATION ACKNOWLEDGEMENT ABSTRACT ABSTRAK TABLE OF CONTENT LIST OF TABLES LIST OF FIGURES NOMENCLATURE LIST OF APPENDICES i ii iii iv
DH220 Dental Materials
 DH220 Dental Materials Lecture #5 Prof. Lamanna RDH, MS Restorative Dentistry: Glass Ionomer Bird & Robinson p.740-741 I. Use Liner Base Luting agent Restorative material: Class III, V, & eroded/abraded
Structure and Properties of Cellulose
 Structure and Properties of Cellulose David Wang s Wood Chemistry Class Wood Polysaccharides Biosynthesis Cellulose is synthesized from UDP-D-glucose, the energy content of which is used for the formation
Presented by Sean Day, Stanley Gelin, Kristin O Connor, Chris Sullivan, and Brian Wilson
 Different corrosive effects on hydroxyapatite nanocrystals and amine fluoride-based mouthwashes on dental titanium brackets: a comparative in vitro study Presented by Sean Day, Stanley Gelin, Kristin O
THE STUDY OF DEMINERALIZED AND REMINERALIZED ENAMEL & HYDROXYAPATITE USING NUCLEAR MAGNETIC RESONANCE (NMR)
") Oral Biology Original Article ABSTRACT THE STUDY OF DEMINERALIZED AND REMINERALIZED ENAMEL & HYDROXYAPATITE USING NUCLEAR MAGNETIC RESONANCE (NMR) 1 ADIL DURRANI 2 MUHAMMAD ANWAAR ALAM 3 MUSTAFA QADEER
Oral Biology Original Article ABSTRACT THE STUDY OF DEMINERALIZED AND REMINERALIZED ENAMEL & HYDROXYAPATITE USING NUCLEAR MAGNETIC RESONANCE (NMR) 1 ADIL DURRANI 2 MUHAMMAD ANWAAR ALAM 3 MUSTAFA QADEER
Supporting Information. Phosphatase mediated hydrolysis of linear polyphosphates. Rixiang Huang, Biao Wan, Margot Hultz, Julia M. Diaz, Yuanzhi Tang
 Supporting Information Phosphatase mediated hydrolysis of linear polyphosphates Rixiang Huang, Biao Wan, Margot Hultz, Julia M. Diaz, Yuanzhi Tang Total 1pages 9 figures S1 PolyP_end PolyP_middle PyroP
Discussion CHAPTER - 5
 CHAPTER - 5 Discussion The chapter deals with discussion of the results. The thesis ends with this chapter. The chapter interpretates and discusses the results of the investigation on the physical properties
ANALYSIS OF SYNCHROTRON X-RAY DIFFRACTION PATTERNS FROM FLUOROTIC ENAMEL SAMPLES
 2009 International Nuclear Atlantic Conference - INAC 2009 Rio de Janeiro,RJ, Brazil, September27 to October 2, 2009 ASSOCIAÇÃO BRASILEIRA DE ENERGIA NUCLEAR - ABEN ISBN: 978-85-99141-03-8 ANALYSIS OF
Radiation Detection and Measurement
 Radiation Detection and Measurement Range of charged particles (e.g.,!: µm; ": mm) Range of high energy photons (cm) Two main types of interactions of high energy photons Compton scatter Photoelectric
Tooth hypersensitivity and Dental erosion DR. KÁROLY BARTHA
 Tooth hypersensitivity and Dental erosion DR. KÁROLY BARTHA 2 Why Is Erosion an Issue Now? Changing dietary habits Higher consumption of acidic beverages (colas, sport drinks) Higher incidence of xerostomia
3.1 Background. Preformulation Studies
 Preformulation Studies 3.1 Background Delivery of any drug requires a suitable dosage form to get optimum therapeutic effects. The development of such dosage forms fundamental properties of the drug molecule
Effect of Three Different Remineralizing Agents on Enamel Caries Formation An in vitro Study
 KATHMANDU UNIVERSITY MEDICAL JOURNAL Effect of Three Different Remineralizing Agents on Enamel Caries Formation An in vitro Study Sathe N, 1 Chakradhar Raju RVS, 1 Chandrasekhar V 2 Department of Conservative
Synthesis and Characterization of Mn 2+ Doped Zn 2. Phosphor Films by Combustion CVD Method
 Synthesis and Characterization of Mn 2+ Doped Zn 2 Phosphor Films by Combustion CVD Method Z. T. Kang a, Y. Liu b, B. K. Wagner a, R. Gilstrap a, M. Liu b, and C. J. Summers a a Phosphor Technology Center
Electronic Supplementary Information. High-Yield Bottom-Up Synthesis of 2D Metal Organic Frameworks
 Electronic Supplementary Material (ESI) for Journal of Materials Chemistry A. This journal is The Royal Society of Chemistry 2017 Electronic Supplementary Information High-Yield Bottom-Up Synthesis of
Heparin Sodium ヘパリンナトリウム
 Heparin Sodium ヘパリンナトリウム Add the following next to Description: Identification Dissolve 1 mg each of Heparin Sodium and Heparin Sodium Reference Standard for physicochemical test in 1 ml of water, and
Membrane Structure and Function - 1
 Membrane Structure and Function - 1 The Cell Membrane and Interactions with the Environment Cells interact with their environment in a number of ways. Each cell needs to obtain oxygen and other nutrients
Strongly Fluorescent Quaternary Cu-In-Zn-S Nanocrystals Prepared from Cu 1-x InS 2 Nanocrystals by Partial Cation Exchange
 SUPPORTING INFORMATION FOR: Strongly Fluorescent Quaternary Cu-In-Zn-S Nanocrystals Prepared from Cu 1-x InS 2 Nanocrystals by Partial Cation Exchange Inductively Coupled Plasma and emission analysis In:Cu
Supplementary Information
 Supplementary Information for Chemical Synthesis of Blue-emitting Metallic Zinc Nano-hexagons Nguyen T. Mai, Trinh T. Thuy, Derrick M. Mott and Shinya Maenosono* School of Materials Science, Japan Advanced
Fabrication of Zinc Oxide Thin Films for Acoustic Resonators
 Fabrication of Zinc Oxide Thin Films for Acoustic Resonators Glen R. Kowach Materials Research Department, Bell Labs Murray Hill, NJ USA 550 o C ZnO Pt SiO 2 Si top view cross-section Collaborators film
Supplementary Materials for
 advances.sciencemag.org/cgi/content/full/2/12/e1601838/dc1 Supplementary Materials for General and programmable synthesis of hybrid liposome/metal nanoparticles Jin-Ho Lee, Yonghee Shin, Wooju Lee, Keumrai
CHAPTER 4. CHARACTERIZATION OF ZINC DOPED TIN OXIDE (Zn:SnO 2 ) THIN FILMS
 THIN FILMS") 84 CHAPTER 4 CHARACTERIZATION OF ZINC DOPED TIN OXIDE (Zn:SnO 2 ) THIN FILMS 4.1 INTRODUCTION Tin oxide (SnO 2 ) is one of the most important Transparent Conductive Oxide (TCOs) materials, which finds
84 CHAPTER 4 CHARACTERIZATION OF ZINC DOPED TIN OXIDE (Zn:SnO 2 ) THIN FILMS 4.1 INTRODUCTION Tin oxide (SnO 2 ) is one of the most important Transparent Conductive Oxide (TCOs) materials, which finds
Fluoridens 133 Fluorosilicic acid 136 Fluorosis, see Dental fluorosis Foams 118 acute toxicity 71, 122 clinical efficacy 122 Free saliva 149, 150
 Subject Index Abrasive systems, dentifrices 123 Absorption 23, 24, 38, 78 Accidental poisonings 66, 67, 69, 70, see also Acute toxicity Acid-base status, see also ph metabolism effects 28, 29 toxicity
Detergent solubilised 5 TMD binds pregnanolone at the Q245 neurosteroid potentiation site.
 Supplementary Figure 1 Detergent solubilised 5 TMD binds pregnanolone at the Q245 neurosteroid potentiation site. (a) Gel filtration profiles of purified 5 TMD samples at 100 nm, heated beforehand for
Fundamental & Preventive Curvatures of Teeth and Tooth Development. Lecture Three Chapter 15 Continued; Chapter 6 (parts) Dr. Margaret L.
 Dr. Margaret L.") Fundamental & Preventive Curvatures of Teeth and Tooth Development Lecture Three Chapter 15 Continued; Chapter 6 (parts) Dr. Margaret L. Dennis Proximal contact areas Contact areas are on the mesial and
Fundamental & Preventive Curvatures of Teeth and Tooth Development Lecture Three Chapter 15 Continued; Chapter 6 (parts) Dr. Margaret L. Dennis Proximal contact areas Contact areas are on the mesial and
Chemical Engineering, Xiamen University, Xiamen ,China. 4
 Supporting Information for : One-pot synthesis of superfine core-shell Cu@metal nanowires for highly tenacious transparent LED dimmer Huachun Wang 1, Chenping Wu 1, Youyang Huang 1, Feipeng Sun 1, Na Lin
Exploring Physical And Optical Behavior Of Co:Zno Nanostructures
 Exploring Physical And Optical Behavior Of Co:Zno Nanostructures Durga Prasad Gogoi 1 1 Associate Professor, Dept. of Physics, Namrup college, Dist: Dibrugarh, Assam: 786623, India Abstract- Zinc oxide
THE RIGAKU JOURNAL VOL. 23 / 2006, A1-A10 CONSIDERATIONS REGARDING THE ALIGNMENT OF DIFFRACTOMETERS FOR RESIDUAL STRESS ANALYSIS
 THE RIGAKU JOURNAL VOL. 23 / 2006, A1-A10 CONSIDERATIONS REGARDING THE ALIGNMENT OF DIFFRACTOMETERS FOR RESIDUAL STRESS ANALYSIS THOMAS R. WATKINS, O. BURL CAVIN, CAMDEN R. HUBBARD, BETH MATLOCK, AND ROGER
data reports Bis[S-hexyl 3-(thiophen-2-ylmethylidene)dithiocarbazato-j 2 N 3,S]palladium(II) Structure description
![data reports Bis[S-hexyl 3-(thiophen-2-ylmethylidene)dithiocarbazato-j 2 N 3,S]palladium(II) Structure description](/thumbs/95/123526978.jpg "data reports Bis[S-hexyl 3-(thiophen-2-ylmethylidene)dithiocarbazato-j 2 N 3,S]palladium(II) Structure description") Bis[S-hexyl 3-(thiophen-2-ylmethylidene)dithiocarbazato-j 2 N 3,S]palladium(II) ISSN 2414-3146 K. Begum, a * M. C. Sheikh, b R. Miyatake, c E. Zangrando d and M. S. Begum e Received 15 June 2016 Accepted
Bis[S-hexyl 3-(thiophen-2-ylmethylidene)dithiocarbazato-j 2 N 3,S]palladium(II) ISSN 2414-3146 K. Begum, a * M. C. Sheikh, b R. Miyatake, c E. Zangrando d and M. S. Begum e Received 15 June 2016 Accepted
Supporting Information. Observing Solid-state Formation of Oriented Porous. Functional Oxide Nanowire Heterostructures by in situ
 Supporting Information Observing Solid-state Formation of Oriented Porous Functional Oxide Nanowire Heterostructures by in situ TEM Jo-Hsuan Ho,+, Yi-Hsin Ting,,+, Jui-Yuan Chen,+, Chun-Wei Huang, Tsung-Chun
Zoltán Szabó. Synthesis and characterisation of zinc-oxide thin films and nanostructures for optoelectronical purposes
 PHD theses Synthesis and characterisation of zinc-oxide thin films and nanostructures for optoelectronical purposes Zoltán Szabó Supervison: Dr. János Volk Consultant: Dr. György Hárs HAS Centre for Energy
8 Influence of permeation modulators on the behaviour of a SC lipid model mixture
 8 Influence of permeation modulators on the behaviour of a SC lipid model mixture 8.1 Introduction In the foregoing parts of this thesis, a model membrane system of SC lipids has been developed and characterized.
Syllabus References. Resources. Video: MRI Introduction
 MRI Lesson Outline Syllabus References 9.6.4.2.5 Define precessing and relate the frequency of the precessing to the composition of the nuclei and the strength of the applied external magnetic field 9.6.4.2.6
Can you believe that the ultrasonic waves are used for cleaning purpose???
 Introduction (Ultrasonic Cleaning Unit) Can you believe that the ultrasonic waves are used for cleaning purpose??? Learning Objectives On completion of this chapter you will be able to: 1. Describe the
Structural Properties of ZnO Nanowires Grown by Chemical Vapor Deposition on GaN/sapphire (0001)
") Structural Properties of ZnO Nanowires Grown by Chemical Vapor Deposition on GaN/sapphire (0001) F. C. Tsao 1, P. J. Huang 1, J. Y. Chen 2, C. J. Pan 3, C. J. Tun 4, C. H. Kuo 2, B. J. Pong 5, T. H. Hsueh
Structural Properties of ZnO Nanowires Grown by Chemical Vapor Deposition on GaN/sapphire (0001) F. C. Tsao 1, P. J. Huang 1, J. Y. Chen 2, C. J. Pan 3, C. J. Tun 4, C. H. Kuo 2, B. J. Pong 5, T. H. Hsueh
Rebaudioside a From Multiple Gene Donors Expressed in Yarrowia Lipolytica
 Residue Monograph prepared by the meeting of the Joint FAO/WHO Expert Committee on Food Additives (JECFA), 82 nd meeting 2016 Rebaudioside a From Multiple Gene Donors Expressed in Yarrowia Lipolytica This
Supplementary Figures
 Supplementary Figures Absorption 4 3 2 1 Intensity Energy U(R) relaxation ~~~ ~~~~~~ 2 3 4 1 S S 1 2 3 4 1 Fluoescence 4 3 2 1 Intensity H-aggregation ~~~~ J-aggregation Absorption Emission Vibrational
RBM dental implants by CST Process Technical Release September 2012
 Page 1 of 7 RBM dental implants by CST Process Technical Release September 2012 Summary Finish Line operates technologically validated RBM (Resorbable Blasting Media) Process, based on its CST (Comprehensive
Atomic Layer Deposition: A Novel Strategy to Remineralize Calcium Hydroxyapatite Matrix BY BELA DEEPAK JOSHI
 Atomic Layer Deposition: A Novel Strategy to Remineralize Calcium Hydroxyapatite Matrix BY BELA DEEPAK JOSHI B.Tech., Institute of Chemical Technology (UDCT), 2013 THESIS Submitted as partial fulfillment
EFFECT OF SOLVENTS ON PARTICLE STRUCTURE, MORPHOLOGY AND OPTICAL PROPERTIES OF ZINC OXIDE NANOPARTICLES
 EFFECT OF SOLVENTS ON PARTICLE STRUCTURE, MORPHOLOGY AND OPTICAL PROPERTIES OF ZINC OXIDE NANOPARTICLES A.Vanaja 1 and K.Srinivasa Rao 2 1 Department of Physics, Lingayya s University, Old Faridabad, Haryana,
Descriptions of NDT Projects Fall 2004 October 31, 2004
 Descriptions of NDT Projects Fall 2004 October 31, 2004 Introduction There are two separate NDT labs in Magister: ULTRA for ultrasound and EDDY for eddy current. Both labs are equipped with mechanical
Supporting Information
 Supporting Information An efficient broadband and omnidirectional light-harvesting scheme employing the hierarchical structure based on ZnO nanorod/si 3 N 4 -coated Si microgroove on 5-inch single crystalline
Scanning electron microscope characterization of abrasion in human teeth
 Dental Journal Mahidol Dental Journal Original Article Scanning electron microscope characterization of abrasion in human teeth B.Sc., D.D.S., Specialty Certificate in Oral Pathology, M.S. Department of
GC Tooth Mousse Plus. Made from milk. Perfect for teeth.
 GC Tooth GC Tooth Made from milk. Perfect for teeth. 1 We all brush our teeth everyday. But people who really want to care for their teeth are discovering the many benefits that come from moussing their
Structural and Optical Properties of Single- and Few-Layer Magnetic
 SUPPORTING INFORMATION Structural and Optical Properties of Single- and Few-Layer Magnetic Semiconductor CrPS 4 Jinhwan Lee 1, Taeg Yeoung Ko 2, Jung Hwa Kim 3, Hunyoung Bark 4, Byunggil Kang 4, Soon-Gil
Supporting Information
 This journal is The Royal Society of Chemistry 011 Supporting Information Vertically-Aligned ZnO Nanorods Doped with Lithium for Polymer Solar Cells: Defect Related Photovoltaic Properties Pipat Ruankham,