Predictive Models: Current and Future. November 9, Steve Wickstrom Vice President, Research and Methods OptumInsight
|
|
|
- Annis Morgan
- 5 years ago
- Views:
Transcription

1 Predictive Models: Current and Future November 9, 2011 Steve Wickstrom Vice President, Research and Methods OptumInsight
2 OptumInsight Predictive Solutions: Overview OptumInsight is dedicated to delivering a comprehensive suite of quality predictive modeling tools to meet our customer needs Our longitudinal research data warehouse allows us to create a wide range of models Access to over 50M individuals Over 15 years of historical data available Creation of prototypes simulating the customer experience Beyond our marketed capabilities we have the ability to create custom models or unique needs 2
3 Applications of Predictive Models Identify persons for inclusion in multi-disease case-management programs More effectively target single-disease management programs Identify persons who might benefit from educational/ self-care support Provide data on which to make financial decisions (e.g. budget allocations; demand forecasts) 3
4 Desired Properties of a Predictive Model Accuracy - maximize predictive accuracy Transparency - support users ability to validate and explain predictions Interoperability - integrate with other clinical and underwriting systems Flexibility - offer users options that best meet operational needs Industry Acceptance - evidence of its credibility in the marketplace 4
5 Predictive Model Essentials Determination of what you want to predict Unplanned admits, readmissions, cost... The sources of data must be identified Traditional: Professional, Facility, Medications Other: Social Care, Mental Health, Consumer, Functional Status... The quality of the data must be assessed Completeness: Is all of the data there Accuracy: Do the codes make sense Condition identification methodology Method of identifying conditions across the ICD-9-CM simplifying to a reasonable number of meaningful conditions Methodological approach Approach to building predictors, assessing the outcome and iterating to an optimal solution 5

6 OptumInsight Solution Overview We have several types of models to meet a wide range of business applications Episode Risk Groups Pharmacy Risk Groups Rx Dx Impact Pro Natural History of Disease 6
7 OptumInsight Predictive Solutions: ERG Based on market leading episode methodology: ETG Ten years: Initial release in 2001 Morbidity based does not use service utilization in determination of risk Risk markers are determined by the constellation of observed ETG s for each person Leverages one year of service data Substantial improvement to the model in 2008 leveraging the ETG 7.0 risk adjustment methodology 7
8 OptumInsight Predictive Solutions: ERG Flexible models to meet customer data availability MedRx MedRx, Med MedRx and Med Med Has a wide range of models that can meet diverse customer needs: Prospective ( ) Retrospective Actuarial/Underwriting ( ) Risk weights are recalibrated every 2-3 years to account for changes in health care utilization and spending patterns 8
9 OptumInsight Predictive Solutions: PRG Based on retail pharmacy claims Initial release in 2003 Leverages the Symmetry DCC pharmacy classification system Risk markers are determined by the constellation of observed DCC s for each person Leverages one year of service data Can run as a stand-alone or with ETG Allows customers that promptly acquire pharmacy data speedy access to risk 9
10 OptumInsight Predictive Solutions: PRG Flexible models to meet customer data availability Rx MedRx and Rx RX Has a wide range of models that can meet diverse customer needs: Prospective ( ) Actuarial/Underwriting ( ) Risk weights are recalibrated every 2-3 years to account for changes in health care utilization and spending patterns 10

11 Rx Dx Rx Dx uses prescribed drugs (along with age and gender) to assign the likelihood of an individual having one or more specific medical conditions Generates probabilities at the individual/condition level A probability assignment of 0.75 for hypertension suggests a 75% probability of that individual having a diagnosis of hypertension 11
12 Approach Developed for conditions: Where an Rx Dx map could be constructed in a reliable and valid manner Where pharmaceutical agents are an important component of the treatment regimen With clinical & financial importance to potential users Guided by empirical evidence and clinical expertise Informed by the healthcare experience derived from a large population Leverages Symmetry Drug Hierarchy - DCC 12
13 Example: Multiple Sclerosis Description DCC N MS % Mitoxantrone HCI % Interferon beta-1b % Interferon Beta-1a % Glatiramer Acetate % Riluzole % Interferon Beta-1a (Rebif) % Natalizumab % Hemiacidrin % Repository Corticotropin Injection % Ingenix, Inc
14 How do you know if the model works? Think of the model as a screening test Desirable features: Sensitivity: The ability of the model to identify most of all of the cases Positive Predictive Value : The degree to which the model indicates one has the condition, when they actually do have it There is a balance between Sensitivity and PPV Negative Predictive Value: Ability for the model to not identify negative cases (NPV) The best models are those that have a large differentiation between presence and absence of a drug Ingenix, Inc
 94.41% (10,277 / 10,885) Se 54.96% (10,277 / 18,698) False+ 608 False- 8,421 Ingenix, Inc.")
15 Example: Multiple Sclerosis Multiple Sclerosis Yes No Total Drug Y Drug N 10,277 (tp) 608 (fp) 10,885 8,421 (fn) 9,980,694 (tn) 9,989,115 Total 18,698 9,981,302 10,000,000 PPV (TP) 94.41% (10,277 / 10,885) Se 54.96% (10,277 / 18,698) False+ 608 False- 8,421 Ingenix, Inc
16 Logistic Regression Results: Diabetes Type I Neither Insulin or Supplies Insulin Only Supplies Only Both Insulin & supplies Age Gender F F F F Insulin No Yes No Yes Supplies No No Yes Yes Probability 1.8% 88.7% 64.9% 96.4% Ingenix, Inc
17 Impact Pro Version 6 17
18 Impact Pro: Summary Uses ETG, pharmacy, utilization and laboratory results in assessment of risk of individuals Additionally provides a comprehensive clinical view Mature solution: Initial release in 2001 Generates prospective risk assessment Integrated into a full service solution: Processing Engine Data Mart Reporting System 18
19 Impact Pro: Model Summary Flexible models to meet customer data availability MedRx MedRx, Med MedRx and Med Med Has a wide range of models that can meet diverse customer needs: Care Management ( ) Also leverages lab results if available Actuarial/Underwriting ( ) Type of Service Likelihood of an Inpatient Event Probability of exceeding cost thresholds 19
20 Business Applications for Impact Pro Medical Management Identify and manage the right patients, at the right time, with the right intervention Identify members at greatest risk for future healthcare problems Understand key clinical drivers of risk support steerage to appropriate programs Identify care opportunities members with gaps in care, complications and comorbidities Underwriting Set the right premium rate, attract and retain good business, promote stability and profitability Historically, underwriters have used experience and other factors (age/gender, geographic and industry factors) to set healthcare premiums for individuals & groups Information on health risk for groups and individuals is used to enhance the underwriting process 20


21 Impact Pro Patient-Centered Profile Data Patient-centered Profile System-reported Data Medications Lab Data Medical Services Inpatient Stays Medications Care Team Risk of future costs Risk of Self-Reported hospitalization Claims Data Members Member-reported Data Self-Entered Biometric Data Clinical Indicators Care Opportunities Case Definitions 21


22 Measuring Patient Risk Four Steps to Prediction: 1. Inputs 2. Markers Demographics Medical Claims Rx Claims Lab Results Disease Prevalence, Severity Condition Based Risk Markers Service-Based Risk Markers Episode and other groupings to support disease identification and severity Grouping conditions into clinically homogeneous base markers High Acuity Events Moderate/ Lower Risk Markers Rx Markers Patientcentered Risk Profile Measures of Risk Translating Markers to Predictive Risk Member Clinical Risk Profile Risk score for each model Key drivers of risk Combine profile and risk results to complete Member Profile Apply weights measuring contribution of each Marker to Overall Risk Array of markers for each member 4. Risk 3. Weights 22
23 Step 1 Data Inputs Used for Prediction Medical and Pharmacy claims diagnosis codes (ICD9-CM) procedure codes (CPT, HCPCS) pharmacy (NDC codes) Demographics (age and gender) Clinical data- lab results A 12-month experience period used for prediction Supports a range of input data scenarios 23
24 Step 2 Markers of Risk What is a Risk Marker? Characteristic that can be assigned to an individual and used to differentiate risk Goal: optimize use of data inputs to create markers that are: Predictive Provide clinical insights Multi-use for different model outcomes Robust across populations and over time 24
25 Step 2 Markers of Risk How are ETGs used to create markers of risk? Identify unique clinical conditions Identify levels of severity for a condition Link services to conditions Provide a context for key events and services Some markers go beyond ETG context Result is a clinical risk profile for each individual the individual markers that they trigger 25
26 Impact Pro Types of Risk Markers Base and Severity Medical and Pharmacy Service Age/Gender (every one gets one of these) Lab Results Hierarchies are applied In total, there are approximately 900 risk markers available in Impact Pro 26
27 Impact Pro Chronic Marker Families (examples) Ischemic Asthma Impact Pro Marker Type Diabetes Heart Disease Heart Failure and COPD Base Marker Added severity I Added severity II High episode clusters, recent 3 months High episode clusters, recent 12 months Moderate episode clusters, last 4-12 months Emergency room visit, recent 3 months Acute care inpatient event, recent 3 months Acute care inpatient event, last 4-12 months All members identified with a condition receive the base marker (linked to episode triggering base) Some members receive added risk based on severity level of episode triggering the base marker Some members receive added risk based on acute and cluster service markers (hierarchical) Examples from Impact Pro Version 6. CM Future Risk Costs Model. 27
28 Impact Pro Lab Result Markers Lab results can be used to supplement claims-based markers of risk Types of lab markers Presence of an extreme lab result, e.g., Alanine aminotransferase, extreme high value, recent Cancer-125 (tumor marker), high/extreme value, recent Trend in lab results, e.g., C-reactive protein, significant increase in result Albumin, significant decrease in result 28
29 Step 3 Translating Markers to Risk Measures Risk Weights measure a marker s incremental contribution to risk Estimated from large population (about 14M for V6) Statistical approach depends on model Each marker has its own weight for each of the models supported by Impact Pro Model outcome being predicted, data inputs and timing impact weight assigned to a marker 29
30 Step 4 Predicting Risk Member Markers of Risk Relative Risk Score Predicted Annual Cost Base Diabetes $ 1,851 Severity Diabetes, Added Severity II $ 3,003 Service Inpatient stay, diabetes within recent 3 months $ 10,423 Base Heart Failure $ 3,362 Severity Heart Failure, Added Severity I $ 903 Service High HF episode clusters, recent 3 months $ 6,030 Demographic Male, $ 2, $28,292 Example from Impact Pro Version 6. CM Future Risk Costs Model. 30
 Analysis")

31 Patient-centered profile Clinical Profile Each member s Clinical Profile is based upon the latest evidence-based medicine and rules which you can tailor to specific populations Symmetry EBM Connect Disease Prevalence Co-morbidities, Complications Compliance Assessment Demographics Medical Claims Rx Claims Lab Results Grouping of inputs to support disease identification (40+ Condition) Analysis of compliance with Evidence Based and nationally recognized treatment guidelines (e.g. NCQA, AQHC, NQF) Patient-centered Clinical Profile Disease Prevalence, Co-Morbidities Complication Utilization Care Opportunity Assessment Identify in detail clinical conditions, complications, co-morbidities, services, and significant utilization events Identify departures from consensus-based clinical practice guidelines 31
32 Predictive Modeling Case Example Differentiating Between Members Patient A. Male, 52, Diabetic Patient B. Male, 60, Diabetic Type 2 Diabetic, non-insulin dependent Most recent HbA1c is 8.9; taken 2 months ago Hospitalization 6 months ago for AMI Multiple outpatient visits over last 12 months Type 2 Diabetic, non-insulin dependent Most recent HbA1c is 8.2; taken 9 months ago Multiple outpatient visits over last 12 months Prior year s cost $25,400 Prior year s cost $21,700 32
33 Impact Pro Case Example Looking Deeper Patient A Patient B Prior Cost $21,700 $25,400 Predicted Risk (Cost) 9.0 ($34,020) 4.0 ($15,120) Predicted Risk (Inpatient) 29.2% in next 3 months 6.9% in next 3 months Disease Prevalence Diabetes Diabetes Co-morbidity and Complication Markers Management EBM-compliance Care Team Care Alerts Coronary Artery Disease (CAD) Hyperlipidemia (Rx-based) Hospitalization AMI Over 15 Outpatient Visits (Diabetes and CAD) Not refilling Beta-blockers for CAD Dr. Sugar Diabetes Manager No Cardiac Care Manager Poor CAD/Diabetes Management Not Refilling Beta-blockers No Cardiac Care Manager Hypertension Over 15 Outpatient Visits (Carpal Tunnel Syndrome) No eye exam for Diabetes No recent HbA1c Test Dr. Pressure Cardiac Care No Primary Care Physician Lack of Eye Exam Lack of recent HBa1C Test No Primary Care Physician Intervention Program Diabetes, Level 4 (High) Diabetes, Level 2 (Medium) 33
34 Impact Pro Performance 34
35 Impact Pro 6.0 How Do we Compare to V5.0? We have observed a substantial increase in model performance Impact Pro Performance: R-squared 30% 25% 20% 26.0% 22.9% 20.1% 17.4% 15% 10% 5% 0% Version 6 Version 5 Version 6 Version 5 Care Management Med-Rx $250K A/U Med-Rx $250K 35
36 Impact Pro 6.0 How Do we Compare to V5.0? Impact Pro 6.0 has improved predictions for high risk patients Positive Predictive Value (PPV) Identification of High Risk Individuals Percent Correctly Identified 60% 55% 50% 45% 40% 35% 30% 25% 20% Top 0.5% Top 1% Top 2% Top 5% Top 20% Top 25% Risk Cutoff Version 6 Version 5 Impact Pro 6.0 Care Management ( ), Med+Rx Med+Rx, $250K 36
37 High Risk Individuals: Where did they go? Another angle for those we miss where do they end up? (Observed Cost Percentile Selecting Patients in Top 0.5% based on Risk) Distribution of Top 0.5% Percentage 100% 90% 80% 70% 60% 50% 40% 30% 20% Top 0.5% Top 1% Top 2% Top 5% Top 20% Top 25% Observed Percentile Version 6 Version 5 Impact Pro 6.0 Care Management ( ), Med+Rx Med+Rx, $250K 37
38 Deployment Options ASP/BPO Client extracts data Ingenix cleans and warehouses data Ingenix periodically processes data through Impact Pro Ingenix delivers data output and business intelligence application to client (BPO) Ingenix hosts data and business intelligence application (ASP) Ingenix trains client on methodology, output, and production Stand-alone Software Ingenix delivers Impact Pro processing and reporting application Supports industry standard technologies including SQL Server, Oracle, DB2, and Microsoft IIS Client extracts data and runs data periodically through Impact Pro Ingenix trains client on methodology, output, and production Ingenix, Inc
39 Where are we going next? There is an increasing desire to expand the set of input data for improved predictions Consumer data Income, education, spending patterns... How to use? Accuracy at the patient level is an issue... Health Risk Appraisals Clinical data from the point of care Electronic medical record information such as BMI, blood pressure... Integration with administrative data is crucial Not to mention compatibility with ICD-10-CM! 39
40 Where are we going next? Current efforts are focused on the collection clinical data Issues include standarized coding Timing of data Integration of clinical data with administrative data Developing analytics that can be applied at the point of care Benchmarks Predictive analytics Quality of care Presenting in a way that can be easily interpreted by clinical team members 40
41 Developing Capability Natural History of Disease 41
42 Natural History of Disease: Overview Define a disease protocol Find people who match the protocol Gather all their medical history Find control cohorts for each individual Find their history Compare clinical and financial attributes between the two groups in every conceivable way Do this in a minute or two This is being driven by the OptumInsight Innovation Lab 42 42

*t0 + (1-p0-p1)*t1*n 3 You X =")

43 Big Data Analysis (Today) Mountains of Claims Data Average disk seek time for big data in traditional databases (1-p0)*t0 + (1-p0-p1)*t1*n 3 You X = Side note What would Google s market capitalization be if its searches returned in days? 43 43
44 Big Data and NHD Massively parallel database (Netezza) Optimized Data Storage structures User Interface for mix and match attributes Medical Codes Temporal requirements Member demographics SQL based Real Time cohort matching Signal Visualizations 44 44

45 Primary population anchor criteria 45 45

46 Required enrollment and interval of interest 46 46
47 Comparison requirement/anchor 47 47

48 Matched sets 48 48
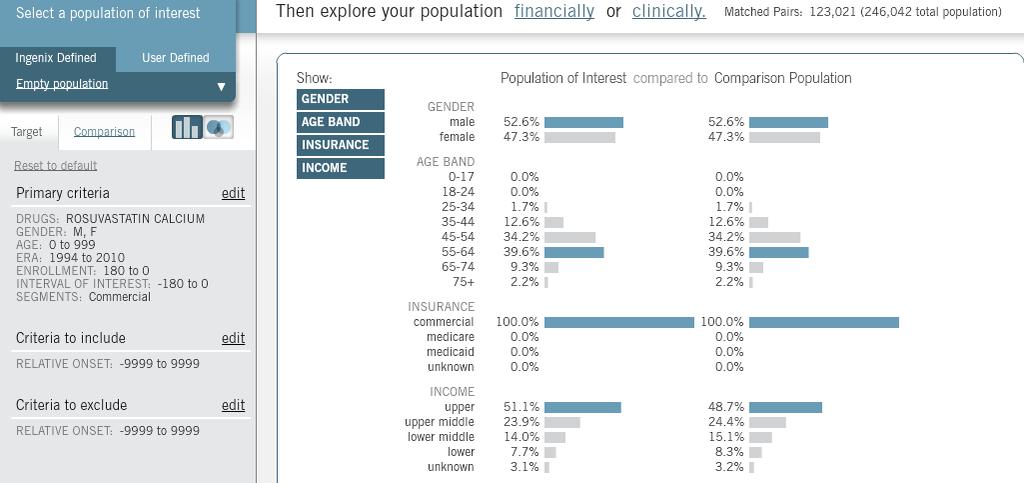
49 Demographics 49 49
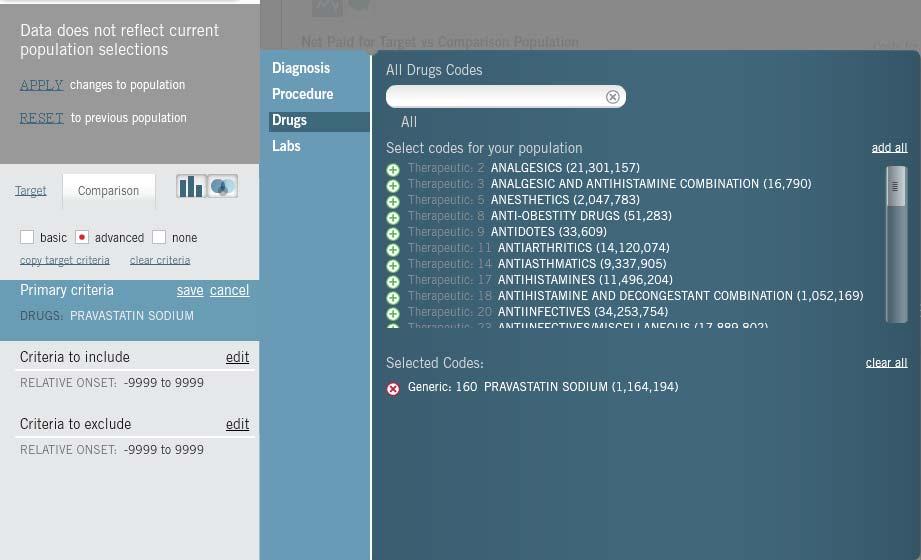
50 Now what? Drug analysis Disease analysis Lab analysis Financial analysis 50 50

51 Financial comparison 51 51

52 Drug costs 52 52


53 Questions 53
54 Impact Pro Appendix Example of clinical specificity 54
55 Value of Models: Impact Pro - Diabetes Random selection of 2M individuals from our research data warehouse Identification all individuals with diabetes and asthma/copd using Impact Pro markers Computed the prevalence of each marker Stratification of risk Details on the top 10% for diabetes and top 9% for asthma/copd Examination of the impact of markers 55
56 Chronic Condition Example: Diabetes - Markers Diabetes Marker Comments Weight Base marker Diabetes ETG-severity level Added severity I Diabetes ETG-severity level 2, Added severity II Diabetes ETG-severity level High episode clusters, recent 3 months 5+ clusters High episode clusters, last 4-12 months 11+ clusters Moderate episode clusters, last 4-12 months 5-10 clusters Emergency room visit, recent 3 months Acute care inpatient event, recent 3 months Acute care inpatient event, last 4-12 months Diabetes, selected behavioral health agents Must have base marker Diabetes, selected cardiovascular agents Must have base marker Diabetes, diuretics agents Must have base marker Rx only, non-insulin No diabetes base marker Rx only, insulin No diabetes base marker Impact Pro Version 6. Care Management ( ), MedRx MedRx Future Risk Costs Model. 56
57 Example: Diabetes Marker Description N Prev Avg. Risk P_02_01_000 Diabetes 80, % P_02_01_001 Diabetes, added severity I 13, % P_02_01_002 Diabetes, added severity II 4, % P_02_01_000_CLQ4L Diabetes, high episode clusters, recent 3 months 1, % P_02_01_000_CLSTH Diabetes, high episode clusters, last 4-12 months 1, % P_02_01_000_CLSTL Diabetes, mod. episode clusters, last 4-12 months 11, % P_02_01_000_E03 Diabetes, ER visit, recent 3 months % P_02_01_000_I03 Diabetes, acute care inpt event, recent 3 months % P_02_01_000_I12 Diabetes, acute care inpt event, last 4-12 months % P_02_01_DBH_01 Diabetes, selected behavioral health agents 7, % P_02_01_DCV_01 Diabetes, selected cardiovascular agents 23, % P_02_01_DDI_01 Diabetes, diuretics agents % P_02_13_000 Diabetes, Rx treatment-only, non-insulin 6, % P_02_14_000 Diabetes, Rx treatment-only, insulin %
58 Example: Diabetes Top 10% Marker Description N Pct-1 Pct-2 P_02_01_000 Diabetes 8, % 9.9% P_02_01_001 Diabetes, added severity I 4, % 32.8% P_02_01_002 Diabetes, added severity II 2, % 61% P_02_01_000_CLQ4L Diabetes, high episode clusters, recent 3 months 1, % 82.4% P_02_01_000_CLSTH Diabetes, high episode clusters, last 4-12 months 1, % 81.6% P_02_01_000_CLSTL Diabetes, mod. episode clusters, last 4-12 months 4, % 39.0% P_02_01_000_E03 Diabetes, ER visit, recent 3 months % 28.9% P_02_01_000_I03 Diabetes, acute care Inpt event, recent 3 months % 99.7% P_02_01_000_I12 Diabetes, acute care Inpt event, last 4-12 months % 78.8% P_02_01_DBH_01 Diabetes, selected behavioral health agents 1, % 15.7% P_02_01_DCV_01 Diabetes, selected cardiovascular agents 3, % 12.9% P_02_01_DDI_01 Diabetes, diuretics agents % 17.2% N: Number of individuals in top 10% of diabetics with this marker Pct-1: Percent of top 10% of diabetics with this marker Pct-2: For marker, the percent triggered in top 10%(e.g. 4,282/13,402 = 32.8%) 58
59 Value of Models: Summary Nearly 90% of the individual in the top 10% has severity level I or II markers triggered Severity level I triggered: 53.5% of the top 10% had this marker triggered 32.8% of the individuals with severity I triggered were in the top 10% Severity level II triggered: 35.3% of the top 10% had this marker triggered 61.0% of the individuals with severity I triggered were in the top 10% 59
60 Value of Models: Summary 82% of the individuals with a high number of diabetes clusters in the last 3 months were in the top 10% 82% of the individuals with a high number of diabetes clusters in the first 9 months were in the top 10% Nearly all of the individuals with an Inpatient event in the last 3 months were in the top 10% 79% of the individuals with an Inpatient event in the first 9 months were in the top 10% 60
Value-Driven Population Health Strategies: Designing Models for Different Populations
 Value-Driven Population Health Strategies: Designing Models for Different Populations Expert presenters Dan Dunn, Ph.D., SVP, Business Solutions, Distinguished Fellow, Optum Mark Leenay, M.S., M.D., Chief
Efficiency Methodology
 Efficiency Methodology David C. Schutt, MD Bob Kelley Thomson Healthcare October 2007 Overview Definition Clinical Grouping Methods Implementation Considerations Reporting to Physician Organizations Example
Symmetry Episode Treatment Groups
 Symmetry Episode Treatment Groups Measuring health care with meaningful episodes of care Identifying clinical episodes of illness and the services involved in their diagnosis, management, and treatment
Symmetry Episode Treatment Groups
 Symmetry Episode Treatment Groups Measuring Health Care with Meaningful Episodes of Care The information in this document is subject to change without notice. This documentation contains proprietary information,
Real World Patients: The Intersection of Real World Evidence and Episode of Care Analytics
 PharmaSUG 2018 - Paper RW-05 Real World Patients: The Intersection of Real World Evidence and Episode of Care Analytics David Olaleye and Youngjin Park, SAS Institute Inc. ABSTRACT SAS Institute recently
Practical Predictive Analytics. John Cuddeback, MD, PhD AMA IPPS November 11, 2016
 Practical Predictive Analytics John Cuddeback, MD, PhD AMA IPPS November 11, 2016 AMGA s Work in Analytics Advocacy: Align payment incentives around population health Programs: Help members redesign delivery
Using Analytics for Value-Based Care
 Using Analytics for Value-Based Care John Cuddeback, MD, PhD Elizabeth Ciemins, PhD, MPH, MA AMGA Northwest Regional Meeting February 3, 2017 Seattle A Fundamental Change Is Underway Fee for Service MIPS
Presenter. Rebecca Susic Director Account Management MEDai
 Presenter Rebecca Susic Director Account Management MEDai Agenda The Chronic Care Problem Market Needs Risk Navigator Guidelines ROI Company Overview Summary and Discussion The Chronic Care Dilemma Seventy-five
Large Scale Predictive Analytics for Chronic Illness using FuzzyLogix s In-Database Analytics Technology on Netezza
 Large Scale Predictive Analytics for Chronic Illness using FuzzyLogix s In-Database Analytics Technology on Netezza Christopher Hane, Vijay Nori, Partha Sen, Bill Zanine Fuzzy Logix Contact: Cyrus Golkar,
TENNCARE Bundled Payment Initiative: Description of Bundle Risk Adjustment for Wave 2 Episodes
 TENNCARE Bundled Payment Initiative: Description of Bundle Risk Adjustment for Wave 2 Episodes Acute COPD exacerbation (COPD); Screening and surveillance colonoscopy (COL); and Outpatient and non-acute
NEUROSCIENCE TRIALS OF THE FUTURE: A WORKSHOP Pragmatic Trials: Challenges and Opportunities for Neuroscience Trials
 NEUROSCIENCE TRIALS OF THE FUTURE: A WORKSHOP Pragmatic Trials: Challenges and Opportunities for Neuroscience Trials Mark J. Cziraky, PharmD, CLS Vice President of Research HealthCore Inc. Wilmington,
Member-centered cancer care In Georgia
 Quality health plans & benefits Healthier living Financial well-being Intelligent solutions Member-centered cancer care In Georgia Ira Klein, MD, MBA, FACP GASCO Annual Meeting September 5, 2015 > One
Improved Transparency in Key Operational Decisions in Real World Evidence
 PharmaSUG 2018 - Paper RW-06 Improved Transparency in Key Operational Decisions in Real World Evidence Rebecca Levin, Irene Cosmatos, Jamie Reifsnyder United BioSource Corp. ABSTRACT The joint International
PHPG. Utilization and Expenditure Analysis for Dually Eligible SoonerCare Members with Chronic Conditions
 PHPG The Pacific Health Policy Group Utilization and Expenditure Analysis for Dually Eligible SoonerCare Members with Chronic Conditions Prepared for: State of Oklahoma Oklahoma Health Care Authority April
Imaging Performance Partnership. A Data Driven Approach to Your Imaging Program Strategy
 Imaging Performance Partnership A Data Driven Approach to Your Imaging Program Strategy PROGRAM GOALS Imaging Performance Partnership has a wide array of tools to support various aspects of imaging business
Advances in Alignment, Measurement, and Performance MY 2017 Results Highlights
 Advances in Alignment, Measurement, and Performance MY 2017 Results Highlights Align. Measure. Perform. (AMP) Programs Launched in 2003, VBP4P is a statewide performance improvement program and one of
Key Quality of Care Measures. Blue Cross Blue Shield of Michigan Traditional, PPO and POS Members. Fourth Quarter 2003
 Key Quality of Care Measures Blue Cross Blue Shield of Michigan Traditional, PPO and POS Members Fourth Quarter 2003 Blue Cross Blue Shield of Michigan is a nonprofit corporation and independent licensee
A COMPREHENSIVE APPROACH TO MANAGING DIABETES
 A COMPREHENSIVE APPROACH TO MANAGING DIABETES Programs and services to help individuals avoid costly complications and improve outcomes 2 0 1 8 ENTER Supporting each member with targeted guidance and services.
Do OurHealth primary care clinics improve health & reduce healthcare costs? OurHealth Patient Engagement Analysis June 2018
 Question: Do OurHealth primary care clinics improve health & reduce healthcare costs? OurHealth Patient Engagement Analysis June 2018 An examination of health improvements, utilization & cost of care for
Using Predictive Analytics to Save Lives
 March 2018 1 Using Predictive Analytics to Save Lives Presented by Sybil Klaus MD MPH, MITRE, and James Fackler MD, Johns Hopkins University School of Medicine Approved for Public Release; Distribution
Big Data & Predictive Analytics Case Studies: Applying data science to human data Big-Data.AI Summit
 Big Data & Predictive Analytics Case Studies: Applying data science to human data 1.03.2018 Big-Data.AI Summit Dr. Arnim Jost, Commercial Director Technology Copyright 2017 IQVIA. All rights reserved.
CLINICAL PROCESS IMPROVEMENT INITIATIVE (CPII) EFFICIENCY REPORT EXPLANATION January 4, 2016
 EFFICIENCY REPORT EXPLANATION January 4, 2016") CLINICAL PROCESS IMPROVEMENT INITIATIVE (CPII) EFFICIENCY REPORT EXPLANATION January 4, 2016 WHAT IS AN EPISODE OF CARE? An episode of care is a grouping of a patient s health care claims for a unique
CLINICAL PROCESS IMPROVEMENT INITIATIVE (CPII) EFFICIENCY REPORT EXPLANATION January 4, 2016 WHAT IS AN EPISODE OF CARE? An episode of care is a grouping of a patient s health care claims for a unique
Your Partnership in Health Report: Chronic Conditions ABC Company and Kaiser Permanente
 Your Partnership in Health Report: s ABC Company and Kaiser Permanente Measurement Period: JUL-01-2012 through JUN-30-2013 Report Date: DEC-31-2013 Commercial All Members Partnership in Health (PIH) reports:
UnitedHealth Premium Designation Program Case-mix Adjusted Benchmarks with Severity or Risk Adjustment
 UnitedHealth Premium Designation Program Case-mix Adjusted Benchmarks with Severity or Risk Adjustment Resources u Phone: 866-270-5588 u u u Website: UnitedHealthcareOnline.com > Quick Links > UnitedHealth
ONCOLOGY: WHEN EXPERTISE, EXPERIENCE AND DATA MATTER. KANTAR HEALTH ONCOLOGY SOLUTIONS: FOCUSED I DEDICATED I HERITAGE
 CATALYSTS DRIVING SUCCESSFUL DECISIONS IN LIFE SCIENCES ONCOLOGY: WHEN EXPERTISE, EXPERIENCE AND DATA MATTER. KANTAR HEALTH ONCOLOGY SOLUTIONS: FOCUSED I DEDICATED I HERITAGE AT KANTAR HEALTH, ONCOLOGY
HOW TO MAXIMIZE PATIENT RECRUITMENT IN ONCOLOGY TRIALS A BIOPHARMA DIVE PLAYBOOK
 HOW TO MAXIMIZE PATIENT RECRUITMENT IN ONCOLOGY TRIALS A BIOPHARMA DIVE PLAYBOOK Over the last several decades, patient recruitment for clinical trials has remained a major barrier to rapid execution of
UnitedHealth Premium Program Case-mix Adjusted Benchmarks with Severity or Risk Adjustment
 UnitedHealth Premium Program Case-mix Adjusted Benchmarks with Severity or Risk Adjustment Resources u Phone: 866-270-5588 u u Website: UHCprovider.com/Premium Mail: UnitedHealthcare - UnitedHealth Premium
Jae Jin An, Ph.D. Michael B. Nichol, Ph.D.
 IMPACT OF MULTIPLE MEDICATION COMPLIANCE ON CARDIOVASCULAR OUTCOMES IN PATIENTS WITH TYPE II DIABETES AND COMORBID HYPERTENSION CONTROLLING FOR ENDOGENEITY BIAS Jae Jin An, Ph.D. Michael B. Nichol, Ph.D.
PCMH 2018 Enrollment and Update August 25, 2017
 PCMH 2018 Enrollment and Update August 25, 2017 Enrollment Requirements Anne Santifer HealthCare Innovations Department of Human Services 2018 Enrollment Requirements A physician practice that is enrolled
Combining Risk Adjustment and HEDIS to Improve Quality of Care. Colleen Gianatasio, CPC, CPC-P, CPMA, CPC-I, CRC
 Combining Risk Adjustment and HEDIS to Improve Quality of Care Colleen Gianatasio, CPC, CPC-P, CPMA, CPC-I, CRC Agenda Improving primary care in today s health care environment Risk adjustment basics (using
THE NATIONAL QUALITY FORUM
 THE NATIONAL QUALITY FORUM National Voluntary Consensus Standards for Patient Outcomes Table of Measures Submitted-Phase 1 As of March 5, 2010 Note: This information is for personal and noncommercial use
Visualizing Data for Hypothesis Generation Using Large-Volume Health care Claims Data
 Visualizing Data for Hypothesis Generation Using Large-Volume Health care Claims Data Eberechukwu Onukwugha PhD, School of Pharmacy, UMB Margret Bjarnadottir PhD, Smith School of Business, UMCP Shujia
Measuring and Improving Quality in Accountable Care Organizations
 Measuring and Improving Quality in Accountable Care Organizations Joachim Roski, PhD MPH Fellow, Economic Studies Managing Director, High Value Healthcare Initiative Overview ACOs and health care reform
UnitedHealth Premium Program Case-mix, Severity and Risk
 UnitedHealth Premium Program Case-mix, Severity and Risk Resources u Phone: 866-270-5588 u u Website: UnitedHealthPremium.UHC.com Mail: UnitedHealthcare - UnitedHealth Premium Program MN017-W700 9700 Health
REFERENCE CODE GDHCER022 PUBLICAT ION DATE AUGUST 2013 OVERWEIGHT AND OBESITY - EPIDEMIOLOGY FORECAST TO 2022
 REFERENCE CODE GDHCER022 PUBLICAT ION DATE AUGUST 2013 OVERWEIGHT AND OBESITY - Executive Summary Obesity is an escalating global public health problem that has reached pandemic proportions. It is caused
Study Exposures, Outcomes:
 GSK Medicine: Coreg IR, Coreg CR, and InnoPran Study No.: WWE111944/WEUSRTP3149 Title: A nested case-control study of the association between Coreg IR and Coreg CR and hypersensitivity reactions: anaphylactic
Social Determinants of Health
 FORECAST HEALTH WHITE PAPER SERIES Social Determinants of Health And Predictive Modeling SOHAYLA PRUITT Director Product Management Health systems must devise new ways to adapt to an aggressively changing
OBSERVATIONAL MEDICAL OUTCOMES PARTNERSHIP
 OBSERVATIONAL Patient-centered observational analytics: New directions toward studying the effects of medical products Patrick Ryan on behalf of OMOP Research Team May 22, 2012 Observational Medical Outcomes
Commercial Health Insurance Claims Data. for Studying HIV/AIDS Care. Senior Scientist, Innovus Epidemiology. David D.
 Commercial Health Insurance Claims Data for Studying HIV/AIDS Care David D. Dore, PharmD, PhD Senior Scientist, Innovus Epidemiology Adjunct Assistant Professor, Alpert Medical School, Brown University
Care Management Technologies
 Care Management Technologies Insight and Action in Behavioral Health Role of MH/DD SA Provider in Improving Care and Lowering Costs: Using Data to Demonstrate Your Value North Carolina Providers Council
Innovative Risk and Quality Solutions for Value-Based Care. Company Overview
 Innovative Risk and Quality Solutions for Value-Based Care Company Overview Meet Talix Talix provides risk and quality solutions to help providers, payers and accountable care organizations address the
Using the NIH Collaboratory's and PCORnet's distributed data networks for clinical trials and observational research - A preview
 Using the NIH Collaboratory's and PCORnet's distributed data networks for clinical trials and observational research - A preview Millions of people. Strong collaborations. Privacy first. Jeffrey Brown,
Modular Program Report
 Modular Program Report The following report(s) provides findings from an FDA initiated query using its Mini Sentinel pilot. While Mini Sentinel queries may be undertaken to assess potential medical product
TENNCARE Bundled Payment Initiative: Description of Bundle Risk Adjustment for Wave 4 Episodes
 TENNCARE Bundled Payment Initiative: Description of Bundle Risk Adjustment for Wave 4 Episodes Attention deficit hyperactivity disorder (ADHD); Opposition defiance disorder (ODD); Coronary artery bypass
A Prospective Comparison of Two Commercially Available Hospital Admission Risk Scores
 A Prospective Comparison of Two Commercially Available Hospital Admission Risk Scores Dale Eric Green, MD MHA FCCP: Chief Medical Information Officer, Cornerstone Health Care AMGA April, 2014 Disclosure
INSIGHTS INTO ADHD CARE IN GERMANY BASED ON SHI CLAIMS DATA 03. March Results of the CoCA Study (Horizon 2020)
") 03. March 2017 INSIGHTS INTO ADHD CARE IN GERMANY BASED ON SHI CLAIMS DATA Results of the CoCA Study (Horizon 2020) Who are we? HGC looks back on close to 30 years of experience in the health care sector
03. March 2017 INSIGHTS INTO ADHD CARE IN GERMANY BASED ON SHI CLAIMS DATA Results of the CoCA Study (Horizon 2020) Who are we? HGC looks back on close to 30 years of experience in the health care sector
Capital Health Plan CMS Star Ratings Strategies for Improvement
 Capital Health Plan CMS Star Ratings Strategies for Improvement ESTRELLITA REDMON, MD, MBA MEDICAL DIRECTOR The Ultimate Goal Outline Current 5 Star Plans CHP History Importance of Ratings Part C and Part
We see health care. differently. Comprehensive data Novel insights Transformative actions Lasting value
 We see health care differently Comprehensive data Novel insights Transformative actions Lasting value 24 Hours of Optum data: Creating a more complete health picture We capture: Largest EHR dataset 90
Trends in Health Plan Design: High Performance Networks. John Bertko, F.S.A., MAAA Vice President and Chief Actuary Humana Inc July 28, 2005
 Trends in Health Plan Design: High Performance Networks John Bertko, F.S.A., MAAA Vice President and Chief Actuary Humana Inc July 28, 2005 1 Overview What is a High Performance Network (HPN) Tighter network
ICD-10 Contingency Planning Thinking through Step Up Step Down Translation for Contingency Planning Ryan McDermitt, VP compliance Products, Edifecs
 ICD-10 Contingency Planning Thinking through Step Up Step Down Translation for Contingency Planning Ryan McDermitt, VP compliance Products, Edifecs Inc Agenda 1 Speaker Background in ICD-10 Space 2 ICD-10
ADA 2018 JUN 25, 2018 ORLANDO, FLORIDA
 ADA 2018 JUN 25, 2018 ORLANDO, FLORIDA FORWARD LOOKING STATEMENTS This presentation contains forward-looking statements. They are based on current assumptions and expectations that involve uncertainties
Bringing Together Clinical, Economic and Patient Reported Outcomes Data Future Of Real World Evidence. March IIeX Health, Philadelphia, PA
 Bringing Together Clinical, Economic and Patient Reported Outcomes Data Future Of Real World Evidence March 27 2018 IIeX Health, Philadelphia, PA Overview Current Landscape Data Sources to generate Real
Medicare Severity-adjusted Diagnosis Related Groups (MS-DRGs) Coding Adjustment
 Coding Adjustment") American Hospital association December 2012 TrendWatch Are Medicare Patients Getting Sicker? Today, Medicare covers more than 48 million people, and that number is growing rapidly baby boomers are reaching
American Hospital association December 2012 TrendWatch Are Medicare Patients Getting Sicker? Today, Medicare covers more than 48 million people, and that number is growing rapidly baby boomers are reaching
Team-Based Decision Support in Diabetes Outcomes and Costs
 Team-Based Decision Support in Diabetes Outcomes and Costs Session 89, 8:30 a.m. February 13, 2019 Gary Ozanich, Ph.D. - College of Informatics, Northern Kentucky University 1 Conflict of Interest Gary
Population Health 2.0 through Personalized Medicine
 DISCOVERING WHAT WORKS. AND FOR WHOM. Population Health 2.0 through Personalized Medicine Colin Hill CEO and Co-Founder "Fifty-five percent of drugs used in America don't work for the patients they are
Sound Off DR. GOOGLE S ROLE IN PRE-DIAGNOSIS THROUGH TREATMENT. Ipsos SMX. June 2014
 Sound Off DR. GOOGLE S ROLE IN PRE-DIAGNOSIS THROUGH TREATMENT June 2014 Ipsos SMX : Sound bits (of advice) and bites (of research) from Ipsos SMX Ipsos social media research division, dedicated to providing
Reducing Readmissions and Improving Outcomes at OhioHealth Mansfield Hospital:
 Reducing Readmissions and Improving Outcomes at OhioHealth Mansfield Hospital: Eugenio H. Zabaleta, Ph.D. Clinical Chemist OhioHealth Mansfield Hospital Reducing Readmissions and Improving Outcomes at
SAGE. Nick Beard Vice President, IDX Systems Corp.
 SAGE Nick Beard Vice President, IDX Systems Corp. Sharable Active Guideline Environment An R&D consortium to develop the technology infrastructure to enable computable clinical guidelines, that will be
Cost-Motivated Treatment Changes in Commercial Claims:
 Cost-Motivated Treatment Changes in Commercial Claims: Implications for Non- Medical Switching August 2017 THE MORAN COMPANY 1 Cost-Motivated Treatment Changes in Commercial Claims: Implications for Non-Medical
HEDIS Quick Reference Guide Updated to reflect NCQA HEDIS 2016 Technical Specifications
 HEDIS Quick Reference Guide Updated to reflect NCQA HEDIS 2016 Technical Specifications Fidelis SecureCare strives to provide quality healthcare to our membership as measured through HEDIS quality metrics.
Watson Summit Prague 2017
 Watson for Oncology Matěj Adam Watson Health Executive May 2017 Watson Summit Prague 2017 an IBM Company Leadership & 23 Years Patent Leadership Research Spend Global Presence Technology 7300+ 2015 $6B
Q u a l i t y M e a s u r e G a p s i n To d a y s A c c o u n t a b l e C a r e P r o g r a m s
 Q u a l i t y M e a s u r e G a p s i n To d a y s A c c o u n t a b l e C a r e P r o g r a m s Tom Valuck, MD, JD March 3, 2015 Discern Health 1120 North Charles Street Suite 200 Baltimore, MD 21201
Get the Right Reimbursement for High Risk Patients
 Get the Right Reimbursement for High Risk Patients A Proven Strategy for Managing Hierarchical Condition Categories (HCC) in your EHR 847-272-1242 sales@e-imo.com e-imo.com 1 OVERVIEW Medicare Advantage
Value Based Pay for Performance Results & Highlights Measurement Year September 2017
 Value Based Pay for Performance Results & Highlights Measurement Year 2016 September 2017 IHA s Value Based Pay for Performance (VBP4P) ~200 Medical Groups & IPAs 9 Health Plans Common Measurement Public
Jukti Kumar Kalita, PhD Business Analytics and Insights Pfizer Presented at:
 Hospital to Retail Spillover Analysis and Its Impact on Commercial Decision Making Jukti Kumar Kalita, PhD Business Analytics and Insights Pfizer Presented at: 1 Disclaimer The information provided and
Disclaimer. The following report contains a description of the request, request specifications, and results from the modular program run(s).
.") Disclaimer The following report(s) provides findings from an FDA initiated query using its Mini Sentinel pilot. While Mini Sentinel queries may be undertaken to assess potential medical product safety
Disclaimer The following report(s) provides findings from an FDA initiated query using its Mini Sentinel pilot. While Mini Sentinel queries may be undertaken to assess potential medical product safety
Arkansas Blue Cross and Blue Shield (ABCBS) Patient Centered Medical Home (PCMH) Specifications Manual
 Patient Centered Medical Home (PCMH) Specifications Manual") Arkansas Blue Cross and Blue Shield (ABCBS) Patient Centered Medical Home (PCMH) Specifications Manual 2017 This document is a guide to the 2017 Arkansas Blue Cross and Blue Shield Patient-Centered Medical
Arkansas Blue Cross and Blue Shield (ABCBS) Patient Centered Medical Home (PCMH) Specifications Manual 2017 This document is a guide to the 2017 Arkansas Blue Cross and Blue Shield Patient-Centered Medical
Aexcel. Specialist Designation in Aetna Performance Network. Methodology Guide
 Aexcel Specialist Designation in Aetna Performance Network Methodology Guide Aexcel 2009 TABLE OF CONTENTS Background on Aexcel Performance Networks... 3 Clinical Performance Evaluation Process... 8 General
TN Bundled Payment Initiative: Overview of Episode Risk Adjustment
 TN Bundled Payment Initiative: Overview of Episode Risk Adjustment United Healthcare, April 2014 The State of Tennessee has implemented an episode-based approach to reimburse providers for the care delivered
Maximize the value of your diabetes population management program with advanced analytics PLAYBOOK
 Maximize the value of your diabetes population management program with advanced analytics PLAYBOOK STEP ONE: Analyze your patient population Bend the cost curve: Learning more about your patients can lead
Predictive and Similarity Analytics for Healthcare
 Predictive and Similarity Analytics for Healthcare Paul Hake, MSPA IBM Smarter Care Analytics 1 Disease Progression & Cost of Care Health Status Health care spending Healthy / Low Risk At Risk High Risk
Epi Database. June 2018 Newsletter
 Epi Database June 2018 Newsletter Epi Database June 2018 Newsletter Epi Database is the premier online database that provides reliable, documented and well-researched epidemiological estimates. All epidemiologies
ARKANSAS MEDICARE CHRONIC CONDITIONS REPORT. July 1, T. Mac Bird, PhD, APCD Analytic Lead Kenley Money, APCD Director. Version
 lll ARKANSAS MEDICARE CHRONIC CONDITIONS REPORT July 1, 2016 T. Mac Bird, PhD, APCD Analytic Lead Kenley Money, APCD Director Version 1.0.2016 ACHI is a nonpartisan, independent, health policy center that
Submitted to the House Energy and Commerce Committee. Federal Efforts to Combat the Opioid Crisis
 STATEMENT FOR THE RECORD Submitted to the House Energy and Commerce Committee Federal Efforts to Combat the Opioid Crisis October 25, 2017 America s Health Insurance Plans 601 Pennsylvania Avenue, NW Suite
ADM to Acquire Neovia and Probiotics International Limited. July 2, 2018
 ADM to Acquire Neovia and Probiotics International Limited July 2, 2018 Safe Harbor Statement 2 Some of our comments constitute forward-looking statements that reflect management s current views and estimates
Clinical Quality Measures Summary of Upcoming Enhancements
 Upcoming coding enhancements will impact the logic behind the clinical quality indicators applicable to your practice specialty. Please refer to this grid for a summary of the coding enhancements and some
REFERENCE CODE GDHCER PUBLICAT ION DATE JULY 2014 ACUTE CORONARY SYNDROME (ACS) - EPIDEMIOLOGY FORECAST TO 2023
 - EPIDEMIOLOGY FORECAST TO 2023") REFERENCE CODE GDHCER053-14 PUBLICAT ION DATE JULY 2014 ACUTE CORONARY SYNDROME (ACS) - Executive Summary Acute coronary syndrome (ACS) is a serious cardiovascular disease associated with high healthcare
REFERENCE CODE GDHCER053-14 PUBLICAT ION DATE JULY 2014 ACUTE CORONARY SYNDROME (ACS) - Executive Summary Acute coronary syndrome (ACS) is a serious cardiovascular disease associated with high healthcare
PPD S EXPERT HEMATOLOGY AND ONCOLOGY TEAM
 HEMATOLOGY ONCOLOGY PPD S EXPERT HEMATOLOGY AND ONCOLOGY TEAM COMMITTED TO ADVANCING DRUG DEVELOPMENT IN ONCOLOGY $ MARKETPLACE COMPLEXITIES increasingly competitive marketplace and rising cost pressures
Innovator Case Studies: Oncology Networks
 Innovator Case Studies: Oncology Networks J. Ike Nicoll Chief Executive Officer Cancer Clinics of Excellence Alan Armer, Ph.D. Vice President, Research & Development Catholic Health Initiatives Cancer
Leveraging Data for Targeted Patient Population Health Improvements
 Leveraging Data for Targeted Patient Population Health Improvements Diabetes Impact on Health in America Diabetes is a major health concern in the United States today. The Centers for Disease Control
Predictive Models for Healthcare Analytics
 Predictive Models for Healthcare Analytics A Case on Retrospective Clinical Study Mengling Mornin Feng mfeng@mit.edu mornin@gmail.com 1 Learning Objectives After the lecture, students should be able to:
BETTER WAYS TO PAY FOR CANCER CARE Creating Win-Win-Win Approaches for Oncologists, Cancer Patients, and Payers
 BETTER WAYS TO PAY FOR CANCER CARE Creating Win-Win-Win Approaches for Oncologists, Cancer Patients, and Payers Harold D. Miller President and CEO Center for Healthcare Quality and Payment Reform Physicians
Lead the Way with Advanced Care Management. Workbook
 Lead the Way with Advanced Care Management Workbook TPCA Training 10.2018 Section 1: Using i2itracks for Chronic Disease Management Chronic Disease Tracking in 2018 Disease Management Definition A system
16 th Annual IHA Stakeholders Meeting Session 2C
 16 th Annual IHA Stakeholders Meeting Session 2C September 19, 2017 Hilton Los Angeles Airport Thank you to our Content Partner: Medication Adherence AppleCare Pharmacy Programs Confidential and proprietary.
Leveraging Analytics and Artificial Intelligence to Predict Health Risk
 Leveraging Analytics and Artificial Intelligence to Predict Health Risk A case study on using machine learning to boost atrial fibrillation identification and anticoagulant drug use Arthur L. Forni, MD,
REFERENCE CODE GDHCER052 PUBLICAT ION DATE NOVEMBER 2013 DIABETIC NEPHROPATHY - EPIDEMIOLOGY FORECAST TO 2022
 REFERENCE CODE GDHCER052 PUBLICAT ION DATE NOVEMBER 2013 DIABETIC NEPHROPATHY - Executive Summary Diabetic nephropathy is one of the microvascular complications of diabetes, along with diabetic neuropathy
Modular Program Report
 Modular Program Report The following report(s) provides findings from an FDA initiated query using its Mini Sentinel pilot. While Mini Sentinel queries may be undertaken to assess potential medical product
TENNCARE Bundled Payment Initiative: Description of Bundle Risk Adjustment for Wave 3 Episodes
 TENNCARE Bundled Payment Initiative: Description of Bundle Risk Adjustment for Wave 3 Episodes Respiratory Infection (RI); Pneumonia (PNA); Inpatient Urinary Tract Infection (UTI-I; Outpatient Urinary
Cambia Palliative Care Metrics: Where are we and where are we going?
 Cambia Palliative Care Metrics: Where are we and where are we going? J. Randall Curtis, MD, MPH Director, Cambia Palliative Care Center of Excellence www.uwpalliativecarecenter.com Overview of System-Wide
Health Services & High Risk Admissions Registries. David Carnahan, MD MSCE DHA CEI Branch Chief 12 June 2014
 Health Services & High Risk Admissions Registries David Carnahan, MD MSCE DHA CEI Branch Chief 12 June 2014 Introduction Background Information Variables of Interest (potential markers) ACG Use case Readmissions
 Legislative Report: 5010/ICD-10 --------------------------------- WEDI EHR Work Group: Electronic Health Record Product and Vendor Profile Site (Draft) Robert M. Tennant MGMA Co-chair, WEDI EHR WG HR 4157
Performance Analysis:
 Performance Analysis: Healthcare Utilization of CCNC- Population 2007-2010 Prepared by Treo Solutions JUNE 2012 Table of Contents SECTION ONE: EXECUTIVE SUMMARY 4-5 SECTION TWO: REPORT DETAILS 6 Inpatient
SAS UTILIZATION A TO Z: HOW WE`RE USING SAS TODAY AND WHERE WE MAY BE HEADED!
 SAS UTILIZATION A TO Z: HOW WE`RE USING SAS TODAY AND WHERE WE MAY BE HEADED! EXTRACT TRANSFORM LOAD WHAT WE TRANSFORM (AND HOW) ELIGIBILITY CLAIMS GROUP CONTRACT BENEFIT PROVIDER PREMIUM (PAID AND EARNED)
CLINICAL. Determinants of Compliance With Statin Therapy and Low-Density Lipoprotein Cholesterol Goal Attainment in a Managed Care Population
 Determinants of Compliance With Statin Therapy and Low-Density Lipoprotein Cholesterol Goal Attainment in a Managed Care Population Jennifer S. Schultz, PhD; John C. O Donnell, PhD; Ken L. McDonough, MD;
Smarter Big Data for a Healthy Pennsylvania: Changing the Paradigm of Healthcare
 Smarter Big Data for a Healthy Pennsylvania: Changing the Paradigm of Healthcare By: Alejandro Borgonovo Mentor: Dr. Amol Navathe Outline Project Overview Project Significance Objectives Methods About
Key Behavioral Health Measures (18 Years and Older)
") At WellCare, we value everything you do to deliver quality care for our members your patients to make sure they have a positive health care experience. That s why we ve created this easy-to-use, informative
At WellCare, we value everything you do to deliver quality care for our members your patients to make sure they have a positive health care experience. That s why we ve created this easy-to-use, informative
Information Technology-Driven Analytics: The Link Between Data Aggregation, Analytics and EHRs. Ronald A. Paulus, MD President and CEO June 27, 2011
 Information Technology-Driven Analytics: The Link Between Data Aggregation, Analytics and EHRs Ronald A. Paulus, MD President and CEO June 27, 2011 1 Summary Analytics and EHRs are co-dependent and complementary
Not all NLP is Created Equal:
 Not all NLP is Created Equal: CAC Technology Underpinnings that Drive Accuracy, Experience and Overall Revenue Performance Page 1 Performance Perspectives Health care financial leaders and health information
THE ANALYTICS EDGE. Intelligence, Happiness, and Health x The Analytics Edge
 THE ANALYTICS EDGE Intelligence, Happiness, and Health 15.071x The Analytics Edge Data is Powerful and Everywhere 2.7 Zettabytes of electronic data exist in the world today 2,700,000,000,000,000,000,000
CLINICAL REGISTRIES Use and Emerging Best Practices
 CLINICAL REGISTRIES Use and Emerging Best Practices Tim Friede Department of Medical Statistics University Medical Center Göttingen DZHK (German Center for Cardiovascular Research) OUTLINE Background: