Displaying the Order in a Group of Numbers Using Tables and Graphs
|
|
|
- Clare Hutchinson
- 6 years ago
- Views:
Transcription


1 SIXTH EDITION 1 Displaying the Order in a Group of Numbers Using Tables and Graphs
2 Statistics (stats) is a branch of mathematics that focuses on the organization, analysis, and interpretation of a group of numbers. is a method of pursuing the truth Psychologists use statistical methods to help them make sense of the numbers they collect when conducting research The best way of understanding stats is to do the procedures by hand for a while
3 Two Branches of Statistical Methods Descriptive statistics Summarize/organize scores from a research study Inferential statistics Draw conclusions/make inferences that go beyond the scores from a research study
4 Basic Concepts Variable A characteristic that can have different values; a characteristics that can vary Value A possible number or category that a score can have Score A particular person s value on a variable
5 Basic Concepts Research: Suppose that I am interested in your stress level during the last 2,5 weeks On a scale of 0 to 10 Variable? Values? Score?
6 Example Variable: Age Value: Any positive number A 20 year old has a score of 20 Thus, this person s score of 20 is one of many possible values of age Your examples?
7 Levels of measurement The scores are numbers that tell you how much there is of what is being measured 0-10 rating for stress What do the numbers correspond? 0 = never; 10 = always The higher the number, the more stress there is 0 = always; 10 = never The higher the number, the less stress
8 Levels of Measurement A) Numeric (quantitative) variable 1) Equal-interval variable: A variable in which the numbers stand for approximately equal amounts of what is being measured Eg. GPA Difference b/w means about as much as the difference b/w Eg stress ratings Difference b/w 4 and 6 means about as much as the difference b/w 7 and 9
9 Levels of Measurement 1) Equal-interval variable (Ex.: GPA) 1a) Ratio scale Some equal-interval variables are measured on what is called a ratio scale An equal-interval variable is measured on a ratio scale if it has an absolute zero point. Most counts or accumulations of things use a ratio scale Eg. Number of children For these variables, one can make statements a/ the difference in magnitude b/w values Eg. A person w/ 4 siblings has twice as many siblings as a person w/ 2 siblings. Other examples: distance, time and weight
10 Levels of Measurement A) Numeric (quantitative) variable 2) Rank-order (ordinal) variables A variable in which the numbers stand only for relative ranking Other name: Ordinal (sıra gösteren) E.g., A student s standing in his/her graduating class A rank-order variable provides less info than an equal-interval variable The difference from one rank to the next doesn t tell the exact difference in amount of what is being measured ADV.: When rating how much you like your friends from 0-10, you can give same scores for several friends. However if you rank order them; this is avoided
11 Levels of Measurement B) Nominal (categorical) variables Not a numeric variable at all. A variable in which the values are names or categories Values are categories; so its other name is categorical variable Eg. Gender Values: male and female A person s score on the gender variable is one of these values Eg. Psychiatric diagnosis A person s score on the Psychiatric diagnosis variable could be any diagnosis such as major depression, PTSD, schizophrenia, OCD
12 The Characteristics of the Scores
13 Types of Data Broadly speaking, there are two types of data 1) Nominal and 2) Numerical or score Nominal variables are those in which a case falls into one of two or more categories Gender, eye colour, socio-economic status, nationality etc. Nominal variables are also referred to as categorical or qualitative variables
14 Types of Data Numerical variables are those in which a case is assigned a numerical value Age, height, weight, IQ, test scores, income, distance or temperature Numerical variables are also referred to as score or quantitative variables
15 Slide 2.45 Nominal or Numerical? Which type of data are each of the following? Facebook user (i.e. yes or no) Use of Facebook (i.e. hours per day) Network (i.e. number of friends on Facebook) How do you access Facebook (i.e. mobile phone, PC or laptop) Use of Facebook (i.e. Less than five hours per day or at least five hours per day) Howitt and Cramer, Introduction to Statistics in Psychology, 5th Edition and Introduction to SPSS Statistics in Psychology, 5th Edition Pearson Education Limited 2011
16 Measurement Scales A nominal scale does not indicate an amount; rather, it is used for identification, as a name. An ordinal scale indicates rank order. There is not an equal unit of measurement separating each score.
17 Measurement Scales (cont d) An interval scale indicates an actual quantity and there is an equal unit of measurement separating adjacent scores. Interval scales do not have a true 0. A ratio scale reflects the true amount of the variable that is present because the scores measure an actual amount, there is an equal unit of measurement, and 0 truly means that zero amount of the variable is present.
18 Summary of Measurement Scales

19 Slide 2.49 Measurement Characteristics Figure 1.1 The different scales of measurement and their main characteristics Howitt and Cramer, Introduction to Statistics in Psychology, 5th Edition and Introduction to SPSS Statistics in Psychology, 5th Edition Pearson Education Limited 2011
20 Classify the variables in the study as either a score variable or a nominal (category) variable. A forensic psychologist is interested in the relationship between geographical factors and criminal victimization. Information is collected from a substantial sample of participants on the following variables. Gender 1 = female; 2 = male Age recorded as years Marital status 1 = married; 2 = divorced; 3 = separated; 4 = other Social class 1 = working class; 2 = middle class; 3 = upper middle class; 4 = unemployed Number of adults (18+) in the household number of adults Number of children in the household number of children
21 Classify the variables in the study as either a score variable or a nominal (category) variable. Geographical location 1 = inner city council accommodation; 2 = inner city private rented accommodation; 3 = inner city owner occupied; 4 = suburban council accommodation; 5 = suburban private rented accommodation; 6 = suburban owner occupied; 7 = rural council accommodation; 8 = rural private rented accommodation; 9 = rural owner occupied Number of times victimized in last year number of times Number of times victimized by burglary in last year number of times Number of times victimized by sexual offences in last year number of times Number of victimizations reported to the police in last year number of times Whether respondent charged with any offences in last year Yes = 1; No = 2
22 Classify the variables in the study as either a score variable or a nominal (category) variable. Type of prison 1=secure; 2=open Offence type 1 = violent; 2 = sexual; 3 = property; 4 = mixed Offender's age on leaving prison in years Length of current sentence before release in years Whether on any educational programme 1 = yes; 2 = no Whether on any treatment programme 1 = yes; 2 = no Offender expresses regret at offending 1 = yes; 2 = no Offender was a lone offender 1 = lone offender; 2 = with others Whether or not re-convicted for same type of offence (sexual, violent or property) within five years of release 1 = yes; 2 = no
23 Classify the variables in the study as either a score variable or a nominal (category) variable. Number of years before being re-convicted during 5 years following release for a violent crime 5 years indicates that offender was not re-convicted during study period Number of times imprisoned prior to current sentence number reported Total amount of time imprisoned prior to current sentence in years Total number of times ever arrested number of times Offender has job on leaving prison 1 = yes; 2 = no Anxiety score on psychological test on entering prison the higher the score the more anxious Anxiety score on psychological test shortly before release the higher the score the more anxious Intelligence in IQ points the higher the number the more intelligent the offender
24 Levels of Measurement Why to care about these types of variables? The level of measurement selected affects the type of statistics that can be used w/ a variable
25 Discrete Variables vs. Continuous Variables Discrete variables have specific values and cannot have values between these specific values Eg. The number of times you went to dentist in the last 12 months Answer could be 0,1,2,3 but cannot be 1.65 times Nominal variables can also be considered as discrete variables Eg. Gender, religious affiliation, college major (department)
26 Discrete Variables vs. Continuous Variables Continuous variables can, in theory, have an infinite number of values between any two values Eg. Age 19 years old 19,25 years old Other examples: height, weight and time.

27 FREQUENCY DISTRIBUTIONS AND PERCENTILES
28 Frequency Tables Provide a listing of individuals having each of the different values for a particular variable. Frequency table gives the number of people who used each particular rating. Eg. Stress ratings of 30 students: 8,7,4,10,8,6,8,9,9,7,3,7,6,5,0,9,10,7,7, 3,6,7,5,2,1,6,7,10,8,8
29 Steps for Making a Frequency Table 1.Make a list down the page of each possible value, from lowest to highest 2.Go one by one through the scores, making a mark for each next to its value on the list 3.Make a table showing how many times each value on the list is used 4.Figure the percentage of scores for each value

30 A Frequency Table
31 Uses of Frequency Tables Describes the data Makes the pattern of the data clear Which numbers are given more and which are given less Shows how many scores there were for each value on the scale
32 Grouped Frequency Tables Sometimes there are so many possible values that an ordinary frequency table is too awkward to give a simple picture of the scores Solution? Make combined categories Combined category = interval (aralık) A grouped frequency table is a frequency table using intervals based on values.
33 Grouped Frequency Tables Eg. Lets make Table 1-3 (on previous slides) as a grouped frequency table The intervals will be like 0-1, 2-3, 4-5, 6-7, 8-9, Stress rating interval Frequency Percent
34 Grouped Distributions Grouped distribution: scores are combined to form small groups we report the total f, rel. f, or cf of each group
35 A Grouped Distribution

36 An Example: Grouped Frequency Distribution Record the limits of all class intervals, placing the interval containing the highest score value at the top. Count up the number of scores in each interval. Hotel Rates Frequency Las Vegas Hotel Rates
37 Frequency Table Guidelines Intervals should not overlap, so no score can belong to more than one interval. Make all intervals the same width. Make the intervals continuous throughout the distribution (even if an interval is empty). Choose a convenient interval width. Hotel Rates Frequency
38 An Example: Grouped Frequency Distribution Proportion (Relative Frequency) Divide frequency of each class by total frequency. Hotel Rates Frequency Proportion N =
39 An Example: Grouped Frequency Percentage Proportion *100 Distribution Hotel Rates Frequency Proportion Percent
40 An Example: Grouped Frequency Distribution Cumulative Frequency Shows total number of observations in each class and all lower classes. Hotel Rates Frequency Proportion Percent Cumulative Frequency

41 An Example: Grouped Frequency Distribution Cumulative Proportion (Cumulative Relative Frequency): Divide Cumulative Frequency by Total Frequency Percentile Rank Cumulative Proportion * 100 Hotel Rates Frequency Proportion Percent Cumulative Frequency Cumulative Proportion Percentile
42 SUMMARY OF THE FORMULAS Proportion/Relative Frequency: f/total Frequency Percentage: Proportion/Relative Frequency*100 Cumulative Proportion/Cumulative Relative Frequency: Cumulative Frequency/Total Frequency Percentile Rank: Cumulative Proportion/Cumulative Relative Frequency*100
43 Histogram A graph is a good way to understand a large group of numbers Histogram is a barlike graph of a frequency distribution in which the values are plotted along the horizontal axis and the height of each bar is the frequency of that value The bars are usually placed next to each other w/out spaces, giving the appearance of a city skyline
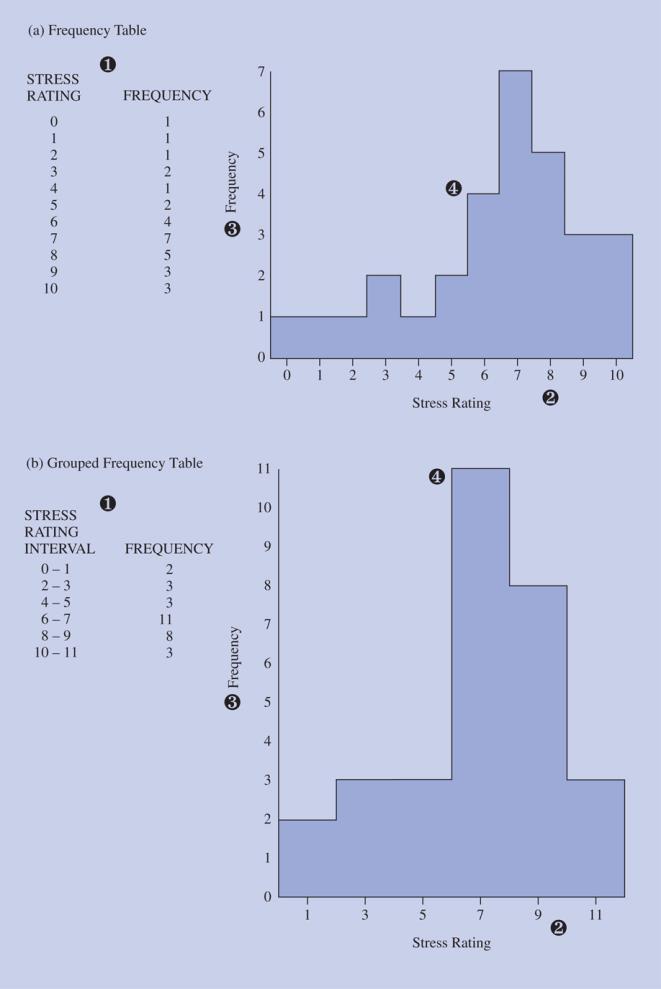
44 Histogram
45 Histogram Steps to make a histogram Make a frequency table Put the values along the bottom of the page, from left to right, from lowest to highest Make a scale of frequencies along the left edge of the page that goes from 0 at the bottom to the highest frequency for any value Make a bar above each value with a height for the frequency of that value
46 Histogram Instead of histogram, a bar chart would be used to display nominal data Since the values of a nominal variable are not in any particular order, space is left between bars.

47 Slide 3.9 Example of a Pie Chart Figure 2.3 A poor pie diagram Howitt and Cramer, Introduction to Statistics in Psychology, 5th Edition and Introduction to SPSS Statistics in Psychology, 5th Edition Pearson Education Limited 2011
48 Slide 3.10 Example of a Bar Chart What this variable might be? Figure 2.4 Bar chart showing occupational categories in Table 2.1 Howitt and Cramer, Introduction to Statistics in Psychology, 5th Edition and Introduction to SPSS Statistics in Psychology, 5th Edition Pearson Education Limited 2011

49 Slide 3.11 Describe the below data with a frequency table Howitt and Cramer, Introduction to Statistics in Psychology, 5th Edition and Introduction to SPSS Statistics in Psychology, 5th Edition Pearson Education Limited 2011
50 Slide 3.13 A Forced Choice Variable I like statistics. 1) Strongly agree. 2) Agree. 3) Not sure. 4) Disagree. 5) Strongly disagree. Howitt and Cramer, Introduction to Statistics in Psychology, 5th Edition and Introduction to SPSS Statistics in Psychology, 5th Edition Pearson Education Limited 2011
51 Slide 3.14 Frequency Table: I like statistics... Response Value Frequency Percentage (%) Strongly agree Agree Notsure Disagree Strongly disagree Howitt and Cramer, Introduction to Statistics in Psychology, 5th Edition and Introduction to SPSS Statistics in Psychology, 5th Edition Pearson Education Limited 2011

52 Slide 3.15 Example of a Histogram Figure 2.5 Histogram of students attitudes towards statistics Howitt and Cramer, Introduction to Statistics in Psychology, 5th Edition and Introduction to SPSS Statistics in Psychology, 5th Edition Pearson Education Limited 2011

53 Slide 3.16 Example of a Bar Chart Figure 2.5Bar chart of number of hours spend with children as a function of time of the day and gender Howitt and Cramer, Introduction to Statistics in Psychology, 5th Edition and Introduction to SPSS Statistics in Psychology, 5th Edition Pearson Education Limited 2011

54 Slide 3.17 Example of a Line Diagram Bar chart of number of hours spend with children in a family as a function of time of the day and gender Howitt and Cramer, Introduction to Statistics in Psychology, 5th Edition and Introduction to SPSS Statistics in Psychology, 5th Edition Pearson Education Limited 2011
55 Shapes of Frequency Distributions -1 A frequency distribution shows the pattern of frequencies over the various values A frequency table or histogram shows how the frequencies are spread out or distributed

56 Shapes of Frequency Distributions -1 Unimodal, bimodal, and rectangular
57 Shapes of Frequency Distributions -1 If a distribution s shape has only one main high point: one height tower on the histogram This is unimodal distribution If a distribution has two fairly equal high points It is a bimodal distribution Any distribution which has two or more high points is multimodal distribution A distribution w/ values of all about the same frequency is rectangular distribution


58 Shapes of Frequency Distributions -1 Frequency polygons The height of each point shows the number of scores w/ that value

59 Shapes of Frequency Distributions -2 Symmetrical and skewed distributions
60 Shapes of Frequency Distributions -2 Symmetrical and skewed distributions The distributions can be lopsided (orantısız, bir yana eğik). More scores can be near the high or low end => SKEWED DISTRIBUTION If equal numbers are placed about equal numbers on both sides of the middle => SYMMETRICAL DISTRIBUTION
61 Shapes of Frequency Distributions -2 Skewed distributions are not symmetrical Tail shows the direction of the skew Tail is the side of the distribution w/ fewer scores
62 Shapes of Frequency Distributions -2 A skewed distribution caused by a lower limit => Floor effect A skewed distribution caused by an upper limit => Ceiling effect
63 Shapes of Frequency Distributions -3 Normal and kurtotic distributions
64 Shapes of Frequency Distributions -3 Normal and kurtotic distributions We describe a distribution in terms of whether the middle of the distribution is particularly peaked or flat The standard of comparison is a bellshaped curve NORMAL CURVE Normal curve is unimodal, symmetrical curve w/ an average peak- the sort of bell-shaped
65 Shapes of Frequency Distributions -3 Kurtosis is how much a shape of a distribution differs from a normal curve in terms of whether its curve in the middle is more peaked or flat than the normal curve (DeCarlo, 1997).
66 Shapes of Frequency Distributions -3 A) normal curve B) heavy-tailed distribution C) light-tailed distribution
67 Exercise 1 The following data are representing answers of 20 participants to the question I feel I am being paid a fair amount for the work I do. Responses were coded as following 1- Completely agree. 2-Somewhat agree. 3-Neither agree nor disagree. 4- Somewhat disagree 5-Completely disagree Draw a frequency table for each response category. 2, 1, 2, 1, 1, 5, 5, 4, 5, 1, 5, 3, 4, 4, 4, 1, 2, 5, 2, 4,
68 Exercise 2 A particular block in a suburban neigborhood has 20 households The number of children in these households are as follows: 2, 4, 2, 1, 0, 3, 6, 0, 1, 1, 2, 3, 2, 0, 1, 2, 1, 0, 2, 2 Make a f table including relative frequency, percentage, cumulative frequency, cumulative proportion, percentile A histogram Describe the general shape of the distribution
69 Exercise 3 Following are the speeds of 40 carsclocked by radar on a particular road in a 35-mph zone on Sunday afternoon: 30,36,42,36,30,52,36,34,36,33,30,32,35,32,37,3 4,36,31,35,20,24,46,23,31,32,45,34,37,28,40,34,38,40,52,31,33,15,27,36,40 Make a f table including relative frequency, percentage, cumulative frequency, cumulative proportion, percentile A histogram Describe the general shape of the distribution
70 Exercise 4 These are the scores on a measure of sensitivity to smell taken by 25 chefs attending a national conference: 96,83,59,64,73,74,80,68,87,67,64,92,76,71,68,5 0,85,75,81,70,76,91,69,83,75 Make a f table including relative frequency, percentage, cumulative frequency, cumulative proportion, percentile A histogram Describe the general shape of the distribution
71 Exercise 5 The following data are the number of minutes it took each of year-olds to do a series of abstract puzzles: 24,83,36,22,81,39,60,62,38,66,38,36,45,20,20,6 7,41,87,41,82,35,82,28,80,80,68,40,27,43,80,31,89,83,24 Make a f table including relative frequency, percentage, cumulative frequency, cumulative proportion, percentile A histogram Describe the general shape of the distribution
72 Slide 3.2 Overview You have collected data. Conducted statistical analyses. Now what? You a need to effectively communicate the key characteristics of your data You have to communicate results in the simplest and the most effective way Graphically description of data Tables, graphs or charts Howitt and Cramer, Introduction to Statistics in Psychology, 5th Edition and Introduction to SPSS Statistics in Psychology, 5th Edition Pearson Education Limited 2011
73 Slide 3.3 What is variable Review of Key Concepts Variable is something which varies What is nominal variable Nominal variables are those where cases are placed into groups (e.g. gender, eye colour) What is score variable Score variables are those in which cases are given a numerical value (e.g. age, income) What are the types of score variable Ordinal, interval and ratio Howitt and Cramer, Introduction to Statistics in Psychology, 5th Edition and Introduction to SPSS Statistics in Psychology, 5th Edition Pearson Education Limited 2011
74 Slide 3.4 What is raw data Review of Key Concepts Raw data are the actual measures taken from the sample What is descriptive statistics Descriptive statistics are visual and numerical techniques for presenting the major features of one s raw data Howitt and Cramer, Introduction to Statistics in Psychology, 5th Edition and Introduction to SPSS Statistics in Psychology, 5th Edition Pearson Education Limited 2011
75 Slide 3.5 How to Present Nominal Variables? The aim is to display the number of cases which fall into each category Frequency table different groups are presented with the number and percentage in each category Pie chart It shows the relative size of each group based on percentages Bar chart A bar chart represents the size of groups based on the height of bars on a graph Howitt and Cramer, Introduction to Statistics in Psychology, 5th Edition and Introduction to SPSS Statistics in Psychology, 5th Edition Pearson Education Limited 2011
76 Slide 3.6 A Forced Choice Variable Where do you live? Please choose one of the options below. 1) I live in public dormitory. 2) I live in private dormitory. 3) I rented a house. 4) I am leaving with my family. Howitt and Cramer, Introduction to Statistics in Psychology, 5th Edition and Introduction to SPSS Statistics in Psychology, 5th Edition Pearson Education Limited 2011
77 Slide 3.7 Frequency Table: Student Accommodation Category Frequency Percentage (%) PublicDormitory PrivateDormitory Homerental Family Total Howitt and Cramer, Introduction to Statistics in Psychology, 5th Edition and Introduction to SPSS Statistics in Psychology, 5th Edition Pearson Education Limited 2011
78 Slide 3.8 An open-ended variable What is the diagnosis of the patient? Howitt and Cramer, Introduction to Statistics in Psychology, 5th Edition and Introduction to SPSS Statistics in Psychology, 5th Edition Pearson Education Limited 2011
79 Slide 3.19 Errors to Avoid There are some key points that you must keep in mind when presenting your data using tables, charts or graphs: 1.Make sure that you provide clear headings that succinctly describe the contents 2.Clearly label all the key elements 3.Make the diagrams as simple as possible 4.Check with other people that they can understand the diagrams and that they convey the key messages as intended Howitt and Cramer, Introduction to Statistics in Psychology, 5th Edition and Introduction to SPSS Statistics in Psychology, 5th Edition Pearson Education Limited 2011
80 End of Chapter 1
Stats 95. Statistical analysis without compelling presentation is annoying at best and catastrophic at worst. From raw numbers to meaningful pictures
 Stats 95 Statistical analysis without compelling presentation is annoying at best and catastrophic at worst. From raw numbers to meaningful pictures Stats 95 Why Stats? 200 countries over 200 years http://www.youtube.com/watch?v=jbksrlysojo
Chapter 1: Introduction to Statistics
 Chapter 1: Introduction to Statistics Variables A variable is a characteristic or condition that can change or take on different values. Most research begins with a general question about the relationship
AP Psych - Stat 1 Name Period Date. MULTIPLE CHOICE. Choose the one alternative that best completes the statement or answers the question.
 AP Psych - Stat 1 Name Period Date MULTIPLE CHOICE. Choose the one alternative that best completes the statement or answers the question. 1) In a set of incomes in which most people are in the $15,000
CHAPTER 2. MEASURING AND DESCRIBING VARIABLES
 4 Chapter 2 CHAPTER 2. MEASURING AND DESCRIBING VARIABLES 1. A. Age: name/interval; military dictatorship: value/nominal; strongly oppose: value/ ordinal; election year: name/interval; 62 percent: value/interval;
Undertaking statistical analysis of
 Descriptive statistics: Simply telling a story Laura Delaney introduces the principles of descriptive statistical analysis and presents an overview of the various ways in which data can be presented by
Lesson 9 Presentation and Display of Quantitative Data
 Lesson 9 Presentation and Display of Quantitative Data Learning Objectives All students will identify and present data using appropriate graphs, charts and tables. All students should be able to justify
Chapter 7: Descriptive Statistics
 Chapter Overview Chapter 7 provides an introduction to basic strategies for describing groups statistically. Statistical concepts around normal distributions are discussed. The statistical procedures of
Frequency distributions
 Applied Biostatistics distributions Martin Bland Professor of Health Statistics University of York http://www-users.york.ac.uk/~mb55/ Types of data Qualitative data arise when individuals may fall into
Chapter 2: The Organization and Graphic Presentation of Data Test Bank
 Essentials of Social Statistics for a Diverse Society 3rd Edition Leon Guerrero Test Bank Full Download: https://testbanklive.com/download/essentials-of-social-statistics-for-a-diverse-society-3rd-edition-leon-guerrero-tes
AP Psych - Stat 2 Name Period Date. MULTIPLE CHOICE. Choose the one alternative that best completes the statement or answers the question.
 AP Psych - Stat 2 Name Period Date MULTIPLE CHOICE. Choose the one alternative that best completes the statement or answers the question. 1) In a set of incomes in which most people are in the $15,000
Probability and Statistics. Chapter 1
 Probability and Statistics Chapter 1 Individuals and Variables Individuals and Variables Individuals are objects described by data. Individuals and Variables Individuals are objects described by data.
On the purpose of testing:
 Why Evaluation & Assessment is Important Feedback to students Feedback to teachers Information to parents Information for selection and certification Information for accountability Incentives to increase
Unit 7 Comparisons and Relationships
 Unit 7 Comparisons and Relationships Objectives: To understand the distinction between making a comparison and describing a relationship To select appropriate graphical displays for making comparisons
Statistics for Psychology
 Statistics for Psychology SIXTH EDITION CHAPTER 3 Some Key Ingredients for Inferential Statistics Some Key Ingredients for Inferential Statistics Psychologists conduct research to test a theoretical principle
STP226 Brief Class Notes Instructor: Ela Jackiewicz
 CHAPTER 2 Organizing Data Statistics=science of analyzing data. Information collected (data) is gathered in terms of variables (characteristics of a subject that can be assigned a numerical value or nonnumerical
Statistics. Nur Hidayanto PSP English Education Dept. SStatistics/Nur Hidayanto PSP/PBI
 Statistics Nur Hidayanto PSP English Education Dept. RESEARCH STATISTICS WHAT S THE RELATIONSHIP? RESEARCH RESEARCH positivistic Prepositivistic Postpositivistic Data Initial Observation (research Question)
Organizing Data. Types of Distributions. Uniform distribution All ranges or categories have nearly the same value a.k.a. rectangular distribution
 Organizing Data Frequency How many of the data are in a category or range Just count up how many there are Notation x = number in one category n = total number in sample (all categories combined) Relative
Biostatistics. Donna Kritz-Silverstein, Ph.D. Professor Department of Family & Preventive Medicine University of California, San Diego
 Biostatistics Donna Kritz-Silverstein, Ph.D. Professor Department of Family & Preventive Medicine University of California, San Diego (858) 534-1818 dsilverstein@ucsd.edu Introduction Overview of statistical
Results & Statistics: Description and Correlation. I. Scales of Measurement A Review
 Results & Statistics: Description and Correlation The description and presentation of results involves a number of topics. These include scales of measurement, descriptive statistics used to summarize
q2_2 MULTIPLE CHOICE. Choose the one alternative that best completes the statement or answers the question.
 q2_2 MULTIPLE CHOICE. Choose the one alternative that best completes the statement or answers the question. A sporting goods retailer conducted a customer survey to determine its customers primary reason
Chapter 2--Norms and Basic Statistics for Testing
 Chapter 2--Norms and Basic Statistics for Testing Student: 1. Statistical procedures that summarize and describe a series of observations are called A. inferential statistics. B. descriptive statistics.
Statistics is the science of collecting, organizing, presenting, analyzing, and interpreting data to assist in making effective decisions
 Readings: OpenStax Textbook - Chapters 1 5 (online) Appendix D & E (online) Plous - Chapters 1, 5, 6, 13 (online) Introductory comments Describe how familiarity with statistical methods can - be associated
Still important ideas
 Readings: OpenStax - Chapters 1 11 + 13 & Appendix D & E (online) Plous - Chapters 2, 3, and 4 Chapter 2: Cognitive Dissonance, Chapter 3: Memory and Hindsight Bias, Chapter 4: Context Dependence Still
2.4.1 STA-O Assessment 2
 2.4.1 STA-O Assessment 2 Work all the problems and determine the correct answers. When you have completed the assessment, open the Assessment 2 activity and input your responses into the online grading
Business Statistics Probability
 Business Statistics The following was provided by Dr. Suzanne Delaney, and is a comprehensive review of Business Statistics. The workshop instructor will provide relevant examples during the Skills Assessment
Descriptive Statistics Lecture
 Definitions: Lecture Psychology 280 Orange Coast College 2/1/2006 Statistics have been defined as a collection of methods for planning experiments, obtaining data, and then analyzing, interpreting and
Statistics is the science of collecting, organizing, presenting, analyzing, and interpreting data to assist in making effective decisions
 Readings: OpenStax Textbook - Chapters 1 5 (online) Appendix D & E (online) Plous - Chapters 1, 5, 6, 13 (online) Introductory comments Describe how familiarity with statistical methods can - be associated
Chapter 2 Norms and Basic Statistics for Testing MULTIPLE CHOICE
 Chapter 2 Norms and Basic Statistics for Testing MULTIPLE CHOICE 1. When you assert that it is improbable that the mean intelligence test score of a particular group is 100, you are using. a. descriptive
Describe what is meant by a placebo Contrast the double-blind procedure with the single-blind procedure Review the structure for organizing a memo
 Please note the page numbers listed for the Lind book may vary by a page or two depending on which version of the textbook you have. Readings: Lind 1 11 (with emphasis on chapters 10, 11) Please note chapter
Unit 1 Exploring and Understanding Data
 Unit 1 Exploring and Understanding Data Area Principle Bar Chart Boxplot Conditional Distribution Dotplot Empirical Rule Five Number Summary Frequency Distribution Frequency Polygon Histogram Interquartile
Still important ideas
 Readings: OpenStax - Chapters 1 13 & Appendix D & E (online) Plous Chapters 17 & 18 - Chapter 17: Social Influences - Chapter 18: Group Judgments and Decisions Still important ideas Contrast the measurement
CHAPTER 3 DATA ANALYSIS: DESCRIBING DATA
 Data Analysis: Describing Data CHAPTER 3 DATA ANALYSIS: DESCRIBING DATA In the analysis process, the researcher tries to evaluate the data collected both from written documents and from other sources such
Chapter 1. Picturing Distributions with Graphs
 Chapter 1 Picturing Distributions with Graphs Statistics Statistics is a science that involves the extraction of information from numerical data obtained during an experiment or from a sample. It involves
Lecture (chapter 1): Introduction
: Introduction") Lecture (chapter 1): Introduction Ernesto F. L. Amaral January 17, 2018 Advanced Methods of Social Research (SOCI 420) Source: Healey, Joseph F. 2015. Statistics: A Tool for Social Research. Stamford:
Lecture (chapter 1): Introduction Ernesto F. L. Amaral January 17, 2018 Advanced Methods of Social Research (SOCI 420) Source: Healey, Joseph F. 2015. Statistics: A Tool for Social Research. Stamford:
MBA 605 Business Analytics Don Conant, PhD. GETTING TO THE STANDARD NORMAL DISTRIBUTION
 MBA 605 Business Analytics Don Conant, PhD. GETTING TO THE STANDARD NORMAL DISTRIBUTION Variables In the social sciences data are the observed and/or measured characteristics of individuals and groups
Appendix B Statistical Methods
 Appendix B Statistical Methods Figure B. Graphing data. (a) The raw data are tallied into a frequency distribution. (b) The same data are portrayed in a bar graph called a histogram. (c) A frequency polygon
STA Module 9 Confidence Intervals for One Population Mean
 STA 2023 Module 9 Confidence Intervals for One Population Mean Learning Objectives Upon completing this module, you should be able to: 1. Obtain a point estimate for a population mean. 2. Find and interpret
LOTS of NEW stuff right away 2. The book has calculator commands 3. About 90% of technology by week 5
 1.1 1. LOTS of NEW stuff right away 2. The book has calculator commands 3. About 90% of technology by week 5 1 Three adventurers are in a hot air balloon. Soon, they find themselves lost in a canyon in
Medical Statistics 1. Basic Concepts Farhad Pishgar. Defining the data. Alive after 6 months?
 Medical Statistics 1 Basic Concepts Farhad Pishgar Defining the data Population and samples Except when a full census is taken, we collect data on a sample from a much larger group called the population.
Chapter 1: Exploring Data
 Chapter 1: Exploring Data Key Vocabulary:! individual! variable! frequency table! relative frequency table! distribution! pie chart! bar graph! two-way table! marginal distributions! conditional distributions!
V. Gathering and Exploring Data
 V. Gathering and Exploring Data With the language of probability in our vocabulary, we re now ready to talk about sampling and analyzing data. Data Analysis We can divide statistical methods into roughly
Outline. Practice. Confounding Variables. Discuss. Observational Studies vs Experiments. Observational Studies vs Experiments
 1 2 Outline Finish sampling slides from Tuesday. Study design what do you do with the subjects/units once you select them? (OI Sections 1.4-1.5) Observational studies vs. experiments Descriptive statistics
Population. Sample. AP Statistics Notes for Chapter 1 Section 1.0 Making Sense of Data. Statistics: Data Analysis:
 Section 1.0 Making Sense of Data Statistics: Data Analysis: Individuals objects described by a set of data Variable any characteristic of an individual Categorical Variable places an individual into one
Nature of measurement
 Nature of measurement Lecturer: Dr. Emmanuel Adjei; Department of Information Studies Contact Information: eadjei@ug.edu.gh College of Education School of Continuing and Distance Education 2014/2015 2016/2017
Test Bank for Privitera, Statistics for the Behavioral Sciences
 1. The use of tables and graphs to summarize data is an example of A) inferential statistics B) interpretation C) descriptive statistics D) generalization 2. Statistical analysis allows researchers to
Data, frequencies, and distributions. Martin Bland. Types of data. Types of data. Clinical Biostatistics
 Clinical Biostatistics Data, frequencies, and distributions Martin Bland Professor of Health Statistics University of York http://martinbland.co.uk/ Types of data Qualitative data arise when individuals
WDHS Curriculum Map Probability and Statistics. What is Statistics and how does it relate to you?
 WDHS Curriculum Map Probability and Statistics Time Interval/ Unit 1: Introduction to Statistics 1.1-1.3 2 weeks S-IC-1: Understand statistics as a process for making inferences about population parameters
Summarizing Data. (Ch 1.1, 1.3, , 2.4.3, 2.5)
") 1 Summarizing Data (Ch 1.1, 1.3, 1.10-1.13, 2.4.3, 2.5) Populations and Samples An investigation of some characteristic of a population of interest. Example: You want to study the average GPA of juniors
1 Summarizing Data (Ch 1.1, 1.3, 1.10-1.13, 2.4.3, 2.5) Populations and Samples An investigation of some characteristic of a population of interest. Example: You want to study the average GPA of juniors
QMS102- Business Statistics I Chapter1and 3
 1. Techniques used to organize, summarize and present data that have been collected are called A. descriptive statistics B. inferential statistics C. Sample D. population 2. The collection of all possible
Readings: Textbook readings: OpenStax - Chapters 1 11 Online readings: Appendix D, E & F Plous Chapters 10, 11, 12 and 14
 Readings: Textbook readings: OpenStax - Chapters 1 11 Online readings: Appendix D, E & F Plous Chapters 10, 11, 12 and 14 Still important ideas Contrast the measurement of observable actions (and/or characteristics)
Application of Medical Statistics. E.M.S. Bandara Dep. of Medical Lab. Sciences
 Application of Medical Statistics E.M.S. Bandara Dep. of Medical Lab. Sciences What is Statistics? The discipline concerned with the treatment of numerical data derived from groups of individuals (P. Armitage).
Describe what is meant by a placebo Contrast the double-blind procedure with the single-blind procedure Review the structure for organizing a memo
 Business Statistics The following was provided by Dr. Suzanne Delaney, and is a comprehensive review of Business Statistics. The workshop instructor will provide relevant examples during the Skills Assessment
Readings: Textbook readings: OpenStax - Chapters 1 13 (emphasis on Chapter 12) Online readings: Appendix D, E & F
 Online readings: Appendix D, E & F") Readings: Textbook readings: OpenStax - Chapters 1 13 (emphasis on Chapter 12) Online readings: Appendix D, E & F Plous Chapters 17 & 18 Chapter 17: Social Influences Chapter 18: Group Judgments and Decisions
Readings: Textbook readings: OpenStax - Chapters 1 13 (emphasis on Chapter 12) Online readings: Appendix D, E & F Plous Chapters 17 & 18 Chapter 17: Social Influences Chapter 18: Group Judgments and Decisions
Statistics Guide. Prepared by: Amanda J. Rockinson- Szapkiw, Ed.D.
 This guide contains a summary of the statistical terms and procedures. This guide can be used as a reference for course work and the dissertation process. However, it is recommended that you refer to statistical
NORTH SOUTH UNIVERSITY TUTORIAL 1
 NORTH SOUTH UNIVERSITY TUTORIAL 1 REVIEW FROM BIOSTATISTICS I AHMED HOSSAIN,PhD Data Management and Analysis AHMED HOSSAIN,PhD - Data Management and Analysis 1 DATA TYPES/ MEASUREMENT SCALES Categorical:
Homework Exercises for PSYC 3330: Statistics for the Behavioral Sciences
 Homework Exercises for PSYC 3330: Statistics for the Behavioral Sciences compiled and edited by Thomas J. Faulkenberry, Ph.D. Department of Psychological Sciences Tarleton State University Version: July
Welcome to OSA Training Statistics Part II
 Welcome to OSA Training Statistics Part II Course Summary Using data about a population to draw graphs Frequency distribution and variability within populations Bell Curves: What are they and where do
Slide 1 - Introduction to Statistics Tutorial: An Overview Slide notes
 Slide 1 - Introduction to Statistics Tutorial: An Overview Introduction to Statistics Tutorial: An Overview. This tutorial is the first in a series of several tutorials that introduce probability and statistics.
9 research designs likely for PSYC 2100
 9 research designs likely for PSYC 2100 1) 1 factor, 2 levels, 1 group (one group gets both treatment levels) related samples t-test (compare means of 2 levels only) 2) 1 factor, 2 levels, 2 groups (one
Describe what is meant by a placebo Contrast the double-blind procedure with the single-blind procedure Review the structure for organizing a memo
 Please note the page numbers listed for the Lind book may vary by a page or two depending on which version of the textbook you have. Readings: Lind 1 11 (with emphasis on chapters 5, 6, 7, 8, 9 10 & 11)
Two Branches Of Statistics
 Stats 95 Two Branches Of Statistics Descriptive Organize Summarize Communicate a body of observed data Describe a Population or a Sample Inferential Using sample data to make estimates of the rest of the
Lecture Outline. Biost 517 Applied Biostatistics I. Purpose of Descriptive Statistics. Purpose of Descriptive Statistics
 Biost 517 Applied Biostatistics I Scott S. Emerson, M.D., Ph.D. Professor of Biostatistics University of Washington Lecture 3: Overview of Descriptive Statistics October 3, 2005 Lecture Outline Purpose
Quantitative Methods in Computing Education Research (A brief overview tips and techniques)
") Quantitative Methods in Computing Education Research (A brief overview tips and techniques) Dr Judy Sheard Senior Lecturer Co-Director, Computing Education Research Group Monash University judy.sheard@monash.edu
Quantitative Methods in Computing Education Research (A brief overview tips and techniques) Dr Judy Sheard Senior Lecturer Co-Director, Computing Education Research Group Monash University judy.sheard@monash.edu
Readings: Textbook readings: OpenStax - Chapters 1 4 Online readings: Appendix D, E & F Online readings: Plous - Chapters 1, 5, 6, 13
 Readings: Textbook readings: OpenStax - Chapters 1 4 Online readings: Appendix D, E & F Online readings: Plous - Chapters 1, 5, 6, 13 Introductory comments Describe how familiarity with statistical methods
Previously, when making inferences about the population mean,, we were assuming the following simple conditions:
 Chapter 17 Inference about a Population Mean Conditions for inference Previously, when making inferences about the population mean,, we were assuming the following simple conditions: (1) Our data (observations)
Quantitative Data and Measurement. POLI 205 Doing Research in Politics. Fall 2015
 Quantitative Fall 2015 Theory and We need to test our theories with empirical data Inference : Systematic observation and representation of concepts Quantitative: measures are numeric Qualitative: measures
Chapter 23. Inference About Means. Copyright 2010 Pearson Education, Inc.
 Chapter 23 Inference About Means Copyright 2010 Pearson Education, Inc. Getting Started Now that we know how to create confidence intervals and test hypotheses about proportions, it d be nice to be able
Introduction to biostatistics & Levels of measurement
 Introduction to biostatistics & Levels of measurement Objectives: Definition of statistics and biostatistics To understand different Levels of measurements To understand different Types of data To use
full file at
 Chapter 01 What Is Statistics? True / False Questions 1. A population is a collection of all individuals, objects, or measurements of interest. True False 2. Statistics are used as a basis for making decisions.
STATISTICS AND RESEARCH DESIGN
 Statistics 1 STATISTICS AND RESEARCH DESIGN These are subjects that are frequently confused. Both subjects often evoke student anxiety and avoidance. To further complicate matters, both areas appear have
Psychology Research Process
 Psychology Research Process Logical Processes Induction Observation/Association/Using Correlation Trying to assess, through observation of a large group/sample, what is associated with what? Examples:
STT315 Chapter 2: Methods for Describing Sets of Data - Part 2
 Chapter 2.5 Interpreting Standard Deviation Chebyshev Theorem Empirical Rule Chebyshev Theorem says that for ANY shape of data distribution at least 3/4 of all data fall no farther from the mean than 2
Chapter 1: Introduction to Statistics
 Chapter 1: Introduction to Statistics Statistics, Science, and Observations Definition: The term statistics refers to a set of mathematical procedures for organizing, summarizing, and interpreting information.
Section 6: Analysing Relationships Between Variables
 6. 1 Analysing Relationships Between Variables Section 6: Analysing Relationships Between Variables Choosing a Technique The Crosstabs Procedure The Chi Square Test The Means Procedure The Correlations
Collecting & Making Sense of
 Collecting & Making Sense of Quantitative Data Deborah Eldredge, PhD, RN Director, Quality, Research & Magnet Recognition i Oregon Health & Science University Margo A. Halm, RN, PhD, ACNS-BC, FAHA Director,
Six Sigma Glossary Lean 6 Society
 Six Sigma Glossary Lean 6 Society ABSCISSA ACCEPTANCE REGION ALPHA RISK ALTERNATIVE HYPOTHESIS ASSIGNABLE CAUSE ASSIGNABLE VARIATIONS The horizontal axis of a graph The region of values for which the null
Chapter 20: Test Administration and Interpretation
 Chapter 20: Test Administration and Interpretation Thought Questions Why should a needs analysis consider both the individual and the demands of the sport? Should test scores be shared with a team, or
The Nature of Probability and Statistics
 Chapter 1 The Nature of Probability and Statistics Chapter 1 Overview Introduction 1-1 Descriptive and Inferential Statistics 1-2 Variables and Types of Data 1-3 Data Collection & Sampling Techniques 1-4
Basic SPSS for Postgraduate
 Basic SPSS for Postgraduate Dr. Shamshuritawati Sharif School of Quantitative Science Email : shamshurita@uum.edu.my Office : +6049286336 Mobile :+60194248001 In the process of carrying out the research,
Chapter 1: Explaining Behavior
 Chapter 1: Explaining Behavior GOAL OF SCIENCE is to generate explanations for various puzzling natural phenomenon. - Generate general laws of behavior (psychology) RESEARCH: principle method for acquiring
Types of data and how they can be analysed
 1. Types of data British Standards Institution Study Day Types of data and how they can be analysed Martin Bland Prof. of Health Statistics University of York http://martinbland.co.uk In this lecture we
Chapter 1: Introduction to Statistics
 Chapter 1: Introduction o to Statistics Statistics, ti ti Science, and Observations Definition: The term statistics refers to a set of mathematical procedures for organizing, summarizing, and interpreting
Variability. After reading this chapter, you should be able to do the following:
 LEARIG OBJECTIVES C H A P T E R 3 Variability After reading this chapter, you should be able to do the following: Explain what the standard deviation measures Compute the variance and the standard deviation
Examining differences between two sets of scores
 6 Examining differences between two sets of scores In this chapter you will learn about tests which tell us if there is a statistically significant difference between two sets of scores. In so doing you
Math for Liberal Arts MAT 110: Chapter 5 Notes
 Math for Liberal Arts MAT 110: Chapter 5 Notes Statistical Reasoning David J. Gisch Fundamentals of Statistics Two Definitions of Statistics Statistics is the science of collecting, organizing, and interpreting
Topic 1 Exercises Assignment Grand Canyon University: PSY 520 ( ) Mary Young February 21, 2017
 Mary Young February 21, 2017") Topic 1 Exercises Assignment Grand Canyon University: PSY 520 (520-0101) Mary Young February 21, 2017 CHAPTER 1 1.8 Indicate whether each of the following studies is an experiment or an observational study.
Topic 1 Exercises Assignment Grand Canyon University: PSY 520 (520-0101) Mary Young February 21, 2017 CHAPTER 1 1.8 Indicate whether each of the following studies is an experiment or an observational study.
Introduction to Statistics
 Introduction to Statistics Parameter: measurable characteristic of a population. Population: all members of a definable group. For statistical purposes a population must have definable characteristics
Variables and Data. Gbenga Ogunfowokan Lead, Nigerian Regional Faculty The Global Health Network 19 th May 2017
 Variables and Data Gbenga Ogunfowokan Lead, Nigerian Regional The Global Health Network 19 th May 2017 Objectives At the end of this presentation you should be able to 1) Define a variable 2) Classify
UNIVERSITY OF TORONTO SCARBOROUGH Department of Computer and Mathematical Sciences Midterm Test February 2016
 UNIVERSITY OF TORONTO SCARBOROUGH Department of Computer and Mathematical Sciences Midterm Test February 2016 STAB22H3 Statistics I, LEC 01 and LEC 02 Duration: 1 hour and 45 minutes Last Name: First Name:
Statistical Methods Exam I Review
 Statistical Methods Exam I Review Professor: Dr. Kathleen Suchora SI Leader: Camila M. DISCLAIMER: I have created this review sheet to supplement your studies for your first exam. I am a student here at
A Probability Puzzler. Statistics, Data and Statistical Thinking. A Probability Puzzler. A Probability Puzzler. Statistics.
 Statistics, Data and Statistical Thinking FREC 408 Dr. Tom Ilvento 213 Townsend Hall Ilvento@udel.edu A Probability Puzzler Pick a number from 2 to 9. It can be 2 or it can be 9, or any number in between.
Statistics is a broad mathematical discipline dealing with
 Statistical Primer for Cardiovascular Research Descriptive Statistics and Graphical Displays Martin G. Larson, SD Statistics is a broad mathematical discipline dealing with techniques for the collection,
Chapter 1 Overview. Created by Tom Wegleitner, Centreville, Virginia. Copyright 2007 Pearson Education, Inc Publishing as Pearson Addison-Wesley.
 Chapter 1 Overview Created by Tom Wegleitner, Centreville, Virginia Slide 1 11 Statistics Overview Slide 2 A. Statistics is the science of conducting studies to: Collect Organize Summarize Analyze Draw
INTRODUCTION TO STATISTICS SORANA D. BOLBOACĂ
 INTRODUCTION TO STATISTICS SORANA D. BOLBOACĂ OBJECTIVES Definitions Stages of Scientific Knowledge Quantification and Accuracy Types of Medical Data Population and sample Sampling methods DEFINITIONS
Two-Way Independent ANOVA
 Two-Way Independent ANOVA Analysis of Variance (ANOVA) a common and robust statistical test that you can use to compare the mean scores collected from different conditions or groups in an experiment. There
Section 1.2 Displaying Quantitative Data with Graphs. Dotplots
 Section 1.2 Displaying Quantitative Data with Graphs Dotplots One of the simplest graphs to construct and interpret is a dotplot. Each data value is shown as a dot above its location on a number line.
PRINCIPLES OF STATISTICS
 PRINCIPLES OF STATISTICS STA-201-TE This TECEP is an introduction to descriptive and inferential statistics. Topics include: measures of central tendency, variability, correlation, regression, hypothesis
Statistics Lecture 4. Lecture objectives - Definitions of statistics. -Types of statistics -Nature of data -Levels of measurement
 Statistics Lecture 4 Introduction of statistics By Dr.Chelli Lecture objectives - Definitions of statistics -Types of statistics -Nature of data -Levels of measurement - Introduction The study of statistics
Human-Computer Interaction IS4300. I6 Swing Layout Managers due now
 Human-Computer Interaction IS4300 1 I6 Swing Layout Managers due now You have two choices for requirements: 1) try to duplicate the functionality of an existing applet; or, 2) create your own (ideally
9.63 Laboratory in Cognitive Science
 9.63 Laboratory in Cognitive Science Fall 2005 Course 2b Variables, Controls Aude Oliva Ben Balas, Charles Kemp Science is: Scientific Thinking 1. Empirical Based on observations 2. Objective Observations