Stats 95. Statistical analysis without compelling presentation is annoying at best and catastrophic at worst. From raw numbers to meaningful pictures
|
|
|
- Roland Dennis
- 6 years ago
- Views:
Transcription
1 Stats 95 Statistical analysis without compelling presentation is annoying at best and catastrophic at worst. From raw numbers to meaningful pictures


2 Stats 95 Why Stats? 200 countries over 200 years

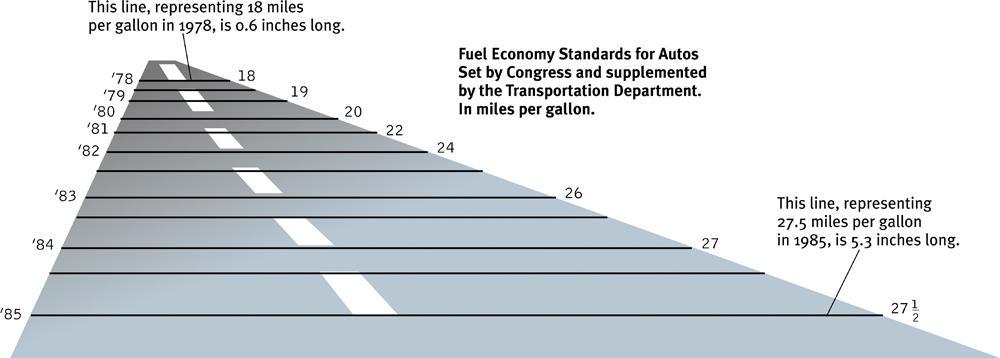
3 BETTER GRAPHS COULD HAVE SAVED LIVES
4 Frequency Table
5 The first rule of statistics: USE COMMON SENSE! 90% of the information is contained in the graph.
6 Frequency Distributions: Where It All Starts Number of graduate students of U.S. professors in chemistry departments who went on to have jobs at top 50 Chemistry departments (minimum of 3)

7 Frequency Table: It All Starts Here! Not only does a Frequency table organize data in way a way that makes it intelligible, the link between the observation and its statistical probability starts here. Table 2.3 Nolan and Heinzen: Statistics for the Behavioral Sciences, First Edition Copyright 2008 by Worth Publishers
8 Frequency Table: Steps Find Max and Min. scores Determine Range (Max- Min+1) Determine #of intervals More art than science, judgment call Decide bottom number From Highest to lowest, count number of scores that belongs in each bin / interval.
9 Frequency Graphs
 Bars TOUCH: Discrete (no decimals) Frequency Polygon: Scale/Continuous (decimals) Lei Lei * and Brian Hilton 2013")
10 Bar Graphs Descriptive Stats: Bar Graphs Vs. Histograms If Variable is Categorical (labels) Bars do NOT TOUCH Bar Graphs can be horizontal Always Draw A Graph! Histogram If Variable is Continuous (numbers) Bars TOUCH: Discrete (no decimals) Frequency Polygon: Scale/Continuous (decimals) Lei Lei * and Brian Hilton 2013
11 Frequency Plot Frequency Graph of Table Example Using Fictitious Data: # of Discovered Errors Errors Discovered Frequency % Cumulative % % 4.27% % 11.97% % 22.65% % 32.05% % 41.88% % 51.71% % 67.09% % 76.07% % 83.76% % 93.16% % % Histogram: Frequency of Discovered Errors Discovered Errors % % 80.00% 60.00% 40.00% 20.00% 0.00% Frequency Cumulative %
12 Descriptive Stats: Histograms Vs. Bar Graphs Bin size can help you tell the story Find Max, Min and Range (Max-Min+1) Make Bins More art than science, judgment call 12 Copyright 2013, Oracle and/or its affiliates. All rights reserved.
13 Histogram: Steps Define X-axis Define the range of X-axis variable. Define range of frequency on the Y-axis. CHOOSE the bin size (wisely).
14 Frequency Distributions Central Tendencies Variability
15 Distributions
16 God Loves The Normal Distribution
17 Normal Distributions: Different Shapes, Same Formula
18 The Normal Distribution Described by: Shape Central Tendency Variability 18
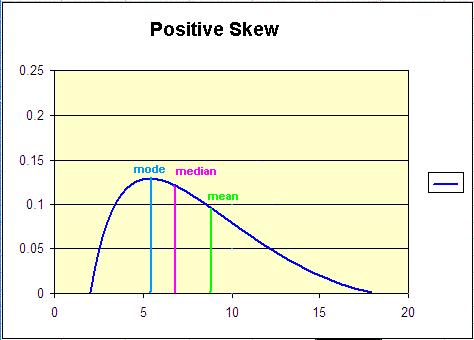
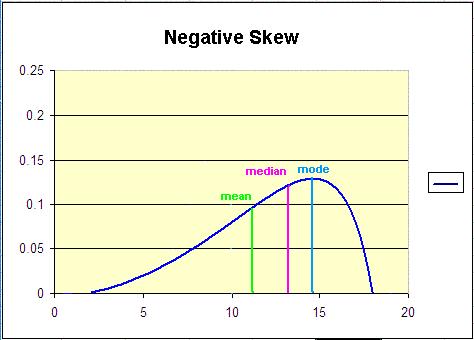
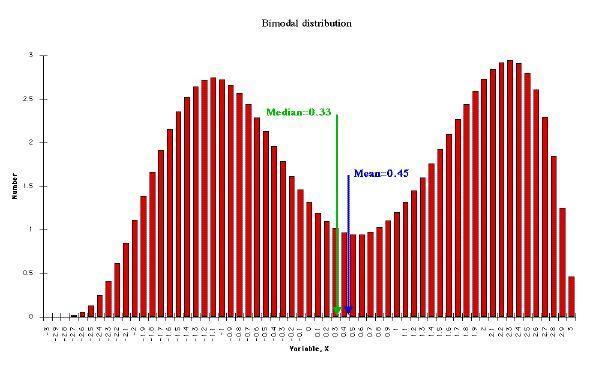
19 2.2 The Science of Observation Normal distribution Shape Symmetrical Positively skewed Negatively skewed Bi modal Tails go on to infinity Central tendencies overlap exactly Most biological measures (height, IQ), random events (coin tosses, dice) and measurement error falls in a Normal Distribution. 19
20
21 Central Tendencies Central tendency mode most frequent mean average median 50 th percentile Normal Distribution: All three central tendencies overlap From Grad Student Example: What is the Median?
22 Sources of Variability Environmental and Natural forces Random variation Measurement error Measures of Variability: Range (max-min) Quartiles (divide cumulative percentiles in equal quarters) Variance Standard deviation (avg distance of all observations to the mean and the square root of Variance)
23 Descriptive Statistics: Standard Deviation Variability Standard Deviation = average distance of all measures from the mean As STDV decreases, Normal Distribution becomes narrower and taller In Normal Distribution, Mean = 0 STDV As distance from mean increases = probability decreases In normal distribution for a Population, STDV is called Z-score Standard Deviations Normal Distribution Normal Distributions with diff. Standard Deviations. The Smaller the STDV The Narrower the Curve
 σ (population) Expressed in")
24 2.2 The Science of Observation Variability Range Standard deviation The average range, the average distance from a point to the mean Measure of Specialness Symbols for Standard Deviation s (sample) σ (population) Expressed in z-scores 24
25 Plotting Frequencies with Box Plots and Stem & Leaf
26 Stem-and-Leaf: Exam 1 & 3 Selection of ranges & bins like Histogram, but usually simpler. These plots represent the scores on an exam given to two different sections for the same course.
27 Box-Plot: Exam 1 & 3 Box Bottom = 1 st quartile Box Midline = 2 quartile Box Top = 3 rd Quartile Stems = Lowest & Highest scores, range.
28 How to Lie with Graphs
29 Rt (ms) Ln (Rt) Tricks in Describing Stats If you omit Zero in your scale, must indicate with ellipsis Simulated Survey Orientation Simulated Survey and Egocentric Orientation: Sex Differences Egocentric Survey Scale and Load Female Male Heavy Light Load and Angle Conditions Large Small
30 Statistical Control Using Multivariate Analysis
31 Tricks in Describing Statistics: Distorting Proportions What s wrong with this comparison? Value of Dollar in 1960 s Value of Dollar in 2010 s


32 A simple visual size illusion Ponzo Illusion: visual depth illusion

33 How To Lie with Graphs

34 How To Lie With Graphs The World s most deceptive graph
35

36 World s Best Graph
37 Back-up slides The End
38 Figure 2.14 Kurtosis Nolan and Heinzen: Statistics for the Behavioral Sciences, First Edition Copyright 2008 by Worth Publishers
39 Figure 2.13 Distributions with More Than One Mode Nolan and Heinzen: Statistics for the Behavioral Sciences, First Edition Copyright 2008 by Worth Publishers
40 Histogram: Exam 1 & 3
41 Histogram Bins. Both histograms show the same data, first has bins of 1.666, and second bins of 3, third bins of 6. Which conveys more information and which conveys information most clearly? Histogram changes, but normal curve stays more stable
42 2.2 The Science of Observation Variability Range Standard deviation The average range, the average of the distances of all points to the mean 42

43 Table 2.2 Nolan and Heinzen: Statistics for the Behavioral Sciences, First Edition Copyright 2008 by Worth Publishers
44 Special Histogram: Pareto Chart Histograms show percent who said that avowed homosexuals were not allowed to speak.
45 Age Discrimination Case
46 Histogram: Showing a Frequency Table
47 Graphing Frequency Discrete: Histogram Continuous: Frequency Polygon
48 Figure 2.16 Skewed Distributions Nolan and Heinzen: Statistics for the Behavioral Sciences, First Edition Copyright 2008 by Worth Publishers
Population. Sample. AP Statistics Notes for Chapter 1 Section 1.0 Making Sense of Data. Statistics: Data Analysis:
 Section 1.0 Making Sense of Data Statistics: Data Analysis: Individuals objects described by a set of data Variable any characteristic of an individual Categorical Variable places an individual into one
Lesson 9 Presentation and Display of Quantitative Data
 Lesson 9 Presentation and Display of Quantitative Data Learning Objectives All students will identify and present data using appropriate graphs, charts and tables. All students should be able to justify
Displaying the Order in a Group of Numbers Using Tables and Graphs
 SIXTH EDITION 1 Displaying the Order in a Group of Numbers Using Tables and Graphs Statistics (stats) is a branch of mathematics that focuses on the organization, analysis, and interpretation of a group
AP Psych - Stat 1 Name Period Date. MULTIPLE CHOICE. Choose the one alternative that best completes the statement or answers the question.
 AP Psych - Stat 1 Name Period Date MULTIPLE CHOICE. Choose the one alternative that best completes the statement or answers the question. 1) In a set of incomes in which most people are in the $15,000
Frequency distributions
 Applied Biostatistics distributions Martin Bland Professor of Health Statistics University of York http://www-users.york.ac.uk/~mb55/ Types of data Qualitative data arise when individuals may fall into
Data, frequencies, and distributions. Martin Bland. Types of data. Types of data. Clinical Biostatistics
 Clinical Biostatistics Data, frequencies, and distributions Martin Bland Professor of Health Statistics University of York http://martinbland.co.uk/ Types of data Qualitative data arise when individuals
Probability and Statistics. Chapter 1
 Probability and Statistics Chapter 1 Individuals and Variables Individuals and Variables Individuals are objects described by data. Individuals and Variables Individuals are objects described by data.
2.4.1 STA-O Assessment 2
 2.4.1 STA-O Assessment 2 Work all the problems and determine the correct answers. When you have completed the assessment, open the Assessment 2 activity and input your responses into the online grading
AP Psych - Stat 2 Name Period Date. MULTIPLE CHOICE. Choose the one alternative that best completes the statement or answers the question.
 AP Psych - Stat 2 Name Period Date MULTIPLE CHOICE. Choose the one alternative that best completes the statement or answers the question. 1) In a set of incomes in which most people are in the $15,000
Business Statistics Probability
 Business Statistics The following was provided by Dr. Suzanne Delaney, and is a comprehensive review of Business Statistics. The workshop instructor will provide relevant examples during the Skills Assessment
4.3 Measures of Variation
 4.3 Measures of Variation! How much variation is there in the data?! Look for the spread of the distribution.! What do we mean by spread? 1 Example Data set:! Weight of contents of regular cola (grams).
Unit 1 Exploring and Understanding Data
 Unit 1 Exploring and Understanding Data Area Principle Bar Chart Boxplot Conditional Distribution Dotplot Empirical Rule Five Number Summary Frequency Distribution Frequency Polygon Histogram Interquartile
WDHS Curriculum Map Probability and Statistics. What is Statistics and how does it relate to you?
 WDHS Curriculum Map Probability and Statistics Time Interval/ Unit 1: Introduction to Statistics 1.1-1.3 2 weeks S-IC-1: Understand statistics as a process for making inferences about population parameters
Biostatistics. Donna Kritz-Silverstein, Ph.D. Professor Department of Family & Preventive Medicine University of California, San Diego
 Biostatistics Donna Kritz-Silverstein, Ph.D. Professor Department of Family & Preventive Medicine University of California, San Diego (858) 534-1818 dsilverstein@ucsd.edu Introduction Overview of statistical
Still important ideas
 Readings: OpenStax - Chapters 1 11 + 13 & Appendix D & E (online) Plous - Chapters 2, 3, and 4 Chapter 2: Cognitive Dissonance, Chapter 3: Memory and Hindsight Bias, Chapter 4: Context Dependence Still
Chapter 1: Exploring Data
 Chapter 1: Exploring Data Key Vocabulary:! individual! variable! frequency table! relative frequency table! distribution! pie chart! bar graph! two-way table! marginal distributions! conditional distributions!
Statistics is the science of collecting, organizing, presenting, analyzing, and interpreting data to assist in making effective decisions
 Readings: OpenStax Textbook - Chapters 1 5 (online) Appendix D & E (online) Plous - Chapters 1, 5, 6, 13 (online) Introductory comments Describe how familiarity with statistical methods can - be associated
Introduction to Statistical Data Analysis I
 Introduction to Statistical Data Analysis I JULY 2011 Afsaneh Yazdani Preface What is Statistics? Preface What is Statistics? Science of: designing studies or experiments, collecting data Summarizing/modeling/analyzing
Medical Statistics 1. Basic Concepts Farhad Pishgar. Defining the data. Alive after 6 months?
 Medical Statistics 1 Basic Concepts Farhad Pishgar Defining the data Population and samples Except when a full census is taken, we collect data on a sample from a much larger group called the population.
Organizing Data. Types of Distributions. Uniform distribution All ranges or categories have nearly the same value a.k.a. rectangular distribution
 Organizing Data Frequency How many of the data are in a category or range Just count up how many there are Notation x = number in one category n = total number in sample (all categories combined) Relative
Chapter 1: Introduction to Statistics
 Chapter 1: Introduction to Statistics Variables A variable is a characteristic or condition that can change or take on different values. Most research begins with a general question about the relationship
Descriptive Statistics Lecture
 Definitions: Lecture Psychology 280 Orange Coast College 2/1/2006 Statistics have been defined as a collection of methods for planning experiments, obtaining data, and then analyzing, interpreting and
Undertaking statistical analysis of
 Descriptive statistics: Simply telling a story Laura Delaney introduces the principles of descriptive statistical analysis and presents an overview of the various ways in which data can be presented by
The normal curve and standardisation. Percentiles, z-scores
 The normal curve and standardisation Percentiles, z-scores The normal curve Frequencies (histogram) Characterised by: Central tendency Mean Median Mode uni, bi, multi Positively skewed, negatively skewed
Part III Taking Chances for Fun and Profit
 Part III Taking Chances for Fun and Profit Chapter 8 Are Your Curves Normal? Probability and Why it Counts What You Will Learn in Chapter 8 How probability relates to statistics Characteristics of the
Describe what is meant by a placebo Contrast the double-blind procedure with the single-blind procedure Review the structure for organizing a memo
 Please note the page numbers listed for the Lind book may vary by a page or two depending on which version of the textbook you have. Readings: Lind 1 11 (with emphasis on chapters 10, 11) Please note chapter
UNIT V: Analysis of Non-numerical and Numerical Data SWK 330 Kimberly Baker-Abrams. In qualitative research: Grounded Theory
 UNIT V: Analysis of Non-numerical and Numerical Data SWK 330 Kimberly Baker-Abrams In qualitative research: analysis is on going (occurs as data is gathered) must be careful not to draw conclusions before
Still important ideas
 Readings: OpenStax - Chapters 1 13 & Appendix D & E (online) Plous Chapters 17 & 18 - Chapter 17: Social Influences - Chapter 18: Group Judgments and Decisions Still important ideas Contrast the measurement
Student name: SOCI 420 Advanced Methods of Social Research Fall 2017
 SOCI 420 Advanced Methods of Social Research Fall 2017 EXAM 1 RUBRIC Instructor: Ernesto F. L. Amaral, Assistant Professor, Department of Sociology Date: October 12, 2017 (Thursday) Section 903: 9:35 10:50am
Understandable Statistics
 Understandable Statistics correlated to the Advanced Placement Program Course Description for Statistics Prepared for Alabama CC2 6/2003 2003 Understandable Statistics 2003 correlated to the Advanced Placement
CHAPTER 3 DATA ANALYSIS: DESCRIBING DATA
 Data Analysis: Describing Data CHAPTER 3 DATA ANALYSIS: DESCRIBING DATA In the analysis process, the researcher tries to evaluate the data collected both from written documents and from other sources such
Observational studies; descriptive statistics
 Observational studies; descriptive statistics Patrick Breheny August 30 Patrick Breheny University of Iowa Biostatistical Methods I (BIOS 5710) 1 / 38 Observational studies Association versus causation
Students will understand the definition of mean, median, mode and standard deviation and be able to calculate these functions with given set of
 Students will understand the definition of mean, median, mode and standard deviation and be able to calculate these functions with given set of numbers. Also, students will understand why some measures
V. Gathering and Exploring Data
 V. Gathering and Exploring Data With the language of probability in our vocabulary, we re now ready to talk about sampling and analyzing data. Data Analysis We can divide statistical methods into roughly
Chapter 2--Norms and Basic Statistics for Testing
 Chapter 2--Norms and Basic Statistics for Testing Student: 1. Statistical procedures that summarize and describe a series of observations are called A. inferential statistics. B. descriptive statistics.
Statistical Methods Exam I Review
 Statistical Methods Exam I Review Professor: Dr. Kathleen Suchora SI Leader: Camila M. DISCLAIMER: I have created this review sheet to supplement your studies for your first exam. I am a student here at
Welcome to OSA Training Statistics Part II
 Welcome to OSA Training Statistics Part II Course Summary Using data about a population to draw graphs Frequency distribution and variability within populations Bell Curves: What are they and where do
Department of Statistics TEXAS A&M UNIVERSITY STAT 211. Instructor: Keith Hatfield
 Department of Statistics TEXAS A&M UNIVERSITY STAT 211 Instructor: Keith Hatfield 1 Topic 1: Data collection and summarization Populations and samples Frequency distributions Histograms Mean, median, variance
Describe what is meant by a placebo Contrast the double-blind procedure with the single-blind procedure Review the structure for organizing a memo
 Business Statistics The following was provided by Dr. Suzanne Delaney, and is a comprehensive review of Business Statistics. The workshop instructor will provide relevant examples during the Skills Assessment
SPRING GROVE AREA SCHOOL DISTRICT. Course Description. Instructional Strategies, Learning Practices, Activities, and Experiences.
 SPRING GROVE AREA SCHOOL DISTRICT PLANNED COURSE OVERVIEW Course Title: Basic Introductory Statistics Grade Level(s): 11-12 Units of Credit: 1 Classification: Elective Length of Course: 30 cycles Periods
Outline. Practice. Confounding Variables. Discuss. Observational Studies vs Experiments. Observational Studies vs Experiments
 1 2 Outline Finish sampling slides from Tuesday. Study design what do you do with the subjects/units once you select them? (OI Sections 1.4-1.5) Observational studies vs. experiments Descriptive statistics
Frequency Distributions
 Frequency Distributions In this section, we look at ways to organize data in order to make it user friendly. We begin by presenting two data sets, from which, because of how the data is presented, it is
Chapter 1. Picturing Distributions with Graphs
 Chapter 1 Picturing Distributions with Graphs Statistics Statistics is a science that involves the extraction of information from numerical data obtained during an experiment or from a sample. It involves
PRINTABLE VERSION. Quiz 1. True or False: The amount of rainfall in your state last month is an example of continuous data.
 Question 1 PRINTABLE VERSION Quiz 1 True or False: The amount of rainfall in your state last month is an example of continuous data. a) True b) False Question 2 True or False: The standard deviation is
CHAPTER 2. MEASURING AND DESCRIBING VARIABLES
 4 Chapter 2 CHAPTER 2. MEASURING AND DESCRIBING VARIABLES 1. A. Age: name/interval; military dictatorship: value/nominal; strongly oppose: value/ ordinal; election year: name/interval; 62 percent: value/interval;
Quantitative Methods in Computing Education Research (A brief overview tips and techniques)
") Quantitative Methods in Computing Education Research (A brief overview tips and techniques) Dr Judy Sheard Senior Lecturer Co-Director, Computing Education Research Group Monash University judy.sheard@monash.edu
Quantitative Methods in Computing Education Research (A brief overview tips and techniques) Dr Judy Sheard Senior Lecturer Co-Director, Computing Education Research Group Monash University judy.sheard@monash.edu
Statistics. Nur Hidayanto PSP English Education Dept. SStatistics/Nur Hidayanto PSP/PBI
 Statistics Nur Hidayanto PSP English Education Dept. RESEARCH STATISTICS WHAT S THE RELATIONSHIP? RESEARCH RESEARCH positivistic Prepositivistic Postpositivistic Data Initial Observation (research Question)
Readings: Textbook readings: OpenStax - Chapters 1 13 (emphasis on Chapter 12) Online readings: Appendix D, E & F
 Online readings: Appendix D, E & F") Readings: Textbook readings: OpenStax - Chapters 1 13 (emphasis on Chapter 12) Online readings: Appendix D, E & F Plous Chapters 17 & 18 Chapter 17: Social Influences Chapter 18: Group Judgments and Decisions
Readings: Textbook readings: OpenStax - Chapters 1 13 (emphasis on Chapter 12) Online readings: Appendix D, E & F Plous Chapters 17 & 18 Chapter 17: Social Influences Chapter 18: Group Judgments and Decisions
Measurement and Descriptive Statistics. Katie Rommel-Esham Education 604
 Measurement and Descriptive Statistics Katie Rommel-Esham Education 604 Frequency Distributions Frequency table # grad courses taken f 3 or fewer 5 4-6 3 7-9 2 10 or more 4 Pictorial Representations Frequency
Appendix B Statistical Methods
 Appendix B Statistical Methods Figure B. Graphing data. (a) The raw data are tallied into a frequency distribution. (b) The same data are portrayed in a bar graph called a histogram. (c) A frequency polygon
Describe what is meant by a placebo Contrast the double-blind procedure with the single-blind procedure Review the structure for organizing a memo
 Please note the page numbers listed for the Lind book may vary by a page or two depending on which version of the textbook you have. Readings: Lind 1 11 (with emphasis on chapters 5, 6, 7, 8, 9 10 & 11)
Readings: Textbook readings: OpenStax - Chapters 1 11 Online readings: Appendix D, E & F Plous Chapters 10, 11, 12 and 14
 Readings: Textbook readings: OpenStax - Chapters 1 11 Online readings: Appendix D, E & F Plous Chapters 10, 11, 12 and 14 Still important ideas Contrast the measurement of observable actions (and/or characteristics)
STATISTICS AND RESEARCH DESIGN
 Statistics 1 STATISTICS AND RESEARCH DESIGN These are subjects that are frequently confused. Both subjects often evoke student anxiety and avoidance. To further complicate matters, both areas appear have
Student name: SOCI 420 Advanced Methods of Social Research Fall 2017
 SOCI 420 Advanced Methods of Social Research Fall 2017 EXAM 1 RUBRIC Instructor: Ernesto F. L. Amaral, Assistant Professor, Department of Sociology Date: October 12, 2017 (Thursday) Section 904: 2:20 3:35pm
Readings: Textbook readings: OpenStax - Chapters 1 4 Online readings: Appendix D, E & F Online readings: Plous - Chapters 1, 5, 6, 13
 Readings: Textbook readings: OpenStax - Chapters 1 4 Online readings: Appendix D, E & F Online readings: Plous - Chapters 1, 5, 6, 13 Introductory comments Describe how familiarity with statistical methods
Statistics is a broad mathematical discipline dealing with
 Statistical Primer for Cardiovascular Research Descriptive Statistics and Graphical Displays Martin G. Larson, SD Statistics is a broad mathematical discipline dealing with techniques for the collection,
Results & Statistics: Description and Correlation. I. Scales of Measurement A Review
 Results & Statistics: Description and Correlation The description and presentation of results involves a number of topics. These include scales of measurement, descriptive statistics used to summarize
Table of Contents. Plots. Essential Statistics for Nursing Research 1/12/2017
 Essential Statistics for Nursing Research Kristen Carlin, MPH Seattle Nursing Research Workshop January 30, 2017 Table of Contents Plots Descriptive statistics Sample size/power Correlations Hypothesis
Unit 7 Comparisons and Relationships
 Unit 7 Comparisons and Relationships Objectives: To understand the distinction between making a comparison and describing a relationship To select appropriate graphical displays for making comparisons
Methodological skills
 Methodological skills rma linguistics, week 3 Tamás Biró ACLC University of Amsterdam t.s.biro@uva.nl Tamás Biró, UvA 1 Topics today Parameter of the population. Statistic of the sample. Re: descriptive
MBA 605 Business Analytics Don Conant, PhD. GETTING TO THE STANDARD NORMAL DISTRIBUTION
 MBA 605 Business Analytics Don Conant, PhD. GETTING TO THE STANDARD NORMAL DISTRIBUTION Variables In the social sciences data are the observed and/or measured characteristics of individuals and groups
Student Performance Q&A:
 Student Performance Q&A: 2009 AP Statistics Free-Response Questions The following comments on the 2009 free-response questions for AP Statistics were written by the Chief Reader, Christine Franklin of
Part 1. For each of the following questions fill-in the blanks. Each question is worth 2 points.
 Part 1. For each of the following questions fill-in the blanks. Each question is worth 2 points. 1. The bell-shaped frequency curve is so common that if a population has this shape, the measurements are
STT315 Chapter 2: Methods for Describing Sets of Data - Part 2
 Chapter 2.5 Interpreting Standard Deviation Chebyshev Theorem Empirical Rule Chebyshev Theorem says that for ANY shape of data distribution at least 3/4 of all data fall no farther from the mean than 2
MULTIPLE CHOICE. Choose the one alternative that best completes the statement or answers the question.
 Exam Name MULTIPLE CHOICE. Choose the one alternative that best completes the statement or answers the 1) Which of the following is the properly rounded mean for the given data? 7, 8, 13, 9, 10, 11 A)
How to interpret scientific & statistical graphs
 How to interpret scientific & statistical graphs Theresa A Scott, MS Department of Biostatistics theresa.scott@vanderbilt.edu http://biostat.mc.vanderbilt.edu/theresascott 1 A brief introduction Graphics:
VU Biostatistics and Experimental Design PLA.216
 VU Biostatistics and Experimental Design PLA.216 Julia Feichtinger Postdoctoral Researcher Institute of Computational Biotechnology Graz University of Technology Outline for Today About this course Background
PRINCIPLES OF STATISTICS
 PRINCIPLES OF STATISTICS STA-201-TE This TECEP is an introduction to descriptive and inferential statistics. Topics include: measures of central tendency, variability, correlation, regression, hypothesis
On the purpose of testing:
 Why Evaluation & Assessment is Important Feedback to students Feedback to teachers Information to parents Information for selection and certification Information for accountability Incentives to increase
Chapter 2 Norms and Basic Statistics for Testing MULTIPLE CHOICE
 Chapter 2 Norms and Basic Statistics for Testing MULTIPLE CHOICE 1. When you assert that it is improbable that the mean intelligence test score of a particular group is 100, you are using. a. descriptive
Frequency Distributions
 Frequency Distributions In this section, we look at ways to organize data in order to make it more user friendly. It is difficult to obtain any meaningful information from the data as presented in the
STT 200 Test 1 Green Give your answer in the scantron provided. Each question is worth 2 points.
 STT 200 Test 1 Green Give your answer in the scantron provided. Each question is worth 2 points. For Questions 1 & 2: It is known that the distribution of starting salaries for MSU Education majors has
Lesson 8 Descriptive Statistics: Measures of Central Tendency and Dispersion
 Lesson 8 Descriptive Statistics: Measures of Central Tendency and Dispersion Learning Objectives All students will define key terms and calculate different descriptive statistics. All students should be
10/4/2007 MATH 171 Name: Dr. Lunsford Test Points Possible
 Pledge: 10/4/2007 MATH 171 Name: Dr. Lunsford Test 1 100 Points Possible I. Short Answer and Multiple Choice. (36 points total) 1. Circle all of the items below that are measures of center of a distribution:
Basic Statistics 01. Describing Data. Special Program: Pre-training 1
 Basic Statistics 01 Describing Data Special Program: Pre-training 1 Describing Data 1. Numerical Measures Measures of Location Measures of Dispersion Correlation Analysis 2. Frequency Distributions (Relative)
Standard Scores. Richard S. Balkin, Ph.D., LPC-S, NCC
 Standard Scores Richard S. Balkin, Ph.D., LPC-S, NCC 1 Normal Distributions While Best and Kahn (2003) indicated that the normal curve does not actually exist, measures of populations tend to demonstrate
CHAPTER 3 Describing Relationships
 CHAPTER 3 Describing Relationships 3.1 Scatterplots and Correlation The Practice of Statistics, 5th Edition Starnes, Tabor, Yates, Moore Bedford Freeman Worth Publishers Reading Quiz 3.1 True/False 1.
Lecture 12: Normal Probability Distribution or Normal Curve
 12_normalcurve.pdf Michael Hallstone, Ph.D. hallston@hawaii.edu Lecture 12: Normal Probability Distribution or Normal Curve The real importance of this lecture is to show you what a normal curve looks
First Hourly Quiz. SW 430: Research Methods in Social Work I
 SW 430 1 st Hourly Quiz - 1 of 11 SW 430: Research Methods in Social Work I First Hourly Quiz Name: 1.23. When we use the Method of Science, we hold a belief because a. evidence from a systematic observation
UNIVERSITY OF TORONTO SCARBOROUGH Department of Computer and Mathematical Sciences Midterm Test February 2016
 UNIVERSITY OF TORONTO SCARBOROUGH Department of Computer and Mathematical Sciences Midterm Test February 2016 STAB22H3 Statistics I, LEC 01 and LEC 02 Duration: 1 hour and 45 minutes Last Name: First Name:
q2_2 MULTIPLE CHOICE. Choose the one alternative that best completes the statement or answers the question.
 q2_2 MULTIPLE CHOICE. Choose the one alternative that best completes the statement or answers the question. A sporting goods retailer conducted a customer survey to determine its customers primary reason
Key: 18 5 = 1.85 cm. 5 a Stem Leaf. Key: 2 0 = 20 points. b Stem Leaf Key: 2 0 = 20 cm. 6 a Stem Leaf. c Stem Leaf
 Answers EXERCISE. D D C B Numerical: a, b, c Categorical: c, d, e, f, g Discrete: c Continuous: a, b C 9 C Categorical B A Categorical and ordinal Discrete Ordinal D EXERCISE. Stem Leaf 9 9 9 Key: = Stem
Summarizing Data. (Ch 1.1, 1.3, , 2.4.3, 2.5)
") 1 Summarizing Data (Ch 1.1, 1.3, 1.10-1.13, 2.4.3, 2.5) Populations and Samples An investigation of some characteristic of a population of interest. Example: You want to study the average GPA of juniors
1 Summarizing Data (Ch 1.1, 1.3, 1.10-1.13, 2.4.3, 2.5) Populations and Samples An investigation of some characteristic of a population of interest. Example: You want to study the average GPA of juniors
Quantitative Literacy: Thinking Between the Lines
 Quantitative Literacy: Thinking Between the Lines Crauder, Noell, Evans, Johnson Chapter 6: Statistics 2013 W. H. Freeman and Company 1 Chapter 6: Statistics Lesson Plan Data summary and presentation:
Clever Hans the horse could do simple math and spell out the answers to simple questions. He wasn t always correct, but he was most of the time.
 Clever Hans the horse could do simple math and spell out the answers to simple questions. He wasn t always correct, but he was most of the time. While a team of scientists, veterinarians, zoologists and
Lauren DiBiase, MS, CIC Associate Director Public Health Epidemiologist Hospital Epidemiology UNC Hospitals
 Lauren DiBiase, MS, CIC Associate Director Public Health Epidemiologist Hospital Epidemiology UNC Hospitals Statistics Numbers that describe the health of the population The science used to interpret these
Chapter 20: Test Administration and Interpretation
 Chapter 20: Test Administration and Interpretation Thought Questions Why should a needs analysis consider both the individual and the demands of the sport? Should test scores be shared with a team, or
Content Scope & Sequence
 Content Scope & Sequence GRADE 2 scottforesman.com (800) 552-2259 Copyright Pearson Education, Inc. 0606443 1 Counting, Coins, and Combinations Counting, Coins, and Combinations (Addition, Subtraction,
Distributions and Samples. Clicker Question. Review
 Distributions and Samples Clicker Question The major difference between an observational study and an experiment is that A. An experiment manipulates features of the situation B. An experiment does not
Chapter 7: Descriptive Statistics
 Chapter Overview Chapter 7 provides an introduction to basic strategies for describing groups statistically. Statistical concepts around normal distributions are discussed. The statistical procedures of
Chapter 2: The Normal Distributions
 Chapter 2: The Normal Distributions Use the following to answer questions 1-3: 1. For this density curve, which of the following is true? a) It is symmetric. c) The median is 1. b) The total area under
Quantitative Data and Measurement. POLI 205 Doing Research in Politics. Fall 2015
 Quantitative Fall 2015 Theory and We need to test our theories with empirical data Inference : Systematic observation and representation of concepts Quantitative: measures are numeric Qualitative: measures
Topic 1 Exercises Assignment Grand Canyon University: PSY 520 ( ) Mary Young February 21, 2017
 Mary Young February 21, 2017") Topic 1 Exercises Assignment Grand Canyon University: PSY 520 (520-0101) Mary Young February 21, 2017 CHAPTER 1 1.8 Indicate whether each of the following studies is an experiment or an observational study.
Topic 1 Exercises Assignment Grand Canyon University: PSY 520 (520-0101) Mary Young February 21, 2017 CHAPTER 1 1.8 Indicate whether each of the following studies is an experiment or an observational study.
Data and Statistics 101: Key Concepts in the Collection, Analysis, and Application of Child Welfare Data
 TECHNICAL REPORT Data and Statistics 101: Key Concepts in the Collection, Analysis, and Application of Child Welfare Data CONTENTS Executive Summary...1 Introduction...2 Overview of Data Analysis Concepts...2
Lecture Outline. Biost 517 Applied Biostatistics I. Purpose of Descriptive Statistics. Purpose of Descriptive Statistics
 Biost 517 Applied Biostatistics I Scott S. Emerson, M.D., Ph.D. Professor of Biostatistics University of Washington Lecture 3: Overview of Descriptive Statistics October 3, 2005 Lecture Outline Purpose
Chapter 1: Explaining Behavior
 Chapter 1: Explaining Behavior GOAL OF SCIENCE is to generate explanations for various puzzling natural phenomenon. - Generate general laws of behavior (psychology) RESEARCH: principle method for acquiring
Standard Deviation and Standard Error Tutorial. This is significantly important. Get your AP Equations and Formulas sheet
 Standard Deviation and Standard Error Tutorial This is significantly important. Get your AP Equations and Formulas sheet The Basics Let s start with a review of the basics of statistics. Mean: What most
AP Stats Review for Midterm
 AP Stats Review for Midterm NAME: Format: 10% of final grade. There will be 20 multiple-choice questions and 3 free response questions. The multiple-choice questions will be worth 2 points each and the