CFPB Financial Well-Being Scale
|
|
|
- Aileen Hampton
- 5 years ago
- Views:
Transcription

1 May 2017 CFPB Financial Well-Being Scale Scale development technical report
2 Table of contents Table of contents Introduction Defining financial well-being Overview of a typical approach to scale development What is a scale? Typical scale development process Scoring a scale Development of the CFPB Financial Well-Being Scale Concept and initial item pool development Survey data collection & analysis Age-group and mode differences Validation CFPB Financial Well-Being Scale Items Scoring Conclusion References CFPB FINANCIAL WELL-BEING SCALE: SCALE DEVELOPMENT TECHNICAL REPORT
3 Appendix A: Survey respondent demographics Appendix B: Model and item parameters CFPB Financial Well-Being Scale model Item parameters Appendix C: Reliability statistics Appendix D: Validation statistics Appendix E: CFPB Financial Well-Being Scale scoring worksheets Standard version scoring worksheet Abbreviated version scoring worksheet Appendix F: Instructions for software-based IRT scoring using Stata CFPB FINANCIAL WELL-BEING SCALE: SCALE DEVELOPMENT TECHNICAL REPORT
4 1. Introduction There is a growing consensus that the ultimate goal of financial education is to support individual financial well-being. The vision for the U.S. National Strategy for Financial Literacy is [s]ustained financial well-being for U.S. individuals and families. 1 This vision is consistent with that of the OECD s International Network on Financial Education (INFE), 2 which describes the ultimate goal of financial literacy as individual financial well-being. 3 Researchers and practitioners have relied on a variety of measures to assess financial education program outcomes and to infer financial well-being. While existing measures provide information on factual knowledge, applied financial numeracy, or behaviors like savings or credit use, these measures generally do not take into account consumers own perspectives on their financial lives. The 2015 Consumer Financial Protection Bureau (CFPB or Bureau) report, Financial wellbeing: The goal of financial education, provided the first consumer-driven definition of 1 See Financial Literacy and Education Commission, Promoting Financial Success in the United States: National Strategy for Financial Literacy. Available at (2011) (accessed May 19, 2017): p The Organization for Economic Cooperation and Development (OECD) is a unique forum where the governments of 34 democracies with market economies work with each other, as well as with more than 70 non-member economies to promote economic growth, prosperity, and sustainable development. To learn more, see 3 See OECD INFE, Measuring Financial Literacy: Questionnaire and Guidance Notes for Conducting an Internationally Comparable Survey of Financial Literacy. Paris: OECD. Available at (2011) (accessed May 19, 2017): p CFPB FINANCIAL WELL-BEING SCALE: SCALE DEVELOPMENT TECHNICAL REPORT
5 financial well-being for the financial education field. 4 This technical report describes the next milestone in our financial well-being research program: the development of a scale a set of questions along with a scoring procedure to measure individual financial well-being. This report is designed to serve as a resource for researchers and others who seek the technical details related to the development of the scale and the scoring procedures. It describes the process used to develop the new financial well-being scale and scoring procedures, including the scoring rubric and the reliability of scores derived from its use. Readers seeking to learn about the methodology and detailed findings related to the consumerdriven financial well-being definition, established in the initial phase of our research, should refer to the CFPB s 2015 report, Financial well-being: The goal of financial education. Because it lays the groundwork for this scale, that report is an important reference source for this technical report. The consumer-driven financial well-being definition developed by the CFPB is multi-faceted, not directly observable, and describes a continuum ranging from feeling severe financial stress to being highly satisfied with one s financial situation. Through our prior work, we learned that consumers perception of financial well-being corresponds to their sense of financial security and financial freedom of choice, in the present and when considering the future. As part of the scale development process, we therefore sought to learn whether financial wellbeing could be represented by a single measure. 5 Our findings confirmed that one multidimensional measure could reflect a consumer s perception of financial well-being. This overall measure is the focus of this report. The CFPB Financial Well-Being Scale, described in greater detail in the rest of this report, is: A consumer-driven measure based on a definition of financial well-being that draws on insights from both consumers and financial practitioners. Evaluation of scale items 4 Available at consumerfinance.gov/reports/financial-well-being/. 5 Measures of the individual elements (i.e., financial security and freedom of choice now and in the future) were not explored in this work. 4 CFPB FINANCIAL WELL-BEING SCALE: SCALE DEVELOPMENT TECHNICAL REPORT
6 included cognitive interviewing and testing to ensure accurate comprehension of questions, as well as review by academic experts. A measurement tool developed over multiple waves of quantitative testing using both classical scale development methods and state-of-the-art Item Response Theory (IRT) techniques to identify appropriate items and how best to combine those items to produce reliable scores of the financial well-being construct. A common metric adjusted for age group 6 and mode of administration that allows an apples-to-apples comparison of scores across consumers. It can also be used to assess a consumer s current state of financial well-being, to track their progress over time, and to understand how other factors, including program interventions, affect financial wellbeing. A free and publicly available survey instrument and measurement scale. Use of the scale does not require a thorough understanding of the technical details in this report. Those seeking to use the scale off the shelf may refer to a companion publication, Measuring financial well-being: A guide to using the CFPB Financial Well-Being Scale. 7 6 Prior qualitative findings suggested that while descriptions of financial well-being by working age and older adults were largely consistent, minor systematic differences could exist. Therefore the scale development process investigated and ultimately adjusted for such differences. 7 This user guide is available at consumerfinance.gov/financial-well-being. 5 CFPB FINANCIAL WELL-BEING SCALE: SCALE DEVELOPMENT TECHNICAL REPORT
7 2. Defining financial well-being Our research program on financial well-being began with a carefully-designed set of research activities to understand and formally define financial well-being. Our goal was to develop a definition of financial well-being for all adults that could be applicable across different economic, geographic, and age-related contexts. 8 Here, we briefly summarize the approach and findings from the first phase of this project. 9 In order to arrive at a definition of financial well-being that reflected the consumer perspective, CFPB s research team listened to people around the country talk about what financial well-being means to them. 10 As a result of this work we developed the following definition. Financial well-being is a state of being wherein a person can fully meet current and ongoing financial obligations, can feel secure in their financial future, and is able to make choices that allow them to enjoy life. 8 Adult refers to those ages 18 and older. Further working age is ages 18 to 61, while older is over age 62, a proxy for separating (or close to separating) from the full-time workforce. Certain age-based distinctions are specified in the Dodd-Frank Wall Street Reform and Consumer Protection Act of 2010, 12 U.S.C. 5493(g)(1). 9 For more information on the methodology and detailed findings from this first phase of research, see Financial wellbeing: The goal of financial education, available at consumerfinance.gov/reports/financial-well-being/. 10 The research team responsible for conducting the research and analysis to develop this definition of financial wellbeing, as well as to develop the scale to measure financial well-being, included Bureau staff as well as a team of research contractors led by the Corporation for Enterprise Development (CFED), including the University of Wisconsin-Madison Center for Financial Security, the Urban Institute, ICF International, and Vector Psychometric Group. The research was funded under a competitive award; contract number CFP-12-Z CFPB FINANCIAL WELL-BEING SCALE: SCALE DEVELOPMENT TECHNICAL REPORT
8 Overall, perspectives on the meaning of financial well-being were remarkably similar for consumers of different ages, incomes, and locations around the country. Combined with a review of research and consultation with leading experts, the CFPB found that financial well-being includes the following four elements: Having control over day-to-day, month-to-month finances. Having the capacity to absorb a financial shock. Being on track to meet your financial goals. Having the financial freedom to make the choices that allow you to enjoy life. Another way to think about this is that financial well-being is the feeling of having financial security and financial freedom of choice, in the present and when considering the future. FIGURE 1: THE FOUR ELEMENTS OF FINANCIAL WELL-BEING The definition reflects a concept of financial well-being that is inherently subjective, and, therefore, not directly observable. Grounded in the consumer insights gathered from this first stage, the research team next undertook a state-of-the-art process to develop a scale to measure financial well-being, based on the construct definition described above. 7 CFPB FINANCIAL WELL-BEING SCALE: SCALE DEVELOPMENT TECHNICAL REPORT
9 3. Overview of a typical approach to scale development In this section, we describe a typical approach to scale development. This discussion provides a backdrop for Section 4 in which the specific method used to develop the CFPB Financial Well- Being Scale is presented. 3.1 What is a scale? A scale is an instrument, made up of multiple questions or items, that yields a composite measure of something that is not directly observable, such as an attitude or ability. 11 Such scales are often described as reflective scales, in which one s level of the attribute being measured is reflected in the response given to individual items. 12 Therefore, a scale was the natural choice for a tool to measure this inherently subjective concept of financial well-being. Response options for each item in a scale can range in complexity from a simple Yes or No response to a Likert scale or continuum, such as the level of agreement or disagreement along a range of response 11 A scale can also refer to a response scale, which is the way a survey question is rated or measured. For example, one of the response scales used in the CFPB Financial Well-being Scale asks respondents How well does this statement describe you? and allows them to respond with one of 5 options, from Describes me completely to Does not describe me at all. 12 Bagozzi, R. P. (2011). Measurement and meaning in information systems and organizational research: Methodological and philosophical foundations. MIS Quarterly, 35(2), CFPB FINANCIAL WELL-BEING SCALE: SCALE DEVELOPMENT TECHNICAL REPORT
10 options. The quality of a scale is judged by its reliability and validity. Reliability describes how consistent and precise the scores produced by the scale are. The more reliable the scale, the less measurement error it is producing. Validity identifies whether the scale is measuring the intended construct. There are multiple, interrelated types of validity but they can be divided into two broad groupings: content-related validity, which assesses whether the scale relates to its underlying theoretical concepts, and criterion-related validity, which is used to determine whether the scale can predict performance on a related measure. 3.2 Typical scale development process Scale development is an iterative process that begins with many more items than will go into the final scale. The multiple rounds of data collection and analysis serve to winnow down the initial pool of items and narrow in on the ones that best reflect the underlying construct. While there is variability depending on the particular project, the process and standards that are commonly followed when developing reflective scales include: 1. Establishing the concepts to be measured based on relevant theory, prior research, and qualitative evidence. 2. Creating a relatively large initial or candidate set of questions, with the goal of refining the set of questions into a shorter final scale based on iterative testing. 3. Gathering expert and user feedback on instructions, each individual question, and response set(s) to ensure that they relate to the intended construct, make sense to respondents and are interpreted as intended. 9 CFPB FINANCIAL WELL-BEING SCALE: SCALE DEVELOPMENT TECHNICAL REPORT
11 4. Conducting psychometric analyses 13 on the data gathered for candidate items through iterative surveys to create the scale model, narrow down the items in the final scale, and assess the reliability of the measure. 14 Examinations regarding the invariance of item properties across targeted grouping variables (e.g. age, sex, mode of administration, 15 etc.) may also be done. 5. Using validation questions in the surveys to check for content and criterion-related validity. Establishing the validity of inferences derived from the use of a new scale is an ongoing process, as more data are collected over time and through different studies Scoring a scale The value of a scale is realized in its application. Applications may involve use of the scale to better understand a given respondent or use in a broader analysis involving the construct being measured. Applying a scale requires the combination of individual scale item responses into a 13 Analyses may include classical test theory techniques, such as Cronbach s alpha and item-total correlations, factor analysis (both exploratory and confirmatory), and/or IRT analyses. 14 A survey is the typical way in which a scale is deployed or implemented. A survey encompasses all aspects of the research process; the scales developed for this project were part of a larger survey that respondents received, which also included demographic and validation questions. 15 The relevance of data collection methods and modes to resulting data quality and interpretation is well-documented. See, e.g., Chapter 5 of Groves et al. (20o9) Survey methodology. 16 There are multiple criteria necessary to assess the psychometric soundness of a new behavioral measure. The American Psychological Association (1985) suggests that scales should demonstrate content validity, criterionrelated validity, construct validity, and internal consistency. Content validity pertains to the adequacy with which a measure assesses the domain of interest. Criterion-related validity describes the relationship between the new measure of interest and another independent measure. Construct validity is concerned with the relationship of the measure to the underlying attributes it is attempting to assess. Internal consistency refers to the homogeneity of the items in the measure or the extent to which item responses correlate with the total test score. There are specific practices that can be utilized to establish evidence of validity and reliability of new measures. 10 CFPB FINANCIAL WELL-BEING SCALE: SCALE DEVELOPMENT TECHNICAL REPORT
12 single score. There are a number of ways individual item responses can be combined to produce a single score. Many instruments rely on summed scores (i.e., simply summing or taking the mean of all relevant individual item responses), although this method assumes that all items are equally good indicators of the construct of interest. This assumption is often hard to support. In other cases, a score is obtained by weighting each item by its factor loading or relatedness to the scale before summing or averaging. An increasingly popular and psychometrically rigorous alternative is to use scores obtained via item response theory (IRT), which allows for each item s relatedness to the concept (e.g., financial well-being) and degree of severity, 17 as well as respondent group (e.g., age) properties, to be accounted for when scoring. The assumptions underlying these IRT-based scores broadly speaking that items may differ in their relationship to the construct of interest - are often more likely to be met in real-world situations and can offer superior reliability compared to other scoring methods (e.g., summed scores) Degree of severity means how much of the attribute being measured, such as financial well-being, is needed for a respondent to choose a certain item response. 18 See Edwards (2009) for an introduction to IRT models and further explanation of the concepts of relatedness and severity as item properties. 11 CFPB FINANCIAL WELL-BEING SCALE: SCALE DEVELOPMENT TECHNICAL REPORT
13 4. Development of the CFPB Financial Well-Being Scale The process for developing the CFPB Financial Well-Being Scale followed the five steps outlined in Section 3, with a few adjustments to increase precision of the scores. The primary enhancement to the process was the incorporation of IRT modeling. 19 IRT is the method of choice for standardized educational testing and other domains in which score precision is critical, such as health outcomes. While both classic approaches and IRT seek a score that indicates a given respondent s level of financial well-being (or other latent construct), classic approaches take more of an additive approach summing (or weighting and summing) responses to individual items to reflect the respondent s level of financial well-being. IRT asks what is the probability that a given respondent will have a specific financial well-being score, given how they answered the questions we asked? IRT and related methods (such as structural equation modeling) then go further to examine whether the probability varies as a function of respondent characteristics or the mode of survey administration (e.g., self- versus interviewer-administered). This section describes our process in the following order: concept and initial item pool development (Section 4.1); survey data collection and analysis to create the scale model and select scale items (Section 4.2); testing for age group considerations and mode effects (Section 19 For general information about IRT and its applications, see Embretson and Reise (2013) or Thissen and Wainer (2001). For a specific example of how IRT has been applied to the development of a scale measuring financial knowledge, including a description of the IRT process and its contribution to measurement precision, see Knoll and Houts (2012). 12 CFPB FINANCIAL WELL-BEING SCALE: SCALE DEVELOPMENT TECHNICAL REPORT
14 4.3); and validation (Section 4.4). The project goal was to create a financial well-being scale that could be used for all adults in the United States. Due to indications of potential age-related differences in perceptions of financial well-being from the initial qualitative research, 20 the research team chose to examine whether working age consumers might answer questions systematically differently from their older counterparts. Thus, all data collected in this study consisted of two separate samples - older consumers (aged 62 years and older) and younger consumers (aged years). Initial analyses were conducted separately with data from these two groups, as expert opinion suggested that there were likely meaningful differences in how respondents would think about financial well-being as well as answer questions depending on age. Although data collection and analysis were separated by age group, the general design of the study was the same across the two groups. Analysis of differential item functioning 21 between the two age groups is discussed in Section 4.3, below. Table 1, below, provides a high-level overview of the number of participants at each stage of data collection (interviews and surveys) throughout the scale development process. 22 In Phase 1 of the project, qualitative interviews were conducted with 59 adult consumers and 30 financial practitioners. 23 Information gleaned through these interviews, along with expert opinion, was 20 See Section 3.2 in Financial well-being: The goal of financial education, available at consumerfinance.gov/reports/financial-well-being/, for a discussion of this particular finding. 21 Differential item functioning (DIF) occurs when groups (such as defined by age or mode of survey administration) have different probabilities of providing a particular response to an item in the multi-item scale after controlling for overall scale scores. An item is labeled as having DIF when people with the same level of a latent trait but from different groups have an unequal probability of giving a response. 22 The qualitative interviews used to develop the financial well-being construct definition and initial item pool were approved by the Office of Management and Budget (OMB) under OMB No All further information collection activities used to refine and select items for the scale were approved under OMB No For detailed information on the qualitative interviews, see Financial well-being: The goal of financial education, available at consumerfinance.gov/reports/financial-well-being. 13 CFPB FINANCIAL WELL-BEING SCALE: SCALE DEVELOPMENT TECHNICAL REPORT
15 used to develop an initial pool of candidate items. The initial pool of items was assessed through cognitive interviews with 19 adult consumers to test and refine the item wording. Three rounds of surveys totaling over 14,000 respondents were used to develop and confirm the scale model, narrow down the questions to the best indicators of the construct, and determine how survey responses may differ when self-administered online versus when administered by telephone, for younger and older adults separately. More detail on each of these activities follows below. TABLE 1: NUMBER OF PARTICIPANTS FOR EACH PHASE OF DATA COLLECTION Interviews Adults Adults 62+ All Consumers Practitioners Qualitative interviews Cognitive interviews Surveys Adults Adults 62+ All Consumers Round 1 survey (online) 3, ,500 Round 2 survey (online) 6,350 1,549 7,899 Round 3 survey Online ,000 Telephone ,000 Total Survey Respondents* 10,911 3,488 14,399 *Subset of survey respondents included in final scale development analysis sample = 10, Concept and initial item pool development In order to develop an initial pool of candidate items (i.e., statements likely to reflect underlying financial well-being), the study team reviewed the transcripts of the one-on-one qualitative interviews that were conducted during the first phase of this research project with a diverse set of consumers and financial practitioners around the United States. Drawing heavily on the phrasing and language used by consumers during the interviews, the team developed potential items for testing. In addition, the team conducted a review of prior research surveys to learn what questions had been previously asked on related topics and incorporated some of them into the initial item pool. Items in the initial pool were intentionally designed to be income and lifestage agnostic. For example, none of them refer to specific dollar amounts, so that all items can be viewed in the context of the respondent s own economic situation and standards. 14 CFPB FINANCIAL WELL-BEING SCALE: SCALE DEVELOPMENT TECHNICAL REPORT
16 These items were reviewed by academic experts and 47 were selected to be field-tested with consumers using cognitive interviewing to ensure that respondents adequately understood all of the questions and to make refinements to the question wording where needed. These consumers represented diverse educational levels, socio-economic status, and life stages. This process identified any potential comprehension problems that could impact survey respondents answers to the items. During this process, alternative wordings for items and responses were also tested. Because survey questions are either negatively or positively worded, the testing process included an analysis of how the direction, also known as polarity, of the items influenced responses. Following refinements to statement wording and discarding one item that was deemed repetitive, the study team moved 46 candidate items forward to the next stage of scale development. 4.2 Survey data collection & analysis Using the refined pool of items, the research team fielded three rounds of surveys via a large nationally-recognized provider of survey data. No respondents participated in more than one round. The first two rounds of surveys were fielded online to large, diverse groups of consumers. 24 As the study moved from round one to round two, exploratory and confirmatory factor analysis, as well as IRT modeling, were used to develop, refine and shorten the scale from the initial set of items. The third survey round was fielded both online and by telephone and was used to confirm and refine the scale developed following the second round of online data collection, and to test for mode effects. Each round of survey data collection is briefly described below, followed by a description of the data analysis conducted to develop the scale model and to select the items. 24 IRT scale development methods require a large and diverse sample of respondents, but not one that is nationally representative. Accordingly, survey respondents were recruited by Survey Sampling International (SSI) such that the sample was roughly similar to the U.S. population based on Census demographics for working age and older consumers, but not nationally representative. Some respondents were removed from the analysis sample due to data quality concerns. See Appendix A for demographics of survey respondents included in the scale development analysis sample. 15 CFPB FINANCIAL WELL-BEING SCALE: SCALE DEVELOPMENT TECHNICAL REPORT
17 ROUND 1 The first survey round fielded the 46 candidate items to 4,500 respondents, divided, as described in Table 1, between adults ages 18 to 61 and adults ages 62 and older. The sample was split fairly evenly between men and women, and included respondents across multiple racial and ethnic categories and areas of the country. The purpose of this first survey round was to collect data needed to begin to develop the scale model (via empirical determination of the most appropriate structure underlying the candidate financial well-being items). ROUND 2 The purpose of the second survey round was to collect data needed to (1) confirm the initial scale model developed from round one survey data with a new data set, (2) examine age-grouprelated differences in responding to the items (3) select items for a preliminary version of the scale based on item content and item performance, and (4) develop the scale scoring. This survey round fielded the 44 candidate items 25 resulting from analysis of Round 1 survey data analysis to 7,899 respondents with a mix of adult ages, racial and ethnic categories, income categories, and U.S. geographic regions. ROUND 3 The third and final round of survey data collection served two purposes: (1) to provide one more test of the reliability of the scale, and (2) to compare multiple modes or methods of survey administration: self-administered and interviewer administered. The 12 selected items, based on the analysis of the data collected in round two, were fielded online in round three to 1,000 respondents and by telephone to another 1,000 respondents. This type of mode-testing assesses whether respondents answer questions differently depending on how questions are presented to respondents (e.g., read aloud by interviewer or read directly from text by the respondent). 25 These 44 items included an A/B split which allowed for examination of positive and negative wording for particular items. 16 CFPB FINANCIAL WELL-BEING SCALE: SCALE DEVELOPMENT TECHNICAL REPORT
18 4.2.1 Model development The CFPB Financial Well-Being Scale was developed using modern measurement theory analyses (including factor analysis and IRT modeling). 26 The goal was to develop a measure with strong psychometric properties that can be easily used across varied populations in both experimental and survey research. The statistical analysis undertaken to develop the CFPB Financial Well-Being Scale included basic descriptive statistics as well as exploratory and confirmatory factor analysis using standard statistical programs to allow for the empirical determination of the most appropriate structure underlying the candidate financial well-being items. This process sought to answer whether 1) financial well-being could be represented by a single measure and 2) if only a single concept was being measured with the items in the scale. The researchers tested several different models, including a unidimensional model, several multidimensional models defined a priori by substantive item content, and other models indicated by initial exploratory analyses that reflected methodological considerations (such as positive versus negative item wording). The model found to fit the data best took the form of a bi-factor model. 27 This model contains one factor related to the latent financial well-being construct, which applies to all 10 scale items, plus two additional factors/dimensions that are associated with the polarity of the item (i.e., whether the item was phrased negatively or positively). 28 The second and third factors apply only to items whose wording matches the direction of the appropriate secondary factor. Hence each individual item has only two factors. See Appendix B for further description of the model used. 26 Psychometric analyses were conducted by Vector Psychometric Group. 27 See Gibbons, R.D., & Hedeker, D. (1992). Full information item bi-factor analysis. Psychometrika, 57, The observed dependencies among items in the CFPB Financial Well-Being Scale related to the positive/negative orientation of the item wording is consistent with the conclusion of the 2013 National Research Council publication Subjective Well-Being: Measuring Happiness, Suffering, and Other Dimensions of Experience, that Both positive and negative emotions must be accounted for in [experienced well-being] measurement, as research shows that they do not simply move in an inverse way...therefore, assessments of [experienced well-being] should include both positive and negative dimensions in order for meaningful inferences to be drawn. 17 CFPB FINANCIAL WELL-BEING SCALE: SCALE DEVELOPMENT TECHNICAL REPORT
19 The final model provides us with an overall, general financial well-being score that is conceptually sound, while also removing noise in the item responses stemming from the positive and negative wording of the items. While the four substantive elements previously mentioned are not explicitly modelled (e.g., there is no freedom of choice score that is calculated), items were selected for inclusion in the final version of the CFPB Financial Well- Being Scale to ensure that the four substantive areas were all represented Item selection Using the model structure empirically supported during the model development phase, IRT analyses were then conducted to obtain objective values regarding item performance, otherwise known as item parameters. 29 Each item had one parameter/value that described how strongly related to the general concept of financial well-being the item is and several severity parameters/values that are used to describe how much financial well-being was needed to provide a certain response (for example, what level of financial well-being is needed to answer Strongly Agree to I am securing my financial future ). In deciding which item to include in the scale, the research team considered the following criteria: (1) Items more strongly related to general financial well-being were preferred over those less strongly related to our concept of interest; and (2) a wide range of severity items across all items was desirable given the general purpose nature of the scale. 30 We wanted a wide range of severity values to ensure that we could accurately measure low financial well-being individuals, high financial well-being individuals, and everyone in between. The analysis of item performance following the first round of survey data collection began with 46 financial well-being candidate items. By Round 3, only the 12 best-performing questions, based on Round 2 results, were presented to respondents. Of these, 10 questions were selected 29 IRT analyses were conducted using the software package flexmirt 2.0. See Houts, C. R., & Cai, L. (2013). flexmirt user s manual version 2: Flexible multilevel multidimensional item analysis and test scoring. Chapel Hill, NC: Vector Psychometric Group. Available at: 30 See Edwards (2009) for further discussion of these considerations. 18 CFPB FINANCIAL WELL-BEING SCALE: SCALE DEVELOPMENT TECHNICAL REPORT
20 for the final version of the scale, based on item performance (IRT results), overall scale reliability, and item content (ensuring that the four substantive areas of interest were all represented). The number of items tested at each phase is shown in Table 2. TABLE 2: NUMBER OF ITEMS FOR EACH PHASE OF DATA COLLECTION Data Collection Phase Tested Items Cognitive Interviews 47* Phase 1 46 Phase 2 44 Phase 3 12 Final Scale 10 *One item was deemed repetitive and discarded following cognitive testing For the final 10-item scale, we employ two different 5-point categorical response sets, providing labels that indicate the content of the item: Describes me: Describes me response set, where the participants are told to select the response that indicates how well each statement describes them, where 5 indicates that the statement Describes me completely and 1 indicates that the statement Does not describe me at all. Frequency: How often response set, where the participants are told to select the response that best indicates how often they would be able to make this statement about themselves using a 5-point scale, where 5 indicates Always and 1 indicates Never. Abbreviated Scale A further refinement was to select a subset of the 10-item scale that would still provide a useful indicator of financial well-being in settings where collecting 10 items is not feasible. The items were selected based on item performance (as before, how strongly related to financial well-being and the severity values for each item), and to ensure all four substantive elements of financial well-being (control, capacity to absorb a shock, being on track to meet goals, and freedom of choice) were represented. The correlation between scores from the 5-item version and the 10- item version of the scale estimated for the same groups of consumers was quite high, 0.94 (p < 19 CFPB FINANCIAL WELL-BEING SCALE: SCALE DEVELOPMENT TECHNICAL REPORT
21 0.001) where 1.0 means perfectly correlated. However, unless time and effort constraints are a significant concern, the standard 10-item version is preferable because it produces scores with higher reliability and increased precision. 4.3 Age-group and mode differences Initial models were tested for younger and older consumers separately but with the goal, if supported by the data, to find a common model across the two age groups. This would allow for direct comparisons between groups and the use of the same questions and response sets (but potentially different scoring) for the different groups. Further, the third round of the data used different modes of data collection in order to test whether responses remained consistent across self-administered and interviewer-administered modes. The item parameters (relatedness and severity, as described earlier) for self-administration were developed through online data collection, and the item parameters for interviewer administration were developed through telephone data collection. 31 Thus, four groups were produced and examined: Respondents ages who self-administered the scale Respondents ages who had the scale read to them by an interviewer Respondents ages 62 and older who self-administered the scale Respondents ages 62 and older who had the scale read to them by an interviewer While the analyses support using the same underlying model structure (a bi-factor model with specific factors for negative and positive wording) for the CFPB Financial Well-Being Scale in all 4 groups, we found meaningful differences in item performance for some items among the 31 Although the study team also collected about 500 pencil and paper surveys using respondents recruited through mall intercept, the research team did not have confidence in these data and they were dropped from this analysis. Prior studies support the idea that Web-based and paper surveys will have similar results under similar conditions. Groves et al. (20o9) find that for a large array of nonthreatening survey items, interviewer-administered surveys yield similar results whether administered by telephone or face to face, and self-administered methods yield similar results whether they are done on paper or via the Web. 20 CFPB FINANCIAL WELL-BEING SCALE: SCALE DEVELOPMENT TECHNICAL REPORT
22 groups. Therefore, different item parameters were estimated for the 4 groups. These item parameters are available in Appendix B. Because these item parameters were estimated from one large multiple-group model, the resulting scores from all 4 groups are directly comparable to each other (that is, they are on the same metric a score of 45 in the older-interview group means the same thing as a 45 in the younger-self-administered group). Further, analyses showed that all scoring rubrics (sets of item parameters) from this model displayed marginal reliability at 0.89 or better for the standard (10 item) version of the scale. 32 The marginal reliability of the abbreviated (5-item) scale is also above.80 for all groups. Marginal reliability can be interpreted similar to Cronbach s alpha. Table 6 in Appendix C has reliability estimates for each scoring rubric. 4.4 Validation To assess the validity of the inferences made using scores from the financial well-being scale, each of the three rounds of survey data collection included the scale questions as well as various validation measures: other questions whose answers we expect to have positive or negative associations with financial well-being, as measured by the scale. Although there were no existing, precise measures of financial well-being available to refer to, there are related concepts such as financial satisfaction, credit scores, and experiences of economic shocks and material hardships. Thus, if the new scale is measuring what it is supposed to be measuring, there will be a statistically significant relationship in an expected direction between those measures and CFPB Financial Well-Being Scale scores. The validation measures used in this project came predominantly from existing scales for related concepts and other items frequently used in 32 Unlike classical test theory (e.g., Cronbach s alpha) which assumes that all scores from a scale are equally well estimated/equally reliable, IRT acknowledges that the reliability of the scores can vary (e.g., average scores may be well estimated while extreme scores may be less well estimated). For this reason, in IRT reliability is represented by a function/curve that may change over the range of the latent construct, rather than a single value. For comparison to more traditional results, however, the marginal reliability statistic provides a single value summary of the marginal reliability (a weighted average of the reliability values over the whole continuum). See Thissen & Wainer (2001; pgs ) for a more detailed discussion. 21 CFPB FINANCIAL WELL-BEING SCALE: SCALE DEVELOPMENT TECHNICAL REPORT
23 surveys. Appendix D provides a full list of these validators and the corresponding data: Credit rating (self-reported) Confidence in one s ability to come up with $2,000 in 30 days Having three months of expenses in savings Self-rated current financial situation Experience of negative economic events (household income shocks, foreclosure, health emergency, debt in collections) Inability to afford food and/or medical care (material hardship) An analysis of the relationship between scores on the new scale and these measures shows the expected relationships in both direction and magnitude. For instance, analysis found a positive association between respondents financial well-being scores and their answers to the question, How would you rate your current financial situation? 33 as well as with commonly used measures of financial resilience, such as having three months of expenses in savings and confidence in one s ability to come up with $2,000 in 30 days. Other validation items displayed similar statistically significant results. Respondents financial well-being scores were positively correlated with self-assessed credit quality and negatively correlated with having a debt in collections, as well as likelihood of experiencing economic hardships in the last year. These results are directionally consistent with a priori hypotheses about the expected relationship between these other financial concepts and financial well-being. The CFPB Financial Well-Being Scale scores are also correlated in the expected direction with commonly used indicators of socio-economic status such as income and education. 33 The questions had 7 possible responses ranging from Extremely bad to Extremely good. 22 CFPB FINANCIAL WELL-BEING SCALE: SCALE DEVELOPMENT TECHNICAL REPORT
24 5. CFPB Financial Well-Being Scale 5.1 Items Through the analytical process described in Section 4, the research team developed a 10-item scale to measure financial well-being. Table 3 shows the 10 items that make up the final standard form of the CFPB Financial Well-Being Scale. The first column contains the text of each item and the second column provides the response options associated with those items. The items cover all four elements of the CFPB s definition of financial well-being: control over finances, capacity to absorb a financial shock, being on track to meet financial goals, and having the financial freedom to enjoy life, using both positive and negative phrasing. TABLE 3: CFPB FINANCIAL WELL-BEING SCALE Questions How well does this statement describe you or your situation? 1. I could handle a major unexpected expense 2. I am securing my financial future 3. Because of my money situation, I feel like I will never have the things I want in life* 4. I can enjoy life because of the way I m managing my money 5. I am just getting by financially * Response Options Describes me completely Describes me very well Describes me somewhat Describes me very little Does not describe me at all 6. I am concerned that the money I have or will save won t last * 23 CFPB FINANCIAL WELL-BEING SCALE: SCALE DEVELOPMENT TECHNICAL REPORT
25 Questions How often does this statement apply to you? 7. Giving a gift for a wedding, birthday or other occasion would put a strain on my finances for the month* 8. I have money left over at the end of the month 9. I am behind with my finances* 10. My finances control my life* Response Options Always Often Sometimes Rarely Never * Denotes items for which the response options are reverse coded. Denotes items that are part of the abbreviated (5 item) scale. The abbreviated 5-question version of the scale (items denoted with a in the table above) still provides adequate coverage of the four elements of financial well-being as well as both positive and negative phrasing. The correlation between the 10 and 5 item versions of the scale is 0.94 (p<0.001). Both versions of the scale can be found formatted as printable questionnaires at consumerfinance.gov/financial-well-being. 5.2 Scoring CFPB Financial Well-Being Scale scores In this section we detail two possible methods for obtaining scores from the CFPB Financial Well-Being Scale: table-based scoring and software-based scoring. Both methods rely on the results of our IRT model. The use of IRT-based scoring procedures, rather than simple summed scores, automatically places the obtained scores on a common metric, regardless of group (i.e., age group or administration mode) or use of 5- versus 10-item version. This ensures the scores are directly comparable to one another. Further, the recommended IRT-based scoring also incorporates group values (the varied means and variances from the four age- and mode-specific groups reported earlier), resulting in more precise scores for each individual than if item responses were just summed or averaged, with no consideration of administration mode or age group. 24 CFPB FINANCIAL WELL-BEING SCALE: SCALE DEVELOPMENT TECHNICAL REPORT
26 Typical IRT-based scores are on the standard normal distribution that is, a bell-shaped curve that has a mean of zero and a standard deviation value of one. For ease of interpretation and communication, the CFPB Financial Well-Being Scale scores are whole numbers between 0 and 100. To get to the CFPB Financial Well-Being Scale metric from a raw IRT score, the value is multiplied by 15, added to 50, and then rounded to the nearest whole number: This provides a score distribution that ranges from approximately 0 to 100 and is centered at 50. CFPB Financial Well-Being Scale Score = round ((IRT FWB score*15) + 50) Scoring Methods We recommend two methods for scoring the CFPB Financial Well-Being Scale: table-based IRT scoring or software-based IRT scoring. The former is a simple and expedient way to approximate a directly estimated IRT score when a respondent answers all the questions in the scale. The table-based method should not be used if a respondent does not answer all questions in the scale. Software-based scoring allows for direct estimation of individual IRT scores using the individual s full response pattern, provides the most precise individual scores, and can be used to produce common-metric (i.e. comparable) scores even if some questions in the scale are not answered. Table-based IRT scoring As a convenience to researchers and practitioners who do not have access to IRT software, or prefer not to use the scoring program described in Appendix F, the research team provides a table-based scoring procedure a look-up table that allows researchers to find an approximate IRT-based score for any given sum score. The table-based scoring procedure has two steps: calculating the total response value (i.e., the raw summed score) for each respondent and then looking that summed score up in the table to find the associated CFPB Financial Well-Being Scale score (on the metric). This procedure is demonstrated in the scoring worksheets provided in Appendix E. The table-based method should not be used if a respondent does not answer all questions in the scale (meaning 9 or fewer of the items answered on the 10 item scale), because skipping items reduces the overall number of items contributing values to the final score. For instance, an individual who answered all of the questions and has a total response value of 30 out of a total 25 CFPB FINANCIAL WELL-BEING SCALE: SCALE DEVELOPMENT TECHNICAL REPORT
27 possible 40 likely does not have the same financial well-being as an individual who skipped two of the items and therefore has a total response value of 30 out of a total possible 32. The CFPB Financial Well-Being Scale score reported in the look-up table is the score for the most likely answer pattern for any given total response value or sum of answers. 34 To simplify communication of financial well-being scores, the tables shown in Appendix E translate the IRT scores onto a point scale. 35 Because the table-based method uses summed scores rather than an individual s actual response pattern, the method is an approximation of directly estimated IRT scores when there are no missing item responses. Table-based scores show correlations of over.90 with response pattern IRT scores. This table-based method of scoring holds two advantages over simply taking a sum or average of scores across the items. First, because it relies on IRT scoring for its foundation, the lookup table offers a more precise estimate than methods that assume each item contributes equally to underlying financial well-being. Further, the table-based scores account for variation introduced by item polarity, age group of respondent, and mode of data collection. Using the simple average or sum as the final score ignores these important sources of variation. Second, scores produced using table-based IRT scoring can be directly compared to data collected by survey researchers and financial education practitioners that are using either of the two IRT scoring methods provided in this report for either the 5-item or 10-item versions of the CFPB Financial Well-Being Scale. To the extent researchers want a score comparable across studies, scale versions, etc. and a simple method of score calculation, these look-up tables may be the most expedient option. An important question is what to do with respondents who fail to complete all questions in the scale, as simply discarding such observations could be inefficient and costly. The most direct solution is for researchers to use IRT software for scoring instead of the table-based method. Software-based IRT scoring (described below), which uses the estimated item parameters 34 This method has been described as a psuedo-eap score and is described in Bonifay (2014). 35 Not shown in these tables is the conversion from the summed totals into IRT-based EAP (Expected a posteriori) scores, which is the intermediate step before the EAP score is transformed to a scale. 26 CFPB FINANCIAL WELL-BEING SCALE: SCALE DEVELOPMENT TECHNICAL REPORT
28 provided in Appendix B and the full response pattern of answers given by each individual, can calculate scores even for respondents with missing item responses. Software-based IRT scoring The software-based IRT scoring method allows researchers to estimate the most precise financial well-being scores for each respondent. This approach uses the individual s full response pattern, rather than the sum of the responses, to determine a financial well-being score for each individual in the data, providing more precise scores than summed scores and even scores found via the provided look-up tables. Additionally, this method can accurately estimate scores even with missing responses. This method requires the use of IRT-specific software (e.g., flexmirt, IRTPRO), using IRT-specific packages or toolboxes in more general purpose statistical software (e.g., R, Stata, MPLUS), or programming the model and item parameters in a statistical package yourself. Appendix F describes procedures for scoring responses according to this method using a custom Stata package. 36 Because differential item functioning was found across both age groups and survey modes, item parameters are provided in Appendix B for scoring four different types of scale respondents: Respondents ages who self-administered the scale Respondents ages who had the scale read to them by an interviewer Respondents ages 62 and older who self-administered the scale Respondents ages 62 and older who had the scale read to them by an interviewer Use of the appropriate parameters produces a financial well-being score that is directly comparable across age groups, modes, and scale versions (10 versus 5 item). 36 This Stata package was developed for the CFPB by Abt Associates, under a competitive award; contract number TPDCFPBPA CFPB FINANCIAL WELL-BEING SCALE: SCALE DEVELOPMENT TECHNICAL REPORT
29 6. Conclusion The CFPB Financial Well-Being Scale was built to measure what consumers say defines financial well-being to them: control over day-to-day, month-to-month finances; the capacity to absorb a financial shock; being on track to meet financial goals; and the financial freedom to make the choices that allow for the enjoyment of life. The data analysis conducted during the development of the scale model reinforced the idea that the items can be used to measure financial well-being as a cohesive general construct. With this new free and reliable scale, it is now possible to measure and compare financial wellbeing across individuals and over time. The scale provides practitioners and researchers a way to understand financial well-being using a tool that was developed using large samples and rigorous statistical analyses. The end result of this work is a scale that can provide reliable financial well-being scores that have been supported by our initial validation exercises. These scores offer a complement to objective measures such as income, credit scores, and other common measures of financial situation, in that they were purposefully designed to reflect a respondent s holistic and subjective sense of their financial situation. At the CFPB, we are using this measurement tool to continue our work to uncover what specific types of knowledge, skills, behavior, and attitudes tend to help people to improve their financial well-being, with the goal of helping move consumer financial capability-building practices forward in ways that can benefit American consumers. We hope this tool will prove useful to others in their programmatic or policy work to support improvements in consumer financial well-being, or in kindred research efforts. We look forward to engaging with the broader field to collectively advance our shared understanding of how to support consumers in achieving their life goals and greater financial well-being. 28 CFPB FINANCIAL WELL-BEING SCALE: SCALE DEVELOPMENT TECHNICAL REPORT
30 7. References Bagozzi, R. P. (2011). Measurement and meaning in information systems and organizational research: Methodological and philosophical foundations. MIS Quarterly, 35(2), Bock, R. D., & Aitkin, M. (1981). Marginal maximum likelihood estimation of item parameters: Application of an EM algorithm. Psychometrika, 46(4), Bonifay, W. E. (2014). An illustration of the two-tier item factor analysis model. In S. P. Reise & D. A. Revicki (Eds.), Handbook of item response theory modeling (pp ). New York, NY: Routledge. Browne, M. W., & Cudeck, R. (1993). Alternative ways of assessing model fit. In K. A. Bollen & J. S. Long (Eds.), Testing structural models (pp ). Newbury Park, CA: Sage Publications. Cai, L. (2013). flexmirt version 2: Flexible multilevel multidimensional item analysis and test scoring [computer software]. Chapel Hill, NC: Vector Psychometric Group, LLC. Cai, L., & Hansen, M. (2013). Limited-information goodness-of-fit testing of hierarchical item factor models. British Journal of Mathematical and Statistical Psychology, 66(2), Cai, L., Yang, J. S., & Hansen, M. (2011). Generalized full-information item bifactor analysis. Psychological Methods, 16(3), Consumer Financial Protection Bureau. (2015). Financial well-being: The goal of financial education. Retrieved from consumerfinance.gov/reports/financial-well-being Consumer Financial Protection Bureau. (2015). Measuring financial well-being: A guide to using the CFPB Financial Well-Being Scale. Retrieved from consumerfinance.gov/financial-well-being Edwards, M. C. (2009). An introduction to item response theory using the Need for Cognition Scale. Social and Personality Psychology Compass, 3 (4), CFPB FINANCIAL WELL-BEING SCALE: SCALE DEVELOPMENT TECHNICAL REPORT
31 Embretson, S. E., & Reise, S. P. (2013.) Item response theory (2 nd ed.). Hove, UK: Psychology Press. Gibbons, R. D., & Hedeker, D. (1992). Full information item bi-factor analysis. Psychometrika, 57(3), Gibbons, R. D., Darrell, R. B., Hedeker, D., Weiss, D. J., Segawa, E., Bhaumik, D. K., Kupfer, D. J., Frank, E., Grochocinski, V. J., & Stover, A. (2007). Full-information item bifactor analysis of graded response data. Applied Psychological Measurement, 31(1), Groves, R. M., Fowler Jr, F. J., Couper, M. P., Lepkowski, J. M., Singer, E., & Tourangeau, R. (2009) Survey methodology (2 nd ed.). Hoboken, NJ: John Wiley & Sons. Knoll, M. A. Z., & Houts, C. R. (2012). The financial knowledge scale: An application of item response theory to the assessment of financial literacy. Journal of Consumer Affairs, 46(3), National Research Council. (2013). Subjective well-being: Measuring happiness, suffering, and other dimensions of experience. In A. A. Stone & C. Mackie (Eds.), Panel on measuring subjective well-being in a policy-relevant framework. Committee on National Statistics, Division of Behavioral and Social Sciences and Education. Washington, DC: The National Academies Press. Nunnally, J. C., & Bernstein, I. H. (1994). Psychometric theory (3 rd ed.). New York, NY: McGraw-Hill, Inc. Sireci, S. G., Thissen, D., & Wainer, H. (1991). On the reliability of testlet-based tests. Journal of Educational Measurement, 28(3), Thissen, D., & Wainer, H. (Eds.). (2001). Test scoring. Mahwah, NJ: Erlbaum. 30 CFPB FINANCIAL WELL-BEING SCALE: SCALE DEVELOPMENT TECHNICAL REPORT
32 APPENDIX A: Survey respondent demographics TABLE 4: DEMOGRAPHIC CHARACTERISTICS OF COMBINED ANALYSIS SAMPLE OF RESPONDENTS TO ALL THREE ROUNDS OF SCALE DEVELOPMENT SURVEYS Number Percent 10, % Sex Female 5, % Male 5, % Age Group , % , % , % , % , % , % 70+ 1, % Race Not reported % White 7, % Black 1, % Asian % Hispanic % Other race % Income Not reported % Less than $20,000 1, % $20,000 - $29,000 1, % $30,000 - $39,999 1, % $40,000 - $49,999 1, % 31 CFPB FINANCIAL WELL-BEING SCALE: SCALE DEVELOPMENT TECHNICAL REPORT
33 Number Percent $50,000 - $59,999 1, % $60,000 - $74,999 1, % $75,000 - $99,999 1, % $100,000 - $149, % $150,000 or higher % Don't know / Refused % Education Not reported % Some high school % Completed high school 1, % Some college 3, % College degree 2, % Some post-graduate classes % Master's degree 1, % Ph.D. or professional degree % 32 CFPB FINANCIAL WELL-BEING SCALE: SCALE DEVELOPMENT TECHNICAL REPORT
34 APPENDIX B: Model and item parameters Appendix B provides a description of the CFPB Financial Well-Being Scale model. First, we describe the scale model and how it was estimated. Then we discuss how to apply the estimated model to responses to produce a score, followed by a presentation of the item parameters from the estimated model. Instructions for how to prepare and score response data using the estimated item parameters via a custom Stata package are provided in Appendix F. CFPB Financial Well-Being Scale model The model that best fit the financial well-being item responses, based on the type of methods widely used in psychometrics and test scoring called Item Response Theory (IRT), is an item bifactor graded response model. The model is discussed by Gibbons et al. (2007) and Cai, Yang, and Hansen (2011). In this model, two conditions hold. First, each item loads on a general factor and also loads on one (and only one) additional factor (so each item is informed by exactly two factors hence the bi of bifactor). Second, responses to each item are monotonic; meaning a higher level of the general factor raises the probability of higher responses (responses are ordered on a Likert scale). The CFPB Financial Well-Being Scale has ten items with 5 potential ordered responses (0, 1, 2, 3, 4), with numerical values associated with the verbal labels described in Section 5.1 of the full report. For our specific bifactor model, there are three factors total. The first factor captures the respondent s general level of financial well-being and applies to all 10 items while the second and third factors are wording-specific (positive and negative, respectively) and apply only to items whose wording matches the direction of the appropriate secondary factor. 33 CFPB FINANCIAL WELL-BEING SCALE: SCALE DEVELOPMENT TECHNICAL REPORT
35 IRT Model Specification The graded response model is a probabilistic model in which latent factors (i.e., unobserved person- and item-specific values) determine the probability of the answers respondents provide. An individual respondent is assumed to have a value for each latent factor in a vector of latent factors which are multiplied by item-specific coefficients to form an index value that can be compared to cutoffs specific to each question to compute the probability of each given answer being observed, conditional on the factors. That is, there are three types of parameters estimated in the model thetas (i.e., individualspecific latent factor values or ability scores) and two types of item-specific parameters (i.e., cutoffs for each level of answer and multipliers/slopes related to the thetas). These item-specific parameters correspond, respectively, to the item severity parameters and degree of relatedness parameters described conceptually in the main document, and measure how much variation is produced in individual responses to items by the same amount of variation in latent factors. In the model, the primary factor theta zero, written reflects the trait of interest, in this case, financial well-being. There are two additional thetas reflecting additional factors that are related to positively and negatively worded-items, respectively. In the model, each item has parameter values, represented by alpha (α) which can be interpreted as the degree to which the item relates to the factor, also called slopes. For our bifactor model is the slope on the primary factor,, measuring financial well-being, and is the slope on the additional factor,, for s= 1, or s= 2. For any item that has a non-zero slope on the first additional factor, that item s slope parameter relating it to the second additional factor must be zero, and vice versa. The second type of item-specific parameter has to do with item location or intercept parameters. In the graded response model, each location parameter or cutoff represents the point on the multivariate theta distribution at which the probability of responding in category k or higher surpasses The probability of a given response on the Likert scale is the difference between the two adjacent cumulative response probabilities. For an item with K response categories (in which K-1 is the highest possible response), this can be expressed as:,, 1, Eq. 1 where 0, 1, P y 1 θ,θ, 34 CFPB FINANCIAL WELL-BEING SCALE: SCALE DEVELOPMENT TECHNICAL REPORT
36 1 1, 1,, 0 and where, is the cutoff between the first and second response options indicating the level of the index value (sum of factors or thetas multiplied by coefficients alpha) below which the lowest response (coded 0, indicating the lowest level of financial well-being) has the highest probability of being chosen. When the index value (the sum of latent factors or theta multiplied by coefficients alpha) exactly equals then the probability of answering 0 or more than 0 is one half. The cumulative logistic distribution function converts the sum of factors and the item-specific cutoffs into probabilities; these probabilities are used in a maximum likelihood estimator (described in the next section, and in Gibbons et al. 2007) to estimate cutoffs for each item, and individual-specific s. Estimation was conducted by Vector Psychometric Group, LLC using flexmirt 2.0 (Cai, 2013), a commercially available IRT-software package, using the defaults of that program described in flexmirt user s manual version Because differential item functioning (DIF) 38 was found across both age groups and survey modes, item- specific parameters were estimated for scoring four different types of scale respondents: Respondents ages who self-administered the scale Respondents ages who had the scale read to them by an interviewer 37 Flexible multilevel multidimensional item analysis and test scoring. Chapel Hill, NC: Vector Psychometric Group, available at: 38 Differential item functioning (DIF) occurs when groups (such as defined by age or mode of survey administration) have different probabilities of endorsing a given item on a multi-item scale after controlling for overall scale scores. An item is labeled as having DIF when people with the same level of a latent trait but from different groups have an unequal probability of giving a response. 35 CFPB FINANCIAL WELL-BEING SCALE: SCALE DEVELOPMENT TECHNICAL REPORT
37 Respondents ages 62 and older who self-administered the scale Respondents ages 62 and older who had the scale read to them by an interviewer The program assumes a normal distribution for each latent factor. Respondents ages who self-administered the scale were used as the reference population and assumed to have standard normal latent factors in the population (that is, latent factor means of 0 and standard deviations of 1); the means and standard deviations of other groups latent factors are estimated, relative to that group, by the software. Applying the Model The probabilities of observing a response conditional on a set of factor values, calculated using Equation 1 and using the estimated item parameters in Table 5, below, are used to score responses using the estimated model. The method of scoring proceeds by computing the probability of an observed response pattern (the product of all item-specific probabilities, given estimated parameters) weighted by a factor value 0 and the prior probability of that factor value f( 0, 1, 2 ) where f() is the multivariate standard normal density. This value is summed over all possible factor values 0 and divided by the sum over all factor values 0 of the prior probability of that factor value f( 0, 1, 2 ) times the probability of the response pattern. That is, the integrals capturing the true expected a posteriori (TEAP) scores, assuming infinitely many calculations are possible, TEAP=,,,,,,,, Eq. 2 (where the P functions are given by Equation 1 above using estimated parameters and cutoffs d in Table 5) for each person i are approximated by sums EAP=,,,,,,,, Eq. 3 taken over discrete steps of size d from L to H, to get the estimated EAP. This numerical integration (commonly known as fixed-point quadrature) is done to ensure compatibility with 36 CFPB FINANCIAL WELL-BEING SCALE: SCALE DEVELOPMENT TECHNICAL REPORT
38 scoring procedures used in flexmirt (other kinds of numerical integration procedures will give slightly different estimated EAP values). This process is depicted for a single dimension in figure 2 (setting the specific factor to zero for simplicity of exposition). Each step in the sum is the area of the rectangle of height f times the width of the step d (divided by the sum of all rectangles) multiplied by the product of all probabilities P: the product of probabilities is the chance of seeing the observed response pattern conditional on that value of. This is a Riemann integral approximated by numerical integration that gets arbitrarily close to the true value of the integral as the number of steps increases (i.e. as d gets smaller) and L and H increase in absolute magnitude. In both the integrals (Eq. 2) and the sums (Eq. 3), the probability P for any refused, don t know, or otherwise missing response is set to one in the calculations, so those answers contribute no information (since multiplying by one does not change the overall product). 39 As an illustrative example of how the software calculates an EAP theta score for the calculation illustrated in Figure 2, below, assume a situation in which a person aged 62 or older surveyed by phone (Group 1, in Table 5, below) answers one question only. The prior density is a simple normal curve, shown in the top left panel of figure 2. Suppose a person responds only to I could handle a major unexpected expense with Describes me very well or a 3 in numerical terms (and for simplicity fix the specific factor to be zero for the one calculation), meaning that times is likely to lie between and 2.119, per the first row in Table 5. That is, the probability of answering 3 or lower (rather than 4) is one half when the sum of factors is divided by 2.205, and the probability of answering 2 or lower (rather than 3 or higher) is one half when the sum of factors is divided by 2.205, meaning probabilities of observing a response of 3 are highest between about one half and one, as shown in the top right panel of Figure 2. The convolution, or the distribution of probabilities of the observed response 3 multiplied by prior densities, is shown in the bottom left panel of Figure 2. The sum of the convolution of P, f, 39 Note that different estimated scores can be obtained for different numerical approximations to the triple integrals shown, but for large numbers of steps from extreme values of the underlying normal distribution, small changes do not change computed scores within rounding error. 37 CFPB FINANCIAL WELL-BEING SCALE: SCALE DEVELOPMENT TECHNICAL REPORT
39 and in the final panel (bottom right panel of figure 2) is divided by the sum of the convolution of P and f (bottom left) to get the EAP theta of.675 which is multiplied by 15 and added to 50 to get the final CFPB Financial Well-Being Scale score of 60. The software does this calculation for each value of the specific factor, and each question answered, to construct the sum over all items, to get EAP scores and the final CFPB Financial Well-Being Scale scores. FIGURE 2: ILLUSTRATIVE CALCULATION OF EAP THETA SCORES.4 Prior density for factor.3 Probability of response.3 f(θ) P(y1=3 θ) θ θ.1 Convolution of P with f.06 Convolution with θ f(θ)p(y1=3 θ) f(θ)p(y1=3 θ)θ θ θ Note: This example assumes an older person surveyed by phone (group 1) answers one question only, to illustrate steps in calculating EAP scores. Item parameters The estimated item parameters used for scoring the model are shown in Table 5. The three alphas are (the estimated slope parameter for factor or financial well-being as shown in Eq. 1), and (the estimated slope parameters for the specific factors, for s= 1, or s= 2). The other values in the table are the item intercept parameters where d4 the cutoff for the highest Likert scale response (4) and the next 3 items are the cutoffs (d3, d2, d1) for each subsequent response. The parameters estimated and shown in the table are used to estimate an expected a posteriori (EAP) score (Equation 2), which is a latent maximum likelihood mean factor estimate based on 38 CFPB FINANCIAL WELL-BEING SCALE: SCALE DEVELOPMENT TECHNICAL REPORT
40 probabilities computed using the estimated cut points for each categorical response (Equation 3 above). For example, d 4 is the point at which a factor sum ( , where we always take one of the item-specific alphas 1 to be zero for the specific factor that does not apply to the item yields a chance of selecting 4 versus 3, 2, 1, or 0. Likewise, d 3 is the factor sum that yields a chance of selecting 4 or 3 versus 2, 1, or 0, and so on. The estimated parameters shown below in Table 5 include all combinations of respondent age groups and data collection modes, across all 10 items. These parameters are the basis of the scoring lookup tables shown in Appendix E, and the scoring program available for Stata, described in Appendix F, using the formulas shown in Eq. 3. TABLE 5: IRT ESTIMATED PARAMETERS BY AGE GROUP AND MODE AGE 62+, INTERVIEWER-ADMINISTERED (GROUP=1) Item α 0 d 4 d 3 d 2 d 1 α 1 α 2 I could handle a major unexpected expense I am just getting by financially I am securing my financial future I am concerned that the money I have or will save won t last Because of my money situation, I feel like I will never have the things I want in life I can enjoy life because of the way I m managing my money I am behind with my finances My finances control my life Giving a gift for a wedding, birthday or other occasion would put a strain on my finances for the month I have money left over at the end of the month CFPB FINANCIAL WELL-BEING SCALE: SCALE DEVELOPMENT TECHNICAL REPORT
41 AGE 62+, SELF-ADMINISTERED (GROUP=2) Item α 0 d 4 d 3 d 2 d 1 α 1 α 2 I could handle a major unexpected expense I am just getting by financially I am securing my financial future I am concerned that the money I have or will save won t last Because of my money situation, I feel like I will never have the things I want in life I can enjoy life because of the way I m managing my money I am behind with my finances My finances control my life Giving a gift for a wedding, birthday or other occasion would put a strain on my finances for the month I have money left over at the end of the month AGE 18-61, INTERVIEWER-ADMINISTERED (GROUP=3) Item α 0 d 4 d 3 d 2 d 1 α 1 α 2 I could handle a major unexpected expense I am just getting by financially I am securing my financial future I am concerned that the money I have or will save won t last Because of my money situation, I feel like I will never have the things I want in life CFPB FINANCIAL WELL-BEING SCALE: SCALE DEVELOPMENT TECHNICAL REPORT
42 Item α 0 d 4 d 3 d 2 d 1 α 1 α 2 I can enjoy life because of the way I m managing my money I am behind with my finances My finances control my life Giving a gift for a wedding, birthday or other occasion would put a strain on my finances for the month I have money left over at the end of the month AGE 18-61, SELF-ADMINISTERED (GROUP=4) Item α 0 d 4 d 3 d 2 d 1 α 1 α 2 I could handle a major unexpected expense I am just getting by financially I am securing my financial future I am concerned that the money I have or will save won t last Because of my money situation, I feel like I will never have the things I want in life I can enjoy life because of the way I m managing my money I am behind with my finances My finances control my life Giving a gift for a wedding, birthday or other occasion would put a strain on my finances for the month I have money left over at the end of the month Source: Vector Psychometric Group. MIRT parameters using bi-factor graded response model using flexmirt software. 41 CFPB FINANCIAL WELL-BEING SCALE: SCALE DEVELOPMENT TECHNICAL REPORT
43 APPENDIX C: Reliability statistics Marginal reliability statistics describe the percentage likelihood that the differences in scores produced by the scale are due to true or actual variance in the respondents financial well-being, rather than to statistical error. In other words, marginal reliability in IRT is the ratio of true score variance to observed score variance. 40 Marginal reliability statistics can range from 0 to 1, where higher values indicate more reliable scores, similar to Cronbach s alpha in classical test theory. The minimum standard for a scale to be considered generally credible is.70, 41 so the CFPB Financial Well-Being Scale, at or above.80, can be considered highly reliable for all combinations of respondent age, survey mode, and scale version. TABLE 6: MARGINAL RELIABILITY BETWEEN AGE GROUPS AND MODES FOR CFPB FINANCIAL WELL- BEING SCALE Standard 10 Item Scale 5 Item Scale Mode Age Age 62+ Age Age 62+ Online Phone Sireci, S.G., Thissen, D., & Wainer, H. (1991). On the reliability of testlet-based tests. Journal of Educational Measurement, 28, Nunnally, J. & Bernstein, I. (1994) Psychometric Theory. New York: McGraw Hill, 3rd ed. 42 CFPB FINANCIAL WELL-BEING SCALE: SCALE DEVELOPMENT TECHNICAL REPORT
44 APPENDIX D: Validation statistics The following table provides information on the relationship between the CFPB Financial Well- Being Scale score and select validation items collected during the scale development process. TABLE 7: SPEARMAN S CORRELATIONS BETWEEN 10 ITEM IRT SCORES AND VALIDATION ITEMS Variable Mean (SD) N FWB Spearman Corr. How would you rate your current credit record? , *** (1) Very bad to (5) Very good How confident are you that you could come up with $2,000 if an unexpected need arose within the next month? , *** (1) I am certain I could not come up with $2,000 (2) I could probably not come up with $2,000 (3) I could probably come up with $2,000 (4) I am certain I could come up with the full $2,000 Have you set aside funds that would cover your expenses for 3 months if you or someone in your family lost a job, got sick or had another emergency? (1) No (2) Yes On a scale of 1 to 7 where 1 means "Extremely bad" and 7 means "Extremely good" how would you rate your current financial situation? (1) Extremely bad to (7) Extremely good There has been a time in the last year when I needed food but couldn't afford to buy it. (1) No (2) Yes In the past 12 months, there was at least one time when I or someone in my household needed to see a doctor or go to the hospital but did not go because we couldn t afford it. (1) No (2) Yes 0.49 N/A 7, *** , *** 0.18 N/A 10, *** 0.14 N/A 10, *** 43 CFPB FINANCIAL WELL-BEING SCALE: SCALE DEVELOPMENT TECHNICAL REPORT
45 Variable Mean (SD) N FWB Spearman Corr. Had a debt in collections 0.09 N/A 1, *** (1) No (2) Yes Count of negative financial shocks experienced in past 12 months (out of 10 possible options) , *** Notes: *** = p < N varies per item because different validation items were fielded in different rounds of data collection. Calculated as the number of events selected by respondents in response to the following question: In the past 12 months, did you or your family living with you experience any of the following events? (1) I lost a job (2) I had my work hours and/or pay reduced (3) My spouse/partner lost a job (4) My spouse/partner had their work hours and/or pay reduced (5) Received a foreclosure notice (6) A business I owned had financial difficulty (7) Had a health emergency (8) Divorce (9) Had a baby (10) Death of primary breadwinner. In addition to these validators, the following table provides information on the relationship between the CFPB Financial Well-Being Scale score and education and income. As shown below, the scale score is positively correlated with income and education. TABLE 8: SPEARMAN S CORRELATIONS BETWEEN 10 ITEM EAP SCORES AND SOCIO-ECONOMIC DATA Variable Mean (SD) N FWB Spearman Corr. Annual Household Income [midpoint of bins] 62,948 48,013 9, *** Less than $20,000 [$10,000] $20,000 - $29,999 $30,000 - $39,999 $40,000 - $49,999 $50,000 - $59,999 $60,000 - $74,999 $75,000 - $99,999 $100,000 - $149,999 $150,000 or higher [$200,000] Education , *** (1) Some high school to (7) PhD or professional degree 44 CFPB FINANCIAL WELL-BEING SCALE: SCALE DEVELOPMENT TECHNICAL REPORT
46 APPENDIX E: CFPB Financial Well-Being Scale scoring worksheets As a convenience to researchers and practitioners who do not have access to IRT software, or prefer not to use the Stata scoring program described in Appendix F, the research team has developed a table-based scoring procedure which approximates IRT procedures by providing the IRT-based score for the most likely answer pattern for any given raw score. This appendix contains both the standard version and the abbreviated version of the CFPB Financial Well- Being Scale scoring worksheets needed to employ this scoring method. For more information on this scoring method and guidelines about its use, see Section CFPB FINANCIAL WELL-BEING SCALE: SCALE DEVELOPMENT TECHNICAL REPORT
47 Standard version scoring worksheet 46 CFPB FINANCIAL WELL-BEING SCALE: SCALE DEVELOPMENT TECHNICAL REPORT

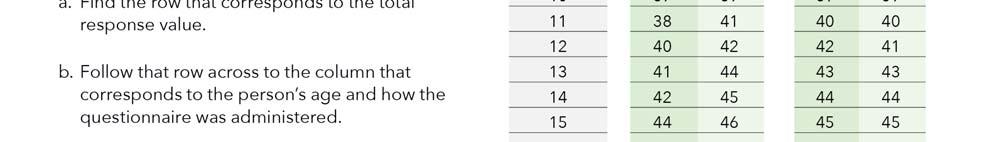
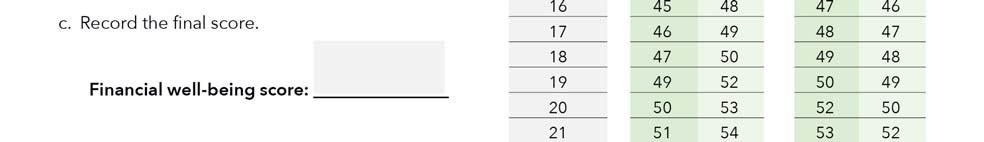


48 47 CFPB FINANCIAL WELL-BEING SCALE: SCALE DEVELOPMENT TECHNICAL REPORT
49 Abbreviated version scoring worksheet 48 CFPB FINANCIAL WELL-BEING SCALE: SCALE DEVELOPMENT TECHNICAL REPORT


50 49 CFPB FINANCIAL WELL-BEING SCALE: SCALE DEVELOPMENT TECHNICAL REPORT
Financial Well-Being Scale
 Financial Well-Being Scale April 13, 2016 ASEC Spring Meeting Hector Ortiz, Policy Analyst, Office for Older Americans This presentation is being made by a Consumer Financial Protection Bureau representative
1. Evaluate the methodological quality of a study with the COSMIN checklist
 Answers 1. Evaluate the methodological quality of a study with the COSMIN checklist We follow the four steps as presented in Table 9.2. Step 1: The following measurement properties are evaluated in the
GENERALIZABILITY AND RELIABILITY: APPROACHES FOR THROUGH-COURSE ASSESSMENTS
 GENERALIZABILITY AND RELIABILITY: APPROACHES FOR THROUGH-COURSE ASSESSMENTS Michael J. Kolen The University of Iowa March 2011 Commissioned by the Center for K 12 Assessment & Performance Management at
CHAPTER VI RESEARCH METHODOLOGY
 CHAPTER VI RESEARCH METHODOLOGY 6.1 Research Design Research is an organized, systematic, data based, critical, objective, scientific inquiry or investigation into a specific problem, undertaken with the
Technical Specifications
 Technical Specifications In order to provide summary information across a set of exercises, all tests must employ some form of scoring models. The most familiar of these scoring models is the one typically
 alternate-form reliability The degree to which two or more versions of the same test correlate with one another. In clinical studies in which a given function is going to be tested more than once over
SLEEP DISTURBANCE ABOUT SLEEP DISTURBANCE INTRODUCTION TO ASSESSMENT OPTIONS. 6/27/2018 PROMIS Sleep Disturbance Page 1
 SLEEP DISTURBANCE A brief guide to the PROMIS Sleep Disturbance instruments: ADULT PROMIS Item Bank v1.0 Sleep Disturbance PROMIS Short Form v1.0 Sleep Disturbance 4a PROMIS Short Form v1.0 Sleep Disturbance
Basic concepts and principles of classical test theory
 Basic concepts and principles of classical test theory Jan-Eric Gustafsson What is measurement? Assignment of numbers to aspects of individuals according to some rule. The aspect which is measured must
CHAPTER 3 METHOD AND PROCEDURE
 CHAPTER 3 METHOD AND PROCEDURE Previous chapter namely Review of the Literature was concerned with the review of the research studies conducted in the field of teacher education, with special reference
Saville Consulting Wave Professional Styles Handbook
 Saville Consulting Wave Professional Styles Handbook PART 4: TECHNICAL Chapter 19: Reliability This manual has been generated electronically. Saville Consulting do not guarantee that it has not been changed
Survey Research. We can learn a lot simply by asking people what we want to know... THE PREVALENCE OF SURVEYS IN COMMUNICATION RESEARCH
 Survey Research From surveys we can learn how large groups of people think and act. To trust generalizations made on the basis of surveys, however, the sample must be representative, the response rate
Methodological Issues in Measuring the Development of Character
 Methodological Issues in Measuring the Development of Character Noel A. Card Department of Human Development and Family Studies College of Liberal Arts and Sciences Supported by a grant from the John Templeton
INTERVIEWS II: THEORIES AND TECHNIQUES 5. CLINICAL APPROACH TO INTERVIEWING PART 1
 INTERVIEWS II: THEORIES AND TECHNIQUES 5. CLINICAL APPROACH TO INTERVIEWING PART 1 5.1 Clinical Interviews: Background Information The clinical interview is a technique pioneered by Jean Piaget, in 1975,
Chapter 5 Analyzing Quantitative Research Literature
 Activity for Chapter 5 Directions: Locate an original report of a quantitative research, preferably on a topic you are reviewing, and answer the following questions. 1. What characteristics of the report
THE USE OF CRONBACH ALPHA RELIABILITY ESTIMATE IN RESEARCH AMONG STUDENTS IN PUBLIC UNIVERSITIES IN GHANA.
 Africa Journal of Teacher Education ISSN 1916-7822. A Journal of Spread Corporation Vol. 6 No. 1 2017 Pages 56-64 THE USE OF CRONBACH ALPHA RELIABILITY ESTIMATE IN RESEARCH AMONG STUDENTS IN PUBLIC UNIVERSITIES
ANXIETY A brief guide to the PROMIS Anxiety instruments:
 ANXIETY A brief guide to the PROMIS Anxiety instruments: ADULT PEDIATRIC PARENT PROXY PROMIS Pediatric Bank v1.0 Anxiety PROMIS Pediatric Short Form v1.0 - Anxiety 8a PROMIS Item Bank v1.0 Anxiety PROMIS
COGNITIVE FUNCTION. PROMIS Pediatric Item Bank v1.0 Cognitive Function PROMIS Pediatric Short Form v1.0 Cognitive Function 7a
 COGNITIVE FUNCTION A brief guide to the PROMIS Cognitive Function instruments: ADULT PEDIATRIC PARENT PROXY PROMIS Item Bank v1.0 Applied Cognition - Abilities* PROMIS Item Bank v1.0 Applied Cognition
Contents. What is item analysis in general? Psy 427 Cal State Northridge Andrew Ainsworth, PhD
 Psy 427 Cal State Northridge Andrew Ainsworth, PhD Contents Item Analysis in General Classical Test Theory Item Response Theory Basics Item Response Functions Item Information Functions Invariance IRT
CHAPTER III RESEARCH METHODOLOGY
 CHAPTER III RESEARCH METHODOLOGY Research methodology explains the activity of research that pursuit, how it progress, estimate process and represents the success. The methodological decision covers the
Statistical analysis DIANA SAPLACAN 2017 * SLIDES ADAPTED BASED ON LECTURE NOTES BY ALMA LEORA CULEN
 Statistical analysis DIANA SAPLACAN 2017 * SLIDES ADAPTED BASED ON LECTURE NOTES BY ALMA LEORA CULEN Vs. 2 Background 3 There are different types of research methods to study behaviour: Descriptive: observations,
Answers to end of chapter questions
 Answers to end of chapter questions Chapter 1 What are the three most important characteristics of QCA as a method of data analysis? QCA is (1) systematic, (2) flexible, and (3) it reduces data. What are
Using Analytical and Psychometric Tools in Medium- and High-Stakes Environments
 Using Analytical and Psychometric Tools in Medium- and High-Stakes Environments Greg Pope, Analytics and Psychometrics Manager 2008 Users Conference San Antonio Introduction and purpose of this session
Funnelling Used to describe a process of narrowing down of focus within a literature review. So, the writer begins with a broad discussion providing b
 Accidental sampling A lesser-used term for convenience sampling. Action research An approach that challenges the traditional conception of the researcher as separate from the real world. It is associated
EU-SILC 2013 MODULE ON WELL-BEING DESCRIPTION OF SILC SECONDARY TARGET VARIABLES Version 5 March 2012
 EUROPEAN COMMISSION EUROSTAT Directorate F: Social and information society statistics Unit F-3: Living conditions and social protection EU-SILC 2013 MODULE ON WELL-BEING DESCRIPTION OF SILC SECONDARY TARGET
CHAPTER 3 RESEARCH METHODOLOGY. In this chapter, research design, data collection, sampling frame and analysis
 CHAPTER 3 RESEARCH METHODOLOGY 3.1 Introduction In this chapter, research design, data collection, sampling frame and analysis procedure will be discussed in order to meet the objectives of the study.
VARIABLES AND MEASUREMENT
 ARTHUR SYC 204 (EXERIMENTAL SYCHOLOGY) 16A LECTURE NOTES [01/29/16] VARIABLES AND MEASUREMENT AGE 1 Topic #3 VARIABLES AND MEASUREMENT VARIABLES Some definitions of variables include the following: 1.
PAIN INTERFERENCE. ADULT ADULT CANCER PEDIATRIC PARENT PROXY PROMIS-Ca Bank v1.1 Pain Interference PROMIS-Ca Bank v1.0 Pain Interference*
 PROMIS Item Bank v1.1 Pain Interference PROMIS Item Bank v1.0 Pain Interference* PROMIS Short Form v1.0 Pain Interference 4a PROMIS Short Form v1.0 Pain Interference 6a PROMIS Short Form v1.0 Pain Interference
Reliability. Internal Reliability
 32 Reliability T he reliability of assessments like the DECA-I/T is defined as, the consistency of scores obtained by the same person when reexamined with the same test on different occasions, or with
Having your cake and eating it too: multiple dimensions and a composite
 Having your cake and eating it too: multiple dimensions and a composite Perman Gochyyev and Mark Wilson UC Berkeley BEAR Seminar October, 2018 outline Motivating example Different modeling approaches Composite
Initial Report on the Calibration of Paper and Pencil Forms UCLA/CRESST August 2015
 This report describes the procedures used in obtaining parameter estimates for items appearing on the 2014-2015 Smarter Balanced Assessment Consortium (SBAC) summative paper-pencil forms. Among the items
CHAPTER 3 RESEARCH METHODOLOGY
 CHAPTER 3 RESEARCH METHODOLOGY 3.1 Introduction 3.1 Methodology 3.1.1 Research Design 3.1. Research Framework Design 3.1.3 Research Instrument 3.1.4 Validity of Questionnaire 3.1.5 Statistical Measurement
PHYSICAL STRESS EXPERIENCES
 PHYSICAL STRESS EXPERIENCES A brief guide to the PROMIS Physical Stress Experiences instruments: PEDIATRIC PROMIS Pediatric Bank v1.0 - Physical Stress Experiences PROMIS Pediatric Short Form v1.0 - Physical
Group Assignment #1: Concept Explication. For each concept, ask and answer the questions before your literature search.
 Group Assignment #1: Concept Explication 1. Preliminary identification of the concept. Identify and name each concept your group is interested in examining. Questions to asked and answered: Is each concept
Issues That Should Not Be Overlooked in the Dominance Versus Ideal Point Controversy
 Industrial and Organizational Psychology, 3 (2010), 489 493. Copyright 2010 Society for Industrial and Organizational Psychology. 1754-9426/10 Issues That Should Not Be Overlooked in the Dominance Versus
FATIGUE. A brief guide to the PROMIS Fatigue instruments:
 FATIGUE A brief guide to the PROMIS Fatigue instruments: ADULT ADULT CANCER PEDIATRIC PARENT PROXY PROMIS Ca Bank v1.0 Fatigue PROMIS Pediatric Bank v2.0 Fatigue PROMIS Pediatric Bank v1.0 Fatigue* PROMIS
PSYCHOLOGICAL STRESS EXPERIENCES
 PSYCHOLOGICAL STRESS EXPERIENCES A brief guide to the PROMIS Pediatric and Parent Proxy Report Psychological Stress Experiences instruments: PEDIATRIC PROMIS Pediatric Item Bank v1.0 Psychological Stress
WHO Quality of Life. health other than the cause of a disease or the side effects that come along with it. These other
 WHO Quality of Life Overview of the WHO Quality of Life As healthcare progresses globally, so does that evolution of scientific research on healthcare assessments and practices. Healthcare services have
MEANING AND PURPOSE. ADULT PEDIATRIC PARENT PROXY PROMIS Item Bank v1.0 Meaning and Purpose PROMIS Short Form v1.0 Meaning and Purpose 4a
 MEANING AND PURPOSE A brief guide to the PROMIS Meaning and Purpose instruments: ADULT PEDIATRIC PARENT PROXY PROMIS Item Bank v1.0 Meaning and Purpose PROMIS Short Form v1.0 Meaning and Purpose 4a PROMIS
INTRODUCTION TO ASSESSMENT OPTIONS
 DEPRESSION A brief guide to the PROMIS Depression instruments: ADULT ADULT CANCER PEDIATRIC PARENT PROXY PROMIS-Ca Bank v1.0 Depression PROMIS Pediatric Item Bank v2.0 Depressive Symptoms PROMIS Pediatric
Multiple Act criterion:
 Common Features of Trait Theories Generality and Stability of Traits: Trait theorists all use consistencies in an individual s behavior and explain why persons respond in different ways to the same stimulus
Data and Statistics 101: Key Concepts in the Collection, Analysis, and Application of Child Welfare Data
 TECHNICAL REPORT Data and Statistics 101: Key Concepts in the Collection, Analysis, and Application of Child Welfare Data CONTENTS Executive Summary...1 Introduction...2 Overview of Data Analysis Concepts...2
ANXIETY. A brief guide to the PROMIS Anxiety instruments:
 ANXIETY A brief guide to the PROMIS Anxiety instruments: ADULT ADULT CANCER PEDIATRIC PARENT PROXY PROMIS Bank v1.0 Anxiety PROMIS Short Form v1.0 Anxiety 4a PROMIS Short Form v1.0 Anxiety 6a PROMIS Short
A Brief Introduction to Bayesian Statistics
 A Brief Introduction to Statistics David Kaplan Department of Educational Psychology Methods for Social Policy Research and, Washington, DC 2017 1 / 37 The Reverend Thomas Bayes, 1701 1761 2 / 37 Pierre-Simon
CHAPTER 4 THE QUESTIONNAIRE DESIGN /SOLUTION DESIGN. This chapter contains explanations that become a basic knowledge to create a good
 CHAPTER 4 THE QUESTIONNAIRE DESIGN /SOLUTION DESIGN This chapter contains explanations that become a basic knowledge to create a good questionnaire which is able to meet its objective. Just like the thesis
ABOUT PHYSICAL ACTIVITY
 PHYSICAL ACTIVITY A brief guide to the PROMIS Physical Activity instruments: PEDIATRIC PROMIS Pediatric Item Bank v1.0 Physical Activity PROMIS Pediatric Short Form v1.0 Physical Activity 4a PROMIS Pediatric
Framework Partners Incorporated
 Framework Partners Incorporated Summary of Findings from the 2011 Ontario Association of Architects Intern Survey It is the purpose of this summary to describe the methodology, the reliability, the findings,
Introduction. 1.1 Facets of Measurement
 1 Introduction This chapter introduces the basic idea of many-facet Rasch measurement. Three examples of assessment procedures taken from the field of language testing illustrate its context of application.
Validating Measures of Self Control via Rasch Measurement. Jonathan Hasford Department of Marketing, University of Kentucky
 Validating Measures of Self Control via Rasch Measurement Jonathan Hasford Department of Marketing, University of Kentucky Kelly D. Bradley Department of Educational Policy Studies & Evaluation, University
Thinking Like a Researcher
 3-1 Thinking Like a Researcher 3-3 Learning Objectives Understand... The terminology used by professional researchers employing scientific thinking. What you need to formulate a solid research hypothesis.
Using the Rasch Modeling for psychometrics examination of food security and acculturation surveys
 Using the Rasch Modeling for psychometrics examination of food security and acculturation surveys Jill F. Kilanowski, PhD, APRN,CPNP Associate Professor Alpha Zeta & Mu Chi Acknowledgements Dr. Li Lin,
CEMO RESEARCH PROGRAM
 1 CEMO RESEARCH PROGRAM Methodological Challenges in Educational Measurement CEMO s primary goal is to conduct basic and applied research seeking to generate new knowledge in the field of educational measurement.
The Impact of Item Sequence Order on Local Item Dependence: An Item Response Theory Perspective
 Vol. 9, Issue 5, 2016 The Impact of Item Sequence Order on Local Item Dependence: An Item Response Theory Perspective Kenneth D. Royal 1 Survey Practice 10.29115/SP-2016-0027 Sep 01, 2016 Tags: bias, item
Module 14: Missing Data Concepts
 Module 14: Missing Data Concepts Jonathan Bartlett & James Carpenter London School of Hygiene & Tropical Medicine Supported by ESRC grant RES 189-25-0103 and MRC grant G0900724 Pre-requisites Module 3
PHYSICAL FUNCTION A brief guide to the PROMIS Physical Function instruments:
 PROMIS Bank v1.0 - Physical Function* PROMIS Short Form v1.0 Physical Function 4a* PROMIS Short Form v1.0-physical Function 6a* PROMIS Short Form v1.0-physical Function 8a* PROMIS Short Form v1.0 Physical
Comparability Study of Online and Paper and Pencil Tests Using Modified Internally and Externally Matched Criteria
 Comparability Study of Online and Paper and Pencil Tests Using Modified Internally and Externally Matched Criteria Thakur Karkee Measurement Incorporated Dong-In Kim CTB/McGraw-Hill Kevin Fatica CTB/McGraw-Hill
Title: Validation of the Comprehensive Feeding Practices Questionnaire with parents of 10-to-12-year-olds
 Author's response to reviews Title: Validation of the Comprehensive Feeding Practices Questionnaire with parents of 10-to-12-year-olds Authors: Elisabeth L Melbye (elisabeth.l.melbye@uis.no) Torvald Øgaard
Bruno D. Zumbo, Ph.D. University of Northern British Columbia
 Bruno Zumbo 1 The Effect of DIF and Impact on Classical Test Statistics: Undetected DIF and Impact, and the Reliability and Interpretability of Scores from a Language Proficiency Test Bruno D. Zumbo, Ph.D.
Chapter-2 RESEARCH DESIGN
 Chapter-2 RESEARCH DESIGN 33 2.1 Introduction to Research Methodology: The general meaning of research is the search for knowledge. Research is also defined as a careful investigation or inquiry, especially
MOVEMBER FUNDED MEN S HEALTH INFORMATION RESOURCES EVALUATION BRIEF. 1 P age
 MOVEMBER FUNDED MEN S HEALTH INFORMATION RESOURCES EVALUATION BRIEF 1 P age Contents 1. Purpose... 3 2. Background... 3 3. beyondblue, the national depression and anxiety initiative... 4 4. Movember funded
Research Methodology in Social Sciences. by Dr. Rina Astini
 Research Methodology in Social Sciences by Dr. Rina Astini Email : rina_astini@mercubuana.ac.id What is Research? Re ---------------- Search Re means (once more, afresh, anew) or (back; with return to
INTRODUCTION TO ASSESSMENT OPTIONS
 ASTHMA IMPACT A brief guide to the PROMIS Asthma Impact instruments: PEDIATRIC PROMIS Pediatric Item Bank v2.0 Asthma Impact PROMIS Pediatric Item Bank v1.0 Asthma Impact* PROMIS Pediatric Short Form v2.0
Addendum: Multiple Regression Analysis (DRAFT 8/2/07)
") Addendum: Multiple Regression Analysis (DRAFT 8/2/07) When conducting a rapid ethnographic assessment, program staff may: Want to assess the relative degree to which a number of possible predictive variables
Addendum: Multiple Regression Analysis (DRAFT 8/2/07) When conducting a rapid ethnographic assessment, program staff may: Want to assess the relative degree to which a number of possible predictive variables
Chapter 4. Objective & Research Methodology of the Study
 Chapter 4 Objective & Research Methodology of the Study 4.1] Introduction The current chapter details about research methodology used in the present study to arrive at desired results. This chapter includes
Chapter 2 Norms and Basic Statistics for Testing MULTIPLE CHOICE
 Chapter 2 Norms and Basic Statistics for Testing MULTIPLE CHOICE 1. When you assert that it is improbable that the mean intelligence test score of a particular group is 100, you are using. a. descriptive
By Hui Bian Office for Faculty Excellence
 By Hui Bian Office for Faculty Excellence 1 Email: bianh@ecu.edu Phone: 328-5428 Location: 1001 Joyner Library, room 1006 Office hours: 8:00am-5:00pm, Monday-Friday 2 Educational tests and regular surveys
Analysis A step in the research process that involves describing and then making inferences based on a set of data.
 1 Appendix 1:. Definitions of important terms. Additionality The difference between the value of an outcome after the implementation of a policy, and its value in a counterfactual scenario in which the
Guidelines for using the Voils two-part measure of medication nonadherence
 Guidelines for using the Voils two-part measure of medication nonadherence Part 1: Extent of nonadherence (3 items) The items in the Extent scale are worded generally enough to apply across different research
Importance of Good Measurement
 Importance of Good Measurement Technical Adequacy of Assessments: Validity and Reliability Dr. K. A. Korb University of Jos The conclusions in a study are only as good as the data that is collected. The
ISC- GRADE XI HUMANITIES ( ) PSYCHOLOGY. Chapter 2- Methods of Psychology
 PSYCHOLOGY. Chapter 2- Methods of Psychology") ISC- GRADE XI HUMANITIES (2018-19) PSYCHOLOGY Chapter 2- Methods of Psychology OUTLINE OF THE CHAPTER (i) Scientific Methods in Psychology -observation, case study, surveys, psychological tests, experimentation
ISC- GRADE XI HUMANITIES (2018-19) PSYCHOLOGY Chapter 2- Methods of Psychology OUTLINE OF THE CHAPTER (i) Scientific Methods in Psychology -observation, case study, surveys, psychological tests, experimentation
1. The Role of Sample Survey Design
 Vista's Approach to Sample Survey Design 1978, 1988, 2006, 2007, 2009 Joseph George Caldwell. All Rights Reserved. Posted at Internet website http://www.foundationwebsite.org. Updated 20 March 2009 (two
Introduction: Statistics, Data and Statistical Thinking Part II
 Introduction: Statistics, Data and Statistical Thinking Part II FREC/STAT 608 Dr. Tom Ilvento Department of Food and Resource Economics Let s Continue with our introduction We need terms and definitions
Validity and reliability of measurements
 Validity and reliability of measurements 2 3 Request: Intention to treat Intention to treat and per protocol dealing with cross-overs (ref Hulley 2013) For example: Patients who did not take/get the medication
Measuring mathematics anxiety: Paper 2 - Constructing and validating the measure. Rob Cavanagh Len Sparrow Curtin University
 Measuring mathematics anxiety: Paper 2 - Constructing and validating the measure Rob Cavanagh Len Sparrow Curtin University R.Cavanagh@curtin.edu.au Abstract The study sought to measure mathematics anxiety
Likert Scaling: A how to do it guide As quoted from
 Likert Scaling: A how to do it guide As quoted from www.drweedman.com/likert.doc Likert scaling is a process which relies heavily on computer processing of results and as a consequence is my favorite method
Item Response Theory. Steven P. Reise University of California, U.S.A. Unidimensional IRT Models for Dichotomous Item Responses
 Item Response Theory Steven P. Reise University of California, U.S.A. Item response theory (IRT), or modern measurement theory, provides alternatives to classical test theory (CTT) methods for the construction,
ABOUT SUBSTANCE USE INTRODUCTION TO ASSESSMENT OPTIONS SUBSTANCE USE. 2/26/2018 PROMIS Substance Use Page 1
 SUBSTANCE USE A brief guide to the PROMIS Substance Use instruments: ADULT PROMIS Item Bank v1.0 Appeal of Substance Use (Past 3 Months) PROMIS Item Bank v1.0 Appeal of Substance Use (Past 30 days) PROMIS
2 Critical thinking guidelines
 What makes psychological research scientific? Precision How psychologists do research? Skepticism Reliance on empirical evidence Willingness to make risky predictions Openness Precision Begin with a Theory
Internal Consistency and Reliability of the Networked Minds Social Presence Measure
 Internal Consistency and Reliability of the Networked Minds Social Presence Measure Chad Harms, Frank Biocca Iowa State University, Michigan State University Harms@iastate.edu, Biocca@msu.edu Abstract
Examining the efficacy of the Theory of Planned Behavior (TPB) to understand pre-service teachers intention to use technology*
 to understand pre-service teachers intention to use technology*") Examining the efficacy of the Theory of Planned Behavior (TPB) to understand pre-service teachers intention to use technology* Timothy Teo & Chwee Beng Lee Nanyang Technology University Singapore This
Examining the efficacy of the Theory of Planned Behavior (TPB) to understand pre-service teachers intention to use technology* Timothy Teo & Chwee Beng Lee Nanyang Technology University Singapore This
A Comparison of Several Goodness-of-Fit Statistics
 A Comparison of Several Goodness-of-Fit Statistics Robert L. McKinley The University of Toledo Craig N. Mills Educational Testing Service A study was conducted to evaluate four goodnessof-fit procedures
Foundations of Research Methods
 1 Foundations of Research Methods Relevant dates and information 09/03/2017 Intermediate test (final test) >> to be defined 1 Things to do: Enrol yourself in the page of the course (obligatory) Sign every
Internal Consistency and Reliability of the Networked Minds Measure of Social Presence
 Internal Consistency and Reliability of the Networked Minds Measure of Social Presence Chad Harms Iowa State University Frank Biocca Michigan State University Abstract This study sought to develop and
The Classification Accuracy of Measurement Decision Theory. Lawrence Rudner University of Maryland
 Paper presented at the annual meeting of the National Council on Measurement in Education, Chicago, April 23-25, 2003 The Classification Accuracy of Measurement Decision Theory Lawrence Rudner University
ADMS Sampling Technique and Survey Studies
 Principles of Measurement Measurement As a way of understanding, evaluating, and differentiating characteristics Provides a mechanism to achieve precision in this understanding, the extent or quality As
Differential Item Functioning
 Differential Item Functioning Lecture #11 ICPSR Item Response Theory Workshop Lecture #11: 1of 62 Lecture Overview Detection of Differential Item Functioning (DIF) Distinguish Bias from DIF Test vs. Item
Evidence Informed Practice Online Learning Module Glossary
 Term Abstract Associations Attrition Bias Background and Significance Baseline Basic Science Bias Blinding Definition An abstract is a summary of a research article. It usually includes the purpose, methods,
Assessing the Validity and Reliability of the Teacher Keys Effectiveness. System (TKES) and the Leader Keys Effectiveness System (LKES)
 and the Leader Keys Effectiveness System (LKES)") Assessing the Validity and Reliability of the Teacher Keys Effectiveness System (TKES) and the Leader Keys Effectiveness System (LKES) of the Georgia Department of Education Submitted by The Georgia Center
Assessing the Validity and Reliability of the Teacher Keys Effectiveness System (TKES) and the Leader Keys Effectiveness System (LKES) of the Georgia Department of Education Submitted by The Georgia Center
School orientation and mobility specialists School psychologists School social workers Speech language pathologists
 2013-14 Pilot Report Senate Bill 10-191, passed in 2010, restructured the way all licensed personnel in schools are supported and evaluated in Colorado. The ultimate goal is ensuring college and career
Chapter 1 Introduction to Educational Research
 Chapter 1 Introduction to Educational Research The purpose of Chapter One is to provide an overview of educational research and introduce you to some important terms and concepts. My discussion in this
Patient Reported Outcomes (PROs) Tools for Measurement of Health Related Quality of Life
 Tools for Measurement of Health Related Quality of Life") Patient Reported Outcomes (PROs) Tools for Measurement of Health Related Quality of Life David Victorson, Ph.D. Assistant Professor Department of Medical Social Sciences Northwestern University Feinberg
Patient Reported Outcomes (PROs) Tools for Measurement of Health Related Quality of Life David Victorson, Ph.D. Assistant Professor Department of Medical Social Sciences Northwestern University Feinberg
CHAPTER 3 DATA ANALYSIS: DESCRIBING DATA
 Data Analysis: Describing Data CHAPTER 3 DATA ANALYSIS: DESCRIBING DATA In the analysis process, the researcher tries to evaluate the data collected both from written documents and from other sources such
HEES for Spanish- Speaking Customers
 Southern California Edison HEES for Spanish- Speaking Customers Study ID: SCE0291.01 Addendum to Study ID SCE 0275.01 September 2010 Prepared for: Caroline Chen, Southern California Edison Prepared by:
CONSTITUENT VOICE FISCAL YEAR 2016 RESULTS REPORT
 CONSTITUENT VOICE FISCAL YEAR 2016 RESULTS REPORT April 2015 to May 2016 INTRODUCTION At LIFT, we strongly believe our members are the experts on their own lives. And, when working with LIFT staff, they
Chapter 4 Research Methodology
 Chapter 4 Research Methodology 137 RESEARCH METHODOLOGY Research Gap Having done a thorough literature review on gender diversity practices in IT organisations, it has been observed that there exists a
Unit 1 Exploring and Understanding Data
 Unit 1 Exploring and Understanding Data Area Principle Bar Chart Boxplot Conditional Distribution Dotplot Empirical Rule Five Number Summary Frequency Distribution Frequency Polygon Histogram Interquartile
Empowered by Psychometrics The Fundamentals of Psychometrics. Jim Wollack University of Wisconsin Madison
 Empowered by Psychometrics The Fundamentals of Psychometrics Jim Wollack University of Wisconsin Madison Psycho-what? Psychometrics is the field of study concerned with the measurement of mental and psychological
1 The conceptual underpinnings of statistical power
 1 The conceptual underpinnings of statistical power The importance of statistical power As currently practiced in the social and health sciences, inferential statistics rest solidly upon two pillars: statistical
ISA 540, Auditing Accounting Estimates, Including Fair Value Accounting Estimates, and Related Disclosures Issues and Task Force Recommendations
 Agenda Item 1-A ISA 540, Auditing Accounting Estimates, Including Fair Value Accounting Estimates, and Related Disclosures Issues and Task Force Recommendations Introduction 1. Since the September 2016
The Assertive Community Treatment Transition Readiness Scale User s Manual 1
 The Assertive Community Treatment Transition Readiness Scale User s Manual 1 Gary S. Cuddeback, Ph.D. 1 This project was supported by funding from the Ohio Department of Mental Health and The Health Foundation