Exemplar for Internal Assessment Resource Physics Level 1
|
|
|
- Blake McCormick
- 5 years ago
- Views:
Transcription

1 Exemplar for internal assessment resource 1.1B Physics for Achievement Standard Exemplar for Internal Assessment Resource Physics Level 1 This exemplar supports assessment against: Achievement Standard Carry out a practical physics investigation that leads to a linear mathematical relationship, with direction Student and grade boundary specific exemplar The material has been gathered from student material specific to an A or B assessment resource. Date version published by Ministry of Education December 2011 To support internal assessment from 2012 Crown 2011
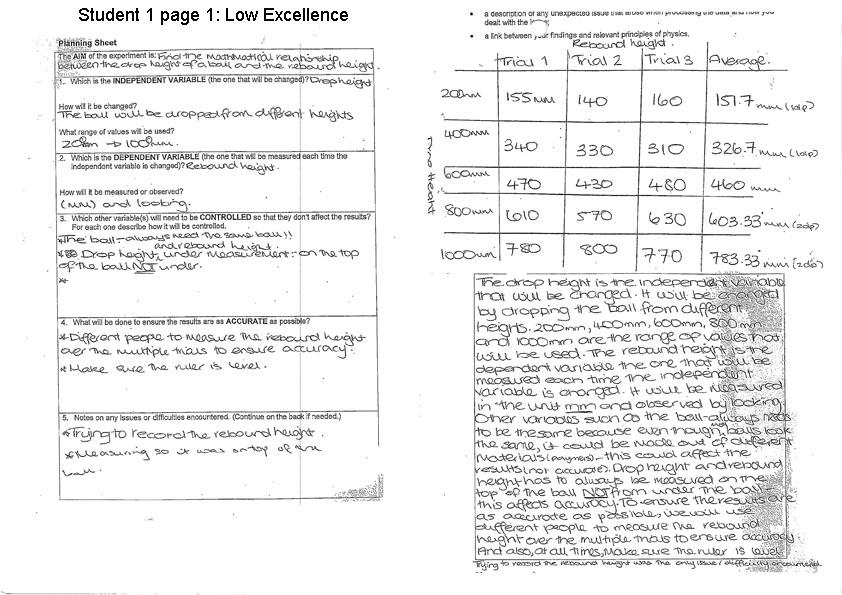
2 Exemplar for internal assessment resource 1.1B Physics for Achievement Standard Grade Boundary: Low Excellence At the Excellence level the students are required to carry out a comprehensive practical physics investigation, with direction, that leads to a linear mathematical relationship. Carrying out a comprehensive practical physics investigation involves writing a discussion that validates the conclusion. The discussion may include, as appropriate: a justification for the accuracy-improving techniques used a reason that there is a limit to either end of the value chosen for the independent variable a justification why a variable needs to be controlled a description of any difficulties encountered when making measurements and how these difficulties were overcome a link between investigation findings and applicable physics ideas a description of any unexpected outcomes of the processing of the results and a suggestion of how these outcomes could have been caused and/or the effect they had on the validity of the conclusion. The control variables have been discussed and the importance of using the same ball has been justified, they have discussed the possibility that other rubbers may give different rebound heights however this was not investigated in the experiment. Accuracy-improving techniques have been used and justified. A confused attempt has been made at providing a reason for a limit to the values chosen for the independent variable. An attempt at a description of any difficulties and the solution to these has been made but the justification does add to the work at the excellence level. To achieve the standard at the Excellence level more securely the student could include the following: reason for a limit to the values chosen for the independent variable a description of any difficulties and the solution to these a comment on the validity of the conclusion. Crown 2011
3

4
5
6 Exemplar for internal assessment resource 1.1B Physics for Achievement Standard Grade Boundary: High Merit At the Merit level the students are required to carry out an in-depth practical physics investigation, with direction, that leads to a linear mathematical relationship. Carrying out an in-depth practical physics investigation involves: controlling the variable(s) that could have a significant effect on the results using technique(s) that increase the accuracy of the measured values of the dependent (and independent, if appropriate) variable drawing a linear graph, valid for the data writing a conclusion that states the equation of the relationship. The link has been given between the findings of the investigation and the energy transformation from GPE to KE. The reliability of the results has not been fully discussed and the validity has only been very briefly mentioned. To achieve the standard at the Excellence level the student could include the following: a justification for the use of the accuracy improving techniques. a reason for the limits of the independent variable. a justification for why the variables should be controlled. a description of any difficulties and the solution to these a comment on the validity of the conclusion. Crown 2011

7

8
9 Exemplar for internal assessment resource 1.1B Physics for Achievement Standard Grade Boundary: Low Merit The control variables have been listed and techniques that increase accuracy, including repeating and averaging have been used whilst recording the data. The points on the graph are not all plotted accurately for the averaged value of the force. The gradient of the line has been calculated and the equation of the relationship has been stated in the conclusion. To achieve the standard at the Merit level more securely the student could include a linear graph, valid for the data. Crown 2011
10
11
12
13 Exemplar for internal assessment resource 1.1B Physics for Achievement Standard Grade Boundary: High Achieved At the achieved level the students are required to: Carry out a practical physics investigation, with direction, that leads to a linear mathematical relationship. Carry out a practical physics investigation involves: developing a method for collecting the data, collecting primary data, with units, relevant to the purpose, based on the manipulation of the independent variable over a reasonable range and number of values, drawing a graph, based on the data, writing a conclusion that links the processed data to the identified trend on the graph. The control variables which could have an effect on the results have been included. The use of repeating and averaging can be seen and parallax error has been considered. A linear graph has been drawn, however the force values for the masses 0.3 and 0.4 have not been plotted accurately and line of best fit has been forced through the origin and so does not fully reflect the data. The line should show an intercept which indicates a systematic error. The gradient has been calculated for the line of best fit and the correct equation has been given but has then been rearranged incorrectly. To achieve the standard at the Merit level the student could include the following: a linear graph, valid for the data a correctly stated equation for the relationship. Crown 2011
14
15
16
17 Exemplar for internal assessment resource 1.1B Physics for Achievement Standard Grade Boundary: Low Achieved The method has been developed which enables the data to be collected. Relevant data has been collected and has been stated with the appropriate units. The conclusion linking the data to the identified trend on the graph is given. A linear graph has been given for the data collected, the line of best fit is low as all the points not on the line are above it. The gradient calculation has been attempted but not given correctly. The use of repeating and averaging is evident. To achieve the standard more securely the student could include a slightly wider range and number of data points in the data collection, and a conclusion that is more clearly written in terms of the variables. Crown 2011
18

19
20 Exemplar for internal assessment resource 1.1B Physics for Achievement Standard Grade Boundary: High Not Achieved The method has been developed which enables the data to be collected. Relevant data has been collected over a reasonable range of values and has been stated with the appropriate units. A linear graph based on the data has been drawn and labelled. A gradient calculation has been attempted although the value is incorrect. The accuracy improving technique of repeating and averaging has been used and described. To achieve the standard the student could include the following a conclusion linking the processed data to the identified trend on the graph. Crown 2011

21
22
Exemplar for Internal Assessment Resource Mathematics and Statistics Level 1. Resource title: Taxi Charges
 Exemplar for internal assessment resource Mathematics and Statistics 1.4A for Achievement Standard 91029 Exemplar for Internal Assessment Resource Mathematics and Statistics Level 1 Resource title: Taxi
Exemplar for Internal Assessment Resource Mathematics and Statistics Level 1 Resource title: Carbon Credits
 Exemplar for internal assessment resource Mathematics and Statistics 1.1B for Achievement Standard 91026! Exemplar for Internal Assessment Resource Mathematics and Statistics Level 1 Resource title: Carbon
Exemplar for Internal Assessment Resource Mathematics Level 3. Resource title: Sport Science. Investigate bivariate measurement data
 Exemplar for internal assessment resource Mathematics 3.9A for Achievement Standard 91581 Exemplar for Internal Assessment Resource Mathematics Level 3 Resource title: Sport Science This exemplar supports
Exemplar for Internal Assessment Resource Design & Visual Communication Level 2. Resource title: Pavilion
 Exemplar for internal assessment resource Design & Visual Communication 2.33A for Achievement Standard 91340 Exemplar for Internal Assessment Resource Design & Visual Communication Level 2 Resource title:
1.4 - Linear Regression and MS Excel
 1.4 - Linear Regression and MS Excel Regression is an analytic technique for determining the relationship between a dependent variable and an independent variable. When the two variables have a linear
Exemplar for Internal Assessment Resource Science Level 1. Resource title: Are Biomags Dangerous?
 Exemplar for internal assessment resource Science 1.2B for Achievement Standard 90941 Exemplar for Internal Assessment Resource Science Level 1 Resource title: Are Biomags Dangerous? This exemplar supports
Exemplar for Internal Assessment Resource Physical Education Level 1. Resource title: My Interpersonal Skills
 Exemplar for internal assessment resource Physical Education 1.5A for Achievement Standard 90966 Exemplar for Internal Assessment Resource Physical Education Level 1 Resource title: My Interpersonal Skills
Smarter Balanced Assessment Consortium: Mathematics Practice Test Scoring Guide Grade 8
 Smarter Balanced Assessment Consortium: Mathematics Practice Test Scoring Guide Grade 8 08/01/2016 About the Practice Test Scoring Guides The Smarter Balanced Mathematics Practice Test Scoring Guides provide
Internal assessment details
 The tasks include the traditional hands-on practical investigations as in the previous course. The depth of treatment required for hands-on practical investigations is unchanged from the previous internal
Year 8 History. Progression Content and concepts (depth of understanding and. Skills mastery
 Year 8 History Progression Content and concepts (depth of understanding and pathway application 7-9 Students must be able to start consider the relative impact of factors on the causes, consequences and
1. The figure below shows the lengths in centimetres of fish found in the net of a small trawler.
 Bivariate Data 1 IB MATHEMATICS SL Topic: Bivariate Data NAME: DATE: 1. The figure below shows the lengths in centimetres of fish found in the net of a small trawler. Number of fish 11 10 9 8 7 6 5 4 3
I B Biology IA Handbook
 I B Biology IA Handbook E L S E G A P P M A S COPY MASTERS (For use with the IB Diploma programme) (Third edition) Author: Chris Talbot Series editor: David Greig Table of Contents Chapter 1 - Personal
MATHEMATICS J560/03. Summer 2017 examination series GCSE (9 1) Exemplar Candidate Work. J560 For first teaching in
 Exemplar Candidate Work. J560 For first teaching in") Qualification Accredited GCSE (9 1) MATHEMATICS J560 For first teaching in 2015 J560/03 Summer 2017 examination series Version 1 www.ocr.org.uk/maths Contents Introduction 3 Question 2 4 Question 3(b)
Qualification Accredited GCSE (9 1) MATHEMATICS J560 For first teaching in 2015 J560/03 Summer 2017 examination series Version 1 www.ocr.org.uk/maths Contents Introduction 3 Question 2 4 Question 3(b)
The graph should contain 5 major parts: the title, the independent variable, the dependent variable, the scales for each variable, and a legend.
 BLIZZARD BAG #2 Please complete the activity below. You will need to print out this activity sheet (pages 2-5 only) OR Write out the answers on a separate piece of paper and graph on a piece of graphing
FSA Training Papers Grade 7 Exemplars. Rationales
 FSA Training Papers Grade 7 Exemplars Rationales Rationales for Grade 7 Exemplars Reading Grade 7 Reading Exemplar #1: Score 3 Comprehension of the passages and task clearly evident Generally purposeful
Pearson Edexcel International GCSE in Mathematics (Specification A) (9-1) Exemplar student answers with examiner comments
 (9-1) Exemplar student answers with examiner comments") Pearson Edexcel International GCSE in Mathematics (Specification A) (9-1) Exemplar student answers with examiner comments 1 Contents About this booklet... 3 How to use this booklet.... 3 Guide on the use
Pearson Edexcel International GCSE in Mathematics (Specification A) (9-1) Exemplar student answers with examiner comments 1 Contents About this booklet... 3 How to use this booklet.... 3 Guide on the use
Examiners Report June GCE Psychology 8PS0 02
 Examiners Report June 2016 GCE Psychology 8PS0 02 Edexcel and BTEC Qualifications Edexcel and BTEC qualifications come from Pearson, the UK s largest awarding body. We provide a wide range of qualifications
1 Motion. What is motion? Focus Questions: How do we measure it? How do we show it? Name: pd date
 1 Motion Name: pd date Quick Write Focus Question: draw motion use words to describe motion (do not use move, movement, etc) Motion Notes definition symbol formula motion position initial position final
General Certificate of Education (A-level) January 2013 GEO4A. Geography. (Specification 2030) Unit 4A: Geography Fieldwork Investigation.
 January 2013 GEO4A. Geography. (Specification 2030) Unit 4A: Geography Fieldwork Investigation.") General Certificate of Education (A-level) January 2013 Geography GEO4A (Specification 2030) Unit 4A: Geography Fieldwork Investigation Mark Scheme Mark schemes are prepared by the Principal Examiner and
General Certificate of Education (A-level) January 2013 Geography GEO4A (Specification 2030) Unit 4A: Geography Fieldwork Investigation Mark Scheme Mark schemes are prepared by the Principal Examiner and
Section 3 Correlation and Regression - Teachers Notes
 The data are from the paper: Exploring Relationships in Body Dimensions Grete Heinz and Louis J. Peterson San José State University Roger W. Johnson and Carter J. Kerk South Dakota School of Mines and
AP STATISTICS 2013 SCORING GUIDELINES
 AP STATISTICS 2013 SCORING GUIDELINES Question 5 Intent of Question The primary goals of this question were to assess a student s ability to (1) recognize the limited conclusions that can be drawn from
Math Released Item Grade 7. Points in a Table VH095849
 Math Released Item 2017 Grade 7 Points in a Table VH095849 Anchor Set A1 A8 With Annotations Prompt VH095849 Rubric Score Description 3 Student response includes the following 3 elements. Reasoning component
MiSP Solubility Lab L3
 MiSP Solubility Lab L3 Name Date In today s lab you will be working in groups to determine whether sugar or salt dissolves more quickly in water. The rate at which different substances dissolve depends
High School Science MCA Item Sampler Teacher Guide
 High School Science MCA Item Sampler Teacher Guide Overview of Item Samplers Item samplers are one type of student resource provided to help students and educators prepare for test administration. While
Double Award GCSE Mathematics GCSE 1. Exemplar Paper 3 Section A (Higher Tier)
") Double Award GCSE Mathematics GCSE 1 Exemplar Paper 3 Section A (Higher Tier) Time allowed: 1 hour for section A Paper total: 120 marks (60 for section A; 60 for section B) Calculator not allowed for section
Double Award GCSE Mathematics GCSE 1 Exemplar Paper 3 Section A (Higher Tier) Time allowed: 1 hour for section A Paper total: 120 marks (60 for section A; 60 for section B) Calculator not allowed for section
AP STATISTICS 2009 SCORING GUIDELINES
 AP STATISTICS 2009 SCORING GUIDELINES Question 1 Intent of Question The primary goals of this question were to assess a student s ability to (1) construct an appropriate graphical display for comparing
QATs UNIT 3 OUTCOME 2 SCHOOL-ASSESSED COURSEWORK. VCE Physical Education. Introduction. Quality Assessment Tasks
 QATs Quality Assessment s UNIT 3 OUTCOME 2 VCE Physical Education SCHOOL-ASSESSED COURSEWORK Introduction OUTCOME 2 Use data collected in practical activities to analyse how the major body and energy systems
Correlated to: ACT College Readiness Standards Science (High School)
") ACT College Readiness Science Score Range - 1-12 Students who score in the 1 12 range are most likely beginning to develop the knowledge and skills assessed in the other score ranges. locate data in simple
ACT College Readiness Science Score Range - 1-12 Students who score in the 1 12 range are most likely beginning to develop the knowledge and skills assessed in the other score ranges. locate data in simple
Lesson 11 Correlations
 Lesson 11 Correlations Lesson Objectives All students will define key terms and explain the difference between correlations and experiments. All students should be able to analyse scattergrams using knowledge
Non-examined assessment: Exemplar 2 examiner commentary
 Non-examined assessment: Exemplar 2 examiner commentary A Level Geography Pearson Edexcel Level 3 Advanced GCE in Geography (9GE0) Non-examined assessment: Exemplar 2 Contents Candidate Title 1 Summary
Pre-Test Unit 9: Descriptive Statistics
 Pre-Test Unit 9: Descriptive Statistics You may use a calculator. The following table shows how many text messages different students sent this week. Answer the following questions using the table. 20
AP STATISTICS 2010 SCORING GUIDELINES
 AP STATISTICS 2010 SCORING GUIDELINES Question 1 Intent of Question The primary goals of this question were to assess students ability to (1) apply terminology related to designing experiments; (2) construct
What Is Science? Lesson Overview. Lesson Overview. 1.1 What Is Science?
 Lesson Overview 1.1 What Science Is and Is Not What are the goals of science? One goal of science is to provide natural explanations for events in the natural world. Science also aims to use those explanations
SOCIOLOGY. H580/02 Summer 2017 examination series A LEVEL. Exemplar Candidate Work. H580 For first teaching in
 Qualification Accredited Oxford Cambridge and RSA A LEVEL SOCIOLOGY H580 For first teaching in 2015 H580/02 Summer 2017 examination series Version 1 www.ocr.org.uk/sociology Contents Introduction 3 Section
Regression CHAPTER SIXTEEN NOTE TO INSTRUCTORS OUTLINE OF RESOURCES
 CHAPTER SIXTEEN Regression NOTE TO INSTRUCTORS This chapter includes a number of complex concepts that may seem intimidating to students. Encourage students to focus on the big picture through some of
*2) Interprets relevance of context
 Interprets relevance of context") Descriptors Students will be able to demonstrate their analytical reasoning abilities to interpret, evaluate, and synthesize information across disciplines. Criteria (2) Standard (1) Does Not Meet NA 1)
Descriptors Students will be able to demonstrate their analytical reasoning abilities to interpret, evaluate, and synthesize information across disciplines. Criteria (2) Standard (1) Does Not Meet NA 1)
SCATTER PLOTS AND TREND LINES
 1 SCATTER PLOTS AND TREND LINES LEARNING MAP INFORMATION STANDARDS 8.SP.1 Construct and interpret scatter s for measurement to investigate patterns of between two quantities. Describe patterns such as
MEASUREMENT OF SKILLED PERFORMANCE
 MEASUREMENT OF SKILLED PERFORMANCE Name: Score: Part I: Introduction The most common tasks used for evaluating performance in motor behavior may be placed into three categories: time, response magnitude,
Tuesday October 24 First Math Contest of the year room am,
 Tuesday October 24 First Math Contest of the year room 114 11 am, Then every second last Tuesday of the month. 1 MPM 1DI U4 D3 Line of Best Fit A line of best fit (or "trend" line) is a straight line that
Data Analysis, Statistics & Probability - ANSWER KEY DAY 1
 Data Analysis, Statistics & Probability - ANSWER KEY DAY 1 D 1. Dish, vanilla ice cream Sugar cone, vanilla ice cream Regular cone, vanilla ice cream 4. Dish, chocolate ice cream 5. Sugar cone, chocolate
Exemplar for Internal Achievement Standard. Mathematics and Statistics Level 3
 Exemplar for internal assessment resource Mathematics and Statistics for Achievement Standard 91582 Exemplar for Internal Achievement Standard Mathematics and Statistics Level 3 This exemplar supports
1 Version SP.A Investigate patterns of association in bivariate data
 Claim 1: Concepts and Procedures Students can explain and apply mathematical concepts and carry out mathematical procedures with precision and fluency. Content Domain: Statistics and Probability Target
Scatter Plots Homework
 Scatter Plots Homework 1. A dentist kept a record of the number of new cavities his patients had per year for the last 10 years. The scatter plot below shows the average number of new cavities per year
OPERATIONS AND ALGEBRAIC THINKING PRE -ASSESSMENT
 DESK Assessment Title Author / Source Submitted by Type of Assessment Description Scoring Guide, Rubric, or Key Link to Assessment Course: Davis Essential: Skills and Knowledge: 5 th Grade Mathematics
The Jumping Dog Quadratic Activity
 Standards: The Jumping Dog Quadratic Activity A2.4.1 Identify the family of function best suited for modeling a given real-world situation. A2.4.3 Using the adapted general symbolic form, draw reasonable
Conduct an Experiment to Investigate a Situation
 Level 3 AS91583 4 Credits Internal Conduct an Experiment to Investigate a Situation Written by J Wills MathsNZ jwills@mathsnz.com Achievement Achievement with Merit Achievement with Excellence Conduct
MITOCW conditional_probability
 MITOCW conditional_probability You've tested positive for a rare and deadly cancer that afflicts 1 out of 1000 people, based on a test that is 99% accurate. What are the chances that you actually have
MAT Intermediate Algebra - Final Exam Review Textbook: Beginning & Intermediate Algebra, 5th Ed., by Martin-Gay
 MAT1033 - Intermediate Algebra - Final Exam Review Textbook: Beginning & Intermediate Algebra, 5th Ed., by Martin-Gay Section 2.3 Solve the equation. 1) 9x - (3x - 1) = 2 1) 2) 1 3 x + 2 = 1 6 x + 4 3
Contents. Introduction x Acknowledgements
 Contents Introduction x Acknowledgements xiii CHAPTER 1 Number skills 1 Are you ready? 2 Order of operations 3 Exercise 1A 4 Integers 6 Exercise 1B 7 Investigation Golf scores 9 Estimation and rounding
Paper Airplanes & Scientific Methods
 Paper Airplanes & Scientific Methods Scientific Inquiry refers to the many different ways in which scientists investigate the world. Scientific investigations are one to answer questions and solve problems.
Publisher: Pearson Education, Inc. publishing as Prentice Hall
 Section I. Correlation with the Mathematics 2009 SOL and Curriculum Framework Rating 6.1 6.2 6.3 6.4 6.5 6.6 6.7 6.8 6.9 6.10 6.11 6.12 6.13 6.14 6.15 6.16 6.17 6.18 6.19 6.20 Section II. Additional Criteria:
The Scientific Method the process of doing science
 Steps The Scientific Method the process of doing science observation ask a question collect data hypothesis experiment analyze data draw conclusions communicate results Observing and Asking Questions Observation
5090 BIOLOGY. 5090/62 Paper 6 (Alternative to Practical), maximum raw mark 40
, maximum raw mark 40") CAMBRIDGE INTERNATIONAL EXAMINATIONS Cambridge Ordinary Level MARK SCHEME for the May/June 2015 series 5090 BIOLOGY 5090/62 Paper 6 (Alternative to Practical), maximum raw mark 40 This mark scheme is published
CAMBRIDGE INTERNATIONAL EXAMINATIONS Cambridge Ordinary Level MARK SCHEME for the May/June 2015 series 5090 BIOLOGY 5090/62 Paper 6 (Alternative to Practical), maximum raw mark 40 This mark scheme is published
3.2A Least-Squares Regression
 3.2A Least-Squares Regression Linear (straight-line) relationships between two quantitative variables are pretty common and easy to understand. Our instinct when looking at a scatterplot of data is to
The role of sampling assumptions in generalization with multiple categories
 The role of sampling assumptions in generalization with multiple categories Wai Keen Vong (waikeen.vong@adelaide.edu.au) Andrew T. Hendrickson (drew.hendrickson@adelaide.edu.au) Amy Perfors (amy.perfors@adelaide.edu.au)
The Koester Equation: The Quantification of. Progress Lost in a Data Set. By Stefan Wolfgang Koester.
 The Koester Equation: The Quantification of Progress Lost in a Data Set By Stefan Wolfgang Koester stefanwkoester@gmail.com ORCID #: 0000-0003-1156-4090 1. Introduction According to Samprit Chatterjee
Content Scope & Sequence
 Content Scope & Sequence GRADE 2 scottforesman.com (800) 552-2259 Copyright Pearson Education, Inc. 0606443 1 Counting, Coins, and Combinations Counting, Coins, and Combinations (Addition, Subtraction,
AP STATISTICS 2006 SCORING GUIDELINES (Form B) Question 5
 Question 5") AP STATISTICS 2006 SCORING GUIDELINES (Form B) Question 5 Intent of Question The primary goals of this question are to assess a student s ability to: (1) identify the response variable, treatments, and
AP STATISTICS 2006 SCORING GUIDELINES (Form B) Question 5 Intent of Question The primary goals of this question are to assess a student s ability to: (1) identify the response variable, treatments, and
GJump. by Thomas Tretter
 F O R C E A N D M O T I O N EggB U N GJump E E by Thomas Tretter In the spirit of the National Science Education Standards (NRC 1996), many teachers attempt to have their students experience science in
Exemplar for Internal Assessment Resource History Level 1 Resource title: Amritsar Massacre, 1919
 Exemplar for Internal Assessment Resource History Level 1 Resource title: Amritsar Massacre, 1919 This exemplar supports assessment against: Achievement Standard 91004 Demonstrate Understanding of Different
FSA Training Papers Grade 4 Exemplars. Rationales
 FSA Training Papers Grade 4 Exemplars Rationales Rationales for Grade 4 Exemplars Reading Grade 4 Reading Exemplar #1: Score 3 Comprehension of the passage(s) and task is clearly evident Includes details
Chapter 1: Exploring Data
 Chapter 1: Exploring Data Key Vocabulary:! individual! variable! frequency table! relative frequency table! distribution! pie chart! bar graph! two-way table! marginal distributions! conditional distributions!
Statistics. Dr. Carmen Bruni. October 12th, Centre for Education in Mathematics and Computing University of Waterloo
 Statistics Dr. Carmen Bruni Centre for Education in Mathematics and Computing University of Waterloo http://cemc.uwaterloo.ca October 12th, 2016 Quote There are three types of lies: Quote Quote There are
Bouncing Ball Lab. Name
 Bouncing Ball Lab Name Scientists use an organized set of steps when they solve problems or perform investigations. This organized set of steps is called the Scientific Method. There are many versions
Problem Set 3 ECN Econometrics Professor Oscar Jorda. Name. ESSAY. Write your answer in the space provided.
 Problem Set 3 ECN 140 - Econometrics Professor Oscar Jorda Name ESSAY. Write your answer in the space provided. 1) Sir Francis Galton, a cousin of James Darwin, examined the relationship between the height
Statistical reports Regression, 2010
 Statistical reports Regression, 2010 Niels Richard Hansen June 10, 2010 This document gives some guidelines on how to write a report on a statistical analysis. The document is organized into sections that
UNIT 1CP LAB 1 - Spaghetti Bridge
 Name Date Pd UNIT 1CP LAB 1 - Spaghetti Bridge The basis of this physics class is the ability to design an experiment to determine the relationship between two quantities and to interpret and apply the
Level 2 Mathematics and Statistics, 2013
 91267 912670 2SUPERVISOR S Level 2 Mathematics and Statistics, 2013 91267 Apply probability methods in solving problems 2.00 pm Monday 18 November 2013 Credits: Four Achievement Achievement with Merit
Unit 8 Day 1 Correlation Coefficients.notebook January 02, 2018
 [a] Welcome Back! Please pick up a new packet Get a Chrome Book Complete the warm up Choose points on each graph and find the slope of the line. [b] Agenda 05 MIN Warm Up 25 MIN Notes Correlation 15 MIN
Math MidTerm Exam & Math Final Examination STUDY GUIDE Spring 2011
 Math 006 - MidTerm Eam & Math 021 Final Eamination STUDY GUIDE Spring 2011 Name Score TOTAL Final Grade The use of a calculator ma be permitted on this eam. Duration of the Actual test is 0 minutes or
Simple Linear Regression the model, estimation and testing
 Simple Linear Regression the model, estimation and testing Lecture No. 05 Example 1 A production manager has compared the dexterity test scores of five assembly-line employees with their hourly productivity.
Pearson Edexcel International GCSE in Religious Studies (9-1) Paper 1: Christianity Questions 1-8. Exemplar student answers with examiner comments
 Paper 1: Christianity Questions 1-8. Exemplar student answers with examiner comments") Pearson Edexcel International GCSE in Religious Studies (9-1) Paper 1: Christianity Questions 1-8 Exemplar student answers with examiner comments Contents About this booklet 2 How to use this booklet 2
Pearson Edexcel International GCSE in Religious Studies (9-1) Paper 1: Christianity Questions 1-8 Exemplar student answers with examiner comments Contents About this booklet 2 How to use this booklet 2
Scatter Plots and Association
 ? LESSON 1.1 ESSENTIAL QUESTION Scatter Plots and Association How can you construct and interpret scatter plots? Measurement and data 8.11.A Construct a scatterplot and describe the observed data to address
Metabolic Biochemistry GST and the Effects of Curcumin Practical: Criterion-Referenced Marking Criteria Rubric
 Metabolic Biochemistry GST and the Effects of Curcumin Practical: Criterion-Referenced Marking Criteria Rubric You will be required to present class data in a laboratory report. In the week following the
6 th grade science. Drops on a Penny. changed, but the scientist keeps them the same so that they will not interfere with the
 Name Date Block Drops on a Penny Experimental investigations involve the manipulation of variables. Variables are the parts of the experiment that can change. Independent variables are the ONE thing that
Do not copy, post, or distribute
 1 CHAPTER LEARNING OBJECTIVES 1. Define science and the scientific method. 2. Describe six steps for engaging in the scientific method. 3. Describe five nonscientific methods of acquiring knowledge. 4.
MRS Advanced Certificate in Market & Social Research Practice. Preparing for the Exam: Section 2 Q5- Answer Guide & Sample Answers
 MRS Advanced Certificate in Market & Social Research Practice Preparing for the Exam: Section 2 Q5- Answer Guide & Sample Answers This answer guide was developed to provide support for examiners in marking
BIVARIATE DATA ANALYSIS
 BIVARIATE DATA ANALYSIS Sometimes, statistical studies are done where data is collected on two variables instead of one in order to establish whether there is a relationship between the two variables.
7) Briefly explain why a large value of r 2 is desirable in a regression setting.
 Briefly explain why a large value of r 2 is desirable in a regression setting.") Directions: Complete each problem. A complete problem has not only the answer, but the solution and reasoning behind that answer. All work must be submitted on separate pieces of paper. 1) Manatees are
Directions: Complete each problem. A complete problem has not only the answer, but the solution and reasoning behind that answer. All work must be submitted on separate pieces of paper. 1) Manatees are
Section 3.2 Least-Squares Regression
 Section 3.2 Least-Squares Regression Linear relationships between two quantitative variables are pretty common and easy to understand. Correlation measures the direction and strength of these relationships.
Exemplar for Internal Assessment Resource History Level 1. Resource title: The Desegregation of Little Rock High School
 Exemplar for internal assessment resource History 1.4B for Achievement Standard 91004! Exemplar for Internal Assessment Resource History Level 1 Resource title: The Desegregation of Little Rock High School
Cambridge International Examinations Cambridge International General Certificate of Secondary Education
 Cambridge International Examinations Cambridge International General Certificate of Secondary Education *6096073134* CO-ORDINATED SCIENCES 0654/61 Paper 6 Alternative to Practical May/June 2017 1 hour
Name: Date: Solubility Lab - Worksheet #3 Level 1
 Name: Date: Solubility Lab - Worksheet #3 Level 1 In today s lab you will be working in groups to determine whether sugar or salt dissolves more quickly in water. The rate at which different substances
Coke Floats (Or Does It?)
") Date Lab Time Name Objective Coke Floats (Or Does It?) Scientific measurements will be introduced using common soft drinks as examples. Studentcollected data will be pooled leading to a discussion of accuracy
Date Lab Time Name Objective Coke Floats (Or Does It?) Scientific measurements will be introduced using common soft drinks as examples. Studentcollected data will be pooled leading to a discussion of accuracy
Year Area Grade 1/2 Grade 3/4 Grade 5/6 Grade 7+ K&U Recognises basic features of. Uses simple models to explain objects, living things or events.
 Assessment Criteria: Science Year 7 (page 1 of 2) K&U Recognises basic features of Uses simple models to explain objects, living things or events. scientific ideas. Makes a comment about scientific Represents
SCIENTIFIC PROCESSES ISII
 SCIENTIFIC PROCESSES ISII Scientific Method Basic steps used by scientists in solving problems There is no The Scientific Method There is no 1 scientific method with X number of steps There are common
Theoretical Perspectives in the PhD thesis: How many? Dr. Terence Love We-B Centre School of Management Information Systems Edith Cowan University
 Theoretical Perspectives in the PhD thesis: How many? Dr. Terence Love We-B Centre School of Management Information Systems Edith Cowan University Content and purpose of the PhD thesis A candidate s PhD
10/4/2007 MATH 171 Name: Dr. Lunsford Test Points Possible
 Pledge: 10/4/2007 MATH 171 Name: Dr. Lunsford Test 1 100 Points Possible I. Short Answer and Multiple Choice. (36 points total) 1. Circle all of the items below that are measures of center of a distribution:
Math 075 Activities and Worksheets Book 2:
 Math 075 Activities and Worksheets Book 2: Linear Regression Name: 1 Scatterplots Intro to Correlation Represent two numerical variables on a scatterplot and informally describe how the data points are
GCE Religious Studies Unit A (RSS01) Religion and Ethics 1 June 2009 Examination Candidate Exemplar Work: Candidate A
 Religion and Ethics 1 June 2009 Examination Candidate Exemplar Work: Candidate A") hij Teacher Resource Bank GCE Religious Studies Unit A (RSS01) Religion and Ethics 1 June 2009 Examination Candidate Exemplar Work: Candidate A Copyright 2009 AQA and its licensors. All rights reserved.
hij Teacher Resource Bank GCE Religious Studies Unit A (RSS01) Religion and Ethics 1 June 2009 Examination Candidate Exemplar Work: Candidate A Copyright 2009 AQA and its licensors. All rights reserved.
Rela=onship Between Proximal Pressure and Flow
 Parameters of Vascular Function Model 1: Relationships between Pressure and Flow in a Single Vessel The following data were collected by perfusing individual arterioles and measuring the relationship between
Paper Airplanes & Scientific Methods
 Paper Airplanes & Scientific Methods Scientific Inquiry refers to the many different ways in which scientists investigate the world. Scientific investigations are done to answer questions and solve problems.
ARCHDIOCESE OF PHILADELPHIA Performance Assessment Level 4 Physical Education
 Performance Assessment Level 4 Name Date Teacher selects an aerobic activity to correlate with the assessment. 1. Complete the chart Take Pulse Beats per minute Calculate the range (bpm) between readings
Exemplar for Internal Assessment Resource English Level 2. Resource title: Sink your teeth into texts!
 Exemplar for internal assessment resource 2.7A English for Achievement Standard 91104 Exemplar for Internal Assessment Resource English Level 2 Resource title: Sink your teeth into texts! This exemplar
Student Performance Q&A:
 Student Performance Q&A: 2009 AP Statistics Free-Response Questions The following comments on the 2009 free-response questions for AP Statistics were written by the Chief Reader, Christine Franklin of
CRITERIA FOR USE. A GRAPHICAL EXPLANATION OF BI-VARIATE (2 VARIABLE) REGRESSION ANALYSISSys
 REGRESSION ANALYSISSys") Multiple Regression Analysis 1 CRITERIA FOR USE Multiple regression analysis is used to test the effects of n independent (predictor) variables on a single dependent (criterion) variable. Regression tests
Multiple Regression Analysis 1 CRITERIA FOR USE Multiple regression analysis is used to test the effects of n independent (predictor) variables on a single dependent (criterion) variable. Regression tests
NATIONAL SENIOR CERTIFICATE GRADE 11
 Mathematical Literacy/P2 1 DE/2013 NATIONAL SENIOR CERTIFICATE RADE 11 MATHEMATICAL LITERACY P2 EXEMPLAR 2013 MARKS: 100 TIME: 2 hours This question paper consists of 9 pages and 2 annexures. Mathematical
Admission Test Example. Bachelor in Law + Bachelor in Global Governance - BIG
 Admission Test Example Bachelor in Law + Bachelor in Global Governance - BIG Admission Test for the ESADE Bachelor in Law + Bachelor in Global Governance The Admission Test consists of the following parts: