Blood First Edition Paper, prepublished online September 11, 2017; DOI /blood
|
|
|
- Shawn Hopkins
- 5 years ago
- Views:
Transcription
1 From by guest on October 30, For personal use only. Blood First Edition Paper, prepublished online September 11, 2017; DOI /blood Topological Analysis Reveals a PD-L1 Associated Microenvironmental Niche for Reed- Sternberg Cells in Hodgkin Lymphoma d Christopher D. Carey 1,2*, Daniel Gusenleitner 3*, Mikel Lipschitz 3, Margaretha G.M. Roemer 4,5, Edward C. Stack 6, Evisa Gjini 3, Xihao Hu 7, Robert Re 7, Gordon J. Freeman 3,4, Donna Neuberg 7, F. Stephen Hodi 3,4, Xiaole Shirley Liu 7, Margaret A. Shipp 3,4, Scott J. Rodig 1,3 1. Department of Pathology, Brigham and Women s Hospital, Boston, MA 2. Northern Institute for Cancer Research, University of Newcastle upon Tyne, UK 3. Center for Immuno-Oncology, Dana-Farber Cancer Institute, Boston, MA 4. Department of Medical Oncology, Dana-Farber Cancer Institute, Boston, MA 5. VU University Medical Center, Department of Pathology, Amsterdam, Netherlands 6. PerkinElmer, Inc., Hopkinton, MA 7. Department of Biostatistics and Computational Biology, Dana-Farber Cancer Institute, Boston, MA *Equal Contribution Running title: Topology of PD-1:PD-L1 in Hodgkin lymphoma Keywords: Hodgkin Lymphoma, immune escape, PD-1, PD-L1 Correspondence: Scott J. Rodig, MD, PhD Department of Pathology Brigham & Women's Hospital Boston, MA 02215, USA Phone: srodig@partners.org Text word count: 3915 Abstract word count: 176 Figure count: 6 Table count: 0 Reference count: 32 Primary scientific category: Lymphoid neoplasia Copyright 2017 American Society of Hematology
2 KEY POINT Regionally localized PD-L1+ macrophages form a specialized microenvironmental niche for Hodgkin Reed-Sternberg cells in chl. d
3 ABSTRACT ed ed ed Signaling between programmed cell death protein 1 (PD-1) and the programmed cell death - 1 ligands (PD-1 ligands, PD-L1, PD-L2) is essential for malignant Hodgkin Reed-Sternberg (HRS) cells to evade anti-tumor immunity in classical Hodgkin lymphoma (chl). Copy number alterations of 9p24.1/CD274(PD-L1)/PDCD1LG2(PD-L2) contribute to robust PD-L1 and PD-L2 expression by HRS cells. PD-L1 is also expressed by non-malignant tumorassociated macrophages (TAMs) but the relationships between PD-L1+ HRS cells, PD-L1+ TAMs, and PD-1+ T-cells remain undefined. We used multiplex immunofluorescence and digital image analysis to examine the topography of PD-L1+ and PD-1+ cells in the tumor microenvironment (TME) of chl. We find that the majority of PD-L1 in the TME is expressed by the abundant which physically co-localize with PD-L1+ HRS cells in a microenvironmental niche. PD-L1+ TAMs are enriched for contacts with T-cells and PD-L1+ HRS cells are enriched for contacts with CD4+ T-cells, a subset of which are PD-1+. Our data define a unique topology of chl in which surround HRS cells and implicate CD4+ T-cells as a target of PD-1 blockade. ed ed ed d
4 INTRODUCTION ed ed Classical Hodgkin Lymphoma (chl) is a unique subtype of lymphoma, in which the malignant Hodgkin Reed-Sternberg (HRS) cells represent only a small proportion of the overall tumor cellularity (1-5%). 1 The tumor microenvironment (TME) is predominantly composed of inflammatory cells, including macrophages, CD4+ and CD8+ T cells, plasma cells, eosinophils, and other immune cells, yet anti-tumor immunity fails to effectively recognize and eliminate the malignant cells. HRS cells achieve immune evasion by multiple mechanisms including enhanced expression of programmed cell death-1 ligands (PD-L1 and PD-L2) that bind PD-1 (CD279) on the surface of antigen-experienced T-cells to suppress T- cell activation, and diminished or absent expression of MHC Class I to prevent recognition by the adaptive immune response. 2 5 The critical role for PD-1:PD-1 ligand interactions in chl was established with recent trials of monoclonal antibodies directed against PD Treatment with nivolumab, a fully human IgG4 antibody, in a phase I study resulted in an overall response rate (ORR) of 87% and complete remission (CR) rate of 17% in a series of patients with multiply relapsed/refractory chl. 6 In an expan phase II trial, comprising patients with relapsed/refractory disease following brentuximab vedotin and stem cell transplant, an objective response was seen in 66.3% of patients, with a progression-free survival (PFS) at 6 months of 76.9%, including patients with durable remissions. Importantly, patients with the highest PD-L1 expression among HRS cells had the best clinical response. 7 Similar clinical response rates were found in trials of pembrolizumab, a distinct antibody which also targets PD-1. 8,9 PD-1 ligand expression by HRS cells is attributable, in large part, to characteristic copy gains of chromosome 9p24.1, which includes the PD-L1, PD-L2, and JAK2 loci, and results in a direct increase in PD-L1 and PD-L2 transcripts and proteins, and an indirect increase due to augmented JAK-STAT signaling. 2,3 Critically, high level PD-L1/ PD-L2 copy gains (amplification) in HRS cells is associated with advanced stage disease and an inferior outcome following standard induction therapy. 3 However, not all PD-L1 protein within the chl TME is associated with HRS cells. We have shown that PD-L1 is also expressed by tumor-associated macrophages (TAMs). 10 This observation is of interest, as increased TAMs and a macrophage-related gene expression signature predict poor clinical response to combination chemotherapy in patients with advanced stage disease. 11 The number of TAMs that express PD-L1, the relative contribution of TAMs and HRS cells to the overall pool of PD-L1 in the TME, and the geographic distribution of PD-L1 expressing cells within the TME are undefined. Similarly, the numbers and types of T-cells that express PD-1 and their geographic distribution are unknown, despite the striking clinical effectiveness of PD-1 blockade. METHODS Tissue Samples Formalin-fixed, paraffin embed (FFPE) whole tissues from tumors were derived from the archives of Brigham & Women s Hospital, Boston, with IRB approval (2014P001721). Hematoxylin & eosin (H&E) stained tissue sections and the original diagnostic reports were reviewed by an expert hematopathologist (SR). Twenty cases were selected for the study, based on the availability of high quality, whole lymph node excision biopsy tissue (12 EBV negative; 8 EBV positive), including nodular sclerosing (NSHL, n=11), mixed cellularity (MCHL, n=6), lymphocyte rich (LRCHL, n=1), and chl, not otherwise specified (chl, NOS, n=2) subtypes (Supplementary Table 1). Multiplexed Immunofluorescence (IF) Multiplexed IF was performed by staining of 4-µm thick FFPE whole tissue sections with standard, primary antibodies sequentially and paired with a unique fluorochrome followed by d
5 staining with nuclear counterstain/ DAPI per published protocols For example, deparaffinized slides were incubated with anti-pd-l1 antibody (clone 9A11, Cell Signaling Technology, Danvers, MA) for 40 minutes and then treated with anti-mouse horseradish peroxidase-conjugated (HRP) secondary antibody (EnVision plus, Dako, Agilent Technologies, Carpinteria, CA) for 30 minutes. Immunofluorescence labeling was developed for a strictly-observed 5 minutes using Opal-520 amplification reagent (PerkinElmer, Hopkinton, MA) per manufacturer s direction. Slides were washed in Tris buffer (5 minutes) and then transferred to pre-heated citrate solution (90 C), before being heat-treated using a microwave set at 20% of maximum power for 15 minutes. Slides were cooled in the same solution to room temperature. In between all steps, the slides were washed with Tris buffer. The same process was repeated for the following antibodies / fluorescent dyes, in order: anti-cd30 (clone BerH2, Dako) / Opal-540, anti-cd68 (clone PGM1, Dako) / Opal-650, anti- CD163 (clone 10D6, ThermoFisher) / Opal-690. Each slide was then treated with 2 drops of NucBlue Fixed cell ReadyProbes reagent (#P36965, Life Technologies, Carlsbad, CA), washed in distilled water, and manually cover-slipped. Slides were air dried, mounted with Prolong Diamond Anti-fade mounting medium (#P36965, Life Technologies) and stored in a light-proof box at 4 C prior to imaging. The target antigens, antibody clones, and dilutions for markers inclu in this report and details of controls are listed in Supplementary Table 2 and in Supplementary Methods. Image Acquisition Test regions for multiplex IF analysis were identified in matched tissue sections stained for CD30 by chromogenic IHC. Two geographically distinct regions were selected for each tumor, to best represent the overall tissue and to include CD30+ HRS tumor cells and these regions were imaged using the Vectra multispectral imaging platform (Vectra 3, PerkinElmer, Hopkinton, MA) at 4x resolution. Areas with non-tumor or residual normal tissue (i.e. residual lymph node) were exclu from the analysis. For each region, 4 tiled fields of view (FOVs) were acquired at 20x resolution as multispectral images. Further details are provi in Supplementary Methods. Cell Identification After image capture, the FOVs were spectrally unmixed and analyzed using supervised machine learning algorithms within Inform 2.1 (PerkinElmer), which assigns phenotypes to all cells in the image, according to a combination of immunofluorescence characteristics associated with segmented nuclei (DAPI signal). Each cell-phenotype specific algorithm is based upon an iterative training / test process, whereby a small number of cells (training phase, typically cells) are manually selected as being most representative of each phenotype of interest and the algorithm then predicts the phenotype for all remaining cells (testing phase). 12 The decisions made by the software can be over-ruled to improve accuracy, until phenotyping is optimized. Unique phenotyping was performed for each tumor, and then applied to both tiled study images to account for inter-sample variability of signal intensities. Thresholds for "positive" staining and the accuracy of phenotypic algorithms were confirmed by the pathologist (SR) for each case. Inform (PerkinElmer) automatically derives maps of cell membranes and Cartesian coordinates for each phenotyped cell within the image. Quantification of the microenvironment The shortest Euclidian distance from each cell of one phenotype ( A ) towards the nearest cell of a second phenotype ( B ) was calculated using the Cartesian coordinates. These minimum distances from each cell of type A were then averaged to calculate the average nearest neighbor distance between cell type A and B (NN AB ). Physical interactions between two cells were determined based on the membrane maps that are provi by Inform 2.1. We examined each HRS cell, determined the numbers of each of the defined cell types interacting with it (i.e. CD4+ T-cells, CD8+ T-cells), and then took d
6 the average result for all HRS cells. In a similar manner, we also calculated percentages of populations that were within the immediate vicinity of a given cell type, e.g. the percentage of cell types that were not physically interacting but within a defined distance from any HRS cell. Aitional details are provi in Supplementary Methods. RESULTS Cell-specific expression and localization of in relation to PD-L1+ HRS cells Sequential immunofluorescence staining of 20 cases of chl revealed the expected patterns of cellular staining with anti-cd30 delineating cells morphologically consistent with HRS cells, anti-cd68 delineating cells morphologically consistent with TAMs, and anti-pd-l1 highlighting subsets of cells that co-express either CD30 or CD68 (Figure 1A). The number, distribution and morphology of CD30+ HRS cells and CD68+TAMs observed with multiplex IF were indistinguishable from those observed with chromogenic IHC (Supplementary Figure 1 and not shown). A machine-learning algorithm trained on the morphological and staining characteristics of selected cells identified HRS cells and TAMs accurately, as judged by visual review, and confirmed the presence of PD-L1 positive HRS cells and TAMs in every case tested (Figure 1B). We quantified the relative contribution of HRS cells and TAMs to total PD-L1 staining (calculated as percentage of total fluorescence units), and found that, for every case, TAMs contributed the majority of PD-L1 in the tumor microenvironment (TME) (Figure 1B). A mean of 78.5% of the total PD-L1 expression within the TME was contributed by TAMs across the series (range %; S.D. = 14.8). Visual inspection of stained tissue sections suggested possible enrichment of in the vicinity of PD-L1+ HRS cells (exemplified by case P6, Figure 2A; Supplementary Figure 2). To quantify this observation, we used the Cartesian coordinates for each of the thousands of cells of interest within each tissue section (Figure 2B), and calculated the respective distances from each PD-L1+ TAM to the nearest PD-L1+ HRS cell (Figure 2C) and the distances from each PD-L1- TAM to the nearest PD-L1+ HRS cell (Figure 2D). In all 20 cases, the mean distance from to the nearest PD-L1+ HRS cell was significantly less than the mean distance from PD-L1- TAMs to the nearest PD-L1+ HRS cell (Figure 2E). This difference was highly significant across the case series (p< , paired t-test). Conversely, the mean distance from PD-L1+ HRS cells to was shorter than the mean distance from PD-L1+ HRS cells to PD-L1- TAMs in 18 of 20 cases (Supplementary Figure 2G). This difference was also highly significant across the case series (p=0.0002, paired t-test). To ensure the specificity of the analysis, we also optimized IF staining for CD163, a macrophage marker with a more restricted expression pattern than CD68 (Supplementary Figure 3). We found that the majority of cells with positive staining for CD68 were also positive for CD163, as expected (Supplementary Figure 4A-D). By quantitative analysis, we found that the mean distance from PD-L1+ CD68+ CD163+ TAMs to the nearest PD-L1+ HRS cell was significantly less than the mean distance from PD-L1- CD68+ CD163+ TAMs to the nearest PD-L1+ HRS cell in all cases (p < , paired t-test; Supplementary Figure 4E); consistent with coordinate localization of with PD-L1+ HRS cells. T-cell specific expression and localization of PD-1 Immunostaining for PD-1 revealed positive staining of a subset of lymphocytes in chl (Supplementary Figure 5). Quantitative analysis confirmed that PD-1+ cells accounted for a minority of the T-cell population across the series (median 9% of CD4+ T-cells and 18% of CD8+ T-cells). In aition, we observed that levels of cellular PD-1 expression were lower among positive staining lymphocytes in the vicinity of HRS cells compared to positive staining lymphocytes within the residual germinal centers that were found in a subset of cases (Supplementary Figure 5). Quantitative analysis confirmed that the mean PD-1 expression by positive staining CD3+ T-cells in the vicinity of HRS cells was lower than e
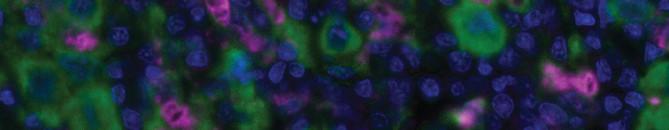
7 among the PD-1 high follicular helper T-cells (T FH ) within reactive germinal centers; consistent with the notion that PD-1+ T-cells in the chl TME express PD-1 at low to intermediate levels (Supplementary Figure 5E). 15,16 PD-1+ T-cells in relation to Visual inspection and cell phenotyping revealed that a subset of PD-1+ cells within the chl TME are CD4+ and that these cells appeared enriched in the vicinity of (exemplified by case N10, Figure 3A; B). Quantitative analysis revealed that the mean distance from PD-1+ CD4+ T-cells to the nearest PD-L1+ TAM was less than the mean distance from PD-1+ CD4+ T-cells to the nearest PD-L1- TAM in 16 of 20 cases (Figure 3C). This difference in distances was highly significant across the case series (p=0.004; Figure 3C). Similarly, we observed that the mean distance from PD-1+ CD8+ T-cells to the nearest PD-L1+ TAM (exemplified by case P6, Figure 3D; E) was less than the mean distance from PD-1+ CD8+ T-cells to the nearest PD-L1- TAM in 15 of 20 cases (Figure 3F). This difference was highly significant for the series (p=0.005) and, overall, consistent with coordinate regional localization of PD-1+ T-cells and. The mean distance from PD-1+ T-cells to was also weakly, but positively correlated with the mean distance from to PD-L1+ HRS cells for the series (r=0.269 for CD4+ T- cells and r=0.283 for CD8+ T-cells, respectively). PD-1+ T-cells in relation to PD-L1+ HRS cells We further wished to determine whether PD-1+ T-cells were preferentially oriented in proximity to PD-L1+ HRS cells. Quantitative analysis revealed that the mean distance from PD-1+ CD4+ T-cells to the nearest PD-L1+ HRS cell was less than the mean distance from PD-1+ CD4+ T-cells to the nearest PD-L1- HRS cell in 15 of 20 cases (Supplementary Figure 6). Thie difference was significant across the case series (p=0.03; Supplementary Figure 6C). The mean distance from PD-1+ CD8+ T-cells to the nearest PD-L1+ HRS cell (exemplified by case P6, Supplementary Figure 6D; E) was less than the mean distance from PD-1+ CD8+ T-cells to the nearest PD-L1- HRS cell in 13 of 20 cases (Supplementary Figure 6F). The difference did not reach significance for the series (p=0.1). T-cells in direct contact with TAMs Close visual inspection of stained tissue sections indicated PD-1+ expression on a subset of CD4+ T-cells and a subset of CD8+ T-cells in direct contact with TAMs (Figure 4A-D). CD4+ T-cells were more likely than CD8+ T-cells to be in direct contact with TAMs across the series (28% [95% CI 22%-34%] versus 7% [95% CI 6%-9%], respectively, Figure 4E). Moreover, CD4+ T-cells and CD8+ T-cells, as proportions of the cellularity, were both significantly higher at the points of contact with TAMs than at points without contact (>75 µm distant; p =0.01 and < 0.01, respectively; Figure 4E). PD-1+ CD4+ T-cells also excee PD-1+ CD8+ T-cells in contact with across the series (3.9% [95% CI 1.6%-6.3%] versus 1.8% [95% CI 1.0%-2.7%], respectively). Like T-cells in general, PD-1+ CD4+ T-cells and PD-1+ CD8+ T-cells, as proportions of the cellularity, were significantly higher at the points of contact with than at points without contact (>75 µm distant; p= 0.04 and <0.01, respectively; Figure 4F) consistent with the notion that PD-1+ CD4+ T-cells and PD-1+ CD8+ T-cells in contact with are a locally enriched population. T-cells in direct contact with HRS cells We also observed PD-1 on subsets of CD4+ T-cells and CD8+ T-cells in direct contact with HRS cells (Figure 5A-D). CD4+ T-cells excee CD8+ T-cells in contact with HRS cells across the series (35% of all contacts [95% CI 28%-42%] versus 4% all contacts [95% CI 3% 6%], respectively, Figure 5E). CD4+ T-cells, as proportions of the cellularity, were significantly higher at the points of contact with HRS cells than at points without contact (p <0.01; Figure 5E). In contrast, CD8+ T-cells, as proportions of the cellularity, were not e
8 significantly different at the points of contact with HRS cells and at points without contact (p= 0.78; Figure 5E). When the PD-1 status of the T-cells and PD-L1 status of the HRS cells were considered, we found that PD-1+ CD4+ T-cells excee PD-1+ CD8+ T-cells in contact with PD-L1+ HRS cells (4.7% of all contacts [95% CI 2.3%-7.1%] versus 1.8% [95% CI 0.8%-2.8%] respectively, Figure 5F). Like CD4+ T-cells in general, PD-1+ CD4+ T-cells were a higher proportion of the cellularity at the points of contact with PD-L1+ HRS than at points without contact (p< 0.01; Figure 5F). In contrast, the proportion of PD-1+ CD8+ T-cells was not significantly different between the points of contact with PD-L1+ HRS cells and at points without contact (p= 0.37; Figure 5F), consistent with the notion that PD-1+ CD4+ T-cells, but not PD-1+ CD8+ T-cells, are enriched in immediate proximity to PD-L1+ HRS cells. DISCUSSION PD-1 blockade is especially effective in chl, where 65-85% of patients with relapsed/refractory disease demonstrate clinical response. 6 8 The sensitivity of chl to PD-1 blockade is determined, in part, by genetic gains of PD-L1 and PD-L2 within the malignant HRS cells that result in robust expression of the PD-1 ligands that, in turn, engage PD-1 on infiltrating immune cells. 2,3,10,17 Here in, we defined the expression and topographic distribution of PD-L1+ and PD-1+ non-malignant cells in the chl microenvironment. We characterized the complex cellular TME in chl using FFPE diagnostic biopsies, simultaneously identifying tens of thousands of cells per sample across large regions of interest, including malignant HRS cells, TAMs and T-cells. In aition, we developed and employed the analytic means to quantify the relative proportion and location of cells expressing PD-L1 and PD-1, and the spatial relationships between specific cell populations. By these methods, we detected PD-L1 expression by at least a subset of HRS cells and TAMs in all chls, as in our previous studies using chromogenic IHC. 10 In all tumors, the majority of tissue PD-L1 was expressed by TAMs. This result is consistent with the observation that TAMs are, in general, far more common than HRS cells. Moreover, we find that TAMs are not randomly distributed; instead lie in greater proximity to PD- L1+ HRS cells than PD-L1- TAMs. The biological importance of this microenvironmental niche is supported by the preferential localization of PD-1+ T-cells in proximity to and for contact with. Taken together, our results suggest a model in which the inflammatory microenvironment of chl is highly organized with immediately surrounding HRS cells to engage PD-1+ T-cells and augment immunosuppression (Figure 6). Whether PD-L1 expression by TAMs is directly dependent upon the presence of HRS cells is unknown, but the are likely programmed as a consequence of the local cytokine milieu. Macrophages demonstrate marked phenotypic plasticity in response to their environment, 18 and the induction of PD-L1 can be mediated by a variety of cytokines, including IFNγ and GM-CSF. 17,19,20 These, and other pro-inflammatory cytokines, are produced by HRS cells, but also the T-cells, natural killer (NK) cells, and myeloid cells within the TME. 19,21 In this respect, the inflammatory TME of chl resembles that of certain solid tumors, in which PD-L1 expression by non-malignant cells, including macrophages, is prominent. 22 It will be of interest to micro-dissect and to interrogate regions rich in PD-L1+ TAMs to characterize the spectrum of cytokines and chemokines that define this specialized niche in greater detail. It will also be of interest to specifically isolate to determine whether they express aitional phenotypic markers of immunosuppression, such as indoleamine 2,3-dioxygenase 1 (IDO1), which might be targetable and thus synergize with PD-1 blockade. 18,23 e
9 Indeed, our data suggest that PD-1+ CD4+ T-cells may play a more important role in the anti-tumor response than previously anticipated. Recent studies indicate that CD4+ T-cells may themselves be able to directly kill tumor cells (even those lacking MHC-II), using mechanisms that are more traditionally associated with CD8+ CTLs. 27,28 In subsequent studies, it will be important to employ aitional phenotypic markers to further define the PD- 1+ CD4+ T-cell population, including those that identify CD4+ cytotoxic T-cells, Th1-type and Th2-type T-cells, and T-regulatory cells. 29 It will be useful to determine whether these cells express aitional immunoregulatory proteins, such as LAG-3, which are also targetable with novel therapies. 30 These data also suggest the importance of determining the distribution and exten functional phenotypes of aitional cell lineages, such as NK cells, NK/T-cells, and γδ T-cells, which can have prominent roles in executing anti-tumor immunity in the absence of MHC class I. 31,32 The methods described in this study can also be applied to B-cells, plasma cells, and other components of humoral immunity. To be effective, PD-L1 must engage PD-1 to inhibit anti-tumor immunity. Despite the marked clinical efficacy of checkpoint blockade, the critical cell populations that express PD- 1 and effect anti-tumor immunity in chl have remained undefined. We examined the expression of PD-1 on T-cells and found that those within the TME of chl express PD-1 at intermediate levels. Prior studies have established that T-cells with intermediate or low levels of PD-1 expression are antigen-experienced, exhausted T-cells that are primed for reactivation, whereas those with the highest levels of PD-1 include T FH cells in germinal centers and T-cells with an irreversibly exhausted phenotype in the periphery. 15,16,24 Thus, our data suggest that the majority of PD-1+ T-cells within the TME of chl have a PD-1 phenotype primed for re-activation. CD4+ and CD8+ T-cells, including a subset that are PD-1+, are enriched in the vicinity of, and in contact with,. This observation is consistent with the role of TAMs as professional antigen presenting cells (APCs) that process and present exogenous antigens, including those potentially from HRS cells, to CD4+ T-cells by the MHC Class II pathway and, through cross-presentation, to CD8+ T-cells by the MHC Class I pathway. 18 As a consequence, the may both promote anti-tumor immunity through antigen presentation to T-cells and to immunosuppression through the engagement of PD-1. Validation of these proposed activities will require functional studies. We find that CD4+ T-cells are more often in contact with HRS cells than CD8+ T-cells, consistent with previous studies. 25 Moreover, CD4+ T-cells in contact with HRS cells represent a locally enriched population, whereas CD8+ T-cells do not. Regions with HRS cells can be locally dense in inflammatory cells, a characteristic that can impact spatial analysis. This is particularly true in the nodular sclerosis subtype compared to the mixed cellularity subtype of chl. Regardless of subtype, however, we find that PD-L1+ macrophages and CD4+ T-cells are enriched relative to PD-L1- macrophages and CD8+ T- cells in the vicinity of and for contact with HRS cells. Similarly, we find that PD-1+ CD4+ T-cells but not PD-1+ CD8+ T-cells in contact with PD- L1+ HRS cells represent a locally enriched population. These observations are of particular interest given that HRS cells more generally express MHC class II than MHC class I. 4,26 Inactivating somatic mutations in β 2 -microglobulin (β 2 M) is a frequent genetic lesion among HRS cells, and the reduction and loss of expression of the β 2 M / MHC class I complex might be expected to compromise the ability of HRS cells to engage CD8+ T-cells. 4,5,26 The high percentage of chls with reduction or complete loss of the β 2 M/ MHC class I protein complex (79%) also indicates that CD8+ T-cells are unlikely to be the only effector cells associated with the efficiency of PD-1 blockade (65-85%) in chl. 4 e
10 Finally, the systematic analysis of a large cohort of diagnostic biopsy specimens, preferably in the context of a clinical trial, will be necessary to determine whether the topological arrangements we observe are associated with response to therapy. In aition, it will be essential to analyze biopsy samples taken from patients while on PD-1 inhibitor therapy to positively identify cell populations that are primarily responsible for HRS cell killing. In summary, we have quantified PD-L1:PD-1 interactions in a series of chl and find a common architectural framework in which the majority of PD-L1 in the microenvironment is derived from TAMs which, like HRS cells, are in extensive contact with PD-1+ T-cells. We propose that HRS tumor cells survive within a specialized cellular niche, an even more localized microenvironment within the broader tumor mass. This expands the overall pool of available PD-L1 surrounding HRS cells, and increases the potential for functional downregulation of PD-1+ T-cells before or at the time that they interact with HRS cells. Given that PD-L1+ and PD-1+ cells are in immediate proximity and in contact with HRS cells, it appears that the immune-suppressive and immune-stimulatory mechanisms governing anti-tumor immunity exist in a delicate and dynamic equilibrium. Further defining this immunologically privileged niche may uncover aitional therapeutic targets. ACKNOWLEDGEMENTS This work was supported in part by Leukemia & Lymphoma Society SCOR (SJR), R01 CA (MAS), International Immune Oncology Network of Bristol-Myers Squibb (FSH, MAS, SJR), the Center for Immuno-Oncology (FSH, SJR), and by the MRC/EPSRC Newcastle Molecular Pathology Node, Bloodwise, Bright Red and North East Promenaders against Cancer (CDC), and NCI P50CA (GJF). AUTHORSHIP CONTRIBUTIONS CC, DG, MAS, FSH, SR designed research; CC, DG, ML, MR, ED, EG performed research; GF, FSH contributed vital reagents and tools; CC, DG, ML, MR, ES, EG, XH, RR, MAS, DN, XSL, SR collected data, analyzed and interpreted data, RR, DN, XH, XSL performed statistical analysis; CC, SR wrote the manuscript. CONFLICTS OF INTEREST: Drs. Rodig, Hodi, and Shipp receive research funding from Bristol-Myers Squibb. GF has patents/pending royalties on the PD-1 pathway from Bristol- Myers-Squibb, Roche, Merck, EMD-Serono, Boehringer-Ingelheim, AstraZeneca, and Novartis. REFERENCES 1. Swerdlow SH, Campo E, Harris NL, et al. WHO Classification of Tumours of Haematopoietic and Lymphoid Tissues. Lyon: IARC; Green MR, Monti S, Rodig SJ, et al. Integrative analysis reveals selective 9p24.1 amplification, increased PD-1 ligand expression, and further induction via JAK2 in nodular sclerosing Hodgkin lymphoma and primary mediastinal large B-cell lymphoma. Blood. 2010;116(17): Roemer MGM, Advani RH, Ligon AH, et al. PD-L1 and PD-L2 Genetic Alterations Define Classical Hodgkin Lymphoma and Predict Outcome. J. Clin. Oncol. 2016;19(13): Roemer MGM, Advani RH, Re RA, et al. Classical Hodgkin Lymphoma with Reduced 2M/MHC Class I Expression Is Associated with Inferior Outcome
11 Independent of 9p24.1 Status. Cancer Immunol. Res. 2016;4(11): Reichel J, Chadburn A, Rubinstein PG, et al. Flow sorting and exome sequencing reveal the oncogenome of primary Hodgkin and Reed-Sternberg cells. Blood. 2015;125(7): Ansell SM, Lesokhin AM, Borrello I, et al. PD-1 Blockade with Nivolumab in Relapsed or Refractory Hodgkin s Lymphoma. N. Engl. J. Med. 2015;372(4): Younes A, Santoro A, Shipp M, et al. Nivolumab for classical Hodgkin s lymphoma after failure of both autologous stem-cell transplantation and brentuximab vedotin: a multicentre, multicohort, single-arm phase 2 trial. Lancet Oncol. 2016;17(9): Armand P, Shipp MA, Ribrag V, et al. Programmed death-1 blockade with pembrolizumab in patients with classical hodgkin lymphoma after brentuximab vedotin failure. J. Clin. Oncol. 2016;34(31): Chen R, Zinzani PL, Fanale MA, et al. Phase II Study of the Efficacy and Safety of Pembrolizumab for Relapsed/Refractory Classic Hodgkin Lymphoma. J. Clin. Oncol. 2017;35(19): Chen BJ, Chapuy B, Ouyang J, et al. PD-L1 expression is characteristic of a subset of aggressive B-cell lymphomas and virus-associated malignancies. Clin. Cancer Res. 2013;19(13): Steidl C, Lee T, Shah SP, et al. Tumor-Associated Macrophages and Survival in Classic Hodgkin s Lymphoma. N. Engl. J. Med. 2010;362(10): Feng Z, Puri S, Moudgil T, et al. Multispectral imaging of formalin-fixed tissue predicts ability to generate tumor-infiltrating lymphocytes from melanoma. J. Immunother. cancer. 2015;3: Tóth ZE, Mezey E. Simultaneous visualization of multiple antigens with tyramide signal amplification using antibodies from the same species. J. Histochem. Cytochem. 2007;55(6): Bogusz AM, Baxter RHG, Currie T, et al. Quantitative immunofluorescence reveals the signature of active B-cell receptor signaling in diffuse large B-cell lymphoma. Clin. Cancer Res. 2012;18(22): Dorfman DM, Brown JA, Shahsafaei A, et al. Programmed Death-1 (PD-1) is a Marker of Germinal Center-associated T Cells and Angioimmunoblastic T-Cell Lymphoma. Am. J. Surg. Pathol. 2006;30(7): Wherry EJ, Kurachi M. Molecular and cellular insights into T cell exhaustion. Nat. Rev. Immunol. 2015;15(8): Keir ME, Butte MJ, Freeman GJ, Sharpe AH. PD-1 and Its Ligands in Tolerance and Immunity. Annu. Rev. Immunol. 2008;26(1): Gabrilovich DI. Myeloid-Derived Suppressor Cells. Cancer Immunol. Res. 2017;5(1): Skinnider BF, Mak TW. The role of cytokines in classical Hodgkin lymphoma. Blood.
12 2002;99(12): Thorn M, Guha P, Cunetta M, et al. Tumor-associated GM-CSF overexpression induces immunoinhibitory molecules via STAT3 in myeloid-suppressor cells infiltrating liver metastases. Cancer Gene Ther. 2016;23(6): Farrar MA, Schreiber RD. The Molecular Cell Biology of Interferon-gamma and its Receptor. Annu. Rev. Immunol. 1993;11(1): Taube JM, Anders RA, Young GD, et al. Colocalization of inflammatory response with B7-h1 expression in human melanocytic lesions supports an adaptive resistance mechanism of immune escape. Sci. Transl. Med. 2012;4(127):127ra Chevolet I, Speeckaert R, Schreuer M, et al. Characterization of the in vivo immune network of IDO, tryptophan metabolism, PD-L1, and CTLA-4 in circulating immune cells in melanoma. Oncoimmunology. 2015;4(3):e Okazaki T, Chikuma S, Iwai Y, Fagarasan S, Honjo T. A rheostat for immune responses: the unique properties of PD-1 and their advantages for clinical application. Nat Immunol. 2013;14(12): Morris CS, Stuart AE. Reed-Sternberg-Lymphocyte Rosette: Lymphocyte Subpopulations as Defined by Monoclonal Antibodies. J.Clin.Pathol. 1984;37: Diepstra A, Niens M, Vellenga E, et al. Association with HLA class I in Epstein-Barr- virus-positive and with HLA class III in Epstein-Barr-virus-negative Hodgkin s lymphoma. Lancet (London, England). 2005;365(9478): Kitano S, Tsuji T, Liu C, et al. Enhancement of tumor-reactive cytotoxic CD4 T cell responses after ipilimumab treatment in four advanced melanoma patients. Cancer Immunol Res. 2013;1(235): Haabeth OAW, Tveita AA, Fauskanger M, et al. How do CD4+ T cells detect and eliminate tumor cells that either lack or express MHC class II molecules? Front. Immunol. 2014;5(APR): 29. Zhu J, Yamane H, Paul WE. Differentiation of Effector CD4 T Cell Populations. Annu. Rev. Immunol. 2010;28(1): Nguyen LT, Ohashi PS. Clinical blockade of PD1 and LAG3 potential mechanisms of action. Nat. Rev. Immunol. 2014;15(1): Waldhauer I, Steinle A. NK cells and cancer immunosurveillance. Oncogene. 2008;27(45): Vesely MD, Kershaw MH, Schreiber RD, Smyth MJ. Natural innate and adaptive immunity to cancer. Annu. Rev. Immunol. 2011;29:
13 FIGURE LEGENDS Figure 1. Expression of PD-L1 by HRS cells and TAMs. (A) Multiplex immunofluorescence staining (40x resolution, case P6) for CD30 (top left, orange) to highlight HRS cells, CD68 (bottom left, magenta) to highlight TAMs, and PD-L1 (green) to show co-localization of PD-L1 and CD30 (top right, co-localization= yellow) and PD-L1 and CD68 (bottom right). Each image includes a nuclear counterstain/dapi (blue). (B) The relative amount of total PD-L1 per tumor (calculated as percentage of total fluorescence units), contributed by HRS cells (black) and TAMs (gray). The cases are ordered by the percentage of PD-L1 attributed to HRS cells, from highest to lowest. Cell lineage assignments (HRS cell; TAM) are based upon pathologist-trained algorithms and include data from all fluorescent-channels (see Methods). Figure 2. Distances from and PD-L1- TAMs to the nearest PD-L1+ HRS cells. (A) Representative multiplex IF image (20x resolution; case P6) showing staining for CD30 (orange), CD68 (magenta), and PD-L1 (green). (B) Cellular phenotype map of the image shown in (A) depicting locations of PD-L1+ HRS cells (orange dots), (purple dots), and PD-L1- TAMs (pink dots). (C) Ray plot depicting the distance from each PD-L1+ TAM to the nearest PD-L1+ HRS cell. (D) Ray plot depicting the distance from each PD-L1- TAM to the nearest PD-L1+ HRS cell. (E) The mean distances (microns) and standard errors for all 20 study tumors, divi into mean distance from PD-L1- TAMs to the nearest PD-L1+ HRS cells (gray) and mean distance from to the nearest PD-L1+ HRS cells (black). The tumors are ordered by the distances from PD-L1- TAMs to PD-L1+ HRS cells, from highest to lowest; p value (<0.0001) was calculated by paired t-test. NN= nearest neighbor. Figure 3. Distances from PD-1+ CD4+ and PD-1+ CD8+ T-cells to the nearest. (A) Representative multiplex IF image (20x resolution; case N10) showing staining for CD4 (cyan), PD-1 (yellow), CD68 (magenta), and PD-L1 (green). (B) Cellular phenotype map of image shown in (A) depicting the locations of PD-1+ CD4+ T-cells (green dots), PD-L1+ TAMs (purple dots), PD-L1- TAMs (pink dots), and undefined cells (gray dots). (C) The mean distances (microns) and standard errors for all 20 study tumors, divi into mean distance from PD-1+ CD4+ T-cells to the nearest (black) and mean distance from PD-1+ CD4+T-cells to the nearest PD-L1- TAMs (gray). Tumors are ordered by the distance between PD-1+ CD4+ T-cells and PD-L1- TAMs, from highest to lowest; p value (0.004) was calculated by paired t-test. (D) Representative multiplex IF image (20x resolution; case P6) showing staining for CD8 (red), PD-1 (yellow), CD68 (magenta), and PD-L1 (green). (E) Cellular phenotype map of image shown in (D) depicting the locations of PD-1+ CD8+ T-cells (red dots), (purple dots), PD-L1- TAMs (pink dots), and undefined cells (gray dots). (F) The mean distances (microns) and standard error for all 20 study tumors, divi into mean distance from PD-1+ CD8+ T-cells to the nearest PD-L1+ TAMs (black) and mean distance from PD-1+ CD8+ T-cells to the nearest PD-L1- TAMs (gray). Tumors are ordered by the distance from PD-1+ CD8+ T-cells to the nearest and PD- L1- TAMs, from highest to lowest; p value (0.005) was calculated by paired t-test. NN= nearest neighbor.
14 e e e e e e e e e e e Figure 4. T-cell subsets in contact with TAMs. (A) Representative image (40x resolution; case N13) showing CD4+ T-cells (left panel, green) with co-expression of PD-1 (right panel, yellow) touching CD68+ TAMs (left and right panels, magenta). (B) Membrane map depicting CD4+ T-cells (PD-1+ dark green; PD-1- light green), and (purple). Cells are generally only outlined, with the exceptions of PD-1+ CD4+ T-cells and PD-L1+ TAMs that are in contact, which are filled to highlight the interaction. (C) Representative image (40x resolution; case N13) showing CD8+ T-cells (left panel, red) with co-expression of PD-1 (right panel, yellow) touching CD68+ TAMs (left and right panels, magenta). (D) Membrane map depicting CD8+ T-cells (PD-1+ dark red; PD-1- light red), and (purple). Cells are generally only outlined, with the exceptions of PD-1+ CD8+ T-cells and that are in contact, which are filled. (E) Mean and standard error of the proportion of cells that are CD4+ T-cells, CD8+ T-cells or undefined that are in contact with TAMs (black bars), within 75 µm of TAMs (gray bars), or >75 µm from TAMs (light gray bars), respectively; p values calculated by the Wilcoxon test. (F) Mean and standard error of the proportion of cells that are PD-1+ CD4+ T-cells, PD-1- CD4+ T-cells, PD-1+ CD8+ T-cells, or PD-1- CD8+ T-cells and that are in contact with (black bars), within 75 µm of PD-L1+TAMs (gray bars), or >75 µm from (light gray bars), respectively; p values calculated by the Wilcoxon test. Figure 5. T-cell subsets in contact with HRS cells. (A) Representative image (40x resolution; case N12) showing CD4+ T-cells (left panel, green) with co-expression of PD-1 (right panel, yellow) touching a CD30+ HRS cell (left and right panels, orange). (B) Membrane map depicting CD4+ T-cells (PD-1+ dark green; PD-1- light green), and PD-L1+ HRS cells (orange). Cell are generally only outlined, with the exceptions of PD-1+ CD4+ T-cells and PD-L1+ HRS cells that are in contact, which are filled to highlight the interaction. (C) Representative image (40x resolution; case P6) showing CD8+ T-cells (left panel, red) with co-expression of PD-1 (right panel, yellow) touching CD30+ HRS cells (left and right panels, orange). (D) Membrane map depicting CD8+ T-cells (PD-1+ dark red; PD-1- light red), and PD-L1+ HRS cells (orange). Cell are generally only outlined, with the exceptions of PD-1+ CD8+ T-cells and PD-L1+ HRS cells that are in contact, which are filled. (E) Mean and standard error of the proportion of cells that are CD4+ T-cells, CD8+ T-cells or undefined and that are in contact with HRS cells (black bars), within 75 µm of HRS cells (gray bars), or >75 µm from the HRS cells (light gray bars), respectively; p values calculated by the Wilcoxon test. (F) Mean and standard error of the proportion of cells that are PD-1+ CD4+ T-cells, PD-1- CD4+ T-cells, PD-1+ CD8+ T-cells, or PD-1- CD8+ T-cells in contact with PD- L1+ HRS cells (black bars), within 75 µm of PD-L1+ HRS cells (gray bars), or >75 µm from PD-L1+ HRS cells (light gray bars), respectively; p values calculated by the Wilcoxon test. Figure 6. Model of PD-1:PD-L1 Interactions in chl. Hodgkin Reed-Sternberg cells (purple) express PD-L1 (and PD-L2) due, in part, to copy gain of chromosome 9p24.1 which includes PD- L1/PD-L2/JAK2. Tumor-associated macrophages (blue) that are in proximity to HRS cells express high levels of PD-L1, likely in response to local cytokine production, and thereby significantly increase the total amount of PD-L1 in the vicinity of the malignant cells. Both TAMs' and HRS cells' PD-L1 is available to bind PD-1 on CD4+ T-cells (green) and CD8+ T- cells (red). CD4+ T-cells and PD-1+ CD4+ T-cells are in greater numbers and are specifically enriched in the vicinity of PD-L1+ HRS cells compared to CD8+ T-cells and PD- 1+ CD8+ T-cells and may indicate a preferential role for CD4+ T-cells during PD-1 blockade.
 From")


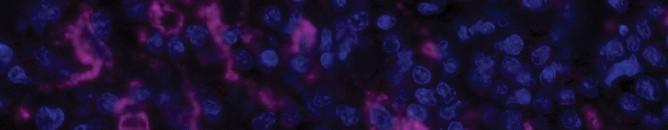


15 Figure 1 (A) From by guest on October 30, For personal use only. 50 mm 50 mm CD30 DAPI CD30 PD-L1 DAPI 50 mm 50 mm (B) 100 CD68 DAPI CD68 PD-L1 DAPI HRS cells TAMs Samples


 PD-L1+")
 100")

 Distance")


16 Figure 2 (A) From by guest on October 30, For personal use only. (B) 100 mm 100 m m CD30 CD68 PD-L1 (C) PD-L1+ HRS PD-L1- TAMs (D) 100 m m 100 mm PD-L1+ HRS PD-L1+ HRS PD-L1- TAMs (E) Distance from PD-L1+/- TAMs to PD-L1+ HRS cells Paired t-test < PD-L1 TAMs
 PD-L1- TAMs 100 mm PD-L1 100 mm")


17 Figure 3 (A) (D) 100 mm CD4 (B) PD-1 CD68 CD8 (E) PD-L1- TAMs 100 mm PD-L1 100 mm PD-1+ CD4+ (C) From by guest on October 30, For personal use only. PD-L1 TAMs CD68 PD-L1 100 mm Other Cells Distance from PD1+ CD4+ T-cells to PD-L1+/- TAMs Paired t-test : PD-1 PD-1+ CD8+ (F) PD-L1- TAMs Other Cells Distance from PD1+ CD8+ T-cells to PD-L1+/- TAMs Paired t-test : PD-L1 TAMs


 20 mm 20")


 (F) CD8+ PD-1+")
18 Figure 4 (A) 20 mm 20 mm From by guest on October 30, For personal use only. (B) 20 mm (C) CD68 CD4 DAPI CD68 PD-1 DAPI (D) 20 mm 20 mm 20 mm Touching TAMs CD4+ PD-1+ Not Touching TAMs CD4+ PD-1+ CD4+ PD-1- CD68 CD8 DAPI CD68 PD-1 DAPI Touching TAMs Not Touching TAMs (E) (F) CD8+ PD-1+ CD8+ PD-1+ CD8+ PD-1-


 20 mm 20")

 20")


19 Figure 5 (A) From by guest on October 30, For personal use only. (B) 20 mm 20 mm 20 mm CD30 CD4 DAPI CD30 PD-1 DAPI Touching HRS Not Touching HRS (C) 20 mm 20 mm (D) 20 mm PD-L1+ HRS CD4+ PD-1+ PD-L1+ HRS CD4+ PD-1+ CD4+ PD-1- CD30 CD8 DAPI CD30 PD-1 DAPI Touching HRS Not Touching HRS (E) (F) PD-L1+ HRS CD8+ PD-1+ PD-L1+ HRS CD8+ PD-1+ CD8+ PD-1-
20 Figure 6 From by guest on October 30, For personal use only.

21 Prepublished online September 11, 2017; doi: /blood Topological analysis reveals a PD-L1 associated microenvironmental niche for Reed-Sternberg cells in Hodgkin lymphoma Christopher D. Carey, Daniel Gusenleitner, Mikel Lipschitz, Margaretha G.M. Roemer, Edward C. Stack, Evisa Gjini, Xihao Hu, Robert Re, Gordon J. Freeman, Donna Neuberg, F. Stephen Hodi, Xiaole Shirley Liu, Margaret A. Shipp and Scott J. Rodig Information about reproducing this article in parts or in its entirety may be found online at: Information about ordering reprints may be found online at: Information about subscriptions and ASH membership may be found online at: Advance online articles have been peer reviewed and accepted for publication but have not yet appeared in the paper journal (edited, typeset versions may be posted when available prior to final publication). Advance online articles are citable and establish publication priority; they are indexed by PubMed from initial publication. Citations to Advance online articles must include digital object identifier (DOIs) and date of initial publication. Blood (print ISSN , online ISSN ), is published weekly by the American Society of Hematology, 2021 L St, NW, Suite 900, Washington DC Copyright 2011 by The American Society of Hematology; all rights reserved.
Untangling the tumor microenvironment
 Webinar Series Untangling the tumor microenvironment Illuminating the complex interactions & functions of immune cells December 10, 2014 Instructions for Viewers To share webinar via social media: To share
Immune checkpoint inhibitors in Hodgkin and non-hodgkin Lymphoma: How do they work? Where will we use them? Stephen M. Ansell, MD, PhD Mayo Clinic
 Immune checkpoint inhibitors in Hodgkin and non-hodgkin Lymphoma: How do they work? Where will we use them? Stephen M. Ansell, MD, PhD Mayo Clinic Conflicts of Interest Research Funding from Bristol Myers
Hodgkin Lymphoma Nivolumab
 New Drugs In Hematology Hodgkin Lymphoma Nivolumab Anas Younes, M.D. Chief, Lymphoma Service Memorial Sloan-Kettering Cancer Center Monday, May 9, 2016 2:10-2:25 p.m immunotherapy modalities CAR T Cells
Role of the Pathologist in Guiding Immuno-oncological Therapies. Scott Rodig MD, PhD
 Role of the Pathologist in Guiding Immuno-oncological Therapies Scott Rodig MD, PhD Department of Pathology, Brigham & Women s Hospital Center for Immuno-Oncology, Dana-Farber Cancer Institute Associate
Deciphering the biology that drives response to immunotherapy
 Deciphering the biology that drives response to immunotherapy Phenoptics TM Quantitative Pathology Platform Trent Norris, Field Application Scientist September 15, 2016 HUMAN HEALTH ENVIRONMENTAL HEALTH
Nivolumab in Hodgkin Lymphoma
 Nivolumab in Hodgkin Lymphoma Stephen M. Ansell, MD, PhD Professor of Medicine Chair, Lymphoma Group Mayo Clinic Conflicts of Interest Research Funding from Bristol Myers Squibb Celldex Therapeutics Seattle
Checkpoint Inhibition in Hodgkin s Lymphoma John Kuruvilla, MD & Rob Laister, PhD
 Checkpoint Inhibition in Hodgkin s Lymphoma John Kuruvilla, MD & Rob Laister, PhD Disclosures for Rob Laister Research Support Employee Consultant Major Stockholder Speakers Bureau Honoraria Scientific
2018 KSMO Immune Oncology Forum. Immune checkpoint inhibitors in hematologic. malignancies: evidences and perspectives 서울아산병원종양내과 홍정용
 2018 KSMO Immune Oncology Forum Immune checkpoint inhibitors in hematologic malignancies: evidences and perspectives 서울아산병원종양내과 홍정용 2018-07-18 Contents Introduction Immune checkpoint inhibtors in lymphomas
Kamakshi V Rao, PharmD, BCOP, FASHP University of North Carolina Medical Center UPDATE IN REFRACTORY HODGKIN LYMPHOMA
 Kamakshi V Rao, PharmD, BCOP, FASHP University of North Carolina Medical Center UPDATE IN REFRACTORY HODGKIN LYMPHOMA Objectives Describe the current standard approach for patients with relapsed/refractory
Immune Cell Phenotyping in Solid Tumors using Quantitative Pathology
 Immune Cell Phenotyping in Solid Tumors using Quantitative Pathology James R. Mansfield Director of Quantitative Pathology Applications 2009 PerkinElmer What is Quantitative Pathology? Quantitative Pathology
Constitutive AP-1 Activity and EBV Infection Induce PD-L1 in Hodgkin. Lymphomas and Post-transplant Lymphoproliferative Disorders:
 Constitutive AP-1 Activity and EBV Infection Induce PD-L1 in Hodgkin Lymphomas and Post-transplant Lymphoproliferative Disorders: Implications for Targeted Therapy Running title: AP-1 Activity and EBV
Mariano Provencio Servicio de Oncología Médica Hospital Universitario Puerta de Hierro. Immune checkpoint inhibition in DLBCL
 Mariano Provencio Servicio de Oncología Médica Hospital Universitario Puerta de Hierro Immune checkpoint inhibition in DLBCL Immunotherapy: The Cure is Inside Us Our immune system prevents or limit infections
Linfoma de Hodgkin. Novos medicamentos. Otavio Baiocchi CRM-SP
 Linfoma de Hodgkin Novos medicamentos Otavio Baiocchi CRM-SP 96.074 Hodgkin Lymphoma Unique B-cell lymphoma HRS malignant cells Scattered malignant Hodgkin-Reed-Sternberg (RS) cells in a background of
Immune Checkpoints. PD Dr med. Alessandra Curioni-Fontecedro Department of Hematology and Oncology Cancer Center Zurich University Hospital Zurich
 Immune Checkpoints PD Dr med. Alessandra Curioni-Fontecedro Department of Hematology and Oncology Cancer Center Zurich University Hospital Zurich Activation of T cells requires co-stimulation Science 3
Checkpoint Blockade in Hematology and Stem Cell Transplantation
 Checkpoint Blockade in Hematology and Stem Cell Transplantation Saad S. Kenderian, MD Assistant Professor of Medicine and Oncology Mayo Clinic College of Medicine October 14, 2016 2015 MFMER slide-1 Disclosures
Immunotherapy Approaches in Lymphoma
 Immunotherapy Approaches in Lymphoma John Kuruvilla MD FRCPC 1 Disclosures for John Kuruvilla MD Research Support Employee Leukemia and Lymphoma Society US, Rasch Foundation Roche, N/A Consultant Abbvie,
Haemato-Oncology ESMO PRECEPTORSHIP PROGRAMME IMMUNO-ONCOLOGY. Development and clinical experience Monique Minnema, hematologist
 Haemato-Oncology ESMO PRECEPTORSHIP PROGRAMME IMMUNO-ONCOLOGY Development and clinical experience Monique Minnema, hematologist Consultancy for disclosures Amgen, Celgene, Jansen Cilag, BMS, Takeda Immune
Navigating Treatment Pathways in Relapsed/Refractory Hodgkin Lymphoma
 Welcome to Managing Hodgkin Lymphoma. I am Dr. John Sweetenham from Huntsman Cancer Institute at the University of Utah. In today s presentation, I will be discussing navigating treatment pathways in relapsed
Priming the Immune System to Kill Cancer and Reverse Tolerance. Dr. Diwakar Davar Assistant Professor, Melanoma and Phase I Therapeutics
 Priming the Immune System to Kill Cancer and Reverse Tolerance Dr. Diwakar Davar Assistant Professor, Melanoma and Phase I Therapeutics Learning Objectives Describe the role of the immune system in cancer
Pembrolizumab in Relapsed/Refractory Classical Hodgkin Lymphoma: Phase 2 KEYNOTE-087 Study
 Pembrolizumab in Relapsed/Refractory Classical Hodgkin Lymphoma: Phase 2 KEYNOTE-087 Study Craig H. Moskowitz, 1 Pier Luigi Zinzani, 2 Michelle A. Fanale, 3 Philippe Armand, 4 Nathalie Johnson, 5 John
Immunotherapy in lung cancer. Saurabh maji
 Immunotherapy in lung cancer Saurabh maji Worldwide, lung cancer is the most common cause of cancerrelated deaths Small cell lung cancer (SCLC) presents with widespread disease at the time of diagnosis,
Darwinian selection and Newtonian physics wrapped up in systems biology
 Darwinian selection and Newtonian physics wrapped up in systems biology Concept published in 1957* by Macfarland Burnet (1960 Nobel Laureate for the theory of induced immune tolerance, leading to solid
Immune checkpoint inhibitors in lymphoma. Catherine Hildyard Haematology Senior Registrar Oxford University Hospitals NHS Foundation Trust
 Immune checkpoint inhibitors in lymphoma Catherine Hildyard Haematology Senior Registrar Oxford University Hospitals NHS Foundation Trust Aims How immune checkpoint inhibitors work Success of immune checkpoint
Supplemental materials
 Supplemental materials 1 Supplemental Fig. 1 Immunogram This immunogram summarizes patient clinical data and immune parameters at corresponding time points for Patient IMF-32. The top panel illustrates
New Systemic Therapies in Advanced Melanoma
 New Systemic Therapies in Advanced Melanoma Sanjay Rao, MD FRCPC Medical Oncologist (BCCA-CSI) Clinical Assistant Professor, UBC Faculty of Medicine SON Fall Update October 22, 2016 Disclosures Equity
IMMUNOTHERAPY FOR CANCER A NEW HORIZON. Ekaterini Boleti MD, PhD, FRCP Consultant in Medical Oncology Royal Free London NHS Foundation Trust
 IMMUNOTHERAPY FOR CANCER A NEW HORIZON Ekaterini Boleti MD, PhD, FRCP Consultant in Medical Oncology Royal Free London NHS Foundation Trust ASCO Names Advance of the Year: Cancer Immunotherapy No recent
New Agents Beyond Brentuximab vedotin for Hodgkin Lymphoma. Stephen M. Ansell, MD, PhD Professor of Medicine Mayo Clinic
 New Agents Beyond Brentuximab vedotin for Hodgkin Lymphoma Stephen M. Ansell, MD, PhD Professor of Medicine Mayo Clinic Disclosures for Stephen Ansell, MD, PhD In compliance with ACCME policy, Mayo Clinic
Welcome. Nanostring Immuno-Oncology Summit. September 21st, FOR RESEARCH USE ONLY. Not for use in diagnostic procedures.
 Welcome Nanostring Immuno-Oncology Summit September 21st, 2017 1 FOR RESEARCH USE ONLY. Not for use in diagnostic procedures. FOR RESEARCH USE ONLY. Not for use in diagnostic procedures. Agenda 4:00-4:30
Predictive Biomarkers for Pembrolizumab. Eric H. Rubin, M.D.
 Predictive Biomarkers for Pembrolizumab Eric H. Rubin, M.D. PD-1 and PD-L1/L2 Pathway PD-1 is an immune checkpoint receptor Binding of PD-1 by its ligands PD-L1 or PD-L2 leads to downregulation of T-cell
Tumor Immunity and Immunotherapy. Andrew Lichtman M.D., Ph.D. Brigham and Women s Hospital Harvard Medical School
 Tumor Immunity and Immunotherapy Andrew Lichtman M.D., Ph.D. Brigham and Women s Hospital Harvard Medical School Lecture Outline Evidence for tumor immunity Types of tumor antigens Generation of anti-tumor
PD-L1 and Immunotherapy of GI cancers: What do you need to know
 None. PD-L1 and Immunotherapy of GI cancers: What do you need to know Rondell P. Graham September 3, 2017 2017 MFMER slide-2 Disclosure No conflicts of interest to disclose 2017 MFMER slide-3 Objectives
VENTANA PD-L1 (SP142) Assay Guiding immunotherapy
 Assay Guiding immunotherapy") VENTANA PD-L1 (SP142) Assay Guiding immunotherapy Hiker s path: VENTANA PD-L1 (SP142) Assay on urothelial carcinoma tissue Location: Point Conception, CA VENTANA PD-L1 (SP142) Assay Identify patients most
VENTANA PD-L1 (SP142) Assay Guiding immunotherapy Hiker s path: VENTANA PD-L1 (SP142) Assay on urothelial carcinoma tissue Location: Point Conception, CA VENTANA PD-L1 (SP142) Assay Identify patients most
Combining ADCs with Immuno-Oncology Agents
 Combining ADCs with Immuno-Oncology Agents Chad May, PhD Senior Director Targeted Immunotherapy Oncology Research Unit, Pfizer 7 th Annual World ADC October 10, 2016 Cancer-Immunity Cycle Innate Immunity
Post-ASCO Immunotherapy Highlights (Part 2): Biomarkers for Immunotherapy
: Biomarkers for Immunotherapy") Post-ASCO Immunotherapy Highlights (Part 2): Biomarkers for Immunotherapy Lee S. Schwartzberg, MD, FACP Chief, Division of Hematology Oncology; Professor of Medicine, The University of Tennessee; The West
Post-ASCO Immunotherapy Highlights (Part 2): Biomarkers for Immunotherapy Lee S. Schwartzberg, MD, FACP Chief, Division of Hematology Oncology; Professor of Medicine, The University of Tennessee; The West
University of Groningen. The microenvironment of Hodgkin lymphoma Sattarzadeh, Ahmad
 University of Groningen The microenvironment of Hodgkin lymphoma Sattarzadeh, Ahmad IMPORTANT NOTE: You are advised to consult the publisher's version (publisher's PDF) if you wish to cite from it. Please
Exploring the PD-L1 Pathway
 Active Within the tumor microenvironment Steps 1-3: Initiating and propagating anticancer immunity 1 may inhibit T-cell activity in the tumor microenvironment Dendritic cells capture cancer and then prime
The Immune System. Innate. Adaptive. - skin, mucosal barriers - complement - neutrophils, NK cells, mast cells, basophils, eosinophils
 Objectives - explain the rationale behind cellular adoptive immunotherapy - describe methods of improving cellular adoptive immunotherapy - identify mechanisms of tumor escape from cellular adoptive immunotherapy
Tumor Immunology. Wirsma Arif Harahap Surgical Oncology Consultant
 Tumor Immunology Wirsma Arif Harahap Surgical Oncology Consultant 1) Immune responses that develop to cancer cells 2) Escape of cancer cells 3) Therapies: clinical and experimental Cancer cells can be
VENTANA PD-L1 (SP142) Assay Guiding immunotherapy in NSCLC
 Assay Guiding immunotherapy in NSCLC") VENTANA (SP142) Assay Guiding immunotherapy in NSCLC Hiker s path: VENTANA (SP142) Assay on non-small cell lung cancer tissue Location: Point Conception, CA VENTANA (SP142) Assay Assess NSCLC patient benefit
VENTANA (SP142) Assay Guiding immunotherapy in NSCLC Hiker s path: VENTANA (SP142) Assay on non-small cell lung cancer tissue Location: Point Conception, CA VENTANA (SP142) Assay Assess NSCLC patient benefit
Effector T Cells and
 1 Effector T Cells and Cytokines Andrew Lichtman, MD PhD Brigham and Women's Hospital Harvard Medical School 2 Lecture outline Cytokines Subsets of CD4+ T cells: definitions, functions, development New
A CME-certified Oncology Exchange Program
 A CME-certified Oncology Exchange Program Jointly provided by Potomac Center for Medical Education and Rockpointe Supported by an educational grant from Seattle Genetics, Inc. Re-treatment with BV Bartlett
Tumor Microenvironment and Immune Suppression
 Tumor Microenvironment and Immune Suppression Hassane M. Zarour,, MD Department of Medicine, Division of Hematology-Oncology, University of Pittsburgh Cancer Institute Hallmarks of Cancer: The Next Generation
Biomarcatori per la immunoterapia: cosa e come cercare Paolo Graziano
 Biomarcatori per la immunoterapia: cosa e come cercare Paolo Graziano Unit of Pathology Fondazione IRCCS Casa Sollievo della Sofferenza San Giovanni Rotondo, Foggia,Italy p.graziano@operapadrepio.it Disclosure
Relapse After Transplant: Next Steps for Patients with Hodgkin Lymphoma
 Hi! My name is Alison Moskowitz. I am an attending at Memorial Sloan Kettering Cancer Center within the Lymphoma Department. I am speaking on behalf of ManagingHodgkinLymphoma.com. I will be discussing
Treating for Cure or Palliation: Difficult Decisions for Older Adults with Lymphoma
 Treating Frail Adults With Common Malignancies: Best Evidence to Personalize Therapy Treating for Cure or Palliation: Difficult Decisions for Older Adults with Lymphoma Raul Cordoba, MD, PhD Lymphoma Unit
Understanding Checkpoint Inhibitors: Approved Agents, Drugs in Development and Combination Strategies. Michael A. Curran, Ph.D.
 Understanding Checkpoint Inhibitors: Approved Agents, Drugs in Development and Combination Strategies Michael A. Curran, Ph.D. MD Anderson Cancer Center Department of Immunology Disclosures I have research
IMMUNOTHERAPY FOR GASTROINTESTINAL CANCERS
 IMMUNOTHERAPY FOR GASTROINTESTINAL CANCERS Dr Elizabeth Smyth Cambridge University Hospitals NHS Foundation Trust ESMO Gastric Cancer Preceptorship Valencia 2018 DISCLOSURES Honoraria for advisory role
The PD-1 pathway of T cell exhaustion
 The PD-1 pathway of T cell exhaustion SAMO 18.3.2016 Overview T cell exhaustion Biology of PD-1 Mechanism Ligands expressed on tumor cell and on non-tumor cells other receptor pairs Biomarkers for apd-1/pd-l1
Interpreting Therapeutic Response on Immune Cell Number and Spatial Distribution within the Tumor Microenvironment. Lorcan Sherry, CSO OracleBio
 Interpreting Therapeutic Response on Immune Cell Number and Spatial Distribution within the Tumor Microenvironment Lorcan Sherry, CSO OracleBio Company Overview OracleBio is a specialised CRO providing
PTAC meeting held on 5 & 6 May (minutes for web publishing)
") PTAC meeting held on 5 & 6 May 2016 (minutes for web publishing) PTAC minutes are published in accordance with the Terms of Reference for the Pharmacology and Therapeutics Advisory Committee (PTAC) and
PTAC meeting held on 5 & 6 May 2016 (minutes for web publishing) PTAC minutes are published in accordance with the Terms of Reference for the Pharmacology and Therapeutics Advisory Committee (PTAC) and
VENTANA PD-L1 (SP142) Assay
 Assay") VENTANA (SP142) Assay Guiding immunotherapy Hiker s path: VENTANA (SP142) Assay on urothelial carcinoma tissue Location: Point Conception, CA VENTANA (SP142) Assay Assess UC patient benefit from TECENTRIQ
VENTANA (SP142) Assay Guiding immunotherapy Hiker s path: VENTANA (SP142) Assay on urothelial carcinoma tissue Location: Point Conception, CA VENTANA (SP142) Assay Assess UC patient benefit from TECENTRIQ
Immunotherapy in NSCLC Pathologist role
 Immunotherapy in NSCLC Pathologist role Pimpin Incharoen, M.D. Assistant Professor, Thoracic Pathology Department of Pathology, Ramathibodi Hospital Genetic alterations in NSCLC Khono et al, Trans Lung
Emerging Tissue and Serum Markers
 Emerging Tissue and Serum Markers for Immune Checkpoint Inhibitors Kyong Hwa Park MD, PhD Medical Oncology Korea University College of Medicine Contents Immune checkpoint inhibitors in clinical practice
Novel RCC Targets from Immuno-Oncology and Antibody-Drug Conjugates
 Novel RCC Targets from Immuno-Oncology and Antibody-Drug Conjugates Christopher Turner, MD Vice President, Clinical Science 04 November 2016 Uveal Melanoma Celldex Pipeline CANDIDATE INDICATION Preclinical
Discover the PD-1 pathway and its role in cancer 105/15 -ONCO- 07/15
 Discover the PD-1 pathway and its role in cancer 105/15 -ONCO- 07/15 Immunology in cancer The role of immunology in cancer Evolving knowledge of the immune system has provided a better understanding of
Interpretation Manual - Gastric or Gastroesophageal Junction Adenocarcinoma. PD-L1 IHC 22C3 pharmdx is FDA-approved for in vitro diagnostic use
 Interpretation Manual - Gastric or Gastroesophageal Junction Adenocarcinoma PD-L1 IHC 22C3 pharmdx is FDA-approved for in vitro diagnostic use For countries outside of the United States, see the local
Exploring Immunotherapies: Beyond Checkpoint Inhibitors
 Exploring Immunotherapies: Beyond Checkpoint Inhibitors Authored by: Jennifer Dolan Fox, PhD VirtualScopics (Now part of BioTelemetry Research) jennifer_fox@virtualscopics.com +1 585 249 6231 Introduction
Presented at the 59th American Society of Hematology (ASH) Annual Meeting & Exposition; December 9 12, 2017; Atlanta, GA, USA
 Annual Meeting & Exposition; December 9 12, 2017; Atlanta, GA, USA") 65 Nivolumab Treatment Beyond Investigator-Assessed Progression: Outcomes in Patients With Relapsed/Refractory Classical Hodgkin Lymphoma From the Phase 2 CheckMate 25 Study Jonathon B. Cohen, 1 Andreas
65 Nivolumab Treatment Beyond Investigator-Assessed Progression: Outcomes in Patients With Relapsed/Refractory Classical Hodgkin Lymphoma From the Phase 2 CheckMate 25 Study Jonathon B. Cohen, 1 Andreas
Use of Single-Arm Cohorts/Trials to Demonstrate Clinical Benefit for Breakthrough Therapies. Eric H. Rubin, MD Merck Research Laboratories
 Use of Single-Arm Cohorts/Trials to Demonstrate Clinical Benefit for Breakthrough Therapies Eric H. Rubin, MD Merck Research Laboratories Outline Pembrolizumab P001 study - example of multiple expansion
Supplementary Appendix
 Supplementary Appendix This appendix has been provided by the authors to give readers additional information about their work. Supplement to: Schuster SJ, Svoboda J, Chong EA, et al. Chimeric antigen receptor
PD-1/PD-L1 Checkpoint in Lymphoprolipherative Malignancies: Focus on Critical Points for Tissue Assessment
 ARC Journal of Hematology Volume 2, Issue 2, 2017, PP 1-6 www.arcjournals.org PD-1/PD-L1 Checkpoint in Lymphoprolipherative Malignancies: Focus on Critical Points for Tissue Antonella Bianchi 1*, Ombretta
PRESAGE CIVO: A NOVEL PLATFORM FOR PRECISION ONCOLOGY & DRUG DEVELOPMENT
 PRESAGE : A NOVEL PLATFORM FOR PRECISION ONCOLOGY & DRUG DEVELOPMENT DECEMBER 2017 Presage Biosciences, Inc. 2017. All rights reserved. Presage Proprietary Biosciences, information. Inc. 2017. All rights
Cytokine Arrays Reveal Black Ops Tactics of Tumor-induced Immunosuppression
 Cytokine Arrays Reveal Black Ops Tactics of Tumor-induced Immunosuppression Jarad J Wilson, Ph.D. Technical Support & Marketing Specialist Ruo-Pan Huang, MD, Ph.D. Founder and CEO What are Antibody Arrays?
The Immunotherapy of Oncology
 The Immunotherapy of Oncology The 30-year Overnight Success Story M Avery, BIOtech Now 2014 Disclosures: Geoffrey R. Weiss, M.D. None The History A. Chekov: It has long been noted that the growth of malignant
Cancer immunity and immunotherapy. General principles
 1 Cancer immunity and immunotherapy Abul K. Abbas UCSF General principles 2 The immune system recognizes and reacts against cancers The immune response against tumors is often dominated by regulation or
Checkpoint blockade in lymphoma
 CONTEMPORARY THERAPY OF LYMPHOMA Checkpoint blockade in lymphoma Philippe Armand 1 1 Division of Medical Oncology, Dana-Farber Cancer Institute, Boston, MA Immune checkpoint blockade therapy (CBT) was
Immuno-Oncology Clinical Trials Update: Therapeutic Anti-Cancer Vaccines Issue 7 April 2017
 Delivering a Competitive Intelligence Advantage Immuno-Oncology Clinical Trials Update: Therapeutic Anti-Cancer Vaccines Issue 7 April 2017 Immuno-Oncology CLINICAL TRIALS UPDATE The goal of this MONTHLY
News from ASCO. Niven Mehra, Medical Oncologist. Radboud UMC Institute of Cancer Research and The Royal Marsden Hospital
 News from ASCO Niven Mehra, Medical Oncologist Radboud UMC Institute of Cancer Research and The Royal Marsden Hospital Disclosures Speaker fees: Merck, Bayer Advisory boards: Janssen-Cilag Research and
Immunology Lecture 4. Clinical Relevance of the Immune System
 Immunology Lecture 4 The Well Patient: How innate and adaptive immune responses maintain health - 13, pg 169-181, 191-195. Immune Deficiency - 15 Autoimmunity - 16 Transplantation - 17, pg 260-270 Tumor
Reflex Testing Guidelines for Immunotherapy in Non-Small Cell Lung Cancer
 Reflex Testing Guidelines for Immunotherapy in Non-Small Cell Lung Cancer Jimmy Ruiz, MD Assistant Professor Thoracic Oncology Program Wake Forest Comprehensive Cancer Center Disclosures I have no actual
Glioblastoma and CNS tumors
 Glioblastoma and CNS tumors PRECEPTORSHIP PROGRAMME IMMUNO-ONCOLOGY Amsterdam, 1 October 2016 Patrick Roth Department of Neurology and Brain Tumor Center University Hospital Zurich Immunology in the CNS
Melanoma: Immune checkpoints
 ESMO Preceptorship Programme Immuno-Oncology Siena, July 04-05, 2016 Melanoma: Immune checkpoints Michele Maio Medical Oncology and Immunotherapy-Department of Oncology University Hospital of Siena, Istituto
Innovation in Prevention, Early Detection & Diagnosis of Colorectal Cancer Heidelberg Workshop Session VI, Oncology Pipeline June 6, 2014
 Innovation in Prevention, Early Detection & Diagnosis of Colorectal Cancer Heidelberg Workshop Session VI, Oncology Pipeline June 6, 2014 Bernd Mueller MSD Sharp & Dohme, Germany Normal Immune Surveillance:
Immunotherapy: The Newest Treatment Route
 Immunotherapy: The Newest Treatment Route IWMF Patient Forum, Phoenix, AZ Madhav Dhodapkar, MD Professor of Medicine and Immunobiology Chief, Section of Hematology Yale University or the Oldest William
Current Trends in Melanoma Theresa Medina, MD UCD Cutaneous Oncology
 Current Trends in Melanoma Theresa Medina, MD UCD Cutaneous Oncology Overview Melanoma incidence and prevention Approach to surgical management of early melanoma Landscape of Advanced Melanoma Therapy
Immunotherapy, an exciting era!!
 Immunotherapy, an exciting era!! Yousef Zakharia MD University of Iowa and Holden Comprehensive Cancer Center Alliance Meeting, Chicago November 2016 Presentation Objectives l General approach to immunotherapy
Aggressive lymphomas ASH Dr. A. Van Hoof A.Z. St.Jan, Brugge-Oostende AV
 Aggressive lymphomas ASH 2015 Dr. A. Van Hoof A.Z. St.Jan, Brugge-Oostende AV CHOP 1992 2002 R-CHOP For DLBCL High dose chemo With PBSCT Aggressive lymphomas 1.DLBCL 2.Primary Mediastinal Lymphoma 3.CNS
Bases for Immunotherapy in Multiple Myeloma
 Bases for Immunotherapy in Multiple Myeloma Paola Neri, MD, PhD Associate Professor of Medicine University of Calgary, Arnie Charbonneau Cancer Institute Disclosures Paola Neri MD, PhD Grants/research
Hodgkin Lymphoma. Barbara Pro, MD Robert H. Lurie Comprehensive Cancer Center of Northwestern University Chicago, Illinois
 Hodgkin Lymphoma Barbara Pro, MD Robert H. Lurie Comprehensive Cancer Center of Northwestern University Chicago, Illinois Hodgkin Lymphoma Successes and Challenges The success 80 % of patients achieve
Best of ASH A selection by Fritz Offner UZ Gent
 Best of ASH 2014 A selection by Fritz Offner UZ Gent Best of ASH 2014 1. Checkpoint inhibition in immunotherapy : antipd-1 in lymphoma 2. Evolution in CAR-T and bispecific antibodies in B-ALL 3. Treatment
NK/T cell lymphoma Recent advances. Y.L Kwong University Department of Medicine Queen Mary Hospital
 NK/T cell lymphoma Recent advances Y.L Kwong University Department of Medicine Queen Mary Hospital Natural killer cell lymphomas NK cell lymphomas are mainly extranodal lymphomas Clinical classification
Immune Checkpoint Inhibitors: The New Breakout Stars in Cancer Treatment
 Immune Checkpoint Inhibitors: The New Breakout Stars in Cancer Treatment 1 Introductions Peter Langecker, MD, PhD Executive Medical Director, Global Oncology Clinipace Worldwide Mark Shapiro Vice President
Challenges in Distinguishing Clinical Signals to Support Development Decisions: Case Studies
 Challenges in Distinguishing Clinical Signals to Support Development Decisions: Case Studies David Feltquate MD, PhD Head of Early Clinical Development, Oncology Bristol-Myers Squibb, Princeton, NJ Challenges
Immunopathology of Lymphoma
 Immunopathology of Lymphoma Noraidah Masir MBBCh, M.Med (Pathology), D.Phil. Department of Pathology Faculty of Medicine Universiti Kebangsaan Malaysia Lymphoma classification has been challenging to pathologists.
PET-adapted therapies in the management of younger patients (age 60) with classical Hodgkin lymphoma
 with classical Hodgkin lymphoma") PET-adapted therapies in the management of younger patients (age 60) with classical Hodgkin lymphoma Ryan Lynch MD Assistant Professor, University of Washington Assistant Member, Fred Hutchinson Cancer
PET-adapted therapies in the management of younger patients (age 60) with classical Hodgkin lymphoma Ryan Lynch MD Assistant Professor, University of Washington Assistant Member, Fred Hutchinson Cancer
Disclosure Information. Mary L. Disis
 Disclosure Information Mary L. Disis I have the following financial relationships to disclose: Consultant for: VentiRx, Celgene, Emergent, EMD Serono Speaker s Bureau for: N/A Grant/Research support from:
Current experience in immunotherapy for metastatic renal cell carcinoma
 Current experience in immunotherapy for metastatic renal cell carcinoma Axel Bex, MD, PhD The Netherlands Cancer Institute FOIU, Tel Aviv, 3 July 2018 Financial and Other Disclosures Off-label use of drugs,
Results you can trust
 PRODUCT I NF OR MAT ION pharmdx Results you can trust The first and only FDA-approved PD-L1 test to assess the magnitude of treatment effect on progression-free survival in melanoma patients from OPDIVO
FcγRIIIA (CD16)-expressing monocytes mediate the depletion of tumor-infiltrating Tregs via ipilimumab-dependent ADCC in melanoma patients
-expressing monocytes mediate the depletion of tumor-infiltrating Tregs via ipilimumab-dependent ADCC in melanoma patients") FcγRIIIA (CD16)-expressing monocytes mediate the depletion of tumor-infiltrating Tregs via ipilimumab-dependent ADCC in melanoma patients Emanuela Romano Department of Oncology University of Lausanne and
FcγRIIIA (CD16)-expressing monocytes mediate the depletion of tumor-infiltrating Tregs via ipilimumab-dependent ADCC in melanoma patients Emanuela Romano Department of Oncology University of Lausanne and
Tumor Immunology: A Primer
 Transcript Details This is a transcript of a continuing medical education (CME) activity accessible on the ReachMD network. Additional media formats for the activity and full activity details (including
Allergy and Immunology Review Corner: Chapter 19 of Immunology IV: Clinical Applications in Health and Disease, by Joseph A. Bellanti, MD.
 Allergy and Immunology Review Corner: Chapter 19 of Immunology IV: Clinical Applications in Health and Disease, by Joseph A. Bellanti, MD. Chapter 19: Tolerance, Autoimmunity, and Autoinflammation Prepared
COURSE: Medical Microbiology, PAMB 650/720 - Fall 2008 Lecture 16
 COURSE: Medical Microbiology, PAMB 650/720 - Fall 2008 Lecture 16 Tumor Immunology M. Nagarkatti Teaching Objectives: Introduction to Cancer Immunology Know the antigens expressed by cancer cells Understand
NewLink Genetics Corporation
 Stifel Healthcare Conference Presentation NewLink Genetics Corporation NASDAQ: NLNK November 13, 2018 Cautionary Note Regarding Forward-Looking Statements This presentation contains forward-looking statements
Manipulating the Tumor Environment
 Manipulating the Tumor Environment Vincenzo Bronte Verona University Hospital vincenzo.bronte@univr.it Escape from immune control can be viewed as one of the «Hallmarks of Cancer» D. Hanahan and R. A.
Immunotherapy in non-small cell lung cancer
 Immunotherapy in non-small cell lung cancer Geoffrey Peters and Thomas John Olivia Newton-John Cancer Research Institute, Heidelberg, Victoria, Australia. Email: Geoffrey.peters@austin.org.au Abstract
Accepted Manuscript. Next Steps for Immune Checkpoints in Hepatocellular Carcinoma. Patricia M. Santos, Lisa H. Butterfield
 Accepted Manuscript Next Steps for Immune Checkpoints in Hepatocellular Carcinoma Patricia M. Santos, Lisa H. Butterfield PII: S0016-5085(18)35218-1 DOI: https://doi.org/10.1053/j.gastro.2018.11.008 Reference:
Glioblastoma and CNS tumors
 Glioblastoma and CNS tumors PRECEPTORSHIP PROGRAMME IMMUNO-ONCOLOGY Amsterdam, 27 May 2017 Patrick Roth Department of Neurology and Brain Tumor Center University Hospital Zurich Challenges in immunooncology
New insights into CD8+ T cell function and regulation. Pam Ohashi Princess Margaret Cancer Centre
 New insights into CD8+ T cell function and regulation Pam Ohashi Princess Margaret Cancer Centre New insights into CD8+ T cell function and regulation Pam Ohashi Princess Margaret Cancer Centre No Disclosures
Antigen Presentation and T Lymphocyte Activation. Abul K. Abbas UCSF. FOCiS
 1 Antigen Presentation and T Lymphocyte Activation Abul K. Abbas UCSF FOCiS 2 Lecture outline Dendritic cells and antigen presentation The role of the MHC T cell activation Costimulation, the B7:CD28 family
What is the best second-line approach to induce remission prior to stem cell transplant? Single agent brentuximab vedotin
 What is the best second-line approach to induce remission prior to stem cell transplant? Single agent brentuximab vedotin Alison Moskowitz, MD Assistant Attending, Lymphoma Service Memorial Sloan Kettering