EFFECT OF CHRONIC AIRWAY INFLAMMATION INDUCED BY ALLERGEN SENSITIZATION ON VAGAL BRONCHOPULMONARY SENSORY NERVES IN RATS
|
|
|
- Benjamin Dalton
- 5 years ago
- Views:
Transcription

1 University of Kentucky UKnowledge University of Kentucky Doctoral Dissertations Graduate School 2008 EFFECT OF CHRONIC AIRWAY INFLAMMATION INDUCED BY ALLERGEN SENSITIZATION ON VAGAL BRONCHOPULMONARY SENSORY NERVES IN RATS Guangfan Zhang University of Kentucky Click here to let us know how access to this document benefits you. Recommended Citation Zhang, Guangfan, "EFFECT OF CHRONIC AIRWAY INFLAMMATION INDUCED BY ALLERGEN SENSITIZATION ON VAGAL BRONCHOPULMONARY SENSORY NERVES IN RATS" (2008). University of Kentucky Doctoral Dissertations This Dissertation is brought to you for free and open access by the Graduate School at UKnowledge. It has been accepted for inclusion in University of Kentucky Doctoral Dissertations by an authorized administrator of UKnowledge. For more information, please contact
2 ABSTRACT OF DISSERTATION Guangfan Zhang The Graduate School University of Kentucky 2009
3 EFFECT OF CHRONIC AIRWAY INFLAMMATION INDUCED BY ALLERGEN SENSITIZATION ON VAGAL BRONCHOPULMONARY SENSORY NERVES IN RATS ABSTRACT OF DISSERTATION A dissertation submitted in partial fulfillment of the requirements of the degree of Doctor of Physiology in the College of Medicine at the University of Kentucky By Guangfan Zhang Lexington, Kentucky Director: Dr. Lu-Yuan Lee, Professor of Physiology Lexington, Kentucky 2009 Copyright Guangfan Zhang 2009
4 ABSTRACT OF DISSERTATION EFFECT OF CHRONIC AIRWAY INFLAMMTION INDUCED BY ALLERGEN SENSITIZATION ON VAGAL BRONCHOPULMOANRY SENSORY NERVES IN RATS Airway hyperresponsivness (AHR) is one of most prominent pathophysiological features of asthma. Increasing evidence suggests that vagal bronchopulmonary afferents may be involved in the development of AHR. However, the underlying mechanisms are not clear. Therefore, the purpose of this dissertation was to investigate the effect of chronic airway inflammation induced by allergen sensitization on vagal bronchopulmonary afferents. The study was carried out in an animal model of allergic asthma. Brown-Norway rats were sensitized by intraperitoneal Ovalbumin (Ova) and exposed to aerosolized Ova 3 times/week for three weeks. Control rats received the vehicle. In vivo single-fiber recording technique was applied in this study. Our results showed that chronic Ova exposure caused an elevated baseline activity of pulmonary C- fibers, and a distinctly higher sensitivity of these afferents to chemical stimulants and lung inflation. After an acute Ova inhalation challenge, the increase in baseline activity and the excitability of pulmonary C-fibers were further augmented in sensitized rats, but not in control rats. In addition, sensitivity of pulmonary myelinated afferents to capsaicin was significantly elevated after chronic airway inflammation was induced by allergen. Furthermore, immunohistochemsitry data showed that, in nodose ganglia the proportion of transient receptor potential vanilloids type 1 channels (TRPV1)-expressing bronchopulmonary neurons was significantly higher in sensitized rats than in controls. This increase of TRPV1 expression was found mainly in neurofilament-positive neurons (myelinated neurons), but this effect was absent in jugular ganglia. In conclusion, allergen-induced airway inflammation caused a pronounced sensitizing effect on vagal pulmonary non-myelinated (C-fiber) afferents and elevated the sensitivity of vagal pulmonary myelinated afferents to capsaicin. The latter was accompanied by the upregulation of TRPV1 expression in these myelinated neurons. Keywords: asthma; allergen; vagus; TRPV1; capsaicin.
5 Guangfan Zhang /07/
6 EFFECT OF CHRONIC AIRWAY INFLAMMATION INDUCED BY ALLERGEN SENSITIZATION ON VAGAL BRONCHOPULMONARY SENSORY NERVES IN RATS By Guangfan Zhang Lu-Yuan Lee Director of Dissertation OK-Kyong Park-Sarge Director of Graduate Studies 01/07/ Date
7 RULES FOR THE USE OF DISSERTATIONS Unpublished dissertation submitted for the Doctor s degree and deposited in University of Kentucky Library are as a rule open for inspection, but are to be used only with due regard to the rights of the authors. Bibliographical references may be noted, but quotations or summaries of parts may be published only with the permission of the author, and with the usual scholarly acknowledgements. Extensive copying or publication of the dissertation in whole or in part also requires the consent of the Dean of the Graduate School of the University of Kentucky. A library that borrows this dissertation for use by its patron is expected to secure the signature of each user. Name Date
8 DISSERTATION Guangfan Zhang The Graduate School University of Kentucky 2009
9 EFFECT OF CHRONIC AIRWAY INFLAMMATION INDUCED BY ALLERGEN SENSITIZATION ON VAGAL BRONCHOPULMONARY SENSORY NERVES IN RATS DISSERTATION A dissertation submitted in partial fulfillment of the requirements of the degree of Doctor of Physiology in the College of Medicine at the University of Kentucky By Guangfan Zhang Lexington, Kentucky Director: Dr. Lu-Yuan Lee, Professor of Physiology Lexington, Kentucky 2009 Copyright Guangfan Zhang 2009
10 For my loving parents, Naiyang Zhang and Huanqin Zhang
11 ACKNOWLEGEMENTS This dissertation would not have been written without the contribution from many people. I owe my gratitude to all those people who have made this dissertation possible and because of whom my graduate experience has been one that I will cherish forever. My deepest gratitude is to my mentor, Dr. Lu-Yuan Lee. I have been amazingly fortunate to have an advisor who gave me the guidance to recover when my steps faltered and also gave me the freedom to explore by my own. His patience and support helped me to overcome many crisis situations and finish this dissertation. I am also indebted to the members of our laboratory, Dr. David Gu for carefully reading and commenting on countless revisions of my manuscripts and Libby Lim, Ruei-lung Lin and Bob Morton for their assistance. I would like to thank the members of my committee, Dr. Timothy McClintock, Dr. Steven Estus and Dr. Diane Snow. Their insightful comments and constructive criticisms at different stages of my research were thought-provoking and they helped me to complete my dissertation. In particular, I am deeply grateful to Dr. Snow for her guidance and advice in the design of my immunohistochemistry experiments and for allowing me to use the facilities in her lab. She has been always there to listen and help me to sort out the technical details of my work and enforce strict validations for each research result. Additionally, I would like to thank Dr. Don Cohen for his willingness to serve as my outside examiner. iii
12 I am grateful to Dr. Neeraja Sammeta and other members in Dr. McClontock s lab for their encouragement and practical advices for my experiments. I am also thankful to Chris Calulot in Dr. Snow lab and Cynthia Long for helping me in immunohistochemistry experiments. The last and certain not least, I would like to thank my family: my mom and dad: Huanqin and Naiyang; my brother: Lei. Their unending support and love accompany me through all the tough times. Most importantly, I would like to thank the love of my life, my husband Zhan, who has been so incredible supportive of all my pursuits. Finally, I would like to thank my sweet heart, my daughter Sarah, who is my forever motivation. iv
13 TABLE OF CONTENTS Acknowledgements... iii List of Tables... vi List of Figures... vii Chapter One: Introduction 1.1 Background Rationale and Hypothesis...13 Chapter Two: Sensitizing Effects of Chronic Exposure and Acute Inhalation of Ovalbumin Aerosol on Pulmonary C-fibers in Rats 2.1 Specific Aim Methods Results...22 Chapter Three: Altered Expression of TRPV1 and Sensitivity to Capsaicin in Pulmonary Myelinated Afferents following Chronic Airway Inflammation in the Rat 3.1 Specific Aim Methods Results...49 Chapter Four: Discussion and Conclusions...71 Appendices (A list of abbreviations)...88 References...91 Vita v
14 LIST OF TABLES Table 2.1 Effect of Ova sensitization on leukocyte counts in BALF collected at 4-6 hours after the acute Ova inhalation challenge...27 Table 2.2 Effects of acute Ova inhalation challenge on average baseline MABP and HR in both control and sensitized rats...28 Table 3.1 Expression of TRPV1-immunoreactivity in myelinated and nonmyelinated pulmonary neurons in nodose and jugular ganglia...55 vi
15 LIST OF FIGURES Figure 1.1 Neurogenic inflammations in asthmatic airways via retrograde release of peptides from sensory nerves via an axon reflex...8 Figure 1.2 TRPV1 is an integrator of inflammatory pain pathways...12 Figure 2.1 Experimental Setup for exposure of rats to Ova aerosol...29 Figure 2.2 Responses of R L (total pulmonary resistance) and C dyn (dynamic lung compliance) to acute inhalation of Ova aerosol (3%, 5 min)...30 Figure 2.3 Dose responses of R L (total pulmonary resistance) and C dyn (dynamic lung compliance) to aerosolized methacholine (MCh) in control and sensitized rats...31 Figure 2.4 The average baseline fiber activities before and after acute Ova challenge in anesthetized, open-chest and artificially ventilated rats...32 Figure 2.5 Experimental records illustrating the effects of acute Ova challenge on the pulmonary C-fiber responses to lung inflation in anesthetized, openchest and artificially ventilated rats...33 Figure 2.6 Effect of Ova sensitization on the average responses of pulmonary C- fibers to lung inflation in anesthetized, open-chest and artificially ventilated rats...34 Figure 2.7 Experimental records illustrating the effects of acute Ova inhalation challenge on the pulmonary C-fiber responses to capsaicin in anesthetized, open-chest and artificially ventilated rats...35 vii
16 Figure 2.8 Effects of acute Ova inhalation challenge on pulmonary C-fiber activity and cardiovascular responses to capsaicin in anesthetized and open-chest rats...36 Figure 2.9 Effect of Ova sensitization on the average peak response and the duration of discharge of pulmonary C-fibers in response to right-atrial bolus injection of capsaicin in anesthetized, open-chest and artificially ventilated rats...37 Figure 2.10 Effect of Ova sensitization on the average peak response and the duration of discharge of pulmonary C-fibers in response to right-atrial bolus injection of adenosine in anesthetized, open-chest and artificially ventilated rats...39 Figure 3.1 TRPV1 antibody specificity test (panels A and B) and IHC controls for TRPV1 and NF (panel C)...56 Figure 3.2 Experimental records illustrating the effect of perineural capsaicin treatment (PNCT) of both cervical vagi on cardiorespiratory responses to capsaicin injection...58 Figure 3.3 Experimental records illustrating the responses of silent RARs to lung inflation, deflation and capsaicin injection in anesthetized, vagotomized, open-chest and artificially ventilated rats...60 Figure 3.4 Average baseline fiber activities (FA) and the responses of silent (si) RARs, phasic (ph) RARs and SARs to lung inflation in anesthetized, vagotomized, open-chest and artificially ventilated rats...61 viii
17 Figure 3.5 Experimental records illustrating the responses of SARs to lung inflation, deflation and capsaicin injection in anesthetized, vagotomized, openchest and artificially ventilated rats...62 Figure 3.6 Effect of Ova sensitization on responses of myelinated afferents to rightatrial injection of capsaicin in anesthetized, vagotomized, open-chest and artificially ventilated rats...63 Figure 3.7 Effect of Ova sensitization on TRPV1 expression in pulmonary neurons in nodose and jugular ganglia...65 Figure 3.8 Effect of Ova sensitization on TRPV1 expression in NF-positive and NF-negative neurons with DiI labeling in nodose ganglion...67 Figure 3.9 Effect of Ova sensitization on TRPV1 expression in NF-positive and NF-negative neurons with DiI labeling in jugular ganglion...69 ix
18 CHAPTER ONE Introduction 1.1 Background Asthma Asthma is a life-threatening lung disease that causes various problems in breathing (e.g., airway obstruction, hypoxia, shortness of breath, coughing etc.). In the United States, asthma prevalence has been increasing since the early 1980s in all ages and racial groups, and in both sexes. It affects an estimated 14.9 million persons and cause over 1.5 million emergency hospital visits, about 500,000 hospitalizations, and over 5,500 deaths in The estimated direct and indirect monetary costs for this disease added up to $11.3 billion in 1998 [1]. Therefore, in addition to the high prevalence of asthma, asthma remains a major illness in terms of mobility, suffering and financially cost. It is very important to understand the pathogenetic mechanisms of asthma. Asthma is a disease characterized by episodic and reversible airway obstruction and inflammation, accompanied by airway hyperresponsiveness (AHR), which is defined as an increased bronchoconstrictive response to bronchial provocative challenge [2]. The exact cause of asthma remains uncertain, but, it is known that several factors may contribute to the development of this disease, for example, genetic factors (e.g., a history of asthma in the family), environmental factors (e.g., air pollution, occupational exposure, viral infections and allergen exposure) and life style factors (e.g., smoking). In susceptible individuals, asthma causes recurrent episodes of wheezing, breathlessness, 1
19 chest tightness and coughing [3]. The development of allergic asthma episodes consists of three phases, namely the induction phase, the early-phase asthmatic response (EAR), and the late-phase asthmatic response (LAR). Each phase is characterized by the production and interaction of various cell-derived mediators. In the induction phase, T helper (TH) cytokines are important in the development of asthma. Inhaled allergens that escape the mucociliary clearance are taken up and processed by antigen presenting cells (APCs), which are distributed throughout the respiratory tract, from the nasal mucosa to the lung pleura. These APCs then migrate to the lymph nodes where the processed allergen is presented to allergen specific T and B cells [4, 5]. Interactions between those cells elicit responses that are influenced by secreted cytokines and cell-bound costimulatory molecules. Activation of TH cells by APCs leads to the production of cytokines that regulate the isotype switch of B cells in their production of immunoglobulin (Ig) E [4]. Once synthesized, IgE antibodies circulate in the blood before binding to the high-affinity IgE receptor FcεRI that is present on mast cells in tissues or on peripheral blood basophils. After re-exposure, allergens cross-link to mast cell bound specific IgE, causing the activation of cellular signaling pathways, which subsequently trigger the release of preformed mediators, such as histamine, the synthesis of prostaglandins (PGs) and leukotrienes (LTs), and the transcription of cytokines by mast cells [6]. These mediators cause the so-called EAR, The EAR is characterized by constriction of airway smooth muscle cells, vascular leakage, mucus production, enhanced AHR and recruitment of inflammatory cells [7]. The EAR occurs almost immediately, lasting for min and 4 12 h later followed by LAR [8]. 2
20 The LAR is characterized by excessive inflammation of the airways. The inflammatory molecules are produced by various cell types, such as eosinophils, neutrophils, T cells, macrophages, dendritic cells, and structural cells. Chronic inflammation leads to structural changes in the airways, including airway wall thickening, subepithelial fibrosis, goblet cell hyperplasia, myofibroblast hyperplasia, airway smooth muscle cell hyperplasia and hypertrophy, and epithelial hypertrophy [9]. These are collectively known as airway remodeling. An animal model of allergic asthma Animal models of asthma have been developed in various animal species. Rat has been shown to have several advantages as a model for asthma compared to other species [10, 11]. For example, the layers of the submucosal and bronchial muscle are thicker in rats compare to mice. The blood supply of bronchial mucosa in rat comes from the bronchial artery, which is similar to human. The lamina propria of bronchi in rats contains capillaries and veins in contrast to mice, which is a very important feature for the development of airway inflammation since these vessels are the exit site of leukocytes leading to mucosal inflammation and epithelial damage in asthma in humans and other species. Adhesion molecules are expressed in lamina propria after allergen exposure in human biopsy specimens. A swelling of the bronchi mucosa, possibly due to dilation of bronchial blood vessels, followed by congestion and edema, has often been described in fetal asthma. Thus, these anatomical features of the proprietary bronchial mucosa in rats are very similar to those in humans. The rat asthma model also has other similarities with human asthma such as the production of IgE in response to allergens, the accumulation of 3
21 lymphocytes and eosinophils in the lung lavage and tissue, and the characteristic elevation of TH2 cytokines. Taken together, rat is considered a good model to study human asthma [10]. Brown-Norway (BN) rats represent a TH2-like immunophenotype and have been established as a classic animal model of allergic asthma [12-14], because many of the pathological features of human asthma are seen in this model after antigen challenges, including the presence of eosinophilic lung inflammation during LAR, damage to the airway epithelium, thickening of basement membrane, early and late phase airway responses, and the presence of AHR. It is also known that BN rats have more pronounced IgE production and inflammatory responses to challenge following sensitization compared with other strains [15]. These features of sensitized BN rats provide a good model in which to investigate the mechanisms of human asthma. Bronchopulmonary sensory afferents Vagus nerve supplies most of the sensory nerve fibers to the airways and lung. Cell bodies of these afferent fibers reside in the nodose and jugular ganglia, projecting centrally to the nucleus tractus solitarius, thus relaying the information from the lung and airways to the medullar respiratory center. There are three major types of sensory receptors in vagus bronchopulmonary afferents. 1) Slowly adapting pulmonary receptors (SARs): myelinated afferents in vagus nerve that have a fast conduction velocity. The discharge pattern of SARs is synchronized with respiratory cycles. Their activities are closely related to the degree 4
22 of lung inflation, with a low volume threshold; they are inhibited by deflation and adapt slowly to maintained lung inflation. Activation of SARs causes the relaxation of airway smooth muscle, shortens inspiration and prolongs expiration. Thus, these nerves are responsible for the Hering-Breuer inflation reflex, which inhibits sustained inspiratory activity. They also lead to a reflex bronchodilation by inhibiting vagal tone. The evidence that SARs can be activated by reflex-induced or drug (such as histamine and acetylcholine)-induced smooth muscle contraction suggests that the location of these receptors is in the vicinity of airway smooth muscle. Although SARs are generally considered as a mechano-sensitive receptor and less sensitive to chemical stimulants, their activity can be inhibited by CO 2, and may be stimulated by volatile anesthetics such as halothanes [16]. 2) Rapidly adapting pulmonary receptors (RARs): receptors whose activities are generated in myelinated nerves. The sensory terminals of RARs are believed to lie under the airway epithelium. RARs respond with a rapidly adapting discharge to a maintained lung inflation. The majority of RARs are consistently stimulated by deflation of the lung (below the resting lung volume), and thus they were also named deflation receptor. RARs have a wide range of physiological properties. Those in the nasopharynx, and many in the trachea discharge only during the application and removal of a mechanical stimulus. They are usually silent in eupnea and are extremely sensitive to mechanical stimuli, but are not very sensitive to the direct application of chemical agents. RARs in the larynx and the trachea are very sensitive to particulate irritants (cigarette smoke, dust), and, therefore, have been termed the 5
23 cough receptor. Intrapulmonary RARs can be stimulated by gases such as ammonia, sulfur dioxide and ozone and also by histamine, or serotonin. Generally, stimulation of RARs causes cough, augmented breath and the expiration reflex [17-19]. 3) Vagal bronchopulmonary C-fibers: they represent more than 75% of sensory nerves innervating the entire respiratory tract including larynx, trachea, bronchial, bronchioles and lung [20]. The sensory terminals of these non-myelinated afferents are usually located either underneath or between airway epithelial cells [21, 22]. These afferents are relatively insensitive to mechanical stimuli, but are extremely sensitive to chemical stimuli including inhaled irritants such as acid aerosol, capsaicin, and endogenous mediators, such as bradykinin and prostaglandins, released during tissue inflammatory and allergic reactions [23, 24]. The afferent activity arising from these C-fiber endings plays an important role in regulating respiratory and cardiovascular function under both normal and abnormal physiologic conditions [23]. The primary function of these neurons under normal physiological conditions is protective: when the sensory terminals are activated by irritants or circulated autacoids, action potentials are conducted through the vagus nerves to the commissural subnucleus of the nucleus tractus solitarius and elicit the pulmonary chemoreflex that includes apnea, bronchoconstriction, mucus secretion, cough, bradycardia and hypotension. These responses limit further infiltration of the irritants deeper into the lung. Under certain pathological states, however, these afferent nerves develop hypersensitivity, and exaggerated reflex responses become deleterious to normal airway function [23, 25]. Activation of C-fiber sensory nerves 6
24 may release neuropeptides such as substance P (SP), neurokinin A (NKA) and calcitonin gene-related peptide (CGRP), which are known to act on a number of effector cells in the respiratory tract (e.g., airway and vascular smooth muscles, cholinergic ganglia, inflammatory cells and mucous glands), and cause bronchoconstriction, protein extravasation, airway mucosal edema and inflammatory cell chemotaxis. These reactions are known as neurogenic inflammation [26]. There is a close relationship between asthma and neurogenic inflammation (Fig. 1.1). In asthma, damage to airway epithelium, possibly caused by eosinophil products, exposes C-fiber afferent nerve endings. Stimulation of these endings by inflammatory mediators such as bradykinin may result in an axon (local) reflex and release of sensory neuropeptides [27]. Studies on human airways suggest an increased synthesis of SP in the airways of asthmatic patients [28]. The augmented bronchoconstrictive effect caused by allergen challenge can be attenuated by the deletion of the neuropeptide stored in these sensory nerves in guinea pigs [29, 30]. 7
 SP causes vasodilatation, plasma exudation and mucus secretion. NKA causes bronchoconstriction, enhanced cholinergic reflexes, and CGRP vasodilatation.")
25 Fig Neurogenic inflammation in asthmatic airways due to retrograde release of peptides from sensory nerves via axon reflex. (Modified from Barnes, 2001) SP causes vasodilatation, plasma exudation and mucus secretion. NKA causes bronchoconstriction, enhanced cholinergic reflexes, and CGRP vasodilatation. Afferent nerve fibers can also be classified anatomically by the location of their cell bodies. The nodose and jugular ganglia have distinct embryological origins. The nodose ganglion is derived from placodes, while the jugular ganglion is derived from cells of the neural crest [31]. It is therefore not surprising that there are different phenotypes of afferents arising from these two ganglia. In the guinea pig airways, the jugular ganglia contain the cell bodies of myelinated Aδ and unmyelinated C-fibers. The C-fibers rising from jugular ganglion neurons innervate both the extrapulmonary airways (larynx, trachea and bronchus) and the lung parenchymal tissue. The myelinated fibers from jugular ganglion have a lower threshold to mechanical stimuli and respond 8
26 vigorously to classic nociceptive fiber-selective stimuli such as capsaicin and bradykinin. In comparison, myelinated afferents from nodose ganglia are exquisitely sensitive to punctate mechanical stimuli but respond poorly to stretch, and do not respond to a variety of chemical stimuli including capsaicin and bradykinin. In addition, neural crest-derived C-fibers innervating the pulmonary system are more likely to express neuropeptides such as SP and CGRP than those derived from placodes [31, 32]. Transient receptor potential vanilloid type 1 ion channel One prominent feature of pulmonary C-fibers is the expression of transient receptor potential vanilloid type 1 (TRPV1) channels, a member of transient receptor potential vanilloid (TRPV) channel family, at the sensory terminal [33]. TRPV1 was first cloned from rodent dorsal root ganglion (DRG) neurons [34] and is a ligand-gated, nonspecific cation channel with six transmembrane domains (Fig. 1.2) [35]. TRPV1, a 426 (in the rat) amino acid protein [34], is uniquely sensitive to vanilloid molecules including capsaicin, the pungent component in the hot pepper, and is also activated by low extracellular ph (ph 6 5) [36, 37], elevated concentrations (in the micromolar range) of the endocannabionoid, anandamide [38], the lipoxygenase metabolites of arachidonic acid, leukotriene B 4 (LTB 4 ) or 12-hydroperoxyeicosatetraenoic acids (12-HPETE) [39] and N- arachidonoyl-dopamine [40]. In addition, TRPV1 is a thermosensor, activated by moderate noxious temperature between 42 and 53 C [34]. A recent study in our labs has further demonstrated that the TRPV1 expressed in pulmonary-sensory neurons has a lower temperature threshold for activation (~39 C) [41]. 9
27 The expression of TRPV1 is very broad in both neuronal and non-neuronal tissues such as DRG, the keratinocytes of epidermis, and bladder [42-44]. The presence of TRPV1 has also been confirmed in human airways, mainly in non-myelinated sensory nerves from the vagal ganglia [45-47]. Activation of TRPV1 channels on airway sensory nerves induces Ca 2+ influx into the neuronal cell, membrane depolarization and action potentials. Therefore, activation of these non-myelinated vagal sensory terminals in the airways can elicit extensive reflex responses mediated through cholinergic pathway and axon reflex [48], and trigger the release of neuropeptides from both peripheral and central nerve terminals [49]. The expression of mrna and protein as well as function of the TRPV1 channel in neurons can undergo marked plasticity upon the action of a series of regulatory and inflammatory mediators (Fig. 1.2) [50]. For instance, nerve growth factor (NGF) increases TRPV1 protein transportation to the peripheral endings of sensory neurons, a phenomenon associated with an increase in heat hypersensitivity via a p38 mitogenactivated protein (MAP) kinase [51]. Protein kinases (PK) A and C, and phospholipase A and C metabolites can also modulate TRPV1 function. The threshold temperature for TRPV1 stimulation is lowered by anandamide through a PKC dependent pathway [52]. The major proinflammatory peptide, bradykinin via activation of the B 2 receptor, sensitizes TRPV1 by different intracellular mechanisms, including PKC-ε [52, 53], displacement of phosphinositide-4,5-bisphosphate (PIP 2 ) from TRPV1 binding [54], and 12- and 5-lipoxygenase metabolites production [55, 56]. A recent study shows that PGE 2 can sensitize TRPV1 channels through EP 1 prostanoid receptors, predominantly through a PKC-dependent pathway in mouse DRG neurons. The temperature threshold for 10
28 TRPV1 channel activation was reduced to below 35 C after PGE 2 treatment [57]. Our lab has shown that PGE 2 activates the Gs protein-coupled EP 2 prostanoid receptor present on the membrane of vagal sensory neurons. Then, the stimulation of PKA by the increase in cyclic AMP (camp) increases the phosphorylation of TRPV1 and enhances its excitability [58]. Extensive evidence has suggested a potential involvement of TRPV1 channels in the pathogenesis of asthma. Endogenous TRPV1 activators, such as hydrogen ion and lipoxygenase products, have been detected in asthmatic patients [59, 60]. In allergic animal models, pre-treatment with capsaicin to degenerate the airway TRPV1-expressing afferents and to deplete sensory neuropeptides, inhibits allergen-induced airway constriction in sensitized guinea pigs [29] and AHR in allergic rabbits [61], suggesting an important role for these airway sensory nerves. In a mouse model of non-atopic asthma, dinitrofluorobenzene sensitization and challenge induces an accumulation of inflammatory cells and AHR; these responses can also be inhibited by capsaicin pretreatment [62]. Recent studies have further presented convincing evidence of an important role of TRPV1 in the manifestation of various symptoms of airway hypersensitivity associated with airway inflammation [63]; for example, bronchomotor response and cough sensitivity to TRPV1 activators, capsaicin or citric acid aerosol, are markedly elevated in patients with asthma or airway inflammation [64, 65]. One of the most prominent pathophysiological features of asthma is bronchial hyperresponsiveness [66], which is generally believed to be closely associated with endogenous release of various chemical mediators from inflammatory cells. Recent studies have demonstrated that some of these inflammatory mediators (e.g., prostaglandins, bradykinin, leukotrienes, 11
![eosinophil granule-derived cationic proteins, etc.) can markedly enhance the sensitivity of TRPV1 and lower its threshold for activation (Fig. 1.2) [67].](/docs-images/88/117501012/images/29-0.jpg "Furthermore, a recent report has further revealed a higher tissue temperature in the airways of asthmatic patients [68].")
29 eosinophil granule-derived cationic proteins, etc.) can markedly enhance the sensitivity of TRPV1 and lower its threshold for activation (Fig. 1.2) [67]. Furthermore, a recent report has further revealed a higher tissue temperature in the airways of asthmatic patients [68]. Thus, a given level of stimulation may evoke a greater afferent discharge of the TRPV1- expressing C-fiber endings and consequently a more severe bronchoconstriction via both the central cholinergic pathway and local axon reflex [67]. Fig TRPV1 is a transducer and an integrator of nociceptive stimuli. (Modified from Cortight and Szallasi, 2004) TRPV1 is directly activated by a multiplicity including vanilloids (capsaicin), low ph, elevated temperature, and arachidonic acid. TRPV1 is indirectly activated through the protein kinase-mediated signaling pathways by activation of prostaglandin and bradykinin receptors. 12
30 1.2 Rationale and Hypothesis Asthma is characterized by airway inflammation and AHR in response to a number of bronchoconstrictive stimuli, but the precise mechanism is not clear. AHR induced by allergen sensitization can be divided into 2 distinct phases, early and late, based on the timing of the response in relation to antigen exposure. The EAR, which is due to the contraction of airway smooth muscles induced by the degranulation of mast cells, occurs within minutes after inhalation of antigen, lasts up to an hour, and is followed by a rapid return to baseline. The LAR then emerges in 4 to 12 hours after antigen exposure and may persist for more than 24 hours. There is an accumulation of inflammatory cells, especially eosinophils, in the airways. These inflammatory cells cause further tissue damage. Previous studies show that bronchopulmonary capsaicinsensitive afferent fibers (C-fibers) are involved in the development of AHR in asthma [30, 69]. Endogenous inflammatory mediators released during the allergic reactions can modulate the excitability of primary C-fiber afferents [70]. Tachykinins such as SP released from C-fibers are believed to play a part in airway hyperreactivity in guinea pigs. Enhanced pulmonary C-fiber activity and airway responsiveness to inhaled cigarette smoke have been observed in ovalbumin (Ova) -sensitized guinea-pigs. In addition, the excitability of myelinated afferents has been shown to increase during the development of asthma. Antigen can induce the increased excitability of Aδ myelinated afferents in isolated guinea pig airways [71]. Challenging the isolated bronchus with a sensitizing antigen resulted in a transient depolarization of the resting membrane potential of the guinea pig sensory ganglion [72]. The inflammatory mediators such as NGF can induce 13
31 neuropeptide production in rapidly adapting afferent nerves that do not normally express these peptides [73]. NGF increased the capsaicin sensitivity of sensory neurons both in vivo and in vitro [74-77]. Capsaicin is a potent stimulant of pulmonary C-fibers and a specific agonist of TRPV1 channels. The presence of TRPV1 has been demonstrated in human airways, mainly in the sensory nerves originating from the vagal ganglia [45-47]. Increased sensitivity of pulmonary C-fibers to capsaicin has been reported in asthmatics [78]. Activation of TRPV1 in sensory nerves leads to neurotransmitter release from peripheral and central nerve endings resulting in neurogenic inflammatory bronchoconstriction, mucus hypersecretion and cough [79, 80]. However, the role of TRPV1 and the relative involvements of different types of bronchopulmonary afferents in the allergen-induced chronic airway inflammation are not clearly defined. Hypothesis: Sensitivity of bronchopulmonary afferents is altered during allergeninduced airway inflammation, and an increase in the sensitivity and/or expression of TRPV1 channels in these sensory neurons is involved. The main objective of these studies is to test this hypothesis in a well-established animal model of asthma. Copyright Guangfan Zhang
32 CHAPTER TWO Study Series 1: Sensitizing Effects of Chronic Exposure and Acute Inhalation of Ovalbumin Aerosol on Pulmonary C-fibers in Rats 2.1 Specific Aim This study was carried out in an animal model of allergen-induced asthma to investigate: 1) whether the excitability of pulmonary C-fibers in response to mechanical and chemical stimuli was altered in rats that were sensitized with Ova; and 2) if so, whether the responses were altered by acute Ova inhalation challenge in sensitized rats. 2.2 Methods The experimental procedures in study series 1 were performed in accordance with the recommendations of the Guide for the Care and Use of Laboratory Animals, published by the National Institutes of Health, and were also approved by the University of Kentucky Institutional Animal Care and Use Committee. Animal Sensitization and Allergen Exposure Pathogen-free male BN rats weighing g were divided into two groups (control and sensitized). Sensitized rats received an initial intraperitoneal (i.p.) injection of a suspension containing 2 mg Ova in 1 ml Imject Alum as adjuvant. Three days after the initial intraperitoneal injection, sensitized rats were exposed to Ova aerosol for 15 15
33 min each time, 3 times per week for 3 weeks, following the protocol established by previous investigators [81]. During exposure, the unanesthetized rat was placed in a Plexiglas restrainer (University of Kentucky, Center for Manufacturing), and breathed spontaneously and continuously through a nose cone connected to a free stream of air/aerosol mixture under a negative-pressure exhaust hood (Fig. 2.1). The Ova solution (wt/vol concentration: 1.25% in saline) was nebulized and delivered by an ultrasonic nebulizer (Model 099HD; Devilbiss) at a droplet size ranging from 0.5 to 5 µm. Control rats received the i.p. injection and aerosol inhalation of the vehicle (isotonic saline) following the identical procedures. Animal Preparation After 3 weeks of either Ova or saline exposure, rats were initially anesthetized with an i.p. injection of α-chloralose (100 mg/kg) and urethane (500 mg/kg) dissolved in a 2% borax solution; whenever necessary, supplemental doses (one-tenth of the initial dose) of the same anesthetics were injected intravenously (i.v.) to maintain abolition of pain reflexes elicited by paw-pinch. The right femoral artery and the left jugular vein were cannulated for recording arterial blood pressure (ABP) and administration of pharmacological agents, respectively; the latter was advanced until its tip was positioned just above the right atrium. A short tracheal cannula was inserted just below the larynx via a tracheotomy. Tracheal pressure (P t ) was measured (MP45-28; Validyne) via a side-port of the tracheal cannula. After a midline thoracotomy was performed, the lung was artificially ventilated with a respirator (model 7025; UGO Basile), and the expiratory outlet of the respirator was placed under 3 cmh 2 O pressure to maintain a near-normal 16
34 functional residual capacity. Volume and frequency were set at ~ 8 ml/kg and breaths/min, respectively, to mimic those of unilaterally vagotomized rats. Body temperature was maintained at ~ 36 C by means of a heating pad placed under the animal lying in a supine position. Electrophysiological Recording of Pulmonary C-fiber Activity Single-unit pulmonary C-fiber activity was recorded as previously described [82]. Briefly, the right cervical vagus nerve was separated from the right carotid artery. The caudal end of the cut right vagus nerve was placed on a small dissecting platform and immersed in a pool of mineral oil. A thin filament was teased away from the desheathed nerve trunk and placed on a platinum iridium hook electrode. Action potentials were amplified (P511K; Grass Instruments Co.), monitored by an audio monitor (AM8RS; Grass Instruments Co.) and displayed on an oscilloscope (model 2211; Tektronix Inc.). The thin filament was further split until the afferent activity arising from a single unit was electrically isolated. The nerve trunk was ligated just above the diaphragm to eliminate afferent signals arising from lower visceral organs. The afferent activity of a single unit was first searched by hyperinflation (3-4 x V T ) and then identified by the immediate (delay < 1 s) response to a bolus injection of capsaicin (1.0 µg/kg) into the right atrium. Finally, the general locations of pulmonary C-fibers were identified by their responses to the gentle pressing of the lungs with a blunt-ended glass rod. The signals of the afferent activity, P t and ABP were recorded on a thermal writer (TW11; Gould Instrument Systems Inc.) and on a VCR format data recorder (SLV-N900; Sony Electronics Inc.). 17
35 Fiber activities (FA) in impulses per second (imp/s) were analyzed by an on-line data acquisition system (TS-100; Biocybernetics) in 0.5-s intervals. Inflammatory Cell Analysis in Bronchoalveolar Lavage Fluid (BALF) BALF was collected from two other groups of rats (control and Ova-sensitized) after 3 weeks of vehicle and Ova exposures, respectively. BALF was obtained by injecting 10 ml of sterile saline (5 ml, twice) into the lungs of the anesthetized rat via a tracheal cannula. The collected BALF (approximately 7 ml) was centrifuged at 1,500 rpm for 10 min, and the pelleted cells were treated with TRIS-buffered ammonium chloride solution (ph 7.2) to lyse red blood cells. The remaining cells were washed once with phosphate-buffered saline, supplemented with 1% fetal calf serum, 100 U/ml penicillin, 100 µg/ml streptomycin, and 250 ng/ml amphotericin (GIBCO). Total cell counts were determined using a hemocytometer. Differential leukocyte counts were then performed on cytospin slides after Wright-Giemsa staining. A minimum of 500 leukocytes were counted using standard morphologic criteria and determined by two different individuals. The data were then averaged. Measurements of Lung Mechanics Control and sensitized rats were anesthetized and artificially ventilated, in the same manner as that described earlier, one day after the last Ova exposure or vehicle. A catheter for measuring intrapleural pressure (P pl ) was inserted into the intrapleural cavity via a surgical incision between the fifth and sixth ribs; this incision was subsequently sutured and further sealed air-tight with silicone jelly. The pneumothorax was then 18
36 corrected by briefly opening the intrapleural catheter to ambient air during a held hyperinflation (3 V T ). During the experiment, animals were paralyzed with pancuronium bromide (50 µg/kg, intravenously). Transpulmonary pressure was measured as the difference between P t and P pl with a differential pressure transducer (Validyne MP 45-28). Respiratory flow was measured with a heated pneumotachograph and a differential pressure transducer (Validyne MP 45-14). All signals were recorded on a chart recorder (Grass model 7); total pulmonary resistance (R L ) and dynamic lung compliance (C dyn ) were analyzed continuously by an on-line computer on a breath-bybreath basis (TS-100 series; Biocybernetics). Acute Ova Inhalation Challenge Ova aerosol (3%) was delivered directly into the lungs for 5 min; aerosol was generated by an ultrasonic nebulizer (Lumiscope 6610; Lumiscope Co.) that was connected between the outlet of the respirator and the tracheal cannula to prevent contamination of the breathing circuit by the residual Ova. The mass mean diameter of aerosol under our experimental setting was estimated to be 3-4 µm. To shorten the protocol in order to maintain the signal stability of single-fiber recording, acute inhalation Ova challenge was administrated for a shorter duration (5 min) at a higher concentration of Ova solution (3%). Methacholine (MCh) Dose-response Curve To verify AHR, responses of R L and C dyn to inhalation challenge with increasing concentrations of MCh aerosol (0.1, 0.3, 1, 3 mg/ml solutions) were determined in each 19
37 animal. MCh aerosol was generated and delivered in the same manner as described above for 1 min. There was a 15-min interval between two consecutive MCh aerosol challenges. The lungs were hyperinflated (3 V T ) at 2 min before each MCh aerosol challenge. Experimental Protocol Three series of experiments were carried out. Series 1-1 was carried out to determine the presence and severity of airway inflammation by differential leukocyte counts of the BALF on day 21 at 4-6 hours after the last inhalation exposure to Ova aerosol. Series 1-2 was designed to investigate whether the bronchomotor responses to inhaled MCh aerosol and acute Ova inhalation challenge were altered by Ova sensitization in anesthetized rats. On day 24, the dose-response curve to MCh aerosol was obtained in each of the animals. Subsequently, responses of R L and C dyn were measured continuously in each animal before and for 30 min immediately after acute Ova inhalation challenge. Series 1-3 was carried out to determine whether the excitability of pulmonary C- fibers was altered by chronic Ova sensitization, and to determine if the changes were further augmented by acute Ova inhalation challenge. The baseline activities and the responses to lung inflation and chemical stimulation were determined in anesthetized, open-chest, and artificially ventilated rats before and within 45 min after acute Ova challenge in both control and sensitized rats on day 24. The baseline FA was recorded first followed by the response to lung inflation, and five minutes later the response to chemical stimulation. A 10-min interval was allowed between two chemical stimulation trials. Baseline FA was averaged over 60 s in each fiber before and 5-15 min after acute 20
38 Ova challenge (3%, 5 min). Constant-pressure lung inflation was applied by inflating the lung with a constant air flow (~ 12 ml/s) until P t reached 15 or 30 cmh 2 O, and maintained at that pressure for 10 s after turning off the respirator. Two chemical agents (capsaicin 0.25 and 0.5 µg/kg; adenosine 75 and 150 µg/kg) were selected as stimulants of pulmonary C-fibers for the following reasons: capsaicin is a potent stimulant of pulmonary C-fibers and a selective agonist of TRPV1 [34]; adenosine is a metabolite of ATP and another pulmonary C-fiber stimulant, but its action is mediated by activating adenosine A 1 receptors [83]. The volume of each bolus injection was 0.15 ml, which was first slowly injected into the catheter (dead space ~ 0.2 ml) and then flushed into the right atrium by an injection of 0.4 ml saline before and within 45 min after the acute Ova challenge (3%, 5 min). Mean arterial blood pressure (MABP) and heart rate (HR) were measured as 30-s averages before and after acute Ova challenge in both control and sensitized rats. Materials The Ova solution was prepared daily (concentration = 1.25% in saline). Imject Alum as adjuvant was purchased from Pierce Biotechnology (Rockford, IL). A stock solution of capsaicin (250 µg/ml) was prepared in 1% Tween 80, 1% ethanol and 98% saline and stored at - 20 C. Stock solutions of adenosine (10 mg/ml) and methacholine (250 mg/ml) were prepared in saline and stored at - 20 C. Dilutions of these chemical agents at desired concentrations for injection or aerosolization were then prepared daily by dilution with isotonic saline based on the animal's body weight. All chemical agents were purchased from Sigma Chemical. 21
39 Statistical Analysis Data were analyzed with a two-way repeated-measure ANOVA, unless mentioned otherwise. One factor was the treatment effect of Ova, and the other factor was the effect of lung inflation or chemical agents. When the ANOVA showed a significant interaction, pair-wise comparisons were made with a post hoc analysis (Fisher's least significant difference). A P-value < 0.05 was considered significant. Data are reported as mean ± S.E.M. 2.3 Results A total of 52 rats (control, n = 26; sensitized, n = 26) were used in this study. The average body weight of control rats (300.8 ± 3.7 g) was significantly higher than sensitized rats (279.6 ± 4.4 g; P < 0.05). Series 1-1: Effect of chronic Ova sensitization on airway inflammatory cells infiltration The total number of leukocytes in the BALF collected from sensitized rats (n = 7) exceeded that of control ones (n = 7) by 73%. In particular, the percentage of eosinophils ( = 1633%; P < 0.01; paired t-test), neutrophils ( = 1159%; P < 0.01), and lymphocytes ( = 183%; P < 0.05) in the BALF of sensitized rats were distinctly higher than that in control rats (Table 2.1). Series 1-2: Effect of chronic Ova sensitization on bronchial reactivity 22
40 There was no significant difference in the average baseline R L or C dyn between control and sensitized rats, but the bronchomotor response to acute Ova aerosol challenge was significantly higher in sensitized rats (Fig. 2.2). The same Ova inhalation challenge evoked an intense increase of the R L, which sustained and remained above the baseline for 30 min after challenge in sensitized rats; in contrast, no detectable change in R L was found in control rats. The decrease in C dyn after the Ova inhalation challenge was also significantly greater in sensitized rats (Fig. 2.2). Even in control rats, C dyn decreased significantly below the baseline after acute Ova challenge, which was presumably caused by the aerosol (liquid) deposition in the lung because the decrease in C dyn could be readily reversed by hyperinflation of the lung (data not shown). Inhalation of MCh aerosol induced an increase in R L and a decrease in C dyn in a dosedependent manner in both control and sensitized rats (Fig. 2.3). The bronchomotor responses to MCh aerosol were significantly higher in sensitized rats at the higher concentrations of MCh (1.0 and 3.0 mg/ml) (Fig. 2.3), verifying the presence of nonspecific AHR in the sensitized group. Series 1-3: Effect of Ova sensitization on the excitability of pulmonary C-fibers A total of 35 pulmonary C-fibers were studied in 28 rats (control rats: ± 5.7 g, n = 14; sensitized rats: ± 4.7 g, n = 14). The distribution of these receptors was as follows: 2 in upper lobe; 7 in middle lobe; 12 in lower lobe, and 6 in accessory lobe; all were located in the right lung. The locations of remaining 8 pulmonary C-fibers were not identified, but all of them were activated by lung inflation and a bolus injection of 23
41 capsaicin with a latency of < 1 s; these receptors were therefore considered as pulmonary C-fibers [33]. Pulmonary C-fibers showed either no or very low and irregular baseline FA in both control and sensitized rats before acute Ova challenge. However, baseline FA in sensitized rats (0.36 ± 0.21 imp/s; n = 11) was significantly higher than that in control rats (0.02 ± 0.01 imp/s; n = 12, P < 0.05) (Fig. 2.4). After the acute Ova challenge, FA in sensitized rats was further elevated (0.74 ± 0.24 imp/s) and significantly higher than that in control rats (0.01 ± 0.01 imp/s) (P < 0.01, Fig. 2.4). There was no significant difference in FA, compared between before and after acute Ova challenge in either control or sensitized rats, despite that the average baseline FA in sensitized rats was almost doubled after acute Ova challenge (Fig. 2.4). There was no significant difference in either baseline MABP or HR between control and sensitized rats (Table 2.2). The pulmonary C-fiber response to lung inflation was also markedly greater in sensitized rats. The change in FA ( FA) in response to lung inflation was calculated as the difference between the average FA over the 10-s interval during lung inflation and the baseline FA (60-s average) in each fiber. Before acute Ova challenge, the response to lung inflation (P t = 30 cmh 2 O) in sensitized rats ( FA = 1.43 ± 0.42 imp/s) was significantly higher than that in control rats ( FA = 0.46 ± 0.1 imp/s, P < 0.05); after acute Ova challenge, the same lung inflation evoked a greater response in both groups, but the response ( FA) was greater in sensitized rats (2.83 ± 0.64 imp/s) than in control rats (0.85 ± 0.19 imp/s, P < 0.05). The FA response to lung inflation was markedly augmented by acute Ova challenge in sensitized rats (P < 0.01), but not in control rats (Figs. 2.5 & 2.6). The response to lower intensity of lung inflation (P t = 15 cmh 2 O) in 24
42 sensitized rats was significantly higher than that in control rats after acute Ova challenge, but not before the Ova challenge (Fig. 2.6). Responses of pulmonary C-fibers to chemical stimulants (capsaicin and adenosine) were also clearly elevated in sensitized rats. The FA in response to a stimulus was calculated as the difference between the peak FA and the baseline FA (60-s average) in each fiber. The peak response of FA was averaged over 2-s and 10-s intervals after injections of capsaicin and adenosine, respectively, because the fiber discharges evoked by adenosine lasted substantially longer. Right-atrial injection of capsaicin (0.5 µg/kg) consistently evoked an abrupt burst of C-fiber activity in both control and sensitized rats, accompanied by reflex bradycardia and hypotension, presumably mediated through the C-fiber afferents conducted in the left vagus nerve (e.g., Fig. 2.7). The responses of pulmonary C-fibers to the high dose (0.5 µg/kg) of capsaicin ( FA = 12.2 ± 2.3 and 17.5 ± 2.6 imp/s, before and after acute Ova challenge, respectively) in sensitized rats were distinctly higher than those in control rats ( FA = 4.15 ± 0.86 imp/s and 3.81 ± 0.93 imp/s, before and after acute Ova challenge, respectively; P < 0.05 and P < 0.01) (Figs. 2. 7, 2.8 & 2.9). In sensitized rats, the duration of discharge in response to capsaicin (0.5 µg/kg) was also significantly increased after acute Ova challenge (P < 0.01; Fig. 2.9B). Interestingly, the decrease in HR and MABP induced by capsaicin appeared to last a longer duration after acute Ova challenge in both control and sensitized rats (e.g., Fig. 2.7 & 2.8). The pulmonary C-fiber response to the lower dose of capsaicin (0.25 µg/kg) was also distinctly different between control and sensitized rats, both before and after acute Ova challenge. These results further showed that the FA responses to capsaicin were significantly augmented by acute Ova challenge in sensitized rats (P < 0.05) (Fig. 2.9), 25
43 but not in control rats. The differences in response to right-atrial injection of adenosine between control and sensitized rats were similar but less pronounced, as compared to the difference in the response to capsaicin between the two groups. The response to the high dose of adenosine (150 µg/kg) in sensitized rats was higher than that in control rats both before and after acute Ova challenge, whereas the response to the low dose (75 µg/kg) was significantly higher in the sensitized rats only after acute Ova inhalation challenge (P < 0.05) (Fig. 2.10). There was no significant difference in the duration of fiber discharge after the adenosine injection either between control and sensitized rats, or before and after acute challenge (Fig. 2.10). 26
44 Table 2.1. Effect of Ova sensitization on leukocyte counts in BALF collected at 4-6 hours after the acute Ova inhalation challenge. Group Control, n = 7 Sensitized, n = 7 Total cells ( 10 5 ) Basophils (%) Eosinophils (%) Lymphocytes (%) Monocytes (%) Neutrophils (%) 12.32± ± ± ± ± ± ± ± ±0.41** 13.14±2.54* 54.71±8.13* 27.71±8.68** Data are presented as means ± S.E.M. * (P < 0.05) and * * (P < 0.01), significant difference between control and sensitized rats (paired t-test). 27
45 Table 2.2. Effects of acute Ova inhalation challenge on average baseline MABP and HR in both control and sensitized rats. Control, n =14 Sensitized, n =14 MABP (mmhg) HR (beats/min) Before Ova After Ova Before Ova After Ova 86.1± ± ± ± ± ± ± ±8.0 MABP and HR were measured before and within 45 min after acute Ova challenge (3%, 5 min). Data are means ± S.E.M. 28
 which allows the rat to receive sufficient Ova/saline aerosol.")
46 Figures A B Air Ova 5% Nebulizer Figure 2.1. Experimental setup for exposure of rats to Ova aerosol. Panel A: Photographs show a rat placed in the restrainer during aerosol exposure. Note the small dead space in the nose (marked by arrow) which allows the rat to receive sufficient Ova/saline aerosol. Panel B: A schematic drawing illustrates the Ova aerosol delivery system. 29
47 Figure 2.2. Responses of R L (total pulmonary resistance) and C dyn (dynamic lung compliance) to acute inhalation of Ova aerosol (3%, 5 min). Open circles: responses in control animals; filled circles: responses in sensitized animals. Ova aerosol (3%; 5 min) was delivered into the lung by respirator between the two arrows. The peak responses were averaged over 20 consecutive breaths at every 2 min after acute inhalation of Ova in each animal. Data represent means ± S.E.M. of five rats in each group. * (P < 0.05), significant difference comparing between the baseline and the response to Ova at different time points in either control or sensitized group; (P < 0.05), significant difference comparing corresponding data between control and sensitized groups. 30
48 Figure 2.3. Dose responses of R L (total pulmonary resistance) and C dyn (dynamic lung compliance) to aerosolized methacholine (MCh) in control and sensitized rats. MCh aerosol was delivered by respirator for 1 min. Peak response to each dose of MCh aerosol in each animal was averaged over 10 consecutive breaths that occurred within 30 seconds after the MCh aerosol exposure (1 min). Baseline data (zero concentration of MCh) represent responses to vehicle (isotonic saline). Open circles: responses in control animals; filled circles: responses in sensitized animals. Data represent means ± S.E.M. of five rats in each group. * (P < 0.05), significant difference comparing the baseline and the response to MCh in either control or sensitized group; (P < 0.05), significant difference comparing corresponding data between control and sensitized groups. 31
49 Figure 2.4. The average baseline fiber activities before and after acute Ova challenge in anesthetized, open-chest and artificially ventilated rats. Baseline FA was averaged over 60 s in each fiber before and 5 15 min after acute Ova inhalation challenge (3%, 5 min). Open bars: control rats, n = 12; close bars: sensitized rats, n = 11. * (P < 0.05) and ** (P < 0.01), significantly different between corresponding data in control and sensitized rats. Data are mean ± S.E.M. 32
50 Figure 2.5. Experimental records illustrating the effects of acute Ova challenge on the pulmonary C-fiber responses to lung inflation in anesthetized, open-chest and artificially ventilated rats. Left and right panels, responses to lung inflation (P t = 30 cmh 2 O for 10 s) before and at ~ 15 min after acute Ova challenge (3%, 5 min), respectively. AP, action potential; P t, tracheal pressure; ABP, arterial blood pressure. Receptor location in the control rat (297 g): right lower lobe. Receptor location in the sensitized rat (298 g): right accessory lobe. The large spike at the end of lung inflation in each panel was electrical noise generated by turning on the respirator. 33
51 Figure 2.6. Effect of Ova sensitization on the average responses of pulmonary C- fibers to lung inflation in anesthetized, open-chest and artificially ventilated rats. Left and right panels, average responses to lung inflation at P t of 15 and 30 cmh 2 O, respectively. Open bars: control rats, n = 13; closed bars: sensitized rats, n = 16 in left panel, and n = 15 in right panel. Responses were tested both before and 5-25 min after acute Ova challenge (3%, 5 min) in both control and sensitized rats. FA represents the difference between the average FA over the 10-s interval during lung inflation and the average baseline FA (over 60 s) in each fiber. * (P < 0.05) and ** (P < 0.01), significant difference in responses between control and sensitized rats; (P < 0.05) and (P < 0.01), significant difference in responses between before and after acute Ova challenge in either control or sensitized rats. Data are means ± S.E.M. 34
52 Figure 2.7. Experimental records illustrating the effects of acute Ova inhalation challenge on the pulmonary C-fiber responses to capsaicin in anesthetized, openchest and artificially ventilated rats. Left panel, responses to capsaicin (0.5 µg/kg in 0.15 ml volume) that was slowly injected into the catheter and then flushed (at arrow) into the right atrium as a bolus with saline (0.4 ml) before acute Ova challenge (3%, 5 min); right panel, responses to the same dose of capsaicin at ~ 30 min after acute Ova inhalation challenge. Receptor location in control rat (300 g): right lower lobe. Receptor location in sensitized rat (285 g): right lower lobe. For detailed descriptions, see legend of Fig
53 Figure 2.8. Effects of acute Ova inhalation challenge on pulmonary C-fiber activity and cardiovascular responses to capsaicin in anesthetized and open-chest rats. Left and right panels: the FA and cardiovascular responses to right-atrial injection of capsaicin (0.5 µg/kg) in both control (open circles, n = 13) and sensitized (closed circles, n = 15) rats before and min after acute Ova challenge (3%, 5 min), respectively. MABP, mean arterial blood pressure; HR, heart rate. Dashed vertical line depicts the time of capsaicin injection. 36
54 Figure 2.9. Effect of Ova sensitization on the average peak response and the duration of discharge of pulmonary C-fibers in response to right-atrial bolus injection of capsaicin in anesthetized, open-chest and artificially ventilated rats. Panel A and B, average peak responses (top) and durations of discharge (bottom) of pulmonary C-fibers in response to right-atrial injections of capsaicin at 0.25 and 0.5 µg/kg, respectively. Open bars: control rats, n = 11 in panel A, n = 13 in panel B; closed bars: sensitized rats, n = 10 in panel A, n = 15 in panel B. FA represents the difference between the peak FA (average over 2-s interval) within 5 s after the injection and the baseline FA (average over 60-s interval) in each fiber. Duration of discharge was calculated as the time when FA exceeded the average baseline FA by 1 imp/s. Responses 37
55 were tested before and min after the acute Ova challenge (3%, 5 min) in both control and sensitized rats. * (P < 0.05) and ** (P < 0.01), significant difference in the response or the duration of discharge between control and sensitized rats; (P < 0.05) and (P < 0.01), significant difference in the response or the duration of the discharge between before and after acute Ova challenge. Data are means ± S.E.M. 38
56 Figure Effect of Ova sensitization on the average peak response and the duration of discharge of pulmonary C-fibers in response to right-atrial bolus injection of adenosine in anesthetized, open-chest and artificially ventilated rats. Panels A and B, average peak responses (top) and durations of discharge (bottom) of pulmonary C-fibers in response to right-atrial injections of adenosine at 75 and 150 µg/kg, respectively. Open bars: control rats, n = 12; closed bars: sensitized rats, n = 12. FA represents the difference between the peak FA (average over 10-s interval) and the baseline FA (average over 60-s interval) in each fiber. Duration of discharge was calculated as the time when FA exceeded the average baseline FA by 0.5 imp/s. Responses were tested before and min after acute Ova challenge (3%, 5 min) in 39
57 both control and sensitized rats. * (P < 0.05), significant difference in the response between control and sensitized rats. Data are means ± S.E.M. Copyright Guangfan Zhang
58 CHAPTER THREE Study Series 2: Altered Expression of TRPV1 and Sensitivity to Capsaicin in Pulmonary Myelinated Afferents following Chronic Airway Inflammation in the Rat 3.1 Specific Aim The present study was carried out to investigate: 1) whether the sensitivity of vagal myelinated afferents to capsaicin is altered in Ova-sensitized rats; and 2) If so, whether the expression of the TRPV1 channel is upregulated in pulmonary sensory neurons of the nodose and jugular ganglia. 3.2 Methods The experimental procedures in study series 2 were performed in accordance with the recommendations of the Guide for the Care and Use of Laboratory Animals, and were also approved by the University of Kentucky Institutional Animal Care and Use Committee. Allergen Sensitization and Animal Exposure Adult male BN rats were separated into 2 groups (control, n = 19; sensitized, n = 21). Sensitized rats received the same sensitization procedure as described in Chapter 2, except the concentration of Ova solution was increased to 5% (wt/vol concentration: 5% 41
59 in saline). Control rats received i.p. injection and aerosol inhalation of the vehicle (isotonic saline) following the identical procedures as sensitized rats. Animal Preparation After 3 weeks of either Ova or saline exposure, rats were anesthetized, and trachea, femoral artery and left jugular vein were cannulated for measuring P t, ABP and administration of pharmacological agents, respectively. For detailed descriptions of other procedures, see Chapter 2. Measurements of Pulmonary Chemoreflex Responses Rats breathed spontaneously via the tracheal cannula. Respiratory flow was measured with a heated pneumotachograph connected to the tracheal cannula and a differential pressure transducer (Validyne MP45-14), and integrated to give V T. f, expiratory duration (T E ), ABP, and HR were analyzed (TS-100; Biocybernetics) on a breath-by-breath basis by an on-line computer. Measurement of Single Fiber Activity Pulmonary single-unit fiber activities were recorded in anesthetized, vagotomized, open-chest and artificially ventilated rats, as described in details in Chapter 2 [33]. Briefly, after a midline thoracotomy was performed, the lung was artificially ventilated with a respirator (Model 7025; UGO Basile); the expiratory outlet of the respirator was placed under 3 cmh 2 O pressure to maintain a near-normal functional residual capacity. Volume and frequency were set at ~8 ml/kg and breaths/min, respectively. To prevent a 42
60 possible indirect stimulatory effect caused by reflex bronchoconstriction on these afferents, bilateral vagotomy was performed on these animals. The caudal end of the cut right vagus nerve was placed on a small dissecting platform and immersed in a pool of mineral oil. A thin filament was teased away from the desheathed nerve trunk and further split until the afferent activity arising from a single unit was electrically isolated. The nerve trunk was ligated just above the diaphragm to eliminate afferent signals arising from lower visceral organs. SARs and RARs were searched initially by their responses to lung inflation and deflation, and then further identified by their adaptation indexes (AIs) in response to lung inflation; AI was calculated in each fiber by dividing the difference in fiber activity (FA) between the first two seconds during a constant-pressure (P t = 30 cmh 2 O) lung inflation by the FA of the first second, and expressed as a percentage [84]. Fibers with AIs of < 80% and > 80% were classified as SARs and RARs, respectively. The signals of the afferent activity, P t and ABP were recorded on a thermal writer (Gould TW11; Gould Instrument Inc.), and analyzed by a computer and a data acquisition system (TS-100; Biocybernetics) in 0.1 s intervals. Measurement of Conduction Velocity As described in details previously [33], we isolated the intrathoracic segment of the right vagus nerve in each animal, and placed a pair of stimulating electrodes under the vagus nerve above the exit of its pulmonary branches. A rectangular constant-current pulse (duration: ms; intensity: ma) was generated by a pulse generator (WPI A310) and a stimulus isolation unit (WPI A360R-C), and delivered to the 43
61 stimulatory electrodes. The exact distance between stimulating and recording electrodes was measured to calculate the conduction velocity. The general locations of all fibers were identified by their responses to gently pressing the lungs with a saline-wetted cotton Q-tip. Only receptors with their locations identified in the lung or airways were included for data analysis in this study. Finally, animals were euthanized after the experiment by an i.v. injection of KCl. Retrograde Neuronal Tracing The cell bodies of sensory neurons innervating the lungs and airways were identified by retrograde labeling from the lungs using the fluorescent tracer, 1,1 - dioctadecyl-3,3,3,3 -tetramethylindocarbocyanine perchlorate (DiI; Sigma). A polyethylene catheter (PE-150) was inserted into the trachea of the anesthetized (pentobarbital sodium, i.p., 40 mg/kg) rat via larynx, and its tip was positioned above the thoracic inlet. DiI (1 mg/ml) was sonicated and dissolved in ethanol, diluted in saline (1% ethanol vol/vol), and instilled into the lungs (0.2 ml x 2) with the animal's head tilted up at ~30. Five days later, the rats were subjected to chronic exposure to saline or Ova aerosol. Tissue preparation On day 24 (three days after the last exposure to saline or Ova aerosol), rats were anesthetized with halothane inhalation, euthanized and transcardially perfused with 0.01M phosphate-buffered saline (PBS), followed by freshly prepared 0.01 M phosphate buffer (ph 7.4) containing 4% paraformaldehyde. The nodose and jugular ganglia were dissected and fixed in 4% paraformaldehyde for 4 hours. The ganglia were incubated in 44
62 20% sucrose in PBS overnight at 4 C, embedded in Tissue-Tek OCT compound (VWR Scientific), and frozen in dry ice for serial cryosectioning at 12 µm on a cryostat (Model550; MICROM International GmbH). The sections were mounted on SuperFrost Plus slides (Fisher Scientific), and air dried. Immunohistochemistry Tissue sections were first pre-incubated for 1 h at room temperature with 0.01 M PBS containing 5% normal donkey serum to block non-specific protein binding sites. Then, the sections were incubated in a mixture of 1:500 TRPV1 antibody (rabbit polyclonal antibody), or in combination with 1:1000 neurofilament (NF) 160/200 antibody (mouse monoclonal antibody) overnight at 4 C, which were each diluted in PBS containing 5% normal donkey serum and 0.1% Triton X-100. After three 10-min washes in PBS, the sections were incubated with a mixture of 1:200 FITC conjugated donkey anti-rabbit IgG and 1:200 AMCA conjugated donkey anti-mouse IgG for 1 h at room temperature. Finally, the sections were washed again in PBS and mounted in Vectorshield (Vector Laboratories). The immunoreactivity of each neuron was analyzed using epifluorescence microscopy (Zeiss Axiovert 100AV) with appropriate filter combinations. DiI was detected with the filter module (wavelengths of 552 nm for excitation and 565 nm for emission); FITC (495 nm excitation and 528 nm emission); AMCA (353 nm excitation and 440 nm emission). The sections were visualized with an AxioCam MRc color CCD camera (Zeiss, Inc.). All images were captured using the same brightness and contrast setting. 45
63 The specificity of the TRPV1 antibody used in this study was tested in two separate procedures (Fig. 3.1A & B): 1) applying TRPV1 antibody to the nodose-jugular ganglia of TRPV1-null mice (B6.129X1-Trpv1 tm1jul /J; the Jackson Laboratory), and 2) neutralizing the primary antibody with a blocking peptide (Neuromics). Ganglia tested with either of the two procedures showed no the TRPV1 immunoreactivity. For negative controls, primary antibodies were omitted (Fig. 3.1C). At least two slides for each animal were prepared to test as negative controls. Quantitative Analysis One nodose and one jugular ganglia were studied in each animal. A total of ~100 sections were obtained from the entire length of each ganglion (~1.5 mm). To avoid double counting of the same neurons, every eighth section ( 96 µm apart) was selected from serial sections for each ganglion. About 12 sections were analyzed per ganglion in each trial. Two regions of interest were captured and analyzed per section at 20x magnification. Computer-assisted image analysis was used to analyze quantitatively the expression of TRPV1 and NF immunoreactivity. Digital images were captured using an Axiovert 100AV microscope with a CCD camera (AxioCam MRc color CCD; Zeiss, Inc.) interfaced through a Dell Dimensions 4600 computer using Axiovision 4.6 software (Carl Zeiss Imaging Systems). The TRPV1, NF and DiI thresholds were set based on their densities on the control slides. DiI-labeled, TRPV1-positive and NF-positive neurons were counted separately, and co-localizations were determined for each region. The proportion of a neuron phenotype in a given population of neurons is expressed in 46
64 percentage and then averaged for group analysis; for example, the percentage of TRPV1- positive neurons in pulmonary (DiI-labeled) neurons was determined in each section, and averaged for the entire ganglion in each animal. Data were then pooled in each group of animals for statistical analysis. Experimental Design and Protocol Three series of experiments were carried out: in Series 2-1, we investigated the effect of Ova sensitization on pulmonary chemoreflex sensitivity in anesthetized, spontaneously breathing rats. The cardiorespiratory reflex responses to right-atrial injection of the same dose of capsaicin ( µg/kg) were compared between control and sensitized rats. To determine the responses mediated through vagal myelinated afferents to capsaicin, perineural capsaicin treatment (PNCT) of both cervical vagus nerves was applied to selectively block the neural conduction in vagal C-fiber afferents as described previously [85]. Briefly, cotton strips soaked in capsaicin solution (250 µg/ml) were wrapped around a 2 3 mm segment of the isolated cervical vagus nerves for 30 min. The apneic response to right-atrial injection of capsaicin was measured as the ratio between apneic duration and baseline T E ; apneic duration is the longest T E occurring within 5 s after the capsaicin injection. In Series 2-2, the effects of Ova sensitization on the baseline FA and the responses of RARs and SARs to lung inflation and capsaicin were determined. Baseline FA was averaged over 20 consecutive breaths in each fiber. Constant-pressure lung inflation was applied by inflating the lung with a constant air flow (~ 12 ml/s) until P t reached 30 cmh 2 O, and maintained at that pressure for 10 s after turning off the respirator. 47
65 Responses to lung inflation were calculated as the FA in the first second during lung inflation. Capsaicin (0.5 and 1.0 µg/kg) was first injected as a bolus (0.15 ml volume) into the catheter (dead space ~ 0.2 ml) and then flushed into the right atrium by an injection of 0.3 ml saline. The FA in response to capsaicin was calculated as the difference between the peak FA (averaged over 2 consecutive breaths) within 5 s after capsaicin injection and the baseline FA (averaged over 20 consecutive breaths) in each fiber. To avoid any accumulated effect, at least 10 min elapsed between two injections. Series 2-3 was carried out to investigate whether the ratios of TRPV1-positive neurons in pulmonary myelinated and non-myelinated neurons have been altered by Ova sensitization. NF has been used as the specific marker for identifying myelinated neurons [86, 87]. Thus, DiI-labeled NF-positive neurons were considered as pulmonary myelinated neurons. The number of pulmonary non-myelinated neurons (DiI-labeled NFnegative) was calculated as the number of pulmonary neurons (DiI-labeled) minus the number of pulmonary myelinated neurons (DiI-labeled NF-positive). Materials Solution of Ova was prepared daily at the concentration described earlier. Solutions of chemical agents at the desired concentrations for injection or aerosolization were prepared daily by dilution with isotonic saline based on the animal's body weight. All chemical agents were purchased from Sigma Chemical, except Imject Alum (Pierce Biotechnology); rabbit polyclonal TRPV1 antibody (Chemicon Inc); FITC conjugated donkey anti-rabbit IgG, AMCA conjugated donkey anti-mouse IgG and normal donkey serum (Jackson ImmunoResearch Labs). 48
66 Statistical Analysis Statistical analysis of the difference in the responses between control and sensitized groups was performed using one-way or two-way ANOVA. When the twoway ANOVA showed a significant interaction, pairwise comparisons were made with a post hoc analysis (Fisher's least significant difference). A P-value < 0.05 was considered significant. Data were reported as mean ± S.E.M. 3.3 Results A total of 40 adult male BN rats were used in this study. Average body weight of sensitized rats was significantly lower (266.7 ± 5.5 g; n = 21) than that of control rats (300.4 ± 5.6 g; n = 19, P < 0.01). Series 2-1: Effect of chronic Ova sensitization on reflex responses induced by activation of pulmonary C-fibers and RARs In anesthetized, spontaneously breathing rats, right-atrial injection of capsaicin ( µg/kg) immediately elicited apnea, bradycardia and hypotension in control rats; these pulmonary chemoreflex responses are well documented in the literature and known to be mediated through stimulation of pulmonary C-fiber afferents [23, 48]. In comparison, the same dose of capsaicin challenge elicited clearly more pronounced pulmonary chemoreflex responses in Ova-sensitized rats (e.g., Fig. 3.2). The apneic ratio (apneic duration /average baseline T E ) was 265 ± 88 % in control rats (n = 7), and 605 ± 49
67 193 % in sensitized rats (n = 7; P < 0.05) after injection of low dose of capsaicin (0.5 µg/kg). More importantly, capsaicin injection frequently elicited an augmented breath (inspiratory V T exceeding the baseline V T by twofold), which usually occurred shortly following the initial apnea in sensitized rats, but not in control rats (e.g., Fig. 3.2). Augmented breath is a vagal-mediated reflex response known to be triggered by activation of RARs [88, 89] and can be completely eliminated by vagotomy (data not shown). Furthermore, after the C-fiber conduction was selectively blocked by PNCT of both cervical vagus nerves, the same capsaicin injection no longer elicited the apnea, whereas the occurrence of augmented breath became more consistent and its volume was further amplified in sensitized rats (Fig. 3.2), probably resulting from the removal of C- fiber mediated respiratory inhibition by PNCT [88]. Results of this series imply that sensitivity to capsaicin of RARs was elevated in Ova-sensitized rats. Series 2-2: Effect of Ova sensitization on the excitability of myelinated afferents A total of 75 vagal bronchopulmonary afferents were studied in 18 anesthetized, open-chest rats (18 RARs and 13 SARs in 8 control rats and 26 RARs and 18 SARs in 10 sensitized rats): in control rats, 9.6, 41.9, 38.6 and 12.9% receptors were in upper, middle, lower and accessory lobes, respectively; in sensitized rats, 17.8, 46.7, 28.9 and 6.6% receptors were in upper, middle, lower and accessory lobes, respectively. The average conduction velocities were 12.6 ± 1.5 m/s for RARs and 14.8 ± 2.0 m/s for SARs in the control group, and were 13.2 ± 1.5 m/s for RARs and 15.2 ± 1.7 m/s for SARs in the sensitized group; no significant difference in the conduction velocity was found between control and sensitized rats in either RARs or SARs. 50
68 Approximately a half of the RARs exhibited distinct phasic baseline activity that was synchronous with either expiratory or inspiratory phase of respiratory cycles. The remaining RARs had no detectable or very little respiratory-related baseline activity (Fig. 3.3). These two types of RARs were named as phasic RARs and silent RARs in this study; in order to balance the distribution, the same number of each of these two types of RARs was selected from both control and sensitized groups for this study. In phasic RAR groups, there was no significant difference in the intensity and pattern of the baseline activity between control (3.7 ± 1.8 impulses/breath (imp/breath), n = 9) and sensitized rats (6.2 ± 1.7 imp/breath, n = 13) (Fig. 3.4). Similarly, in silent RAR groups, there was also no significant difference in the baseline activity between control (0.2 ± 0.1 imp/breath, n = 9) and sensitized rats (0.3 ± 0.1 imp/breath, n = 13). When constantpressure lung inflation (P t = 30 cmh 2 O) was applied for 10 s, the discharge in RARs increased abruptly in response to inflation and then rapidly declined despite the maintained P t (Fig. 3.3). When lung deflation was applied by exposing the expiratory outlet of the respirator to atmospheric pressure (P t = 0 cmh 2 O), the activity of RARs increased and did not show any sign of rapid adaptation during the prolonged deflation (e.g., Fig. 3.3). In phasic RARs, the FA in response to lung inflation in the first second were 4.4 ± 1.6 and 15.5 ± 5.7 impulses in control (n = 9) and sensitized rats (n = 13) (Fig. 3.5), respectively, but there was no significant difference between them (P = 0.13). In view of the three-fold difference in the responses and the small sample size of these data, a non-parametric statistical analysis (Wilcox rank sum test) was also applied, but a significant difference was not found (P = 0.18) in the response. Similarly, in silent RARs, there was 51
69 also no significant difference in the first-second response to the lung inflation between control and sensitized rats (Figs. 3.3 & 3.4). In sharp contrast, the responses of these afferents to capsaicin were markedly elevated in sensitized rats. In silent RARs, the high dose (1 µg/kg) of capsaicin triggered a significantly higher discharge in sensitized rats ( FA = 3.2 ± 0.9 imp/breath, n = 13) than those in control rats ( FA = 0.5 ± 0.3 imp/breath, n = 9, P < 0.05; Figs. 3.3 & 3.6B). The response of phasic RARs to the same dose of capsaicin showed a similar pattern as that in silent RARs (Fig. 3.6B; in control rats, FA = 0.9 ± 0.4 imp/breath, n = 9; in sensitized rats, FA = 12.4 ± 3.3 imp/breath, n = 13; P < 0.01). All of the SARs (13 in control and 18 in sensitized rats) exhibited distinct phasic baseline activity that peaked during the inspiratory phase of the respiratory cycles. The discharge of SARs showed very little adaptation during the constant-pressure lung inflation (AI < 80%), but ceased during deflation (e.g., Fig. 3.5). No significant difference in either the baseline activity (FA = 15.8 ± 6.1 imp/breath and 17.8 ± 5.0 imp/breath in control and sensitized rats, respectively) or the responses to lung inflation in the first second (FA = 68.5 ± 11.5 impulses and 86.1 ± 18.0 impulses, in control and sensitized rats, respectively) was found between the two groups (Fig. 3.4). In contrast, the response to capsaicin (1 µg/kg) was significantly elevated in sensitized rats ( FA = 8.1 ± 2.2 imp/breath, n = 18) compared to controls ( FA = 2.3 ± 1.3 imp/breath, n = 13, P < 0.05) (Figs. 3.5 & 3.6B). When all the pulmonary myelinated afferents, including both RARs and SARs were grouped together, right-atrial injection of either low or high dose of capsaicin evoked significantly higher responses in sensitized rats than in controls (e.g., at the 52
70 capsaicin dose of 1.0 µg/kg, FA = 7.9 ± 1.4 imp/breath, n = 44 in sensitized rats, FA = 1.4 ± 0.7 imp/breath, n = 31 in control rats; P < 0.01; Fig. 3.6A). Series 2-3: Effect of Ova sensitization on the expression of TRPV1 channels in both nodose and jugular ganglia To investigate whether TRPV1 expression in pulmonary neurons in nodose and jugular ganglia is altered by Ova sensitization, bronchopulmonary neurons were identified using DiI labeling. In nodose ganglia obtained from control rats, 35.1% of the neurons were retrogradely labeled with DiI, which was similar to that of sensitized rats (33.6%). Among these DiI-labeled neurons, 68.1 ± 1.3% exhibited TRPV1 immunoreactivity in control rats. In comparison, a significantly higher percentage of the DiI-labeled neurons (80.9 ± 1.2%; n = 4, P < 0.05) expressed TRPV1 in sensitized rats (Fig. 3.7A). To further investigate the relative increase of TRPV1 expression in myelinated and non-myelinated neurons, we used NF immunoreactivity as the criterion to identify myelinated neurons. Previous studies showed that all NF positive neurons were large, myelinated neurons and essentially all NF-negative neurons were small, nonmyelinated C neurons [87]. Among these DiI-labeled neurons, 32.8 ± 1.6% and 36.1 ± 2.1% were NF-positive neurons in control and sensitized rats, respectively (Fig. 3.8A). The percentage of TRPV1-positive pulmonary myelinated (DiI-labeled and NF-positive) neurons was significantly higher in sensitized rats (73.7 ± 1.5%) than in control rats (47.8 ± 1.6%; n = 4, P < 0.05) (Figs. 3.8B & C). Surprisingly, there was no significant difference in the percentage of TRPV1-immunoreactive pulmonary nonmyelinated (C-) (NF-negative and DiI-labeled) neurons between control (78.1 ± 1.7%) and sensitized rats 53
71 (85.1 ± 1.5%; n = 4, P > 0.05) (Fig. 3.8B). Thus, the staining for TRPV1 in nodose ganglia revealed a substantial increase of TRPV1 expression in DiI-labeled neurons induced by sensitization. The increase was mainly found in NF-positive DiI-labeled neurons (Table 3.1; Figs. 3.8B & C). Among jugular ganglion neurons obtained from the same groups of animals, approximately 28.5 ± 0.4% were labeled with DiI in control rats, which was not significantly different from those of the jugular neurons in sensitized rats (30.5 ± 1.5%). There was no difference in TRPV1 expression in DiI-labeled neurons between control and sensitized rats (61.5 ± 3.0% in control rats; 63.8 ± 2.5% in sensitized rats; Fig. 3.7B). Furthermore, 31.8 ± 1.8% and 28.5 ± 1.8% of the DiI-labeled neurons in control and sensitized rats, respectively, were NF positive (Fig. 3.9A). In contrast to what we found in nodose ganglia, the expression of TRPV1 in DiI-labeled NF-positive neurons was not different between control and sensitized rats. The percentages of TRPV1-positive neurons in bronchopulmonary myelinated neurons were 51.5 ± 1.1% and 47.9 ± 0.6% (P > 0.05) in control and sensitized rats, respectively (Fig. 3.9B). Therefore, TRPV1 expression in either myelinated or non-myelinated neurons was not altered by Ova sensitization in jugular ganglia (Table 3.1). To avoid possible bias and to verify data accuracy, the quantitative immunohistochemistry analyses were re-performed in 21% of the images that were randomly selected from both groups and blindly coded by a person unfamiliar with the experiment. The difference between the two analyses of the same slides was relatively small; for example, the differences for NF, DiI and TRPV1 stainings were 2.1 ± 0.4%, 4.1 ± 0.8% and 2.6 ± 0.4%, respectively. 54
72 Table 3.1. Expression of TRPV1-immunoreactivity in myelinated and nonmyelinated pulmonary neurons in nodose and jugular ganglia. Nodose (%) DiI/All NF(+)/DiI NF(-)/DiI TRPV1(+)/DiI TRPV1(+) /DiI NF(+) TRPV1(+) /DiI NF(-) Control 35.1 ± ± ± ± ± ± 1.7 Sensitized 33.6 ± ± ± ± 1.2* 73.7 ± 1.5* 85.1 ± 1.5 Jugular (%) DiI/All NF(+)/DiI NF(-)/DiI TRPV1(+)/DiI TRPV1(+) /DiI NF(+) TRPV1(+) /DiI NF(-) Control 28.5 ± ± ± ± ± ± 4.1 Sensitized 30.5 ± ± ± ± ± ± 3.2 The number of DiI-labeled, NF-negative [NF(-)] neurons was calculated by subtracting the number of DiI-labeled NF-positive neurons from the total number of DiI-labeled neurons; the TRPV1 expression in pulmonary non-myelinated neurons as the number of TRPV1-positive DiI-labeled neurons minus the number of TRPV1-postive NF-positive neurons with DiI. Control rats, n = 4; sensitized rats, n = 4. Values are means ± S.E.M. *, P < 0.05, significant difference between the corresponding data of control and sensitized rats. 55


73 Figures Figure 3.1. TRPV1 antibody specificity test (panels A and B) and IHC controls for TRPV1 and NF (panel C). Panel A demonstrates TRPV1 immunoreactivity (TRPV1-IR) in the ganglion of TRPV1 wild type (WT) mice, but not in that of TRPV1 -/- mice. Panel B demonstrates that 56
74 preabsorption of the TRPV1 antibody with TRPV1 blocking peptides blocks specific binding of the antibody to the tissue with only very low non-specific binding. Panel C shows that omitting the primary antibodies (for TRPV1 and NF) incubation step in the staining protocol did not result in non-specific binding of the secondary antibodies. Scale bar: 100 µm. 57
75 Figure 3.2. Experimental records illustrating the effect of perineural capsaicin treatment (PNCT) of both cervical vagi on cardiorespiratory responses to capsaicin injection. Upper, middle and lower panels: responses to right-atrial injection of capsaicin before, during and after PNCT. Right-atrial injection of capsaicin (1 µg/kg in 0.15-ml volume) was slowly injected into the catheter and then flushed (at arrow) into the right atrium as a bolus with saline (0.3 ml). Asterisks were added to depict the augmented breaths. Note that the augmented breath was consistently elicited by capsaicin in sensitized rat (243 g; right) and its volume was amplified when C-fiber conduction in the vagus nerve was selectively blocked either during or after PNCT. Vagal-mediated reflex apnea elicited by lung inflation (P t = 10 cmh 2 O) was not blocked by PNCT in either control or sensitized rat (records not shown), indicating that neural conduction was intact in myelinated afferents. Partial recovery of the response was shown at 70 min after the termination of PNCT in the control rat (257 g; left). Note the augmented breath was always followed 58
76 immediately by a short apnea (e.g., right lower panel), which was probably caused by the hypocapnia generated by the augmented breath. 59
77 Figure 3.3. Experimental records illustrating the responses of silent RARs to lung inflation, deflation and capsaicin injection in anesthetized, vagotomized, open-chest and artificially ventilated rats. Left, responses to lung inflation (P t = 30 cmh 2 O for 10 s); middle, responses to lung deflation (P t = 0 cmh 2 O at the end of expiration); right, responses to right-atrial injection of capsaicin (1 µg/kg; arrow). Note the lack of bradycardia and hypotensive reflex responses to capsaicin injection because of the bilateral vagotomy performed in these rats. AP, action potential; P t, tracheal pressure; ABP, arterial blood pressure. Control rat (299 g): receptor location, right middle lobe; conduction velocity, 15.3 m/s. Sensitized rat (258 g): receptor location, right lower lobe; conduction velocity, 16.7 m/s. 60
78 Figure 3.4. Average baseline fiber activities (FA) and the responses of silent (si) RARs, phasic (ph) RARs and SARs to lung inflation in anesthetized, vagotomized, open-chest and artificially ventilated rats. Baseline FA was averaged over 20 consecutive breaths in each fiber. Response to lung inflation was measured as the FA during the first second of lung inflation (P t = 30 cmh 2 O). Values are means ± S.E.M. Open bars, control group (n = 9 fibers in A, n = 9 in B, n = 13 in C); filled bars, sensitized group (n = 13 fibers in A, n = 13 in B, n =18 in C). No statistical difference was found in any of the corresponding data between control and sensitized groups. 61
79 Figure 3.5. Experimental records illustrating the responses of SARs to lung inflation, deflation and capsaicin injection in anesthetized, vagotomized, open-chest and artificially ventilated rats. Left, responses to lung inflation (P t = 30 cmh 2 O for 10 s); middle, responses to lung deflation (P t = 0 cmh 2 O at the end of expiration); right, responses to right-atrial injection of capsaicin (1 µg/kg). Control rat (291 g): receptor location, right middle lobe; conduction velocity, 12.9 m/s. Sensitized rat (272 g): receptor location, right middle lobe; conduction velocity, 16.3 m/s. For detailed descriptions, see legend of Fig
80 Figure 3.6. Effect of Ova sensitization on responses of myelinated afferents to rightatrial injection of capsaicin in anesthetized, vagotomized, open-chest and artificially ventilated rats. Panel A: average responses of all the myelinated afferents to right-atrial injection of capsaicin at 0.5 µg/kg and 1 µg/kg. Open bars, control group (n = 31 fibers); filled bars, sensitized group (n = 44 fibers). Values are means ± S.E.M. FA, difference between the 63
81 peak FA (averaged over 2 consecutive breaths) within 5 s after capsaicin injection and the baseline FA (averaged over 20 consecutive breaths) in each fiber. Panel B: Scatterplot diagrams of the responses of silent RARs, phasic RARs and SARs to right-atrial injection of capsaicin (1 µg/kg). RAR(si): silent RAR; RAR(ph): phasic RAR. Open circles, data obtained in control group (n = 9, 9 and 13 in silent RARs, phasic RARs and SARs, respectively); filled circles, sensitized group (n = 13, 13 and 18 in silent RARs, phasic RARs and SARs, respectively). Dash line: mean of the FA. *, P < 0.05 and **, P <0.01, significant difference in the responses between control and sensitized rats., P < 0.01, significant difference in the responses between low and high doses of capsaicin. 64


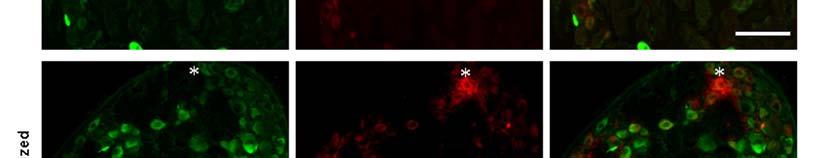

82 Figure 3.7. Effect of Ova sensitization on TRPV1 expression in pulmonary neurons 65
83 in nodose and jugular ganglia. Percentages of DiI-labeled (pulmonary) neurons in all neurons, and TRPV1-positive neurons in pulmonary neurons in nodose (A) and jugular (B) ganglia. Open bars, average data obtained from control rats (n = 4); filled bars, sensitized rats (n = 4). Values are means ± S.E.M. *, P < 0.05, significant difference between control and sensitized rats. C and D: representative photographs of double-labeling immunohistochemistry of TRPV1 and DiI in nodose (C) and jugular (D) of both control and sensitized rats. Left, TRPV1 staining in green; middle, DiI labeling in red; right, the merged image. Arrows are added to depict co-localization of TRPV1 staining and DiI labeling in the same neurons. Asterisks depict the DiI labeled neurons without TRPV1 staining. Scale bar, 100 µm. 66


84 Figure 3.8. Effect of Ova sensitization on TRPV1 expression in NF-positive and NFnegative neurons with DiI labeling in nodose ganglion. 67
85 A: percentages of NF-positive and NF-negative neurons in DiI-labeled pulmonary neurons. B: percentages of TRPV1-positive neurons in NF-positive and NF-negative neurons labeled with DiI. Open bars, average data obtained from control rats (n = 4); filled bars, sensitized rats (n = 4). Values are means ± S.E.M. *, P < 0.05, significant difference between control and sensitized rats. C: representative photographs of triplelabeling immunohistochemistry of NF, DiI and TRPV1 in nodose ganglia of both control and sensitized rats. The first column from left, NF staining in blue; second, DiI labeling in red; third, TRPV1 staining in green; fourth, the merged image. Arrows are added to depict co-localization of NF staining, DiI labeling and TRPV1 staining in the same neurons. Asterisks depict the neuron with co-localization of NF staining and DiI labeling, but without TRPV1 staining. Scale bar, 100 µm. 68


86 Figure 3.9. Effect of Ova sensitization on TRPV1 expression in NF-positive and NFnegative neurons with DiI labeling in jugular ganglion. 69
Inflammation-Induced Airway Hypersensitivity: From Ion Channels to Patients
 Inflammation-Induced Airway Hypersensitivity: From Ion Channels to Patients Lu-Yuan Lee, Ph.D. Airway Sensory Neurobiology Laboratory Department of Physiology University of Kentucky Medical Center BACKGROUND
Systems Pharmacology Respiratory Pharmacology. Lecture series : General outline
 Systems Pharmacology 3320 2017 Respiratory Pharmacology Associate Professor Peter Henry (Rm 1.34) Peter.Henry@uwa.edu.au Division of Pharmacology, School of Biomedical Sciences Lecture series : General
RESPIRATORY BLOCK. Bronchial Asthma. Dr. Maha Arafah Department of Pathology KSU
 RESPIRATORY BLOCK Bronchial Asthma Dr. Maha Arafah Department of Pathology KSU marafah@ksu.edu.sa Jan 2018 Objectives Define asthma (BA) Know the two types of asthma 1. Extrinsic or atopic allergic 2.
Asthma. - A chronic inflammatory disorder which causes recurrent episodes of wheezing, breathlessness, cough and chest tightness.
 Obstructive diseases Asthma - A chronic inflammatory disorder which causes recurrent episodes of wheezing, breathlessness, cough and chest tightness. - Characterized by Intermittent and reversible (the
Dr Rodney Itaki Lecturer Division of Pathology Anatomical Pathology Discipline
 Pathology of Asthma Dr Rodney Itaki Lecturer Division of Pathology Anatomical Pathology Discipline Bronchial Asthma Definition: chronic, relapsing inflammatory lung disorder characterised by reversible
Impact of Asthma in the U.S. per Year. Asthma Epidemiology and Pathophysiology. Risk Factors for Asthma. Childhood Asthma Costs of Asthma
 American Association for Respiratory Care Asthma Educator Certification Prep Course Asthma Epidemiology and Pathophysiology Robert C. Cohn, MD, FAARC MetroHealth Medical Center Cleveland, OH Impact of
Medicine Dr. Kawa Lecture 1 Asthma Obstructive & Restrictive Pulmonary Diseases Obstructive Pulmonary Disease Indicate obstruction to flow of air
 Medicine Dr. Kawa Lecture 1 Asthma Obstructive & Restrictive Pulmonary Diseases Obstructive Pulmonary Disease Indicate obstruction to flow of air through the airways. As asthma, COPD ( chronic bronchitis
Prostaglandin E 2 Enhances Chemical and Mechanical Sensitivities of Pulmonary C Fibers in the Rat
 Prostaglandin E 2 Enhances Chemical and Mechanical Sensitivities of Pulmonary C Fibers in the Rat CHING-YIN HO, QIHAI GU, JU-LUN HONG, and LU-YUAN LEE Department of Physiology, University of Kentucky,
Potent and Selective CRTh2 Antagonists are Efficacious in Models of Asthma, Allergic Rhinitis and Atopic Dermatitis
 Potent and Selective CRTh2 Antagonists are Efficacious in Models of Asthma, Allergic Rhinitis and Atopic Dermatitis Laura L. Carter, Yoshi Shiraishi, Yooseob Shin, Laurence Burgess, Christine Eberhardt,
Respiratory System. Introduction. Atmosphere. Some Properties of Gases. Human Respiratory System. Introduction
 Introduction Respiratory System Energy that we consume in our food is temporarily stored in the bonds of ATP (adenosine triphosphate) before being used by the cell. Cells use ATP for movement and to drive
Lecture Notes. Chapter 3: Asthma
 Lecture Notes Chapter 3: Asthma Objectives Define asthma and status asthmaticus List the potential causes of asthma attacks Describe the effect of asthma attacks on lung function List the clinical features
211MDS Pain theories
 211MDS Pain theories Definition In 1986, the International Association for the Study of Pain (IASP) defined pain as a sensory and emotional experience associated with real or potential injuries, or described
The Respiratory System
 Elaine N. Marieb Katja Hoehn Human Anatomy & Physiology SEVENTH EDITION C H A P T E R PowerPoint Lecture Slides prepared by Vince Austin, Bluegrass Technical and Community College 22P A R T B The Respiratory
Chapter 11 The Respiratory System
 Biology 12 Name: Respiratory System Per: Date: Chapter 11 The Respiratory System Complete using BC Biology 12, page 342-371 11.1 The Respiratory System pages 346-350 1. Distinguish between A. ventilation:
ASTHMA. Epidemiology. Pathophysiology. Diagnosis. IAP UG Teaching slides
 BRONCHIAL ASTHMA ASTHMA Epidemiology Pathophysiology Diagnosis 2 CHILDHOOD ASTHMA Childhood bronchial asthma is characterized by Airway obstruction which is reversible Airway inflammation Airway hyper
ASTHMA ASTHMA DISEASE SUMMARY. Risk Factors
 ASTHMA Risk Factors Family history of asthma or other atopic diseases (eczema, hayfever) Having eczema or hayfever currently or as a child Living in an industrialised area more exposure to airborne pollutants,
Chapter 10. The Respiratory System Exchange of Gases. Copyright 2009 Pearson Education, Inc.
 Chapter 10 The Respiratory System Exchange of Gases http://www.encognitive.com/images/respiratory-system.jpg Human Respiratory System UPPER RESPIRATORY TRACT LOWER RESPIRATORY TRACT Nose Passageway for
2. List seven functions performed by the respiratory system?
 The Respiratory System C23 Study Guide Tortora and Derrickson 1. In physiology we recognize that the word respiration has three meanings. What are the three different meanings of the word respiration as
Defining Asthma: Clinical Criteria. Defining Asthma: Bronchial Hyperresponsiveness
 Defining Asthma: Clinical Criteria Atopy 34% Recent wheeze 20% Asthma 11% AHR 19% n = 807 From: Woolcock, AJ. Asthma in Textbook of Respiratory Medicine, 2nd ed. Murray, Nadel, eds.(saunders:philadelphia)
What are the Human Health Effects of Air Pollution?
 What are the Human Health Effects of Air Pollution? Dr. Judy Guernsey Department of Community Health and Epidemiology Dalhousie University Nova Scotia Department of Environment and Labour Outdoor Air Quality
Immunology of Asthma. Kenneth J. Goodrum,Ph. Ph.D. Ohio University College of Osteopathic Medicine
 Immunology of Asthma Kenneth J. Goodrum,Ph Ph.D. Ohio University College of Osteopathic Medicine Outline! Consensus characteristics! Allergens:role in asthma! Immune/inflammatory basis! Genetic basis!
Respiratory Pharmacology. Manuel Otero Lopez Department of Anaesthetics and Intensive Care Hôpital Européen Georges Pompidou, Paris, France
 Respiratory Pharmacology Manuel Otero Lopez Department of Anaesthetics and Intensive Care Hôpital Européen Georges Pompidou, Paris, France Programme Bronchomotor tone Drugs and factors influencing airway
Function of the Respiratory System. Exchange CO2 (on expiration) for O2 (on inspiration)
 for O2 (on inspiration)") Function of the Respiratory System Exchange CO2 (on expiration) for O2 (on inspiration) Upper Respiratory Tract Includes: Nose Mouth Pharynx Larynx Function: Warms and humidifies the inspired air Filters
Function of the Respiratory System Exchange CO2 (on expiration) for O2 (on inspiration) Upper Respiratory Tract Includes: Nose Mouth Pharynx Larynx Function: Warms and humidifies the inspired air Filters
Respiratory System. Functional Anatomy of the Respiratory System
 Respiratory System Overview of the Respiratory System s Job Major Duty Respiration Other important aspects ph control Vocalization Processing incoming air Protection Metabolism (ACE) What structures allow
Air Flow Limitation. In most serious respiratory disease, a key feature causing morbidity and functional disruption is air flow imitation.
 Asthma Air Flow Limitation In most serious respiratory disease, a key feature causing morbidity and functional disruption is air flow imitation. True whether reversible, asthma and exercise-induced bronchospasm,
Chapter 10 The Respiratory System
 Chapter 10 The Respiratory System Biology 2201 Why do we breathe? Cells carry out the reactions of cellular respiration in order to produce ATP. ATP is used by the cells for energy. All organisms need
Hypersensitivity is the term used when an immune response results in exaggerated or inappropriate reactions harmful to the host.
 Hypersensitivity is the term used when an immune response results in exaggerated or inappropriate reactions harmful to the host. Hypersensitivity vs. allergy Hypersensitivity reactions require a pre-sensitized
Respiratory Pharmacology PCTH 400 Asthma and β-agonists
 Respiratory Pharmacology PCTH 400 Asthma and β-agonists Dr. Tillie-Louise Hackett Department of Anesthesiology, Pharmacology and Therapeutics University of British Columbia Associate Director, Centre of
Systems Pharmacology Respiratory Pharmacology. Lecture series : General outline
 Systems Pharmacology 3320 2017 Respiratory Pharmacology Associate Professor Peter Henry (Rm 1.34) Peter.Henry@uwa.edu.au Division of Pharmacology, School of Biomedical Sciences Lecture series : General
Basic mechanisms disturbing lung function and gas exchange
 Basic mechanisms disturbing lung function and gas exchange Blagoi Marinov, MD, PhD Pathophysiology Department, Medical University of Plovdiv Respiratory system 1 Control of breathing Structure of the lungs
Chronic Cough. Abhishek Kumar, MD, MPH Pulmonary and Critical Care Mercy Medical Center, Cedar Rapids, IA
 Chronic Cough Abhishek Kumar, MD, MPH Pulmonary and Critical Care Mercy Medical Center, Cedar Rapids, IA What we shall discuss? Cough anatomy and pathophysiology Common etiologies Work-up Role of spirometry/pulmonary
Respiratory System. Organization of the Respiratory System
 Respiratory System In addition to the provision of oxygen and elimination of carbon dioxide, the respiratory system serves other functions, as listed in (Table 15 1). Respiration has two quite different
RESPIRATORY PHARMACOLOGY - ASTHMA. Primary Exam Teaching - Westmead ED
 RESPIRATORY PHARMACOLOGY - ASTHMA Primary Exam Teaching - Westmead ED Sympathomimetic agents MOA: relax airway smooth muscle and inhibit broncho constricting mediators from mast cells May also inhibit
Chapter 2 Electrophysiologically Identified Airway Receptors: Main Characteristics
 Chapter 2 Electrophysiologically Identified Airway Receptors: Main Characteristics The most generally accepted classification discriminates mechanosensory slowly adapting (stretch) receptors (SARs), rapidly
Control of Respiration
 Control of Respiration Graphics are used with permission of: adam.com (http://www.adam.com/) Benjamin Cummings Publishing Co (http://www.awl.com/bc) Page 1. Introduction The basic rhythm of breathing is
Pathophysiology of Pain
 Pathophysiology of Pain Wound Inflammatory response Chemical mediators Activity in Pain Path PAIN http://neuroscience.uth.tmc.edu/s2/chapter08.html Chris Cohan, Ph.D. Dept. of Pathology/Anat Sci University
Chronic inflammation of the airways Hyperactive bronchi Shortness of breath Tightness in chest Coughing Wheezing
 Chronic inflammation of the airways Hyperactive bronchi Shortness of breath Tightness in chest Coughing Wheezing Components of the respiratory system Nasal cavity Pharynx Trachea Bronchi Bronchioles Lungs
Function: to supply blood with, and to rid the body of
 1 2 3 4 5 Bio 1102 Lec. 7 (guided): Chapter 10 The Respiratory System Respiratory System Function: to supply blood with, and to rid the body of Oxygen: needed by cells to break down food in cellular respiration
Chapter 11 Introduction to the Nervous System and Nervous Tissue Chapter Outline
 Chapter 11 Introduction to the Nervous System and Nervous Tissue Chapter Outline Module 11.1 Overview of the Nervous System (Figures 11.1-11.3) A. The nervous system controls our perception and experience
COPYRIGHTED MATERIAL. Definition and Pathology CHAPTER 1. John Rees
 CHAPTER 1 Definition and Pathology John Rees Sherman Education Centre, Guy s Hospital, London, UK OVERVIEW Asthma is an overall descriptive term but there are a number of more or less distinct phenotypes
Chapter 10. Respiratory System and Gas Exchange. Copyright 2005 Pearson Education, Inc. publishing as Benjamin Cummings
 Chapter 10 Respiratory System and Gas Exchange Function of the Respiratory System To obtain oxygen (O 2 ) for all cells in the body. To rid the cells of waste gas (CO 2 ). Oxygen (O 2 ) is vital chemical
Learning Outcomes. Systems Pharmacology PHAR3320. Nerves of the Respiratory Tract. Dr Fernandes
 Systems Pharmacology PHAR3320 Nerves of the Respiratory Tract Dr Fernandes Learning Outcomes By the end of this lecture, students should be able to describe nerve pathways that innervate the airways discuss
Pharmacology of the Respiratory Tract Lecture 2: Allergy and IgE
 Pharmacology of the Respiratory Tract Lecture 2: Allergy and IgE Dr. Tillie-Louise Hackett Centre for Heart Lung Innovation University of British Columbia tillie.hackett@hli.ubc.ca Learning Objectives
2010 Health Press Ltd.
 Fast Facts Fast Facts: Asthma Third edition Stephen T Holgate MD DSc FRCP FMedSci MRC Clinical Professor of Immunopharmacology School of Medicine Southampton General Hospital Southampton, UK Jo Douglass
Lymphoid System: cells of the immune system. Answer Sheet
 Lymphoid System: cells of the immune system Answer Sheet Q1 Which areas of the lymph node have most CD3 staining? A1 Most CD3 staining is present in the paracortex (T cell areas). This is towards the outside
Anatomy & Physiology 2 Canale. Respiratory System: Exchange of Gases
 Anatomy & Physiology 2 Canale Respiratory System: Exchange of Gases Why is it so hard to hold your breath for Discuss! : ) a long time? Every year carbon monoxide poisoning kills 500 people and sends another
CHAPTER 7.1 STRUCTURES OF THE RESPIRATORY SYSTEM
 CHAPTER 7.1 STRUCTURES OF THE RESPIRATORY SYSTEM Pages 244-247 DO NOW What structures, do you think, are active participating in the breathing process? 2 WHAT ARE WE DOING IN TODAY S CLASS Finishing Digestion
Respiratory Physiology
 Respiratory Physiology Dr. Aida Korish Associate Prof. Physiology KSU The main goal of respiration is to 1-Provide oxygen to tissues 2- Remove CO2 from the body. Respiratory system consists of: Passages
The Respiratory System Structures of the Respiratory System Structures of the Respiratory System Structures of the Respiratory System Nose Sinuses
 CH 14 D.E. Human Biology The Respiratory System The Respiratory System OUTLINE: Mechanism of Breathing Transport of Gases between the Lungs and the Cells Respiratory Centers in the Brain Function Provides
Chapter 7. Anticholinergic (Parasympatholytic) Bronchodilators. Mosby items and derived items 2008, 2002 by Mosby, Inc., an affiliate of Elsevier Inc.
 Bronchodilators. Mosby items and derived items 2008, 2002 by Mosby, Inc., an affiliate of Elsevier Inc.") Chapter 7 Anticholinergic (Parasympatholytic) Bronchodilators Clinical Indications for Use Indication for anticholinergic bronchodilator COPD maintenance Indication for combined anticholinergic and β-agonist
Chapter 7 Anticholinergic (Parasympatholytic) Bronchodilators Clinical Indications for Use Indication for anticholinergic bronchodilator COPD maintenance Indication for combined anticholinergic and β-agonist
7/12/2012. Respiratory system. Respiratory Response to Toxic Injury (Lung) Ninth Industrial Toxicology and Pathology Short Course.
 Ninth Industrial Toxicology and Pathology Short Course.") Ninth Industrial Toxicology and Pathology Short Course 23 27 July, 2012 Contemporary Concepts in Target Organ Toxicologic Pathology Respiratory system Respiratory Response to Toxic Injury (Lung) Eric Wheeldon
Ninth Industrial Toxicology and Pathology Short Course 23 27 July, 2012 Contemporary Concepts in Target Organ Toxicologic Pathology Respiratory system Respiratory Response to Toxic Injury (Lung) Eric Wheeldon
Defining Asthma: Clinical Criteria. Defining Asthma: Bronchial Hyperresponsiveness
 Defining Asthma: Clinical Criteria Atopy 34% Recent wheeze 20% Asthma 11% AHR 19% n = 807 From: Woolcock, AJ. Asthma in Textbook of Respiratory Medicine, 2nd ed. Murray, Nadel, eds.(saunders:philadelphia)
Defining Asthma: Bronchial Hyperresponsiveness. Defining Asthma: Clinical Criteria. Impaired Ventilation in Asthma. Dynamic Imaging of Asthma
 Defining Asthma: Clinical Criteria Defining Asthma: Bronchial Hyperresponsiveness Atopy 34% Recent wheeze 20% Asthma 11% AHR 19% n = 807 From: Woolcock, AJ. Asthma in Textbook of Respiratory Medicine,
Respiratory System. BSC 2086 A&P 2 Professor Tcherina Duncombe Palm Beach State College
 Respiratory System BSC 2086 A&P 2 Professor Tcherina Duncombe Palm Beach State College Respiration Ventilation of lungs Gas exchange between air/bld and bld/tissue Use of oxygen in cellular respiration
HYPERSENSITIVITY REACTIONS D R S H O AI B R AZ A
 HYPERSENSITIVITY REACTIONS D R S H O AI B R AZ A HYPERSENSITIVITY REACTIONS Are exaggerated immune response upon antigenic stimulation Individuals who have been previously exposed to an antigen are said
E-1 Role of IgE and IgE receptors in allergic airway inflammation and remodeling
 E-1 Role of IgE and IgE receptors in allergic airway inflammation and remodeling Ruby Pawankar, MD, Ph.D. FRCP, FAAAAI Prof. Div of Allergy, Dept of Pediatrics Nippon Medical School Tokyo, Japan pawankar.ruby@gmail.com
Significance. Asthma Definition. Focus on Asthma
 Focus on Asthma (Relates to Chapter 29, Nursing Management: Obstructive Pulmonary Diseases, in the textbook) Asthma Definition Chronic inflammatory disorder of airways Causes airway hyperresponsiveness
Airway Inflammation in Asthma Chih-Yung Chiu 1,2, Kin-Sun Wong 2 1 Department of Pediatrics, Chang Gung Memorial Hospital, Keelung, Taiwan.
 REVIEW ARTICLE Chih-Yung Chiu 1,2, Kin-Sun Wong 2 1 Department of Pediatrics, Chang Gung Memorial Hospital, Keelung, Taiwan. 2 Division of Pediatric Pulmonology, Department of Pediatrics, Chang Gung Memorial
Respiratory system. Applied Anatomy &Physiology
 Respiratory system Applied Anatomy &Physiology Anatomy The respiratory system consists of 1)The Upper airway : Nose, mouth and larynx 2)The Lower airways Trachea and the two lungs. Within the lungs,
B cell response. B cell response. Immunological memory from vaccines. Macrophage and helper T cell involvement with initiating a B cell response:
 B cell response Macrophage and helper T cell involvement with initiating a B cell response: B cell response When specific B cells are activated, they multiply Some cells become memory cells, stored in
CHAPTER 22 RESPIRATORY
 pulmonary ventilation move air external respiration exchange gases transportation of gases internal respiration exchange gases CHAPTER 22 RESPIRATORY in / out lungs air - blood blood - cells cell respiration
Asthma. chapter 7. Overview
 chapter 7 Asthma Sinus Sinus Sinus Right lung Adenoids Tonsils Pharynx Epiglottis Oesophagus Right bronchus Nasal cavity Oral cavity Tongue Larynx Trachea Ribs Left bronchus Diaphragm Bronchiole Pleura
Overview. The Respiratory System. Chapter 18. Respiratory Emergencies 9/11/2012
 Chapter 18 Respiratory Emergencies Slide 1 Overview Respiratory System Review Anatomy Physiology Breathing Assessment Adequate Breathing Breathing Difficulty Focused History and Physical Examination Emergency
The Respiratory System. Dr. Ali Ebneshahidi
 The Respiratory System Dr. Ali Ebneshahidi Functions of The Respiratory System To allow gases from the environment to enter the bronchial tree through inspiration by expanding the thoracic volume. To allow
Asthma Pathophysiology and Treatment. John R. Holcomb, M.D.
 Asthma Pathophysiology and Treatment John R. Holcomb, M.D. Objectives Definition of Asthma Epidemiology and risk factors of Asthma Pathophysiology of Asthma Diagnostics test of Asthma Management of Asthma
10.00 PBS OVA OVA+isotype antibody 8.00 OVA+anti-HMGB1. PBS Methatroline (mg/ml)
") RESEARCH ARTICLE Penh (100% of PBS) 1 PBS 8.00 +anti-hmgb1 6.00 4.00 p=0.054 Cellular & Molecular Immunology advance online publication, PBS 3.12 6.25 Methatroline (mg/ml) Neutrophil isolation and culture
RESEARCH ARTICLE Penh (100% of PBS) 1 PBS 8.00 +anti-hmgb1 6.00 4.00 p=0.054 Cellular & Molecular Immunology advance online publication, PBS 3.12 6.25 Methatroline (mg/ml) Neutrophil isolation and culture
CAPTAINS TRYOUTS 2018 ANATOMY & PHYSIOLOGY ANSWER KEY
 CAPTAINS TRYOUTS 2018 ANATOMY & PHYSIOLOGY ANSWER KEY Section 1: Respiratory System (65 points) 1) It provides CO 2 and O 2 exchange, enables vocalization, provides the sense of smell, helps control the
Pulmonary Function Testing: Concepts and Clinical Applications. Potential Conflict Of Interest. Objectives. Rationale: Why Test?
 Pulmonary Function Testing: Concepts and Clinical Applications David M Systrom, MD Potential Conflict Of Interest Nothing to disclose pertinent to this presentation BRIGHAM AND WOMEN S HOSPITAL Harvard
Allergic diseases and treatment. Feng Qian ( 钱峰 )
") Allergic diseases and treatment Feng Qian ( 钱峰 ) fengqian@sjtu.edu.cn Hypersensitivity Antigen Host Adaptive responses protective to the host harmful to the host The deleterious consequences of the adaptive
Allergic diseases and treatment Feng Qian ( 钱峰 ) fengqian@sjtu.edu.cn Hypersensitivity Antigen Host Adaptive responses protective to the host harmful to the host The deleterious consequences of the adaptive
SERIES 'OCCUPATIONAL ASTHMA' Edited by C. Mapp
 Eur Respir J, 1994, 7, 555 568 DOI: 10.1183/09031936.94.07030555 Printed in UK - all rights reserved Copyright ERS Journals Ltd 1994 European Respiratory Journal ISSN 0903-1936 SERIES 'OCCUPATIONAL ASTHMA'
SCIENCE OLYMPIAD CAPTAINS TRYOUTS DIVISION C ANATOMY & PHYSIOLOGY. Written by Monta Vista Science Olympiad
 SCIENCE OLYMPIAD 1 CAPTAINS TRYOUTS DIVISION C ANATOMY & PHYSIOLOGY Written by Monta Vista Science Olympiad INSTRUCTIONS: 1. Please turn in ALL MATERIALS at the end of the test. 2. Put your TEAM NAME AND
On completion of this chapter you should be able to: discuss the stepwise approach to the pharmacological management of asthma in children
 7 Asthma Asthma is a common disease in children and its incidence has been increasing in recent years. Between 10-15% of children have been diagnosed with asthma. It is therefore a condition that pharmacists
Lec #2 histology. Bronchioles:
 Lec #2 histology. Last lecture we talked about the upper respiratory tract histology, this one is about the lower part histology. We will discuss the histology of: -bronchioles -respiratory bronchioles
Question 1. Kupffer cells, microglial cells and osteoclasts are all examples of what type of immune system cell?
 Abbas Chapter 2: Sarah Spriet February 8, 2015 Question 1. Kupffer cells, microglial cells and osteoclasts are all examples of what type of immune system cell? a. Dendritic cells b. Macrophages c. Monocytes
I. Lines of Defense Pathogen: Table 1: Types of Immune Mechanisms. Table 2: Innate Immunity: First Lines of Defense
 I. Lines of Defense Pathogen: Table 1: Types of Immune Mechanisms Table 2: Innate Immunity: First Lines of Defense Innate Immunity involves nonspecific physical & chemical barriers that are adapted for
Chapter 10 Lecture Outline
 Chapter 10 Lecture Outline See separate PowerPoint slides for all figures and tables preinserted into PowerPoint without notes. Copyright 2016 McGraw-Hill Education. Permission required for reproduction
Bronchioles. Alveoli. Type I alveolar cells are very thin simple squamous epithelial cells and form most of the lining of an alveolus.
 276 Bronchioles Bronchioles continue on to form bronchi. The primary identifying feature is the loss of hyaline cartilage. The epithelium has become simple ciliated columnar, and there is a complete ring
Regulation of respiration
 Regulation of respiration Breathing is controlled by the central neuronal network to meet the metabolic demands of the body Neural regulation Chemical regulation Respiratory center Definition: A collection
Chapter 10 Respiration
 1 Chapter 10 Respiration Introduction/Importance of the Respiratory System All eukaryotic organisms need oxygen to perform cellular respiration (production of ATP), either aerobically or anaerobically.
Anatomy and Neurophysiology of Cough CHEST Guideline and Expert Panel Report
 [ Evidence-Based Medicine ] Anatomy and Neurophysiology of Cough CHEST Guideline and Expert Panel Report Brendan J. Canning, PhD ; Anne B. Chang, MBBS, PhD, MPH ; Donald C. Bolser, PhD ; Jaclyn A. Smith,
Station A: YR3 -RESPIRATORY, DIGESTIVE, IMMUNE SYSTEM Sample Tournament. Use the diagram in answering Questions 1-5.
 YR3 -RESPIRATORY, DIGESTIVE, IMMUNE SYSTEM Sample Tournament Station A: Use the diagram in answering Questions 1-5. 1. Give the name and functions of the structure labeled 5 on the diagram. 2. Give the
The Tissue Level of Organization
 The Tissue Level of Organization 4.5-4.11 August 31, 2012 4.5 Connective Tissues Describe the general features of connective Describe the structure, location, and function of the various types of connective
Cell-Derived Inflammatory Mediators
 Cell-Derived Inflammatory Mediators Introduction about chemical mediators in inflammation Mediators may be Cellular mediators cell-produced or cell-secreted derived from circulating inactive precursors,
Respiratory Pharmacology
 Allergy Targets of allergies Type I Histamine Leukotrienes Prostaglandins Bradykinin Hypersensitivity reactions Asthma Characterised by Triggered by Intrinsic Extrinsic (allergic) Mediators Result Early
Asthma Description. Asthma is a disease that affects the lungs defined as a chronic inflammatory disorder of the airways.
 Asthma Asthma Description Asthma is a disease that affects the lungs defined as a chronic inflammatory disorder of the airways. Symptoms of asthma In susceptible individuals, this inflammation causes recurrent
Robert Kruklitis, MD, PhD Chief, Pulmonary Medicine Lehigh Valley Health Network
 Robert Kruklitis, MD, PhD Chief, Pulmonary Medicine Lehigh Valley Health Network Robert.kruklitis@lvh.com Correlation of a Asthma pathophyisology with basic science Asthma (Physiology) Bronchodilators
B Unit III Notes 6, 7 and 8
 The Respiratory System Why do we breathe? B. 2201 Unit III Notes 6, 7 and 8 Respiratory System We know that our cells respire to produce ATP (energy). All organisms need energy to live, so that s why we
The Respiratory System
 BIOLOGY OF HUMANS Concepts, Applications, and Issues Fifth Edition Judith Goodenough Betty McGuire 14 The Respiratory System Lecture Presentation Anne Gasc Hawaii Pacific University and University of Hawaii
The Respiratory System
 The Respiratory System By Mr. Danilo Villar Rogayan Jr. Instructor I, Department of Natural Sciences RMTU San Marcelino Introduction Function Move air in an out of lungs (ventilation) Delivers oxygen (O
Physiological processes in the GI tract:
 Gastrointestinal physiology for medical students General principal of gastrointestinal function Motility, nervous control and blood circulation Physiological processes in the GI tract: Motility Secretion
Allergy and Immunology Review Corner: Chapter 75 of Middleton s Allergy Principles and Practice, 7 th Edition, edited by N. Franklin Adkinson, et al.
 Allergy and Immunology Review Corner: Chapter 75 of Middleton s Allergy Principles and Practice, 7 th Edition, edited by N. Franklin Adkinson, et al. Chapter 75: Approach to Infants and Children with Asthma
Respiratory System Functions. Respiratory System Organization. Respiratory System Organization
 Respiratory System Functions Functions of Respiratory System Gas exchange between blood and air Move air to and from exchange surfaces Protect exchange surfaces from environmental variations and pathogens
Unit 14: The Respiratory System
 Unit 14: The Respiratory System See what you already know! 1. Fill in the diagram on your own 2. Collaborate with your partner The Respiratory System The major function of the respiratory system is gas
Pharmacology of Pain Transmission and Modulation
 Pharmacology of Pain Transmission and Modulation 2 Jürg Schliessbach and Konrad Maurer Nociceptive Nerve Fibers Pain is transmitted to the central nervous system via thinly myelinated Aδ and unmyelinated
5/5/2013. The Respiratory System. Chapter 16 Notes. The Respiratory System. Nasal Cavity. Sinuses
 The Respiratory System Chapter 16 Notes The Respiratory System Objectives List the general functions of the respiratory system. Identify the organs of the respiratory system. Describe the functions of
CHAPTER 10 THE SOMATOSENSORY SYSTEM
 CHAPTER 10 THE SOMATOSENSORY SYSTEM 10.1. SOMATOSENSORY MODALITIES "Somatosensory" is really a catch-all term to designate senses other than vision, hearing, balance, taste and smell. Receptors that could
Obstructive Lung Diseases. By: Shefaa Qa qa
 Obstructive Lung Diseases By: Shefaa Qa qa Obstructive lung diseases (or airway diseases) are characterized by an increase in resistance to airflow due to partial or complete obstruction at any level from
10.1: Introduction. Cell types in neural tissue: Neurons Neuroglial cells (also known as neuroglia, glia, and glial cells) Dendrites.
 Dendrites.") 10.1: Introduction Copyright The McGraw-Hill Companies, Inc. Permission required for reproduction or display. Cell types in neural tissue: Neurons Neuroglial cells (also known as neuroglia, glia, and glial
10.1: Introduction Copyright The McGraw-Hill Companies, Inc. Permission required for reproduction or display. Cell types in neural tissue: Neurons Neuroglial cells (also known as neuroglia, glia, and glial
LUNGS. Requirements of a Respiratory System
 Respiratory System Requirements of a Respiratory System Gas exchange is the physical method that organisms use to obtain oxygen from their surroundings and remove carbon dioxide. Oxygen is needed for aerobic
Bronchial Epithelial Cell-Cytokine Interactions in Airway Inflammation
 NIH CONFERENCE Airway Inflammation Moderator: James H. Shelhamer, MD; Discussants: Stewart J. Levine, MD; Tong Wu, MD; David B. Jacoby, MD; Michael A. Kaliner, MD; and Stephen I. Rennard, MD Diseases characterized