Dr. Allen Back. Sep. 30, 2016
|
|
|
- Hope Adams
- 5 years ago
- Views:
Transcription
1 Dr. Allen Back Sep. 30, 2016
2 Extrapolation is Dangerous
3 Extrapolation is Dangerous And watch out for confounding variables. e.g.: A strong association between numbers of firemen and amount of damge at a fire does not mean firemen cause
 have a large impact on the line")
4 Extrapolation is Dangerous High Leverage Point: A data point (x i, y i ) with x i far from x.. Consequently the point might (depending on the actual value of y i ) have a large impact on the line of regression.
5 Was it Fair? The first draft lottery during the Vietnam War: 366 balls labeled by dates. Mixed up and pulled out in a random order.
6 Was it Fair? Scatterplot

7 Was it Fair? Boxplots for each month
8 Was it Fair? Scatterplot with Line
9 Was it Fair? Correlation Display
10 Was it Fair? Correlation Display Around 1 in a thousand chance of a correlation coefficient this far from 0 if the lottery was fair.
11 Was it Fair? Around 1 in a thousand chance of a correlation coefficient this far from 0 if the lottery was fair. The balls were probably not mixed well enough.
12 How Many Rooms Can x Clean? x crews working for a building contractor go out each night and clean y rooms. Understand the relationship?
13 How Many Rooms Can x Clean? Scatterplot
14 How Many Rooms Can x Clean? Num summary
15 How Many Rooms Can x Clean? RoomsCleaned Summary
16 How Many Rooms Can x Clean? Scatterplot with Line
17 How Many Rooms Can x Clean? Display
18 How Many Rooms Can x Clean? Display
19 How Many Rooms Can x Clean? Display RoomsCleaned = 3.70 Num
20 How Many Rooms Can x Clean? Residual Plot
21 How Many Rooms Can x Clean? There are important deviations from the the assumptions of an ideal linear regression model here.
22 Highlight of and Distance The slope b 1 of Fare = b 1 Distance + b 0 is the average increase in fare per extra mile. Fare = Distance and Distance = Fare are different lines! (Note ) If you want to compute r on a TI-83/84, the place to look is stat calc linreg. And ONCE, you need to set DiagnosticsOn in the Catalog.
23 Highlight of and Distance Phrase about the regression of y on x: The proportion of the variance of y explained by the regression is r 2.
24 Highlight of and Distance Phrase about the regression of y on x: The proportion of the variance of y explained by the regression is r 2. My view: Right psychologically but unclear at first glance what it means.
25 Highlight of and Distance Phrase about the regression of y on x: The proportion of the variance of y explained by the regression is r 2. What it actually means is Var(ŷ i ) Var(y i ) = r 2 where the variances refer to the 1 variable data sets {y i } and {ŷ i }.
26 Highlight of and Distance Phrase about the regression of y on x: The proportion of the variance of y explained by the regression is r 2. My view: Right psychologically but unclear at first glance what it means. My view: The companion statement Var(Residuals) Var(y i ) = 1 r 2 does really explain why r 2 near 1 says something important about the quality of the approximation offered by the regression model.
27 by Locality (rm outliers?, transform?) vs Housing Prices in 1996 Crime Rate is Crimes Per 1000 Housing Prices in Dollars
28 by Locality (rm outliers?, transform?) scatterplot
29 by Locality (rm outliers?, transform?) with regression line ĤP = 577 CR + 177K r 2 =.06 (SMALL)
30 by Locality (rm outliers?, transform?) regression display
31 by Locality (rm outliers?, transform?) Residuals
32 by Locality (rm outliers?, transform?) Now analyze without the Center City Outlier
33 by Locality (rm outliers?, transform?) scatterplot
34 by Locality (rm outliers?, transform?) with regression line ĤP = 2290 CR + 225K r 2 =.18 (vs..06 before)
35 by Locality (rm outliers?, transform?) regression display
36 by Locality (rm outliers?, transform?) Residuals
37 by Locality (rm outliers?, transform?) Now transform from CR to 1 CR.
38 by Locality (rm outliers?, transform?) scatterplot
39 by Locality (rm outliers?, transform?) with regression line ĤP = 1.3M But Center City included. 1 CR K r 2 =.17
40 by Locality (rm outliers?, transform?) regression display
41 by Locality (rm outliers?, transform?) Residuals
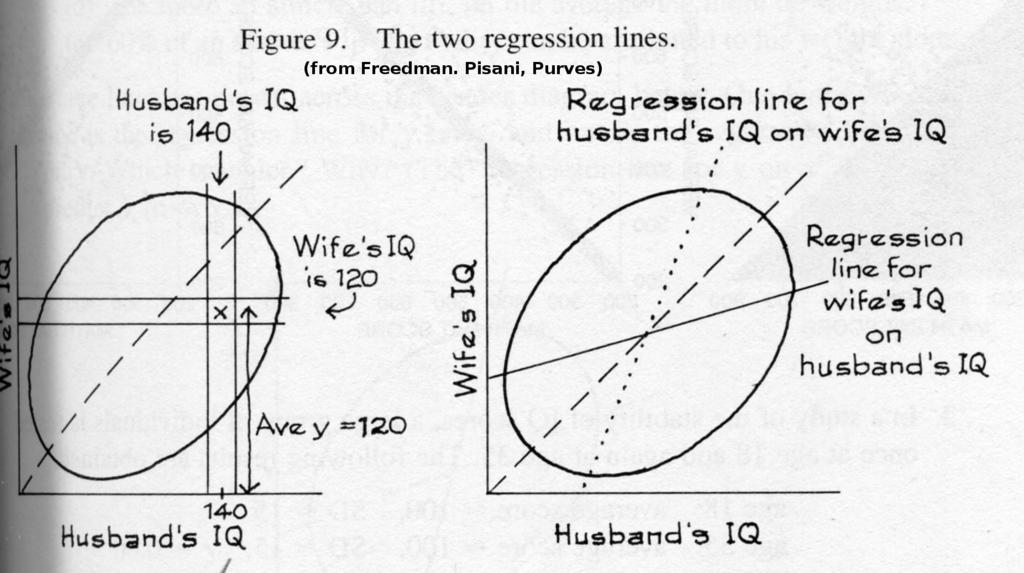
42 For both men and women: 1 IQ s average about SD about 15
43 A large study showed: 1 For men with IQ of 140, average wife s IQ was For women with IQ of 120, average husband s s IQ was Note the Z score of 140 is twice the Z score of The above kind of comparison is typical because of the two regression lines.
44
45 e.g. if r =.5, 1 Ẑ w = rz m, Z m = Ẑ w = Ẑ m = rz w, Z w = Ẑ m =.667.
46 Polio Vaccine NFIP Vaccine Trials Size Rate (cases/100k) Grade 2 Vaccine 125K 25 Grade 2 No Consent 125K 44 Grade 1,3 Control 725K 54
47 Polio Vaccine NFIP Vaccine Trials Size Rate (cases/100k) Grade 2 Vaccine 125K 25 Grade 2 No Consent 125K 44 Grade 1,3 Control 725K 54 PHS Double Blind Vaccine Trials Size Rate (cases/100k) Treatment 200K 28 Control 200K 71 No Consent 350K 46
48 Polio Vaccine NFIP Vaccine Trials Size Rate (cases/100k) Grade 2 Vaccine 125K 25 Grade 2 No Consent 125K 44 Grade 1,3 Control 725K 54 PHS Double Blind Vaccine Trials Size Rate (cases/100k) Treatment 200K 28 Control 200K 71 No Consent 350K 46 NFIP result confusing, but PHS not.
49 Polio Vaccine NFIP Vaccine Trials Size Rate (cases/100k) Grade 2 Vaccine 125K 25 Grade 2 No Consent 125K 44 Grade 1,3 Control 725K 54 PHS Double Blind Vaccine Trials Size Rate (cases/100k) Treatment 200K 28 Control 200K 71 No Consent 350K 46 NFIP result confusing, but PHS not. Randomized control groups help a lot with unanticipated issues!
50 Portacaval Shunt Studies 51 Studies Enthusiasm: Design Marked Moderate None No Controls Controls, not randomized Randomized controls 0 1 3
51 Gilbert Social and Medical Interventions ++ 21% + 21% 0 46% - 7% 4%
52 Gilbert Surgical and Anaesthetic Innovations innovation highly preferred 14% innovation preferred 19% innovation a success but not much better 11% innovation a disappointment but not much worse 28% standard preferred 6% standard highly preferred 11%
53 Establishing Association strong. (Attempts)
54 Establishing Association strong. Association consistent. (Attempts)
55 Establishing (Attempts) Association strong. Association consistent. Higher doses give stronger responses.
56 Establishing (Attempts) Association strong. Association consistent. Higher doses give stronger responses. Alleged cause precedes effect.
57 Establishing (Attempts) Association strong. Association consistent. Higher doses give stronger responses. Alleged cause precedes effect. Alleged cause is plausible.
58 Establishing (Attempts) Association strong. Association consistent. Higher doses give stronger responses. Alleged cause precedes effect. Alleged cause is plausible. Rule out other plausible explanations.
59 Establishing (Attempts) Association strong. Association consistent. Higher doses give stronger responses. Alleged cause precedes effect. Alleged cause is plausible. Rule out other plausible explanations. This is hard to do reliably.
60 Establishing (Attempts) Association strong. Association consistent. Higher doses give stronger responses. Alleged cause precedes effect. Alleged cause is plausible. Rule out other plausible explanations. This is hard to do reliably. is much clearer!
61 Basic Strategies 1) Control extraneous sources of variation.
62 Basic Strategies 1) Control extraneous sources of variation. 2) Randomize to deal with uncontrollable sources of variation.
63 Basic Strategies 1) Control extraneous sources of variation. 2) Randomize to deal with uncontrollable sources of variation. 3) Replicate to increase accuracy and gain greater confidence in the scope of your conclusions.
64 Basic Strategies 1) Control extraneous sources of variation. 2) Randomize to deal with uncontrollable sources of variation. 3) Replicate to increase accuracy and gain greater confidence in the scope of your conclusions. 4) Block when possible to increase accuracy/sensitivity and better control variability.
65 Sampling Words Sample vs. Population Sample Statistic vs. Population Parameter Sampling Frame (not in your text?) Voluntary Response Sample (not in your text?) Convenience Sample Biased Sample Simple Random Sample (SRS)
66 Sampling Words Census Strata Stratified Random Sample Cluster Sample Multistage Sample Design
67 Sampling Words Matching in an observational study cohort Undercoverage (not in your text?) Non-Response Bias Response Bias (not in your text?) Leading Questions Sampling Variability
68 Stratification Strata groups of homogeneous individuals. Stratified Random Sample same probability of choice within each group.
69 Stratification Strata groups of homogeneous individuals. Stratified Random Sample same probability of choice within each group. Advantages include: Every stratum well represented. Can be more accurate for a given sample size. Strata with greater variability should be better represented.
70 Types of Bias Response bias vs. voluntary response bias vs. non-response bias?
71 Types of Bias Response bias vs. voluntary response bias vs. non-response bias? Response Bias: problems in the questions or how they are asked.
72 Types of Bias Response bias vs. voluntary response bias vs. non-response bias? Voluntary Response Bias: problems in surveys where only volunteers participate.
73 Types of Bias Response bias vs. voluntary response bias vs. non-response bias? Non-Response Bias: problems associated with which people are missing in the final results.
74 Types of Bias Response bias vs. voluntary response bias vs. non-response bias? Undercoverage: groups somewhat missing from the sampling frame.
75 s Observational Study vs. Prospective vs Retrospective Study Factor in an experiment Level Treatment
76 s Control Group Single-Blind vs. Double-Blind One Factor vs. Two Factor Placebo Placebo Effect
77 s Block Block Design Matched Pairs Design Confounding Variables Statistically Significant Effect
78 Factors and Levels Factors vs. Levels vs. Treatments?
79 Factors and Levels Factors vs. Levels vs. Treatments? Factor in an : Variable being manipulated.
80 Factors and Levels Factors vs. Levels vs. Treatments? Levels: Values of a factor.
81 Factors and Levels Factors vs. Levels vs. Treatments? Treatment: What is actively done to the experimental units.
82 Block Related Block vs. Block Design vs. Matched Pairs Design
83 Block Related Block vs. Block Design vs. Matched Pairs Design Block: homogenous group similar in some important way.
84 Block Related Block vs. Block Design vs. Matched Pairs Design Block Design: random within each block.
85 Block Related Block vs. Block Design vs. Matched Pairs Design Matched Pairs Design: block size of 2.
Dr. Allen Back. Oct. 7, 2016
 Dr. Allen Back Oct. 7, 2016 al Was it Fair? The first draft lottery during the Vietnam War: 366 balls labeled by dates. Mixed up and pulled out in a random order. al Was it Fair? Scatterplot al Was it
Vocabulary. Bias. Blinding. Block. Cluster sample
 Bias Blinding Block Census Cluster sample Confounding Control group Convenience sample Designs Experiment Experimental units Factor Level Any systematic failure of a sampling method to represent its population
aps/stone U0 d14 review d2 teacher notes 9/14/17 obj: review Opener: I have- who has
 aps/stone U0 d14 review d2 teacher notes 9/14/17 obj: review Opener: I have- who has 4: You should be able to explain/discuss each of the following words/concepts below... Observational Study/Sampling
Chapter 5: Producing Data
 Chapter 5: Producing Data Key Vocabulary: observational study vs. experiment confounded variables population vs. sample sampling vs. census sample design voluntary response sampling convenience sampling
Chapter 1: Exploring Data
 Chapter 1: Exploring Data Key Vocabulary:! individual! variable! frequency table! relative frequency table! distribution! pie chart! bar graph! two-way table! marginal distributions! conditional distributions!
Unit 1 Exploring and Understanding Data
 Unit 1 Exploring and Understanding Data Area Principle Bar Chart Boxplot Conditional Distribution Dotplot Empirical Rule Five Number Summary Frequency Distribution Frequency Polygon Histogram Interquartile
Examining Relationships Least-squares regression. Sections 2.3
 Examining Relationships Least-squares regression Sections 2.3 The regression line A regression line describes a one-way linear relationship between variables. An explanatory variable, x, explains variability
AP Statistics Exam Review: Strand 2: Sampling and Experimentation Date:
 AP Statistics NAME: Exam Review: Strand 2: Sampling and Experimentation Date: Block: II. Sampling and Experimentation: Planning and conducting a study (10%-15%) Data must be collected according to a well-developed
Sampling. (James Madison University) January 9, / 13
 January 9, / 13") Sampling The population is the entire group of individuals about which we want information. A sample is a part of the population from which we actually collect information. A sampling design describes
Sampling The population is the entire group of individuals about which we want information. A sample is a part of the population from which we actually collect information. A sampling design describes
AP Stats Review for Midterm
 AP Stats Review for Midterm NAME: Format: 10% of final grade. There will be 20 multiple-choice questions and 3 free response questions. The multiple-choice questions will be worth 2 points each and the
Understandable Statistics
 Understandable Statistics correlated to the Advanced Placement Program Course Description for Statistics Prepared for Alabama CC2 6/2003 2003 Understandable Statistics 2003 correlated to the Advanced Placement
1.4 - Linear Regression and MS Excel
 1.4 - Linear Regression and MS Excel Regression is an analytic technique for determining the relationship between a dependent variable and an independent variable. When the two variables have a linear
REVIEW FOR THE PREVIOUS LECTURE
 Slide 2-1 Calculator: The same calculator policies as for the ACT hold for STT 315: http://www.actstudent.org/faq/answers/calculator.html. It is highly recommended that you have a TI-84, as this is the
Experimental Design There is no recovery from poorly collected data!
 Experimental Design There is no recovery from poorly collected data! Vocabulary List n Look over the list of words. n Count how many you feel you know. n Place a dot on the number line above that number.
Chapter 3: Describing Relationships
 Chapter 3: Describing Relationships Objectives: Students will: Construct and interpret a scatterplot for a set of bivariate data. Compute and interpret the correlation, r, between two variables. Demonstrate
Outline. Practice. Confounding Variables. Discuss. Observational Studies vs Experiments. Observational Studies vs Experiments
 1 2 Outline Finish sampling slides from Tuesday. Study design what do you do with the subjects/units once you select them? (OI Sections 1.4-1.5) Observational studies vs. experiments Descriptive statistics
Chapter 1 - Sampling and Experimental Design
 Chapter 1 - Sampling and Experimental Design Read sections 1.3-1.5 Sampling (1.3.3 and 1.4.2) Sampling Plans: methods of selecting individuals from a population. We are interested in sampling plans such
UNIT I SAMPLING AND EXPERIMENTATION: PLANNING AND CONDUCTING A STUDY (Chapter 4)
") UNIT I SAMPLING AND EXPERIMENTATION: PLANNING AND CONDUCTING A STUDY (Chapter 4) A DATA COLLECTION (Overview) When researchers want to make conclusions/inferences about an entire population, they often
UNIT I SAMPLING AND EXPERIMENTATION: PLANNING AND CONDUCTING A STUDY (Chapter 4) A DATA COLLECTION (Overview) When researchers want to make conclusions/inferences about an entire population, they often
Chapter 3. Producing Data
 Chapter 3 Producing Data Types of data collected Anecdotal data data collected haphazardly (not representative!!) Available data existing data (examples: internet, library, census bureau,.) Gather own
Experimental design. Basic principles
 This work is licensed under a Creative Commons Attribution-NonCommercial-ShareAlike License. Your use of this material constitutes acceptance of that license and the conditions of use of materials on this
HPS301 Exam Notes- Contents
 HPS301 Exam Notes- Contents Week 1 Research Design: What characterises different approaches 1 Experimental Design 1 Key Features 1 Criteria for establishing causality 2 Validity Internal Validity 2 Threats
Unit 3: Collecting Data. Observational Study Experimental Study Sampling Bias Types of Sampling
 Unit 3: Collecting Data Observational Study Experimental Study Sampling Bias Types of Sampling Feb 7 10:12 AM The step of data collection is critical to obtain reliable information for your study. 2 Types
MULTIPLE CHOICE. Choose the one alternative that best completes the statement or answers the question.
 Exam Name MULTIPLE CHOICE. Choose the one alternative that best completes the statement or answers the question. Identify the W's for the description of data. 1) A survey of bicycles parked outside college
Thursday, April 25, 13. Intervention Studies
 Intervention Studies Outline Introduction Advantages and disadvantages Avoidance of bias Parallel group studies Cross-over studies 2 Introduction Intervention study, or clinical trial, is an experiment
Chapter 3. Producing Data
 Chapter 3. Producing Data Introduction Mostly data are collected for a specific purpose of answering certain questions. For example, Is smoking related to lung cancer? Is use of hand-held cell phones associated
1. What is the difference between positive and negative correlations?
 1. What is the difference between positive and negative correlations? 2. Can correlations make predictions? 3. Can correlations prove causation? 4. What are illusory correlations? We can take data from
04/12/2014. Research Methods in Psychology. Chapter 6: Independent Groups Designs. What is your ideas? Testing
 Research Methods in Psychology Chapter 6: Independent Groups Designs 1 Why Psychologists Conduct Experiments? What is your ideas? 2 Why Psychologists Conduct Experiments? Testing Hypotheses derived from
Variable Data univariate data set bivariate data set multivariate data set categorical qualitative numerical quantitative
 The Data Analysis Process and Collecting Data Sensibly Important Terms Variable A variable is any characteristic whose value may change from one individual to another Examples: Brand of television Height
3. For a $5 lunch with a 55 cent ($0.55) tip, what is the value of the residual?
 tip, what is the value of the residual?") STATISTICS 216, SPRING 2006 Name: EXAM 1; February 21, 2006; 100 points. Instructions: Closed book. Closed notes. Calculator allowed. Double-sided exam. NO CELL PHONES. Multiple Choice (3pts each). Circle
STATISTICS 216, SPRING 2006 Name: EXAM 1; February 21, 2006; 100 points. Instructions: Closed book. Closed notes. Calculator allowed. Double-sided exam. NO CELL PHONES. Multiple Choice (3pts each). Circle
WDHS Curriculum Map Probability and Statistics. What is Statistics and how does it relate to you?
 WDHS Curriculum Map Probability and Statistics Time Interval/ Unit 1: Introduction to Statistics 1.1-1.3 2 weeks S-IC-1: Understand statistics as a process for making inferences about population parameters
I. Introduction and Data Collection B. Sampling. 1. Bias. In this section Bias Random Sampling Sampling Error
 I. Introduction and Data Collection B. Sampling In this section Bias Random Sampling Sampling Error 1. Bias Bias a prejudice in one direction (this occurs when the sample is selected in such a way that
Observational study is a poor way to gauge the effect of an intervention. When looking for cause effect relationships you MUST have an experiment.
 Chapter 5 Producing data Observational study Observes individuals and measures variables of interest but does not attempt to influence the responses. Experiment Deliberately imposes some treatment on individuals
Still important ideas
 Readings: OpenStax - Chapters 1 13 & Appendix D & E (online) Plous Chapters 17 & 18 - Chapter 17: Social Influences - Chapter 18: Group Judgments and Decisions Still important ideas Contrast the measurement
Biostatistics for Med Students. Lecture 1
 Biostatistics for Med Students Lecture 1 John J. Chen, Ph.D. Professor & Director of Biostatistics Core UH JABSOM JABSOM MD7 February 14, 2018 Lecture note: http://biostat.jabsom.hawaii.edu/education/training.html
Math 124: Module 3 and Module 4
 Experimental Math 124: Module 3 and Module 4 David Meredith Department of Mathematics San Francisco State University September 24, 2009 What we will do today Experimental 1 What we will do today Experimental
Thursday, April 25, 13. Intervention Studies
 Intervention Studies Outline Introduction Advantages and disadvantages Avoidance of bias Parallel group studies Cross-over studies 2 Introduction Intervention study, or clinical trial, is an experiment
Section 6.1 Sampling. Population each element (or person) from the set of observations that can be made (entire group)
 from the set of observations that can be made (entire group)") Section 6.1 Sampling Population each element (or person) from the set of observations that can be made (entire group) Sample a subset of the population Census systematically getting information about an
Section 6.1 Sampling Population each element (or person) from the set of observations that can be made (entire group) Sample a subset of the population Census systematically getting information about an
Describe what is meant by a placebo Contrast the double-blind procedure with the single-blind procedure Review the structure for organizing a memo
 Business Statistics The following was provided by Dr. Suzanne Delaney, and is a comprehensive review of Business Statistics. The workshop instructor will provide relevant examples during the Skills Assessment
Readings: Textbook readings: OpenStax - Chapters 1 11 Online readings: Appendix D, E & F Plous Chapters 10, 11, 12 and 14
 Readings: Textbook readings: OpenStax - Chapters 1 11 Online readings: Appendix D, E & F Plous Chapters 10, 11, 12 and 14 Still important ideas Contrast the measurement of observable actions (and/or characteristics)
STAT 201 Chapter 3. Association and Regression
 STAT 201 Chapter 3 Association and Regression 1 Association of Variables Two Categorical Variables Response Variable (dependent variable): the outcome variable whose variation is being studied Explanatory
Chapter 3: Examining Relationships
 Name Date Per Key Vocabulary: response variable explanatory variable independent variable dependent variable scatterplot positive association negative association linear correlation r-value regression
Elementary Statistics and Inference. Elementary Statistics and Inference. 1.) Introduction. 22S:025 or 7P:025. Lecture 1.
 Introduction. 22S:025 or 7P:025. Lecture 1.") Elementary Statistics and Inference 22S:025 or 7P:025 Lecture 1 1 Elementary Statistics and Inference 22S:025 or 7P:025 Introduction 2 1.) Introduction A. The course will be based on the text: Statistics,
Elementary Statistics and Inference 22S:025 or 7P:025 Lecture 1 1 Elementary Statistics and Inference 22S:025 or 7P:025 Introduction 2 1.) Introduction A. The course will be based on the text: Statistics,
Lecture 6B: more Chapter 5, Section 3 Relationships between Two Quantitative Variables; Regression
 Lecture 6B: more Chapter 5, Section 3 Relationships between Two Quantitative Variables; Regression! Equation of Regression Line; Residuals! Effect of Explanatory/Response Roles! Unusual Observations! Sample
2.75: 84% 2.5: 80% 2.25: 78% 2: 74% 1.75: 70% 1.5: 66% 1.25: 64% 1.0: 60% 0.5: 50% 0.25: 25% 0: 0%
 Capstone Test (will consist of FOUR quizzes and the FINAL test grade will be an average of the four quizzes). Capstone #1: Review of Chapters 1-3 Capstone #2: Review of Chapter 4 Capstone #3: Review of
Unit 1 History and Methods Chapter 1 Thinking Critically with Psychological Science
 Myers PSYCHOLOGY (7th Ed) Unit 1 History and Methods Chapter 1 Thinking Critically with James A. McCubbin, PhD Clemson University Worth Publishers Fact vs. Falsehood 1. Human intuition is remarkably accurate
Chapter 3 CORRELATION AND REGRESSION
 CORRELATION AND REGRESSION TOPIC SLIDE Linear Regression Defined 2 Regression Equation 3 The Slope or b 4 The Y-Intercept or a 5 What Value of the Y-Variable Should be Predicted When r = 0? 7 The Regression
Sta 309 (Statistics And Probability for Engineers)
") Instructor: Prof. Mike Nasab Sta 309 (Statistics And Probability for Engineers) Chapter (1) 1. Statistics: The science of collecting, organizing, summarizing, analyzing numerical information called data
Instructor: Prof. Mike Nasab Sta 309 (Statistics And Probability for Engineers) Chapter (1) 1. Statistics: The science of collecting, organizing, summarizing, analyzing numerical information called data
Readings: Textbook readings: OpenStax - Chapters 1 13 (emphasis on Chapter 12) Online readings: Appendix D, E & F
 Online readings: Appendix D, E & F") Readings: Textbook readings: OpenStax - Chapters 1 13 (emphasis on Chapter 12) Online readings: Appendix D, E & F Plous Chapters 17 & 18 Chapter 17: Social Influences Chapter 18: Group Judgments and Decisions
Readings: Textbook readings: OpenStax - Chapters 1 13 (emphasis on Chapter 12) Online readings: Appendix D, E & F Plous Chapters 17 & 18 Chapter 17: Social Influences Chapter 18: Group Judgments and Decisions
Chapter 2. The Data Analysis Process and Collecting Data Sensibly. Copyright 2005 Brooks/Cole, a division of Thomson Learning, Inc.
 Chapter 2 The Data Analysis Process and Collecting Data Sensibly Important Terms Variable A variable is any characteristic whose value may change from one individual to another Examples: Brand of television
AP Statistics. Semester One Review Part 1 Chapters 1-5
 AP Statistics Semester One Review Part 1 Chapters 1-5 AP Statistics Topics Describing Data Producing Data Probability Statistical Inference Describing Data Ch 1: Describing Data: Graphically and Numerically
Pre-Calculus Multiple Choice Questions - Chapter S4
 1 Which of the following represents the dependent variable in experimental design? a Treatment b Factor 2 Which of the following represents the independent variable in experimental design? a Treatment
Still important ideas
 Readings: OpenStax - Chapters 1 11 + 13 & Appendix D & E (online) Plous - Chapters 2, 3, and 4 Chapter 2: Cognitive Dissonance, Chapter 3: Memory and Hindsight Bias, Chapter 4: Context Dependence Still
Describe what is meant by a placebo Contrast the double-blind procedure with the single-blind procedure Review the structure for organizing a memo
 Please note the page numbers listed for the Lind book may vary by a page or two depending on which version of the textbook you have. Readings: Lind 1 11 (with emphasis on chapters 10, 11) Please note chapter
Math 140 Introductory Statistics
 Math 140 Introductory Statistics Professor Silvia Fernández Sample surveys and experiments Most of what we ve done so far is data exploration ways to uncover, display, and describe patterns in data. Unfortunately,
Relationships. Between Measurements Variables. Chapter 10. Copyright 2005 Brooks/Cole, a division of Thomson Learning, Inc.
 Relationships Chapter 10 Between Measurements Variables Copyright 2005 Brooks/Cole, a division of Thomson Learning, Inc. Thought topics Price of diamonds against weight Male vs female age for dating Animals
DO NOT OPEN THIS BOOKLET UNTIL YOU ARE TOLD TO DO SO
 NATS 1500 Mid-term test A1 Page 1 of 8 Name (PRINT) Student Number Signature Instructions: York University DIVISION OF NATURAL SCIENCE NATS 1500 3.0 Statistics and Reasoning in Modern Society Mid-Term
Math 124: Modules 3 and 4. Sampling. Designing. Studies. Studies. Experimental Studies Surveys. Math 124: Modules 3 and 4. Sampling.
 What we will do today Five Experimental Module 3 and Module 4 David Meredith Department of Mathematics San Francisco State University September 24, 2008 Five Experimental 1 Five 2 Experimental Terminology
Villarreal Rm. 170 Handout (4.3)/(4.4) - 1 Designing Experiments I
/(4.4) - 1 Designing Experiments I") Statistics and Probability B Ch. 4 Sample Surveys and Experiments Villarreal Rm. 170 Handout (4.3)/(4.4) - 1 Designing Experiments I Suppose we wanted to investigate if caffeine truly affects ones pulse
Statistics and Probability B Ch. 4 Sample Surveys and Experiments Villarreal Rm. 170 Handout (4.3)/(4.4) - 1 Designing Experiments I Suppose we wanted to investigate if caffeine truly affects ones pulse
Describe what is meant by a placebo Contrast the double-blind procedure with the single-blind procedure Review the structure for organizing a memo
 Please note the page numbers listed for the Lind book may vary by a page or two depending on which version of the textbook you have. Readings: Lind 1 11 (with emphasis on chapters 5, 6, 7, 8, 9 10 & 11)
Biostatistics II
 Biostatistics II 514-5509 Course Description: Modern multivariable statistical analysis based on the concept of generalized linear models. Includes linear, logistic, and Poisson regression, survival analysis,
STATISTICS & PROBABILITY
 STATISTICS & PROBABILITY LAWRENCE HIGH SCHOOL STATISTICS & PROBABILITY CURRICULUM MAP 2015-2016 Quarter 1 Unit 1 Collecting Data and Drawing Conclusions Unit 2 Summarizing Data Quarter 2 Unit 3 Randomness
11 questions to help you make sense of a case control study
 Critical Appraisal Skills Programme (CASP) making sense of evidence 11 questions to help you make sense of a case control study How to use this appraisal tool Three broad issues need to be considered when
Multi-Stage Stratified Sampling for the Design of Large Scale Biometric Systems
 Multi-Stage Stratified Sampling for the Design of Large Scale Biometric Systems Jad Ramadan, Mark Culp, Ken Ryan, Bojan Cukic West Virginia University 1 Problem How to create a set of biometric samples
Critical Appraisal Series
 Definition for therapeutic study Terms Definitions Study design section Observational descriptive studies Observational analytical studies Experimental studies Pragmatic trial Cluster trial Researcher
Study Design. Study design. Patrick Breheny. January 23. Patrick Breheny Introduction to Biostatistics (171:161) 1/34
 1/34") Study design Patrick Breheny January 23 Patrick Breheny Introduction to Biostatistics (171:161) 1/34 in the ideal world In an ideal world, We have a list of everyone in the population of interest We randomly
Study design Patrick Breheny January 23 Patrick Breheny Introduction to Biostatistics (171:161) 1/34 in the ideal world In an ideal world, We have a list of everyone in the population of interest We randomly
CHAPTER 5: PRODUCING DATA
 CHAPTER 5: PRODUCING DATA 5.1: Designing Samples Exploratory data analysis seeks to what data say by using: These conclusions apply only to the we examine. To answer questions about some of individuals
Sampling Controlled experiments Summary. Study design. Patrick Breheny. January 22. Patrick Breheny Introduction to Biostatistics (BIOS 4120) 1/34
 1/34") Sampling Study design Patrick Breheny January 22 Patrick Breheny to Biostatistics (BIOS 4120) 1/34 Sampling Sampling in the ideal world The 1936 Presidential Election Pharmaceutical trials and children
Sampling Study design Patrick Breheny January 22 Patrick Breheny to Biostatistics (BIOS 4120) 1/34 Sampling Sampling in the ideal world The 1936 Presidential Election Pharmaceutical trials and children
CHAPTER ONE CORRELATION
 CHAPTER ONE CORRELATION 1.0 Introduction The first chapter focuses on the nature of statistical data of correlation. The aim of the series of exercises is to ensure the students are able to use SPSS to
Name: Class: Date: 1. Use Scenario 4-6. Explain why this is an experiment and not an observational study.
 Name: Class: Date: Chapter 4 Review Short Answer Scenario 4-6 Read the following brief article about aspirin and alcohol. Aspirin may enhance impairment by alcohol Aspirin, a long time antidote for the
Math 1680 Class Notes. Chapters: 1, 2, 3, 4, 5, 6
 Math 1680 Class Notes Chapters: 1, 2, 3, 4, 5, 6 Chapter 1. Controlled Experiments Salk vaccine field trial: a randomized controlled double-blind design 1. Suppose they gave the vaccine to everybody, and
Chapter 1 Data Collection
 Chapter 1 Data Collection OUTLINE 1.1 Introduction to the Practice of Statistics 1.2 Observational Studies versus Designed Experiments 1.3 Simple Random Sampling 1.4 Other Effective Sampling Methods 1.5
You can t fix by analysis what you bungled by design. Fancy analysis can t fix a poorly designed study.
 You can t fix by analysis what you bungled by design. Light, Singer and Willett Or, not as catchy but perhaps more accurate: Fancy analysis can t fix a poorly designed study. Producing Data The Role of
Methodological skills
 Methodological skills rma linguistics, week 3 Tamás Biró ACLC University of Amsterdam t.s.biro@uva.nl Tamás Biró, UvA 1 Topics today Parameter of the population. Statistic of the sample. Re: descriptive
Lecture Slides. Elementary Statistics Eleventh Edition. by Mario F. Triola. and the Triola Statistics Series 1.1-1
 Lecture Slides Elementary Statistics Eleventh Edition and the Triola Statistics Series by Mario F. Triola 1.1-1 Chapter 1 Introduction to Statistics 1-1 Review and Preview 1-2 Statistical Thinking 1-3
Epidemiologic Methods I & II Epidem 201AB Winter & Spring 2002
 DETAILED COURSE OUTLINE Epidemiologic Methods I & II Epidem 201AB Winter & Spring 2002 Hal Morgenstern, Ph.D. Department of Epidemiology UCLA School of Public Health Page 1 I. THE NATURE OF EPIDEMIOLOGIC
CRITICAL APPRAISAL SKILLS PROGRAMME Making sense of evidence about clinical effectiveness. 11 questions to help you make sense of case control study
 CRITICAL APPRAISAL SKILLS PROGRAMME Making sense of evidence about clinical effectiveness 11 questions to help you make sense of case control study General comments Three broad issues need to be considered
Theory. = an explanation using an integrated set of principles that organizes observations and predicts behaviors or events.
 Definition Slides Hindsight Bias = the tendency to believe, after learning an outcome, that one would have foreseen it. Also known as the I knew it all along phenomenon. Critical Thinking = thinking that
Section 6.1 Sampling. Population each element (or person) from the set of observations that can be made (entire group)
 from the set of observations that can be made (entire group)") Section 6.1 Sampling Population each element (or person) from the set of observations that can be made (entire group) Sample a subset of the population Census systematically getting information about an
Section 6.1 Sampling Population each element (or person) from the set of observations that can be made (entire group) Sample a subset of the population Census systematically getting information about an
Research Methods. It is actually way more exciting than it sounds!!!!
 Research Methods It is actually way more exciting than it sounds!!!! Why do we have to learn this stuff? Psychology is first and foremost a science. Thus it is based in research. Before we delve into how
UNIT 3 & 4 PSYCHOLOGY RESEARCH METHODS TOOLKIT
 UNIT 3 & 4 PSYCHOLOGY RESEARCH METHODS TOOLKIT Prepared by Lucie Young, Carey Baptist Grammar School lucie.young@carey.com.au Credit to Kristy Kendall VCE Psychology research methods workbook for some
Statistics is the science of collecting, organizing, presenting, analyzing, and interpreting data to assist in making effective decisions
 Readings: OpenStax Textbook - Chapters 1 5 (online) Appendix D & E (online) Plous - Chapters 1, 5, 6, 13 (online) Introductory comments Describe how familiarity with statistical methods can - be associated
GATHERING DATA. Chapter 4
 GATHERING DATA Chapter 4 4.3 What are Good and Poor Ways to Experiment? Elements of an Experiment Experimental units: Subjects Treatment: Conditions imposed on subjects Explanatory variable: Defines groups
STA 291 Lecture 4 Jan 26, 2010
 STA 291 Lecture 4 Jan 26, 2010 Methods of Collecting Data Survey Experiment STA 291 - Lecture 4 1 Review: Methods of Collecting Data Observational Study vs. Experiment An observational study (survey) passively
MAT 155. Chapter 1 Introduction to Statistics. Key Concept. Basics of Collecting Data. August 20, S1.5_3 Collecting Sample Data
 MAT 155 Dr. Claude Moore Cape Fear Community College Chapter 1 Introduction to Statistics 1 1 Review and Preview 1 2 Statistical Thinking 1 3 Types of Data 1 4 Critical Thinking 1 5 Collecting Sample Data
Define the population Determine appropriate sample size Choose a sampling design Choose an appropriate research design
 Numbers! Observation Study: observing individuals and measuring variables of interest without attempting to influence the responses Correlational Research: examining the relationship between two variables
CHAPTER 4 Designing Studies
 CHAPTER 4 Designing Studies 4.2 Experiments The Practice of Statistics, 5th Edition Starnes, Tabor, Yates, Moore Bedford Freeman Worth Publishers Experiments Learning Objectives After this section, you
Psych 1Chapter 2 Overview
 Psych 1Chapter 2 Overview After studying this chapter, you should be able to answer the following questions: 1) What are five characteristics of an ideal scientist? 2) What are the defining elements of
IAPT: Regression. Regression analyses
 Regression analyses IAPT: Regression Regression is the rather strange name given to a set of methods for predicting one variable from another. The data shown in Table 1 and come from a student project
Statistics is the science of collecting, organizing, presenting, analyzing, and interpreting data to assist in making effective decisions
 Readings: OpenStax Textbook - Chapters 1 5 (online) Appendix D & E (online) Plous - Chapters 1, 5, 6, 13 (online) Introductory comments Describe how familiarity with statistical methods can - be associated
Chapter 1 Thinking Critically with Psychological Science
 Myers PSYCHOLOGY (7th Ed) Chapter 1 Thinking Critically with James A. McCubbin, PhD Clemson University Worth Publishers The Need for Psychologists, like all scientists, use the scientific method to construct
Section 1.1 What is Statistics?
 Chapter 1 Getting Started Name Section 1.1 What is Statistics? Objective: In this lesson you learned how to identify variables in a statistical study, distinguish between quantitative and qualitative variables,
Chapter 4: More about Relationships between Two-Variables
 1. Which of the following scatterplots corresponds to a monotonic decreasing function f(t)? A) B) C) D) G Chapter 4: More about Relationships between Two-Variables E) 2. Which of the following transformations
Goal: To understand the methods that scientists use to study abnormal behavior
 Key Dates TH Jan 26 Unit 4 TU Jan 31 Begin Dimensions-Emotion, Units IIA, 5; MW Ch 3 Paul TH Feb 2 Unit 6; MW Ch 3 Agnes, Bess TU Feb 7 Unit 7; MW Ch 7 Joseph, Virginia 1 Goal: To understand the methods
Chapter 8 Statistical Principles of Design. Fall 2010
 Chapter 8 Statistical Principles of Design Fall 2010 Experimental Design Many interesting questions in biology involve relationships between response variables and one or more explanatory variables. Biology
UNIT II: RESEARCH METHODS
 THINKING CRITICALLY WITH PSYCHOLOGICAL SCIENCE UNIT II: RESEARCH METHODS Module 4: The Need for Psychological Science Module 5: Scientific Method and Description Module 6: Correlation and Experimentation
EXPERIMENTAL RESEARCH DESIGNS
 ARTHUR PSYC 204 (EXPERIMENTAL PSYCHOLOGY) 14A LECTURE NOTES [02/28/14] EXPERIMENTAL RESEARCH DESIGNS PAGE 1 Topic #5 EXPERIMENTAL RESEARCH DESIGNS As a strict technical definition, an experiment is a study
The Practice of Statistics 1 Week 2: Relationships and Data Collection
 The Practice of Statistics 1 Week 2: Relationships and Data Collection Video 12: Data Collection - Experiments Experiments are the gold standard since they allow us to make causal conclusions. example,
Review and Wrap-up! ESP 178 Applied Research Methods Calvin Thigpen 3/14/17 Adapted from presentation by Prof. Susan Handy
 Review and Wrap-up! ESP 178 Applied Research Methods Calvin Thigpen 3/14/17 Adapted from presentation by Prof. Susan Handy Final Proposals Read instructions carefully! Check Canvas for our comments on
Midterm STAT-UB.0003 Regression and Forecasting Models. I will not lie, cheat or steal to gain an academic advantage, or tolerate those who do.
 Midterm STAT-UB.0003 Regression and Forecasting Models The exam is closed book and notes, with the following exception: you are allowed to bring one letter-sized page of notes into the exam (front and
Chapter 13 Summary Experiments and Observational Studies
 Chapter 13 Summary Experiments and Observational Studies What have we learned? We can recognize sample surveys, observational studies, and randomized comparative experiments. o These methods collect data