Excess weight in Wakefield schoolchildren 2018
|
|
|
- Nathaniel Mills
- 5 years ago
- Views:
Transcription
1 Excess weight in Wakefield schoolchildren 2018 An updated analysis of excess weight in Wakefield schoolchildren using data from the National Child Measurement Program (NCMP) 2017/18. Key findings: There has been a rise in the percentage of Wakefield children who are overweight and obese in recent years. 23.9% of Reception children are carrying excess weight. 35.3% of Year 6 children are carrying excess weight. 5% of Year 6 children are severely obese. There is a link between deprivation and excess weight in Wakefield for both age groups. There are gender differences in excess weight in Wakefield Contents: 1. Background..2 2a. Trends in overweight YR children. 3 2b. Trends in overweight Y6 children. 4 3a. Excess weight in YR...5 3b. Obesity in YR...7 4a. Excess weight in Y b. Obesity in Y Gender differences in excess weight Deprivation differences in excess weight Summary Methodology and Additional Information Appendix ward level prevalences
2 Background The UK is experiencing an epidemic of obesity in both adults and children. Childhood obesity is considered to be a good indicator of adult obesity, which can lead to many different long term health conditions and poor health outcomes. The National Child Measurement Program (NCMP) is a government scheme which collects data on the height and weight of school children in Year Reception (aged 4 to 5 years) and Year 6 (aged 10 to 11 years) annually. The scheme was set up in 2006 in line with the government s strategy to tackle obesity and inform local planning and service delivery for children. As of 2017/18, measurements can be categorised as Underweight, Healthy Weight, Overweight, Very Overweight/Obese, and Severely Obese. These are based on the child s Body Mass Index (BMI), which combines both height and weight measurements to give a score indicative of whether or not a child s weight is healthy, and takes into account their age. Children falling into the overweight, very overweight/obese or severely obese categories are classified as carrying excess weight. In 2017/18, a new severely obese category was added to the NCMP Dataset BMI classifications to reflect increasing prevalence. 95.2% of Reception children and 94.3% of Year 6 children participated in the 2017/18 NCMP data collection across England. 94.1% of Reception children and 91.4% of Year 6 children in Wakefield were measured as part of the 2017/18 NCMP data collection. Percentage prevalence in this report includes only the children measured. NHS Digital report a nation-wide rise in the number of children carrying excess weight in England 1. According to key findings from the 2017/18 data, 34.3% of Year 6 children in England are carrying excess weight and 20.1% are classified as obese. This compares to 35.3% and 23.9% in Wakefield respectively. For Reception children, these figures show that almost a quarter of children are overweight (22.4%) and 9.5% are obese, despite rates remaining stable in recent years. 2017/18 figures for Reception children attending school in Wakefield show consistency with last year s figures and indicate an overall sustained rise in excess weight in the District s children over the past few years. Nationally, obesity prevalence was higher for boys than girls in both age groups. Prevalence for children living in the most deprived areas was more than double that of those living in the least deprived areas for both reception and year six, and the gap between differences in the most and least areas has increased over time 1. The proportion of both Reception and Year 6 children classified as overweight or very overweight is more than the national average 23.9% of YR children in Wakefield are carrying excess weight 35.3% of Y6 children in Wakefield are carrying excess weight 2
3 Changes in overweight Reception children There has been an overall rise in the proportion of Reception children in Wakefield classified as being overweight or obese in the period Currently, 23.9% of Reception children in Wakefield are carrying excess weight, with the sharpest rise observed between measurement periods 2015/16 and 2016/17. Although the latest data shows that the prevalence of excess weight among Reception children has decreased slightly in 2017/18, is it still much higher than previous years which suggests last year s result is not an anomaly and instead may be an early indicator of a worsening trend. Although there has been a slight increase nationally in this period (from 22.6% to 23.9%), Wakefield has seen a much greater increase. However, rates are similar for Wakefield s statistical neighbours which suggests the issue is not limited to Wakefield. Statistical neighbours is a term used to refer to areas with statistically similar demographic profiles and levels of deprivation to Wakefield. Please see page 10 of this report for more information on statistical neighbours. 3
4 Changes in overweight Year 6 children There has also been an overall rise in the proportion of Year 6 children classified as being overweight or obese in the period , denoting a long-term trend in the increasing prevalence of obesity. Currently, 35.5% of Year 6 children in Wakefield are carrying excess weight, with a steady rise observed throughout the measurement periods 2013/14 to 2016/17. This year s figure is marginally lower than last year s, however Wakefield still has a higher prevalence of children carrying excess weight than the national average. This also occurs after a large decrease in prevalence was observed from 2011/12 to 2013/14. However, the prevalence of excess weight in Y6 children in Wakefield still remains lower than for our statistical neighbours. 4

5 Prevalence of excess weight in YR 2017/18 Looking at data from the current year in more detail, the prevalence of excess weight in Reception children in Wakefield is similar most of the district s statistical neighbours 1. The graph below shows a breakdown of each statistically similar area to Wakefield and its relative position in terms of prevalence of excess weight in YR. Looking at a breakdown of the data at electoral ward level, Hemsworth stands out as the ward with the highest prevalence of excess weight among Reception children by a significant amount followed by, Airedale and Ferry Fryston and Horbury and South Ossett. Wrenthorpe and Outwood West has the lowest prevalence in the district by a large amount. The average prevalence of excess weight for reception children among all Wakefield wards is 24.1%. Eight wards exceed the ward average. In the 2016/17 measurements, 11 wards exceeded the ward average of 25.3%. However, there appears to be no trend in wards which exceed the average with high prevalence rates in both measurement years apart from Hemsworth, which is notably high in both years. For data tables on the prevalence of excess weight by ward since 2010/11, please see the appendix. Only the 10 most similar statistical neighbours displayed on chart for legibility purposes. The statistical neighbour average has been calculated using all 15 statistical neighbours. For more information on statistical neighbours see page 10. 5


6 6
 to assess the issue of childhood obesity at the more extreme and of the scale.")
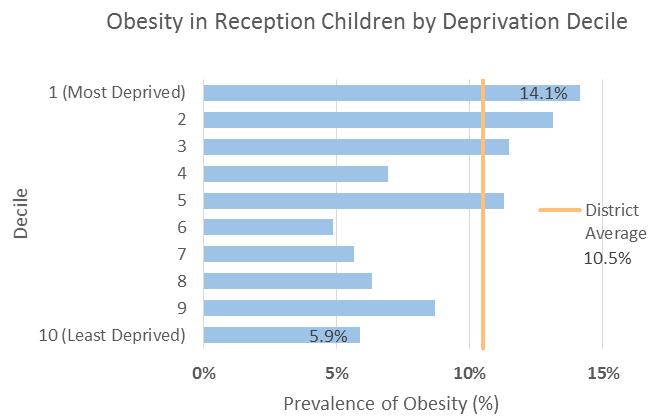
7 Obesity and Severe Obesity YR 2017/18 As the problem of excess weight becomes more widespread, it is fitting to look at the subset of children defined as very overweight (defined as obese in national reports) to assess the issue of childhood obesity at the more extreme and of the scale. Further to this, NHS Digital have introduced a newly defined category severely obese to further subdivide the obese category. Severe obesity is defined as children having a BMI in the top 0.4% of the population. The proportion of Reception children classified as obese is 10.5%. This is above the national average, but comparable to Wakefield s statistical neighbours and in line with the statistical neighbour average. This is the same for the proportion of children classed as severely obese. The prevalence of severe obesity is greater than the national average, and similar to the statistical neighbour average. It is, however, greater than most statistical neighbours individually. 7

8 Prevalence of excess weight in Y6 2017/18 Looking at this year s data in more detail, the prevalence of excess weight in Year 6 children in Wakefield is higher than for England and only a couple of the district s statistical neighbours. The graph below shows a breakdown of each statistically similar area to Wakefield and its relative position in terms of prevalence of excess weight in YR. At the electoral ward level, Hemsworth and Airedale and Ferry Fryston stand out as the two wards with the highest prevalence of excess weight among Year 6 children, which are the same wards as for the highest prevalence of excess weight in Year Reception. Wrenthorpe and Outwood West is the ward with the lowest. The average prevalence of excess weight for Y6 children among all wards is 35.3%, more than 10% greater than for YR children. Only 6 wards exceed the ward average. In the 2015/16 measurements, 10 wards exceeded the ward average of 35.6%. However, there appears to be no trend in wards which exceed the average with high prevalence rates in both measurement years. Additionally, there appears to be a much lesser degree of variation around measurements for 2016/17, with more measurements clustered around the mean value. There were no wards in which 2016/17 measurements showed statistically significant difference from the 2015/16 measurements. For data tables on the prevalence of excess weight by ward since 2010/11, please see the appendices. 8


9 9
 to assess the issue of childhood obesity at the more extreme and of the scale.")

10 Obesity and Severe Obesity Y6 2017/18 As the problem of excess weight becomes more widespread, it is fitting to look at the subset of children defined as very overweight (defined as obese in national reports) to assess the issue of childhood obesity at the more extreme and of the scale. Further to this, NHS Digital have introduced a newly defined category severely obese to further subdivide the obese category. Severe obesity is defined as children having a BMI in the top 0.4% of the population. The proportion of Year 6 children classified as obese this year is 20.5%, which is lower than most of Wakefield s statistical neighbours but slightly higher than the national average. However, when looking at children classed as severely obese, the proportion of children in this category (5.0%) is greater than the statistical neighbour and national averages. This may suggest that whilst fewer children are obese overall, those who are obese are more obese than their peers in other areas. 10
11 Gender and prevalence of excess weight 2017/18 Studies show that there is generally a gender difference in excess weight between boys and girls 2. There tends to be a greater prevalence of excess weight among boys, and boys tend to be more overweight than girls individually 1. The difference in Wakefield follows the same pattern suggested by analysis carried out by NHS Digital, which is that this difference is greater for children in Y6 than Reception. The same trend is true for children classified as being very overweight. Analysis carried out nationally suggests that deprivation levels have a greater effect on the prevalence of excess weight in boys compared to that in girls. The charts below shows differences in the prevalence of excess weight and those classified as very overweight (obese) in Year 6 and Reception boys and girls for the 2017/18 data. Deprivation, Excess Weight and Obesity There is also a trend to suggest an association between prevalence of excess weight and levels of deprivation. Deprivation is well established to have a negative effect on the prevalence of obesity 3, and is measured by 2015 IMD (index of multiple deprivation) score. Areas are split into deciles depending on their deprivation scores the top 10% most deprived areas of Wakefield are classed as Decile 1, and the least 10% deprived are Decile 10. The graphs below show that that generally as level of deprivation increases, so does the prevalence of excess weight and obesity. It should be noted that this analysis includes only children who live and attend school in Wakefield. 11


12 12
13 Summary Levels of childhood obesity in Wakefield are already above the national average and are increasing. Although this year s measurements show a slight fall in the prevalence of excess weight and obesity from the previous year, the overall long term trend suggests that prevalence is increasing. However, the highest prevalence of excess weight still occurs within Year 6, with a large difference between boys and girls. Excess weight and obesity prevalence is also linked to deprivation levels, with a general trend demonstrating higher prevalence in more deprived areas. Ward level trends tend to change year on year, however there are a few wards which notably have retained high prevalence of excess weight and obesity over the past few years. Although there are limitations of the NCMP, discussed within the methodology section of this report, the data should be continued to be monitored in future years to determine whether this increase forms part of a worsening trend. This will enable the relevant service providers to determine whether interventions are necessary and in which areas of the district they would be most effective. 13
14 Methodology and Additional information Data All data is sourced from the NCMP results via NHS Digital. Only data from the period 2011/2012 onward have been analysed in this document, as this matches the number of years data analysed in previous versions of this report. It is important to note that data for children who reside in Wakefield but attend school in another local authority region have not been included in these analyses, and children who attend school in Wakefield but are not resident in a Wakefield electoral ward have been excluded unless otherwise stated. For this reason, there may be instances in this document where local figures do not match nationally reported figures. Participation rate in 2017/18 was above 90%; 94.1% of Reception children and 91.4% of Year 6 children participated in the 2017/18 NCMP data collection. However, there is the potential for error in the collection, collation and interpretation of all data for both years due to potential bias introduced relating to poor response rates and selective opt out of larger children which it is not possible to control for. Due to the lower participation rate for Year 6 children, it should be noted that data for Y6 in particular may underestimate the prevalence of obesity due to the observation that overweight children in Y6 are less likely to participate in the NCMP 1. Additionally, rounding of height measurements occurred in around a third of cases. This may have the potential to introduce bias. One measurement deemed to be a duplicate record entry was excluded from the analysis. Analysis in this document was carried out only for those children where a valid measurement was recorded and this did not meet exclusion criteria measurements for Y6 were analysed and 4190 for YR in 2016/17. Confidence intervals used on graphs have been pre-calculated by NHS Digital 4 using the Wilson Score method, unless otherwise stated. Statistical Neighbours Statistical neighbours are defined as areas with similar population profiles, levels of deprivation and characteristics to Wakefield. Statistical neighbours in this document have been taken from analysis generated via Public Health England, using the CIPFA Nearest Neighbours tool. Wakefield s statistical neighbours as of December 2018 were: Barnsley, Bolton, Calderdale, Doncaster, Dudley, Halton, Kirklees, North Lincolnshire, St. Helens, Stockton-on-Tees, Sunderland, Tameside, Telford and Wreckin and Wigan. For technical information regarding collection, analysis and presentation of data for the NCMP, please see the websites in the reference section. Data quality checks: The following data quality checks were carried out prior to analysis being carried out: NCMP Data quality flags - There were no fields flagged up for Wakefield by NHS Digital s own data quality measures in 2017/18, which include criteria such as blank/unknown records, incorrectly dated 14
15 fields, percentage of extreme measurements and duplicate data entries. However, for other years, low participation rate for Y6 has been flagged. Rounding errors Data were checked for rounding errors and imprecisions. According to NHS Digital guidelines, 10% of measurements would be expected to be whole numbers by chance. Anything above 30% results in a data quality flag being raised. For Wakefield measurements, 10.9% of weight measurements and 28.6% of height measurements were recorded as whole numbers. This may suggest that in some instances, height measurements have been rounded to the nearest whole number and therefore there is potential that inaccuracies have been introduced into the data resulting from this. However, as there is no clear association between rounded measurements and specific dates or schools, therefore it is assumed that the level of error is the same for all schools and the data has been analysed as such. Ethnicity Ethnicity was recorded for 100% of measurements, however lack of accuracy in coding and lack of coding in data from previous years meant that no further analysis could be carried out based on ethnicity. References 1 NHS Digital NCMP Report 2017, via NHS Digital. Available at: 2 Sweeting, H. (2008) Gendered dimensions of obesity in childhood and adolescence. Available at 3 Marmot, M. (2010) Fair society, healthy lives: the Marmot Review: strategic review of health inequalities in England post Available at: 4 NHS Digital NCMP Report 2018 (Appendices; Annex E). Available at: 15
16 Appendix Prevalence of excess weight by electoral ward for the complete period , Year R (top) Year 6 (bottom). Measurement Year (Year R) Ward 2011/ / / / / / /18 Wakefield 22.7% 22.5% 22.2% 21.7% 22.0% 25.3% 23.9% Ackworth, North Elmsall and Upton 21.6% 21.3% 26.1% 19.9% 12.9% 20.6% 22.7% Airedale and Ferry Fryston 22.4% 28.3% 29.5% 29.8% 28.6% 27.2% 29.1% Altofts and Whitwood 20.7% 25.1% 25.8% 23.3% 21.1% 25.8% 27.2% Castleford Central and Glasshoughton 25.2% 24.0% 16.6% 23.6% 24.0% 25.0% 23.1% Crofton, Ryhill and Walton 20.1% 21.7% 17.4% 17.6% 14.1% 21.7% 21.8% Featherstone 26.6% 23.1% 26.3% 25.0% 23.9% 23.3% 21.7% Hemsworth 21.3% 25.5% 16.2% 18.0% 16.2% 29.6% 36.3% Horbury and South Ossett 19.7% 20.3% 18.6% 17.4% 20.9% 21.3% 28.1% Knottingley 21.7% 20.8% 16.9% 22.7% 26.0% 30.4% 21.8% Normanton 22.3% 23.4% 24.0% 21.6% 23.8% 24.2% 25.8% Ossett 26.7% 23.4% 21.3% 22.6% 23.9% 27.0% 20.3% Pontefract North 17.7% 16.9% 26.8% 18.9% 22.2% 28.4% 21.5% Pontefract South 25.0% 19.0% 21.6% 13.5% 21.7% 25.1% 20.2% South Elmsall and South Kirkby 29.9% 26.2% 19.7% 24.7% 13.2% 27.7% 25.7% Stanley and Outwood East 25.6% 18.9% 16.4% 17.3% 23.1% 27.6% 21.3% Wakefield East 24.5% 28.0% 18.3% 22.8% 24.7% 20.6% 25.0% Wakefield North 17.9% 22.7% 24.5% 21.3% 26.5% 27.4% 22.4% Wakefield Rural 18.7% 18.5% 22.4% 18.6% 26.2% 23.0% 19.6% Wakefield South 24.7% 20.7% 19.6% 23.2% 26.9% 21.5% 23.8% Wakefield West 22.0% 20.6% 26.4% 26.5% 23.0% 28.2% 26.2% Wrenthorpe and Outwood West 22.8% 23.0% 25.8% 21.7% 19.5% 22.3% 14.5% Measurement Year (Year 6) Ward 2011/ / / / / / /18 Wakefield 34.8% 34.0% 32.7% 33.5% 35.6% 36.1% 35.3% Ackworth, North Elmsall and Upton 33.8% 32.0% 36.6% 33.8% 23.9% 35.7% 32.3% Airedale and Ferry Fryston 32.8% 32.0% 37.0% 38.7% 41.8% 34.4% 36.7% Altofts and Whitwood 33.3% 34.1% 26.7% 35.7% 40.5% 33.6% 34.5% Castleford Central and Glasshoughton 42.7% 44.4% 36.5% 39.5% 39.3% 39.0% 40.6% Crofton, Ryhill and Walton 33.9% 32.3% 32.4% 38.1% 27.3% 31.8% 32.5% Featherstone 35.8% 38.3% 34.4% 35.2% 43.8% 32.0% 37.7% Hemsworth 34.6% 31.5% 26.9% 41.2% 30.6% 36.4% 35.7% Horbury and South Ossett 28.3% 31.3% 24.8% 21.2% 33.8% 29.8% 30.0% Knottingley 39.7% 33.3% 31.0% 23.6% 38.7% 41.4% 38.7% Normanton 36.3% 33.3% 35.2% 30.2% 30.3% 37.3% 34.9% Ossett 40.4% 29.5% 32.5% 33.5% 40.1% 35.8% 33.7% Pontefract North 30.3% 36.4% 35.1% 34.6% 35.8% 35.8% 36.4% Pontefract South 31.9% 37.9% 22.2% 35.3% 32.3% 32.8% 37.6% South Elmsall and South Kirkby 33.3% 35.7% 37.2% 39.0% 38.1% 43.7% 41.1% Stanley and Outwood East 33.8% 31.9% 28.8% 30.5% 33.6% 34.8% 33.7% Wakefield East 40.7% 39.4% 35.7% 39.4% 46.8% 35.7% 42.1% Wakefield North 32.8% 30.0% 32.8% 30.6% 33.1% 41.8% 37.0% Wakefield Rural 30.8% 29.7% 26.5% 25.0% 33.6% 32.6% 30.1% Wakefield South 28.9% 32.0% 36.7% 27.8% 39.5% 33.6% 35.0% Wakefield West 41.8% 36.6% 35.9% 34.2% 36.0% 37.6% 29.7% Wrenthorpe and Outwood West 33.3% 28.5% 37.8% 26.9% 25.6% 37.7% 30.1% 16
17 Prepared by: Hannah Moore Public Health Intelligence Team Wakefield Council For enquiries please contact: 17
Digest of Demographic Statistics
 Digest of Demographic Statistics This summary of the basic demographic statistics for Wakefield District is intended as an introduction and aide for Nova Wakefield District Limited staff and members. Because
Public Health Profile
 Eastern Wakefield Primary Care Trust Public Health Profile 2005/06 Introduction Eastern Wakefield Primary Care Trust () is situated within the West Yorkshire Strategic Health Authority Area. The PCT commissions
National Child Measurement Programme Changes in children s body mass index between 2006/07 and 2010/11
 National Child Measurement Programme Changes in children s body mass index between 2006/07 and 2010/11 Delivered by NOO on behalf of the Public Health Observatories in England Published: March 2012 NOO
PHARMACEUTICAL NEEDS ASSESSMENT (PNA)
") PHARMACEUTICAL NEEDS ASSESSMENT (PNA) 31 January 2011 Document Control Title of Document: Pharmaceutical Needs Assessment (PNA) 2011 Content: Originator: Owner: This document relates to NHSWD priority
PHARMACEUTICAL NEEDS ASSESSMENT (PNA) 31 January 2011 Document Control Title of Document: Pharmaceutical Needs Assessment (PNA) 2011 Content: Originator: Owner: This document relates to NHSWD priority
Downloaded from:
 Ridler, C; Townsend, N; Dinsdale, H; Mulhall, C; Rutter, H (2009) National child measurement programme: detailed analysis of the 2007/08 national dataset. National Obesity Observatory, London. p. 41. Downloaded
Our Wakefield. STATE OF THE DISTRICT REPORT April 2012 update
 Our Wakefield STATE OF THE DISTRICT REPORT April 212 update CONTENTS Section Page Introduction 2 Executive Summary 3 Population Profile 5 Employment and Skills 9 Housing and Infrastructure 14 Health 17
National Child Measurement Programme. Changes in children s body mass index between 2006/7 and 2014/15
 National Child Measurement Programme Changes in children s body mass index between 2006/7 and 2014/15 Version 1.0/ October 2016 Changes in Children s Body Mass Index btween 2006/7 and 2014/15 About Public
Gender Profile of Wakefield s Labour Market
 Gender and Employment in Local Labour Markets Gender Profile of Wakefield s Labour Market Dr Lisa Buckner Dr Ning Tang Professor Sue Yeandle Centre for Social Inclusion Preface Gender Equality: Gender
Obesity Statistics BRIEFING PAPER. By Carl Baker. Number 3336, 20 January 2017
 BRIEFING PAPER Number 3336, 20 January 2017 Obesity Statistics By Carl Baker Inside: 1. Measures of obesity 2. Obesity among adults, England 3. Obesity among children, England 4. Obesity in Wales, Scotland
Primary 1 Body Mass Index (BMI) Statistics
 Statistics") Publication Report Primary 1 Body Mass Index (BMI) Statistics School Year 2010/11 Publication date 24 April 2012 A National Statistics Publication for Scotland Contents Contents... 1 About ISD... 2 Official
Publication Report Primary 1 Body Mass Index (BMI) Statistics School Year 2010/11 Publication date 24 April 2012 A National Statistics Publication for Scotland Contents Contents... 1 About ISD... 2 Official
Bowel Cancer Profile for Oldham, Business Intelligence Service
 Bowel Cancer Profile for Oldham, 2015 Business Intelligence Service December 2015 Overview of Report This report provides an assessment of a range of measures (prevalence, incidence, mortality, years of
Summary of the Dental Results from the GP Patient Survey January to March 2018
 Summary of the Dental Results from the GP Patient Survey January to March 2018 Published 9 August 2018 (Annual) About this release Dental questions were originally added to the GP Patient Survey in January
Cancer Screening Nottingham City Joint Strategic Needs Assessment April 2009
 Cancer Screening Nottingham City Joint Strategic Needs Assessment April 2009 Introduction Cancer screening aims to detect disease at an early stage in people with no symptoms, when treatment is more likely
Body Mass Index of Primary 1 Children in Scotland
 Publication Report Body Mass Index of Primary 1 Children in Scotland School Year 2016/17 Publication date 12 December 2017 A National Statistics Publication for Scotland Contents Contents... 1 Introduction...
Overweight and obesity: where are we and where are we heading?
 Overweight and obesity: where are we and where are we heading? Harry Rutter harry.rutter@lshtm.ac.uk Prevalence of excess weight among adults aged 16+ years Health Survey for England 1993-2010 70 60 Prevalence
INFORMATION TO SUPPORT THE DEVELOPMENT OF THE LINCOLNSHIRE CANCER STRATEGY
 INFORMATION TO SUPPORT THE DEVELOPMENT OF THE LINCOLNSHIRE CANCER STRATEGY Refreshed March 2013 Ann Ellis, Health Improvement Principal, NHS Lincolnshire Andrew Smith, Information Analyst, NHS Lincolnshire
Wakefield Central Normanton, Altofts, Featherstone, Sharlston, Crofton, Walton and Nostell
 Local Support and Social Groups to aid independence and healthy living Wakefield Central Normanton, Altofts, Featherstone, Sharlston, Crofton, Walton and Nostell This information has been compiled by the
Dental health profile
 Bradford Kirklees Wakefield Barnsley Kingston upon Hull, City of Rotherham Doncaster Sheffield YORKSHIRE & THE HUMBER Leeds North East Lincolnshire ENGLAND York East Riding of Yorkshire North Yorkshire
HPV Immunisation Statistics Scotland
 HPV Immunisation Statistics Scotland School Year 2017/18 27 November 2018 A National Statistics publication for Scotland This is a National Statistics Publication National Statistics status means that
Joint Strategic Needs Assessment (JSNA) Picture of Lewisham - Part A 2018
 Picture of Lewisham - Part A 2018") Joint Strategic Needs Assessment (JSNA) Picture of Lewisham - Part A 2018 2 What is a JSNA? The JSNA Process in Lewisham The Borough Contents The JSNA is a process by which the current and future health
Joint Strategic Needs Assessment (JSNA) Picture of Lewisham - Part A 2018 2 What is a JSNA? The JSNA Process in Lewisham The Borough Contents The JSNA is a process by which the current and future health
Pinderfields. Macmillan Information centre report. Quarter 2
 Pinderfields Macmillan Information centre report Quarter 2 1 July-September 2017 The Mid Yorkshire Hospitals NHS Trust provides care to the communities of Wakefield, Pontefract and North Kirklees, a population
Public Health Observatories: An introduction to the London Health Observatory in England and recent developments in Alberta. Learning objectives
 Public Health Observatories: An introduction to the London Health Observatory in England and recent developments in Alberta Justine Fitzpatrick 19 th February 2008- Public Health WORKS Speaker Series Learning
The association between tooth loss and deprivation in Plymouth children
 The association between tooth loss and deprivation in Plymouth children Robert Witton, Consultant in Dental Public Health, Public Health England, Robert Nelder, Consultant in Public Health, Plymouth City
Adult obesity and socioeconomic status data factsheet
 Key points The relationship between obesity prevalence and socioeconomic status can be examined in different ways. This factsheet examines several approaches to give a picture of the current situation
Hull s Joint Strategic Needs Assessment: Analysis of Public Health Outcomes Framework Data Children and Young People
 s Joint Strategic Needs Assessment: Analysis of Public Health Outcomes Framework Data Children and Young People A summary of the data for each of the Public Health Outcomes Framework (PHOF) indicators
Measuring up. Benchmarking Redcar & Cleveland. Leon Green. Public Health Intelligence Specialist. Tees Valley Public Health Shared Service
 Measuring up Benchmarking Redcar & Cleveland Leon Green Public Health Intelligence Specialist Tees Valley Public Health Shared Service 17th March 2014 2 Contents Introduc on.......page 5 Benchmarking....Page
North West ChiMatters Child and Maternal Health Intelligence Briefing
 North West ChiMatters Child and Maternal Health Intelligence Briefing Children with long-term conditions in the North West: Emergency hospital admissions for asthma, diabetes and epilepsy 28/9 March 211
Registered childcare providers and places in England, 30 September October 2004
 Registered childcare providers and places in England, 30 September 2004. 21 October 2004 Contents: Childcare statistics About this publication Registered childcare providers and places in England, by Ofsted
Hull s Adult Health and Lifestyle Survey: Summary
 Hull s 211-212 Adult Health and Lifestyle Survey: Summary Public Health Sciences, Hull Public Health April 213 Front cover photographs of Hull are taken from the Hull City Council Flickr site (http://www.flickr.com/photos/hullcitycouncil/).
Locality Health Improvement Plan
 Locality Health Improvement Plan North Devon 2012/13 Public Health Annual Report 2011-12 The Northern Locality health improvement and tackling health inequalities plan is a mechanism for monitoring and
North-West Mental Wellbeing Survey 2013 Wirral results
 North-West Mental Wellbeing Survey 2013 Wirral results Produced by Wirral Council Performance & Public Health Intelligence Team Table of contents Contents Page Introduction 1 Characteristics of respondents
Commissioning Living with and Beyond Cancer in Yorkshire and Humber; an Overview.
 Commissioning Living with and Beyond Cancer in Yorkshire and Humber; an Overview. Document Title An Overview of Commissioning Living with and Beyond Cancer in Yorkshire and Humber Version number: 1 First
Foreword Key messages Background Method Results Concluding remarks References Appendices Dental Health
 The Dental Health of Adults in Yorkshire and the Humber 2008 Contents 3...Foreword 4...Key messages 5...Background 5...Method 7...Results 7...Responses to the survey 10...Demographic information 10...Number
Repeat ischaemic heart disease audit of primary care patients ( ): Comparisons by age, sex and ethnic group
: Comparisons by age, sex and ethnic group") Repeat ischaemic heart disease audit of primary care patients (2002-2003): Comparisons by age, sex and ethnic group Baseline-repeat ischaemic heart disease audit of primary care patients: a comparison
Repeat ischaemic heart disease audit of primary care patients (2002-2003): Comparisons by age, sex and ethnic group Baseline-repeat ischaemic heart disease audit of primary care patients: a comparison
Diabetes in New Zealand Models and Forecasts
 Diabetes in New Zealand Models and Forecasts 1996 2011 Published in March 2002 by the Ministry of Health ISBN 0-478-26284-1 (Booklet) ISBN 0-478-26285-X (Internet) HP 3493 This document is available on
ScotPHO Tobacco Profiles Second release (January 2015)
") ScotPHO Tobacco Profiles Second release (January 2015) Salomi Barkat, Shivani Karanwal, Richard Lawder, Anna MacKinnon, Diane Stockton (ISD Scotland) and Fiona Moore (NHS Health Scotland) Contents Background...
ScotPHO Tobacco Profiles Second release (January 2015) Salomi Barkat, Shivani Karanwal, Richard Lawder, Anna MacKinnon, Diane Stockton (ISD Scotland) and Fiona Moore (NHS Health Scotland) Contents Background...
Dental health profile
 Oldham Bolton Blackpool Manchester Knowsley Blackburn with Darwen Rochdale Liverpool Lancashire* NORTH WEST Bury Wirral Cumbria Wigan St Helens Halton Tameside Warrington ENGLAND Sefton Trafford Cheshire
HPV Immunisation Statistics Scotland
 Publication Report HPV Immunisation Statistics Scotland School Year 2016/17 Publication date 28 November 2017 A National Statistics Publication for Scotland Contents Contents... 1 Introduction... 2 HPV
Children and Young Peoples Oral Health in Barnet
 Appendix A Children and Young People s Oral Health in Barnet Introduction Good oral health is integral to a child s general health and well-being, and affects how children grow, enjoy life, look, speak,
Physical Activity and Sport Framework Appendix 2 - Hertfordshire
 Physical Activity and Sport Framework Appendix 2 - Hertfordshire 1 CONTENTS This appendix provides a wealth of information and data to give the reader an understanding of the demographics, health information
Childhood Obesity in Dutchess County 2004 Dutchess County Department of Health & Dutchess County Children s Services Council
 Childhood Obesity in Dutchess County 2004 Dutchess County Department of Health & Dutchess County Children s Services Council Prepared by: Saberi Rana Ali, MBBS, MS, MPH Dutchess County Department of Health
Dental health profile
 Middlesbrough Sunderland Redcar and Cleveland Darlington Stockton-on-Tees NORTH EAST ENGLAND County Durham Northumberland South Tyneside North Tyneside Newcastle-upon- Tyne Gateshead Hartlepool Average
This information has been compiled by the Live Well Wakefield Service South West Yorkshire Partnership NHS Foundation Trust.
 Local Support and Social Groups to aid independence and healthy living Wakefield North West - Ossett, Overton, Horbury, Middlestown Netherton and Lupset This information has been compiled by the Live Well
PHYSICAL ACTIVITY AND SEDENTARY BEHAVIOUR TRAJECTORIES IN MIDDLE CHILDHOOD, AND THE ASSOCIATION OF THESE WITH ADIPOSITY
 PHYSICAL ACTIVITY AND SEDENTARY BEHAVIOUR TRAJECTORIES IN MIDDLE CHILDHOOD, AND THE ASSOCIATION OF THESE WITH ADIPOSITY by SUZANNE ELIZABETH MCFALL A thesis submitted to the University of Birmingham for
Contents [HEALTH PROFILES - QUARTERLY UPDATE BRIEFING AUGUST 2016] M.Foxcroft. Performance & Intelligence Team
![Contents [HEALTH PROFILES - QUARTERLY UPDATE BRIEFING AUGUST 2016] M.Foxcroft. Performance & Intelligence Team](/thumbs/95/126035179.jpg "Contents [HEALTH PROFILES - QUARTERLY UPDATE BRIEFING AUGUST 2016] M.Foxcroft. Performance & Intelligence Team") M.Foxcroft Performance & Intelligence Team HEALTH PROFILES - QUARTERLY UPDATE BRIEFING AUGUST 2016 Public Health England has recently published a quarterly update to its Health Profiles, which provide
M.Foxcroft Performance & Intelligence Team HEALTH PROFILES - QUARTERLY UPDATE BRIEFING AUGUST 2016 Public Health England has recently published a quarterly update to its Health Profiles, which provide
Healthier Communities. Effective Governance
 Our Key Priorities Effective Governance Healthier Communities Accessible and sustainable services Our values Excellent outcomes and experience Strong partnerships A Fully Engaged and Skilled Workforce
Smoking in Barnsley: Key facts
 Smoking in Barnsley: Key facts December 2014 2 Smoking prevalence: adults who currently smoke (aged 18 and over), na onal data 2010 2011 2012 England 20.8 20.2 19.5 Yorkshire and The Humber 23.2 22.1 22.7
INFORMATION TO SUPPORT THE DEVELOPMENT OF THE LINCOLNSHIRE CANCER STRATEGY
 INFORMATION TO SUPPORT THE DEVELOPMENT OF THE LINCOLNSHIRE CANCER STRATEGY Final draft January 212 Ann Ellis, Health Improvement Principal, NHS Lincolnshire Leanne Goulsbra, Senior Information Analyst,
Outcomes from Local Cancer Campaigns Survey February 2016
 Outcomes from Local Cancer Campaigns Survey February 2016 Purpose The purpose of this report is for the Clinical Network and our key stakeholders to understand if Local Authorities have identified specific
Finalised Patient Reported Outcome Measures (PROMs) in England
 in England") Finalised Patient Reported Outcome Measures (PROMs) in England April 2015 to March Published 10 August 2017 PROMs measures health gain in patients undergoing hip and knee replacement, varicose vein treatment
Finalised Patient Reported Outcome Measures (PROMs) in England April 2015 to March Published 10 August 2017 PROMs measures health gain in patients undergoing hip and knee replacement, varicose vein treatment
Deaths from Suicide and Injury Undetermined
 Merseyside Mental Health Equity Audit Interim report on Deaths from Suicide and Injury Undetermined Observatory Report Series No 58 Janet Ubido Liverpool Public Health Observatory April 2004 A report for
Are Smoking Cessation Services Reducing Inequalities in Health?
 Are Smoking Cessation Services Reducing Inequalities in Health? An Evaluation Study Helen Lowey, Brenda Fullard, Karen Tocque and Mark A Bellis FOREWORD The research evidence on the effectiveness of the
Public Health Walsall 2015 Healthy Weight and Physical Activity Needs Assessment
 Public Health Walsall 2015 Healthy Weight and Physical Activity Needs Assessment This needs assessment is part of the Walsall Joint Strategic Needs Assessment process 1 Contents Acknowledgements... 3 Glossary...
NHS Dental Statistics for England: 2009/10
 NHS Dental Statistics for England: 2009/10 Copyright 2010, The Health and Social Care Information Centre, Dental and Eye Care Team. All Rights Reserved. 1 The NHS Information Centre is England s central,
West Yorkshire & Harrogate Health and Care Partnership
 West Yorkshire & Harrogate Health and Care Partnership Engagement mapping on the communication needs for people with a sensory impairment November 2017 1.0 Introduction The purpose of the report is to
Brief Audit of Platelet Use in the Yorkshire and The Humber Region
 Brief Audit of Platelet Use in the Yorkshire and The Humber Region Anne Davidson, Patient Blood Management Practitioner, Yorkshire and The Humber Regional Transfusion Committee Introduction This project
Men Behaving Badly? Ten questions council scrutiny can ask about men s health
 Men Behaving Badly? Ten questions council scrutiny can ask about men s health Contents Why scrutiny of men s health is important 03 Ten questions to ask about men s health 04 Conclusion 10 About the Centre
Tuesday 15 January 2013 Afternoon
 Tuesday 15 January 2013 Afternoon AS GCE HUMAN BIOLOGY F222/01/TEST Growth, Development and Disease *F210760113* Candidates answer on the Question Paper. OCR supplied materials: Advance Notice (inserted)
Breastfeeding comparisons between initiation, days and 6-8 weeks in
 Breastfeeding comparisons between initiation, 10-14-days and 6-8 weeks in 2015-16 Breastfeeding comparisons at initiation, 10-14 days and 6-8 weeks in 2015/16 The following report includes information
CASE STUDY: Measles Mumps & Rubella vaccination. Health Equity Audit
 CASE STUDY: Measles Mumps & Rubella vaccination Health Equity Audit October 2007 Dr Marie-Noelle Vieu Public Health - Lambeth PCT 1 Contents 1. Executive summary page: Lambeth PCT MMR vaccination Equity
West Yorkshire Oral Health Needs Assessment 2015 (Draft)
") West Yorkshire Oral Health Needs Assessment 2015 (Draft) This document details the oral health of the people of West Yorkshire and describes the services currently commissioned to meet those needs. It
West Yorkshire Oral Health Needs Assessment 2015 (Draft) This document details the oral health of the people of West Yorkshire and describes the services currently commissioned to meet those needs. It
Yorkshire Cancer Network
 Yorkshire Cancer Network This leaflet is intended to identify organisations and charities who may be able to help you and your family cope with the unexpected cost of your illness. It is important that
Australian Longitudinal Study on Women's Health TRENDS IN WOMEN S HEALTH 2006 FOREWORD
 Australian Longitudinal Study on Women's Health TRENDS IN WOMEN S HEALTH 2006 FOREWORD The Longitudinal Study on Women's Health, funded by the Commonwealth Government, is the most comprehensive study ever
The Prevalence of Autism (including Asperger Syndrome) in School Age Children in Northern Ireland 2017
 in School Age Children in Northern Ireland 2017") The Prevalence of Autism (including Asperger Syndrome) in School Age Children in Northern Ireland 2017 Published 15 June 2017 Reader Information Authors Iain Waugh Publication Date 15 June 2017 Issued
The Prevalence of Autism (including Asperger Syndrome) in School Age Children in Northern Ireland 2017 Published 15 June 2017 Reader Information Authors Iain Waugh Publication Date 15 June 2017 Issued
University Journal of Medicine and Medical Specialities
 ISSN 2455-2852 2019, Vol. 5(1) A STUDY ON PREVALENCE OF OVERWEIGHT AND OBESITY AND FACTORS INFLUENCING OBESITY AMONG SCHOOL GOING ADOLESCENTS IN CHENNAI, 2016 Author :KARTHICK B Department of PUBLIC HEALTH,MADRAS
The Cost of Alcohol to the North East Economy
 The Cost of Alcohol to the North East Economy Introduction In 2008 The Centre for Public Health at Liverpool John Moore s University updated a 2003 Cabinet report 1 on the costs associated with alcohol
Northumberland, Tyne and Wear NHS Foundation Trust. Board of Directors Meeting
 Agenda item Northumberland, Tyne and Wear NHS Foundation Trust Board of Directors Meeting Meeting Date: 29th November 2017 Title and Author of Paper: National CQC Community Mental Health Survey & National
Child obesity a national plan for action
 Child obesity a national plan for action Eustace de Sousa Interim Deputy Director for Health & Wellbeing and National Lead - Children, Young People and Families National Children and Adult Services Conference
Lincolnshire JSNA: Cancer
 What do we know? Summary Around one in three of us will develop cancer at some time in our lives according to our lifetime risk estimation (Sasieni PD, et al 2011). The 'lifetime risk of cancer' is an
Adult overweight and obesity
 Facts on Adult overweight and obesity March 2017 in Durham Region Highlights In 2013/2014, 57 per cent of Durham Region adults 18 and older were overweight or obese. Rates for both Durham Region and Ontario
Let them eat pizza - an investigation into the healthy eating patterns of primary school children using data from the NFER attitude surveys.
 Let them eat pizza - an investigation into the healthy eating patterns of primary school children using data from the NFER attitude surveys. Sally Bradshaw Tom Benton March 2012 ate] 2012 Published in
Teenage Booster Immunisation Statistics Scotland
 Teenage Booster Immunisation Statistics Scotland Uptake for School Year 2017/18 27 November 2018 An Official Statistics publication for Scotland This is an Official Statistics Publication The Official
Deaths from liver disease. March Implications for end of life care in England.
 National End of Life Care Programme Improving end of life care Deaths from liver Implications for end of life care in England March 212 www.endoflifecare-intelligence.org.uk Foreword The number of people
Summary of the Health Needs in Rugby Borough
 Rugby Borough Summary of the Health Needs in Rugby Borough Domain Indicator Rugby Borough 2010 Trend Warwickshire England Data Communities Children's and young people Adult's health and lifestyle Disease
Map 6: Percentage of people in the National Diabetes Audit (NDA) with Type 1 diabetes receiving all nine key care processes by PCT
 with Type 1 diabetes receiving all nine key care processes by PCT") 78 NHS ATLAS OF VARIATION ENDOCRINE, NUTRITIONAL AND METABOLIC PROBLEMS Map 6: Percentage of people in the National Diabetes Audit (NDA) with Type 1 diabetes receiving all nine key care processes by PCT
78 NHS ATLAS OF VARIATION ENDOCRINE, NUTRITIONAL AND METABOLIC PROBLEMS Map 6: Percentage of people in the National Diabetes Audit (NDA) with Type 1 diabetes receiving all nine key care processes by PCT
NHS Dental Statistics for England:
 NHS Dental Statistics for England: 2016-17 Annex 3 First Quarterly Report, Technical Annex Published 24 November 2016 Copyright 2016 Health and Social Care Information Centre. The Health and Social Care
2016 Children and young people s inpatient and day case survey
 NHS Patient Survey Programme 2016 Children and young people s inpatient and day case survey Technical details for analysing trust-level results Published November 2017 CQC publication Contents 1. Introduction...
Subject: NHS Screening and Immunisation Programmes T
 Report of the West Yorkshire Screening and Immunisation Team to the meeting of the Health and Social Care Overview & Scrutiny Committee to be held on 7 December 2017 Subject: NHS Screening and Immunisation
Local Alcohol Profiles for England 2017 user guide
 Local Alcohol Profiles for England 2017 user guide About Public Health England Public Health England s mission is to protect and improve the nation s health and to address inequalities through working
news Discover what s going on in your area! Wakefield City Castleford and Normanton North West and Rural Featherstone and South East
 news Winter 2017 Discover what s going on in your area! Wakefield City North West and Rural Pontefract and Knottingley Featherstone and South East Castleford and Normanton Pontefract and Knottingley Win
Mental Health Summary Profile. Common Mental Health Disorders and Serious Mental Illness
 Mental Health Summary Profile Common Mental Health Disorders and Serious Mental Illness Specialist Public Health, January 216 Contents Common mental health disorders (CMHD)... 2 Summary key points... 2
Summary of the Dental Results from the GP Patient Survey; July to September 2014
 Introduction Summary of the Dental Results from the GP Patient Survey; July to September 2014 1. Dental questions were originally added to the GP Patient Survey in January to March 2010, as the Department
Everyday!!! Childhood Obesity
 Childhood Obesity S O U T H W E S T C O M M U N I T Y H E A L T H C E N T E R S E A R C H P R O J E C T L A C Y B I R D S E Y E R N, B S N ( F N P S T U D E N T ) F A I R F I E L D U N I V E R S I T Y
Deb Johnson-Shelton, PhD, Geraldine Moreno-Black, PhD, and Shawn Boles, PhD Oregon Research Institute
 Bethel School District Report: Elementary Student BMI Measurement 1 Descriptive Summary for the 2008 and School Years A Report from the Communities and Schools Together (CAST) Project 2 Deb Johnson-Shelton,
People in Norfolk and Waveney with Autistic Spectrum Disorder
 People in Norfolk and Waveney with Autistic Spectrum Disorder Linda Hillman Public Health Consultant, March 2011 The national strategy to improve the lives of adults with Autism, Fulfilling and Rewarding
Overview of the FITNESSGRAM Body Composition Standards
 body composition Body composition refers to the division of total body weight (mass) into components, most commonly fat mass and fat-free mass. The proportion of total body weight that is fat (referred
March 2012: Review September 2012
 10. Cancer This section of the JSNA explores the incidence, prevalence, mortality and survival rates of cancer, to inform target setting and commissioning. Approximately 1200 Trafford residents are diagnosed
Statistics on NHS Stop Smoking Services
 Statistics on NHS Stop Smoking Services England, 2017 17 th August 2017 Key findings Thousands 900 800 700 600 500 400 300 200 100 0 Setting a quit date 2 The number of people setting a quit date fell
JSNA Data Refresh 2013/14 Diabetes Barnet
 JSNA Data Refresh 2013/14 Diabetes Barnet Diabetes is a common life-long health condition. There are 3 million people diagnosed with diabetes in the UK. Type 2 diabetes is a largely preventable disease
The South Derbyshire Health and Wellbeing Plan
 The South Derbyshire and Wellbeing Plan 2013-16 1. Vision and Aim A healthier and more active lifestyle across all communities. (c. Our Sustainable Community Strategy for South Derbyshire 2009-2029) The
Joint Strategic Needs Assessments (JSNA)
") The East Sussex Public Health bulletin is a monthly update of local Public Health news, the latest additions to the East Sussex Joint Strategic Needs Assessment website, local campaigns and projects, GP
The East Sussex Public Health bulletin is a monthly update of local Public Health news, the latest additions to the East Sussex Joint Strategic Needs Assessment website, local campaigns and projects, GP
Contents. Foreword 2 Preface 3. Part One: The Survey 1. Introduction 7 2. Survey Design 9 3. Data Validation Profile of Respondents 17
 Contents Foreword 2 Preface 3 Part One: The Survey 1. Introduction 7 2. Survey Design 9 3. Data Validation 13 4. Profile of Respondents 17 Part Two: General Findings 5. General Health 27 6. Obesity 35
Joint Strategic Needs Assessment
 Joint Strategic Needs Assessment People make healthy choices for healthy lifestyles - Cancer Last updated: June 2015 Summary Prevalence As at the end of 2010, around 5,100 people living on the Isle of
Obesity in the United Kingdom: Analysis of QRESEARCH data
 Obesity in the United Kingdom: Analysis of QRESEARCH data Authors: Professor Julia Hippisley-Cox Ronan Ryan Professor of Clinical Epidemiology and General Practice Research Fellow/Program Institution University
Alcohol-attributable hospital admissions: segmentation series report 3
 Alcohol-attributable hospital admissions: segmentation series report 3 Michela Morleo, Dan Dedman, Irene O Farrell, Penny A Cook, Michael Burrows, Karen Tocque, Clare Perkins, Mark A Bellis Alcohol-attributable
Oral Health Needs in Hull summary 2015 (November 2015)
") Oral Health Needs in Hull summary 2015 (November 2015) This document summarises the oral health needs in Hull and has been prepared to inform and complement the Hull s Oral Health Action Plan 2015-2020
Oral Health Needs in Hull summary 2015 (November 2015) This document summarises the oral health needs in Hull and has been prepared to inform and complement the Hull s Oral Health Action Plan 2015-2020
Body Mass Index Growth Module in the Michigan Care Improvement Registry. Frequently Asked Questions
 Body Mass Index Growth Module in the Michigan Care Improvement Registry Frequently Asked Questions 1. Question: What is the BMI Growth Module in the Michigan Care Improvement Registry (MCIR)? Answer: The
Statistical Press Notice NHS referral to treatment (RTT) waiting times data July 2018
 waiting times data July 2018") Thursday 13 September 2018 Statistical Press Notice NHS referral to treatment (RTT) waiting times data July 2018 NHS England released statistics today on referral to treatment (RTT) waiting times for consultant-led
Thursday 13 September 2018 Statistical Press Notice NHS referral to treatment (RTT) waiting times data July 2018 NHS England released statistics today on referral to treatment (RTT) waiting times for consultant-led
Community Bowel Screening Volunteers (CBSV) Project: Outcomes and Impact of the Pilot Phase
 Project: Outcomes and Impact of the Pilot Phase") Jonny Hirst, Regional Manager (North West) October 2017 Community Bowel Screening Volunteers (CBSV) Project: Outcomes and Impact of the Pilot Phase Contents 1. Executive Summary... 2 2. Context: Bowel
Jonny Hirst, Regional Manager (North West) October 2017 Community Bowel Screening Volunteers (CBSV) Project: Outcomes and Impact of the Pilot Phase Contents 1. Executive Summary... 2 2. Context: Bowel
Universal Newborn Hearing Screening and Early Intervention Programme (UNHSEIP) Monitoring Report
 Monitoring Report") Universal ewborn Hearing Screening and Early Intervention Programme (UHSEIP) Monitoring Report January to December 2015 Released 2016 health.govt.nz Copyright The copyright owner of this publication is
Universal ewborn Hearing Screening and Early Intervention Programme (UHSEIP) Monitoring Report January to December 2015 Released 2016 health.govt.nz Copyright The copyright owner of this publication is