T. R. Golub, D. K. Slonim & Others 1999
|
|
|
- Kelly Clarke
- 5 years ago
- Views:
Transcription

1 T. R. Golub, D. K. Slonim & Others 1999
2 Big Picture in 1999 The Need for Cancer Classification Cancer classification very important for advances in cancer treatment. Cancers of Identical grade can have widely variable clinical courses Focus on improving cancer treatment by: Targeting specific therapies to pathogenetically distinct tumor types To maximize efficacy To minimize toxicity
3 Big Picture in 1999 Cancer classification based on: Morphological appearance. Enzyme-based histochemical analyses. Immunophenotyping. Cytogenetic analysis. Methods had serious limitations: Tumors with similar histopathological appearance can follow significantly different clinical courses and show different responses to therapy Some of these differences have been explained by dividing tumors into sub-classes In other tumors, important sub-classes may exist but are yet to be defined Classification historically relied on specific biological insights
4 Executive Summary A generic approach to cancer classification based on Gene Expression Monitoring by DNA microarrays Applied to human Acute Leukemias as a test case A Class Discovery procedure automatically discovered the distinction between AML and ALL without prior knowledge. An automatically derived Class Predictor to determine the class of new leukemia cases. Bottom-line: A general strategy for discovering and predicting cancer classes for other types of cancer, independent of previous biological knowledge.

5 Types of Cancer
6 Leukemia Leukemia is Cancer of the Blood or Bone Marrow Characterized by abnormal production of WBC in the body
7 Classification of Leukemia Acute vs Chronic Chronic: The abnormal cells are more mature (look more like normal white blood cells) Acute: Abnormal cells are immature (look more like stem cells). Myelogenous vs Lymphocytic Myelogenous: Leukemias that start in early forms of myeloid cells Lymphocytic: Leukemias that start in immature forms of lymphocytes
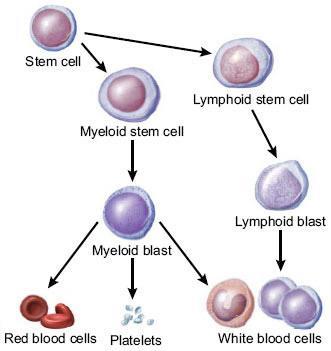
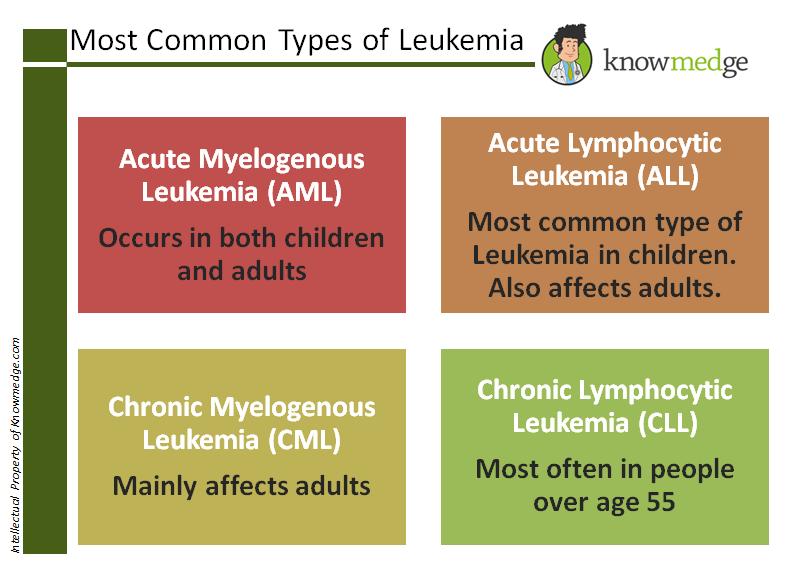
8 Classification of Leukemia
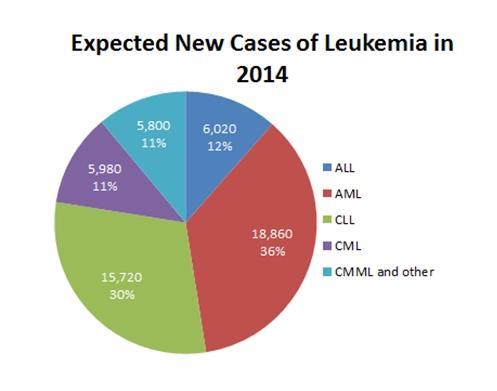

9 Some Statistics on Leukemia
10 More Background on Leukemia In 1999, no single test is sufficient to establish the diagnosis A combination of different tests in morphology, histochemistry and immunophenotyping used. Although usually accurate, leukemia classification remains imperfect and errors do occur
11 Problem How do we categorize different types of Cancer so that we can increase effectiveness of treatments and decrease toxicity? Motivation No general approach for identifying new cancer classes (Class Discovery) or for assigning tumors to known classes (Class Prediction).
12 Idea / Intuition Cancers can be automatically classified based on Gene Expression. Objective To develop a more systematic approach to cancer classification based on the simultaneous expression monitoring of thousands of genes using DNA microarrays with leukemia as test cases.
13 Gene Expression Monitoring Gene Expression Process by which information from a gene is used in the synthesis of a functional gene product. Products are typically proteins In trna or snrna genes, the product is a functional RNA.
14 Problem Breakdown Class Prediction: Assignment of particular tumor samples to already-defined classes (supervised learning). Class Discovery: Defining previously unrecognized tumor subtypes. (unsupervised learning).
15 Class Prediction How can we use an initial collection of samples belonging to known classes to create a class Predictor? Issue-1: Are there genes whose expression pattern are strongly correlated with the class distinction to be predicted? Issue-2: How do we use a collection of known samples to create a class predictor capable of assigning a new sample to one of two classes? Issue-3: How do we test the validity of these class predictors?
16 Data: Biological Samples Primary samples: 38 bone marrow samples (27 ALL, 11 AML) obtained from acute leukemia patients at diagnosis Independent samples: 34 leukemia samples (24 bone marrow, 10 peripheral blood samples)
17 Process: Use DNA Microarrays MicroArrays contained probes for 6817 human genes RNA prepared from cells was hybridized to high-density oligonucleotide MA Samples were subjected to a priori quality control standards regarding the amount of labeled RNA and the quality of the scanned microarray image. About DNA Microarrays Also known as DNA chip or biochip Collection of microscopic DNA spots attached to a solid surface. Used to measure the expression levels of large numbers of genes simultaneously or to genotype multiple regions of a genome.
18 DNA MicroArrays
19 Issue-1: Are there strong correlations? Issue-1: Are there genes whose expression pattern are strongly correlated with the class distinction to be predicted? Use Neighborhood Analysis Objective: To establish whether the observed correlations were stronger than would be expected by chance Defines an "idealized expression pattern" corresponding to a gene that is uniformly high in one class and uniformly low in the other Tests whether there is an unusually high density of genes "nearby" (or similar to) this idealized pattern, as compared to equivalent random patterns. Why do we want to start with informative genes? To be readily applied in a clinical setting Highly instructive
20 Neighborhood Analysis 1. v(g) = (e 1, e 2,..., e n ) 2. c = (c 1, c 2,..., c n ) 3. Compute the correlation between v(g) and c. 1. Euclidean distance 2. Pearson correlation coefficient. 3. P(g,c) = [µ 1 (g) - µ 2 (g)]/[ σ 1 (g) + σ 2 (g)] V(g) = expression vector, with e i denoting the expression level of gene g in ith sample C=vector of idealized expression pattern. c i = +1 or 0 based on i-th sample belonging to class 1 or 2 P(g,c) = Measure of Signal-to-noise ratio
21 Neighborhood Analysis
22 Results of Neighborhood Analysis Neighborhood Analysis showed that roughly 1100 genes of the 6,817 genes were more highly correlated with the AML-ALL class distinction than would be expected by chance Suggested that classification could indeed be based on expression data.

23 Results of Neighborhood Analysis
24 Issue-2: Building a Predictor Issue-2: How do we use a collection of known samples to create a class predictor capable of assigning a new sample to one of two classes? Use a set of informative genes to build the predictor They chose 50 genes most closely correlated with AML-ALL distinction in the known samples. Why 50? Why not 20 or 100? Predictors with 10 to 200 genes all gave 100% accurate classification 50 seemed like a reasonably robust against noise but small enough to be readily applied in a clinical setting
25 Class Predictor via Gene Voting Developed a procedure that uses a fixed subset of informative genes Makes a prediction on basis of the expression level of these genes in a new sample Each informative gene casts a weighted vote for one of the classes The magnitude of each vote dependent on the expression level in the new sample and the degree of that gene's correlation with the class distinction Votes were summed to determine the winning class Prediction Strength (PS), a measure of the margin of victory that ranges from 0 to 1 The sample was assigned to the winning class if PS exceeded a predetermined threshold, and was otherwise considered uncertain.
26 Class Predictor via Gene Voting 1. Parameters (a g, b g ) are defined for each informative gene 2. a g = P(g,c) 3. b g = [µ 1 (g) + µ 2 (g)]/2 4. v g = a g (x g - b g ) 5. V 1 = V g ; for V g > 0 6. V 2 = V g ; for V g < 0 7. PS = (V win - V lose )/(V win + V lose ) 8. The sample was assigned to the winning class for PS > threshold.
27 Class Predictor via Gene Voting
28 Issue-3: Validation of Class Predictors Issue-3: How do we test the validity of the class predictors? Two-step validation: Cross-Validation (Leave-one-out) Independent Sample Validation
29 Results of Validation of Class Predictors Initial Samples: 36 of the 38 samples as either AML or ALL and two as uncertain All 36 samples agree with clinical diagnosis Independent Samples: 29 of 34 samples are strongly predicted with 100% accuracy Average PS was lower for samples from one lab that used a different protocol Should standardize of sample preparation in clinical implementation.

30 Validation of Class Predictors Prediction Strengths were quite high: Median PS = 0.77 in cross-validation Media PS = 0.73 in independent test
31 A Look at the Set of 50 Genes The list of informative genes used in the predictor was highly instructive Some genes, including CD11c, CD33, and MB-1, encode cell surface proteins useful in distinguishing lymphoid from myeloid lineage cells. Others provide new markers of acute leukemia subtype. For example, the leptin receptor, originally identified through its role in weight regulation, showed high relative expression in AML. Together, these data suggest that genes useful for cancer class prediction may also provide insight into cancer pathogenesis and pharmacology.
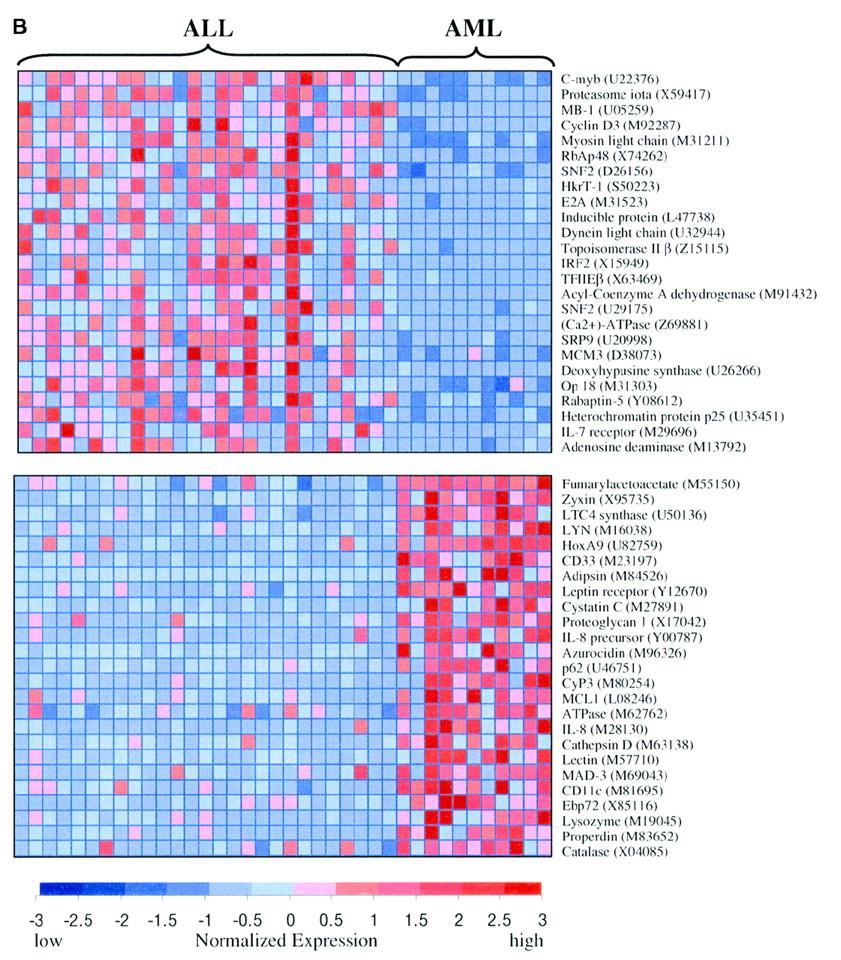
32
33 When Does This Methodology Work Best? Can be applied to any measurable distinction among tumors Importantly, such distinctions could concern a future clinical outcome Ability to predict response to chemotherapy: Among the 15 adult AML patients who had been treated and for whom long-term clinical follow-up was available. No evidence of a strong multigene expression signature was correlated with clinical outcome (This could reflect the relatively small sample size). single most highly correlated gene out of the 6817 genes was the homeobox gene HOXA9, which was over-expressed in patients with treatment failure Further clinical trials needed to test the hypothesis that HOXA9 expression plays a role in predicting AML outcome.
34 Class Discovery If the AML-ALL distinction was not already known, could it have been discovered simply based on gene expression? Issues in Class Discovery: Cluster tumors based on Gene Expression Determining whether putative classes produced are meaningful i.e. whether they reflect true structure in the data rather than simply random aggregation.
35 Class Discovery Clustering for class discovery (Unsupervised) Self-organizing maps (SOMs) technique: User specifies the number of clusters to be identified. SOM finds an optimal set of "centroids" around which the data points appear to aggregate. It then partitions the data set, with each centroid defining a cluster consisting of the data points nearest to it.
36 Video on Clustering K-Means Clustering: SOM:
37 Self Organizing Map (SOM) SOM is a mathematical cluster analysis for recognizing and classifying features in complex, multidimensional data (similar to K-mean approach) Chooses a geometry of nodes Nodes are mapped into K-dimensional space, initially at random Iteratively adjust the nodes Adjusting the Nodes: Randomly select a data point P Move the nodes in the direction of P The closest node N p is moved the most Other nodes are moved depending on their distance from N p in the initial geometry
38 Self Organizing Map (SOM)
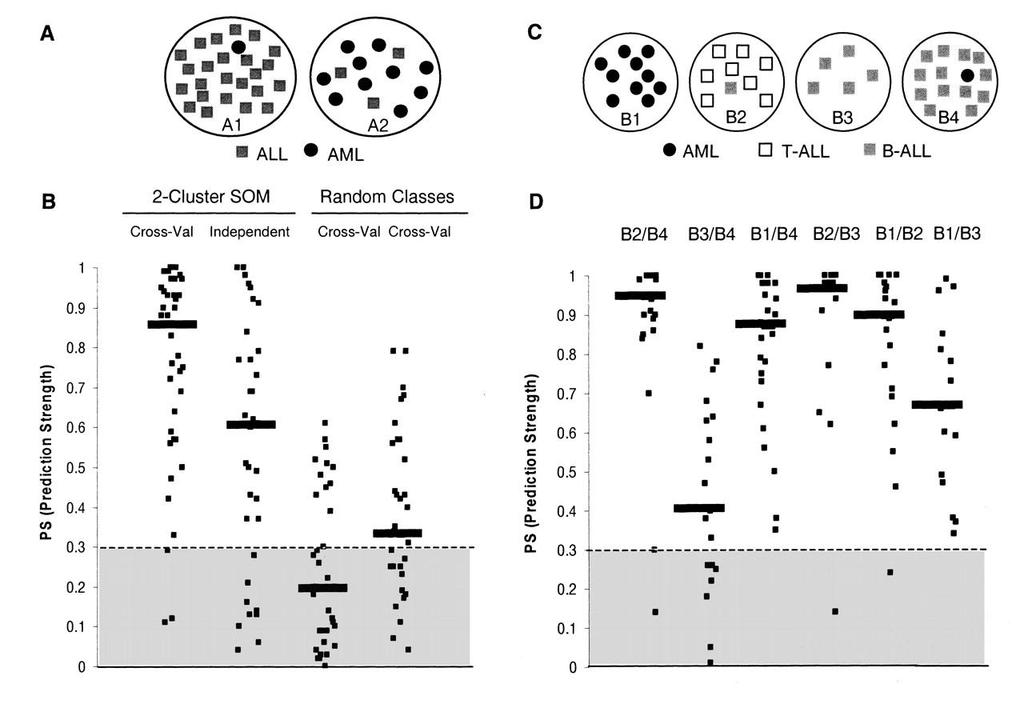
39 Results of Two-Cluster Analysis Two-cluster SOM was applied to automatically group the 38 initial leukemia samples into two classes on the basis of the expression pattern of all 6817 genes. Clusters were evaluated by comparing them to the known AML-ALL classes Class A1 contained mostly ALL (24 of 25 samples) Class A2 contained mostly AML (10 of 13 samples) SOM was thus quite effective at automatically discovering the two types of leukemia.
40
41 Discovering New Classes Issue: How do we evaluate such putative clusters if the "right" answer were not already known? Idea: Class discovery can be tested using Class Prediction Intuition: If putative classes reflect true structure, then a class predictor based on these classes should perform well. Discussion: Is this Reasonable? Is it possible that the putative classes perform well even if they do not reflect true structure?
42 Process & Results (Two Cluster) Clusters A1 and A2 were evaluated: Constructed predictors to assign new samples as Type A1" or Type A2 Cross-Validation: Predictors that used a wide range of different numbers of informative genes performed well Cross-validation thus not only showed high accuracy, but actually refined the SOM-defined classes except for the subset of samples accurately classified Similar analysis on random clusters yielded predictors with poor accuracy in cross-validation
43 Process & Results (Two Cluster) Independent Set Validation: Median PS was 0.61, and 74% of samples were above threshold High PS indicates that the structure seen in the initial data set is also seen in the independent data set Predictors from random clusters consistently yielded low PS on independent data set Conclusion: A1-A2 distinction can be seen to be meaningful, rather than simply a statistical artifact of the initial data set Results show that the AML-ALL distinction could have been automatically discovered and confirmed without previous biological knowledge
44 Process & Results (Four Cluster) SOM divides the samples into four clusters Largely corresponded to AML, T-lineage ALL, B-lineage ALL & B-lineage ALL Four-cluster SOM thus divided the samples along another key biological distinction Evaluated classes by constructing class predictors. The four classes could be distinguished from one another, with the exception of B3 versus B4 The prediction tests thus confirmed the distinctions corresponding to AML, B- ALL, and T-ALL Suggested that it may be appropriate to merge classes B3 and B4, composed primarily of B-lineage ALL
45
46 Conclusion Technique for creating class predictors These class predictors could be adapted to a clinical setting, with appropriate steps to standardize the protocol for sample preparation. Such a test supplementing rather than replacing existing leukemia diagnostics; Class predictors can be constructed for known pathological categories and provide diagnostic confirmation or clarify unusual cases. The technique of class prediction can be applied to distinctions relating to future clinical outcome, suchas drug response or survival. Class prediction provides an unbiased, general approach to constructing such prognostic tests.
47 Conclusion In principle, the class discovery techniques discovered here can be used to identify fundamental subtypes of any cancer. In general, such studies will require careful experimental design to avoid potential experimental artifacts--especially in the case of solid tumors. Various approaches could be used to avoid such artifacts; Class discovery methods could also be used to search for fundamental mechanisms that cut across distinct types of cancers.

48 WOS Citation Report

49 Mayo 50 Oncogene Panel
Classification of cancer profiles. ABDBM Ron Shamir
 Classification of cancer profiles 1 Background: Cancer Classification Cancer classification is central to cancer treatment; Traditional cancer classification methods: location; morphology, cytogenesis;
Case Studies on High Throughput Gene Expression Data Kun Huang, PhD Raghu Machiraju, PhD
 Case Studies on High Throughput Gene Expression Data Kun Huang, PhD Raghu Machiraju, PhD Department of Biomedical Informatics Department of Computer Science and Engineering The Ohio State University Review
Gene expression analysis. Roadmap. Microarray technology: how it work Applications: what can we do with it Preprocessing: Classification Clustering
 Gene expression analysis Roadmap Microarray technology: how it work Applications: what can we do with it Preprocessing: Image processing Data normalization Classification Clustering Biclustering 1 Gene
Comparison of discrimination methods for the classification of tumors using gene expression data
 Comparison of discrimination methods for the classification of tumors using gene expression data Sandrine Dudoit, Jane Fridlyand 2 and Terry Speed 2,. Mathematical Sciences Research Institute, Berkeley
Efficacy of the Extended Principal Orthogonal Decomposition Method on DNA Microarray Data in Cancer Detection
 202 4th International onference on Bioinformatics and Biomedical Technology IPBEE vol.29 (202) (202) IASIT Press, Singapore Efficacy of the Extended Principal Orthogonal Decomposition on DA Microarray
Molecular Classification of Cancer: Class Discovery and Class Prediction by Gene Expression Monitoring
 Molecular Classification of Cancer: Class Discovery and Class Prediction by Gene Expression Monitoring T. R. Golub, 1,2 * D. K. Slonim, 1 P. Tamayo, 1 C. Huard, 1 M. Gaasenbeek, 1 J. P. Mesirov, 1 H. Coller,
Predicting Breast Cancer Survival Using Treatment and Patient Factors
 Predicting Breast Cancer Survival Using Treatment and Patient Factors William Chen wchen808@stanford.edu Henry Wang hwang9@stanford.edu 1. Introduction Breast cancer is the leading type of cancer in women
Segmentation and Analysis of Cancer Cells in Blood Samples
 Segmentation and Analysis of Cancer Cells in Blood Samples Arjun Nelikanti Assistant Professor, NMREC, Department of CSE Hyderabad, India anelikanti@gmail.com Abstract Blood cancer is an umbrella term
Introduction to Discrimination in Microarray Data Analysis
 Introduction to Discrimination in Microarray Data Analysis Jane Fridlyand CBMB University of California, San Francisco Genentech Hall Auditorium, Mission Bay, UCSF October 23, 2004 1 Case Study: Van t
Gene Selection for Tumor Classification Using Microarray Gene Expression Data
 Gene Selection for Tumor Classification Using Microarray Gene Expression Data K. Yendrapalli, R. Basnet, S. Mukkamala, A. H. Sung Department of Computer Science New Mexico Institute of Mining and Technology
Identification of Tissue Independent Cancer Driver Genes
 Identification of Tissue Independent Cancer Driver Genes Alexandros Manolakos, Idoia Ochoa, Kartik Venkat Supervisor: Olivier Gevaert Abstract Identification of genomic patterns in tumors is an important
Chapter 1. Introduction
 Chapter 1 Introduction 1.1 Motivation and Goals The increasing availability and decreasing cost of high-throughput (HT) technologies coupled with the availability of computational tools and data form a
Class discovery in Gene Expression Data: Characterizing Splits by Support Vector Machines
 Class discovery in Gene Expression Data: Characterizing Splits by Support Vector Machines Florian Markowetz and Anja von Heydebreck Max-Planck-Institute for Molecular Genetics Computational Molecular Biology
International Journal of Computer Science Trends and Technology (IJCST) Volume 5 Issue 1, Jan Feb 2017
 Volume 5 Issue 1, Jan Feb 2017") RESEARCH ARTICLE Classification of Cancer Dataset in Data Mining Algorithms Using R Tool P.Dhivyapriya [1], Dr.S.Sivakumar [2] Research Scholar [1], Assistant professor [2] Department of Computer Science
RESEARCH ARTICLE Classification of Cancer Dataset in Data Mining Algorithms Using R Tool P.Dhivyapriya [1], Dr.S.Sivakumar [2] Research Scholar [1], Assistant professor [2] Department of Computer Science
Can we classify cancer using cell signaling?
 Can we classify cancer using cell signaling? Central hypotheses (big ideas) Alterations to signaling genes would cause leukemic cells to react in an inappropriate or sensitized manner to environmental
Roadmap for Developing and Validating Therapeutically Relevant Genomic Classifiers. Richard Simon, J Clin Oncol 23:
 Roadmap for Developing and Validating Therapeutically Relevant Genomic Classifiers. Richard Simon, J Clin Oncol 23:7332-7341 Presented by Deming Mi 7/25/2006 Major reasons for few prognostic factors to
Clustering analysis of cancerous microarray data
 Available online www.jocpr.com Journal of Chemical and Pharmaceutical Research, 2014, 6(9): 488-493 Research Article ISSN : 0975-7384 CODEN(USA) : JCPRC5 Clustering analysis of cancerous microarray data
Classification. Methods Course: Gene Expression Data Analysis -Day Five. Rainer Spang
 Classification Methods Course: Gene Expression Data Analysis -Day Five Rainer Spang Ms. Smith DNA Chip of Ms. Smith Expression profile of Ms. Smith Ms. Smith 30.000 properties of Ms. Smith The expression
Nearest Shrunken Centroid as Feature Selection of Microarray Data
 Nearest Shrunken Centroid as Feature Selection of Microarray Data Myungsook Klassen Computer Science Department, California Lutheran University 60 West Olsen Rd, Thousand Oaks, CA 91360 mklassen@clunet.edu
Motivation: Fraud Detection
 Outlier Detection Motivation: Fraud Detection http://i.imgur.com/ckkoaop.gif Jian Pei: CMPT 741/459 Data Mining -- Outlier Detection (1) 2 Techniques: Fraud Detection Features Dissimilarity Groups and
A Biclustering Based Classification Framework for Cancer Diagnosis and Prognosis
 A Biclustering Based Classification Framework for Cancer Diagnosis and Prognosis Baljeet Malhotra and Guohui Lin Department of Computing Science, University of Alberta, Edmonton, Alberta, Canada T6G 2E8
Hierarchical Bayesian Modeling of Individual Differences in Texture Discrimination
 Hierarchical Bayesian Modeling of Individual Differences in Texture Discrimination Timothy N. Rubin (trubin@uci.edu) Michael D. Lee (mdlee@uci.edu) Charles F. Chubb (cchubb@uci.edu) Department of Cognitive
Gene expression correlates of clinical prostate cancer behavior
 Gene expression correlates of clinical prostate cancer behavior Cancer Cell 2002 1: 203-209. Singh D, Febbo P, Ross K, Jackson D, Manola J, Ladd C, Tamayo P, Renshaw A, D Amico A, Richie J, Lander E, Loda
Diagnosis of multiple cancer types by shrunken centroids of gene expression
 Diagnosis of multiple cancer types by shrunken centroids of gene expression Robert Tibshirani, Trevor Hastie, Balasubramanian Narasimhan, and Gilbert Chu PNAS 99:10:6567-6572, 14 May 2002 Nearest Centroid
Gene expression analysis for tumor classification using vector quantization
 Gene expression analysis for tumor classification using vector quantization Edna Márquez 1 Jesús Savage 1, Ana María Espinosa 2, Jaime Berumen 2, Christian Lemaitre 3 1 IIMAS, Universidad Nacional Autónoma
A REVIEW OF BIOINFORMATICS APPLICATION IN BREAST CANCER RESEARCH
 Journal of Advanced Bioinformatics Applications and Research. Vol 1, Issue 1, June 2010, pp 59-68 A REVIEW OF BIOINFORMATICS APPLICATION IN BREAST CANCER RESEARCH Vidya Vaidya, Shriram Dawkhar Department
Reliability of Ordination Analyses
 Reliability of Ordination Analyses Objectives: Discuss Reliability Define Consistency and Accuracy Discuss Validation Methods Opening Thoughts Inference Space: What is it? Inference space can be defined
Data Mining. Outlier detection. Hamid Beigy. Sharif University of Technology. Fall 1395
 Data Mining Outlier detection Hamid Beigy Sharif University of Technology Fall 1395 Hamid Beigy (Sharif University of Technology) Data Mining Fall 1395 1 / 17 Table of contents 1 Introduction 2 Outlier
MODEL-BASED CLUSTERING IN GENE EXPRESSION MICROARRAYS: AN APPLICATION TO BREAST CANCER DATA
 International Journal of Software Engineering and Knowledge Engineering Vol. 13, No. 6 (2003) 579 592 c World Scientific Publishing Company MODEL-BASED CLUSTERING IN GENE EXPRESSION MICROARRAYS: AN APPLICATION
SWOG ONCOLOGY RESEARCH PROFESSIONAL (ORP) MANUAL LEUKEMIA FORMS CHAPTER 16A REVISED: DECEMBER 2017
 MANUAL LEUKEMIA FORMS CHAPTER 16A REVISED: DECEMBER 2017") LEUKEMIA FORMS The guidelines and figures below are specific to Leukemia studies. The information in this manual does NOT represent a complete set of required forms for any leukemia study. Please refer
LEUKEMIA FORMS The guidelines and figures below are specific to Leukemia studies. The information in this manual does NOT represent a complete set of required forms for any leukemia study. Please refer
Research Supervised clustering of genes Marcel Dettling and Peter Bühlmann
 http://genomebiology.com/22/3/2/research/69. Research Supervised clustering of genes Marcel Dettling and Peter Bühlmann Address: Seminar für Statistik, Eidgenössische Technische Hochschule (ETH) Zürich,
Lecture #4: Overabundance Analysis and Class Discovery
 236632 Topics in Microarray Data nalysis Winter 2004-5 November 15, 2004 Lecture #4: Overabundance nalysis and Class Discovery Lecturer: Doron Lipson Scribes: Itai Sharon & Tomer Shiran 1 Differentially
Myelodysplasia/Myeloproliferative Neoplasms (MDS/MPN) Post-HCT Data
 Post-HCT Data") Instructions for Myelodysplasia/Myeloproliferative Neoplasms (MDS/MPN) Post-HCT Data (Form 2114) This section of the CIBMTR Forms Instruction Manual is intended to be a resource for completing the Myelodysplasia/Myeloproliferative
Instructions for Myelodysplasia/Myeloproliferative Neoplasms (MDS/MPN) Post-HCT Data (Form 2114) This section of the CIBMTR Forms Instruction Manual is intended to be a resource for completing the Myelodysplasia/Myeloproliferative
Acute Lymphoblastic and Myeloid Leukemia
 Acute Lymphoblastic and Myeloid Leukemia Pre- and Post-Disease Form Acute Lympoblastic Leukemia Mary Eapen MD, MS Acute Lymphoblastic Leukemia SEER Age-adjusted incidence rate 1.6 per 100,000 men and women
Detection and Classification of Lung Cancer Using Artificial Neural Network
 Detection and Classification of Lung Cancer Using Artificial Neural Network Almas Pathan 1, Bairu.K.saptalkar 2 1,2 Department of Electronics and Communication Engineering, SDMCET, Dharwad, India 1 almaseng@yahoo.co.in,
Profiles of gene expression & diagnosis/prognosis of cancer. MCs in Advanced Genetics Ainoa Planas Riverola
 Profiles of gene expression & diagnosis/prognosis of cancer MCs in Advanced Genetics Ainoa Planas Riverola Gene expression profiles Gene expression profiling Used in molecular biology, it measures the
Gene Expression Based Leukemia Sub Classification Using Committee Neural Networks
 Bioinformatics and Biology Insights M e t h o d o l o g y Open Access Full open access to this and thousands of other papers at http://www.la-press.com. Gene Expression Based Leukemia Sub Classification
L. Ziaei MS*, A. R. Mehri PhD**, M. Salehi PhD***
 Received: 1/16/2004 Accepted: 8/1/2005 Original Article Application of Artificial Neural Networks in Cancer Classification and Diagnosis Prediction of a Subtype of Lymphoma Based on Gene Expression Profile
Statistics 202: Data Mining. c Jonathan Taylor. Final review Based in part on slides from textbook, slides of Susan Holmes.
 Final review Based in part on slides from textbook, slides of Susan Holmes December 5, 2012 1 / 1 Final review Overview Before Midterm General goals of data mining. Datatypes. Preprocessing & dimension
The MILE study: Expression microarray analysis for diagnosis of leukaemia. Ken Mills CCRCB Queen s University Belfast
 The MILE study: Expression microarray analysis for diagnosis of leukaemia Ken Mills CCRCB Queen s University Belfast Outline MILE Prephase Stage I Stage II Implementation MDS Diagnosis into Prognosis Leukaemia
Unit 1 Exploring and Understanding Data
 Unit 1 Exploring and Understanding Data Area Principle Bar Chart Boxplot Conditional Distribution Dotplot Empirical Rule Five Number Summary Frequency Distribution Frequency Polygon Histogram Interquartile
RNA preparation from extracted paraffin cores:
 Supplementary methods, Nielsen et al., A comparison of PAM50 intrinsic subtyping with immunohistochemistry and clinical prognostic factors in tamoxifen-treated estrogen receptor positive breast cancer.
Applications. DSC 410/510 Multivariate Statistical Methods. Discriminating Two Groups. What is Discriminant Analysis
 DSC 4/5 Multivariate Statistical Methods Applications DSC 4/5 Multivariate Statistical Methods Discriminant Analysis Identify the group to which an object or case (e.g. person, firm, product) belongs:
Bayesian Bi-Cluster Change-Point Model for Exploring Functional Brain Dynamics
 Int'l Conf. Bioinformatics and Computational Biology BIOCOMP'18 85 Bayesian Bi-Cluster Change-Point Model for Exploring Functional Brain Dynamics Bing Liu 1*, Xuan Guo 2, and Jing Zhang 1** 1 Department
Module 3: Pathway and Drug Development
 Module 3: Pathway and Drug Development Table of Contents 1.1 Getting Started... 6 1.2 Identifying a Dasatinib sensitive cancer signature... 7 1.2.1 Identifying and validating a Dasatinib Signature... 7
6. Unusual and Influential Data
 Sociology 740 John ox Lecture Notes 6. Unusual and Influential Data Copyright 2014 by John ox Unusual and Influential Data 1 1. Introduction I Linear statistical models make strong assumptions about the
Unsupervised MRI Brain Tumor Detection Techniques with Morphological Operations
 Unsupervised MRI Brain Tumor Detection Techniques with Morphological Operations Ritu Verma, Sujeet Tiwari, Naazish Rahim Abstract Tumor is a deformity in human body cells which, if not detected and treated,
Nature Methods: doi: /nmeth.3115
 Supplementary Figure 1 Analysis of DNA methylation in a cancer cohort based on Infinium 450K data. RnBeads was used to rediscover a clinically distinct subgroup of glioblastoma patients characterized by
TITLE: A Data-Driven Approach to Patient Risk Stratification for Acute Respiratory Distress Syndrome (ARDS)
") TITLE: A Data-Driven Approach to Patient Risk Stratification for Acute Respiratory Distress Syndrome (ARDS) AUTHORS: Tejas Prahlad INTRODUCTION Acute Respiratory Distress Syndrome (ARDS) is a condition
TITLE: A Data-Driven Approach to Patient Risk Stratification for Acute Respiratory Distress Syndrome (ARDS) AUTHORS: Tejas Prahlad INTRODUCTION Acute Respiratory Distress Syndrome (ARDS) is a condition
Mixed Phenotype Acute Leukemias
 Mixed Phenotype Acute Leukemias CHEN GAO; AMY M. SANDS; JIANLAN SUN NORTH AMERICAN JOURNAL OF MEDICINE AND SCIENCE APR 2012 VOL 5 NO.2 INTRODUCTION Most cases of acute leukemia can be classified based
Aspects of Statistical Modelling & Data Analysis in Gene Expression Genomics. Mike West Duke University
 Aspects of Statistical Modelling & Data Analysis in Gene Expression Genomics Mike West Duke University Papers, software, many links: www.isds.duke.edu/~mw ABS04 web site: Lecture slides, stats notes, papers,
Data Mining in Bioinformatics Day 7: Clustering in Bioinformatics
 Data Mining in Bioinformatics Day 7: Clustering in Bioinformatics Karsten Borgwardt February 21 to March 4, 2011 Machine Learning & Computational Biology Research Group MPIs Tübingen Karsten Borgwardt:
Hematology Measure #1: Myelodysplastic Syndrome (MDS) and Acute Leukemias: Baseline Cytogenetic Testing Performed on Bone Marrow
 and Acute Leukemias: Baseline Cytogenetic Testing Performed on Bone Marrow") Hematology Measure #1: Myelodysplastic Syndrome (MDS) and Acute Leukemias: Baseline Cytogenetic Testing Performed on Bone Marrow This measure may be used as an Accountability measure Clinical Performance
Hematology Measure #1: Myelodysplastic Syndrome (MDS) and Acute Leukemias: Baseline Cytogenetic Testing Performed on Bone Marrow This measure may be used as an Accountability measure Clinical Performance
Bayesian (Belief) Network Models,
 Network Models,") Bayesian (Belief) Network Models, 2/10/03 & 2/12/03 Outline of This Lecture 1. Overview of the model 2. Bayes Probability and Rules of Inference Conditional Probabilities Priors and posteriors Joint distributions
Bayesian (Belief) Network Models, 2/10/03 & 2/12/03 Outline of This Lecture 1. Overview of the model 2. Bayes Probability and Rules of Inference Conditional Probabilities Priors and posteriors Joint distributions
Wen et al. (1998) PNAS, 95:
 PNAS, 95:") Large-scale temporal gene expression mapping of central nervous system development Fluctuations in mrna expression of 2 genes during rat central nervous system development, focusing on the cervical spinal
Large-scale temporal gene expression mapping of central nervous system development Fluctuations in mrna expression of 2 genes during rat central nervous system development, focusing on the cervical spinal
Knowledge Discovery and Data Mining I
 Ludwig-Maximilians-Universität München Lehrstuhl für Datenbanksysteme und Data Mining Prof. Dr. Thomas Seidl Knowledge Discovery and Data Mining I Winter Semester 2018/19 Introduction What is an outlier?
NUMERATOR: Patients who had baseline cytogenetic testing performed on bone marrow
 Quality ID #67 (NQF 0377): Hematology: Myelodysplastic Syndrome (MDS) and Acute Leukemias: Baseline Cytogenetic Testing Performed on Bone Marrow National Quality Strategy Domain: Effective Clinical Care
National Surgical Adjuvant Breast and Bowel Project (NSABP) Foundation Annual Progress Report: 2009 Formula Grant
 Foundation Annual Progress Report: 2009 Formula Grant") National Surgical Adjuvant Breast and Bowel Project (NSABP) Foundation Annual Progress Report: 2009 Formula Grant Reporting Period July 1, 2011 June 30, 2012 Formula Grant Overview The National Surgical
National Surgical Adjuvant Breast and Bowel Project (NSABP) Foundation Annual Progress Report: 2009 Formula Grant Reporting Period July 1, 2011 June 30, 2012 Formula Grant Overview The National Surgical
Machine Learning! Robert Stengel! Robotics and Intelligent Systems MAE 345,! Princeton University, 2017
 Machine Learning! Robert Stengel! Robotics and Intelligent Systems MAE 345,! Princeton University, 2017 A.K.A. Artificial Intelligence Unsupervised learning! Cluster analysis Patterns, Clumps, and Joining
Cancerclass: An R package for development and validation of diagnostic tests from high-dimensional molecular data
 Cancerclass: An R package for development and validation of diagnostic tests from high-dimensional molecular data Jan Budczies, Daniel Kosztyla October 30, 2018 Contents 1 Introduction 2 2 Multiple random
Comparison of Gene Set Analysis with Various Score Transformations to Test the Significance of Sets of Genes
 Comparison of Gene Set Analysis with Various Score Transformations to Test the Significance of Sets of Genes Ivan Arreola and Dr. David Han Department of Management of Science and Statistics, University
Informative Gene Selection for Leukemia Cancer Using Weighted K-Means Clustering
 IOSR Journal of Pharmacy and Biological Sciences (IOSR-JPBS) e-issn: 2278-3008, p-issn:2319-7676. Volume 9, Issue 4 Ver. V (Jul -Aug. 2014), PP 12-16 Informative Gene Selection for Leukemia Cancer Using
Outlier Analysis. Lijun Zhang
 Outlier Analysis Lijun Zhang zlj@nju.edu.cn http://cs.nju.edu.cn/zlj Outline Introduction Extreme Value Analysis Probabilistic Models Clustering for Outlier Detection Distance-Based Outlier Detection Density-Based
Predicting Kidney Cancer Survival from Genomic Data
 Predicting Kidney Cancer Survival from Genomic Data Christopher Sauer, Rishi Bedi, Duc Nguyen, Benedikt Bünz Abstract Cancers are on par with heart disease as the leading cause for mortality in the United
Protocol Development: The Guiding Light of Any Clinical Study
 Protocol Development: The Guiding Light of Any Clinical Study Susan G. Fisher, Ph.D. Chair, Department of Clinical Sciences 1 Introduction Importance/ relevance/ gaps in knowledge Specific purpose of the
INTRODUCTION TO MACHINE LEARNING. Decision tree learning
 INTRODUCTION TO MACHINE LEARNING Decision tree learning Task of classification Automatically assign class to observations with features Observation: vector of features, with a class Automatically assign
An Improved Algorithm To Predict Recurrence Of Breast Cancer
 An Improved Algorithm To Predict Recurrence Of Breast Cancer Umang Agrawal 1, Ass. Prof. Ishan K Rajani 2 1 M.E Computer Engineer, Silver Oak College of Engineering & Technology, Gujarat, India. 2 Assistant
Profiles of gene expression & diagnosis/prognosis of cancer Lorena Roa de la Cruz
 Genomics Profiles of gene expression & diagnosis/prognosis of cancer Lorena Roa de la Cruz Gene expression profiling Measurement of the activity of thousands of genes at once Techniques used for gene expression
Cancer Gene Extraction Based on Stepwise Regression
 Mathematical Computation Volume 5, 2016, PP.6-10 Cancer Gene Extraction Based on Stepwise Regression Jie Ni 1, Fan Wu 1, Meixiang Jin 1, Yixing Bai 1, Yunfei Guo 1 1. Mathematics Department, Yanbian University,
Using Bayesian Networks to Analyze Expression Data. Xu Siwei, s Muhammad Ali Faisal, s Tejal Joshi, s
 Using Bayesian Networks to Analyze Expression Data Xu Siwei, s0789023 Muhammad Ali Faisal, s0677834 Tejal Joshi, s0677858 Outline Introduction Bayesian Networks Equivalence Classes Applying to Expression
Heme 9 Myeloid neoplasms
 Heme 9 Myeloid neoplasms The minimum number of blasts to diagnose acute myeloid leukemia is 5% 10% 20% 50% 80% AML with the best prognosis is AML with recurrent cytogenetic abnormality AML with myelodysplasia
Myeloid neoplasms. Early arrest in the blast cell or immature cell "we call it acute leukemia" Myoid neoplasm divided in to 3 major categories:
 Myeloid neoplasms Note: Early arrest in the blast cell or immature cell "we call it acute leukemia" Myoid neoplasm divided in to 3 major categories: 1. AML : Acute myeloid leukemia(stem cell with myeloid
Dharmesh A Sarvaiya 1, Prof. Mehul Barot 2
 Detection of Lung Cancer using Sputum Image Segmentation. Dharmesh A Sarvaiya 1, Prof. Mehul Barot 2 1,2 Department of Computer Engineering, L.D.R.P Institute of Technology & Research, KSV University,
Acute myeloid leukemia. M. Kaźmierczak 2016
 Acute myeloid leukemia M. Kaźmierczak 2016 Acute myeloid leukemia Malignant clonal disorder of immature hematopoietic cells characterized by clonal proliferation of abnormal blast cells and impaired production
Acute Lymphocytic Leukemia Early Detection, Diagnosis, and Types
 Acute Lymphocytic Leukemia Early Detection, Diagnosis, and Types Detection and Diagnosis Catching cancer early often allows for more treatment options. Some early cancers may have signs and symptoms that
Brain Tumor Detection of MRI Image using Level Set Segmentation and Morphological Operations
 Brain Tumor Detection of MRI Image using Level Set Segmentation and Morphological Operations Swati Dubey Lakhwinder Kaur Abstract In medical image investigation, one of the essential problems is segmentation
chapter 1 - fig. 2 Mechanism of transcriptional control by ppar agonists.
 chapter 1 - fig. 1 The -omics subdisciplines. chapter 1 - fig. 2 Mechanism of transcriptional control by ppar agonists. 201 figures chapter 1 chapter 2 - fig. 1 Schematic overview of the different steps
International Journal of Digital Application & Contemporary research Website: (Volume 1, Issue 1, August 2012) IJDACR.
 IJDACR.") Segmentation of Brain MRI Images for Tumor extraction by combining C-means clustering and Watershed algorithm with Genetic Algorithm Kailash Sinha 1 1 Department of Electronics & Telecommunication Engineering,
Segmentation of Brain MRI Images for Tumor extraction by combining C-means clustering and Watershed algorithm with Genetic Algorithm Kailash Sinha 1 1 Department of Electronics & Telecommunication Engineering,
COMMUNICATION ENGINEERING & TECHNOLOGY (IJECET) DETECTION OF ACUTE LEUKEMIA USING WHITE BLOOD CELLS SEGMENTATION BASED ON BLOOD SAMPLES
 DETECTION OF ACUTE LEUKEMIA USING WHITE BLOOD CELLS SEGMENTATION BASED ON BLOOD SAMPLES") International INTERNATIONAL Journal of Electronics JOURNAL and Communication OF ELECTRONICS Engineering & Technology AND (IJECET), COMMUNICATION ENGINEERING & TECHNOLOGY (IJECET) ISSN 0976 6464(Print)
International INTERNATIONAL Journal of Electronics JOURNAL and Communication OF ELECTRONICS Engineering & Technology AND (IJECET), COMMUNICATION ENGINEERING & TECHNOLOGY (IJECET) ISSN 0976 6464(Print)
Application of Artificial Neural Networks in Classification of Autism Diagnosis Based on Gene Expression Signatures
 Application of Artificial Neural Networks in Classification of Autism Diagnosis Based on Gene Expression Signatures 1 2 3 4 5 Kathleen T Quach Department of Neuroscience University of California, San Diego
MOST: detecting cancer differential gene expression
 Biostatistics (2008), 9, 3, pp. 411 418 doi:10.1093/biostatistics/kxm042 Advance Access publication on November 29, 2007 MOST: detecting cancer differential gene expression HENG LIAN Division of Mathematical
Augmented Medical Decisions
 Machine Learning Applied to Biomedical Challenges 2016 Rulex, Inc. Intelligible Rules for Reliable Diagnostics Rulex is a predictive analytics platform able to manage and to analyze big amounts of heterogeneous
Evaluation of Gene Selection Using Support Vector Machine Recursive Feature Elimination
 Evaluation of Gene Selection Using Support Vector Machine Recursive Feature Elimination Committee: Advisor: Dr. Rosemary Renaut Dr. Adrienne C. Scheck Dr. Kenneth Hoober Dr. Bradford Kirkman-Liff John
White Paper Estimating Complex Phenotype Prevalence Using Predictive Models
 White Paper 23-12 Estimating Complex Phenotype Prevalence Using Predictive Models Authors: Nicholas A. Furlotte Aaron Kleinman Robin Smith David Hinds Created: September 25 th, 2015 September 25th, 2015
Done By : WESSEN ADNAN BUTHAINAH AL-MASAEED
 Done By : WESSEN ADNAN BUTHAINAH AL-MASAEED Acute Myeloid Leukemia Firstly we ll start with this introduction then enter the title of the lecture, so be ready and let s begin by the name of Allah : We
Tissue Classification Based on Gene Expression Data
 Chapter 6 Tissue Classification Based on Gene Expression Data Many diseases result from complex interactions involving numerous genes. Previously, these gene interactions have been commonly studied separately.
Supplementary methods:
 Supplementary methods: Primers sequences used in real-time PCR analyses: β-actin F: GACCTCTATGCCAACACAGT β-actin [11] R: AGTACTTGCGCTCAGGAGGA MMP13 F: TTCTGGTCTTCTGGCACACGCTTT MMP13 R: CCAAGCTCATGGGCAGCAACAATA
Supplementary Materials Extracting a Cellular Hierarchy from High-dimensional Cytometry Data with SPADE
 Supplementary Materials Extracting a Cellular Hierarchy from High-dimensional Cytometry Data with SPADE Peng Qiu1,4, Erin F. Simonds2, Sean C. Bendall2, Kenneth D. Gibbs Jr.2, Robert V. Bruggner2, Michael
Differential diagnosis of hematolymphoid tumors composed of medium-sized cells. Brian Skinnider B.C. Cancer Agency, Vancouver General Hospital
 Differential diagnosis of hematolymphoid tumors composed of medium-sized cells Brian Skinnider B.C. Cancer Agency, Vancouver General Hospital Lymphoma classification Lymphoma diagnosis starts with morphologic
A COMBINATORY ALGORITHM OF UNIVARIATE AND MULTIVARIATE GENE SELECTION
 5-9 JATIT. All rights reserved. A COMBINATORY ALGORITHM OF UNIVARIATE AND MULTIVARIATE GENE SELECTION 1 H. Mahmoodian, M. Hamiruce Marhaban, 3 R. A. Rahim, R. Rosli, 5 M. Iqbal Saripan 1 PhD student, Department
IN SPITE of a very quick development of medicine within
 INTL JOURNAL OF ELECTRONICS AND TELECOMMUNICATIONS, 21, VOL. 6, NO. 3, PP. 281-286 Manuscript received July 1, 21: revised September, 21. DOI: 1.2478/v1177-1-37-9 Application of Density Based Clustering
Genetic Analysis of Anxiety Related Behaviors by Gene Chip and In situ Hybridization of the Hippocampus and Amygdala of C57BL/6J and AJ Mice Brains
 Genetic Analysis of Anxiety Related Behaviors by Gene Chip and In situ Hybridization of the Hippocampus and Amygdala of C57BL/6J and AJ Mice Brains INTRODUCTION To study the relationship between an animal's
Predictive Biomarkers
 Uğur Sezerman Evolutionary Selection of Near Optimal Number of Features for Classification of Gene Expression Data Using Genetic Algorithms Predictive Biomarkers Biomarker: A gene, protein, or other change
Best on the Left or on the Right in a Likert Scale
 Best on the Left or on the Right in a Likert Scale Overview In an informal poll of 150 educated research professionals attending the 2009 Sawtooth Conference, 100% of those who voted raised their hands
Using CART to Mine SELDI ProteinChip Data for Biomarkers and Disease Stratification
 Using CART to Mine SELDI ProteinChip Data for Biomarkers and Disease Stratification Kenna Mawk, D.V.M. Informatics Product Manager Ciphergen Biosystems, Inc. Outline Introduction to ProteinChip Technology
INTRODUCTION TO CHILDHOOD LEUKAEMIA
 INTRODUCTION TO CHILDHOOD LEUKAEMIA Mel Greaves and Donald Pinkel This page intentionally left blank 3 INTRODUCTION TO CHILDHOOD LEUKAEMIA Mel Greaves and Donald Pinkel Leukaemia is a cancer of blood cells,
Classifica4on. CSCI1950 Z Computa4onal Methods for Biology Lecture 18. Ben Raphael April 8, hip://cs.brown.edu/courses/csci1950 z/
 CSCI1950 Z Computa4onal Methods for Biology Lecture 18 Ben Raphael April 8, 2009 hip://cs.brown.edu/courses/csci1950 z/ Binary classifica,on Given a set of examples (x i, y i ), where y i = + 1, from unknown
Mutational Impact on Diagnostic and Prognostic Evaluation of MDS
 Mutational Impact on Diagnostic and Prognostic Evaluation of MDS Elsa Bernard, PhD Papaemmanuil Lab, Computational Oncology, MSKCC MDS Foundation ASH 2018 Symposium Disclosure Research funds provided by
Machine Learning for Predicting Delayed Onset Trauma Following Ischemic Stroke
 Machine Learning for Predicting Delayed Onset Trauma Following Ischemic Stroke Anthony Ma 1, Gus Liu 1 Department of Computer Science, Stanford University, Stanford, CA 94305 Stroke is currently the third
Biostatistical modelling in genomics for clinical cancer studies
 This work was supported by Entente Cordiale Cancer Research Bursaries Biostatistical modelling in genomics for clinical cancer studies Philippe Broët JE 2492 Faculté de Médecine Paris-Sud In collaboration