Imaging Mass Microscope
|
|
|
- Sabrina Banks
- 5 years ago
- Views:
Transcription


1 Imaging Mass Microscope imscope C146-E220


2
3 Introducing the New Era of Imaging Mass Spectrometry Imaging mass spectrometry is a revolutionary new technology. The instrument is a combination of an optical microscope which allows the observation of high-resolution morphological images, with a mass spectrometer which identifies and visualizes the distribution of specific molecules. Superimposing the two images obtained based on these very different principles, has created a significant new research tool, the imaging mass microscope. The accurate and high resolution mass images from the imscope will drive your research to the next level. At long last, we have entered the age of imaging mass spectrometry.


4 Optical microscope Capture an optical microscope image Multiplexed imaging Generate molecular distribution images (multiplexed imaging) based on ms signal intensity for specific ions. MS Spectrometer Mass spectra at multiple points Apply matrix to tissue section and irradiate with laser beam. m/za m/zb Laser MALDI TOF Mass Spectrometry Inonized Biomolecules Matrix m/zc Tissue Section m/za m/zb m/zc 4
5 Imaging Mass Spectrometry identifies what you see at the molecular level imscope transforms your data from just Observation to Analysis Optical microscopes cannot determine which molecules are localized in region of interest. On the other hand, the positional information of molecules is lost in mass spectrometric analysis, where sample extraction and homogenization is needed for sample pre-treatment. What if the qualitative analysis and localization of specific molecules and compositional and morphological op oogcaobservation ato could coudbe obtained from a single analysis through microscope observation? Imaging mass spectrometry with the imscope realizes this dream. imscope Superimpose optical and mass microscope images. Imaging mass spectrometry directly detects both natural and synthetic molecules in tissue sections and measures mass spectra, while retaining their positional information associated with the tissue section. Then, two-dimensional distributions of specific molecules are visualized by combining the positional information of each mass spectrum and the signal intensity for specific ions in the mass spectrum (MS imaging). The imaging mass microscope, imscope, is a newly developed instrument designed specifically for imaging mass spectrometry. It represents a completely new hybrid type microscope that combines both an optical microscope and a mass spectrometer. The imscope now makes it possible to identify various substances directly in tissue samples and expands the potential research opportunities to a wide variety of fields. Ideal for Cutting-Edge Research in a Wide Variety of Fields Medical Research Biomarker discovery Pharmaceuticals Pharmacokinetic analysis Food Quality evaluation Industry Surface Analysis Lipid analysis Metabolite analysis Pathological studies Microstructural analysis Localization of native and metabolized drugs Pharmacological research Toxicity mechanism analysis DDS research Ingredient research of agricultural products Inspection of contaminants Homogeneity evaluation Cosmetics development and evaluation 5
.")
6 Biomarker Visualization Profiling Medical Research In Medical research, the imscope is particularly useful for identifying disease-related molecules (biomarker discovery) and rendering two-dimensional distributions of those substances (visualization). Also biological mechanism analysis and pathological research through identifying the location of target molecules (profiling) can be achieved. 6


 8.0 6.0 4.0 2.")
 of glutathione in normal liver (open columns) and cancerous liver (closed columns)")
 3.0 2.0 1.")
 and metastases (M).")
7 Identification of localized molecules in cancerous mouse liver cells The imscope makes it possible to obtain information regarding which molecules are localized within the region of interest in an organ, e.g. cancerous area. Until now, biomarker discovery has been carried out by LCMS or other mass spectrometry techniques for each organ. Biomarker Profiling Visualization Bright field optical Image Fluorescence optical Image Cancer Experiment Conditions Sample: Mouse liver Matrix: 9-AA (aminoacridine, sprayed) Measurement pitch: 10 µm Measuring points: (40,000 points) MS Images GSH GSSG [UDP-HexNAc]app mmol/ g tissue [GSSG]app mmol/ g tissue [GSH]app mmol/ g tissue [GSH]app/[GSSG]app Contents (µmol/g tissue) Contents (µmol/g tissue) Quantitative values (by capillary electrophoresismass spectrometry) of glutathione in normal liver (open columns) and cancerous liver (closed columns) Apparent contents (µmol/g tissue) GSH * Apparent contents (µmol/g tissue) GSSG 0 P M P M Estimated contents of glutathiones by imaging mass spectrometry, which is corrected by normalizing total signal intensities of imaging mass spectrum by that of capillary electrophoresis mass spectrometry in liver parenchyma (P) and metastases (M). * GFP-tagged human colon cancer cells (HCT116) were injected into a mouse portal vein so that the cancer spread to the mouse liver. The bright areas in the fluorescence optical image are the cancerous liver area. Results of analysing the section showed an increase of UDP- Nacetylhexosamine (UDP-HexNAc), glutathione, and related metabolites in the metastatic cancer. The comparison between the quantitative analysis results of the neighbouring tissue and the affected zones enables the highly localized quantitative analysis of many metabolites. Reference: Anal, Bioanal, Chem 2011 Jun; 400(7): License No.:


 and phosphatidylinositols (m/z 885.5) in mouse testis.")


8 Profiling of biological tissue and organ cross sections Biomarker The imscope, which incorporates database searching with MS and MS n data, can be applied not only to visualize the localization of a certain molecule, but also to identify the molecules relating to the cause of disease. Seminolipids in mouse testis Optical Image Profiling Visualization Experiment Conditions Sample: Mouse testis Matrix: 9-AA (AminoAcridine, vapor-deposition) Measuring points: (62,500 points) Pitch between points: 10 um Measurement time: About 3 hours MS Images m/z m/z m/z The images show characteristic distributions of seminolipids (m/z and 809.5) and phosphatidylinositols (m/z 885.5) in mouse testis. In this example, 9-aminoacridine was vapor-deposited as a matrix on the sample, and mass spectra were measured in negative ion mode. Negative ion spectra are simpler than positive ion, making it easier to identify target molecules. Negative ion analysis is frequently used for low molecular weight metabolite analysis. Aminoacrylate in hair cortex Optical Images MS Images Low High Scale bar: 100 µm Optical images of hair cross-sections (left), and distributions of aminoacrylate (right) are shown. Aminoacrylate showed a cortex-specific distribution. Reference: Bunseki No.9,

 Measurement pitch: 10 µm Measurement")
 GalCer (d18:1/24:1)+k (m/z 848.")

 in the mouse cerebellum was successfully visualized within 3 hours (2.5 mm square).")
9 Visualization of lipid in a Mouse Cerebellum Biomarker A wide variety of molecules relate to diseases states. Imaging mass spectrometry using the imscope can detect a wide range of molecules within a defined mass range. Therefore, distribution information for several target molecules with different molecular weights can be determined simultaneously during a single measurement. Profiling Visualization Optical Image Experiment Conditions Sample: Mouse cerebellum Matrix: DHB (vapor deposition) Measurement pitch: 10 µm Measurement points: (62,500 points) Working time: About 3 hours* MS Images SM (d18:1/18:0)+k (m/z 769.5) PC (16:0/16:0)+K (m/z 772.5) PC (18:0/18:1)+K (m/z 826.5) GalCer (d18:1/24:1)+k (m/z 848.5) *Ionization time: 50ms, Mass range: m/z , MS mode By displaying the signal intensity at molecular weight of each target molecule, the 2D location of the target molecules is visualized. All target molecules can be detected simultaneously by a single measurement. Furthermore, samples are measured at a fast 6 pixels per second, dramatically shortening your experiment time. In this example, the distribution of phosphatidylcholines (PCs) in the mouse cerebellum was successfully visualized within 3 hours (2.5 mm square). Limitations in immunostaining of lipids have previously made visual mapping of these compounds difficult. However this can easily be achieved using the imscope, making this technology very powerful, particularly in areas such as brain function analysis and any biological process where lipids are known to play an important role. 9

10 High Spatial Resolution Overlaying Images Pharmacokinetic Analysis Pharmaceuticals In drug discovery, researchers need to do a variety of pharmacokinetics research for many drug candidates in many situations. For instance, a wide range of spatial-resolution observation is needed, from the sub-cellular level high spatial resolution observation to mouse full body large area observation. imscope is useful for pharmacokinetics, pharmacological mechanisms, toxicity testing, and the development of ointments and cosmetics, owing ability to combine morphological observation from the optical microscope and location of target molecules from the mass spectrometer image. 10


 Measurement points: 50 50 (2,500 points) Measurement pitch: 10 µm")
+K m/z 870.")

11 High Spatial Resolution Imaging of Mouse Retina High-resolution imaging offered by optical microscopes is required not only for pharmacokinetic analysis, but also for toxicity testing and toxicity mechanism analysis. Also, evaluating the phototoxic property of drug candidates requires detailed analysis of the retina and neighboring organs. High Spatial Resolution Pharmacokinetic Analysis Overlaying Images Optical Image Experiment Conditions Sample:Mouse retina Matrix: DHB (sprayed) Measurement points: (2,500 points) Measurement pitch: 10 µm Measurement time: About 7 min 10 µm Imaging m/z PC(16:0/18:1)+K m/z PC(18:1/18:1)+K m/z PC(16:0/20:2)+K m/z PC(18:0/24:2)+H In this experiment, two types of phosphatidylcholine (PC) distributions in the mouse retina were visualized. The PC (18:0/22:6) located next to the retinal pigment epithelium, which is about 10 µm thick, and the PC (16:0/18:1) located toward the outside the epithelium, can be detected and visualized distinctively. The images show that the two types of PC are distributed in thin layered structures. 11


 Measurement")

 50 µm pitch A 1 mm B C B C Cortex/ medulla High Kidney pelvis Blood vessel")
 Low Measurement pitch: 50 µm Famotidine, commonly used as a")


12 Pharmacokinetic Analysis (Whole body and tissue) In pharmacokinetic analysis, the imscope enables the distribution of unchanged and metabolized drugs to be simultaneously mapped in a single measurement, without any labeling. The laser diameter used during mass spectrometry imaging with the imscope is continuously variable from 5 to 200 µm, offering low to high spatial resolution. This helps ensure that analyses are performed as efficiently as possible. High Spatial Resolution Pharmacokinetic Analysis Overlaying Images Optical Image Section Brain Spine Heart Lungs Liver Stomach Kidney Intestines Experiment Conditions Sample: 200 mg/kg 5mm Full body section of mouse 3 minutes after single administration of famotidine via tail vein Matrix: DHB (sprayed) Measurement points: (4,547 points) (measured in four different regions) Spatial resolution: 200 µm Famotidine m/z High Low Mass Image: m/z m/z High Low MS/MS Image: m/z (Precursor ion: m/z ) 50 µm pitch A 1 mm B C B C Cortex/ medulla High Kidney pelvis Blood vessel Experiment Conditions Sample: Mouse kidney Matrix: DHB (sprayed) Measurement points: (3,542 points) Low Measurement pitch: 50 µm Famotidine, commonly used as a histamine H2 receptor antagonist, was administered into a mouse vein. Three minutes after administration, the mouse was euthanized and a frozen section was prepared. Famotidine was detected in the kidneys by screening analysis of the full body section at 200 µm pitches. Also, the MS image with 50 µm spatial resolution shows that the famotidine was particularly localized in the kidney pelvis. J. Mass Spectram. Soc. Jpn. Vol. 59, No. 4, 2011 (copyright MSJJ) 12
13 Overlaying Optical and MS Images Overlaying MS images and optical microscope morphological images reveals the difference between the amounts of specific molecules in each minute organ and can relate molecular distribution to the biological functions of an organelle and morphological changes. High Spatial Resolution Pharmacokinetic Analysis Overlaying Images Optical Image 50 µm pitch 5 µm pitch Experiment Conditions Sample: Normal mouse brain Matrix: DHB (vapor deposited) Measurement points: at 50 µm (23,430 points) at 5 µm (62,500 points) Measurement pitch: 50 µm and 5 µm Measurement time: About 1 hour at 50 µm and about 3 hours at 5 µm MS Images Overlay of MS Images Overlay of MS Images and Optical Microscope Images The above figures show the resultant images generated by overlaying MS images at different m/z (blue and yellow) and optical microscope morphological images. These figures clearly indicate that analysis of the localization of specific molecules combined with morphological images is a useful approach for investigating drug efficiency and toxicity in drug discovery. 13


 Measurement points: 68 95 (6,064 points) Measurement")
 In industrial manufacturing, surface inspection is widely performed, for example, to identify the")

14 Food In the food industry, breeding improvement is actively done to develop high-value and high productive agricultural foods. Imaging mass spectrometry is useful as a new evaluating tool for monitoring the amount of effective ingredients in foods. Here, overlaying image of optical and mass images of rice is shown as an example. This figure clearly indicates that a specific lipid exists throughout the endosperm. The measurement of the localization of specific molecules by imaging mass spectrometry can be appiled not only to the development of high-value foods, but also to food safety by monitoring the localization of toxic molecules. Experiment Conditions Sample: Rice Matrix: DHB (vapor deposited) Measurement points: (6,064 points) Measurement pitch: 10 µm Measurement time: About 18 min Industry m/z LPC(l-acyl 16:0) In industrial manufacturing, surface inspection is widely performed, for example, to identify the cause of soldering defects on printed circuit boards or to analyze contaminants. Such an inspection is necessary to maintain high quality production. Imaging mass spectrometry is capable of analyzing various contaminants that cannot be detected by conventional surface inspection methods, and it is possible to gain new knowledge for higher quality production. Experiment Conditions Sample: Printed circuit board Matrix: None Measurement points: (3,200 points) Measurement pitch: 10 µm Measurement time: About 9 min m/z


15 Integration of Intelligent Advanced Technologies The instrument features simple design with indicator lights that allow the user to confirm the operating status from a distance combined with smooth and highly accurate analysis. It also comes with dedicated software for rapid analysis and processing of massive amounts of data. The imaging mass microscope, imscope, features extensive functionality and straight forward operation that has been designed with users in mind. Overlaid optical and MS images Best-in-class 5 µm spatial resolution Structural analysis by highly accurate MS n analysis 6 pixel per second, high-speed analysis *Ionization time: 50 ms Mass range: , MS mode 15
16 A Revolutionary Analysis System that put state-of-the-art-technologies together The imaging mass microscope, imscope is a high-performance, de novo and progressive analysis system, featuring: - proprietary technology to combine optical and mass spectrometric images - 5 µm laser diameter the world s highest level MS image resolution - high-precision tandem mass spectrometer to perform structural analysis Optical Microscope Magnification is variable from 1.25 to 40 times for observing from small to wide field to high detail. Bright field and fluorescence modes are both available. High-speed and High Precision Sample Stage The stage below the section sample moves at high-speed and stops at the desired point instantaneously and precisely. 16

17 High-Speed Laser Unit with Variable Beam Diameter The laser beam diameter can be set from 5 µm to 200 µm. After screening the wide area with the 200 µm beam diameter, detailed analysis can be carried out with a 5 µm beam using the serial section function. Extensive and efficient data acquisition is supported by the 1kHz laser frequency. Versatile and Reliable Quadrupole-Ion-Trap Even though the mass spectra are directly acquired from a tissue section, high mass accuracy is achieved independent of the sample surface state, because the ions are cooled and focused in the ion-trap prior to TOF-MS. Multi-stage (MS n ) target molecule fragmentation, which is easy to set up, provides definitive molecular structural information. A Proprietary Ion Transfer System Ensures High Sensitivity Analysis The laser generated plume of ionised molecules is transferred efficiently and quantitatively from the sample stage into the mass spectrometer. 17


18 Work flow With the imscope, the entire work flow from setting the sample, acquiring an optical image, setting and acquiring MS data to data analysis and statistical treatment is completely seamless and follows the intuitive flow of process of the experiment. 1. Place the sample on the stage. Place a thinly sliced sample (e.g. tissue section) directly on the optical microscope sample stage. Alignment marks Flat springs for holding sample plate Dielectric glass slide Observation 2. Capture an optical microscope image. Observe the sample via the optical microscope and capture an image. The objective lens magnification can be varied from 1.25 times to 40 times, which enables high-resolution images to be captured Apply matrix. Apply the matrix, which assists ionization and desorption, to the tissue section by vapor deposition. The matrix transfers the laser light energy into heat via UV light absorption, with the resultant thermal energy releasing the target molecules from within the tissue section and at the same time ionizing them. Measurement 18

.")

, these can be distinguished and visualized (imaging) by MS/MS analysis. Rat Brain m/z 772.")

19 4. Acquire mass spectra at multiple points across the sample. A mass spectrum of the ionized molecules is acquired at each laser irradiation point. By irradiating the whole sample area in a grid pattern, a mass spectral image of the whole sample is built up. Measurement 5. Visualize the molecular distribution (multiplexed imaging). Visualize a two-dimensional distribution of specific molecules, based on the signal intensity of selected ions of interest in the mass spectra. MS and MS/MS Imaging Optical Image MS image Even if a molecule cannot be identified in the MS spectra, due to multiple molecules coexisting at the same mass (peak), these can be distinguished and visualized (imaging) by MS/MS analysis. Rat Brain m/z Optical Image MS/MS images m/z m/z Overlay the optical microscope and MS images. By overlaying the optical microscope image, which provides the morphological information, and MS image, which reveals the localized molecules in the region of interest, a single tissue section reveals the molecular makeup and distribution of specific tissue features. Analysis 7. Use the software for statistical analysis. Data reduction tools built in to the software help the user to efficiently extract and analyze the necessary data from the high-volume, high-resolution mass spectrometer images. 19


20 Imaging MS Solution Software For Efficient Statistical Analysis Imaging MS Solution is a new software program designed specifically for the imscope, which integrates optical and mass image acquisition. All imaging mass spectrometry parameters can be set on the optical images. Visualization processing is added to mass spectrum acquisition, and high-speed imaging processing up to 6 pixels per second is available. Furthermore, this analysis and display software incorporates statistical tools to analyze the huge amounts of MS-imaging data combined with detailed optical microscope images. Acquisition mode Measurement areas, mass ranges, and other various parameter settings are specified based on the optical images acquired by built-in optical microscope. A variety of parameter settings can be specified for multiple locations on the sample section, allowing highly area specific acquisition and analysis for imaging mass spectrometry. Analysis mode Analysis mode, newly developed for the imscope, can overlay MS images on the optical image, and provides data analysis functions; HCA, ROI and PCA analysis. HCA Analysis ROI Analysis PCA Analysis Hierarchical Cluster Analysis (HCA) After acquiring an optical microscope image, measurement regions are specified and data is acquired by imaging mass spectrometry. By analyzing images, HCA creates clusters (groups) consisting of similar substances (this example shows visualization results for substances grouped as HC#1) from the mixture of different characteristic molecules and classifies target substances from distribution information. For example, by selecting substance groups with the same distribution as the administered drug, it is possible to use the results for studying pharmacological mechanisms or evaluating toxicity. 20


 PCA organizes all detected")
.")

21 Region of Interest (ROI) Analysis ROI analysis helps investigate and compare substances in two specified regions of interest (regions A and B, in the example above) to determine which substances are increased or decreased in each region. For example, if the amount of a given molecule increases in a cancerous region, then that is treated as a candidate cancer biomarker. Principal Component Analysis (PCA) PCA organizes all detected peaks (m/z values) based on loading factor (weight coefficients assigned to individual peaks). When the peaks are arranged in an array, the MS images can form several patterns representing principal components. Therefore, PCA can be especially useful for finding the ions, which show specific localizations. This feature helps provide more multifaceted data analysis. 21
")


22 Matrix Vapor Deposition System imlayer (option) High reproducibility and minute matrix crystals This system ensures reliable vapor deposition of matrices to assist the consistent ionization of samples. Vapor deposition parameters can be changed for each type of matrix. It also includes an auto control function of matrix layer thickness. Slide glass holder Vapor deposition Spray (for reference) Scale bar: 40 µm 22


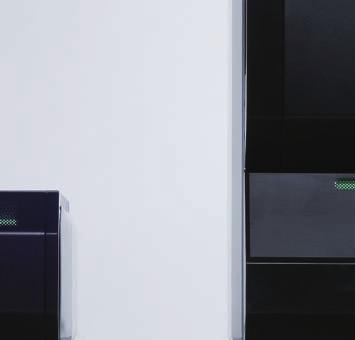
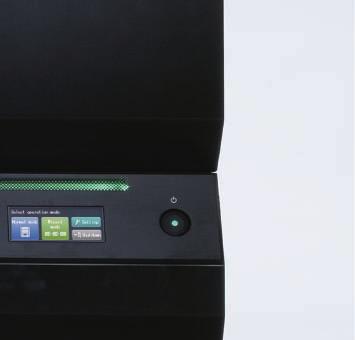

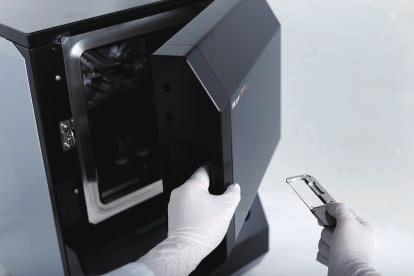
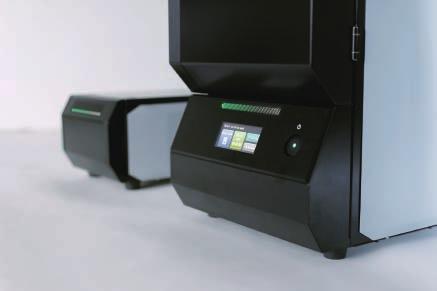
23 User-friendly design Front opening chamber for easy sample loading Intuitive recognition of operation status with indicator LEDs. 23


24 imscope This product may not be sold in your country. Please contact us to check the availability of this product in your country. Company names, product/service names and logos used in this publication are trademarks and trade names of Shimadzu Corporation or its affiliates, whether or not they are used with trademark symbol TM or. Third-party trademarks and trade names may be used in this publication to refer to either the entities or their products/services. Shimadzu disclaims any proprietary interest in trademarks and trade names other than its own. For Research Use Only. Not for use in diagnostic procedures. The contents of this publication are provided to you as is without warranty of any kind, and are subject to change without notice. Shimadzu does not assume any responsibility or liability for any damage, whether direct or indirect, relating to the use of this publication. Shimadzu Corporation, 2013 Printed in Japan ANS
Sequence Identification And Spatial Distribution of Rat Brain Tryptic Peptides Using MALDI Mass Spectrometric Imaging
 Sequence Identification And Spatial Distribution of Rat Brain Tryptic Peptides Using MALDI Mass Spectrometric Imaging AB SCIEX MALDI TOF/TOF* Systems Patrick Pribil AB SCIEX, Canada MALDI mass spectrometric
[application note] DIRECT TISSUE IMAGING AND CHARACTERIZATION OF PHOSPHOLIPIDS USING A MALDI SYNAPT HDMS SYSTEM
![[application note] DIRECT TISSUE IMAGING AND CHARACTERIZATION OF PHOSPHOLIPIDS USING A MALDI SYNAPT HDMS SYSTEM](/thumbs/93/111965378.jpg "[application note] DIRECT TISSUE IMAGING AND CHARACTERIZATION OF PHOSPHOLIPIDS USING A MALDI SYNAPT HDMS SYSTEM") DIRECT TISSUE IMAGING AND CHARACTERIZATION OF PHOSPHOLIPIDS USING A MALDI SYNAPT HDMS SYSTEM Emmanuelle Claude, Marten Snel, Thérèse McKenna, and James Langridge INTRODUCTION The last decade has seen a
DIRECT TISSUE IMAGING AND CHARACTERIZATION OF PHOSPHOLIPIDS USING A MALDI SYNAPT HDMS SYSTEM Emmanuelle Claude, Marten Snel, Thérèse McKenna, and James Langridge INTRODUCTION The last decade has seen a
LOCALISATION, IDENTIFICATION AND SEPARATION OF MOLECULES. Gilles Frache Materials Characterization Day October 14 th 2016
 LOCALISATION, IDENTIFICATION AND SEPARATION OF MOLECULES Gilles Frache Materials Characterization Day October 14 th 2016 1 MOLECULAR ANALYSES Which focus? LOCALIZATION of molecules by Mass Spectrometry
Data Independent MALDI Imaging HDMS E for Visualization and Identification of Lipids Directly from a Single Tissue Section
 Data Independent MALDI Imaging HDMS E for Visualization and Identification of Lipids Directly from a Single Tissue Section Emmanuelle Claude, Mark Towers, and Kieran Neeson Waters Corporation, Manchester,
INTRODUCTION TO MALDI IMAGING
 INTRODUCTION TO MALDI IMAGING Marten F. Snel, Emmanuelle Claude, Thérèse McKenna, and James I. Langridge Waters Corporation, Manchester, UK INT RODUCTION The last few years have seen a rapid increase in
LC/MS/MS SOLUTIONS FOR LIPIDOMICS. Biomarker and Omics Solutions FOR DISCOVERY AND TARGETED LIPIDOMICS
 LC/MS/MS SOLUTIONS FOR LIPIDOMICS Biomarker and Omics Solutions FOR DISCOVERY AND TARGETED LIPIDOMICS Lipids play a key role in many biological processes, such as the formation of cell membranes and signaling
Technical Note # TN-31 Redefining MALDI-TOF/TOF Performance
 Bruker Daltonics Technical Note # TN-31 Redefining MALDI-TOF/TOF Performance The new ultraflextreme exceeds all current expectations of MALDI-TOF/TOF technology: A proprietary khz smartbeam-ii TM MALDI
Ultra High Performance Liquid Chromatograph. Nexera X2 C196-E079
 Ultra High Performance Liquid Chromatograph Nexera X2 C196-E79 Maximizing the Potential of UHPLC/HPLC Analyses Intelligence Intelligent data solutions, including a new i -PDeA peak calculation method for
New Instruments and Services
 New Instruments and Services http://planetorbitrap.com/orbitrap fusion Combining the best of quadrupole, Orbitrap, and ion trap mass analysis in a revolutionary Tribrid architecture, the Orbitrap Fusion
Structural Elucidation of N-glycans Originating From Ovarian Cancer Cells Using High-Vacuum MALDI Mass Spectrometry
 PO-CON1347E Structural Elucidation of N-glycans Originating From Ovarian Cancer Cells Using High-Vacuum MALDI Mass Spectrometry ASMS 2013 TP-708 Matthew S. F. Choo 1,3 ; Roberto Castangia 2 ; Matthew E.
New Instruments and Services
 New Instruments and Services Liwen Zhang Mass Spectrometry and Proteomics Facility The Ohio State University Summer Workshop 2016 Thermo Orbitrap Fusion http://planetorbitrap.com/orbitrap fusion Thermo
Comprehensive Two-Dimensional HPLC and Informative Data Processing for Pharmaceuticals and Lipids
 PO-CON1576E Comprehensive Two-Dimensional HPLC and Informative Data Processing for Pharmaceuticals and Lipids HPLC 2015 PSB-MULTI-06 Yoshiyuki WATABE, Tetsuo IIDA, Daisuke NAKAYAMA, Kanya TSUJII, Saki
Agilent 6410 Triple Quadrupole LC/MS. Sensitivity, Reliability, Value
 Agilent 64 Triple Quadrupole LC/MS Sensitivity, Reliability, Value Sensitivity, Reliability, Value Whether you quantitate drug metabolites, measure herbicide levels in food, or determine contaminant levels
Application Note # MT-91. High Quality MALDI Imaging of Proteins and Peptides in Small Rodent Organ Tissues. Bruker Daltonics.
 Bruker Daltonics Application Note # MT-91 18385 Da 6230 Da 7843 Da High Quality MALDI Imaging of Proteins and Peptides in Small Rodent Organ Tissues New developments in MALDI instrumentation, laser technology
Mass spectrometry imaging. What does MS imaging offer?
 BMG 744 Mass spectrometry imaging Stephen Barnes, PhD With sincere acknowledgments to David Stella, PhD and Kyle A. Floyd, MS, former students in the Barnes Laboratory (2005 2012) and Kevin Schey, PhD,
MALDI Imaging Drug Imaging Detlev Suckau Head of R&D MALDI Bruker Daltonik GmbH. December 19,
 MALDI Imaging Drug Imaging Detlev Suckau Head of R&D MALDI Bruker Daltonik GmbH December 19, 2014 1 The principle of MALDI imaging Spatially resolved mass spectra are recorded Each mass signal represents
Bruker Daltonics. autoflex III smartbeam. The Standard in MALDI-TOF Performance MALDI-TOF/TOF. think forward
 Bruker Daltonics autoflex III smartbeam The Standard in MALDI-TOF Performance think forward MALDI-TOF/TOF Designed for a Routine High Level of Performance The autoflex III smartbeam brings the power of
Three Dimensional Mapping and Imaging of Neuropeptides and Lipids in Crustacean Brain
 Three Dimensional Mapping and Imaging of Neuropeptides and Lipids in Crustacean Brain Using the 4800 MALDI TOF/TOF Analyzer Ruibing Chen and Lingjun Li School of Pharmacy and Department of Chemistry, University
Rapid, Simple Impurity Characterization with the Xevo TQ Mass Spectrometer
 Robert Plumb, Michael D. Jones, and Marian Twohig Waters Corporation, Milford, MA, USA INTRODUCTION The detection and characterization of impurities and degradation products of an active pharmaceutical
The J105 SIMS. A New Instrument for 3-Dimensional Imaging and Analysis. Paul Blenkinsopp, Ionoptika Ltd
 The J105 SIMS A New Instrument for 3-Dimensional Imaging and Analysis Paul Blenkinsopp, Ionoptika Ltd The J105 SIMS Why a new ToF Mass Spectrometer? The J105 ToF has been designed to allow us to separate
Molecular Cartography:
 Molecular Cartography: Moving Towards Combined Topographical and Chemical Imaging Using AFM and Mass Spectrometry Olga S. Ovchinnikova Organic and Biological Mass Spectrometry Group, Chemical Sciences
O O H. Robert S. Plumb and Paul D. Rainville Waters Corporation, Milford, MA, U.S. INTRODUCTION EXPERIMENTAL. LC /MS conditions
 Simplifying Qual/Quan Analysis in Discovery DMPK using UPLC and Xevo TQ MS Robert S. Plumb and Paul D. Rainville Waters Corporation, Milford, MA, U.S. INTRODUCTION The determination of the drug metabolism
SYNAPT G2-S High Definition MS (HDMS) System
 System") SYNAPT G2-S High Definition MS (HDMS) System High performance, versatility, and workflow efficiency of your MS system all play a crucial role in your ability to successfully reach your scientific and business
SYNAPT G2-S High Definition MS (HDMS) System High performance, versatility, and workflow efficiency of your MS system all play a crucial role in your ability to successfully reach your scientific and business
Small Molecule Drug Imaging of Mouse Tissue by MALDI-TOF/TOF Mass Spectrometry and FTMS
 Bruker Daltonics Application Note # MT-93/FTMS-38 Small Molecule Drug Imaging of Mouse Tissue by MALDI-TOF/TOF Mass Spectrometry and FTMS Introduction Matrix Assisted Laser Desorption Ionization (MALDI)
The study of phospholipids in single cells using an integrated microfluidic device
 Supporting Information: The study of phospholipids in single cells using an integrated microfluidic device combined with matrix-assisted laser desorption/ionization mass spectrometry Weiyi Xie,, Dan Gao,
Future Directions: Tissue and Cell Imaging Robert C. Murphy
 LIPID MAPS Lipidomics Workshop April 19, 2009 www.lipidmaps.org m/z 806 (16:0a/22:6-PC) [M+H] + Future Directions: Tissue and Cell Imaging Robert C. Murphy 16:0/22:6 PC m/z 806.4 Department of Pharmacology
Matrix Assisted Laser Desorption Ionization Time-of-flight Mass Spectrometry
 Matrix Assisted Laser Desorption Ionization Time-of-flight Mass Spectrometry Time-of-Flight Mass Spectrometry. Basic principles An attractive feature of the time-of-flight (TOF) mass spectrometer is its
Imaging of lipid species by MALDI mass spectrometry
 Imaging of lipid species by MALDI mass spectrometry Robert C. Murphy, 1 Joseph A. Hankin, and Robert M. Barkley Department of Pharmacology, MS 8303 University of Colorado Denver, Aurora, CO 80045 Abstract
Ultra Performance Liquid Chromatography Coupled to Orthogonal Quadrupole TOF MS(MS) for Metabolite Identification
 for Metabolite Identification") 22 SEPARATION SCIENCE REDEFINED MAY 2005 Ultra Performance Liquid Chromatography Coupled to Orthogonal Quadrupole TOF MS(MS) for Metabolite Identification In the drug discovery process the detection and
22 SEPARATION SCIENCE REDEFINED MAY 2005 Ultra Performance Liquid Chromatography Coupled to Orthogonal Quadrupole TOF MS(MS) for Metabolite Identification In the drug discovery process the detection and
Jose Castro-Perez, Henry Shion, Kate Yu, John Shockcor, Emma Marsden-Edwards, Jeff Goshawk Waters Corporation, Milford, MA, U.S. and Manchester, UK
 HIGH-THRUGHPUT REACTIVE METABLITE SCREEIG FR DICLFEAC BY UPLC AD XEV TQ MS WITH SCAWAVE Jose Castro-Perez, Henry Shion, Kate Yu, John Shockcor, Emma Marsden-Edwards, Jeff Goshawk Waters Corporation, Milford,
NAS Workshop on the Industrialization of Biology
 High throughput chemical characterization using mass spectrometry NAS Workshop on the Industrialization of Biology Jonathan V. Sweedler University of Illinois Urbana, IL USA May 2014 Funding: DOE, NSF
PTM Discovery Method for Automated Identification and Sequencing of Phosphopeptides Using the Q TRAP LC/MS/MS System
 Application Note LC/MS PTM Discovery Method for Automated Identification and Sequencing of Phosphopeptides Using the Q TRAP LC/MS/MS System Purpose This application note describes an automated workflow
FPO. Label-Free Molecular Imaging. Innovation with Integrity. Discover, localize and quantify biochemical changes and molecular markers
 FPO Label-Free Molecular Imaging Discover, localize and quantify biochemical changes and molecular markers Innovation with Integrity Mass Spectrometry Bruker, the global leader in MALDI-MS technology,
Supporting information for: Memory Efficient. Principal Component Analysis for the Dimensionality. Reduction of Large Mass Spectrometry Imaging
 Supporting information for: Memory Efficient Principal Component Analysis for the Dimensionality Reduction of Large Mass Spectrometry Imaging Datasets Alan M. Race,,, Rory T. Steven,, Andrew D. Palmer,,,
MALDI Imaging Mass Spectrometry
 MALDI Imaging Mass Spectrometry Nan Kleinholz Mass Spectrometry and Proteomics Facility The Ohio State University Mass Spectrometry and Proteomics Workshop What is MALDI Imaging? MALDI: Matrix Assisted
Rapid Screening and Quantitation of Pesticide Residues in Cannabis by Modified QuEChERS and LC-MS-MS
 PO-CON689E Rapid Screening and Quantitation of Pesticide Residues in Cannabis by Modified QuEChERS and LC-MS-MS ASMS 206 TP 20 Jeffrey H. Dahl, Julie Kowalski 2, Derek Laine, and Jason Zitzer Shimadzu
Simple Cancer Screening Based on Urinary Metabolite Analysis
 FEATURED ARTICLES Taking on Future Social Issues through Open Innovation Life Science for a Healthy Society with High Quality of Life Simple Cancer Screening Based on Urinary Metabolite Analysis Hitachi
N-terminal charge-driven de novo sequencing by using ASDF-incorporated Curved Field Reflectron
 PO-CON1534E N-terminal charge-driven de novo sequencing by using ASDF-incorporated Curved Field Reflectron ASMS 2015 ThP 361 Yuzo Yamazaki 1 ; Keisuke Shima 1 ; Atsushi Kitanaka 2 ; Masahiro Miyashita
Analysis of Peptides via Capillary HPLC and Fraction Collection Directly onto a MALDI Plate for Off-line Analysis by MALDI-TOF
 Analysis of Peptides via Capillary HPLC and Fraction Collection Directly onto a MALDI Plate for Off-line Analysis by MALDI-TOF Application Note 219 Joan Stevens, PhD; Luke Roenneburg; Kevin Fawcett (Gilson,
Designer Cannabinoids
 Liquid Chromatography Mass Spectrometry SSI-LCMS-010 Designer Cannabinoids LCMS-8030 Summary A rapid LC-MS-MS method for determination of designer cannabinoids in smokeable herbs was developed. Background
An optical dosimeter for the selective detection of gaseous phosgene with ultra-low detection limit
 Supporting information for An optical dosimeter for the selective detection of gaseous phosgene with ultra-low detection limit Alejandro P. Vargas, Francisco Gámez*, Javier Roales, Tània Lopes-Costa and
Solving practical problems. Maria Kuhtinskaja
 Solving practical problems Maria Kuhtinskaja What does a mass spectrometer do? It measures mass better than any other technique. It can give information about chemical structures. What are mass measurements
Vitamin D3 and related compounds by ESI and APCI
 Liquid Chromatography Mass Spectrometry SSI-LCMS-9 Vitamin D and related compounds by ESI and APCI LCMS-8 Summary Vitamin D and related compounds were measured by LC-ESI/APCI-MS-MS. Background Accurate
MS-IMS (MALDI-IMAGING)?
?") MS-IMS (MALDI-IMAGING)? Protein Chemistry/Proteomics and Peptide Synthesis and Array Unit Biomedicum Helsinki and Haartman Institute E-Mail: marc.baumann@helsinki.fi (http://research.med.helsinki.fi/corefacilities/proteinchem)
MS-IMS (MALDI-IMAGING)? Protein Chemistry/Proteomics and Peptide Synthesis and Array Unit Biomedicum Helsinki and Haartman Institute E-Mail: marc.baumann@helsinki.fi (http://research.med.helsinki.fi/corefacilities/proteinchem)
Shimadzu s Guide to Vial Selection. Not all vials are the same
 Shimadzu s Guide to Vial Selection Not all vials are the same The perfect vial? Struggling to find the right vial or microtiter plate? You are not alone! What material? Are all vials the same? The Perfect
Liquid Chromatograph Mass Spectrometer LCMS-8040 C146-E188E
 Liquid Chromatograph Mass Spectrometer LCMS-8040 C146-E188E Ultra-High Sensitivity By incorporating newly improved ion optics and collision cell technology, the LCMS-8040 provides higher multiple reaction
MALDI-TOF. Introduction. Schematic and Theory of MALDI
 MALDI-TOF Proteins and peptides have been characterized by high pressure liquid chromatography (HPLC) or SDS PAGE by generating peptide maps. These peptide maps have been used as fingerprints of protein
An Alternative Approach: Top-Down Bioanalysis of Intact Large Molecules Can this be part of the future? Lecture 8, Page 27
 An Alternative Approach: Top-Down Bioanalysis of Intact Large Molecules Can this be part of the future? Lecture 8, Page 27 Top-down HRAM Bioanalysis of Native Proteins/Molecules Relative Abundance 100
Application Note # MT-111 Concise Interpretation of MALDI Imaging Data by Probabilistic Latent Semantic Analysis (plsa)
") Application Note # MT-111 Concise Interpretation of MALDI Imaging Data by Probabilistic Latent Semantic Analysis (plsa) MALDI imaging datasets can be very information-rich, containing hundreds of mass
Application Note # MT-111 Concise Interpretation of MALDI Imaging Data by Probabilistic Latent Semantic Analysis (plsa) MALDI imaging datasets can be very information-rich, containing hundreds of mass
Liquid Chromatograph Mass Spectrometer LCMS-8050 C146-E232A
 Liquid Chromatograph Mass Spectrometer LCMS-85 C146-E232A Speed and Sensitivity Beyond Comparison Continuing the evolution of Shimadzu's UF technology, Shimadzu introduces the LCMS-85 triple quadrupole
Determination of Amantadine Residues in Chicken by LCMS-8040
 Liquid Chromatography Mass Spectrometry Determination of Amantadine Residues in Chicken by LCMS-8040 A method for the determination of amantadine in chicken was established using Shimadzu Triple Quadrupole
Fundamental Studies of Matrix-Assisted Laser Desorption/Ionization, Using Time-of-Flight Mass Spectrometry to Identify Biological Molecules
 UCRL-ID-126246 Fundamental Studies of Matrix-Assisted Laser Desorption/Ionization, Using Time-of-Flight Mass Spectrometry to Identify Biological Molecules D. Eades, D. Wruck, H. Gregg November 11, 1996
Choosing the metabolomics platform
 Choosing the metabolomics platform Stephen Barnes, PhD Department of Pharmacology & Toxicology University of Alabama at Birmingham sbarnes@uab.edu Challenges Unlike DNA, RNA and proteins, the metabolome
Supporting Information
 Supporting Information Mass Spectrometry Imaging Shows Cocaine and Methylphenidate have Opposite Effects on Major Lipids in Drosophila Brain Mai H. Philipsen *, Nhu T. N. Phan *, John S. Fletcher *, Per
Target and Non-target Analysis of Metabolites in Urine Using Scan/MRM and GC/MS/MS
 PO-CON44E Target and Non-target Analysis of Metabolites in Urine Using Pittcon 04 090-P Shuichi Kawana, Kenichi Obayashi, Katsuhiro Nakagawa, Yuki Hasegawa, Seiji Yamaguchi, Laura Chambers, Zhuangzhi Max
MALDI-IMS (MATRIX-ASSISTED LASER DESORPTION/IONIZATION
 MALDI-IMS (MATRIX-ASSISTED LASER DESORPTION/IONIZATION IMAGING MASS SPECTROMETER) IN TISSUE STUDY YANXIAN CHEN MARCH 8 TH, WEDNESDAY. SEMINAR FOCUSING ON What is MALDI imaging mass spectrometer? How does
Analysis of Triglycerides in Cooking Oils Using MALDI-TOF Mass Spectrometry and Principal Component Analysis
 Analysis of Triglycerides in Cooking Oils Using MALDI-TOF Mass Spectrometry and Principal Component Analysis Kevin Cooley Chemistry Supervisor: Kingsley Donkor 1. Abstract Triglycerides are composed of
Fundamentals of Soft Ionization and MS Instrumentation
 Fundamentals of Soft Ionization and MS Instrumentation Ana Varela Coelho varela@itqb.unl.pt Mass Spectrometry Lab Analytical Services Unit Index Mass spectrometers and its components Ionization methods:
CS Introducing the CS 1600 Intraoral Camera Revolutionary technology. Superior workflow.
 CS 1600 Introducing the CS 1600 Intraoral Camera Revolutionary technology. Superior workflow. Early caries identfication for healthier patients Earliest caries identification Early detection is the most
Mass Spectrometry. Actual Instrumentation
 Mass Spectrometry Actual Instrumentation August 2017 See also http://www.uni-bielefeld.de/chemie/analytik/ms f additional infmation 1. MALDI TOF MASS SPECTROMETRY ON THE ULTRAFLEX 2 2. ESI MASS SPECTROMETRY
Isolation of pure cell populations from healthy and
 Direct Analysis of Laser Capture Microdissected Cells by MALDI Mass Spectrometry Baogang J. Xu and Richard M. Caprioli Department of Chemistry, Vanderbilt University, Nashville, Tennessee, USA Melinda
Supporting Information
 Supporting Information Wiley-VCH 2006 69451 Weinheim, Germany Tissue Imaging at Atmospheric Pressure using Desorption Electrospray Ionization (DESI) Mass Spectrometry Justin M. Wiseman, Demian R. Ifa,
The use of mass spectrometry in lipidomics. Outlines
 The use of mass spectrometry in lipidomics Jeevan Prasain jprasain@uab.edu 6-2612 utlines Brief introduction to lipidomics Analytical methodology: MS/MS structure elucidation of phospholipids Phospholipid
The use of random projections for the analysis of mass spectrometry imaging data Palmer, Andrew; Bunch, Josephine; Styles, Iain
 The use of random projections for the analysis of mass spectrometry imaging data Palmer, Andrew; Bunch, Josephine; Styles, Iain DOI: 10.1007/s13361-014-1024-7 Citation for published version (Harvard):
MASS SPECTROMETRY BASED METABOLOMICS. Pavel Aronov. ABRF2010 Metabolomics Research Group March 21, 2010
 MASS SPECTROMETRY BASED METABOLOMICS Pavel Aronov ABRF2010 Metabolomics Research Group March 21, 2010 Types of Experiments in Metabolomics targeted non targeted Number of analyzed metabolites is limited
Technical Report. Abstract: 2. Experiment. 1. Introduction. Hiroshi Tsugawa 1,*, Eiichiro Fukusaki 1
 C146-E217 Technical Report Effectiveness of Metabolomics Research Using Gas Chromatograph / Quadrupole Mass Spectrometer with High-Sensitivity and High-Speed Scanning Hiroshi Tsugawa 1,*, Eiichiro Fukusaki
John Haselden 1, Gordon Dear 1, Jennifer H. Granger 2, and Robert S. Plumb 2. 1GlaxoSmithKline, Ware, UK; 2 Waters Corporation, Milford, MA, USA
 Challenges of Polar Compound Analysis Routine LC/MS-based analyses usually rely on using reversed-phase column chemistries (e.g. C 18, C 8, C 4 ) in their LC methodology. However, one of the shortcomings
SCS Mass Spectrometry Laboratory
 SCS Mass Spectrometry Laboratory Contact Information Staff 31 Noyes Laboratory (8:00-5:00 M-F) 217-333-2545 http://scs.illinois.edu/massspec/ Furong Sun (frs@illinois.edu) Furong Sun Director Training
New Mass Spectrometry Tools to Transform Metabolomics and Lipidomics
 New Mass Spectrometry Tools to Transform Metabolomics and Lipidomics July.3.13 Ken Miller Vice President of Marketing, Life Sciences Mass Spectrometry 1 The world leader in serving science Omics & the
Metabolomics: quantifying the phenotype
 Metabolomics: quantifying the phenotype Metabolomics Promises Quantitative Phenotyping What can happen GENOME What appears to be happening Bioinformatics TRANSCRIPTOME What makes it happen PROTEOME Systems
Automated Sample Preparation/Concentration of Biological Samples Prior to Analysis via MALDI-TOF Mass Spectroscopy Application Note 222
 Automated Sample Preparation/Concentration of Biological Samples Prior to Analysis via MALDI-TOF Mass Spectroscopy Application Note 222 Joan Stevens, Ph.D.; Luke Roenneburg; Tim Hegeman; Kevin Fawcett
Desorption Electrospray Ionization Coupled with Ultraviolet Photodissociation for Characterization of Phospholipid Isomers in Tissue Sections
 Desorption Electrospray Ionization Coupled with Ultraviolet Photodissociation for Characterization of Phospholipid Isomers in Tissue Sections Dustin R. Klein, Clara L. Feider, Kyana Y. Garza, John Q. Lin,
2. Ionization Sources 3. Mass Analyzers 4. Tandem Mass Spectrometry
 Dr. Sanjeeva Srivastava 1. Fundamental of Mass Spectrometry Role of MS and basic concepts 2. Ionization Sources 3. Mass Analyzers 4. Tandem Mass Spectrometry 2 1 MS basic concepts Mass spectrometry - technique
Biological Mass spectrometry in Protein Chemistry
 Biological Mass spectrometry in Protein Chemistry Tuula Nyman Institute of Biotechnology tuula.nyman@helsinki.fi MASS SPECTROMETRY is an analytical technique that identifies the chemical composition of
CAMAG TLC-MS INTERFACE
 CAMAG TLC-MS INTERFACE 93.1 249.2 40 30 97.1 20 10 250.2 0 200 400 m/z WORLD LEADER IN PLANAR-CHROMATOGRAPHY Identification and elucidation of unknown substances by hyphenation of TLC / HPTLC and MS The
DiscovIR-LC. Application Note 026 May 2008 READING TEA LEAVES SUMMARY INTRODUCTION
 TM DiscovIR-LC Deposition and Detection System Application Note 026 May 2008 READING TEA LEAVES The DiscovIR-LC is a powerful new tool for materials analysis. When connected to the outlet of an LC column,
Impact of Chromatography on Lipid Profiling of Liver Tissue Extracts
 Impact of Chromatography on Lipid Profiling of Liver Tissue Extracts Application Note Clinical Research Authors Mark Sartain and Theodore Sana Agilent Technologies, Inc. Santa Clara, California, USA Introduction
LC/MS Method for Comprehensive Analysis of Plasma Lipids
 Application Note omics LC/MS Method for Comprehensive Analysis of Plasma s Authors Tomas Cajka and Oliver Fiehn West Coast Metabolomics Center, University of California Davis, 451 Health Sciences Drive,
Methods in Mass Spectrometry. Dr. Noam Tal Laboratory of Mass Spectrometry School of Chemistry, Tel Aviv University
 Methods in Mass Spectrometry Dr. Noam Tal Laboratory of Mass Spectrometry School of Chemistry, Tel Aviv University Sample Engineering Chemistry Biology Life Science Medicine Industry IDF / Police Sample
Biological Mass Spectrometry. April 30, 2014
 Biological Mass Spectrometry April 30, 2014 Mass Spectrometry Has become the method of choice for precise protein and nucleic acid mass determination in a very wide mass range peptide and nucleotide sequencing
Join the mass movement towards mass spectrometry
 Join the mass movement towards mass spectrometry Thermo Scientific ISQ EC single quadrupole mass spectrometer Embrace the power of mass spectrometry Achieving a comprehensive understanding of the samples
Quadrupole and Ion Trap Mass Analysers and an introduction to Resolution
 Quadrupole and Ion Trap Mass Analysers and an introduction to Resolution A simple definition of a Mass Spectrometer A Mass Spectrometer is an analytical instrument that can separate charged molecules according
Supplementary Information
 Supplementary Information Molecular imaging of brain localization of liposomes in mice using MALDI mass spectrometry Annabelle Fülöp 1,2, Denis A. Sammour 1,2, Katrin Erich 1,2, Johanna von Gerichten 4,
Edgar Naegele. Abstract
 Simultaneous determination of metabolic stability and identification of buspirone metabolites using multiple column fast LC/TOF mass spectrometry Application ote Edgar aegele Abstract A recent trend in
PosterREPRINT RAPID, SELECTIVE SCREENING OF URINE SAMPLES FOR GLUCURONIDES BY LC/MS/MS INTRODUCTION ABSTRACT
 ABSTRACT The traditional study of in vivo drug metabolism in plasma or urine samples is often complicated by the presence of many endogenous compounds. Several mass spectrometric techniques are often applied
Principles of Shotgun Lipidomics
 Principles of Shotgun Lipidomics Xianlin Han Diabetes and Obesity Research Center Sanford-Burnham Medical Research Institute Lake Nona Orlando, FL 32827 What is shotgun lipidomics? Original definition
MALDI Mass Spectrometry: A Label-Free Solution for Ultra-High-Throughput Screening
 MALDI Mass Spectrometry: A Label-Free Solution for Ultra-High-Throughput Screening MIPTEC Conference 2016 Meike Hamester, Jens Fuchser Bruker Daltonik, Bremen 1 MALDI PharmaPulse for: Biochemical Screening
Phospholipid characterization by a TQ-MS data based identification scheme
 P-CN1716E Phospholipid characterization by a TQ-MS data based identification scheme ASMS 2017 MP-406 Tsuyoshi Nakanishi 1, Masaki Yamada 1, Ningombam Sanjib Meitei 2, 3 1 Shimadzu Corporation, Kyoto, Japan,
Diagnostic Dermatology & Dermatologic Surgery Overview
 Diagnostic Dermatology & Dermatologic Surgery Overview A comprehensive range of innovative products & accessories for dermatologic diagnosis & surgery Clinical imaging The Fully integrated patient management
[ APPLICATION NOTE ] High Sensitivity Intact Monoclonal Antibody (mab) HRMS Quantification APPLICATION BENEFITS INTRODUCTION WATERS SOLUTIONS KEYWORDS
![[ APPLICATION NOTE ] High Sensitivity Intact Monoclonal Antibody (mab) HRMS Quantification APPLICATION BENEFITS INTRODUCTION WATERS SOLUTIONS KEYWORDS](/thumbs/79/80328542.jpg "[ APPLICATION NOTE ] High Sensitivity Intact Monoclonal Antibody (mab) HRMS Quantification APPLICATION BENEFITS INTRODUCTION WATERS SOLUTIONS KEYWORDS") Yun Wang Alelyunas, Henry Shion, Mark Wrona Waters Corporation, Milford, MA, USA APPLICATION BENEFITS mab LC-MS method which enables users to achieve highly sensitive bioanalysis of intact trastuzumab
Yun Wang Alelyunas, Henry Shion, Mark Wrona Waters Corporation, Milford, MA, USA APPLICATION BENEFITS mab LC-MS method which enables users to achieve highly sensitive bioanalysis of intact trastuzumab
Food protein powders classification and discrimination by FTIR spectroscopy and principal component analysis
 APPLICATION NOTE AN53037 Food protein powders classification and discrimination by FTIR spectroscopy and principal component analysis Author Ron Rubinovitz, Ph.D. Thermo Fisher Scientific Key Words FTIR,
[ APPLICATION NOTE ] APPLICATION BENEFITS INTRODUCTION WATERS SOLUTIONS KEYWORDS
![[ APPLICATION NOTE ] APPLICATION BENEFITS INTRODUCTION WATERS SOLUTIONS KEYWORDS](/thumbs/89/100150905.jpg "[ APPLICATION NOTE ] APPLICATION BENEFITS INTRODUCTION WATERS SOLUTIONS KEYWORDS") [ APPLICATI TE ] Ion Mobility-enabled Data-dependent Experiments Distinguishing Co-eluting Isomeric Metabolites Using an IMS-QTof Mass Spectrometer Jayne Kirk, 1 Russell Mortishire Smith, 1 Robert Beecher,
[ APPLICATI TE ] Ion Mobility-enabled Data-dependent Experiments Distinguishing Co-eluting Isomeric Metabolites Using an IMS-QTof Mass Spectrometer Jayne Kirk, 1 Russell Mortishire Smith, 1 Robert Beecher,
Qualitative & Quantitative MS imaging technique for BAK distribution in eye. Stauber Jonathan, PhD CSO ImaBiotech
 Q Qualitative & Quantitative MS imaging technique for BAK distribution in eye Stauber Jonathan, PhD CSO ImaBiotech EBF congress 2012, Bruxelles Q An innovative company with an innovative technology WHAT
Determination of Copper in Green Olives using ICP-OES
 Application Note Food and Agriculture Determination of Copper in Green Olives using ICP-OES Intelligent Rinse function reduced analysis time by 60%, saving 191.4 L of argon Authors Ryley Burgess, Agilent
PIF: Precursor Ion Fingerprinting Searching for a Structurally Diagnostic Fragment Using Combined Targeted and Data Dependent MS n
 Application Note: 441 PIF: Precursor Ion Fingerprinting Searching for a Structurally Diagnostic Fragment Using Combined Targeted and Data Dependent MS n Julie A. Horner, Rohan A. Thakur, Thermo Fisher
Future of Metabolomics. Issues in metabolomics research
 Knowledge that will change your world Ist UAB Metabolomics Workshop July 22 25, 2013 Future of Metabolomics Stephen Barnes, PhD Director, Targeted Metabolomics and Proteomics Laboratory Issues in metabolomics
Mass Spectrometry based metabolomics
 Mass Spectrometry based metabolomics Metabolomics- A realm of small molecules (
Using Software Tools to Improve the Detection of Impurities by LC/MS. Application Note. Christine Miller Agilent Technologies.
 Using Software Tools to Improve the Detection of Impurities Application Note Christine Miller Introduction The analysis of raw materials and finished products for or impurities presents a challenge in
AbsoluteIDQ p150 Kit. Targeted Metabolite Identifi cation and Quantifi cation. Bringing our targeted metabolomics expertise to your lab.
 AbsoluteIDQ p150 Kit Targeted Metabolite Identifi cation and Quantifi cation Bringing our targeted metabolomics expertise to your lab. The Biocrates AbsoluteIDQ p150 mass spectrometry Assay Preparation
ToF-SIMS for Biological Research Sample Preparation Techniques
 ToF-SIMS for Biological Research Sample Preparation Techniques Peter Sjövall SP Technical Research Institute of Sweden Borås, Sweden Göteborg Borås SP Technical Research Institute of Sweden www.sp.se Chemistry