Developing Mass Spectrometry-Based Analytical Methodologies for Analyzing Complex Protein and Lipid Samples
|
|
|
- Thomasina Allyson Carpenter
- 5 years ago
- Views:
Transcription
1 Developing Mass Spectrometry-Based Analytical Methodologies for Analyzing Complex Protein and Lipid Samples Weimin Hou Thesis submitted to the Faculty of Graduate and Postdoctoral Studies in partial fulfillment of the requirements for the degree of Doctor of Philosophy In the Ottawa-Carleton Chemistry Institute Department of Chemistry, University of Ottawa Ottawa, Ontario, Canada 2013 Candidate Weimin Hou Supervisors Dr. Daniel Figeys Dr. Natalie Goto Weimin Hou, Ottawa, Canada, 2013
2 Abstract Mass spectrometry has increasingly become the method of choice for the analysis of complex biological samples, including proteins and lipids. This thesis describes the development of MS-based analytical methodologies for the analysis of complex proteomic and lipidomic samples. Chapter 3 describes the development of microfluidic proteomic reactors, in the formats of SCX reactor, SCX 96-well plate reactor, and SAX reactor, for the enzymatic digestion of complex proteomic samples for subsequent LC-MS/MS analysis. These microfluidic proteomic reactors greatly simplified the enzymatic digestion of complex proteomic samples by combining multiple processing steps, such as rapid extraction and enrichment of proteins. Furthermore, chemical and enzymatic treatments of proteins were all performed in a few nanoliters effective volume, resulting in an increased protein digestion efficacy. After the protein digestion process, the resulting peptides were eluted in buffers that were compatible with HPLC-MS/MS analysis. In chapter 4, a methodology based on nano-hplc-esi-ms/ms for the analysis of PAF and LPC lipid species is described. In this method, lipid extracts from biological samples were separated by nano-flow HPLC prior to being introduced into a Q-TRAP 2000 mass spectrometer, where the lipid species of interest were detected using a precursor ion scan at m/z 184. Absolute quantitation of PAF family lipid species were performed with standard addition method, where 5 standard solutions containing ng each of C16:0, C18:0 PAF and C16:0, C18:0 lyso-paf were used in the experiment. Further, the spiking of identical amount of non-endogenous C13:0 LPC at time of extraction allow the relative comparisons of other LPC lipid species of interest between different samples. The developed methods were employed to analyze the changes of PAF and LPC lipid species in NGFdifferentiated PC12 cells, in the posterior/entorhinal cortex of AD patients and TgCRND8 transgenic mice, and over the course of 24 hour exposure of human hnt neurons to Aβ 42 treatment, respectively, in comparison to controls. ii
3 Chapter 5 describes the development of a novel shotgun lipidomic methodology for the determination of stereospecificity of diacyl glycerophospholipids including glycerophosphatidic acids (PA), glycerophosphoserines (PS), glycerophosphoglycerols (PG), glycerophosphoinositols(pi), and glycerophosphoethanolamines (PE), which can be conventionally ionized under negative ion mode. The stereospecificity of diacyl glycerophospholipids was determined based on the relative abundance of the lyso-form fragment ions, attributed to the neutral loss of fatty acyl moieties. The fragmentation patterns of a variety of diacyl glycerophospholipid standards were first fully examined over a wide range of collision energy. We observed that lyso-form fragment ions corresponding to the neutral loss of fatty acyl moieties attached to the sn2 position as free fatty acids ([M-Sn2] - ) and as ketenes ([M-(Sn2-H 2 O)] - ) exhibited consistently higher intensity than their counter part ions due to the neutral loss of fatty acyl moieties attached to the sn1 position ([M-Sn1] - and [M-(Sn1-H 2 O)] - ). We then examined the product ion spectra of diacyl glycerophospholipids recorded from lipid extracts of rat hepatoma cells, where the stereospecific information of these lipids was conclusively determined. iii
4 Acknowledgements I am deeply grateful to my supervisor Dr. Daniel Figeys for giving me the opportunity to pursue a Ph.D. in his laboratory. I would like to thank him for his time, advice and encouragement over the years. I would also like to thank my thesis co-supervisor Dr. Natalie Goto and CIHR training program in lipidomics co-mentor Dr. Steffany Bennett for their support and suggestions over the years. Over the years I have worked with many colleagues in Dr. Figeys lab. I would like to take this opportunity to thank all of them for their kindly help and making the lab an enjoyable place. Specially, I would like to thank Dr. Martin Ether, Dr. Hu Zhou and Dr. Jeff C. Smith. I would also like to thank NSERC, OGS, University of Ottawa, CIHR lipid training grant and my supervisor Dr. Daniel Figeys for financially assistance. Finally, I would like to thank my wife, my parents, and my parents-in-law for their support and unconditional love. iv
5 Table of Contents Title Page Abstract Acknowledgement Table of Contents List of Figures List of Tables Abbreviations i ii iv v xiii xix xx Chapter 1 Introduction 1.1 MS-based proteomics The general picture Bottom-up/shotgun proteomic experiments Protein/peptide separation Protein/peptide identification Quantitative proteomics Thesis objective: proteomic reactor development MS-based lipidomics The general picture 12 v
6 1.2.2 Structural diversity of lipids Structure elucidation of glycerophospholipids ESI-MS/MS of protonated glycerophospholipids ESI-MS/MS of deprotonated glycerophospholipids ESI-MS/MS of metal ion adducted glycerophospholipids Glycerophospholipid identification by multiple precursor ion scans and neutral loss scans Glycerophospholipid identification by multiple stages tandem mass spectrometry Characterization of the fatty acyl constituents of glycerophospholipids Glycerophospholipid identification with or without separation Lipid quantification Absolute lipid quantification Relative lipid quantification Stable isotope labelling through metabolism Thesis objectives in lipidomics Development of a nanoflow rate HPLC-ESI-MS/MS methodology for the analysis of Platelet Activating Factor (PAF) family and lyso-glycerophosphocholine (LPC) lipids Development of MS-based methodology for determining the stereospecificity of diacyl glycerophospholipids 27 vi
7 References 44 Chapter 2 Experiments 2.1 Proteomic experiments Materials Cell culture and cell lysis Protein samples preparation/digestion Protein digestion using proteomic reactor In-solution protein digestion HPLC-MS/MS experiments Data analysis Lipidomic experiments Materials Cell culture, tissue samples and lipid extraction HPLC-ESI-MS/MS experiments HPLC-ESI-MS/MS system Lipid samples preparation Data analysis Shotgun lipidomics (ESI-MS/MS) 70 References 72 Chapter 3 Developing proteomic reactor techniques for processing complex protein samples vii
8 3.1 Developing a SCX proteomic reactor Introduction Experimental Protein samples preparation and LC-MS/MS data analysis Proteomic reactor assembly and protein processing on reactor Digesting protein samples on the SCX proteomic reactor Results and discussion Characterization of the SCX proteomic reactor The impact of reduction/alkylation reaction on the performance of the SCX proteomic reactor Comparing the performance of the SCX proteomic reactor to in-solution digestion approach Conclusions SCX Plate proteomic reactor Introduction Protein samples preparation and LC-MS/MS data analysis Characterization of the 96 well plate reactor Processing protein samples using the 96-well plate Coupling of the plate reactor with SEC Discussion High confidence in protein identification 95 viii
9 Efficacy of protein fractionation with SEC chromatography Factors limiting the performance of the plate reactor Conclusions Developing a SAX proteomic reactor Introduction Protein samples preparation and LC-MS/MS data analysis Construction and characterization of SAX proteomic reactor Development of a SAX reactor using a mixture of standard proteins A comparison of the performance of SAX and SCX reactors using trypsin for processing yeast samples Conclusions Chapter summary 108 References 119 Chapter 4 Developing a nano-flow HPLC-ESI-MS/MS methodology for the analysis of Platelet Activating Factor (PAF) family and lyso-glycerophosphocholine (LPC) lipids 4.1 Developing a nano-flow HPLC-ESI-MS/MS methodology for the analysis of Platelet Activating Factor (PAF) family of lipids over the course of neuronal differentiation Introduction Experiments 126 ix
10 4.1.3 Profiling glycerophospholipid changes by 2-D mapping Differentiation of PAF species from other isobaric lipid species Quantitation of PAF family species based on standard addition approach Conclusions Applying nano-flow HPLC-ESI-MS/MS methodology for the analysis of Platelet Activating Factor (PAF) family and lyso-glycerophosphocholine (LPC) lipid species in complex biological samples Introduction Experiments Results Metabolism of C16:0 PAF is elevated in the posterior/entorhinal cortex of AD patients Disruption of C16:0 PAF metabolism is an early event in TgCRND8 mice C16:0 PAF accumulates in human neurons treated with soluble Aβ 42 oligomers Discussions Chapter summary 148 References 157 Chapter 5 Developing novel MS-based approach for structural elucidation of diacyl glycerophospholipids 5.1 Introduction Experiments 168 x
11 5.3 Fragmentation patterns of diacyl glycerophospholipid standards under different collision energies Overview Fragmentation patterns of molecular anions diacyl PA as a function of collision energy Fragmentation patterns of molecular anions of diacyl PS, PG, PI, and PE as a function of collision energy Characterization of diacyl glycerophospholipids in lipid extracts from rat hepatoma cells Conclusions 177 References 196 Chapter 6 Conclusions 6.1 The development of proteomic reactors Specialized proteomic reactor techniques to address different biological problems Developing nano-hplc-esi-ms/ms for the analysis of platelet activating factor (PAF) and lyso-phosphocholine (LPC) lipid species The development of shotgun lipidomic methodology for structure elucidation of diacyl glycerophospholipids Future perspectives 204 xi
12 References 209 Statements of author contributions 211 List of publications 214 xii
13 List of Figures Figure Bottom-up and top-down proteomic approaches 34 Figure Electrospray ionization (ESI) 35 Figure CAD and ECD cleave on different bonds 36 Figure Quantitative proteomics: stable-isotope labeling of protein/peptide via chemical labeling. (a) Enzymatic labeling; (b) Isotope-coded affinity tags (ICAT); (c) Isobaric tags for relative and absolute quantification (itraq) 37 Figure Quantitative proteomics: stable-isotope labelling with amino acids in cell culture (SILAC) 38 Figure Quantitative proteomics: label free approaches. 39 Figure Diagram of the structure of glycerophospholipids, a sub-class of lipids 40 Figure Representative lipid structures of glycerophospholipids 41 Figure The MS-based method for the identification of glycerophospholipids 42 Figure The MS-based method for quantitative analysis of glycerophospholipids 43 Figure Schematic representation of sample treatment steps using SCX proteomic reactor 87 Figure Characterization of the SCX proteomic reactor 88 Figure Effect of DDT reduction and iodoacetamide alkylation on the identification of peptides from mouse P19 total cell lysate 89 xiii
14 Figure Evaluation of the performance of the proteomic reactors for processing complex proteomic samples 90 Figure Characterization of the 96-well SCX plate reactor 99 Figure (a) The work flow of sample processing through the plate reactor. (b) The coupling of the reactor plate with size exclusion chromatographic fractionation of proteins 100 Figure (a) The size exclusion chromatographic separation of MCF7 whole cell lysate recorded at 220 nm using a variable wavelength detector. (b) The corresponding total number of proteins identified in each of these 35 fractions 101 Figure The distribution of proteins identified as a function of numbers of unique peptides 102 Figure SDS-PAGE Analysis of flow-through, wash and elute fractions of SAX reactor using standard proteins 114 Figure Flowchart of protein processing steps using SAX proteomic reactor. 115 Figure Reproducibility of unique peptide (a) and protein (b) identified using SAX and SCX reactors 116 Figure (a) Overlap between unique peptides and proteins identified with SAX and SCX reactors. (b) Differences in sequence coverage for protein YJR009C and YHR174W identified with SAX reactor (blue) and xiv
15 SCX reactor (red) 117 Figure Theoretical pi distributions of unique peptides and proteins identified by SAX and SCX reactors 118 Figure 4.1.1Enzymatic and non-enzymatic generation of PAF family members. 136 Figure Glycerophospholipid profiles of PC12 cells over the course of differentiation to a neuronal phenotype 137 Figure Glycerophosphocholine profiles of PC12 cells over the course of differentiation to a neuronal phenotype 138 Figure Identification of key PAF species from PC12 cells and PC12 cells differentiated to a neuronal phenotype 139 Figure Identification of PAF family species from the isobaric lipid species using extracted ion chromatography 140 Figure Quantitation of PAF species from PC12 cells and PC12 cells differentiated to a neuronal phenotype 141 Figure Validation of range of linearity of the developed standard addition method for PAF species quantitation using an internal standard (C13:0 LPC) and an endogenous standard (C16:0 LPC) 142 Figure Specific PAF metabolites accumulate in AD tissue. 152 Figure The identity of C16:0 PAF and C16:0 lyso-paf were verified by co-elution with deuterated standards 153 xv
16 Figure C16:0-PAF and its immediate precursor and metabolite C16:0-lyso-PAF accumulate in AD cortex 154 Figure C16:0 PAF and lyso-paf concentrations are elevated in the entorhinal cortex of TgCNRD8 mice expressing mutant human amyloid precursor protein 155 Figure C16:0 lyso-paf and C16:0 PAF accumulate in human neurons treated with soluble Aβ 42 oligomers 156 Figure 5.1 Product ion spectrum of PA (17:0/14:1) recorded on a hybrid quadrupole time-of-flight mass spectrometer (QSTAR Pulsar) at collision energy of 20, 30, 40, and 50 ev, respectively 185 Figure 5.2 (a) Absolute intensities (ion counts) of molecular ions, polar head group (m/z ), and fatty acyl anions (m/z and ) of PA (17:0/14:1) plotted vs. collision energy. (b) Absolute intensities of lyso-form fragment ions [M-Sn1] -, [M-Sn2] -, [M-(Sn1-H 2 O)] -, and [M-(Sn2-H 2 O)] - of PA (17:0/14:1) plotted vs. collision energy. (c) Ratios of the signal intensities of [FA2] - vs. [FA1] -, [M-(Sn2-H 2 O)] - vs. [M-(Sn1-H 2 O)] -, and [M-Sn2] - vs. [M-Sn1] - of PA (17:0/14:1) 186 Figure 5.3 (a) Absolute intensities (ion counts) of lyso-form fragment ions [M-Sn1] -, [M-Sn2] -, [M-(Sn1-H 2 O)] -, and [M-(Sn2-H 2 O)] - of PA (12:0/13:0) plotted vs. collision energy. (b) Absolute intensities of lyso-form fragment ions [M-Sn1] -, [M-Sn2] -, [M-(Sn1-H 2 O)] -, and [M-(Sn2-H 2 O)] - of PA (17:0/20:4) xvi
17 plotted vs. collision energy 187 Figure 5.4 Fragmentation patterns of PA (17:0/14:1), PS (17:0/14:1), PG (17:0/14:1), PI (17:0/14:1), and PE (17:0/14:1) 188 Figure 5.5 Absolute intensities (ion counts) of lyso-form fragment ions of molecular anions of (17:0/14.1) diacylglycerophospholipids, plotted with respect to collision energy 189 Figure 5.6 Absolute intensities (ion counts) of lyso-form fragment ions plotted as a function of collision energy 190 Figure 5.7 (a) Ratios of the signal intensities of [FA2] - vs. [FA1] -, [M-(Sn2-H 2 O)] - vs. [M-(Sn1-H 2 O)] -, and [M-Sn2] - vs. [M-Sn1] - of PI (12:0/13:0) plotted vs. collision energy. (b) Ratios of the signal intensities of [FA2] - vs. [FA1] -, [M-(Sn2-H 2 O)] - vs. [M-(Sn1-H 2 O)] -, and [M-Sn2] - vs. [M-Sn1] - of PI (17:0/14:1) plotted vs. collision energy. (c) Ratios of the signal intensities of [FA2] - vs. [FA1] -, [M-(Sn2-H 2 O)] - vs. [M-(Sn1-H 2 O)] -, and [M-Sn2] - vs. [M-Sn1] - of PI (17:0/20:4) plotted vs. collision energy. 191 Figure 5.8 (a) Precursor ion spectrum for fragment ions at m/z -153 to identify molecular anions of PA, PS, PG, and PI species from lipin-1α overexpressing cell line lipid extract. (b) Precursor ion spectrum for fragment ions at m/z -196 to identify molecular anions of PE species from lipin-1α overexpressing cell line lipid extract. 192 xvii
18 Figure 5.9 The overlapped product ion spectrum of molecular anions of the isobaric lipid species PS(18:0/22:6) and PS(18:1/22:5) at m/z Figure 5.10 The overlapped product ion spectrum of molecular anions of the isobaric lipid species PI(18:0/20:4) and PI(18:1/20:3) at m/z Figure 5.11The overlapped product ion spectrum of molecular anions of the isobaric lipid species PE(18:1/20:5), PE(18:2/20:4), PE(16:0/22:6), PE(16:1/22:5), and PS(18:0/16:0) at m/z Figure 6.1 The two branches of the Kennedy pathway: the CDP-ethanolamine and the CDP-choline pathways 208 xviii
19 List of Tables Table Protein/peptide identification and protein sequence coverage obtained as using SAX and SCX reactors to process standard protein mixture 110 Table Summary of the number of unique peptides and proteins identified from yeast sample using the SAX and SCX reactors 111 Table LC-MS/MS quantitation of PAF in PC12 cells and NGF-differentiated PC12 cells 132 Table 5.1 List of diacyl glycerophospholipids identified and their relative abundance with respect to the base peak 179 xix
20 Abbreviations Aβ AD BSA CAD DAG DNA DP DTT ECD ETD EDTA ESI FAS HPLC IP LC LPC amyloid-β Alzheimer disease bovine serum albumin collision-activated dissociation diacylglycerol deoxyribonucleic acid declustering potential dithiothreitol electron capture dissociation electron transfer dissociation ethylenediaminetetraacetic acid Electrospray ionization fatty acyl scans High performance liquid chromatography Immunoaffinity purification liquid chromatography lyso-phosphatidylcholine xx
21 LTQ MALDI MDMS-SL MPIS MS MS/MS m/z NGF NL Linear ion trap quadrupole matrix-assisted laser desorption/ionization multidimensional mass spectrometry-based shotgun lipidomics multiple precursor ion scans mass spectrometry Tandem mass spectrometry mass to charge ratio nerve growth factor neutral loss NP-40 nonidet P-40 PA PAF PC PE PG PI PIS PS PBS PTM glycerophosphatidic acid platelet activating factor glycerophosphocholine glycerophosphoethanolamine glycerophosphoglycerol glycerophosphoinositol precursor ion scan glycerophosphoserine Phosphate buffered saline post-translational modification xxi
22 QTOF SAX SCX SDS SDS-Page SILAC sn TIC TLC WT XIC quadrupole time-of-flight strong anion exchange strong cation exchange sodium dodecyl sulfate Sodium dodecyl sulphate polyacrylamide gel electrophoresis Stable isotope labelling of amino acids in cell culture stereospecific number total ion current thin-layer chromatography wild-type extracted ion chromatograph xxii
23 Chapter 1 Introduction 1.1 MS-based Proteomics The general picture Proteomics can be understood as the large-scale study of gene and cellular functions at the protein level. Mass spectrometry has become the method of choice for analysis of complex protein samples (1-2). MS-based proteomics is a discipline made possible by the availability of gene and genome sequence databases, advances in analytical technologies, notably the discovery and development of soft ionization methods (3-4), and the development of database searching algorithms (5-7). These technologies have allowed highthroughput characterization and quantification of proteins in a biological sample or system. Bottom-up or shotgun proteomics is the most common MS-based method for studying proteins (1-2). In bottom-up proteomics studies (Figure 1.1.1a), a mixture of proteins is normally enzymatically cleaved into peptides. The resultant complex peptide mixture is separated using high performance liquid chromatography and other methods, prior to being analyzed by MS. In contrast to bottom-up proteomics methods, top-down MS-based proteomics (Figure 1.1.1b) refers to the analysis of intact proteins, which are not enzymatically digested prior to MS analysis (8-9). Top-down MS-based proteomic approach is normally applied to relatively simple protein samples. The analysis of intact proteins using MS provides comprehensive information on post-translational modifications (PTMs) through the identification of the intact mass of a given protein. The proteomics part covered in the thesis falls within the scope of bottom-up or shotgun proteomics. The proteome is not only complex, it is spatially, temporally, and chemically dynamic (10-11). The explicit goal of global proteomics is the systematic analysis of a large number of proteins expressed in a cell or an organism (1). Complementing global proteome profiling, targeted proteomics focuses on a predefined list of small number of proteins/peptides (12-13). These proteins/peptides are often first identified in a global proteome study. Targeted proteomics strategies have the potential for providing greater 1
24 sensitivity and allowing for the detection of lower abundance candidate peptides and proteins present (13). It is worth noting that proteomics must deal with a limited amount of starting materials. This is unlike DNA sequencing, where the samples are scalable through the polymerase chain reaction. In addition, proteomics also faces other challenges such as sample degradation, a large dynamic range, various forms of post-translational modifications, and spatial and temporary variations. All of these difficulties make any comprehensive proteomics project a daunting task Bottom-up/shotgun proteomic experiments In a typical bottom-up/shotgun proteomic experiment, protein samples are converted into an even more complex mixture of peptides, normally using trypsin. Trypsin has high activity and is a stable protease, which specifically cleaves proteins on the carboxy-terminal side of arginine and lysine residues (14-15). The tryptic peptides, as analyzed by a mass spectrometer, can result in information-rich, and easily interpretable, peptide-fragmentation spectra (2). Another advantage of digesting a protein into a set of peptides is that the physicochemical properties of the protein become less important. As long as some of the peptides originated from the protein can be sequenced by the mass spectrometer, the protein will likely be identified (2). For example, membrane proteins work well with MS-based proteomic approaches whereas they are very difficult to work with using other methods, because of their insolubility in water. A mass spectrometer consists of an ion source, a mass analyser that separates the charged analytes according to their mass-to-charge ratio (m/z), and a detector that registers the number of ions at each m/z value. Mass spectrometry measurements are carried out in the gas phase at low pressure to minimize collisions. 2
25 Electrospray ionization (ESI) (4) and matrix-assisted laser desorption/ionization (MALDI) (3) are two soft ionization techniques that allow the transfer of intact analytes such as peptides from the liquid phase (ESI) or solid phase (MALDI) to the gas phase for mass spectrometric analysis. The proteomic experiments covered in the thesis only involve electrospray ionization under positive ion mode. Because ESI transfers the analytes from solution to gas phase, it is readily coupled to high-performance liquid chromatography (HPLC) separation of peptide mixture. Briefly, as shown in Figure 1.1.2, the peptides are introduced to the electrospray tip (10 µm picotip emitter) as the eluent flow from high performance liquid chromatography (HPLC). Flow rates at the tip are typically around 200 nl/min (16-17). About +1.5 kv is applied between the electrospray emitter and the orifice of the mass spectrometer, resulting in the formation of a Taylor cone at the end of the emitter and forcing the ejection of positively charged droplets from the emitter towards the orifice of the mass spectrometer. As the droplets traverse the space between the emitter and the orifice, solvent evaporation occurs. The droplets continue to shrink until they reach the Rayleigh limit, at which point the surface tension can no longer sustain the charge and a Coulombic explosion occurs. The Coulombic explosion results in smaller droplets, which can repeat this process, until peptide ions are in the gas phase (4). These peptide ions can be singly or multiply charged, designated as (M + nh) n+, where M refers to the mass of the peptide, H + is the mass of a proton, and n is the charge (number of protons). Doubly and triply charged peptide ions typically result in informationrich fragmentation spectra, and are normally used for peptide/protein identification. In proteomics, ESI is often used for the analysis of complex peptide samples, where it is mostly coupled with hybrid instruments such as Orbitrap and QqTOF to perform MS, MS/MS, and MS n experiments, and with triple quadruple instruments to perform multiple reaction monitoring (MRM) and single reaction monitoring (SRM) experiments. Typical shotgun proteomics employs a series of MS and MS/MS for peptide identification. A MS spectrum is first acquired to survey the m/z of the analytes present in the sample. Then, a series of MS/MS spectra are generated for selected m/z (precursors) from the MS spectrum. In MS/MS, the precursor ion is first isolated, and then fragmented 3
26 into smaller fragments, which are then subjected to mass analysis. For LC-MS/MS, the process is repeated for the duration of the LC separation of the peptide mixture. In shotgun proteomic experiments, peptide fragmentation is typically achieved using collision-activated dissociation (CAD) (2), which involves colliding the peptide ions with neutral atoms or molecules in the gas phase. Alternatively, electron capture dissociation (ECD) (18-20), which involves attaching low energy electrons to multiply charged protein/peptide ions, can also be employed for peptide fragmentation. As shown in Figure 1.1.3, CAD and ECD cleave on different sites and therefore result in different type of fragment ions. CAD cleaves the peptide bond and results in b ions when the charge is retained by the amino-terminal fragment, or y ions when it is retained by the carboxyterminal fragment (2). ECD cleaves the N-Cα bond and results in c ions when the charge is retained by the amino-terminal fragment, or z ions when the charge is retained by the carboxy-terminal fragment (21). ECD generates more extensive fragmentation than CAD and therefore provides better sequence coverage of larger and highly charged analytes (18). As a result, ECD is normally integrated with top-down proteomic experiments. The electronbased fragmentation methods have also shown great promise for improved characterization of labile PTMs such as phosphorylation (22-23). It should be noted that knowing the fragmentation pattern of a peptide in a CAD or ECD process is important for peptide identification. As will be discussed later, protein/peptide identification is a matching process between the observed peptide fragment ions and the theoretical peptide fragment ions. The theoretical peptide fragment ions are predicated based on the known fragmentation pattern of a peptide in a CAD or ECD process Protein/peptide separation In biological samples, such as human blood plasma, the protein concentration range can span 12 orders of magnitude, where albumin and immunoglobulins are present in the magnitude of mg/ml whereas cytokines are at the level of pg/ml (10). In order to monitor the expression levels of clinically relevant proteins in plasma, the MS-based proteomic 4
27 technologies must be capable of detecting proteins at ng/ml levels or lower. Detecting and quantifying potentially thousands of proteins present in a complex biological sample, spanning over a huge range of relative abundances, poses an enormous analytical challenge. Single-dimension liquid chromatography does not provide sufficient peak capacity to separate peptide mixtures, which are generated by the proteolysis of complex protein mixtures. The sample complexity can be reduced, and therefore the depth and breadth of proteome coverage can be increased, with fractionation/separation techniques at either the protein or the peptide level, or both. Protein mixtures are often separated by SDS PAGE and the whole lane of the gel are excised into slices so that the proteins in each gel slice can be analysed separately by singledimension HPLC MS/MS (24). If protein samples are separated by two-dimensional gel electrophoresis (2DE), spots of interest are excised, digested and analysed by HPLC MS/MS. As an alternative to protein fractionation, peptide mixtures can be separated by following two orthogonal separation mechanisms. The most popular peptide separation methodology at present is the so-called multidimensional protein-identification technology (MudPIT) (25-26), where the peptide mixtures, generated by tryptic digestion of protein samples, are first separated on the basis of charge (strong cation exchange), and then on the basis of hydrophobicity (reversed phase). In-depth characterization of the proteome of complex proteomic samples, such as biofluids, has also been made possible through the development and application of immunoaffinity depletion chromatography (27). To improve the capability of detecting lower abundant proteins in a complex proteomic samples, various combinations of protein/peptide separation and immunodepletion of high abundant proteins can be explored. In principle, these methods are capable of detecting proteins of very low abundance, although considerable effort is required and a sufficient amount of starting protein sample must be available. The ability of MS-based proteomic technologies to identify low abundance proteins from complex mixtures is a driving force in proteomics. 5
28 1.1.4 Protein/peptide identification It is important to note that de novo sequencing of the complete amino acid sequence of a protein using a mass spectrometer is generally not feasible. In shotgun proteomics, only a small portion of peptides can be transferred into a mass spectrometer for analysis. In topdown proteomics, although intact proteins can be transferred into the mass spectrometer for analysis, it is still not possible to elucidate the complete amino acid sequence of a protein. In shotgun proteomics, protein identification is carried out at the peptide level, i.e., through peptide identification. Further, peptide identification is achieved through a databasematching process, rather than a peptide-sequencing process. The fact that only a finite numbers of the possible peptide amino-acid sequences actually occur in nature renders the database-matching methodology feasible for peptide identification. An observed peptidefragmentation spectrum might not contain sufficient information to unambiguously derive the complete amino-acid sequence, but it might still have sufficient information to match it uniquely to a peptide sequence, which is theoretically predicated on the basis of the genomic information of the proteome of interest. The current MS-based proteomics would not be possible without the previous achievements of genomics, which provided the blueprint of all the possible protein sequences of a biological system. There are several different algorithms that are used to search sequence databases with tandem MS spectra data, including PeptideSearch (6), Sequest (5), and Mascot (7). Correspondingly, there are a number of different techniques and strategies for peptide identification. MALDI-TOF can be used to identify proteins by what is known as peptide-mass mapping or peptide-mass fingerprinting, mostly attributed to the high mass accuracy, high resolution and sensitivity of TOF mass analyser. In this method, proteins are identified by matching a list of experimental peptide masses with the predicated list of all peptides masses of a comprehensive protein database. Protein identifications using MS/MS spectra are more commonly used in shotgun proteomics. In addition to the peptide mass, the peak pattern in the MS/MS spectrum also 6
29 provides valuable information about peptide sequence. Peptide identification is carried out using the precursor ion m/z information and its MS/MS spectrum which are then matched against a comprehensive protein sequence databases using an appropriate algorithm mentioned above. For examples, in the cross-correlation method (e.g. Sequest), the observed m/z of the precursor ion and the specificity of trypsin is used to generate a list of isobaric peptides from the protein database. This information is generally not sufficient to match to a single peptide. Then theoretical MS/MS spectra are generated for all of the isobaric peptide sequences, obtained from the database, on the basis of the known fragmentation patterns of the peptides in CAD or ECD processes (Figure 1.1.3). The overlap or cross-correlation of these predicted spectra with the measured mass spectra is calculated and the one with the best cross-correlation coefficient is considered to be the best match. Often, this will identify the best matching peptide sequence; however this might not be sufficient to pinpoint a single protein. Generally, multiple peptides derived from the same proteins will be analyzed and will as a group point to a unique protein. In the probability based matching method (e.g. Mascot), the calculated fragments from peptide sequences in the database are compared with the observed peaks. A score is then calculated to indicate the statistical significance of the match between the spectrum and the sequences contained in a database. In each of these methods mentioned above, the identified peptides are then compiled into a protein hit list, which is the output of a typical proteomic experiment. High-throughput MS-based proteomic experiments involve searching large numbers of peptide MS/MS spectra recorded with a mass spectrometer against the protein sequence database to derive a list of identified peptides and their corresponding proteins. It should be acknowledged that challenges exist in distinguishing the correct peptide assignments from false identifications (28). Tremendous efforts have been devoted to tackle the issues of false positive (a protein not present in the sample is identified ) and false negative (a protein present in the sample is not identified ) results in the current MS-based proteomic experiments (29-30). It should also be noted that only a limited number of peptide ions, representing a small percentage of the complete amino acids sequence of a protein, are observed and analyzed in shotgun proteomics (31). 7
30 1.1.5 Quantitative proteomics Increasingly, proteomics has evolved into a quantitative science. Quantitative proteomics is a powerful tool to quantify protein changes due to stimuli or to make comparisons between healthy and disease states (1, 32-33). Relative quantification of identified proteins allows a wider range of biological questions to be addressed by a proteomics experiment. Currently, relative comparisons of peptide/protein abundance between proteomic samples can be carried out with stable-isotope labeling of proteins or peptides via chemical labeling and metabolic labeling, or label free approaches. As shown in Figure 1.1.4, several chemical labeling techniques have been developed for quantitative MS-based proteomics. Representative chemical labeling techniques include enzymatic labeling of 18 O atoms during protein digestion, isotope-coded affinity tag (ICAT), and isobaric tags for relative and absolute quantification (itraq). In the enzymatic labeling approach (Figure 1.1.4a), protein digestion of one proteomic sample is carried out in 18 O water while the control is performed in normal water. 18 O atoms are incorporated into the C terminus of every N-terminal peptide produced by proteolysis (34-35). Reaction products from 18 O-labeled and non-labeled reactions are then mixed together, followed by LC-MS analysis. The relative abundance of the treated and control samples can be measured by comparing the peak intensities of the labeled and unlabeled peptides. Isotope-coded affinity tags (ICAT) (Figure 1.1.4b) can be used to label proteins or peptides via a chemical reaction with the sulfhydryl group of cysteine residues (36). The relative abundance of proteins in the treated and control samples can be measured by comparing the peak intensities of the labeled and unlabeled peptides. Isobaric tags for relative and absolute quantification (itraq) is one of the most commonly used techniques for peptide labeling (37-39) (Figure 1.1.4c). The itraq tags react specifically with primary amine groups of tryptic peptides, e.g. N-termini and the side chains of lysine residues. It is worth noting that all the tagged peptides remain indistinguishable in the MS scan. The relative abundance of the normally multiplexed treated and control samples is measured by comparing the peak intensities of the so-called reporter ions, which are released in the MS/MS scan. Recently, a method called stable-isotope labelling with amino acids in cell culture, or SILAC, has been described (40). In this method (Figure 1.1.5), one or two amino acids 8
31 (typically arginine and/or lysine) are labeled with heavy isotopes (e.g. 13 C and/or 15 N atoms) and added to the growth medium, which is arginine and/or lysine deficient. Then, the heavy isotope-labeled amino acids are incorporated into all the proteins after several cell doublings. Potentially all protein/peptides can be labelled and the absence of any in vitro reaction steps make the method easy to apply as well as compatible with multistage purification procedures. The stable-isotope labelling technologies make use of the facts that pairs of chemically identical analytes with different stable-isotope composition can be differentiated in a mass spectrometer owing to their mass difference, and that the ratio of signal intensities for such analyte pairs accurately indicates the abundance ratio for the two analytes in the complex mixture. This is because pairs of chemically identical analytes of different stableisotope composition have identical sample loss during processing, often co-eluted in HPLC separation, and exhibit nearly identical ionization efficiency. Relative peptide and protein abundance from LC-MS/MS measurements can also be estimated with label free approaches (Figure 1.1.6). The label free quantitative proteomics can be carried out by comparing peak area of a peptide (41) or by counting the number of times the MS/MS spectra of a peptide are recorded and identified (spectral counting) in individual LC-MS runs (42). In contrast to quantitative approaches that use labeling, label free does not require multiple samples to be combined prior to analysis. Instead, each sample is separately prepared, and subjected to individual LC-MS/MS runs. As a result, the label free quantitative proteomic approaches require high reproducibility among each individual LC-MS/MS run. Nevertheless, the label free quantitative proteomic approaches have enabled fast and low-cost measurements of protein expression level of complex biological samples Thesis objective: Proteomic reactor development As discussed above, the shotgun proteomic approach requires the processing of proteins into peptides before they are analyzed by mass spectrometry (1-2, 43-44). In order to improve detection capabilities for lower abundance proteins in complex proteomic 9
32 samples, various combinations of protein/peptide separation have been explored. Improving the ability of MS-based proteomic technologies to identify low abundance proteins from complex mixtures is a driving force in proteomics. For the past 30 years, gel electrophoresis has been used for protein pre-fractionation (1D & 2D) (45-46). As the separated proteins are difficult to extract from the polyacrylamide gel (47), they are enzymatically cleaved into peptides in the gel (48). Unfortunately, protein/peptide loss and contamination are intrinsic limitations associated with in-gel sample processing techniques (49). Notably, the in-gel sample processing techniques provide limited dynamic range and are not ideal for the analysis of proteins in lower abundance (45). Recently, gel free alternatives for the fractionation of proteins and peptides have been proposed. These gel-free approaches rely on either solution based protein separations such as size exclusion (50), reverse-phase liquid chromatography (51), free-flow electrophoresis (FFE) (52-53) and 2D chromatography (54), or peptide separations (55-58). In these approaches, the proteins are digested in a large volume of solution (in-solution digestion) either before or after separation. Even though these gel-free approaches bypass the need for gels, they do not address the fundamental issue of efficiency of protein processing. Various approaches to in-solution digestion have been proposed, notably, the approach to process proteins using immobilized trypsin in monolithic columns followed by peptide fractionation (59-60), and that to digest proteins by absorbing them on a hydrophobic support, followed by introducing trypsin (61-62). However, these approaches have notable limitations. These approaches either do not offer protein preconcentration before enzymatic digestion or require a high amount of starting protein sample. In general, these approaches require further development before being readily amenable to real biological samples. MS-based proteomics must deal with a limited amount of starting materials. In addition, it also faces other challenges such as a huge dynamic range of protein concentration. As such, the systematic identification and quantification of lower abundance proteins, often with more biological significance, still remains elusive. 10
33 We hypothesized that miniaturization of protein processing will improve recovery and reduce sample losses. This will lead to more proteins identified per sample and the improved ability to process minute amounts of samples. This thesis presents the development of a microfluidic device, termed the proteomic reactor to simplify and improve the processing of proteomic samples. Compared to other in-gel or gel free protein digestion/separation techniques, proteomic reactor techniques require a significantly smaller amount of starting protein samples but are still capable of identifying a comparable amount of proteins. By minimizing sample loss and improving the protein digestion efficiency during the sample processing processes, the proteomic reactor techniques can increase the depth and breadth of proteome coverage and identification confidence, and therefore increase the possibility of identifying lower abundance proteins. As the total time to process protein samples using the proteomic reactor techniques is relatively short (~2 hours) in comparison to other protein digestion methodologies, the proteomic reactor approaches can also increase the throughput for processing complex biological samples, which is necessary for large scale analysis of proteomes. In this thesis, we developed SCX proteomic reactor (chapter 3.1), SCX 96-well plate proteomic reactor (chapter 3.2) and SAX proteomic reactor (chapter 3.3). 11
34 1.2 MS-based Lipidomics The general picture We know that lipids play many important roles in cells such as cellular structural support, energy storage, and signal transduction (63-64). Also, recent research points to the vital roles that lipids may have in Alzheimer disease (65), cancer (66-67), inflammation and cardiovascular diseases (68), male infertility (69) and other diseases. Glycerophospholipids, for example, form the largest lipid subclass by mass, and they are important components of biological membranes in which they modulate membrane trafficking (70-71). Furthermore, some of their metabolites, such as platelet activating factors, are powerful intracellular signalling molecules (72). These metabolites can induce a broad range of biological responses (73), including the progression of neurodegeneration (74-75). Although the study of lipids is not new, their global quantitative study is more recent. The term lipidomics was thus coined to define the global study of the lipid components of cells, tissues or organisms. Certain challenges still remain in lipidomics. First, in contrast to genomics and proteomics, there is no information that can predict the number of individual lipids present in an organism. Second, despite its rapid advancement, current technology still cannot exhaustively map lipidomes; thus an emphasis on developing mapping techniques is needed. Third, the structural identification of lipids by mass spectrometry, via the gas phase fragmentation of lipid ions, is complicated; thus, a means to solve this problem is vital for structural identification. Fourth, given the diversity in lipid classes, it is not possible to accommodate all classes with a common method for extraction, chromatography, and detection. In the following section, we review recent developments in the field of lipidomics with an emphasis on phospholipids Structural diversity of lipids The structural diversity of lipids, and the fact that their structure cannot be predicted a priori, is a serious challenge to the field of lipidomics. Eukaryotic cells provide an excellent example of the structural complexity of lipids. Lipid can be broadly classified 12
35 under eight classes: Fatty acyls, sterol lipids, prenol lipids, saccharolipids, polyketides sphingolipids, glycerolipids, and glycerophospholipids. Glycerophospholipids and sphingomyelins are two common structural classes of phospholipids (76). The research in this thesis involves primarily glycerophospholipids. Typical glycerophospholipids (Figure 1.2.1) consist of a glycerol backbone, a radyl moiety (acyl ester, alkyl ether, or vinyl ether) at the sn-1 (stereospecific number) position, an acyl ester at the sn-2 position, and a polar head group attached to the sn-3 position through a phosphodiester linkage. The common polar head groups in glycerophospholipids include choline, ethanolamine, inositol, serine, and glycerol. Correspondingly, the glycerophospholipid classes are: the glycerophosphocholines (PC), glycerophosphoethanolamines (PE), glycerophosphoinositols (PI), glycerophosphoserines (PS), and glycerophosphoglycerols (PG), with each class containing a different type of polar head group, while glycerophosphates (PA) have a hydrogen rather than a polar head group attached to the phosphate. Figure shows the representative structures of glycerophospholipids. Lyso variants of glycerophospholipids can also be formed if a radyl moiety is missing at either the sn-1 or sn-2 position. Platelet activating factors (PAF) are a special subclass of phosphatidylcholines (PC), with an ether alkyl at the sn-1 position and an acetyl at sn-2 position (77). In addition to a variety of polar head groups, phospholipids contain fatty acyl moieties with different chain lengths and different numbers of double bonds on different sites. The identification of a glycerophospholipid involves determining its polar head group, its radyl groups at both sn-1 and sn-2 positions, and, ideally, the locations of (possibly multiple) carbon-carbon double bonds on each radyl moiety. Unfortunately, due to the extraordinary structural diversity of phospholipids, the complete identification of all species in lipid extracts obtained from cell or tissue samples has not yet been accomplished. The full identification of species thus remains a challenging task, especially considering the fact that some lipid species are present in low abundance. 13
36 Structure elucidation of glycerophospholipids To delineate lipid structure characteristics, the lipidomics field has benefited from the technical developments established in proteomics. However, as discussed in chapter 1.1.4, protein identification is mostly a matching process: the amino acid sequences of some peptide fragments of a protein are determined by mass spectrometry, and the obtained information is used to search against a library that contains all the possible protein sequences predicted by the genomic information of the biological system (5-7). Normally the matching of the amino acid sequences of one or two peptides to those of a protein in the library is sufficient to unambiguously identify the protein. In contrast, lipid identification is a de novo process, where the structural elucidation of a lipid species is based on the interpretation of MS-derived structural information. It is also a top-down approach, where the identification process is required to be carried out on intact lipid species (78-79). As lipids are subject to CAD, structural information on all parts of the lipids (including both the head group and fatty acyl chains) are required for a complete elucidation of the lipid structure. Therefore, it is crucial to have the lipids in their native, unmodified state to allow accurate structure elucidation of the lipids species of interest. However, lipid species are subject to modifications or degradation (i.e., oxidation and hydrolysis) prior to MS analyses (80). As a result, lipidomics faces the challenge of decoding as much information as possible about the different lipid moieties to allow a non-biased and true identification of the original structure of lipids. In the process of glycerophospholipid identification (Figure 1.2.3), a MS scan is first employed to determine the m/z of each lipid species. Typically, lipids will only carry one charge. Greater mass accuracy translates into more accurate prediction of the atomic composition of the lipid. In the second stage, individual lipids are subjected to dissociations attributed to ion activation. Although low-energy CAD has been extensively applied for lipid studies, high-energy CAD and electron transfer dissociation (ETD) have also been employed (81-82). The fragmentation patterns normally reveal information on the lipid polar head group and its acyl chain moieties. Depending on the polar head group of a lipid species, it can be ionized more efficiently under either positive (protonated) or negative (deprotonated) electrospray ionization. A lipid can also be adducted by a cation (e.g., Na + ) or an anion (e.g., 14
37 Cl - ) and then studied under positive or negative ion mode, respectively. As will be discussed later, using a triple quadrupole mass spectrometer, precursor ion scan and neutral loss scan enable the identification of a specific lipid species from a complex mixture by monitoring its specific diagnostic fragments. In a precursor ion scan, while Q1 is scanned, Q3 is fixed to monitor a specific fragment ion; in neutral loss scan, both Q1 and Q3 are scanned in a synchronized manner with a constant mass difference in m/z between Q1 and Q3, to monitor the loss of a neutral moiety during fragmentation (83-84). The characteristic fragment can be associated with either a polar head group or a fatty acyl moiety ESI-MS/MS of protonated glycerophospholipids Glycerophospholipids (i.e., GPCho, GPEtn, GPSer, and their lyso derivatives) have been previously analyzed by positive ESI-MS/MS (85-86). The fragmentation of protonated GPCho and lyso-gpcho ions yield a peak at m/z 184, the diagnostic fragment for the phosphocholine head group (87). The precursor ion scan of m/z 184 highlights phosphocholine-containing lipids (GPCho and sphingomyelin) out of all the lipids present in a MS scan. Fragmentation of protonated GPEtn ([M+H] + ) yields a peak at [M+H-141] + corresponding to the neutral loss of the phosphoethanolamine head group. Similarly, a peak at [M+H-185] + in a tandem mass spectrum can be used to confirm the presence of protonated GPSer ([M+H] + ), which loses its phosphoserine head group during CAD. Overall, strategies that combine survey scan, precursor ion scans and neutral loss scans can help in the unambiguous determination of the molecular weights and the head group composition of phospholipids. Although positive ESI-MS/MS has been widely used for lipid studies, one of its limitations is that not much information pertaining to the fatty acyl constituents can be revealed from the fragmentation pattern. Alternatively, negative ESI-MS/MS and positive ESI-MS/MS with metal ion adduction have been employed to elucidate lipid structure. This will be discussed in the following sections. 15
38 ESI-MS/MS of deprotonated glycerophospholipids GPEtn, GPIns, GPSer, GPGro, GPA, and their lyso variants can all be detected by negative ESI-MS/MS (86, 88-96). This approach is very powerful in elucidating the structure of glycerophospholipids. Compared to its positive counterpart, negative ESI-MS/MS yields fragmentation patterns with a wealth of structural information on the polar head groups and the fatty acyl constituents of phospholipids. Fragmentation of GPEtn anions ([M-H] - ) generates fragments at m/z 140 and 196, both of which correspond to the polar head group of GPEtn (92). As deprotonated GPIns ([M-H] - ) are subject to CAD, a peak corresponding to the dehydrated GPIns head group is observed at m/z 241. Similarly, PtdInsP and PtdInsP 2 can be identified by precursor ion scans of m/z 321 and 401, respectively, under negative ion mode (94, 97). The fragmentation of deprotonated GPGro yields a head group specific fragment at m/z 171 (96). GPSer anions ([M-H] - ) is identified by a peak at [M-H-87] -, which corresponds to the neutral loss of the serine head group (95). A fragment at m/z 153 ([Glycerophosphate-H 2 O] - ) is detected in the fragmentation spectra of all phospholipid species under negative ion mode. Low-energy CAD of glycerophospholipids under negative ion mode also yields fragments decoding structural information on the fatty acyl constituents at the sn-1/sn-2 - positions. These fragments include the carboxylate anions ([ COO] (x=1, 2)), ions arising - from the neutral loss of fatty acids ([ M - H - Rx COOH ] (x=1, 2)), and ions due to neutral - loss of the fatty moieties as ketene ([ M - H - R x CH = C = O] (x=1, 2)) (92-96). R x It has been found that in a low-energy CAD process, the loss of fatty acyl chains from the sn-2 position is sterically more favourable than that from the sn-1 position. As a result, - the abundances of the [ M - H - R2COOH ] and - [ M - H - R 2CH = C = O] ions are greater - than those of the [ M - H - R1COOH ] and [ M - H - R 1CH = C = O] - ions. However, as the major fragmentation pathways differ among different lipid species, the relative abundance of the carboxylate anion - - [ R 1 COO] with respect to [ R 2 COO] changes. For GPEtn and GPGro, the abundances of - [ R 2 COO] ions are greater than - [ R 1 COO] ions (92, 96). For GPIns, the carboxylate anions [ R 1 COO] and [ R 2 COO] are generated due to direct dissociation from 16
39 the glycerol backbone, and also due to the further dissociation of fragment ions [ M H Rx COOH], [ O M H RxCH C ] and [ inositol - M - H - Rx COOH - ], which are affected by the collision energy applied. Thus, the relative abundance of the carboxylate anions [ R 1 COO] and [ R 2 COO] for GPIns depends on the collision energy applied (94). For GPA, the major pathway that leads to the formation of the carboxylate anions [ R 1 COO] and [ 1COOH [ R 2 COO] is the fragmentation of [ 2COOH - M - H - R ] and - M - H - R ], respectively. As a result, the higher abundance of [ 2COOH - M - H - R ] ions leads to higher abundance of [ R 1 COO] ions (93). As GPSer is subjected to low-energy CAD, it first loses the serine head group to generate [M-H-87] - ions. The fragmentation patterns of [M-H-87] - ions are virtually identical to those of the corresponding GPA (95) ESI-MS/MS of metal ion adducted glycerophospholipids The fragmentation of lipids can be modified by changing the counter ion present in solution. In particular, alkali metal ions (e.g., Li +, Na + and K + ) have been commonly used for adducting phospholipids (90, ). As these metal ions adducted glycerophospholipids are subject to CAD, their fragmentation patterns reveal information on the polar head groups and the fatty acyl constituents. The fragmentation of sodiated GPCho and sphingomyelin both generated a sodiated five-member cyclophosphane at m/z 147, and a product ion at [M+Na-59] + due to the neutral loss of trimethylamine N(CH 3 ) 3, both of which are diagnostic fragments of the phosphocholine head group. In the tandem mass spectra of lithiated GPCho, abundant product ions can be found at [M+Li-59] + (neutral loss of trimethylamine N(CH 3 ) 3 ), [M+Li-183] + (neutral loss of cyclophosphane), and [M+Li-189] + (neutral loss of lithium cyclophosphane) (87). It has been observed that the most prominent ion is [M+Li-183] + for lithiated diacyl-gpcho, whereas the most high abundance ion is [M+Li-59] + for lithiated plasmenyl-, plasmanyl- and lyso-pcs ( ). CAD of lithiated GPEtn yields fragment ions associated with the polar head group, including ions at [M+Li-43] + (neutral loss of aziridine (CH 2 CH 2 NH)), [M+Li-141] + (neutral loss of phosphoethanolamine head group), 17
40 [M+Li-147] + (neutral loss of lithium phosphoethanolamine head group), and m/z 148 (phosphoethanolamine head group) (100). The CAD analyses of GPSer as lithiated adducts yield diagnostic fragments of phosphoserine as a lithium salt at m/z 192 (95). In addition to structural information on the polar head groups, structural information pertaining to the two fatty acyl moieties can also be revealed from product ions - - like[ M - H + Met - RxCOOH ] and [ M - H + Met - R x CH = C = O] (x=1,2), arising from the loss of fatty acyl moieties as fatty acids or alkenes, respectively. Metal ions such as Sr 2+, Ba 2+, Mn 2+, Co 2+, Ni 2+, Cu 2+, and Zn 2+ have been also used to adduct phospholipids (99). The fragmentation spectra of these ions also decode information on the polar head groups of phospholipids, and their fatty acyl chain moieties - - ( [ M - H + Met - Rx COOH ], [ M - H + Met - R x CH = C = O] ). Cobalt(II) ion complexes of GPEtn and GPSer yield [ M - H + Met - R1COOH ] - ions with higher abundance than [ M - H + Met - R2COOH ] - ions, whereas cobalt(ii) adducted GPGro fragmentation patterns generate [ 2COOH - M - H + Met - R ] ions with higher abundance than [ 1COOH - M - H + Met - R ] ions. The information on abundance ratios could be used to determine the stereospecific positions of the two fatty acid substituents. Chlorine adduct has also been reported for the identification of the fatty acyl substituents of GPCho in negative ESI-MS/MS (98, 103). In conclusion, glycerophospholipids with different adduct formations generate lipid-specific fragmentation signatures that allow unambiguous identification of the lipid species of interest Glycerophospholipid identification by multiple precursor ion scans and neutral loss scans Strategies that combine survey, product ion, precursor ion, and neutral loss scans can be employed for the study of the lipidome. A product ion scan records all fragment ions generated during CAD, including fragment ions relevant to the polar head groups and the fatty acyl moieties. Precursor ion scan and neutral loss scan each monitor a specific fragmentation reaction (i.e., whether a specific diagnostic fragment is generated (charged) or 18
41 lost (uncharged)). Compared to product ion scan, precursor ion and neutral loss scans have the capability of identifying a lipid species that contains a specific diagnostic moiety (e.g., a polar head group or a fatty acyl moiety) from a complex mixture. On the other hand, precursor ion and neutral loss scans could not make full use of many other fragment ions that are helpful in lipid structural elucidation. The combination of multiple precursor ion scans and neutral loss scans would enable simultaneous monitoring of multiple fragmentation reactions. This allows the identification of multiple diagnostic fragments from a complex mixture of product ions for lipid structure elucidation (83-84, ). A two-dimensional ESI-MS/MS analysis of lipid extracts has been reported using multiple precursor ion and neutral loss scans under either positive or negative ion mode (108). This strategy made possible the identification of isobaric peaks, and the determination of the regiospecificity of individual lipid species. If multiple precursor ion and neutral loss scans are carried out on a triple-quadrupole mass spectrometer, each scan must be performed one at a time, due to the path stability selection adopted by a triple-quadrupole mass spectrometer. However, if the multiple scans are carried out on a hybrid quadrupole time-offlight (TOF) mass spectrometer with ion trapping capability (e.g., QSTAR Pulsar), all modes may be performed simultaneously due to the non-scanning acquisition of TOF mass analyzers. It has been reported that the hybrid quadrupole time-of-flight (TOF) mass spectrometer allows the simultaneous acquisition of 41 precursor ion spectra, which decode information on specific lipid classes and common fatty acyl chain moieties (107). The high mass accuracy and high resolution of TOF analyzers are very helpful in determining the atomic composition and hence the structure of a lipid species Glycerophospholipid identification by multiple stage tandem mass spectrometry Structural information revealed by tandem MS alone could not always provide adequate information to identify a lipid species unambiguously. In many cases, the lipid species of interest are complex and or the determination of very specific information on a fatty acyl chain is required (e.g., double bond location). Thus, multiple stage tandem MS could be applied to tackle such structural information. Hsu et al. characterized the structure 19
42 of cardiolipin using negative ion mode with multiple stage quadrupole ion trap MS. The MS 3 -spectra of the phosphatidic anions provided critical information on the identity of the fatty acyl substituents and their stereospecific position (109). Hsu et al. also determined the double bond position along the fatty acyl group of glycerophospholipids using multiple-stage MS (110). In another work, Hsu et al. employed multiple stage MS to differentiate 1-O-alk- 1 -enyl-2-acyl-, 1-O-alkyl-2-acyl- and diacyl-glycerophospholipid molecules from each other based on the MS 3 or MS 4 - spectra of their [ M - H - R2COOH - headgroup ] ions. These ions arise from the consecutive losses of the fatty acid substituents at the sn-2 position, and their respective polar head groups from the [M-H] - ions (111). It has been also reported that isobaric lyso-gpcho and PAF can be effectively identified by MS 3 on a QTRAP mass spectrometer (112) Characterization of the fatty acyl constituents of glycerophospholipids Under both positive and negative ESI-MS/MS, glycerophospholipid fragments yield product ions allowing relatively easy elucidation of their polar head groups. The characterization of the two fatty acyl moieties at the sn-1/sn-2 positions, however, poses challenges. The structural information relevant to the fatty acyl chains can only be revealed under negative ion mode ESI or positive ion mode ESI with metal ion adduction. In eukaryotes, the fatty acids at the sn-2 position of glycerophospholipids are always linked to the glycerol backbone through an ester bond. The fatty acids at the sn-1 position can be attached via an ester linkage (diacyl-gp), an alkyl ether linkage (1-alkyl, 2-acyl-GP), or a vinyl ether linkage (plasmologens). For the complete identification of a glycerophospholipid, the following information pertaining to the fatty acyl chains is needed: (i) the chain length of the two fatty acyl moieties, and the total number of carbon double bonds in each chain; (ii) the assignment of the two fatty acyl moieties to sn-1/sn-2 position (for diacyl-gps); and (iii) the location of the polyunsaturated carbon double bonds on each acyl moiety. The molecular weight of a phospholipid can be determined precisely by a survey scan. The polar head group of a phospholipid can be identified by carrying out a precursor ion scan or a neutral loss scan as discussed above. The sum information of the two fatty acid chains 20
43 (i.e., the length of the two fatty acyl chains at the sn-1 and sn-2 positions, and the total number of double bonds) can thus be decoded. However, a number of combinations of different fatty acyl moieties could all add up to the same molecular weight, leaving the length of each fatty acyl chain, and the number of double bonds on each fatty acyl moiety undetermined. Using negative ESI-MS/MS, a variety of fragment ions relevant to the two - fatty acyl moieties can be observed. These include carboxylate anions[ COO], as well as R x [ COOH - M - H - Rx ] and [ H R CH C O] M x ions. The latter two ions arise from the loss of one of the two fatty acyl moieties. These fragment ions reveal critical structural information relevant to the fatty acyl constituents, and allow the unambiguous determination of the length of each fatty acyl moiety and the total number of double bonds on each acyl chain (92-96, 113). Under positive ion mode ESI, the fragmentation of metal adducted glycerophospholipids also yields fragment ions corresponding to their polar head groups and - fatty acyl moieties ( [ M - H + Met - Rx COOH ], [ O - M - H + Met - Rx CH = C = ] ). This permits the unequivocal characterization of the fatty acyl moieties (98-99). The use of MS to determine the regiospecificity of the two fatty acyl substituents of diacyl-glycerophospholipids has been attempted ( ). As discussed earlier, it appears that under low-energy CAD the [ R 1 COO] /[ R 2 COO] abundance ratio follows certain rules for some diacyl-glycerophospholipids, and this information has been used to determine the positions of the two fatty acyl chains (92-94, 96). Such attempts have also been made on the basis of fragmentation patterns of glycerophospholipids adducted with certain metal ions, where the relative abundance of ions corresponding to the loss of the fatty acyl moiety at sn- 1/sn-2 positions has been used to assign the positions of the two fatty acyl substituents (98-99, 115). However, it has been observed that the [ R 1 COO] / [ R 2 COO] abundance ratio recorded from the fragmentation of GPIns under negative ion mode is affected by the collision energy applied (94). Detailed studies on the effect of collision energy on the [ R 1 COO] /[ R 2 COO] ratio for phospholipid species have been carried out by Hvattum et al. These results reveal that as the collision energy increases from 15 to 70 ev, the abundance of [ R 1 COO] ions increases from lower to higher than the abundance of [ R 2 COO] ions for GPCho, GPEtn, and GPIns (116). It is therefore clear that the collision energy applied plays 21
44 an important role during the CAD of glycerophospholipids. Other factors, such as the chain length and the number of double bonds of the fatty acyl moieties should also be taken into consideration. Overall, the assignment of the two fatty acyl chain positions based on the abundance ratio of a specific pair of ions is still under scrutiny Glycerophospholipid identification with or without separation Ideally the identification of a lipid species using ESI-MS/MS should be carried out without interference from other lipid species, as the presence of fragment ions from those impurities could mislead the identification. Lipid extracts from biological samples are complex mixtures. The identification process is, thus, almost always carried out in the presence of other lipid species. As a result, glycerophospholipids can be identified to different extents as discussed above, depending on the complexity of the sample and the separation techniques applied. Lipid extracts can be directly infused into a mass spectrometer without front-end separation through ESI, followed by lipid identification by tandem MS (86, 88, 103, 117). One issue associated with direct infusion is the ionization suppression of lipid species with low ionization efficiency. As a result, the detection of these lipid species becomes extremely difficult, especially if they are present in low concentrations in lipid extracts (97, 118). If a complex mixture of lipid species is analyzed using direct infusion, a single peak in a survey scan could represent several isobaric lipid species (86). CAD of such precursor ions would generate a mixture of fragmentation patterns from several lipid species, making the identification process extremely difficult/impossible. A technique called intra-source separation has been introduced to perform total cellular lipidome analyses by direct infusion of crude lipid extracts without front-end chromatographic separation (83, 106, 108). By employing both positive and negative ion mode, as well as adjusting the ph of the lipid extract, anionic lipids, weak anionic lipids and neutral polar lipids can be preferentially ionized under different experimental conditions. Therefore, intra-source separation of different lipid classes is achieved. Intra-source 22
45 separation in combination with multiple precursor ion scans and neutral loss scans has enabled the unambiguous identification of complex lipid extracts (83, 108). However, precaution must be taken in dealing with isobaric lipid species, and in correcting isotopic peak intensities. The coupling of HPLC with ESI-MS/MS is the most frequently used technique for lipidomic analysis, and the majority of reports on MS-based lipidomics rely on online or offline separation of lipids (63, 85, 113, ). Normal-phase HPLC generally separates phospholipids based on the polarity of their head groups; whereas reverse-phase HPLC separates phospholipids based on the hydrophobicity of their fatty acyl chains (113). In RP- HPLC separation, the order of elution in a class of lipid is related to the length of the fatty acyl chain. Lipids containing shorter fatty acyl chains elute faster than those with longer ones. Furthermore, the higher the degree of unsaturation, the faster the lipid elutes (113). Direct infusion ESI-MS/MS is incapable of resolving isobaric glycerophospholipids with different fatty acyl chain composition. However, these isobaric glycerophospholipid species can be resolved and identified with the application of reversed-phase HPLC (113). Despite the concerns of potential sample loss during liquid chromatography separations, ESI-MS/MS integrated with front-end separation has become the method of choice in MS-based lipidomics Lipid quantification In the lipidomics field, MS is employed not only for qualitative analyses (i.e., lipid structure elucidation) but also for quantitative purposes (i.e., measuring the absolute concentration of lipid species or the relative abundance of a group (class) of lipid species in complex mixtures) (86, 90, 103, ). Unlike the field of quantitative proteomics where several quantitative techniques have been well established and broadly accepted, a general consensus is yet to be reached for the most appropriate lipid quantification approach. However, adding lipid standards prior to MS analysis is a general practice (Figure 1.2.4). The quantitative analysis of a lipidome is generally divided into global and targeted lipidomics. Global lipidomics allows the identification and relative quantification of 23
46 numerous molecular lipid species across multiple structural classes in total lipid extracts. This strategy includes shotgun lipidomics, which utilizes direct infusion of lipid extracts into a mass spectrometer (83, 123), and LC-MS/MS (113, 124). In global lipidomics, normally a variety of lipid standards are spiked in to cover a relatively broad spectrum of lipid species. Precursor ion scan and neutral loss scan are widely adopted MS techniques for global quantitative lipidomics. Targeted lipidomics, on the other hand, permits the quantitative analysis of a single lipid species or several lipids within a specific lipid class ( ). In comparison to precursor ion scan and neutral loss scan, selected reaction monitoring (SRM) can provide exclusive sensitivity and accuracy for targeted quantitative analysis of lipid species of interest. It should be noted that the instrument response varies between different classes of lipids (118). In addition, identical lipid species exhibit different behaviours when analyzed using different types of mass spectrometers or when analyzed using the same mass spectrometer under different experimental parameters (80, 127). Therefore, the relative intensities of signals corresponding to different lipid species in a mass spectrum do not directly reflect their molar abundances and concentrations. It has been documented that as glycerophospholipids are analyzed by ESI-MS, the instrument response decreases with increasing fatty acyl chain length, and increases with increasing degrees of acyl chain unsaturation (86, 118). It is also impractical to use mass spectrometry to directly estimate the relative abundance of different phospholipid subclasses due to the difference in the ionization efficiency of their polar head groups (118). The gross estimation of the relative abundance of lipid species within a specific phospholipid subclass is less problematic, provided the responses of all the lipid species are normalized with appropriate internal standards ( ). Specifically, when using direct infusion ESI-MS (including intra-source separation), the peak intensity is proportional to the concentration of a lipid species in a mixture. However, when front-end separation is applied (e.g., GC or LC), the integrated peak area of a lipid species is generally considered to be proportional to its quantity present in a complex mixture. 24
47 Absolute lipid quantification The absolute quantification of specific lipid species relies on the availability of their synthetic lipid standards in non-labelled or isotopically-labelled forms. This strategy is applicable to a limited number of lipids in complex mixtures (77, 121). The absolute concentration of lipids can be determined by standard addition methods. In brief, known amounts of standards of the target lipid are sequentially spiked in the complex mixture. The respective MS responses are used to determine the original concentration of the lipid species of interest (77, 121). The absolute concentration of a lipid species can also be determined by spiking in known amounts of lipid standards labelled with stable isotopes (stable-isotope dilution) (130). The isotopically-labelled lipid standard and its normal counterpart exhibit identical responses in mass spectrometers as they have identical physiochemical properties. Therefore the original concentration of the target lipid species can be determined by comparing the peak heights or peak areas of the paired heavy and normal lipids Relative lipid quantification In many cases, comprehensive lipid profiling between wild and mutant, basal and stimulated, and normal and disease samples is required (84, 88, 129). Mass spectrometry is the method of choice to tackle this daunting task. This approach requires comparison of multiple MS analyses using different scan modes. Fluctuations in signal intensity due to variations in lipid extraction, sample preparation and sample analysis can be an issue, as each sample is individually processed. Fortunately, non-naturally occurring lipid standards can be spiked into the samples at different stages of sample processing, which facilitates the correction of signal intensity. As the ionization efficiency of different glycerophospholipids differs significantly, normally at least one lipid standard belonging to each phospholipid subclass is spiked into samples to serve as internal standards for its respective subclass. When the analytical strategy includes both positive and negative ESI-MS, lipid species that can be detected in both positive and negative modes (i.e., GPEtn and GPSer) are chosen as internal standards for normalization (88). 25
48 Stable isotope labelling through metabolism Isotopic labelling is also employed for the relative quantitation of a lipidome, and for tracking the fate of lipids via different metabolic pathways (72). Appropriate chemicals labelled with stable isotopes are introduced into the growth medium during cell culture, and depending on the target metabolic pathway, either all or a fraction of the lipids are labelled. For instance, Ekroos et al. cultured cells with 13 C labelled glucose for 24 hours; the lipid extracts from these cells contained a mixture of isotopically labelled endogenous lipids, providing a comprehensive internal standard for quantitative profiling of phospholipids (84). Delong et al. introduced ethanol-1,1,2,2-d 4 -amine (D4-ethanolamine) and choline chloride- (trimethyl-d 9 ) (D9-choline chloride) into the cell culture medium to distinguish the metabolic product GPCho from different metabolic pathways (128). Wenk et al. metabolically labelled mouse neuronal cells with [ 3 H]inositol to profile lipids involved in intracellular signalling (97). Hence, stable isotopic labelling through metabolism is a promising approach for the relative quantitation of lipidome Thesis objectives in lipidomics Development of a nanoflow rate HPLC-ESI-MS/MS methodology for the analysis of Platelet Activating Factor (PAF) family and lyso-glycerophosphocholine (LPC) lipids The PAF subclass of glycerophospholipids are purported to be key mediators of neuronal differentiation and neuronal cell death in vitro and in vivo (74, ). Signaling is isoform-specific. Differences in the sn-1 carbon chain length and degree of saturation determine whether activation of the PAF G-protein coupled receptor (PAFR) is cytotoxic or cytoprotective ( ). However, it is not known whether specific PAF subspecies are preferentially generated over the course of neuronal differentiation or neurodegenerative disease. 26
49 Even though direct infusion approaches (without front-end LC separation) have been employed to study Platelet Activating Factor (PAF) family and lyso-glycerophosphocholine (LPC) lipids, lipid species having low ionization efficiencies are difficult to analyze by this method. As a result, the direct infusion approaches are not ideal for studying the PAF and LPC lipid species, both of which are present in low concentrations (97, 118). Coupling of reversed-phase HPLC (113) with ESI-MS/MS has been used for lipidomic analysis. However, to the best of our knowledge, the liquid chromatographic separations of lipid species for the published studies were performed at a higher flow rate (e.g., µl/min), and therefore these methods required relatively larger starting materials. We hypothesized that the nanoflow HPLC-ESI-MS/MS technology, which is commonly used in proteomics, could be adapted for quantitative lipidomic profiling of PAF and LPC lipid species. We expect that the nanoflow HPLC-ESI-MS/MS could be used to improve the sensitivity and deepen the range of detection for the PAF/LPC family lipids. In this thesis, we developed a nanoflow rate HPLC-ESI-MS/MS method for the analysis of Platelet Activating Factor (PAF) family and lyso-glycerophosphocholine (LPC) lipids. This method was applied to the undifferentiated and differentiated PC12 cells. The PC12 cell has been widely used as model for neural differentiation, where the PAF subclass of glycerophospholipids is implicated. This method was further applied to the posteriorentorhinal cortex of individuals with Alzheimer s disease, TgCRND8 transgenic mice expressing mutant human amyloid precursor protein, and human hnt neurons directly exposed to soluble Aβ 42 oligomers, to study whether specific PAF/LPC subspecies are preferentially generated over the course of neurodegenerative disease Development of MS-based methodology for determining the stereospecificity of diacyl glycerophospholipids For the complete identification of a glycerophospholipid, the information pertaining to the fatty acyl chains, such as the chain length of the two fatty acyl moieties and the total number of carbon double bonds in each fatty acyl chain is needed, in addition to information 27
50 about the polar head group. For diacyl glycerophospholipids, the assignment of the two fatty acyl moieties to sn-1/sn-2 position is required. Previous studies on a limited number of standard diacyl glycerophospholipids revealed that the relative abundance of the fatty acyl anions and the lyso-form fragment ions, which resulted from the neural loss of the two fatty acyl moieties, is associated with their stereospecific position when they are subjected to fragmentation (87, 92-96, , 102). Using MS to determine the regiospecificity of diacyl-glycerophospholipids under negative ion mode has been demonstrated with a number of lipid standards ( ). Of note, for diacyl glycerophosphoinositols (PI), however, the relative abundance of the two fatty acyl anions recorded under negative ion mode depends on collision energy and the characteristics (e.g. length and number of double bonds) of the fatty acyl moieties (94). As such, it is still not feasible to use MS-based approaches to determine the stereospecificity of diacyl glycerophospholipids in real biological samples. Shotgun lipidomic approaches usually analyze lipid extracts with very little, if any, pre-purification (83, 106, 108). Consequently, interference can arise from the presence of other isobaric species, or from lipid species with a molecular ion mass that is encompassed by the isolation window preceding fragmentation. As a result, the peak intensities of some fatty acyl anions of interest can be the sum of contributions from more than one lipid species. It is therefore almost impossible to make correct positional assignments using MS techniques that look only at fatty acyl anions while neglecting lyso-form fragment ions, especially when dealing with complex mixtures. In order to exclusively identify glycerophospholipids, it is desirable to include the fragment ions that can provide connections between the fatty acyl moieties and their respective molecular ions. However, to date the structural information pertaining to the lyso-form fragment ions has not been fully exploited for the purpose of determining the stereospecificity of diacyl glycerophospholipids. In this thesis, we developed a novel methodology to fully determine the stereospecificity of diacyl PA, PS, PG, PI, and PE. This methodology is based on the structural information derived from both the acyl anions and the lyso-form fragment ions from MS/MS spectra obtained using a hybrid quadrupole time-of-flight (QqTOF) mass spectrometer. We first examined a variety of diacyl glycerophospholipid standards with 28
51 different fatty acyl chain compositions, including PA, PS, PG, PI, and PE, over a wide range of collision energy. Using the developed novel methodology, we then further analyzed the fatty acyl compositions of glycerophospholipids in lipid extract from a real biological sample. 29
52 Figure Captions Figure Bottom-up and top-down proteomic approaches. (a) Bottom-up proteomic approach. A mixture of proteins is normally enzymatically cleaved into peptides, which are then separated using high performance liquid chromatography, prior to being analyzed by MS. (b) Top-down approach. Proteins are not enzymatically digested prior to MS analysis. Figure Electrospray ionization (ESI). Peptides are introduced to the electrospray tip as the eluent flow from HPLC. A high voltage is applied between the electrospray emitter and the orifice of the mass spectrometer, resulting in the formation of a Taylor cone at the end of the emitter and forcing the ejection of positively charged droplets from the emitter towards the orifice of the mass spectrometer. As the droplets traverse the space between the emitter and the orifice, solvent evaporation occurs. The droplet continues to shrink until it reaches the Rayleigh limit, at which point the surface tension can no longer sustain the charge and a Coulombic explosion occurs. As a result, the droplet is ripped apart. The Coulombic explosion results in smaller droplets, which can repeat this process, as well as isolated peptide ions. (The figure is modified based on Figure CAD and ECD cleave on different bonds. CAD cleaves the peptide bond and results in b ions when the charge is retained by the amino-terminal fragment, or y ions when it is retained by the carboxy-terminal fragment. ECD cleaves the N-Cα bond and results in c ions when the charge is retained by the amino-terminal fragment, or z ions when the charge is retained by the carboxy-terminal fragment. (This figures only indicates the bonds cleaved by CAD and ECD, but not represent the real structures of the fragments ions) Figure Quantitative proteomics: stable-isotope labeling of protein/peptide via chemical labeling. (a) Enzymatic labeling. Enzymatic digestion of one proteomic sample is carried out in 18 O water while the control is performed in normal water. 18 O atoms are incorporated into the C terminus of every N-terminal peptide produced by proteolysis. The relative abundance of the labeled and unlabeled peptides in the treated and control samples 30
53 can be measured by comparing the peak intensities in the MS scan. (b) Isotope-coded affinity tags (ICAT). ICAT tags are used to label proteins or peptides via a chemical reaction with the sulfhydryl group of cysteine. The relative abundance of the labeled and unlabeled peptides in the treated and control samples can be measured by comparing the peak intensities in the MS scan. (c) Isobaric tags for relative and absolute quantification (itraq). The itraq tags react specifically with primary amine groups of tryptic peptides (e.g. N-termini and the side chains of lysine residues). The relative abundance of the multiplexed treated and control samples is measured by comparing the peak intensities of the so-called reporter ions in the MS/MS scan. Figure Quantitative proteomics: stable-isotope labelling with amino acids in cell culture (SILAC). For the treatment samples, amino acids (typically arginine and/or lysine) that are labeled with heavy isotopes (e.g. 13 C and/or 15 N atoms) are added to arginine and/or lysine deficient cell culture medium. The heavy isotope-labeled amino acids are then incorporated into all the proteins after several cell doublings. For the control samples, the cells are cultured in the conventional cell culture medium, which does not contain stableisotope labelled amino acids. The relative abundance of the labeled and unlabeled peptides in the treated and control samples can be measured by comparing the peak intensities in the MS scan. Figure Quantitative proteomics: label free approaches. In label free quantitative approach, each sample is separately prepared, and subjected to individual LC-MS/MS run. Label free quantitative proteomics can be carried out by comparing peak area of a peptide in MS scan or by counting the number of times the MS/MS spectra of a peptide are recorded and identified (spectral counting) in individual LC-MS runs. Label free does not require multiple samples to be combined prior to MS analysis. Figure Diagram of the structure of glycerophospholipids, a sub-class of lipids. Typical glycerophospholipids consist of a glycerol backbone, a radyl moiety (acyl ester, alkyl ether, or vinyl ether) at the sn-1 (stereospecific number) position, an acyl ester at the sn-2 position, and a polar head group attached to the sn-3 position through a phosphodiester 31
54 linkage. The common polar head groups in glycerophospholipids include choline, ethanolamine, inositol, serine, and glycerol. Adapted with permission from Briefings in Functional Genomics. Copyright 2008 Oxford University Press. Figure Representative lipid structures of glycerophospholipids. (a) Glycerophosphocholines. (b) Glycerophosphoethanolamines. (c) Glycerophosphoserines. (d) Glycerophosphoglycerols. (e) Glycerophosphates. (f) Glycerophosphoinositols. Adapted with permission from Mass Spectrometry Reviews. Copyright 2010 Wiley Periodicals, Inc. Figure The MS-based method for the identification of glycerophospholipids. The identification of glycerophospholipids can be performed by direct infusion of lipid extracts through ESI to a mass spectrometer or by integrating front-end LC separation with a mass spectrometer. Depending on the polar head group of the lipid species of interest, they can be studied under positive ion mode or negative ion mode. A MS scan is first employed to determine the information on the intact molecular weight of each lipid species. In the second stage, individual lipids are subjected to CAD and information on polar head group and fatty acyl moieties are obtained. As there is no genomic information can predicate the structure of a lipid species, lipid structural elucidation is performed on the intact lipid species ( topdown ) and is totally based on fragment ions recorded in the MS/MS spectra ( de novo ). Figure The MS-based method for quantitative analysis of glycerophospholipids. The quantitative analysis of a lipidome generally involves the addition of lipid standards at the time of lipid extraction. The lipid extracts can be introduced into a mass spectrometer directly through ESI (direct infusion) or by integrating a front-end LC separation. Depending on the polar head group of the lipid species of interest, quantitative analysis can be performed under positive ion mode or negative ion mode. Precursor ion scan (PIS) and neutral loss scan (NLS) are used for the quantitative analysis of a large number of lipid species across multiple structural classes in total lipid extracts (global quantitative lipidomics). Selected reaction monitoring (SRM) is used for the quantitative analysis of a 32
55 single lipid species or several lipids within a specific lipid class (targeted quantitative lipidomics). 33
56 Figure Protein mixture Peptide mixture Peptide fragmentation Digestion ESI HPLC m/z (a) Bottom-up approach Purified protein Protein fragmentation ESI m/z (b)top-down approach 34
57 Figure peptide + + emitter Multiply charged droplet evaporation Rayleigh limit ~1.5kV Coulombic explosion MS orifice Peptide ion 35
58 Figure
59 Figure (a) (b) (c) 37
60 Figure
61 Figure
62 Figure
63 Figure
64 Figure
65 Figure
66 References: 1. Aebersold, R., and Mann, M. (2003) Mass spectrometry-based proteomics, Nature 422, Steen, H., and Mann, M. (2004) The ABC's (and XYZ's) of peptide sequencing, Nat Rev Mol Cell Biol 5, Karas, M., and Hillenkamp, F. (1988) Laser desorption ionization of proteins with molecular masses exceeding 10,000 daltons, Anal Chem 60, Fenn, J. B., Mann, M., Meng, C. K., Wong, S. F., and Whitehouse, C. M. (1989) Electrospray ionization for mass spectrometry of large biomolecules, Science 246, Eng, McCormack, and Yates. (1994) An approach to correlatetandem mass spectral data of peptides with amino acid sequences in a protein database, Journal of the American Society for Mass Spectrometry Mann, M., and Wilm, M. (1994) Error-tolerant identification of peptides in sequence databases by peptide sequence tags, Anal Chem 66, Perkins, D. N., Pappin, D. J., Creasy, D. M., and Cottrell, J. S. (1999) Probabilitybased protein identification by searching sequence databases using mass spectrometry data, Electrophoresis 20, Ge, Y., Lawhorn, B. G., ElNaggar, M., Strauss, E., Park, J. H., Begley, T. P., and McLafferty, F. W. (2002) Top down characterization of larger proteins (45 kda) by electron capture dissociation mass spectrometry, J Am Chem Soc 124, Zabrouskov, V., and Whitelegge, J. P. (2007) Increased coverage in the transmembrane domain with activated-ion electron capture dissociation for top-down Fourier-transform mass spectrometry of integral membrane proteins, J Proteome Res 6, Anderson, N. L., and Anderson, N. G. (2002) The human plasma proteome: history, character, and diagnostic prospects, Mol Cell Proteomics 1, Beck, M., Topf, M., Frazier, Z., Tjong, H., Xu, M., Zhang, S., and Alber, F. (2011) Exploring the spatial and temporal organization of a cell's proteome, J Struct Biol 173,
67 12. Schiess, R., Wollscheid, B., and Aebersold, R. (2009) Targeted proteomic strategy for clinical biomarker discovery, Mol Oncol 3, Picotti, P., Rinner, O., Stallmach, R., Dautel, F., Farrah, T., Domon, B., Wenschuh, H., and Aebersold, R. (2010) High-throughput generation of selected reactionmonitoring assays for proteins and proteomes, Nat Methods 7, Olsen, J. V., Ong, S. E., and Mann, M. (2004) Trypsin cleaves exclusively C-terminal to arginine and lysine residues, Mol Cell Proteomics 3, Wierenga, S. K., Zocher, M. J., Mirus, M. M., Conrads, T. P., Goshe, M. B., and Veenstra, T. D. (2002) A method to evaluate tryptic digestion efficiency for highthroughput proteome analyses, Rapid Commun Mass Spectrom 16, Hou, W., Ethier, M., Smith, J. C., Sheng, Y., and Figeys, D. (2007) Multiplexed proteomic reactor for the processing of proteomic samples, Anal Chem 79, Zhou, H., Hou, W., Lambert, J. P., and Figeys, D. (2010) New ammunition for the proteomic reactor: strong anion exchange beads and multiple enzymes enhance protein identification and sequence coverage, Anal Bioanal Chem 397, Bakhtiar, R., and Guan, Z. (2006) Electron capture dissociation mass spectrometry in characterization of peptides and proteins, Biotechnol Lett 28, Horn, D. M., Ge, Y., and McLafferty, F. W. (2000) Activated ion electron capture dissociation for mass spectral sequencing of larger (42 kda) proteins, Anal Chem 72, Zubarev, R. A., Horn, D. M., Fridriksson, E. K., Kelleher, N. L., Kruger, N. A., Lewis, M. A., Carpenter, B. K., and McLafferty, F. W. (2000) Electron capture dissociation for structural characterization of multiply charged protein cations, Anal Chem 72, Anusiewicz, I., Jasionowski, M., Skurski, P., and Simons, J. (2005) Backbone and side-chain cleavages in electron detachment dissociation (EDD), J Phys Chem A 109, Palumbo, A. M., Smith, S. A., Kalcic, C. L., Dantus, M., Stemmer, P. M., and Reid, G. E. (2011) Tandem mass spectrometry strategies for phosphoproteome analysis, Mass Spectrom Rev 30,
68 23. Siuti, N., and Kelleher, N. L. (2007) Decoding protein modifications using top-down mass spectrometry, Nat Methods 4, Lasonder, E., Ishihama, Y., Andersen, J. S., Vermunt, A. M., Pain, A., Sauerwein, R. W., Eling, W. M., Hall, N., Waters, A. P., Stunnenberg, H. G., and Mann, M. (2002) Analysis of the Plasmodium falciparum proteome by high-accuracy mass spectrometry, Nature 419, Washburn, M. P., Wolters, D., and Yates, J. R., 3rd. (2001) Large-scale analysis of the yeast proteome by multidimensional protein identification technology, Nat Biotechnol 19, Wolters, D. A., Washburn, M. P., and Yates, J. R., 3rd. (2001) An automated multidimensional protein identification technology for shotgun proteomics, Anal Chem 73, Schutzer, S. E., Liu, T., Natelson, B. H., Angel, T. E., Schepmoes, A. A., Purvine, S. O., Hixson, K. K., Lipton, M. S., Camp, D. G., Coyle, P. K., Smith, R. D., and Bergquist, J. (2010) Establishing the proteome of normal human cerebrospinal fluid, PLoS One 5, e Cargile, B. J., Bundy, J. L., and Stephenson, J. L., Jr. (2004) Potential for false positive identifications from large databases through tandem mass spectrometry, J Proteome Res 3, Keller, A., Nesvizhskii, A. I., Kolker, E., and Aebersold, R. (2002) Empirical statistical model to estimate the accuracy of peptide identifications made by MS/MS and database search, Anal Chem 74, Nesvizhskii, A. I., Keller, A., Kolker, E., and Aebersold, R. (2003) A statistical model for identifying proteins by tandem mass spectrometry, Anal Chem 75, Duncan, M. W., Aebersold, R., and Caprioli, R. M. (2010) The pros and cons of peptide-centric proteomics, Nat Biotechnol 28, Ong, S. E., and Mann, M. (2005) Mass spectrometry-based proteomics turns quantitative, Nat Chem Biol 1, MacCoss, M. J., and Matthews, D. E. (2005) Quantitative MS for proteomics: teaching a new dog old tricks, Anal Chem 77, 294A-302A. 46
69 34. Yao, X., Freas, A., Ramirez, J., Demirev, P. A., and Fenselau, C. (2001) Proteolytic 18O labeling for comparative proteomics: model studies with two serotypes of adenovirus, Anal Chem 73, Stewart, II, Thomson, T., and Figeys, D. (2001) 18O labeling: a tool for proteomics, Rapid Commun Mass Spectrom 15, Gygi, S. P., Rist, B., Gerber, S. A., Turecek, F., Gelb, M. H., and Aebersold, R. (1999) Quantitative analysis of complex protein mixtures using isotope-coded affinity tags, Nat Biotechnol 17, Choe, L., D'Ascenzo, M., Relkin, N. R., Pappin, D., Ross, P., Williamson, B., Guertin, S., Pribil, P., and Lee, K. H. (2007) 8-plex quantitation of changes in cerebrospinal fluid protein expression in subjects undergoing intravenous immunoglobulin treatment for Alzheimer's disease, Proteomics 7, Pierce, A., Unwin, R. D., Evans, C. A., Griffiths, S., Carney, L., Zhang, L., Jaworska, E., Lee, C. F., Blinco, D., Okoniewski, M. J., Miller, C. J., Bitton, D. A., Spooncer, E., and Whetton, A. D. (2008) Eight-channel itraq enables comparison of the activity of six leukemogenic tyrosine kinases, Mol Cell Proteomics 7, Ross, P. L., Huang, Y. N., Marchese, J. N., Williamson, B., Parker, K., Hattan, S., Khainovski, N., Pillai, S., Dey, S., Daniels, S., Purkayastha, S., Juhasz, P., Martin, S., Bartlet-Jones, M., He, F., Jacobson, A., and Pappin, D. J. (2004) Multiplexed protein quantitation in Saccharomyces cerevisiae using amine-reactive isobaric tagging reagents, Mol Cell Proteomics 3, Ong, S. E., Blagoev, B., Kratchmarova, I., Kristensen, D. B., Steen, H., Pandey, A., and Mann, M. (2002) Stable isotope labeling by amino acids in cell culture, SILAC, as a simple and accurate approach to expression proteomics, Mol Cell Proteomics 1, Chelius, D., and Bondarenko, P. V. (2002) Quantitative profiling of proteins in complex mixtures using liquid chromatography and mass spectrometry, J Proteome Res 1, Lundgren, D. H., Hwang, S. I., Wu, L., and Han, D. K. (2010) Role of spectral counting in quantitative proteomics, Expert Rev Proteomics 7,
70 43. Lambert, J. P., Ethier, M., Smith, J. C., and Figeys, D. (2005) Proteomics: from gel based to gel free, Anal Chem 77, Romijn, E. P., Krijgsveld, J., and Heck, A. J. (2003) Recent liquid chromatographic- (tandem) mass spectrometric applications in proteomics, J Chromatogr A 1000, Gygi, S. P., Corthals, G. L., Zhang, Y., Rochon, Y., and Aebersold, R. (2000) Evaluation of two-dimensional gel electrophoresis-based proteome analysis technology, Proc Natl Acad Sci U S A 97, Beausoleil, S. A., Jedrychowski, M., Schwartz, D., Elias, J. E., Villen, J., Li, J., Cohn, M. A., Cantley, L. C., and Gygi, S. P. (2004) Large-scale characterization of HeLa cell nuclear phosphoproteins, Proc Natl Acad Sci U S A 101, Aebersold, R. H., Leavitt, J., Saavedra, R. A., Hood, L. E., and Kent, S. B. (1987) Internal amino acid sequence analysis of proteins separated by one- or twodimensional gel electrophoresis after in situ protease digestion on nitrocellulose, Proc Natl Acad Sci U S A 84, Wilm, M., Shevchenko, A., Houthaeve, T., Breit, S., Schweigerer, L., Fotsis, T., and Mann, M. (1996) Femtomole sequencing of proteins from polyacrylamide gels by nano-electrospray mass spectrometry., Nature 379, Havlis, J., and Shevchenko, A. (2004) Absolute quantification of proteins in solutions and in polyacrylamide gels by mass spectrometry, Anal Chem 76, Ihling, C., and Sinz, A. (2005) Proteome analysis of Escherichia coli using highperformance liquid chromatography and Fourier transform ion cyclotron resonance mass spectrometry, Proteomics 5, Martosella, J., Zolotarjova, N., Liu, H., Nicol, G., and Boyes, B. E. (2005) Reversedphase high-performance liquid chromatographic prefractionation of immunodepleted human serum proteins to enhance mass spectrometry identification of lower-abundant proteins, J Proteome Res 4, Moritz, R. L., Clippingdale, A. B., Kapp, E. A., Eddes, J. S., Ji, H., Gilbert, S., Connolly, L. M., and Simpson, R. J. (2005) Application of 2-D free-flow electrophoresis/rp-hplc for proteomic analysis of human plasma depleted of multi high-abundance proteins, Proteomics 5,
71 53. Burggraf, D., Weber, G., and Lottspeich, F. (1995) Free flow-isoelectric focusing of human cellular lysates as sample preparation for protein analysis, Electrophoresis 16, Linke, T., Ross, A. C., and Harrison, E. H. (2006) Proteomic analysis of rat plasma by two-dimensional liquid chromatography and matrix-assisted laser desorption ionization time-of-flight mass spectrometry, J Chromatogr A. 55. Dai, J., Shieh, C. H., Sheng, Q. H., Zhou, H., and Zeng, R. (2005) Proteomic analysis with integrated multiple dimensional liquid chromatography/mass spectrometry based on elution of ion exchange column using ph steps, Anal Chem 77, Jessani, N., Niessen, S., Wei, B. Q., Nicolau, M., Humphrey, M., Ji, Y., Han, W., Noh, D. Y., Yates, J. R., 3rd, Jeffrey, S. S., and Cravatt, B. F. (2005) A streamlined platform for high-content functional proteomics of primary human specimens, Nat Methods 2, Washburn, M. P., Wolters, D., and Yates, J. R. r. (2001) Large-scale analysis of the yeast proteome by multidimensional protein identification technology., Nat Biotechnol. 19, Wu, C. C., MacCoss, M. J., Howell, K. E., and Yates, J. R., 3rd. (2003) A method for the comprehensive proteomic analysis of membrane proteins, Nat Biotechnol 21, Duan, J., Sun, L., Liang, Z., Zhang, J., Wang, H., Zhang, L., Zhang, W., and Zhang, Y. (2006) Rapid protein digestion and identification using monolithic enzymatic microreactor coupled with nano-liquid chromatography-electrospray ionization mass spectrometry, J Chromatogr A 1106, Lim, L. W., Tomatsu, M., and Takeuchi, T. (2006) Development of an on-line immobilized-enzyme reversed-phase HPLC method for protein digestion and peptide separation, Anal Bioanal Chem. 61. Craft, D., Doucette, A., and Li, L. (2002) Microcolumn capture and digestion of proteins combined with mass spectrometry for protein identification, J Proteome Res 1,
72 62. Craft, D., and Li, L. (2005) Integrated sample processing system involving oncolumn protein adsorption, sample washing, and enzyme digestion for protein identification by LC-ESI MS/MS, Anal Chem 77, Wenk, M. R. (2005) The emerging field of lipidomics, Nat Rev Drug Discov 4, van Meer, G., Voelker, D. R., and Feigenson, G. W. (2008) Membrane lipids: where they are and how they behave, Nat Rev Mol Cell Biol 9, Sagin, F. G., and Sozmen, E. Y. (2008) Lipids as key players in Alzheimer disease: alterations in metabolism and genetics, Curr Alzheimer Res 5, Denizot, Y., Desplat, V., Drouet, M., Bertin, F., and Melloni, B. (2001) Is there a role of platelet-activating factor in human lung cancer?, Lung Cancer 33, Montrucchio, G., Sapino, A., Bussolati, B., Ghisolfi, G., Rizea-Savu, S., Silvestro, L., Lupia, E., and Camussi, G. (1998) Potential angiogenic role of platelet-activating factor in human breast cancer, Am J Pathol 153, Tselepis, A. D., and John Chapman, M. (2002) Inflammation, bioactive lipids and atherosclerosis: potential roles of a lipoprotein-associated phospholipase A2, platelet activating factor-acetylhydrolase, Atheroscler Suppl 3, Roudebush, W. E., Massey, J. B., Elsner, C. W., Shapiro, D. B., Mitchell-Leef, D., and Kort, H. I. (2005) The significance of platelet-activating factor and fertility in the male primate: a review, J Med Primatol 34, Pereto, J., Lopez-Garcia, P., and Moreira, D. (2004) Ancestral lipid biosynthesis and early membrane evolution, Trends Biochem Sci 29, Cronan, J. E. (2003) Bacterial membrane lipids: where do we stand?, Annu Rev Microbiol 57, Bleijerveld, O. B., Houweling, M., Thomas, M. J., and Cui, Z. (2006) Metabolipidomics: profiling metabolism of glycerophospholipid species by stable isotopic precursors and tandem mass spectrometry, Anal Biochem 352, Wykle, R. L., O'Flaherty, J. T., and Thomas, M. J. (1988) Platelet-activating factor, Methods Enzymol 163, Bazan, N. G. (1998) The neuromessenger platelet-activating factor in plasticity and neurodegeneration, Prog Brain Res 118,
73 75. Farooqui, A. A., Horrocks, L. A., and Farooqui, T. (2007) Modulation of inflammation in brain: a matter of fat, J Neurochem 101, Fahy, E., Subramaniam, S., Brown, H. A., Glass, C. K., Merrill, A. H., Jr., Murphy, R. C., Raetz, C. R., Russell, D. W., Seyama, Y., Shaw, W., Shimizu, T., Spener, F., van Meer, G., VanNieuwenhze, M. S., White, S. H., Witztum, J. L., and Dennis, E. A. (2005) A comprehensive classification system for lipids, J Lipid Res 46, Whitehead, S. N., Hou, W., Ethier, M., Smith, J. C., Bourgeois, A., Denis, R., Bennett, S. A., and Figeys, D. (2007) Identification and quantitation of changes in the platelet activating factor family of glycerophospholipids over the course of neuronal differentiation by high-performance liquid chromatography electrospray ionization tandem mass spectrometry, Analytical chemistry 79, Bou Khalil, M., Hou, W., Zhou, H., Elisma, F., Swayne, L. A., Blanchard, A. P., Yao, Z., Bennett, S. A., and Figeys, D. (2010) Lipidomics era: accomplishments and challenges, Mass Spectrom Rev 29, Hou, W., Zhou, H., Elisma, F., Bennett, S. A., and Figeys, D. (2008) Technological developments in lipidomics, Brief Funct Genomic Proteomic 7, DeLong, C. J., Baker, P. R., Samuel, M., Cui, Z., and Thomas, M. J. (2001) Molecular species composition of rat liver phospholipids by ESI-MS/MS: the effect of chromatography, J Lipid Res 42, Liang, X., Liu, J., LeBlanc, Y., Covey, T., Ptak, A. C., Brenna, J. T., and McLuckey, S. A. (2007) Electron transfer dissociation of doubly sodiated glycerophosphocholine lipids, J Am Soc Mass Spectrom 18, Harvey, D. J. (2005) A new charge-associated mechanism to account for the production of fragment ions in the high-energy CID spectra of fatty acids, J Am Soc Mass Spectrom 16, Han, X., and Gross, R. W. (2005) Shotgun lipidomics: electrospray ionization mass spectrometric analysis and quantitation of cellular lipidomes directly from crude extracts of biological samples, Mass Spectrom Rev 24, Ekroos, K., Chernushevich, I. V., Simons, K., and Shevchenko, A. (2002) Quantitative profiling of phospholipids by multiple precursor ion scanning on a hybrid quadrupole time-of-flight mass spectrometer, Anal Chem 74,
74 85. Retra, K., Bleijerveld, O. B., van Gestel, R. A., Tielens, A. G., van Hellemond, J. J., and Brouwers, J. F. (2008) A simple and universal method for the separation and identification of phospholipid molecular species, Rapid Commun Mass Spectrom 22, Brugger, B., Erben, G., Sandhoff, R., Wieland, F. T., and Lehmann, W. D. (1997) Quantitative analysis of biological membrane lipids at the low picomole level by nano-electrospray ionization tandem mass spectrometry, Proc Natl Acad Sci U S A 94, Hsu, F. F., and Turk, J. (2003) Electrospray ionization/tandem quadrupole mass spectrometric studies on phosphatidylcholines: the fragmentation processes, J Am Soc Mass Spectrom 14, Ivanova, P. T., Cerda, B. A., Horn, D. M., Cohen, J. S., McLafferty, F. W., and Brown, H. A. (2001) Electrospray ionization mass spectrometry analysis of changes in phospholipids in RBL-2H3 mastocytoma cells during degranulation, Proc Natl Acad Sci U S A 98, Taguchi, R., Hayakawa, J., Takeuchi, Y., and Ishida, M. (2000) Two-dimensional analysis of phospholipids by capillary liquid chromatography/electrospray ionization mass spectrometry, J Mass Spectrom 35, Kerwin, J. L., Tuininga, A. R., and Ericsson, L. H. (1994) Identification of molecular species of glycerophospholipids and sphingomyelin using electrospray mass spectrometry, J Lipid Res 35, Smith, P. B., Snyder, A. P., and Harden, C. S. (1995) Characterization of bacterial phospholipids by electrospray ionization tandem mass spectrometry, Anal Chem 67, Hsu, F. F., and Turk, J. (2000) Charge-remote and charge-driven fragmentation processes in diacyl glycerophosphoethanolamine upon low-energy collisional activation: a mechanistic proposal, J Am Soc Mass Spectrom 11, Hsu, F. F., and Turk, J. (2000) Charge-driven fragmentation processes in diacyl glycerophosphatidic acids upon low-energy collisional activation. A mechanistic proposal, J Am Soc Mass Spectrom 11,
75 94. Hsu, F. F., and Turk, J. (2000) Characterization of phosphatidylinositol, phosphatidylinositol-4-phosphate, and phosphatidylinositol-4,5-bisphosphate by electrospray ionization tandem mass spectrometry: a mechanistic study, J Am Soc Mass Spectrom 11, Hsu, F. F., and Turk, J. (2005) Studies on phosphatidylserine by tandem quadrupole and multiple stage quadrupole ion-trap mass spectrometry with electrospray ionization: structural characterization and the fragmentation processes, J Am Soc Mass Spectrom 16, Hsu, F. F., and Turk, J. (2001) Studies on phosphatidylglycerol with triple quadrupole tandem mass spectrometry with electrospray ionization: fragmentation processes and structural characterization, J Am Soc Mass Spectrom 12, Wenk, M. R., Lucast, L., Di Paolo, G., Romanelli, A. J., Suchy, S. F., Nussbaum, R. L., Cline, G. W., Shulman, G. I., McMurray, W., and De Camilli, P. (2003) Phosphoinositide profiling in complex lipid mixtures using electrospray ionization mass spectrometry, Nat Biotechnol 21, Han, X., and Gross, R. W. (1995) Structural Determination of Picomole Amounts of Phospholipids Via Electrospray Ionization Tandem Mass Spectrometry, J Am Soc Mass Spectrom 6, Ho, Y. P., Huang, P. C., and Deng, K. H. (2003) Metal ion complexes in the structural analysis of phospholipids by electrospray ionization tandem mass spectrometry, Rapid Commun Mass Spectrom 17, Hsu, F. F., and Turk, J. (2000) Characterization of phosphatidylethanolamine as a lithiated adduct by triple quadrupole tandem mass spectrometry with electrospray ionization, J Mass Spectrom 35, Hsu, F. F., Turk, J., Thukkani, A. K., Messner, M. C., Wildsmith, K. R., and Ford, D. A. (2003) Characterization of alkylacyl, alk-1-enylacyl and lyso subclasses of glycerophosphocholine by tandem quadrupole mass spectrometry with electrospray ionization, J Mass Spectrom 38, Hsu, F. F., Bohrer, A., and Turk, J. (1998) Formation of lithiated adducts of glycerophosphocholine lipids facilitates their identification by electrospray ionization tandem mass spectrometry, J Am Soc Mass Spectrom 9,
76 103. Lehmann, W. D., Koester, M., Erben, G., and Keppler, D. (1997) Characterization and quantification of rat bile phosphatidylcholine by electrospray-tandem mass spectrometry, Anal Biochem 246, Schwudke, D., Oegema, J., Burton, L., Entchev, E., Hannich, J. T., Ejsing, C. S., Kurzchalia, T., and Shevchenko, A. (2006) Lipid profiling by multiple precursor and neutral loss scanning driven by the data-dependent acquisition, Anal Chem 78, Han, X., Yang, K., Yang, J., Cheng, H., and Gross, R. W. (2006) Shotgun lipidomics of cardiolipin molecular species in lipid extracts of biological samples, J Lipid Res 47, Han, X., and Gross, R. W. (2003) Global analyses of cellular lipidomes directly from crude extracts of biological samples by ESI mass spectrometry: a bridge to lipidomics, J Lipid Res 44, Ejsing, C. S., Duchoslav, E., Sampaio, J., Simons, K., Bonner, R., Thiele, C., Ekroos, K., and Shevchenko, A. (2006) Automated identification and quantification of glycerophospholipid molecular species by multiple precursor ion scanning, Anal Chem 78, Han, X., Yang, J., Cheng, H., Ye, H., and Gross, R. W. (2004) Toward fingerprinting cellular lipidomes directly from biological samples by two-dimensional electrospray ionization mass spectrometry, Anal Biochem 330, Hsu, F. F., Turk, J., Rhoades, E. R., Russell, D. G., Shi, Y., and Groisman, E. A. (2005) Structural characterization of cardiolipin by tandem quadrupole and multiplestage quadrupole ion-trap mass spectrometry with electrospray ionization, J Am Soc Mass Spectrom 16, Hsu, F. F., and Turk, J. (2008) Structural characterization of unsaturated glycerophospholipids by multiple-stage linear ion-trap mass spectrometry with electrospray ionization, J Am Soc Mass Spectrom 19, Hsu, F. F., and Turk, J. (2007) Differentiation of 1-O-alk-1'-enyl-2-acyl and 1-Oalkyl-2-acyl glycerophospholipids by multiple-stage linear ion-trap mass spectrometry with electrospray ionization, J Am Soc Mass Spectrom 18,
77 112. Smith, J. C., Hou, W., Whitehead, S. N., Ethier, M., Bennett, S. A., and Figeys, D. (2008) Identification of lysophosphatidylcholine (LPC) and platelet activating factor (PAF) from PC12 cells and mouse cortex using liquid chromatography/multi-stage mass spectrometry (LC/MS(3)), Rapid Commun Mass Spectrom 22, Houjou, T., Yamatani, K., Imagawa, M., Shimizu, T., and Taguchi, R. (2005) A shotgun tandem mass spectrometric analysis of phospholipids with normal-phase and/or reverse-phase liquid chromatography/electrospray ionization mass spectrometry, Rapid Commun Mass Spectrom 19, Vernooij, E., Brouwers, J., Kettenes-van den Bosch, J., and Crommelin, D. (2002) RP-HPLC/ESI MS determination of acyl chain positions in phospholipids, J. Sep. Sci. 25, Ho, Y. P., and Huang, P. C. (2002) A novel structural analysis of glycerophosphocholines as TFA/K(+) adducts by electrospray ionization ion trap tandem mass spectrometry, Rapid Commun Mass Spectrom 16, Hvattum, E., Hagelin, G., and Larsen, A. (1998) Study of mechanisms involved in the collision-induced dissociation of carboxylate anions from glycerophospholipids using negative ion electrospray tandem quadrupole mass spectrometry, Rapid Commun Mass Spectrom 12, Han, X., and Gross, R. W. (1994) Electrospray ionization mass spectroscopic analysis of human erythrocyte plasma membrane phospholipids, Proc Natl Acad Sci U S A 91, Koivusalo, M., Haimi, P., Heikinheimo, L., Kostiainen, R., and Somerharju, P. (2001) Quantitative determination of phospholipid compositions by ESI-MS: effects of acyl chain length, unsaturation, and lipid concentration on instrument response, J Lipid Res 42, Pulfer, M., and Murphy, R. C. (2003) Electrospray mass spectrometry of phospholipids, Mass Spectrom Rev 22, Milne, S., Ivanova, P., Forrester, J., and Alex Brown, H. (2006) Lipidomics: an analysis of cellular lipids by ESI-MS, Methods 39,
78 121. Liebisch, G., Drobnik, W., Lieser, B., and Schmitz, G. (2002) High-throughput quantification of lysophosphatidylcholine by electrospray ionization tandem mass spectrometry, Clin Chem 48, Zacarias, A., Bolanowski, D., and Bhatnagar, A. (2002) Comparative measurements of multicomponent phospholipid mixtures by electrospray mass spectroscopy: relating ion intensity to concentration, Anal Biochem 308, Schwudke, D., Liebisch, G., Herzog, R., Schmitz, G., and Shevchenko, A. (2007) Shotgun lipidomics by tandem mass spectrometry under data-dependent acquisition control, Methods Enzymol 433, Laaksonen, R., Katajamaa, M., Paiva, H., Sysi-Aho, M., Saarinen, L., Junni, P., Lutjohann, D., Smet, J., Van Coster, R., Seppanen-Laakso, T., Lehtimaki, T., Soini, J., and Oresic, M. (2006) A systems biology strategy reveals biological pathways and plasma biomarker candidates for potentially toxic statin-induced changes in muscle, PLoS ONE 1, e Krank, J., Murphy, R. C., Barkley, R. M., Duchoslav, E., and McAnoy, A. (2007) Qualitative analysis and quantitative assessment of changes in neutral glycerol lipid molecular species within cells, Methods Enzymol 432, Murphy, R. C., Barkley, R. M., Zemski Berry, K., Hankin, J., Harrison, K., Johnson, C., Krank, J., McAnoy, A., Uhlson, C., and Zarini, S. (2005) Electrospray ionization and tandem mass spectrometry of eicosanoids, Anal Biochem 346, Larsen, A., Uran, S., Jacobsen, P. B., and Skotland, T. (2001) Collision-induced dissociation of glycero phospholipids using electrospray ion-trap mass spectrometry, Rapid Commun Mass Spectrom 15, DeLong, C. J., Shen, Y. J., Thomas, M. J., and Cui, Z. (1999) Molecular distinction of phosphatidylcholine synthesis between the CDP-choline pathway and phosphatidylethanolamine methylation pathway, J Biol Chem 274, Rouzer, C. A., Ivanova, P. T., Byrne, M. O., Milne, S. B., Marnett, L. J., and Brown, H. A. (2006) Lipid profiling reveals arachidonate deficiency in RAW264.7 cells: Structural and functional implications, Biochemistry 45,
79 130. Haroldsen, P. E., Clay, K. L., and Murphy, R. C. (1987) Quantitation of lyso-platelet activating factor molecular species from human neutrophils by mass spectrometry, J Lipid Res 28, Bate, C., Salmona, M., and Williams, A. (2004) The role of platelet activating factor in prion and amyloid-beta neurotoxicity, Neuroreport 15, Bellizzi, M. J., Lu, S. M., Masliah, E., and Gelbard, H. A. (2005) Synaptic activity becomes excitotoxic in neurons exposed to elevated levels of platelet-activating factor, J Clin Invest 115, Xu, Y., Zhang, B., Hua, Z., Johns, R. A., Bredt, D. S., and Tao, Y. X. (2004) Targeted disruption of PSD-93 gene reduces platelet-activating factor-induced neurotoxicity in cultured cortical neurons, Exp Neurol 189, Francescangeli, E., Domanska-Janik, K., and Goracci, G. (1996) Relative contribution of the de novo and remodelling pathways to the synthesis of plateletactivating factor in brain areas and during ischemia, J Lipid Mediat Cell Signal 14, Francescangeli, E., Freysz, L., and Goracci, G. (1996) PAF-synthesizing enzymes in neural cells during differentiation and in gerbil brain during ischemia, Adv Exp Med Biol 416, Francescangeli, E., Grassi, S., Pettorossi, V. E., and Goracci, G. (2002) Activation of PAF-synthesizing enzymes in rat brain stem slices after LTP induction in the medial vestibular nuclei, Neurochem Res 27, Francescangeli, E., Lang, D., Dreyfus, H., Boila, A., Freysz, L., and Goracci, G. (1997) Activities of enzymes involved in the metabolism of platelet-activating factor in neural cell cultures during proliferation and differentiation, Neurochem Res 22, Kornecki, E., and Ehrlich, Y. H. (1988) Neuroregulatory and neuropathological actions of the ether-phospholipid platelet-activating factor, Science 240, Southall, M. D., Isenberg, J. S., Nakshatri, H., Yi, Q., Pei, Y., Spandau, D. F., and Travers, J. B. (2001) The platelet-activating factor receptor protects epidermal cells from tumor necrosis factor (TNF) alpha and TNF-related apoptosis-inducing ligand- 57
80 induced apoptosis through an NF-kappa B-dependent process, J Biol Chem 276, Li, T., Southall, M. D., Yi, Q., Pei, Y., Lewis, D., Al-Hassani, M., Spandau, D., and Travers, J. B. (2003) The epidermal platelet-activating factor receptor augments chemotherapy-induced apoptosis in human carcinoma cell lines, J Biol Chem 278, Brewer, C., Bonin, F., Bullock, B., Nault, M.-C., Morin, J., Imbeault, S., Shen, T. Y., Franks, D. J., and Bennett, S. A. L. (2002) Platelet activating factor-induced apoptosis is inhibited by ectopic expression of the platelet activating factor G-protein coupled receptor, J Neurochem 82, Ryan, S. D., Harris, C. S., Carswell, C. L., Baenziger, J. E., and Bennett, S. A. (2008) Heterogeneity in the sn-1 carbon chain of platelet-activating factor glycerophospholipids determines pro- or anti-apoptotic signaling in primary neurons, Journal of lipid research 49,
81 Chapter 2 Experiments 2.1 Proteomic Experiments Materials Ammonium bicarbonate, dithiothreitol (DTT) and sodium carbonate were purchased from EMD Chemicals, Inc. (Darmstadt, Germany); N-2-Hydroxyethylpiperazine-N-2-Ethane Sulfonic Acid (HEPES), Magnesium acetate, ethylene glycol tetraacetic acid (EGTA), ethylenediaminetetraacetic acid (EDTA) and nonidet P-40 (NP-40) were obtained from Sigma-Aldrich (Saint Louis, MO). Glycerol was purchased from MP Biomedicals. Standard proteins ovalbumin (catalogue number A7641), fetuin A (F3004), serum albumin (A9056), carbonic anhydrase 2 (C3934), serotransferrin (T1408) and lysozyme C (L7651) were obtained from Sigma-Aldrich (Saint Louis, MO); sequencing grade trypsin was purchased from Promega (Madison, WI); chymotrypsin and Glu-C were obtained from Roche Applied Science (Indianapolis, IN); DMEM medium was from GIBCO-BRL (Burlington, ON); protease inhibitor cocktail was from Sigma-Aldrich (Saint Louis, MO); Bradford protein assay kit was from Bio-Rad (Hercules, CA). Strong cation exchange (SCX) beads were obtained from the Nest Group (Southboro, MA) or Polymer Laboratories, Varian, Inc.; Strong anion exchange beads were obtained from Polymer Laboratories, Varian, Inc; prototypical SCX Plates (reactor plate) were graciously provided by Millipore (Billerica, MA); the MultiScreen HTS Vacuum Manifold was obtained from Millipore (Billerica, MA). The 5 µm C18 beads were from Waters (Milford, MA); 10 µm picotip emitters were purchased from New Objective (Woburn, MA); Acetonitrile with 0.1% formic acid and water with 0.1% formic acid were purchased from J.T. Baker (Phillipsburg, NJ). 59
82 2.1.2 Cell culture and cell lysis Mouse P19 testicular cancer cells were cultured at 37 C in 5% CO 2 in DMEM medium (GIBCO-BRL, Burlington, ON) supplemented with 10%(v/v) fetal calf serum (1-2). Cells were harvested and washed twice with phosphate buffered saline (PBS). Cell lysis was performed using a modified RIPA lysis buffer (50 mm Tris-HCl ph 7.4, 150 mm NaCl, 1%(w/v) NP-40, 0.25%(w/v) Na deoxycholate, 1 mm EDTA, protease inhibitor cocktail). Collected cells were placed on ice with RIPA buffer for 10 minutes, and cell lysates were centrifuged for 10 min at 14,000 rpm to pellet cell debris. Supernatants were collected and protein concentration was assessed using a Bradford protein assay kit (Bio-Rad, Hercules, CA) with bovine serum albumin as the standard (Sigma, St. Louis, MO). Human MCF-7 breast epithelial cancer cells were cultured at 37 C in 5% CO 2 in a DMEM medium (GIBCOBRL, Burlington, ON) supplemented with 10% (v/v) fetal bovine serum (2). The cells were harvested following treatment with trypsin, washed with phosphate buffered saline (PBS), and re-suspended in a 2 ml hypotonic buffer (50 mm Tris ph 7.5, 1 mm DTT, 1 mm EDTA, 5 mm CaCl 2, 5 mm MgCl 2, protease inhibitor cocktail) on ice for 10 min. Crude cell homogenate was then centrifuged at 3000 g for 15 minutes. Supernatants were collected and aliquots were stored at -80 C. The protein concentration was assessed using Bio-Rad DC protein assay (Bio-Rad, Hercules, CA) with bovine serum albumin as the standard (Sigma, St. Louis, MO). Saccharomyces cerevisiae yeast cells were grown on a 200 ml plate to an OD 600 of 0.8 at which point the cell pellets were harvested by centrifugation and washed with water (3). The cell pellets were then frozen at -80 C until ready to be used. The cell pellets were resuspended in an equivalent volume of lysis buffer (100 mm HEPES ph 8.0, 20 mm magnesium acetate, 10% glycerol (v/v), 10 mm EGTA, 0.1 mm EDTA, protease inhibitors cocktail) and frozen in liquid nitrogen in small droplets and lysed using a coffee grinder halffilled with dry ice for 1 minute. The dry ice was allowed to evaporate, and the resulted whole cell extract was sonicated three times for 30 seconds with at least 1 minute on ice between each pulse. Nonidet P-40 (NP-40) was added to a final concentration of 0.4% (w/v), and the sample was manually mixed for 30 seconds. The extract was clarified by centrifugation at 60
83 14000 rpm for 15 minutes (4ºC) and the supernatant was transferred to a fresh tube. The final protein concentration was determined using a Bradford protein assay kit (Bio-Rad) Protein sample preparation/digestion Protein digestion using proteomic reactor As described in publications (1-3), protein samples were processed using the SCX proteomic reactor, SCX plate reactor, and SAX proteomic reactor described in this thesis. Detailed protocols to process protein samples using the SCX proteomic reactor will be described in chapter 3.1.2; the protocol to process protein samples using the SCX plate reactor will be described in chapter 3.2.4; and the protocol to process protein samples using SAX proteomic reactor will be described in chapter In-solution protein digestion The in-solution digestion of P19 cell lysate was performed as described previously (1, 3). The RIPA buffer from the protein extract was exchanged using a centricon YM-3 filter (Millipore, Billerica, MA) washed three times with 20 mm TRIS, 150 mm NaCl ph 7.4 buffer. The protein concentration was then determined by Bradford assay. Three aliquots of P19 lysate each corresponding to 10 µg of total protein were then dissolved in 100 μl of 100 mm NH 4 HCO 3 buffer containing 10 mm dithiothreitol (ph 8.0). After incubation at 37 C for 2 h, the protein solution was added with 2 μl of 1 M iodoacetamide and incubated in the dark for additional 30 min at room temperature. 1.5 μl of 1 M dithiothreitol was then added to react with the remaining iodoacetamide. Digestion was performed with 2.5 µg of trypsin at 37 C overnight. The solvent was then evaporated and the sample was reconstituted in a final volume of 40 µl of 200 mm ammonium bicarbonate and 4 µl of 50% (v/v) formic acid, which is the same solvent used for the reactor samples prior to HPLC-MS analysis. For the standard protein mixture, a total of 10 μg of standard protein sample was dissolved in 50 μl 100 mm NH 4 HCO 3 buffer containing 10 mm dithiothreitol (ph 8.0) (1, 61
84 3). After incubation at 37 C for 2 h, 2 μl of 1 M iodoacetamide was added and the solution was incubated in the dark for an additional 30 min at room temperature. 1.5 μl of 1 M DTT was then added to react with the remaining iodoacetamide. An in-solution digestion was performed with trypsin (1/4 amount of the protein) at 37 C overnight. The tryptic digestion was quenched by adding formic acid to a final concentration of 2% (v/v) HPLC-MS/MS experiments The 40 µl peptide mixture obtained from the P19 cell lysate digested with SCX reactor were acidified with 4 µl of 50% (v/v) formic acid (1). The resulting peptides were then analyzed with a HPLC-ESI-MS/MS system, where a LCQ DecaXP instrument (Thermo-Finnigan, San Jose, CA) was integrated with a micro flow HPLC 1100 system (Agilent, Palo Alto, CA). 5 µl of each sample was first loaded onto a 4 cm X 75 µm ID precolumn packed with 5 µm C18 beads (Waters, Milford, MA) using a micro flow HPLC 1100 system (Agilent, Palo Alto, CA). The peptides were then separated with a 5 cm X 75 µm ID C18 column integrated with a 10 µm picotip emitter (New Objective, Woburn, MA) using a 5-80% (v/v) linear gradient of acetonitrile with 0.1% (v/v) formic acid over 2 hours. The analytical column was also packed with 5 µm C18 beads. The flow rate through the column was approximately 200 nl/min. Data dependant MS scans were performed, where the three most intense ions in each MS spectrum were subjected to MS/MS analysis using collision induced dissociation. The experiments were performed in dynamic exclusion mode, where a peak could be sequenced a maximum of three times before being excluded for 3 minutes. The peptides obtained from the P19 cell lysate digested with the SCX plate reactor were analyzed using a QSTAR Pulsar quadrupole-tof mass spectrometer (ABI/MDS Sciex, Concord, ON) (2). 8 µl out of 25 µl total elution volume were loaded onto a 75 µm 50 mm pre-column (5 µm YMC ODS-A C18 beads, Waters, Milford, MA) at µl/min using an Agilent 1100 series HPLC system (Agilent Technologies, Palo Alto, CA). Following a 12 minutes desalting step, the flow was split and peptides were eluted through a second 75 µm 50 mm column (5 µm YMC ODS-A C18 beads) at approximately 200 nl/min using a 5-80% (v/v) gradient of acetonitrile with 0.1% (v/v) formic acid over 1.5 hrs. 62
85 The LC effluent was interfaced with the QSTAR Pulsar quadrupole-tof mass spectrometer via a 10 µm picotip emitter (New Objective, Woburn, MA) by electrospray ionization. Data dependant MS scans were performed, where the four most intense ions in each MS spectrum were subjected to MS/MS analysis using CAD. A peak could be sequenced a maximum of three times before being excluded for 3 minutes. The peptides derived from the MCF-7 fractions digested with the SCX plate reactor were analyzed using a LCQ Deca XP mass spectrometer (ThermoFinnigan, San Jose, CA) (2). 8 µl of the total 30 µl of resulting peptides were loaded onto a LC setup as described above. Again, data dependant MS scans were performed, where the three most intense ions in each MS spectrum were subjected to MS/MS analysis using CAD. The experiments were performed in dynamic exclusion mode. A peak could be sequenced a maximum of three times before being excluded for 3 minutes. The peptides of yeast samples and protein standard mixtures that were eluted from the SAX or SCX reactors were acidified with formic acid and loaded onto a 200 μm 50 mm fused silica precolumn that was packed in-house with 5 cm of 5-μm YMC ODS-A C18 beads (Waters Co., Milford, MA) using an 1100 micro-hplc system (Agilent Technologies, Santa Clara, CA) (3). Following a desalting step, the flow was split, and peptides were eluted through a second 75 μm 50 mm column packed with the same beads at approximately 200 nl/min. The peptides were eluted using a 2-h gradient (5-80% acetonitrile(v/v) with 0.1% formic acid (v/v)) into an ESI LTQ linear ion trap mass spectrometer (Thermo Electron, Waltham, MA). MS/MS spectra were acquired in a data-dependent acquisition mode that automatically selected and fragmented the ten most intense peaks from each of the MS spectrum generated Data analysis In this thesis, all the MS/MS spectra recorded were analyzed using Mascot (Matrix Science, Boston, MA). The MS/MS spectra recorded for peptides from P19 cell lysate, digested with SCX reactor and in-solution digestion, were analyzed using Mascot using the 63
86 following parameters: oxidation (M) as an optional modification, a maximum of 2 tryptic miscleavages, a peptide tolerance of 2 Da and a MS/MS tolerance of 0.8 Da, mus taxonomy and 2+ and 3+ precursor ions only (1). Only the proteins with at least one new peptide were kept (Require Bold Red option in Mascot). A Mascot peptide score threshold of 15 was used for the peptide scores on the LCQ, which is above the significance level indicating identity or extensive homology (4). It should be noted that the efficacy of digesting proteins using the SCX proteomic reactors was assessed by comparing the total number of proteins identified to those identified using the in-solution protein digestion method, where the same criteria for protein/peptide identification were applied. The MS/MS spectra recorded for peptides from P19 cell lysate, digested with the SCX plate reactor, were searched against the mouse taxonomy in the NCBI non-redundant database using Mascot; data files from all the 35 fractions of MCF7 cell lysates, digested with SCX plate reactor, were searched against the human taxonomy in the NCBI nr database using Mascot (2). The Mascot peptide and MS/MS tolerances for the experiment performed on a QSTAR mass spectrometer were set to ±100 ppm and 0.2 Daltons, respectively. The Mascot peptide and MS/MS tolerances were set for the LCQ Deca XP experiments at 2 and 0.8 Daltons, respectively. For all experiments, 1 missed cleavage was allowed and the ion score threshold was set at 20. In addition, the protein cut-off score was set at 39 (5). The MS/MS spectra from the yeast samples, digested with SAX and SCX reactors and in-solution approach, were searched against a database consisting of the Saccharomyces Genome Database ( protein entries, released December 2, 2008) and the reverse sequence of all protein entries (3). Mascot (Matrix Science) was used to search the protein sequence database using the following parameters: carbamidomethyl (C) was set as a fixed modification, and oxidation (M, Da) was set as a variable modification. The precursor and fragment mass tolerances for the LTQ data were set at 2.0 and 0.8 Da, respectively. Mascot ion cut off scores were set to 30. Furthermore, only the peptides that ranked first with a probability-based Mowse (expect) P- value smaller than 0.05 were accepted (6). 64
87 2.2 Lipidomic Experiments Materials: 1-O-hexadecyl-2-acetyl-sn-glycero-3-phosphocholine (C16:0 PAF), 1-O-hexadecyl- 2-hydroxy-sn-glycero-3-phosphocholine (C16:0 lyso-paf), 1-O-octadecyl-2-acetyl-snglycero-3-phosphocholine (C18:0 PAF), and 1-O-octadecyl-2-hydroxy-sn-glycero-3- phosphocholine (C18:0 lyso-paf) were purchased from Biomol Research Laboratories (Plymouth Meeting, PA). The C13:0 lyso-phosphatidylcholine (C13:0 LPC) and diacyl glycerophospholipid standards PA (12:0/13:0), PA (17:0/14:1), PA (17:0/20:4), PS (12:0/13:0), PS (17:0/14:1), PS (17:0/20:4), PG (12:0/13:0), PG (17:0/14:1), PG (17:0/20:4), PI (12:0/13:0), PI (17:0/14:1), PI (17:0/20:4), PE (12:0/13:0), PE (17:0/14:1), and PE (17:0/20:4) were quantitative standards from Avanti Polar Lipids, Inc. (Alabaster, AL). Chloroform and methanol were liquid chromatography grade from Fisher Scientific (Waltham, MA). Ammonium acetate was purchased from Sigma Chemical Co. (St. Louis, MO). Cell media and fetal bovine serum (FBS) was from Invitrogen (Carlsbad, California). Bovine serum albumin was from Sigma (St Louis, MO). The 5 µm C18 beads were from Waters (Milford, MA); 10 µm picotip emitters were purchased from New Objective (Woburn, MA); Acetonitrile with 0.1% formic acid(v/v) and water with 0.1% formic acid(v/v) were purchased from J.T. Baker (Phillipsburg, NJ) Cell culture, tissue samples and lipid extraction Rat pheochromocytoma PC12 cells originally obtained from the American Type Tissue Collection were cultured in RPMI containing 10% (v/v) horse serum and 5% (v/v) newborn calf serum (complete media) at 37 C in a 5% CO 2 /95% air atmosphere (7). PC12 cells were differentiated to a neuronal phenotype by seeding at a density of 5x10 4 cells/dish on 10 cm diameter tissue culture plates coated with 2 µg/ml rat tail collagen (Roche, Mississauga, ON). Twenty-four hours after plating, cells were cultured in differentiation media (RPMI containing 0.5% (v/v) heat-inactivated horse serum and 50 ng/ml 7S nerve 65
88 growth factor (NGF, Sigma)). Cells were fed every second day for 7 days. Untreated controls were seeded at a density of 1x10 5 cells/dish and lipids extracted 72 h after plating. Plating controls seeded and cultured at the same time were counted immediately prior to lipid extraction to establish final cell number (PC12 cells 1.79e7, NGF-differentiated PC12 cells 2.34e6). All culture reagents were obtained from Invitrogen (Burlington, ON) except where indicated. Glycerophospholipids were extracted according to a modified Bligh/Dyer procedure (8-9). Briefly, media was removed from each plate and cells were washed extensively with 10 mm phosphate buffered saline. Cultures of undifferentiated PC12 and NGF-differentiated PC12 cells were placed on ice and 1 ml of ice-cold methanol acidified with 2% (v/v) acetic acid was added to each plate. Cells were then scraped and collected in acidified methanol. Four plates per condition were harvested and pooled. Lipids were extracted using a volumetric ratio of 0.95 of chloroform and 0.8 of 0.1 M sodium acetate (aq) per volume of methanol in acidwashed borosilicate glass tubes (Fisher, Ottawa, ON). Phospholipids were collected from the organic phase after layer separation by centrifugation. The aqueous phase was then backextracted three times in the organic phase of a wash solution prepared by combining RPMI % BSA, methanol, chloroform, and sodium acetate in the volumetric ratio of 1:2.5:3.75:1. The organic fractions were combined, evaporated under a stream of nitrogen gas, and dissolved in 300 µl EtOH. Alzheimer brain from deceased patients (74+8 yrs) was obtained from the Douglas Hospital Research Centre Brain Bank (Montreal, Canada). Control patients (78+16 yrs) suffered sudden death due to non-neurological complications. At autopsy, parahippocampal gyri were removed and flash-frozen in liquid nitrogen without fixation for lipid extraction. Post-mortem delay was between 5 and 25 h. TgCRND8 mice, expressing a double mutant (M146L and L286V) form of the human amyloid precursor protein under the control of the PrP gene promoter (10), and NonTg littermate controls were sacrificed between weeks of age via lethal injection of euthanol. Cerebral cortices (posterior cortex, temporal lobe) were removed on ice. All manipulations were performed in compliance with approved institutional protocols and 66
89 according to the strict ethical guidelines for animal experimentation established by the Canadian Council for Animal Care. Human hnt neurons were generated from NT2/D1 precursor cells (11). Cultures were treated with Aβ 42 (25 µm) prepared as soluble oligomers (12) for 6 and 24 hours, respectively. All treatments were carried out in serum-free media containing 0.025% bovine serum albumin to ensure neurons were not exposed to the secreted PAF acetylhydrolase (PAF-AH) isoform present in serum supplements. No degradation of exogenous PAF in media was detected under these conditions confirming the absence of PAF-AH activity in treatment media. Glycerophospholipids were extracted according to a modified Bligh/Dyer procedure (8-9). Briefly, tissue and cell pellets were weighed and placed in 1 ml of ice-cold methanol acidified with 2% acetic acid. Human samples were spiked with ng C13:0 LPC at time of extraction (13). Lipids were extracted using a volumetric ratio of 0.95 of chloroform and 0.8 of 0.1 M Na acetate (aq) per volume of MeOH in acid-washed borosilicate glass tubes (Fisher, Ottawa, ON). Phospholipids were collected from the organic phase after layer separation by centrifugation (1500 rpm, 15 min, 4ºC). The aqueous phase was then back-extracted three times in the organic phase of a wash solution prepared by combining RPMI % BSA, methanol, chloroform, and sodium acetate in the volumetric ratio of 1:2.5:3.75:1. The organic fractions were combined, evaporated under a stream of nitrogen gas, and dissolved in 300 µl EtOH. The expression plasmid pcdna3.1/v5-his-topo containing mouse lipin-1 coding sequences (14) was transfected into rat hepatoma McA-RH7777 cells using the calcium phosphate precipitation method, and stable transformants were obtained following selection with G418(15). The cells were maintained at 37ºC in a 5% CO 2 humidified incubator in Dulbecco's Modified Eagle Medium (DMEM) supplemented with 10% fetal bovine serum (v/v), 10% horse serum(v/v), 1% antibiotyc-antimycotic solution(v/v) (Invitrogen) and 200 μg/ml G418. Lipids were extracted from rat hepatoma cells over expressing lipin-1 (~4X10 7 ) with chloroform/methanol/acetic acid/saturated NaCl/H 2 O (4:2:0.1:1:2, v/v) (16). After phase separation by centrifugation (1500 rpm, 15 min, 4ºC), the organic phase fraction 67
90 was collected and evaporated under a stream of nitrogen gas, followed by dissolving in 300 μl methanol (17) HPLC-ESI-MS/MS experiments HPLC-ESI-MS/MS system A micro flow 1100 HPLC system (Agilent, Palo Alto, CA) was used to introduce the analytes into a 2000 Q TRAP mass spectrometer (7, 13). The solvents used were water and acetonitrile each with 0.1% formic acid (J.T.Baker, Phillipsburg, NJ). Samples were loaded successively onto an Agilent 96-well sampling plate, which was then covered with a pre-slit well cap and thermostated at 4 o C. An Agilent 1100 autosampler was employed to introduce the analytes onto a 200 um x 50 mm pre-column packed with 5 µm YMC ODS-A C18 beads (Waters, Milford, MA) at a flow rate of 10 µl/min. Following the completion of loading 40 µl of analyte, the HPLC flow was split and the analyte was eluted through a 75 um x 50 mm picotip emitter (New Objective, Woburn, MA), which was interfaced with the mass spectrometer via electrospray ionization, at ~200 nl/min. The emitter was packed with the same beads as those of the pre-column. A linear gradient was used to separate the glycerophospholipid species. The gradient of the HPLC was increased from 5% to 60% acetonitrile(v/v) in 1.5 minutes, from 60% to 80% acetonitrile(v/v) over the next 35 minutes, and from 80% to 95% acetonitrile(v/v) over the next 4 minutes. Most of the lipid species were eluted from the columns between 60% to 80% acetonitrile(v/v). The column was then washed with 95% acetonitrile (v/v) for ~ 40 minutes, followed by regeneration at 95% H 2 O for 15 minutes (7, 13). Data were collected on a Q-TRAP 2000 mass spectrometer operated with Analyst (Applied Biosystems/MDS Sciex, Concord, ON). In the detection process, total lipid extract were analyzed by Enhanced MS scan over the range of m/z from 450 to 600. The glycerophosphocholine species were further analysed in positive ion mode using precursor ion scan for an MS/MS fragment with a mass to charge ratio (m/z) of 184.0, a diagnostic fragment of phosphocholine (18). The resolution for both Q1 and Q3 were set at low to 68
91 maximize the sensitivity for ion detection. Capillary voltage was 3.5 kv. Nitrogen served as the collision gas and the collision energy was 40 ev (7, 13) Lipid sample preparation Lipid extract was normally diluted appropriately to avoid overloading the LC-MS system. Lipid extract from differentiated PC12 cells was diluted by a factor of 8 prior to MS analysis. For absolute quantitation of the four PAF family species, 8 L of lipid extract, 5 L of a standard solution containing known amount of C16:0, C18:0 PAF and C16:0, C18:0 lyso-paf, and 27 µl of H 2 O with 0.1% (v/v) formic acid were mixed together to bring the final volume to 40 µl. Five standard solutions containing 200, 400, 600, 800, and 1000 pg each of C16:0, C18:0 PAF and C16:0, C18:0 lyso-paf were used in the experiment. At each standard addition concentration, samples were analyzed in triplicate (7). For relative quantification of PAF family species and other glycerophosphocholine species, 46 µl, consisting of 10 µl of lipid extract, 5 µl of deuterated standards (d 4 -C16:0 PAF/d 4 -C 16 -lyso-paf) at final concentration of 2.5 ng/species, and 31 µl of 0.1% (v/v) formic acid in H 2 O, was analyzed per MS run (13) Data analysis Analyst (Applied Biosystems/MDS Sciex) was used to measure the peak areas of the lipid species of interest from their respective extracted ion chromatograph (XIC), which was extracted from the precursor ion scan of m/z 184 (7, 13). For absolute quantification, concentrations of the native PAF species were calculated using the regression curve when y=0 and expressed as the mean of the triplicate samples 95% confidence interval (7). The 95% confidence interval was determined using the Student s t-test. PAF species data were then standardized to total cell number and expressed as pg per 10 6 cells. Tissue wet weight in grams was divided by the specific gravity of brain tissue (1.050) to obtain the volume in ml for molar calculations (19). 69
92 For relative quantification, lipid samples were spiked with identical amount (e.g ng for human tissue samples) of C13:0 LPC at time of extraction (13). Peak areas of the lipid species of interest were normalized with respect to that of the internal standard C13:0 lyso-phosphatidylcholine (C13:0 LPC). Deuterated standards (d 4 -C16:0 PAF/d 4 -C 16 - lyso-paf) were used to identify C16:0 PAF and/or C 16 -lyso-paf from other isobaric lipid species, as the deuterated and normal C16:0 PAF and C 16 -lyso-paf had the same elution time Shotgun lipidomics (ESI-MS/MS) The mixture of lipid standards was prepared by taking equal volumes of each lipid standard solution (17). The final concentration of each lipid standard was around 1 µm. After vortexing, the mixture of lipid standards was transferred to a QSTAR Pulsar QqTOF mass spectrometer (MDS Sciex, Concord, ON, Canada) using a syringe pump at a flow rate of 250 nl/min, controlled by Analyst software. For the lipid extract from rat hepatoma cells over expressing lipin-1, 50 µl of lipid samples were diluted with an equal volume of methanol, followed by spiking with 3 µl of ammonium acetate at a concentration of 250 mm so that the final concentration of ammonium acetate in the lipid sample was around 7.5 mm. The sample was then introduced into the mass spectrometer with the syringe pump at 250 nl/min. The nano-spray needle potential was set at -1,200 V and the declustering potential (DP) was set at -30 ev (17). The mixture of lipid standards was first monitored by TOF MS until the total ion current (TIC) became stable. Product ion spectra of each lipid standard were then recorded sequentially at collision energies from 20 to 70 ev for PA, PS, PG, and PE, and from 20 to 80 ev for PI. Each product ion spectrum was recorded for 2 minutes to minimize the influence of signal intensity fluctuation. Quadrupole Q1 was operated at unit resolution. For the analyses of the lipid extract from the lipin 1α cell line, precursor ion scans of m/z -153 and -196 were first performed to highlight molecular ions of PA/PS/PG/PI and PE, respectively (17). Quadrupole Q1 was operated at unit resolution and ~20 ms dwell time with 70
93 step size of 0.3 Da. Product ion scans were then carried out for the lipid species of interest, each spectrum recorded for up to 2 minutes. For PI species, the collision energy was set at 55 ev. For all the other glycerophospholipids, the product ion scans were performed at 40 ev. 71
94 References 1. Ethier, M., Hou, W., Duewel, H. S., and Figeys, D. (2006) The proteomic reactor: a microfluidic device for processing minute amounts of protein prior to mass spectrometry analysis, J Proteome Res 5, Hou, W., Ethier, M., Smith, J. C., Sheng, Y., and Figeys, D. (2007) Multiplexed proteomic reactor for the processing of proteomic samples, Anal Chem 79, Zhou, H., Hou, W., Lambert, J. P., and Figeys, D. (2010) New ammunition for the proteomic reactor: strong anion exchange beads and multiple enzymes enhance protein identification and sequence coverage, Anal Bioanal Chem 397, Mawuenyega, K. G., Kaji, H., Yamuchi, Y., Shinkawa, T., Saito, H., Taoka, M., Takahashi, N., and Isobe, T. (2003) Large-scale identification of Caenorhabditis elegans proteins by multidimensional liquid chromatography-tandem mass spectrometry, J Proteome Res 2, Kapp, E. A., Schutz, F., Connolly, L. M., Chakel, J. A., Meza, J. E., Miller, C. A., Fenyo, D., Eng, J. K., Adkins, J. N., Omenn, G. S., and Simpson, R. J. (2005) An evaluation, comparison, and accurate benchmarking of several publicly available MS/MS search algorithms: sensitivity and specificity analysis, Proteomics 5, Elias, J. E., Haas, W., Faherty, B. K., and Gygi, S. P. (2005) Comparative evaluation of mass spectrometry platforms used in large-scale proteomics investigations, Nat Methods 2, Whitehead, S. N., Hou, W., Ethier, M., Smith, J. C., Bourgeois, A., Denis, R., Bennett, S. A., and Figeys, D. (2007) Identification and quantitation of changes in the platelet activating factor family of glycerophospholipids over the course of neuronal differentiation by high-performance liquid chromatography electrospray ionization tandem mass spectrometry, Anal Chem 79, Bonin, F., Ryan, S. D., Migahed, L., Mo, F., Lallier, J., Franks, D. J., Arai, H., and Bennett, S. A. L. (2004) Anti-apoptotic actions of the platelet activating factor acetylhydrolase I alpha 2 catalytic subunit, J Biol Chem 279,
95 9. Bligh, E. G., and Dyer, W. J. (1959) A rapid method of total lipid extraction and purification, Can J Biochem Physiol 37, Chishti, M. A., Yang, D. S., Janus, C., Phinney, A. L., Horne, P., Pearson, J., Strome, R., Zuker, N., Loukides, J., French, J., Turner, S., Lozza, G., Grilli, M., Kunicki, S., Morissette, C., Paquette, J., Gervais, F., Bergeron, C., Fraser, P. E., Carlson, G. A., George-Hyslop, P. S., and Westaway, D. (2001) Early-onset amyloid deposition and cognitive deficits in transgenic mice expressing a double mutant form of amyloid precursor protein 695, J Biol Chem 276, Pleasure, S. J., Page, C., and Lee, V. M.-Y. (1992) Pure, postmitotic, polarized human neurons derived from NTera 2 cells provide a system for expressing exogenous proteins in terminally differentiated neurons, J. Neurosci. 12, Klein, W. L. (2002) Abeta toxicity in Alzheimer's disease: globular oligomers (ADDLs) as new vaccine and drug targets, Neurochem Int 41, Ryan, S. D., Whitehead, S. N., Swayne, L. A., Moffat, T. C., Hou, W., Ethier, M., Bourgeois, A. J., Rashidian, J., Blanchard, A. P., Fraser, P. E., Park, D. S., Figeys, D., and Bennett, S. A. (2009) Amyloid-beta42 signals tau hyperphosphorylation and compromises neuronal viability by disrupting alkylacylglycerophosphocholine metabolism, Proc Natl Acad Sci U S A 106, Peterfy, M., Phan, J., and Reue, K. (2005) Alternatively spliced lipin isoforms exhibit distinct expression pattern, subcellular localization, and role in adipogenesis, J Biol Chem 280, Chen, C., and Okayama, H. (1987) High-efficiency transformation of mammalian cells by plasmid DNA, Mol Cell Biol 7, Tran, K., Thorne-Tjomsland, G., DeLong, C. J., Cui, Z., Shan, J., Burton, L., Jamieson, J. C., and Yao, Z. (2002) Intracellular assembly of very low density lipoproteins containing apolipoprotein B100 in rat hepatoma McA-RH7777 cells, J Biol Chem 277, Hou, W., Zhou, H., Bou Khalil, M., Seebun, D., Bennett, S. A., and Figeys, D. (2011) Lyso-form fragment ions facilitate the determination of stereospecificity of diacyl glycerophospholipids, Rapid Commun Mass Spectrom 25,
96 18. Brugger, B., Erben, G., Sandhoff, R., Wieland, F. T., and Lehmann, W. D. (1997) Quantitative analysis of biological membrane lipids at the low picomole level by nano-electrospray ionization tandem mass spectrometry, Proc Natl Acad Sci U S A 94, Nelson, S. R., Mantz, M. L., and Maxwell, J. A. (1971) Use of specific gravity in the measurement of cerebral edema, J Appl Physiol 30,
97 Chapter 3 Developing proteomic reactor techniques for processing complex protein samples 3.1 Developing a SCX Proteomic Reactor Introduction Different proteomic approaches have been developed over the years which commonly require the processing of proteins into peptides before they are analyzed by mass spectrometry (1-4). In gel-based experiments, such as the well established 2D gel electrophoresis approach (5), the separated proteins are difficult to extract from the polyacrylamide gel (6). Instead, proteins are enzymatically cleaved into peptides in the gel (7) before they can be extracted and analyzed. Unfortunately, protein/peptide loss and contamination are hard to avoid with 2D gel electrophoresis (8) and the proteins are digested in a large volume of solution (typically 25 µl). Gel-free proteomics has been proposed as a complementary approach to 2D gel electrophoresis (9). These gel-free approaches rely on either solution based protein separations such as size exclusion (10), reverse-phase liquid chromatography (11), free-flow electrophoresis (FFE) (12-13) and 2D chromatography (14), or peptide separations (15-18). In these approaches, the proteins are digested in a large volume of solution either before or after separation. Even though gel-free approaches bypass the need for gels, they do not address the fundamental issue of efficiency of protein processing. Various approaches to in-solution digestion have been proposed, but they have notable limitations. For example, two groups have reported approaches for processing proteins using immobilized trypsin in monolithic columns followed by peptide fractionation (19-20). Unfortunately, no protein preconcentration is associated with these approaches. This means that the samples must have low amounts of contaminants and high levels of 75
98 proteins. Another group reported protein separation coupled to immobilized trypsin (21-22) In these studies, protein separation is performed at the same time as the digestion followed by mass spectrometry. However, peptide fractionation is not performed in this approach, which drastically limits the number of proteins that can be handled by the systems. Craft et al. (23-24) digested proteins by absorbing them on a hydrophobic support, introducing trypsin, gradually eluting them, and then analysing the resulting peptides by mass spectrometry. Unfortunately, this technique required a high amount of sample (200 ng per protein) and was only successful for standard protein solutions which were contaminant free. In general, these approaches require further development before being readily amenable to real biological samples. This section presents the development of a single microfluidic device, termed the proteomic reactor to simplify and improve the processing of proteomic samples. We postulated that microfluidic volume could be used to decrease sample loss during proteomic analysis, while a small bed of extraction material incorporated within the microfluidic path could be used to more efficiently perform extractions and reactions on proteins and peptides. At the core of the proteomic reactor is the ability to use multiple ionic interactions between proteins and the bed of the reactor to extract proteins from solution. The first generation of the proteomic reactor contains a small bed of packed strong cation exchange material (SCX). The proteomics samples are resuspended in a low ph buffer, spiked with trypsin and loaded onto the reactor (Figure 3.1.1b). The vast majority of proteins in proteomics samples will be multiply charged due to the protonation of lysine, arginine, histidine, and N-termini at ph lower than 3. As well, the majority of proteins will also be deprotonated (or carrying very few charges) at ph=8. This means that at low ph most proteins can have multiple ionic interactions with charge surfaces whereas at physiological ph these interactions will be much fewer. As well, at low ph trypsin remains stable but is inactivated. Therefore, at low ph a strong cation exchanger bed incorporated within the reactor can readily extract most proteins without issues of isocratic elution. This is often an issue disregarded in microfluidics. However, real biological samples are present in relatively large volumes ( µl) which are a few orders of magnitude larger than the microfluidic dead volume. In conventional chromatography, in which the analytes exchange between the 76
99 stationary and mobile phase, this large difference in volume would cause isocratic elution of many analytes. Fortunately, the presence of multiple charges on the proteins favours the formation of multiple weak interactions with the strong cation exchanger which overall greatly favours the extraction of the proteins onto the SCX. No isocratic elution is observable within the limits of the volumes used in these experiments. Therefore, the proteomic reactor can pre-concentrate protein samples on a small bed. As importantly, at low ph many other biomolecules will either be neutral or negatively charged and therefore will not interact with the SCX and will readily flow through the reactor. The non-ionic detergents, DNA, RNA, lipids and other neutral or negatively charged biomolecules are readily washed away while the proteins are retained by the SCX material. Therefore, the proteomic reactor is also useful to clean-up samples. Finally, chemical and biochemical reactions can be performed on the proteins extracted in the reactors such as derivatization and digestion of protein samples. Proteins can then be derivatized by adding the reagents to the reactors. As well, proteins are digested by increasing the ph to 8.0, which in turn, will activate the trypsin loaded onto the reactor with the protein sample (Figure 3.1.1c). Although the proteomic reactor can be used as a standalone device, the resulting peptides are eluted using a buffer readily compatible with HPLC-ESI-MS/MS (Figure 3.1.1d). Another advantage of the proteomic reactor is that it concentrates proteins from complex mixtures onto approximately 1 µl of packed SCX material. The strong affinity of positively charged proteins towards the SCX material at low ph enables minute amounts of proteins to be easily extracted from mid to high µl solution volumes. Furthermore, the protein samples affinity for the SCX material can be modulated by introducing solutions with different ph and salt concentrations, which is advantageous for capturing and processing proteins on the reactor. While the ph is low during sample loading, the protein samples will bind to the SCX material on the reactor. During digestion/alkylation, the higher ph and salt contents render the protein samples mostly in a free solution phase. The interstitial volume within the proteomic reactor is limited to approximately 50 nl, suggesting that the overall pre-concentration effect ranges from 20 to 2000 fold if 1 µl to 100 µl of starting material is used. 77
100 We first use BSA to characterize the SCX proteomic reactor. Briefly, we established the maximum loading capacity of the proteomic reactor, as well as assessed the capability of the reactor to retain proteins on the SCX bed and elute retained proteins from the reactor using a MS compatible elution buffer. We then used a protein extract from P19 cells to assess the impact of cysteine reduction and alkylation on the efficacy of protein digestion on the SCX proteomic reactor. Briefly, two aliquots of P19 protein samples were processed on the SCX reactors under two conditions: one protein aliquot underwent a reduction/alkylation reaction prior to its tryptic digestion while another protein aliquot was directly digested without the reduction/alkylation step. Finally, we assessed the efficacy of digesting protein samples on the SCX reactor in comparison to that of conventional in-solution protein digestion approach. This was performed with five different amounts of proteins (0.1, 0.5, 1, 5, and 10 µg) from P19 cell lysate in triplicate. These different amounts of proteins correspond to the total proteins that would be obtained from 300 to 30,000 cells, based on the results of Bradford assay and cell counts Experimental Protein samples preparation and LC-MS/MS data analysis P19 cell lysates and standard protein BSA were employed in the study. Five different amounts of proteins (0.1, 0.5, 1, 5, and 10 µg) from P19 cell lysates were digested in triplicate with both the SCX reactor and the conventional in-solution protein digestion approach. 5 µl of the resulting peptides from each sample were analyzed with a LC-MS/MS system, where a micro flow HPLC 1100 system (Agilent, Palo Alto, CA) was integrated with a LCQ DecaXP instrument (Thermo-Finnigan, San Jose, CA). Details were described in chapter 2. The MS/MS spectra were analyzed using Mascot (Matrix Science, Boston, MA) using mus taxonomy. The details regarding P19 cell culture and protein extraction, insolution digestion of P19 protein samples, LC-MS/MS system, and parameters used in Mascot search were described in chapter 2. 78
101 Proteomic reactor assembly and protein processing on reactor The reactor was assembled by connecting a 200 µm inner diameter capillary tubing (~30 cm) into an inline micro-filter (UpChurch Scientific, Oak Harbor, WA), which was used as a frit. All tubing was washed with 500 µl of 10 mm potassium phosphate buffer (ph 3) prior to loading of SCX material. A slurry of SCX material (12 µm beads; The Nest Group, Southboro, MA) was then introduced from the other end of the capillary tubing by applying 200 psi of nitrogen. Unless specified otherwise, 4 centimeters of capillary tubing was packed with SCX material, enabling a protein binding capacity of 12 µg. Each packed reactor was then equilibrated by passing 50 µl of 10 mm potassium phosphate buffer (ph 3) Digesting protein samples on the SCX proteomic reactor The digestion of protein samples on the SCX proteomic reactor was validated with both protein standards and protein samples directly obtained through cell lysate. The steps are summarized below. Protein samples were acidified prior to the proteomic reactor digestion by diluting them with 50 mm H 3 PO 4 (ph~1.8) in a ratio of 1:9 (v/v). Trypsin (Promega, Madison, WI) (0.5 µg/µl in 10 mm potassium phosphate buffer (ph 3)) was added to the protein sample in a ratio of 1:5 (w/w). The acidified protein samples with trypsin were then loaded onto the reactor through continuous flow mode of operation, where a pressure of 200 psi was maintained until all sample solution was driven through the reactor bed. The flow rate remained at approximately 10 µl/min. Next, the reactor was washed three times with 20 µl of wash buffer (8 mm potassium phosphate buffer, 20% (v/v) acetonitrile), and then further washed with 25 µl of deionized water to remove the wash buffer. After washing steps, the reactor was dried with nitrogen gas for seconds. The proteins that were retained by the reactor were then reduced using a solution of 100 mm DTT (dithiothreitol) and 10 mm ammonium bicarbonate for 30 minutes. The reducing step was conducted through infusion operation mode, where the flow was halted by 79
102 dropping the nitrogen pressure to atmospheric pressure, as soon as the solvent front reached the outlet of the reactor column. The reactor remained hydrated while the reduction reaction was allowed to proceed for 30 minutes. The reactor was then dried and washed with 4 µl of 10 mm potassium phosphate buffer to decrease the ph to 3 and thus quench the reaction. The alkylation and the activation of trypsin were carried out concomitantly by introducing a digestion/alkylation solution (100 mm Tris-HCl, ph 8, 10 mm iodoacetamide) through infusion operation mode. The reactions proceeded at atmospheric pressure and at room temperature for 2 hours. The resulting peptides were then eluted using 40 µl of 200 mm ammonium bicarbonate Results and discussion Characterization of the SCX proteomic reactor I first established the maximum loading capacity of the proteomic reactor (Figure 3.1.2). Briefly, the maximum protein binding capacity of the proteomic reactor was determined by sequentially loading 4 aliquots of acidified bovine serum albumin (BSA) onto the same proteomic reactor. Each aliquot containing 5µg of BSA and was acidified by diluting them with 50 mm H 3 PO 4 (ph~1.8) in a ratio of 1:9 (v/v). The flow-through solutions (Load1/Load2/Load3/Load4) for each aliquot were collected after each loading, and the presence of protein was assessed by SDS-PAGE followed by coomassie-blue staining. The presence of protein in the flow-through solutions was only observed from the third aliquot onwards (Load3/Load4). Therefore, the protein binding capacity of the reactor in the present format (4 cm SCX bed) is between µg. Using this proteomic reactor saturated with BSA, I assessed whether the retention of the protein onto the SCX bed was affected by washing steps. Briefly, the reactor was washed three times with 20 µl of wash buffer (8 mm potassium phosphate buffer, ph 3.0, 20% (v/v) acetonitrile) (Wash1), and then further washed with 25 µl of deionized water (Wash2) to remove the wash buffer. No noticeable proteins were observed in the flow-through solutions of Wash1 and Wash2 as assessed by SDS-PAGE followed by coomassie-blue staining. This 80
103 indicates that even when the reactor bed is saturated with proteins, the retention of the proteins by the SCX material is not affected by the various washing conditions when proper ph and salt contents are maintained. I then tested whether the protein could be eluted from the reactor using our MS compatible elution buffer. Briefly, two subsequent elution steps (40 µl of 200 mm ammonium bicarbonate, ph 9.0) were performed to verify the efficacy of eluting the retained protein samples from the reactor (Elute1/Elute2). The eluent collected for each elution step, along with the unpacked SCX beads (Beads) were monitored for BSA by SDS-PAGE. It was observed that most proteins were eluted in the first elution (Elute1), but some were present in the second elution (Elute2). Analysis of the unpacked SCX beads (Beads) from the reactor by SDS-PAGE indicated that small portion of proteins remained on the beads. Incomplete elution of protein from the reactor is considered acceptable as the solutions employed to elute the resulting peptides from the reactor are intended to be compatible with the HPLC- MS analysis. Moreover, in the full protocol trypsin is used to generate peptides that are less likely to be strongly retained by the SCX bed. To avoid cross-contamination, a new proteomic reactor was used for each analysis. The cost of a reactor is estimated to be around $0.02 each The impact of reduction/alkylation reaction on the performance of the SCX proteomic reactor One advantage of the proteomic reactor is that chemical reactions can be performed directly on the proteins retained on the reactor. Here we tested the performance of protein reduction and alkylation of cysteines using a complex protein sample loaded on the reactor. We used a protein extract from P19 cells to demonstrate the impact of cysteine reduction and alkylation on the efficacy of protein digestion on the SCX proteomic reactor. Briefly, protein processing was tested under two conditions: first, one protein aliquot underwent a reduction/alkylation reaction on the reactor prior to its digestion while another protein aliquot was directly digested on another reactor. The resulting peptides were 81
104 analyzed using the LCQ mass spectrometer as described in the experimental section. The experiments were repeated twice. The resulting data were compared for sequence coverage of the identified proteins. Furthermore, in-house software was used to track individual peptides and to verify their protein annotation from sample to sample. Ninety four proteins were identified in all of the samples with varying sequence coverage. The difference in the number of peptides identified between the two conditions tested for each protein was calculated (Figure 3.1.3). Overall, 57% of the identified proteins had increased sequence coverage when reduction/alkylation was performed on the proteomic reactor. In other words, there was an increase in the number of identified peptides per protein. Twenty eight% of the identified proteins had the same sequence coverage and 15% had a decrease in sequence coverage. The vast majority of proteins with a decrease in sequence coverage had only one less peptide identified; while a significant portion of the proteins with an increase in sequence coverage had two or more peptides identified. This clearly indicates that the DDT reduction and iodoacetamide alkylation performed on the reactor can significantly improve the sequence coverage for the proteins identified Comparing the performance of the SCX proteomic reactor to in-solution digestion approach Another advantage of the proteomic reactor is that enzymatic catalysis can be performed on the reactor and benefit from an enhanced concentration effect. This was demonstrated using different amounts of protein lysate loaded onto the reactor, for which the resulting peptides were analyzed by HPLC-ESI-MS/MS. Briefly, five different amounts of proteins (0.1, 0.5, 1, 5, and 10 µg) from P19 cell lysate were processed in triplicate on the reactor and the resulting peptides were analyzed by HPLC-ESI-MS/MS. These different amounts correspond to the total proteins that would be obtained from 300 to 30,000 cells, based on the results of Bradford assay and cell counts. Figure shows the average number of proteins identified in each run and the total number of unique proteins identified after combining the triplicate runs versus the different 82
105 amount of proteins digested. Proteins were detected in all the samples, including an average of 25 proteins identified in samples containing only 0.1 µg of P19 cell lysate. No significant gain was observed when more than 0.5 µg of protein was loaded. In practice only 11% of the total volume of protein digest for each sample was analyzed by the HPLC-ESI-MS/MS, considering that only 5 µl of the 40 µl collected from the reactor were loaded onto the HPLC-ESI-MS/MS. For example, this means that for the 0.1 µg of proteins loaded and processed on the reactor only 11 ng were actually analyzed with the HPLC-ESI-MS/MS, with an average of 25 proteins identified. In other words, an average of 440 pg of total protein lysate is required for every protein identified. Figure shows that the reactor works better when the saturation point of the binding capacity is attained (10 µg); however, even at 0.5 µg, 75% of the identifiable proteins can still be detected. Although we did not change the size of the proteomic reactor according to protein content, it is possible to make shorter or longer proteomic reactors to accommodate different levels of proteins. The reactor s performance for digesting proteins was compared to an in-solution digestion using the same amount of protein (10 µg), as described in experimental section. Briefly, 10 µg of P19 cell lysate was digested in-solution and on the reactor, respectively, to obtain 44 µl of peptide solution in both cases. The resulting peptides for each method were then analyzed by HPLC-ESI-MS/MS as described in the experimental section. The insolution digestions were performed three times and 22 unique proteins were identified. In comparison, 205 unique proteins were identified using the reactor digestions when performed three times. Of the 22 proteins identified in the in-solution digestion, 21 were also identified from the proteomic reactor digestion. The significantly improved performance of the reactor than the in-solution approach, i.e., ~10 times more protein identification and a ~5 fold reduction in processing time, is likely due to 1) the efficient concentration of the protein samples and the buffer exchange prior to digestion, and 2) the efficient digestion of protein samples in the volumes of nanoliters. 83
106 3.1.4 Conclusions The microfluidic proteomic reactor provides an integrated platform to efficiently and reliably purify and concentrate down to nl volumes complex proteomic samples. Furthermore, we have demonstrated that chemical reactions, such as cysteine reduction and alkylation, can be performed on the reactor. The reactor digestion also led to approximately 10 times more protein identifications than in-solution digestions. We expect that the performance of the reactor will be further enhanced by coupling it to protein fractionation approaches and to more efficient mass spectrometers. 84
107 Figure Captions Figure Schematic representation of sample treatment steps using SCX proteomic reactor. a) Sample treatment steps done using the proteomic reactor. b) Schematic representation of the proteomic reactor. Pressurized nitrogen is used to push the liquid into the reactor. The protein and trypsin are bound to the SCX. c) Trypsin is activated by adjusting the ph to 8; the flow is stopped to let the digestion proceed without losing peptides. d) Peptides are eluted by using an ammonium bicarbonate solution. Reprinted with permission from Journal of Proteome Research. Copyright 2006, American Chemical Society. Figure Characterization of the SCX proteomic reactor. The Standard represents 20 µg of BSA standard solution. For Load1/Load2/Load3/Load4, 5 µg of acidified BSA standard solution was introduced into a SCX proteomic reactor sequentially and the eluent was collected separately. The reactor was then washed three times with 20 µl of wash buffer (8 mm potassium phosphate buffer, ph 3.0, 20% (v/v) acetonitrile) (Wash1), and then further washed with 25 µl of deionized water (Wash2) to remove the wash buffer. Two subsequent elution steps (40 µl of 200 mm ammonium bicarbonate, ph 9.0) were performed to verify the efficacy of eluting the retained protein samples from the SCX reactor (Elute1/Elute2). The eluent was collected for each elution step, along with the unpacked SCX beads (Beads). Figure Effect of DDT reduction and iodoacetamide alkylation on the identification of peptides from mouse P19 total cell lysate. The same amount of protein samples were processed on the reactor either with a reduction/alkylation step (treatment) or without this step (control). The experiments were repeated twice for each condition. The resulting peptides were then subjected to LC-MS/MS analysis and protein/peptide identification. The list of protein identified and the number of peptides identified for each protein were then recorded for each sample. The change in the number of peptides identified for the same protein was compared between the two experiment conditions (2 treatments vs. 2 controls). 85
108 This comparison was performed for all individual proteins identified. The total number of times that such changes observed (in 4 comparisons) was grouped in terms of the number of peptide differences. A positive difference indicates an increase in the number of peptides identified when both reduction and alkylation are performed. The percentages represent the proportion of proteins having, respectively, an increase, the same, or a decrease in number of peptides identified. Reprinted with permission from Journal of Proteome Research. Copyright 2006, American Chemical Society. Figure Evaluation of the performance of the proteomic reactors for processing complex proteomic samples. The sample used is total cell lysate from mouse P19 cells. The circles represent the average of triplicate digestion for each protein quantities on reactor of 40 mm X 200 µm packed with 12 µm SCX beads. Error bars correspond to one standard deviation. The different X axes represent respectively the number of cells corresponding to the protein content used in the digestion, (determined by Bradford assay) and the quantity used for mass spectrometry. The diamonds represent the results when the peak lists from the three replicates were merged prior to the Mascot search. Reprinted with permission from Journal of Proteome Research. Copyright 2006, American Chemical Society. 86
")
 87")
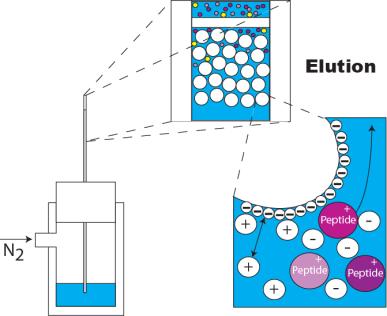
109 Figure (a) (b) (c) (d) 87

110 Figure
111 Figure
112 Figure
113 3.2 SCX Plate Proteomic Reactor Introduction: In section 3.1, we have described a proteomic reactor technique that processes minute amounts of protein samples on SCX resins. Although the reactor can process minute amounts of protein, the serial nature of the associated protocols limits the number of samples that can be processed concomitantly. In this section we describe the development of a 96-well plate version of the proteomic reactor which allows multiplexed processing of minute amount of protein samples. The prototypical SCX 96-well plates were graciously provided by Millipore (Billerica, MA). All of the protein processing abilities of the SCX proteomic reactor may also be carried out in the 96-well reactor plate. Ten to 200 µl of protein solution can be readily processed in each well. The protein mixtures retained in each well can then be desalted, washed, and digested; digestion is complete in about 2 hours. Afterwards, the resulting peptides are eluted from the reactor plate, collected, and analyzed by HPLC-ESI- MS/MS. Full processing of the proteins is routinely performed on the reactor plate in less than three hours, including two hours for the enzymatic digestion. In this thesis, the performance of this 96-well plate reactor for protein binding and elution was demonstrated using the standard protein BSA. The protein digestion process on the plate reactor was tested with different amounts of protein extracts from P19 whole cell lysates. Furthermore, the 96-well plate reactor was coupled with size exclusion chromatography (SEC) fractionation to obtain a broader coverage of the proteome. The performance of the plate reactor with SEC fractionation was demonstrated using MCF7 whole cell lysate Protein sample preparation and LC-MS/MS data analysis Cell lysates of mouse P19 testicular cancer cells and MCF-7 breast epithelial cancer cells were employed in the study. The peptides from different amounts P19 cell lysates (0.2, 91
114 0.5, 1.0, 1.5 and 2.0 µg) derived from the reactor plate were analyzed using a QSTAR Pulsar quadrupole-tof mass spectrometer (ABI/MDS Sciex, Concord, ON). The peptides from the fractions of MCF7 cell lysates were analyzed using a LCQ Deca XP mass spectrometer (ThermoFinnigan, San Jose, CA). The MS/MS spectra were analyzed using Mascot (Matrix Science, Boston, MA), where for P19 mouse taxonomy was used and for MCF7 human taxonomy was used. The details regarding cell culture and protein extraction, LC-MS/MS system, and parameters used in Mascot search were described in chapter Characterization of the 96 well plate reactor The 96 well plate reactor has a capillary (~1 mm x 1 mm (OD)) attached to the bottom of each well and ~300 nl of SCX media was immobilized inside the capillary as well as at the bottom of each well. The protein binding capacity and the reproducibility of each well were measured and examined through wells located at different positions across a 96 well reactor plate. As shown in Figure 3.2.1, 1 ug of acidified BSA standard in 20 ul solution was introduced into the same well sequentially and the eluent (L1/L2/L3/L4) was collected separately. The retained BSA standard was eluted from the well (E1/E2) using 25 ul elution buffer (200 mm ammonium bicarbonate). The eluent collected for each step (E1/E2), along with 2 ug of BSA standard (STD) were monitored for BSA by SDS-PAGE followed by silver stain. The amount of BSA standard in each gel band was quantified using software Image J. For gel band L1, the amount of BSA standard is below the sensitivity of the software. Based on the total amount of BSA eluted in E1/E2, we found that the protein binding capacity of a well was ~ 2 g. We further found that the protein binding capacity was consistent from well to well and protein samples can be fully recovered using 25 L elution buffer (200 mm Ammonium bicarbonate). 92
115 3.2.4 Processing protein samples using the 96-well plate The work-flow of sample processing through the plate reactor is shown in Figure (a). The wells on the 96-well plate were first conditioned by flowing 200 µl of wash buffer (8 mm potassium phosphate buffer, 20% (v/v) acetonitrile) through them. Once the wells were conditioned, 10 to 200 µl of protein samples at ph ~ 2.0 (acidified by 5% (v/v) of 1 M H 3 PO 4 ) were mixed with ~ 0.5 µg of trypsin (inactive at ph 2.0). The samples were applied to the wells and proteins retained by the SCX resin at the bottom of each well. The retained protein samples were then washed with 30 µl of 10 mm potassium phosphate buffer (ph 3.0) and 30 µl of deionized water successively. The wells were then dried. Cysteine reduction occurred in the wells by adding 5 µl of 100 mm dithiothreitol and 10 mm ammonium bicarbonate (Reducing Buffer) for 30 minutes, after which the wells were washed with 5 µl of 10 mm potassium phosphate buffer (ph 3.0) and dried. The digestion of the protein was achieved by introducing 5 µl of digestion/alkylation solution (10 mm iodoacetamide, 100 mm Tris-HCl, ph 8) in each well. The digestion was allowed to proceed for 2 hours, after which the resulting peptides were eluted into a collection plate using a volume of 25~30 µl of 200 mm ammonium bicarbonate (Elution Buffer). All the above processes were carried out using a MultiScreen HTS vacuum manifold. We used a P19 cell lysate to test the analytical performance of the 96-well reactor for identifying proteins. Different amounts of protein extracts from P19 whole cell lysate (0.2, 0.5, 1.0, 1.5 and 2.0 µg) were processed on the reactor plate as described above, and the resulting peptides were eluted in 25 µl of elution buffer. Eight µl were analyzed by HPLC- ESI-MS/MS, and the resulting MS/MS were searched against the mouse taxonomy in the NCBI nr database using Mascot. It follows that 7, 11, 19, 35, and 68 proteins were successfully identified from the different levels of the P19 cell lysate, respectively. This clearly demonstrates that the reactor plate can efficiently processes complex protein mixtures from as little as 200 ng of total protein lysate. It is worth noting that nearly 70 unique proteins were identified with high confidence from less than 2 µg of untreated P19 whole cell lysate. Considering that only 8 µl of the final elution (25 µl) was analyzed, one protein was virtually identified per less than 10 ng of total protein lysate introduced on the reactor well. 93
116 3.2.5 Coupling of the Reactor Plate with SEC We then coupled the reactor plate with size exclusion chromatography fractionation of protein mixtures, as shown in Figure (b), to create a completely gel-free technique for protein sample processing. MCF7 cell lysate was fractionated and then the 96-well plate reactor was used to process the fractions simultaneously. The separation of 400 µg of MCF7 whole cell lysate was carried out using a mm (5 µm) BioSep-SEC-S 3000 analytical column (Phenomenex, Torrance, USA). Samples were directly injected into the analytical column using a manual injection valve (Valco, Houston, TX) equipped with a 100-µL sample loop. The isocratic mobile phase (50 mm NaH 2 PO 4 ) was delivered at 1 ml/min using an Agilent 1100 series microbore HPLC system (Agilent Technologies, Palo Alto, CA). The protein elution chromatography was monitored at 220 nm using a variable wavelength UV detector, and 40 fractions were collected based on the elution time. About 200 µl of eluent was collected for each fraction. 100 µl of eluent from each of the 35 selected fractions were introduced into a well on the plate reactor and processed as described before. The chromatographic traces and the regions in which fractions were collected are illustrated in Figure (a). Eight µl of the 30 µl resulting peptide solution (27% of the sample) were analyzed by HPLC-ESI-MS/MS using an LCQ Deca XP mass spectrometer. During the course of 35 LC-MS runs, multiple columns and pre-columns have been used to avoid issues associated with column aging. The distribution of the number of proteins identified per fraction is illustrated in Figure 3.2.3(b). A total of 1,917 proteins were identified across the 35 fractions with an average of 55 proteins per fraction. From fractions B6 to C3, an average of 94 proteins per fraction was identified. Once redundancy was removed, we obtained 875 unique proteins based on a Mascot peptide threshold score of 20 and a protein score of 39. These results clearly demonstrate that protein fractionation coupled to the reactor plate greatly enhances the total number of proteins identified. Furthermore, as little as 10 ng of total protein lysate 94
117 processed in the reactor was needed for each protein identification, which represents an exquisite level of sensitivity Discussion High Confidence in Protein Identification The thresholds that were used for protein identification were stringent (an ion score cut off of 20 for peptides and a protein score cut off of 39 for proteins) which led to the identification of 875 unique proteins. As a result of the stringent searching criteria, 771 proteins were identified by at least two distinct peptides (with peptide ion scores higher than or equal to 20), as shown in Figure For those 104 proteins identified by a single peptide, the lowest peptide score was 39. This stringent filtering is likely leading to a high false negative level. A recent bioinformatic study of search engine ion score cut-offs reported that a Mascot peptide score threshold of 20 provides a false positive rate below 1% (25). Using these criteria (i.e. no protein score cut-off), we identified a total of 2,683 non redundant proteins, the majority of which were single peptide identifications (1912) (Figure 3.2.4) Efficacy of protein fractionation with SEC chromatography Higher abundance proteins (i.e. proteins that have a higher Mascot score) tended to spread over multiple fractions, while, as expected, proteins with a smaller number of hits were found in a narrower range of fractions. Interestingly, of the 875 unique proteins identified from the combined data file, nearly 300 proteins were identified only through the combination of peptides identified in multiple fractions. This is probably related to the limited duty cycle of the HPLC-ESI-MS/MS over a 2 hour total experiment, preventing a significant number of peptides from being fragmented in each run. 95
118 Factors Limiting the Performance of the Plate Reactor The overall performance of the plate reactor can be further improved. First, the binding capacity of each well on the plate is 2 µg or less of protein. Even though 400 µg of MCF7 protein lysate were separated by size exclusion chromatography, no more than 70 µg of the protein samples were loaded on the reactor plate for the 35 fractions. Hence, increasing the well capacity or the number of fractions would increase the total sample load. Second, to avoid saturating the pre-column, only 8 µl out of the 30 µl resulting peptides from each reactor plate well were injected on the HPLC-ESI-MS/MS for protein identification. Increasing the HPLC capacity or performing multiple runs from the same sample would further enhance the performance (26-27). Third, rapid 2 hour gradients were performed on the HPLC; increasing the duration of the gradient will increase the number of MS/MS generated. Finally, more sensitive mass spectrometers with faster duty cycles should also improve the performance of this approach (28). We recently demonstrated that changing the mass spectrometer from an LCQ to an LTQ ion trap mass spectrometer can double the number of proteins identified from one fraction, all other processing methods being the same (data not shown) Conclusions In summary, we established a completely gel free approach for large scale protein identification using a 96-well plate reactor to process 35 fractions of a size exclusion chromatographic separation of MCF7 lysate. Under stringent criteria, a total of 875 unique proteins were identified. A more relaxed ion score cutoff level associated with a 1% false positive rate resulted in the identification of 2,683 unique proteins. This novel approach proves to be very efficient and sensitive in processing minute amounts of protein samples, demonstrated by one protein being identified per 3-10 ng of total protein lysate loaded on the reactor plate. 96
119 Figure Captions Figure Characterization of the 96-well SCX plate reactor. For L1/L2/L3/L4, 1 µg of acidified BSA standard in 20 µl solution was introduced into a well sequentially and the eluent was collected separately. For E1/E2, the retained BSA standard was eluted from the well using 25 µl elution buffer (200 mm ammonium bicarbonate). The eluent collected for each step, along with 2 µg of BSA standard (STD) were monitored for BSA by SDS-PAGE followed by silver stain. The amount of BSA standard in each gel band was quantified using software ImageJ. For L1, the amount of BSA standard is below the sensitivity of the software. Reprinted with permission from Analytical Chemistry. Copyright 2007, American Chemical Society. Figure (a). The work flow of sample processing through the plate reactor. Details are provided in the experimental section. (b). The coupling of the reactor plate with size exclusion chromatographic fractionation of proteins. Four hundred µg of MCF7 whole cell lysate was separated through size exclusion chromatography. Thirty five fractions were collected and half of each fraction was introduced into a well on the reactor plate and processed as described in the experimental section. The resulting peptides were eluted in a volume of 30 µl, from which 8 µl was introduced into a LC-ESI-MS/MS system. Reprinted with permission from Analytical Chemistry. Copyright 2007, American Chemical Society. Figure (a). The size exclusion chromatographic separation of MCF7 whole cell lysate recorded at 220 nm using a variable wavelength detector. For each fraction, around 200 µl was collected for a time interval of 12 seconds (0.20 min). (b) The corresponding total number of proteins identified in each of these 35 fractions. From fractions B6 to C2, an average of 94 proteins per fraction was identified. Reprinted with permission from Analytical Chemistry. Copyright 2007, American Chemical Society. 97
120 Figure The distribution of proteins identified as a function of numbers of unique peptides. Eight hundred seventy five unique proteins were identified; 104 proteins were identified with a single peptide, and 771 proteins were identified with at least two unique peptides when the Mascot protein and peptide score thresholds were 39 and 20, respectively. When the protein score threshold was removed, 2683 unique proteins were identified; 1912 of these were identified with a single peptide. Reprinted with permission from Analytical Chemistry. Copyright 2007, American Chemical Society. 98
121 Amount of BSA Standard (ug) Figure L1 L2 L3 L4 E1 E2 STD Protein processing procedure 99
122 Figure (a) (b) 100
123 Number of Proteins identified Intensity of UV detector Figure Time (minute) (a) A5 A7 A9 0 A11 B12 B10 B8 B6 B4 B2 C1 C3 C5 C7 C9 Fraction Label C11 D12 D10 (b) 101
124 Figure
125 3.3 Developing a SAX Proteomic Reactor Introduction Anion exchangers can also be used to capture proteins. For example, in the literature, strong anion exchange (SAX) has been reported in phosphopeptide studies; whereas, weak cation exchange (WCX) and weak anion exchange (WAX) have been used in few proteomic experiments (29-36). Important features of a proteomic reactor include an ability to modulate the affinity of proteins and peptides for ion exchange material, and to modulate the activity of enzymes while keeping the volume as small as possible. Changing the ph and ionic strength of buffers modulates the affinity of proteins for the ion exchange material and activity of enzymes; whereas, the volume of the sample can be minimized using microfluidic designs. Outside their isoelectric points, proteins and peptides are charged and can form ionic bonds with cation or anion exchange materials. Fortunately, the theoretical pi distribution of the proteome shows that more than 99% of proteins are in the pi range of 2.5~12 (99.8% in Saccharomyces Genome Database; 99.4% in IPI human 3.53 database; 99.6% in IPI mouse 3.53 database). Furthermore, over 96% of the predicted peptides resulting from the in silico proteome digestion either by trypsin, chymotrypsin or Glu-C have a pi within the range of 2.5~12. This means that the complete proteome can be captured on the SCX proteomic reactor as the ph is below 2.5, or retained on the SAX proteomic reactor when the ph is above 12. The selection of SCX and SAX material for the proteomic reactor needs to take into account the extreme ph (2.5 and 12) used in the processes. For example, the routinely used silica-based SAX and SCX beads cannot tolerate a high ph. Instead, therefore, we used the rigid macroporous polystyrene-divinylbenzene (PS/DVB) polymer matrix derivatized with chemically stable quaternized poly (ethylenimine) PEI (N(CH 3 ) + 3 ) groups to fabricate the SAX reactor and sulfate groups (SO - 3 ) for the SCX reactor. These materials are stable at extreme ph (ph range from 1 to 14). 103
126 Although our initial design of the proteomic reactor focused solely on the use of trypsin to digest proteins, other proteolytic enzymes have been used in proteomics as well. We are particularly interested in proteolytic enzymes that are active at physiological ph and are inactive but stable at lower or higher ph. Some enzymes that are used in proteomics such as Proteinase K (18) and pepsin (37) only function at high or low ph. Other enzymes such as Lys-C, Arg-C, and Asp-N (38-39) may also be suitable. One disadvantage of using these enzymes is the relatively high costs. Chymotrypsin and Glu-C are suitable enzymes because of their optimal ph for protein digestion (ph 8.0) and their low prices. In this section, we demonstrate the development of the SAX proteomic reactor using a standard protein mixture, where trypsin was used as the enzyme. We then demonstrated the performance of the SAX proteomic reactors using yeast lysates in comparison to SCX-based proteomic reactors. The data revealed that the SAX proteomic reactors enrich different peptides than SCX-based proteomic reactors. Therefore, the combination of SCX and SAX proteomic reactors increased the number of identified peptides and proteins by 50% Protein samples preparation and LC-MS/MS data analysis Protein extract from yeast and standard proteins ovalbumin (A7641), fetuin A (F3004), serum albumin (A9056), carbonic anhydrase 2 (C3934), serotransferrin (T1408) and lysozyme C (L7651) were used in the study. Yeast samples and the standard protein mixture were processed with both SAX and SCX proteomic reactor, where trypsin was used for protein digestions. The resulting peptides were analyzed with a LTQ linear ion trap mass spectrometer (Thermo Electron, Waltham, MA). The MS/MS spectra from the yeast sample were searched against a database consisting of the Saccharomyces Genome Database ( protein entries, released December 2, 2008) and the reverse sequence of all protein entries. Details were described in chapter
127 3.3.3 Construction and characterization of SAX proteomic reactor A capillary tubing (200-μm i.d.) was used to construct the proteomic reactor. Briefly, a frit was formed at one end of fused silica tubing using a mixture of potassium silicate (KASIL 1, PQ Corporation, Valley Forge, PA) and formamide with a volume ratio of 11:2. After leaving the fritted tubing at ambient condition for at least 24 hours, a 5 cm long reactor was constructed by pressure packing (400 psi) a slurry of SAX beads (10 μm, Polymer Laboratories, Varian, Inc.) from the open end of the capillary tubing. The capability of the novel SAX proteomic reactor to retain proteins was evaluated using a mixture of protein standards, including ovalbumin (pi: 5.19), fetuin A (pi: 5.26), serum albumin (pi: 5.82, carbonic anhydrase 2 (pi: 6.41), serotransferrin (pi: 6.75) and Lysozyme C (pi: 9.36). These protein standards were present at equimolar concentration. Two and 10 μg of the protein standard mixture, alkalified with ammonium hydroxide (ph 12), was loaded onto a SAX reactor, respectively. The SAX reactor was then washed with an alkaline buffer (3 N ammonium hydroxide, ph 12, 20 μl) and dried. The retained proteins were then eluted with acidic buffer (0.5% formic acid (v/v), ph 2.5). The flowthrough solutions of each step were collected for SDS-PAGE analysis. There are no protein bands detected by SDS-PAGE and colloidal blue staining (nanogram-level sensitivity) in the flow through and wash fractions at 10 µg and 2 µg sample amounts (Figure 3.3.1). The observation indicates that the protein samples are retained by the SAX reactor at ph 12 and are not affected by the washing step. The pattern of elute fraction collected from SAX reactor is the same with that of the control, suggesting that all the protein standards with different pis can be effectively eluted with the acidic buffer at ph 2.5, with almost 100% recovery Development of a SAX reactor using a mixture of standard proteins The performance of the novel SAX proteomic reactor was first evaluated using a mixture of protein standards, as described in the previous section. 105
128 As shown in Figure 3.3.2, 10 μg of protein samples and trypsin (4:1, w/w) were alkalified with ammonium hydroxide (ph 12) prior to being loaded at 150 psi onto the SAX reactors. The SAX reactor was then washed with an alkaline buffer (20 μl of 3N ammonium hydroxide, ph 12,) and dried. The proteins retained on the reactors were then subjected to disulfide bond reduction by introducing the reduction buffer (50 mm dithiothreitol, 20 mm ammonium bicarbonate, ph 8.0) into the reactor, which lasts for 30 min at room temperature. The reactors were then washed with 5 μl of 20 mm ammonium bicarbonate buffer (ph 8.0) and dried. The reduced proteins were then subjected to simultaneous alkylation and enzymatic digestions by introducing the digestion buffer (10 mm iodoacetamide, 20 mm ammonium bicarbonate, ph 8.0) into the reactors for 2 h at 37 C. The resulting peptides were eluted with acidic buffer (0.5% formic acid (v/v), ph 2.5). The mixture of protein standards was also processed with SCX proteomic reactors and the conventional in-solution digestion, as described in the experimental section. Tryptic digestions of 10 μg of protein samples were repeated 2 times for each of the 3 protein digestion methods and an equivalence of 1 μg of initial protein sample was used for each LC-MS/MS analysis. The proteins and peptides identified were compared. All six proteins were identified following digestion on the SAX reactor using as little as 1 µg of the protein mixture (Table 3.3.1). The SAX reactor showed a slight improvement in the number of identified peptides compared to the SCX reactor and in-solution digestion, but overall the SAX and SCX reactors had similar identification capabilities at the unique peptide level. The SAX reactor also showed higher sequence coverage of two standard proteins (ovalbumin and serotransferrin) than SCX reactor. For the SAX and SCX reactors, the overlap between unique peptides found in the two repeated runs was up to 90%. This supports the reproducibility of the performance of SAX and SCX reactors. Overall, these results show that the SAX reactor is suitable for in-reactor digestions using the procedures mentioned above. 106
129 3.3.5 A comparison of the performance of SAX and SCX reactors using trypsin for processing yeast samples The performance of the SAX and SCX proteomic reactors were further compared for analysis of the yeast proteome. 2 μg of yeast lysates were processed with SAX and SCX proteomic reactors in triplicate, respectively. The data obtained was shown in Table The number of identified unique peptides using either SAX or SCX reactor is similar, suggesting SAX is also suitable for processing complex proteomic samples. It is interesting to notice that 24% more unique proteins (286 vs. 230) were identified on the SAX reactor compared to the SCX reactor, although they identified an almost equal amount of unique peptides. We further compared the unique peptides and proteins that were identified on the SCX and SAX proteomic reactors (Figure 3.3.3A and B). Both SAX and SCX reactors showed high reproducibility in yeast peptide/protein identifications, where more than 60% unique peptides and 65% proteins overlapped between different runs for each approach. Although the total number of unique peptides observed from SCX and SAX are similar, only around 40% of the identified peptides overlapped (Figure 3.3.3A). In addition, the overlap in proteins identified with SCX and SAX reactors is also low (Figure 3.3.3B). Figure 3.3.4a shows the overlap in unique peptides and proteins between the combined data of three LC-MS/MS runs using SAX and SCX reactors. It can be seen that the unique peptides and proteins only identified by SAX reactor are 51% (376/733) and 49% (113/230) of the total unique peptides and proteins identified by SCX reactor. This suggests that combining the SAX and SCX reactor increases the number of unique peptides and proteins identified by 50%. Zooming on two proteins (YGR009C, YHR174W) identified from both SAX and SCX reactors (Figure 3.3.4b), it is clear that the unique peptides identified from SAX and SCX reactor were normally mapped to different sequence locations in these proteins. Therefore, extensive sequence coverage can be obtained by using both the SAX and SCX proteomic reactors in combination. 107
130 Figure further delineated the theoretical pi distributions of the identified unique peptides from both the SAX and SCX reactors. The unique peptides were grouped according to their theoretical pi that was calculated by Compute pi ( It can be seen that the majority of the peptides obtained from both the SAX and SCX reactors have pis lower than 7. Differences in the pi distribution were observed between the SAX and SCX proteomic reactor approaches, where the SAX reactor approach identified more acidic peptides (~9%), although the total number of unique peptides identified was similar (Table 3.3.2). At the protein level, among the 286 proteins identified with the SAX reactor approach, around 70% exhibited pis below 7; while among the 230 proteins identified with the SCX reactor approach, around 56% had pis below 7. In other words, the SAX reactor identified 14% more acidic proteins than the SCX reactor. These data indicated that the SAX reactor was biased for relatively acidic proteins/peptides and the SCX reactor for relatively basic protein/peptides Conclusions Our new version of the proteomic reactor, the SAX reactor, is capable of identifying a greater number of acidic peptides and proteins compared to SCX proteomic reactor. The data also demonstrated that the SAX reactor was complementary to the SCX proteomic reactor for peptide and protein identification. The SAX reactor was biased for relatively acidic proteins/peptides and the SCX reactor for relatively basic protein/peptides. The combination of the two proteomic reactors leads to an overall increase in the number of unique peptides and proteins identified. 3.4 Chapter Summary In summary, we developed different versions of microfluidic proteomic reactors, namely, the SCX proteomic reactor, the 96-well SCX plate reactor, and the SAX proteomic reactor, for processing complex protein samples. These microfluidic proteomic reactors provided an integrated platform for efficiently and reliably processing minute amounts of 108
131 protein samples. The reactor digestion technique led to approximately 10 times more protein identifications than the in-solution digestion technique. In addition, the 96-well SCX plate reactor was suitable for simultaneously processing multiplexed protein samples in parallel, and the SAX reactor was found to be complementary to the SCX proteomic reactor for peptide and protein identification. The combination of the SCX and SAX proteomic reactors would lead to an overall increase of unique peptides and proteins identified. 109
132 Table Protein/peptide identification and protein sequence coverage obtained as using SAX and SCX reactors to process standard protein mixture Digestion methods Peptides Results Unique Peptides Proteins Ovalbumin (pi: 5.19) (42.9 kda) Fetuin A (pi: 5.26) (38.4 kda) Protein sequence coverage Serum Carbonic albumin anhydrase 2 (pi: 5.82) (pi:6.41) (69.3 kda) (29.1 kda) Serotransferrin (pi: 6.75) (77.8 kda) Lysozyme C (pi: 9.36) (16.2 kda) SAX % 30.6% 50.9% 69.6% 60.8% 44.9% SAX % 35.4% 51.6% 60.0% 59.5% 40.8% SCX % 28.1% 47.0% 67.3% 54.3% 34.7% SCX % 34.3% 52.1% 64.2% 54.7% 42.9% Solution % 38.4% 54.0% 63.1% 42.8% 59.9% Solution % 38.4% 51.7% 71.2% 48.0% 59.2% 110
133 Table Summary of the number of unique peptides and proteins identified from yeast sample using the SAX and SCX reactors. SAX Reactor SCX Reactor 1 st run 2 nd run 3 rd run combined 1 st run 2 nd run 3 rd run combined Peptides Unique Peptides Proteins
134 Figure Captions Figure SDS-PAGE analysis of flow-through, wash and elute fractions of SAX reactor using standard proteins. Total is the total standard protein mixture as a control; FT is the flow-through fraction (at ph 12); Wash is the wash fraction (at ph 12); Elute is the elute fraction (at ph 2.5). Adapted with permission from Analytical and Bioanalytical Chemistry. Copyright 2010, Springer. Figure Flowchart of protein processing steps using SAX proteomic reactor. (a) Protein sample preparation. (b) SAX reactor: (1) Protein sample was mixed with trypsin (4/1, w/w), alkalified by adding ammonium hydroxide and loaded onto the SAX reactor; (2) after washing and drying, the reduction buffer (50 mm dithiothreitol, 20 mm ammonium bicarbonate, ph 8.0 ) was introduced onto the reactor, and the proteins present on the reactor were subjected to disulfide bond reduction; after another washing (5 μl of 20 mm ammonium bicarbonate, ph 8.0) and drying, the digestion buffer (10 mm iodoacetamide, 20 mm ammonium bicarbonate, ph 8.0) was introduced onto the reactor to perform alkylation and tryptic digestion; (3) the resulting peptides were then eluted with acid buffers (0.5% formic acid, ph 2.5). (c) The resulting peptides from the SAX reactor were analyzed by LC- MS/MS. Adapted with permission from Analytical and Bioanalytical Chemistry. Copyright 2010, Springer. Figure Reproducibility of unique peptide (a) and protein (b) identified using SAX and SCX reactors. The unique peptides and proteins identified were compared between experiments using the same type of proteomic reactor technique (SCX or SAX) or different types of proteomic reactor techniques (SCX or SAX). Both SAX and SCX reactors showed high reproducibility in peptide/protein identification between different runs using the same type of proteomic reactor technique (SCX or SAX). The overlap in peptide/proteins 112
135 identification using different types of proteomic reactor techniques (SCX or SAX) was low. Adapted with permission from Analytical and Bioanalytical Chemistry. Copyright 2010, Springer. Figure (a) Overlap between unique peptides and proteins identified with SAX and SCX reactors. (b) Differences in sequence coverage for protein YJR009C and YHR174W identified with SAX reactor (blue) and SCX reactor (red). Adapted with permission from Analytical and Bioanalytical Chemistry. Copyright 2010, Springer. Figure Theoretical pi distributions of unique peptides and proteins identified by SAX and SCX reactors. X-axis: theoretical pi regions; Y-axis: percentage of identified unique peptides in a given pi region. Using the combined data from three LC-MS/MS runs. Adapted with permission from Analytical and Bioanalytical Chemistry. Copyright 2010, Springer. 113

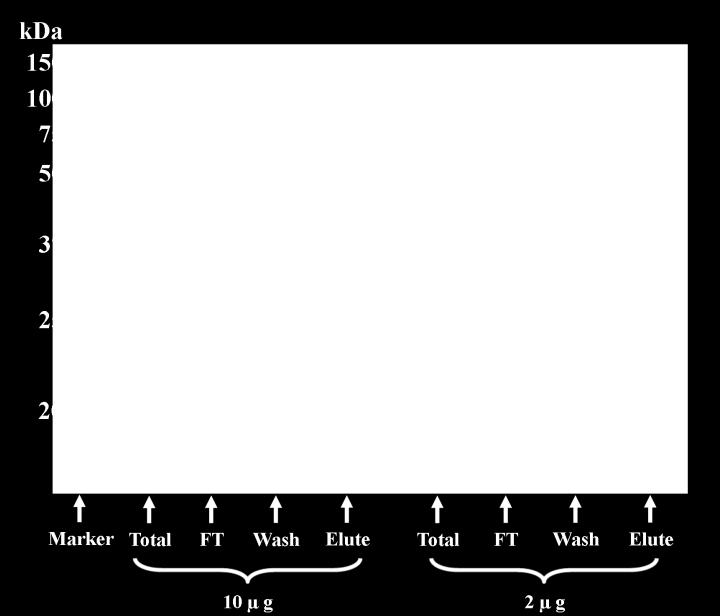
136 Figure

137 Figure
138 Number of Unique peptides Number of identified Priteins Figure A SAX- Trypsin-1 SAX- Trypsin-2 SAX- SAX- SAX- SCX- SCX- SCX- Trypsin-1 Trypsin-2 Trypsin-3 Trypsin-1 Trypsin-2 Trypsin-3 0% B SAX- Trypsin-1 SAX- Trypsin-2 SAX- SAX- SAX- SCX- SCX- SCX- Trypsin-1 Trypsin-2 Trypsin-3 Trypsin-1 Trypsin-2 Trypsin-3 0% SAX- Trypsin-3 SAX- Trypsin-3 SCX- Trypsin-1 SCX- Trypsin-1 SCX- Trypsin-2 100% SCX- Trypsin-2 100% SCX- Trypsin-3 SCX- Trypsin-3 C 1100 Unique Peptide D 340 Protein Number of LC-MS/MS runs SAX Reactor SCX Reactor SAX & SCX Reactor Combination Number of LC-MS/MS runs SAX Reactor SCX Reactor SAX & SCX Reactor Combination 116
")


139 Figure (a) (b) 117


140 Figure
141 References 1. Aebersold, R., and Mann, M. (2003) Mass spectrometry-based proteomics, Nature 422, Lambert, J. P., Ethier, M., Smith, J. C., and Figeys, D. (2005) Proteomics: from gel based to gel free, Anal Chem 77, Steen, H., and Mann, M. (2004) The ABC's (and XYZ's) of peptide sequencing, Nat Rev Mol Cell Biol 5, Romijn, E. P., Krijgsveld, J., and Heck, A. J. (2003) Recent liquid chromatographic- (tandem) mass spectrometric applications in proteomics, J Chromatogr A 1000, Hamdan, M., and Righetti, P. G. (2003) Assessment of protein expression by means of 2-D gel electrophoresis with and without mass spectrometry, Mass Spectrom Rev 22, Aebersold, R. H., Leavitt, J., Saavedra, R. A., Hood, L. E., and Kent, S. B. (1987) Internal amino acid sequence analysis of proteins separated by one- or twodimensional gel electrophoresis after in situ protease digestion on nitrocellulose, Proc Natl Acad Sci U S A 84, Wilm, M., Shevchenko, A., Houthaeve, T., Breit, S., Schweigerer, L., Fotsis, T., and Mann, M. (1996) Femtomole sequencing of proteins from polyacrylamide gels by nano-electrospray mass spectrometry., Nature 379, Havlis, J., and Shevchenko, A. (2004) Absolute quantification of proteins in solutions and in polyacrylamide gels by mass spectrometry, Anal Chem 76, Lambert, J. P., Ethier, M., Smith, J. C., and Figeys, D. (2005) Proteomics: from gel based to gel free., Anal Chem. 15, Ihling, C., and Sinz, A. (2005) Proteome analysis of Escherichia coli using highperformance liquid chromatography and Fourier transform ion cyclotron resonance mass spectrometry, Proteomics 5, Martosella, J., Zolotarjova, N., Liu, H., Nicol, G., and Boyes, B. E. (2005) Reversedphase high-performance liquid chromatographic prefractionation of immunodepleted human serum proteins to enhance mass spectrometry identification of lower-abundant proteins, J Proteome Res 4,
142 12. Moritz, R. L., Clippingdale, A. B., Kapp, E. A., Eddes, J. S., Ji, H., Gilbert, S., Connolly, L. M., and Simpson, R. J. (2005) Application of 2-D free-flow electrophoresis/rp-hplc for proteomic analysis of human plasma depleted of multi high-abundance proteins, Proteomics 5, Burggraf, D., Weber, G., and Lottspeich, F. (1995) Free flow-isoelectric focusing of human cellular lysates as sample preparation for protein analysis, Electrophoresis 16, Linke, T., Ross, A. C., and Harrison, E. H. (2006) Proteomic analysis of rat plasma by two-dimensional liquid chromatography and matrix-assisted laser desorption ionization time-of-flight mass spectrometry, J Chromatogr A. 15. Dai, J., Shieh, C. H., Sheng, Q. H., Zhou, H., and Zeng, R. (2005) Proteomic analysis with integrated multiple dimensional liquid chromatography/mass spectrometry based on elution of ion exchange column using ph steps, Anal Chem 77, Jessani, N., Niessen, S., Wei, B. Q., Nicolau, M., Humphrey, M., Ji, Y., Han, W., Noh, D. Y., Yates, J. R., 3rd, Jeffrey, S. S., and Cravatt, B. F. (2005) A streamlined platform for high-content functional proteomics of primary human specimens, Nat Methods 2, Washburn, M. P., Wolters, D., and Yates, J. R. r. (2001) Large-scale analysis of the yeast proteome by multidimensional protein identification technology, Nat Biotechnol. 19, Wu, C. C., MacCoss, M. J., Howell, K. E., and Yates, J. R., 3rd. (2003) A method for the comprehensive proteomic analysis of membrane proteins, Nat Biotechnol 21, Duan, J., Sun, L., Liang, Z., Zhang, J., Wang, H., Zhang, L., Zhang, W., and Zhang, Y. (2006) Rapid protein digestion and identification using monolithic enzymatic microreactor coupled with nano-liquid chromatography-electrospray ionization mass spectrometry, J Chromatogr A 1106, Lim, L. W., Tomatsu, M., and Takeuchi, T. (2006) Development of an on-line immobilized-enzyme reversed-phase HPLC method for protein digestion and peptide separation, Anal Bioanal Chem. 120
143 21. Slysz, G. W., and Schriemer, D. C. (2003) On-column digestion of proteins in aqueous-organic solvents, Rapid Commun Mass Spectrom 17, Slysz, G. W., and Schriemer, D. C. (2005) Blending protein separation and peptide analysis through real-time proteolytic digestion, Anal Chem 77, Craft, D., Doucette, A., and Li, L. (2002) Microcolumn capture and digestion of proteins combined with mass spectrometry for protein identification, J Proteome Res 1, Craft, D., and Li, L. (2005) Integrated sample processing system involving oncolumn protein adsorption, sample washing, and enzyme digestion for protein identification by LC-ESI MS/MS, Anal Chem 77, Kapp, E. A., Schutz, F., Connolly, L. M., Chakel, J. A., Meza, J. E., Miller, C. A., Fenyo, D., Eng, J. K., Adkins, J. N., Omenn, G. S., and Simpson, R. J. (2005) An evaluation, comparison, and accurate benchmarking of several publicly available MS/MS search algorithms: sensitivity and specificity analysis, Proteomics 5, Durr, E., Yu, J., Krasinska, K. M., Carver, L. A., Yates, J. R., Testa, J. E., Oh, P., and Schnitzer, J. E. (2004) Direct proteomic mapping of the lung microvascular endothelial cell surface in vivo and in cell culture, Nat Biotechnol 22, Liu, H., Sadygov, R. G., and Yates, J. R., 3rd. (2004) A model for random sampling and estimation of relative protein abundance in shotgun proteomics, Anal Chem 76, Riter, L. S., Gooding, K. M., Hodge, B. D., and Julian, R. K., Jr. (2006) Comparison of the Paul ion trap to the linear ion trap for use in global proteomics, Proteomics 6, Gan, C. S., Reardon, K. F., and Wright, P. C. (2005) Comparison of protein and peptide prefractionation methods for the shotgun proteomic analysis of Synechocystis sp. PCC 6803, Proteomics 5, Motoyama, A., Xu, T., Ruse, C. I., Wohlschlegel, J. A., and Yates, J. R., 3rd. (2007) Anion and cation mixed-bed ion exchange for enhanced multidimensional separations of peptides and phosphopeptides, Anal Chem 79,
144 31. Navare, A., Zhou, M., McDonald, J., Noriega, F. G., Sullards, M. C., and Fernandez, F. M. (2008) Serum biomarker profiling by solid-phase extraction with particleembedded micro tips and matrix-assisted laser desorption/ionization mass spectrometry, Rapid Commun Mass Spectrom 22, Dai, J., Wang, L. S., Wu, Y. B., Sheng, Q. H., Wu, J. R., Shieh, C. H., and Zeng, R. (2008) Fully Automatic Separation and Identification of Phosphopeptides by Continuous ph-gradient Anion Exchange Online Coupled with Reversed-Phase Liquid Chromatography Mass Spectrometry, J Proteome Res. 33. Han, G., Ye, M., Zhou, H., Jiang, X., Feng, S., Tian, R., Wan, D., Zou, H., and Gu, J. (2008) Large-scale phosphoproteome analysis of human liver tissue by enrichment and fractionation of phosphopeptides with strong anion exchange chromatography, Proteomics 8, Li, X., Gong, Y., Wang, Y., Wu, S., Cai, Y., He, P., Lu, Z., Ying, W., Zhang, Y., Jiao, L., He, H., Zhang, Z., He, F., Zhao, X., and Qian, X. (2005) Comparison of alternative analytical techniques for the characterisation of the human serum proteome in HUPO Plasma Proteome Project, Proteomics 5, Mange, A., Bellet, V., Tuaillon, E., Van de Perre, P., and Solassol, J. (2008) Comprehensive proteomic analysis of the human milk proteome: Contribution of protein fractionation, J Chromatogr B Analyt Technol Biomed Life Sci 876, Oh, C., Zak, S. H., Mirzaei, H., Buck, C., Regnier, F. E., and Zhang, X. (2007) Neural network prediction of peptide separation in strong anion exchange chromatography, Bioinformatics 23, Simo, C., Gonzalez, R., Barbas, C., and Cifuentes, A. (2005) Combining peptide modeling and capillary electrophoresis-mass spectrometry for characterization of enzymes cleavage patterns: recombinant versus natural bovine pepsin A, Anal Chem 77, Choudhary, G., Wu, S. L., Shieh, P., and Hancock, W. S. (2003) Multiple enzymatic digestion for enhanced sequence coverage of proteins in complex proteomic mixtures using capillary LC with ion trap MS/MS, J Proteome Res 2, Mohammed, S., Lorenzen, K., Kerkhoven, R., van Breukelen, B., Vannini, A., Cramer, P., and Heck, A. J. (2008) Multiplexed proteomics mapping of yeast RNA 122
145 polymerase II and III allows near-complete sequence coverage and reveals several novel phosphorylation sites, Anal Chem 80,
146 Chapter 4 Developing a nano-flow HPLC- ESI-MS/MS methodology for the analysis of Platelet Activating Factor (PAF) family and lyso-glycerophosphocholine (LPC) lipids 4.1 Developing a nano-flow HPLC-ESI-MS/MS methodology for the analysis of Platelet Activating Factor (PAF) family of lipids over the course of neuronal differentiation Introduction Glycerophospholipids are important structural lipids in neuronal membranes (1). Both enzymatic modification by phospholipase A 1, A 2, C, and D and non-enzymatic oxidation produces key cellular second messengers including arachidonic acid, eicosanoids, diacylglycerols, and platelet activating factors (PAF) and PAF-like lipids (2-3). Enhanced synthesis of bioactive glycerophospholipids during brain development is implicated in control of proliferation of neural precursor cells and differentiation of neuronal and glial lineages (4). In adult tissue, increased glycerophosphocholine and glycerophosphoethanolamine concentrations in brain and cerebrospinal fluid are associated with a more rapid cognitive decline in Alzheimer disease (5). Changes in the relative ratio of glycerophospholipid subclasses are also believed to both promote neural cell survival and participate in neuronal death in Parkinson s disease, stroke, and spinal cord injury depending upon which subspecies are generated within the injured microenvironment (2, 4, 6). Mechanistic insight, however, has been complicated by the difficulties associated with 124
147 identifying and quantifying changes in individual molecular species within complex biological samples composed of several thousand lipids. The PAF subclass of glycerophospholipids are purported to be key mediators of neuronal differentiation and neuronal cell death in vitro and in vivo (7-15). PAF synthesis occurs through two enzymatic pathways: de novo and remodeling (Figure 4.1.1). Canonical PAF lipids are defined by alkyl ether linkage at the sn-1 position, a short chain acyl group at the sn-2 position, and a phosphocholine, phosphoethanolamine, or phosphatidic acid at the sn-3 position, however 1-acyl-2-acetyl-sn-glycero-3-phosphocholine species are also produced at significant levels in brain (16-19). Moreover, PAF-like lipids with 4-8 carbon side-chains at the sn-2 position can be generated by non-enzymatic oxidation of sn-2 acyl fatty acids chains in structural membrane glycerophospholipids (20). It is not known whether specific PAF subspecies are preferentially generated over the course of neuronal differentiation or neurodegenerative disease. To date, LC-ESI-MS has proven the most successful in simultaneous detection of multiple glycerophospholipid subspecies at the molecular level. Application of 2- dimensional (2-D) maps of elution time and mass provides a useful means of profiling subclasses within complex samples (21). New tandem mass spectrometry (MS/MS) advances in combination with multiple linear regression modelling has significantly enhanced the capacity to subsequently resolve and quantify molecular subspecies (22). However, these techniques have yet to be applied to a comparison of lipid species in lipidenriched neural samples extracted over the course of differentiation or disease. Here, we describe a method to screen, identify, and quantify changes in glycerophospholipid family members that can be used to compare multiple bioactive subspecies generated over the course of neuronal differentiation. In our approach, nanoflow rate HPLC is combined with positive ion mode ESI-MS to generate 2D profiles of the glycerophospholipid contents of undifferentiated and differentiated PC12 cells. The utilization of precursor ion scans for fragments characteristic of PAF family members and the standard additions of PAF subspecies allows for the 125
148 absolute quantitation of PAF molecules during cell differentiation. We show, for the first time, that the combination of nanoflow rate HPLC with different MS techniques allows the analysis of lipid extract and the specific quantitation of PAF family members from as little as 70,000 PC12 cells Experiments Glycerophospholipids were extracted from undifferentiated rat pheochromocytoma PC12 and NGF (nerve growth factor)-differentiated PC12 cells according to a modified Bligh/Dyer procedure (23). Lipid extracts were analyzed with a 2000 Q TRAP mass spectrometer (Applied Biosystems/MDS Sciex, Concord, ON) integrated with a micro flow 1100 HPLC system (Agilent, Palo Alto, CA). Enhanced MS scan, precursor ion scan and extracted ion chromatogram (XIC) was applied for detecting and highlighting the lipid species of interest. Absolute quantification of C16:0, C18:0 PAF and C16:0, C18:0 lyso-paf were performed using standard addition approach, where 5 standard solutions containing 200, 400, 600, 800, and 1000 pg each of C16:0, C18:0 PAF and C16:0, C18:0 lyso-paf were used in the experiment. At each standard addition concentration, samples were analyzed in triplicate. Therefore a total of 15 LC/MS runs were required for the quantification of the 4 PAF species of interest in each sample. Other details of these experiments were described in chapter Profiling glycerophospholipid changes by 2-D mapping Glycerophospholipid extracts from PC12 cells (non-differentiated vs. NGFdifferentiated) were first screened over the range of m/z from 450 to 600 with enhanced MS scan in positive ion mode. The range of m/z from 450 to 600 covers the PAF family members. Typical spectra are presented as 2-D maps of m/z versus elution time with relative glycerophospholipid abundance indicated in colour (Figure 4.1.2). Figure shows that 126
149 the reversed-phase C18 nanoflow liquid chromatography has provided adequate peak capacity for separating the lipid species of interest. Glycerophosphocholine subclasses, where the PAF family members belong to, were further assessed using precursor ion scan of m/z of 184.0, representing the ionized phosphocholine polar head group. Typical spectra of precursor ion scans are presented in figure 4.1.3, also as 2-D maps of m/z versus elution time with relative abundance indicated in colour. The candidate species of the glycerophosphocholine subclasses can then be estimated on the basis of theoretical mass and elution time. The list of these candidate lipid species are not included in the thesis, as the primary focus of the chapter is the development of a HPLC-MS/MS based analytical approach for the identification and quantification of the PAF family species in non-differentiated and NGF-differentiated PC12 cells. The recorded 2D maps were reproducible over multiple runs. As well, the lipid species of interest recorded on the 2D maps of PC12 and differentiated PC12 could be readily assigned based on the elution time and the m/z. Variation on the m/z axis was on average 0.13 Da and 0.4 minutes on the elution time axis and did not vary between conditions (non-differentiated vs. NGF-differentiated). Secondly, an increase in the number of glycerophosphocholine species were detected in NGF-treated PC12 cells (Figure 4.1.3b) compared to undifferentiated precursors (Figure 4.1.3a) despite an overall decrease in glycerophospholipids observed following differentiation (Figure 4.1.2). Third, the number of glycerophosphocholine species detected within the scan range of 450 to 600 Da is higher than that previously observed over the same m/z range for mouse B-cell NS-1 cells (21). This may reflect the cell-specific differences in lipid metabolism. However, this is also likely attributed to the high sensitivity of the analytical methodology we have developed, where nanoflow rate HPLC was integrated with a more sensitive mass spectrometer. 127
150 4.1.4 Differentiation of PAF species from other isobaric lipid species We intend to identify and quantify the absolute amount of the PAF family species in the complex lipid extracts of non-differentiated and NFG-differentiated PC12 cells. As there is no stable isotope labelled standards available for the PAF family species at the time of the experiment, we use the synthetic standards of the PAF family species, namely, PAF C16, lyso-c16, PAF C18, and lyso-c18, for identification and quantification of endogenous PAF family species in lipid extracts of non-differentiated and NFG-differentiated PC12 cells. The identification was carried out by the standard addition approach. First, we needed to clearly identify the PAF family species and distinguish these species from any isobaric lipid species. Figure 4.1.4a shows the 2D spectra of the 4 synthetic standards of the PAF family species, where m/z of these protonated lipid standards and the corresponding elution time were recorded. During the process of standard addition, we spiked lipid extracts from PC12 and NGF-differentiated PC12 cells with pg of the synthetic standards (Figure b, c). The PAF family species (C16:0, C18:0 PAF and C16:0, C18:0 lyso-paf) in the lipid extracts from PC12 cells can be clearly identified by comparing the elution times recorded in 2D spectra of neat lipid standards (Figure 4.1.4a) and spiked samples (Figure 4.1.4b, c). Figure shows the appearance of considerable tailing on the 2D maps, even with pure standards (Figure 4.1.4a). This is mostly contributed to the colour coding of relative abundance used by the Analyst software. To validate our identification of the four PAF family species and ensure that inclusion of molar excesses of lipid standards would not mask detection of endogenous glycerophosphocholine species in biological samples, extracted ion chromatographs (XIC) were performed for the four PAF family species, as shown in Figure 4.1.5a-d respectively. The precursor ion scan at m/z 184 highlighted any glycerophosphocholine species, which contains a phosphocholine polar head group. As results, isobaric glycerophosphocholine species are identified in the 2D maps. However, these multiple isobaric glycerophospholipids can be clearly differentiated by closer examination of the extracted ion chromatographs (XIC) (Figure 4.1.5a-d). For example, 1-128
151 hexadecanoyl-2-formyl-glycerophosphocholine (PFPC), which is isobaric with C16:0 PAF in positive ion mode (24), elutes earlier than C16:0 PAF as previously reported (25). This can be clearly separated and identified in the XICs (Figure 4.1.5c) Quantitation of PAF family species based on the standard addition approach Further mechanistic insight into the role of these changes in glycerophosphocholine families in developing neurons requires an efficient and sensitive means of identifying and quantifying individual molecular species. To this end, we focused on developing a quantitative analysis of changes in the phosphocholine-paf species (C16:0, C18:0 PAF and C16:0, C18:0 lyso-paf), which are of interest over the course of neuronal differentiation. To develop standard curves, four synthetic PAF standards with defined sn-1 and sn-2 chains and a phosphocholine sn-3 head group were used; namely C16:0, C18:0 PAF and C16:0, C18:0 lyso-paf. We included C18:0 PAF as a negative control as our analysis predicted that the octadecyl-paf species was present at concentrations below detectable levels in both PC12 and NGF-differentiated PC12 cells. The standard addition method was used to quantify the absolute levels of the PAF subspecies present in the sample (Figure 4.1.6). Each standard addition, containing 200, 400, 600, 800, and 1000 pg of C16:0, C18:0 PAF and C16:0, C18:0 lyso-paf, was repeated in triplicate. Peaks of interest were identified (m/z 482.4, 524.3, 510.4, 552.4) based on eluting time and their areas were calculated using the Analyst software. The endogenous PAF species C16:0 LPC (m/z 496.3, elution time 9.60 min) was used to correct the variation in intensity between the multiple MS runs for lipid extracts from non-differentiated and NGFdifferentiated PC12 cells, respectively. This allowed for the correction in intensity variation within a standard addition experiments related to one sample due to changes in alignment and MS performances. Native PAF subspecies concentrations were then determined from the x-intercept using linear regression analysis (Figure 4.1.6a-f). Cook s distance analysis of residuals was performed to identify sample outliers that aberrantly influenced regression outcome (26). The absolute level of PAF species were then calculated according to the 129
152 number of cells utilized. Data were expressed as ng per 10 6 cells (Table 4.1.1). Results indicate a 16-fold increase in C16:0 lyso-paf, an 8-fold increase in C16:0 PAF, and a 3-fold increase in C18:0 lyso-paf. C18:0 PAF levels remained below level of detection and were not identified in either PC12 cells or NGF-differentiated PC12 cells. Further, we used a synthetic internal standard C13:0 LPC not naturally produced by mammalian cells (27) to validate the range of linearity of the standard addition approach developed in this work. First, equal amounts (2 ng) of a synthetic internal standard C13:0 LPC were added to serially-diluted PC12 lipid analytes. The integrated peak intensities of endogenous C16:0 LPC (m/z 496.3, elution time 9.6 min) in each sample were normalized to that of the spiked internal standard C13:0 LPC (Figure 4.1.7a). A linear response was established with normalized peak intensities corresponding to C16:0 LPC falling within the linear range between analyte dilution factors The second experiment, (Figure 4.1.7b) reverses the conditions. We maintained the same sample concentration but added increasing amounts of C13:0 LPC from 2 to 10 ng, which exceeded the maximum amount of lipid standards spiked in the testing samples for quantification. The expected linear response was observed when integrated peak intensities of C13:0 LPC were normalized to the endogenous standard C16:0 LPC (Figure 4.1.7b). These data indicates that quantification of the 4 PAF family species was performed within the range of linearity of the standard addition method developed in the work Conclusions Here, we describe a rapid means of profiling changes in glycerophospholipids with identification and quantitation of glycerophosphocholine species following induction of neuronal differentiation. The combination of nanoflow rate HPLC with ESI-MS in different scan modes facilitated comparison of multiple species in total lipid 2D maps. In this study, we show that the standard addition of synthetic PAF subspecies allows for absolute quantitation of the changes in PAF family members following neuronal differentiation. Surprisingly, a marked asymmetry was detected in the two predominant PAF species (C16:0, 130
153 C18:0) produced by NGF-treated PC12 cells. Differentiation to a peripheral neuronal phenotype was associated with increases in C16:0 PAF and, more dramatically, with production of its immediate precursor and metabolite C16:0 lyso-paf. C18:0 PAF was below limits of detection in both PC12 precursors and differentiated neurons. Interestingly, C18:0 lyso-paf levels were elevated albeit at much lower concentrations than C16:0 lyso- PAF. When placed in context with evidence that C18:0 PAF increases in neural fluids following neuropathological challenge, these data point to a quantifiable difference between PAF molecular species produced by differentiating and damaged neurons. The methodology described here will enable a means of screening and comparing changes in glycerophospholipids, specifically PAF species, by neurons and glia during central and peripheral nervous system development and over the course of progressive neurodegenerative disease. This quantitation is critical to pursuing mechanistic insight in the role of glycerophospholipids in neuronal differentiation and death. 131
154 Table LC-MS/MS quantitation of PAF in PC12 cells and NGF-differentiated PC12 cells. PAF species WT-PC12 (ng/10 6 cells) NGF-driven diffentiated PC12 (ng/10 6 cells) C16:0 Lyso-PAF C18:0 Lyso-PAF C16:0 PAF C18:0 PAF
155 Figure Captions Figure Enzymatic and non-enzymatic generation of PAF family members. PAF species are synthesized through the PAF remodeling pathway (red), de novo synthesis (blue), or direct oxidation of membrane lipids (green, enzyme-independent). Predominant molecular species generated by enzymatic synthesis in brain are the C16:0 and C18:0 PAF family members. Oxidation generates PAF-like family members with longer chain fatty acids (up to 8 carbons) at the sn-2 position (hatched green box). Reprinted with permission from Analytical Chemistry. Copyright 2007, American Chemical Society. Figure Glycerophospholipid profiles of PC12 cells over the course of differentiation to a neuronal phenotype. 2-D spectra of mass versus elution time with relative lipid abundance from (a) PC12 glycerophospholipid extracts spiked with 1000 ng of C18:0 PAF and (b) glycerophospholipids extracted from PC12 cells differentiated to a neuronal phenotype spiked with 1000 ng of C18:0 PAF. Relative lipid expression between conditions was corrected based on the intensity of the exogenous C18:0 PAF. This standard could be applied as endogenous C18:0 PAF was below limits of detection in both conditions. The experimental conditions of the LC/MS-MS are described in the text. Reprinted with permission from Analytical Chemistry. Copyright 2007, American Chemical Society. Figure Glycerophosphocholine profiles of PC12 cells over the course of differentiation to a neuronal phenotype. 2-D maps of mass versus elution time with relative lipid abundance from (a) PC12 cells and (b) PC12 cells differentiated to a neuronal phenotype. Spectra were obtained for glycerophospholipids and analysed in positive ion mode using a precursor ion scan for an MS/MS fragment with a m/z of to detect phosphocholine-containing subspecies. The experimental conditions of the LC/MS-MS are described in the text. Reprinted with permission from Analytical Chemistry. Copyright 2007, American Chemical Society. 133
156 Figure Identification of key PAF species from PC12 cells and PC12 cells differentiated to a neuronal phenotype. 2-D spectra of mass versus elution time with relative lipid abundance from (a) 1000 ng of C16:0, C18:0 PAF and C16:0, C18:0 lyso-paf standards, (b) PC12 glycerophospholipid extracts spiked with 1000 ng of C16:0, C18:0 PAF and C16:0, C18:0 lyso-paf and (c) glycerophospholipids extracted from PC12 cells differentiated to a neuronal phenotype spiked with 1000 ng of C16:0, C18:0 PAF and C16:0, C18:0 lyso-paf. The experimental conditions of the LC/MS-MS are described in the text. Reprinted with permission from Analytical Chemistry. Copyright 2007, American Chemical Society. Figure Identification of PAF family species from the isobaric lipid species using extracted ion chromatography. Extracted ion chromatographs are shown for identifying (a) C16:0 lyso-paf, (b) C18:0 lyso-paf, (c) C16:0 PAF, and (d) C18:0 PAF from PC12 cell lipid extracts spiked with 200 ng of each standard used in standard addition. In (c), the peak eluting at min is consistent with previous reports of PFPC separation, a glycerophospholipid isobaric with C16:0 PAF. Peak retention times were calculated by the instrument software (Analyst 1.4.1). Reprinted with permission from Analytical Chemistry. Copyright 2007, American Chemical Society. 134
157 Figure Quantitation of PAF species from PC12 cells and PC12 cells differentiated to a neuronal phenotype. Lipid extracts from PC12 cells and PC12 cells differentiated to a neuronal phenotype were spiked with 200, 400, 600, 800, or 1000 ng of C16:0, C18:0 PAF and C16:0, C18:0 lyso-paf and analyzed in positive ion mode followed by a precursor ion scan for masses having a m/z MS/MS fragment. Each standard addition was repeated in triplicate. Corresponding peaks of interest were identified (m/z 482.4, 524.3, 510.4, 552.4) and were normalized against the endogenous C16:0 LPC standard to account for any trial variability within each standard addition point. Native PAF species from the cell samples were calculated from the x-intercept using linear regression. Data points depict mean of triplicate measurements standard deviation. Reprinted with permission from Analytical Chemistry. Copyright 2007, American Chemical Society. Figure Validation of range of linearity of the developed standard addition method for PAF species quantitation using an internal standard (C13:0 LPC) and an endogenous standard (C16:0 LPC). (a) PC12 lipid extract was serially diluted and integrated peak intensity for C16:0 LPC (m/z 496.3, elution time 9.60 min) normalized against 2 ng of internal standard C13:0 LPC was plotted. A linear relationship was observed following normalization of C16:0 LPC to C13:0 LPC. (b) To further establish the linear range of response, 2-10 ng of the synthetic internal standard (C13:0 LPC) was added to the same PC12 lipid extract. Variations in the integrated peak area of C16:0 LPC between quadruplicate MS runs are indicated by the red boxes. To correct peak intensity for variations across MS runs, the integrated peak areas of C13:0 LPC was standardized against C16:0 LPC (yellow/black diamonds) demonstrating a linear range of response (y=0.087x , R 2 =0.995). Reprinted with permission from Analytical Chemistry. Copyright 2007, American Chemical Society. 135

158 Figure
159 Figure
160 Figure
161 Figure
162 Figure
163 Figure
164 Figure (a) (b) 142
165 4.2 Applying nano-flow HPLC-ESI-MS/MS methodology for the analysis of Platelet Activating Factor (PAF) family and lyso-glycerophosphocholine (LPC) lipid species in complex biological samples Introduction The aberrant processing of the amyloid precursor protein to different assemblies of amyloid β (Aβ) peptides ranging from 37 and 42 amino acids is an early and necessary prerequisite for the development of Alzheimer Disease (AD) (28). The amyloid cascade hypothesis defines generation of these smaller, toxic Aβ fragments, specifically soluble Aβ 42 oligomers, as the root cause of AD (29). The severity of AD progression, however, is highly correlated with the rate of abnormal tau processing, the other signature AD pathology(30). Underlying molecular mechanisms linking Aβ 42 biogenesis to the aggregation of normally soluble tau proteins into hyperphosphorylated oligomers, paired helical filaments, and finally neurofibrillary tangles remain elusive. Indeed, whether Aβ 42 signals the post-translational modification of tau in human neurons is a matter of intense debate with important therapeutic implications (31). Aβ 42 can activate cytosolic phospholipase A 2 (cpla 2 ) (32-33), a Group IVa PLA 2 that preferentially hydrolyzes arachidonic acid from the sn-2 position of 1-O-alkyl-2- arachidonoyl- and 1-O-acyl-2-arachidonoyl-glycerophospholipids (34). Inhibiting cpla 2 activation completely attenuates Aβ 42 neurotoxicity; however blocking the different metabolic arms of the arachidonic acid cascade confers only partial protection (32-33, 35). Little is known about the fate of the glycerophospholipid backbone following the release of arachidonic acid by cpla 2. The alkyl-lyso-glycerophosphocholines and lysophosphatidylcholines (LPCs) are of particular interest. These metabolites are biologically active in their own right and can be further modified by lyso-phosphatidylcholine acyltransferases (LPCATs). LPCAT activity also increases in AD(36), notably in the posterior-temporal entorhinal cortex, a region characterized by the earliest tau pathology (37). Transfer of a long-chain acyl group to the sn-2 position by LPCAT1 and 2 will regenerate structural membrane lipids whereas addition of a small acetyl group produces a 143
166 powerful family of lipid second messengers known as platelet activating factors (PAFs) (38). PAF lipids signal neuronal death in ischemia, seizure, and AIDS dementia in vivo and have been implicated in both Aβ 42 toxicity and the activation of tau kinases in vitro (7, 39-41). Signaling is isoform-specific. Differences in the sn-1 carbon chain length and degree of saturation determine whether activation of the PAF G-protein coupled receptor (PAFR) is cytotoxic or cytoprotective (42-45). In this section, we used an unbiased lipidomics approach to profile the alkylacylglycerophosphocholine second messengers altered in AD. We found a selective elevation in PAF species defined by a palmitic acid (16:0) at the sn-1 position in the posterior-entorhinal cortex of individuals with AD, in TgCRND8 transgenic mice expressing mutant human amyloid precursor protein, and in human neurons directly exposed to soluble Aβ 42 oligomers Experiments Glycerophospholipids were extracted post-mortem from the posterior/entorhinal cortex of AD patients and control subjects. Glycerophospholipids were also extracted from posterior temporal/entorhinal cortex of TgCRND8 transgenic mice. Human samples were spiked with ng C13:0 LPC at time of extraction. Human hnt neurons, generated from NT2/D1 precursor cells(46), were treated with Aβ 42 (25 µm) to test whether Aβ 42 selectively impairs neuronal C16:0 PAF metabolism. Glycerophospholipids were extracted according to a modified Bligh and Dyer procedure. Relative quantification of PAF family and LPC lipid species in lipid extracts from AD patients and control subjects were carried out by normalizing the peak area of the lipid species of interest against that of the C13:0 LPC internal standard. The synthetic lipid standards d 4 -C16:0 PAF or d 4 -C16:0-lyso-PAF were spiked at the time of MS analysis for facilitating the identification and quantification of endogenous C16:0 PAF or C16:0-lyso- PAF. 144
167 4.2.3 Results Metabolism of C16:0 PAF is elevated in the posterior/entorhinal cortex of AD patients Glycerophospholipids were extracted post-mortem from the posterior/entorhinal cortex of AD patients and control subjects. PAF isoforms were profiled by high performance liquid chromatography electrospray ionization mass spectrometry (LC-ESI-MS) (47). Lipids with mass to charge ratios (m/z) of were analyzed in positive ion mode by MS scan for a protonated molecule at expected m/z followed by precursor ion scan for a diagnostic phosphocholine product ion at m/z 184. Peak intensities were standardized against C13:0 LPC, a synthetic internal standard added at the time of lipid extraction. Sixteen PAF species and three lyso-paf species were identified in human posterior/entorhinal cortex on the basis of mass and retention time (Figure 4.2.1). Three of these species were significantly elevated in AD cortex: 1-O-hexadecyl-2-acetyl-sn-glycero-3-phosphocholine (C16:0-PAF), its immediate metabolite/precursor 1-O-hexadecyl-2-lyso-sn-glycero-3-phosphocholine (C16- lyso-paf), and 1-O-oleyl-2-lyso-sn-glycero-3-phosphocholine (C18:1 lyso-paf). As the elevations in C16:0 PAF and C16:0 lyso-paf suggested a specific disruption in the remodeling of palmitic acid containing-paf through the Land s cycle, we used deuterated standards to verify the identity. Clear separation was obtained between C16:0 PAF and isobaric C18:0 LPC with the isoform altered in AD co-eluting with d 4 -C16:0 PAF (Figure 4.2.2). The analysis of glycerophospholipids extracted post-mortem from the posterior/entorhinal cortex of AD patients and control subjects revealed that, expressed as pg/mg of tissue (Figure 4.2.3), a significant increase from pm in control to pm in AD cortex and from pm in control to pm in AD cortex in C16:0 PAF and C16:0 lyso-paf concentrations respectively. 145
168 Disruption of C16:0 PAF metabolism is an early event in TgCRND8 mice Aberrations in lipid metabolism in AD etiology that occur early and remain elevated are predicted to have the greatest impact on neuronal function in diseased tissue. To determine whether disruption of C16:0 PAF metabolism is an early event in AD, we analyzed the posterior temporal/entorhinal cortex of TgCRND8 transgenic mice (48) (Figure a). The TgCRND8 line expresses a double mutant form (M146L and L286V) of the human amyloid precursor protein gene under the control of the prion protein promoter. Pathogenic increases in cortical Aβ 42 / Aβ 40 ratios are first observed at 10 weeks of age coincident with the onset of learning and memory impairment (48). Here, we found that tissue concentrations of C16:0 PAF (Figure 4.2.4b) and C16:0 lyso-paf (Figure 4.2.4c) of week old TgCRND mice were already four-fold and two-fold greater than nontransgenic (NonTg) littermates respectively. Tissue concentrations, expressed as pg/mg in Figure 4.2.4, represent molar concentrations of pm and pm for C16:0 PAF in NonTg and TgCRND8 and pm and pm for C16:0 lyso-paf in NonTg and TgCRND8 cortex respectively C16:0 PAF accumulates in human neurons treated with soluble Aβ 42 oligomers Accumulation in C16:0 PAF may simply reflect a change in cell distribution, as seen in experimental allergic encephalomyelitis wherein local tissue levels of total PAF lipids are elevated by the influx of activated microglia actively metabolizing PAFs (49). To test whether Aβ 42 selectively impairs neuronal C16:0 PAF metabolism, human hnt neurons were generated from NT2/D1 precursor cells (46). Cultures were treated with Aβ 42 (25 µm) prepared as soluble oligomers (50). All treatments were carried out in serum-free media containing 0.025% bovine serum albumin (w/v) to ensure neurons were not exposed to the secreted PAF acetylhydrolase (PAF-AH) isoform present in serum supplements. No degradation of exogenous PAF in media was detected under these conditions. 146
169 A 24 h exposure to Aβ 42 caused significant neuronal death (Figure a). Over the course of treatment, C16:0 lyso-paf concentrations increased steadily rising to 15-fold that of control cultures ( pm to pm, Figure b). Endogenous C16:0 PAF levels initially dropped from pm to 28+4 pm over the first 6 h of treatment and then increased to 5-fold that of control levels within 24 h ( pm, Figure c). Taken together, these data are consistent with a specific increase in cpla 2 /LPCAT remodeling of alkylacylglycerophosphocholines in response to oligomeric Aβ 42. Also intriguing was the initial drop in endogenous C16:0 PAF levels suggesting a compensatory increase in intracellular catabolism following acute exposure to Aβ 42 that was insufficient to prevent intracellular accumulation of both C16:0 PAF and C16:0 lyso-paf in human neurons chronically exposed to Aβ Discussion In this study, we elucidate a new pathway of neuronal dysfunction triggered by aberrant alkylacylglycerophosphocholine metabolism in response to oligomeric Aβ 42. Our lipidomics approach revealed a selective disruption in C16:0 PAF and C16:0 lyso-paf metabolism in the posterior/entorhinal cortex of AD patients, a region noted for the earliest indication of tau pathology (37). We found that this disruption occurred early in disease progression in TgCRND8 transgenic mice overexpressing mutant human amyloid precursor protein, coincident with pathogenic increases in cortical Aβ 42 / Aβ 40 ratios (48). In human neurons, aberrant C16:0 PAF metabolism was elicited by direct exposure to soluble Aβ 42 oligomers. The specificity of this metabolic disruption for hexadecyl-paf was surprising. While consistent with an upregulation in cpla 2 and LPCAT activities observed in AD and in response to Aβ 42 (32-33, 36), structural lipids with a C16:0 sn-1 carbon-chain are not normally preferentially modified. Moreover, LPCAT1 and 2 utilize 18:2- and 18:3-CoA (LPCAT1) or 20:4-CoA (LPCAT2) as preferred acyl substrates (38) and thus are more likely to regenerate structural membrane lipids over PAF second messengers. Thus, our lipidomics 147
170 profile may indicate a shift in substrate availability and/or specificity in diseased tissue. The selective impairment in C16:0 PAF metabolism in response to oligomeric Aβ 42 may represent a new potential target for therapeutic intervention in AD. 4.3 Chapter Summary In summary, we developed a nano-hplc-esi-ms/ms-based analytical methodology for the analysis of PAF and LPC lipid species in lipid extracts from cells and tissue samples of mice and human. Absolute quantitation of PAF lipid species was performed with standard addition approach, where the PAF subspecies standards of known amount were spiked into lipid samples prior to MS analysis. The relative comparisons of other LPC lipid species of interest between test samples and controls were carried out by spiking in identical amount of non-endogenous C13:0 LPC standard at the time of lipid extraction. We found a 16-fold increase in C16:0 lyso-paf, an 8-fold increase in C16:0 PAF, and a 3-fold increase in C18:0 lyso-paf in lipid extracts from the NGF-differentiated PC12 cells as compared to the non-differentiated PC12 cells. An elevation of C16 PAF was further identified in the posterior/entorhinal cortex of AD patients and TgCRND8 transgenic mice in comparison to the respective human and mice controls. The methodology described here will enable a means of screening and comparing changes in glycerophospholipids, specifically PAF species, by neurons and glia during central and peripheral nervous system development and over the course of progressive neurodegenerative disease. This quantitation is critical to pursuing mechanistic insight in the role of glycerophospholipids in neuronal differentiation and death. 148
171 Figure Captions Figure Specific PAF metabolites accumulate in AD tissue. (a-p) Thirteen PAF species and (q-s) three lyso-paf species were detected in human posterior/entorhinal cortex (by LC-ESI-MS. Species were identified on the basis of mass and retention time. Significant changes in (h) C16:0 PAF, (q) C16:0 lyso-paf, and (r) C18:1 lyso-paf levels were detected in AD tissue (n=4 individuals/condition). Data are expressed as fold change relative to controls + SEM. (* indicates p<0.05, Student s t test). Reprinted with permission from Proceedings of the National Academy of Sciences, USA. Copyright 2009, National Academy of Sciences, USA. Figure The identity of C16:0 PAF and C16:0 lyso-paf were verified by co-elution with deuterated standards. As PAF species can be isobaric with other phosphatidylcholines, analytes were re-analyzed following spike with deuterated d 4 -C16:0 PAF or d 4 -C16:0 lyso-paf. Representative extracted ion chromatographs at m/z 524 (upper panel) or 528 (lower panel) with a phosphocholine product ion at m/z detected by precursor ion scan in positive ion mode are presented. C16:0 PAF clearly separates from isobaric C18:0 LPC (upper inset) and coelutes with d 4 -C16:0 PAF. Reprinted with permission from Proceedings of the National Academy of Sciences, USA. Copyright 2009, National Academy of Sciences, USA. Figure C16:0-PAF and its immediate precursor and metabolite C16:0-lyso-PAF accumulate in AD cortex. (a) PAF lipid species were identified in post-mortem human posterior-entorhinal cortex by LC-ESI-MS. A significant increase in (b) C16:0 PAF and (c) C16:0 lyso-paf levels were detected in AD tissue (n=4 individuals/condition). Data are expressed as fold change relative to controls + standard error of measurement (SEM). Tissue concentrations, expressed as pg/mg tissue wet weight, were calculated for C16:0 lyso-paf (c) and C16:0 PAF (d) in comparison to deuterated samples spiked at the time of analysis 149
172 (see Fig ). Each square represents an individual patient. (* indicates p<0.05, Student s t test). Reprinted with permission from Proceedings of the National Academy of Sciences, USA. Copyright 2009, National Academy of Sciences, USA. Figure C16:0 PAF and lyso-paf concentrations are elevated in the entorhinal cortex of TgCNRD8 mice expressing mutant human amyloid precursor protein. (a) Dissection coordinates of regions analyzed by LC-ESI-MS are indicated in blue. (b) Absolute quantitation of C16:0 PAF and C16:0 lyso-paf species was performed by standard addition method (n=15 measurements/sample). Tissue concentrations of C16:0 PAF and lyso-paf concentrations were elevated in week old TgCRND8 mice with the increase in C16:0 PAF reaching statistically significance (*p<0.05, Student s t test, n=3 mice/condition). Reprinted with permission from Proceedings of the National Academy of Sciences, USA. Copyright 2009, National Academy of Sciences, USA. Figure C16:0 lyso-paf and C16:0 PAF accumulate in human neurons treated with soluble Aβ 42 oligomers. (a) Treatment of hnt neurons for 24 h with 25 µm Aβ 42 prepared as soluble oligomers elicits significant death as assessed by TUNEL (left panel, *p<0.05, Student s t-test). Morphology of single hnt neurons (arrowhead) or aggregated in bundles (arrows) on a feeder layer of non-neuronal cells (asterisk) after 24 h treatment with vehicle (serum-free media % BSA) (top right panel). Following Aβ 42 treatment (bottom right panel), marked cell loss was evident with a reduction in the size of neuronal bundles (arrows) and vacuolization of remaining neurons (arrowheads) without significant impact upon feeder layer cells (asterisk). Scale bar 50 µm. Intracellular (b) C16:0 lyso-paf and (c) C16:0 PAF levels were assessed in vehicle and Aβ 42 -treated cultures over a 24 h period by LC-ESI-MS. Data are expressed as fold change relative to untreated hnt control cultures grown in complete media + SEM. Exposure of cultures to serum-free treatment media (vehicle) did not impact upon PAF metabolism. (b) Treatment with Aβ 42 prepared as soluble oligomers steadily increased C16:0 lyso-paf levels. (c) A transient decrease in 150
173 C16:0 PAF was detected within 6 h of exposure followed by a progressive increase in lipid levels. (*p<0.05, **p<0.01, ANOVA, post-hoc Dunnett s t test). Reprinted with permission from Proceedings of the National Academy of Sciences, USA. Copyright 2009, National Academy of Sciences, USA. 151
174 Figure
175 Figure
176 Figure

177 Figure

178 Figure
Mass Spectrometry. Mass spectrometer MALDI-TOF ESI/MS/MS. Basic components. Ionization source Mass analyzer Detector
 Mass Spectrometry MALDI-TOF ESI/MS/MS Mass spectrometer Basic components Ionization source Mass analyzer Detector 1 Principles of Mass Spectrometry Proteins are separated by mass to charge ratio (limit
Mass Spectrometry based metabolomics
 Mass Spectrometry based metabolomics Metabolomics- A realm of small molecules (
Principles of Shotgun Lipidomics
 Principles of Shotgun Lipidomics Xianlin Han Diabetes and Obesity Research Center Sanford-Burnham Medical Research Institute Lake Nona Orlando, FL 32827 What is shotgun lipidomics? Original definition
Lecture 3. Tandem MS & Protein Sequencing
 Lecture 3 Tandem MS & Protein Sequencing Nancy Allbritton, M.D., Ph.D. Department of Physiology & Biophysics 824-9137 (office) nlallbri@uci.edu Office- Rm D349 Medical Science D Bldg. Tandem MS Steps:
The use of mass spectrometry in lipidomics. Outlines
 The use of mass spectrometry in lipidomics Jeevan Prasain jprasain@uab.edu 6-2612 utlines Brief introduction to lipidomics Analytical methodology: MS/MS structure elucidation of phospholipids Phospholipid
PTM Discovery Method for Automated Identification and Sequencing of Phosphopeptides Using the Q TRAP LC/MS/MS System
 Application Note LC/MS PTM Discovery Method for Automated Identification and Sequencing of Phosphopeptides Using the Q TRAP LC/MS/MS System Purpose This application note describes an automated workflow
4th Multidimensional Chromatography Workshop Toronto (January, 2013) Herman C. Lam, Ph.D. Calibration & Validation Group
 Herman C. Lam, Ph.D. Calibration & Validation Group") 4th Multidimensional Chromatography Workshop Toronto (January, 2013) Herman C. Lam, Ph.D. Calibration & Validation Group MDLC for Shotgun Proteomics Introduction General concepts Advantages Challenges
4th Multidimensional Chromatography Workshop Toronto (January, 2013) Herman C. Lam, Ph.D. Calibration & Validation Group MDLC for Shotgun Proteomics Introduction General concepts Advantages Challenges
Glycerolipid Analysis. LC/MS/MS Analytical Services
 Glycerolipid Analysis LC/MS/MS Analytical Services Molecular Characterization and Quantitation of Glycerophospholipids in Commercial Lecithins by High Performance Liquid Chromatography with Mass Spectrometric
Mass-Spectrometric Analysis of Lipids (Lipidomics)
") Mass-Spectrometric Analysis of Lipids (Lipidomics) 1. Identification 2. Quantification 3. Metabolism Why to do lipidomics? Biology: Functions of different lipids? Medicine: Diagnostics and Therapy Industry:
Mass-Spectrometric Analysis of Lipids (Lipidomics) 1. Identification 2. Quantification 3. Metabolism Why to do lipidomics? Biology: Functions of different lipids? Medicine: Diagnostics and Therapy Industry:
Comparison of mass spectrometers performances
 Comparison of mass spectrometers performances Instrument Mass Mass Sensitivity resolution accuracy Quadrupole 1 x 10 3 0.1 Da* 0.5-1.0 pmol DE-MALDI 2 x 10 4 20 ppm 1-10 fmol peptide 1-5 pmol protein Ion
2. Ionization Sources 3. Mass Analyzers 4. Tandem Mass Spectrometry
 Dr. Sanjeeva Srivastava 1. Fundamental of Mass Spectrometry Role of MS and basic concepts 2. Ionization Sources 3. Mass Analyzers 4. Tandem Mass Spectrometry 2 1 MS basic concepts Mass spectrometry - technique
Lipid Analysis ISOLATION, SEPARATION, IDENTIFICATION AND. Bridgwater, England LIPIDOMIC ANALYSIS. Fourth Edition. Invergowrie, Dundee, Scotland
 Lipid Analysis ISOLATION, SEPARATION, IDENTIFICATION AND LIPIDOMIC ANALYSIS Fourth Edition WILLIAM W.CHRISTIE MRS Lipid Analysis Unit, Scottish Crop Research Institute, Dundee, Scotland Invergowrie, and
Mass Spectrometry. - Introduction - Ion sources & sample introduction - Mass analyzers - Basics of biomolecule MS - Applications
 - Introduction - Ion sources & sample introduction - Mass analyzers - Basics of biomolecule MS - Applications Adapted from Mass Spectrometry in Biotechnology Gary Siuzdak,, Academic Press 1996 1 Introduction
REDOX PROTEOMICS. Roman Zubarev.
 REDOX PROTEOMICS Roman Zubarev Roman.Zubarev@ki.se Physiological Chemistry I, Department for Medical Biochemistry & Biophysics, Karolinska Institutet, Stockholm What is (RedOx) Proteomics? Proteomics -
MALDI-TOF. Introduction. Schematic and Theory of MALDI
 MALDI-TOF Proteins and peptides have been characterized by high pressure liquid chromatography (HPLC) or SDS PAGE by generating peptide maps. These peptide maps have been used as fingerprints of protein
Sequence Identification And Spatial Distribution of Rat Brain Tryptic Peptides Using MALDI Mass Spectrometric Imaging
 Sequence Identification And Spatial Distribution of Rat Brain Tryptic Peptides Using MALDI Mass Spectrometric Imaging AB SCIEX MALDI TOF/TOF* Systems Patrick Pribil AB SCIEX, Canada MALDI mass spectrometric
Introduction to Proteomics 1.0
 Introduction to Proteomics 1.0 CMSP Workshop Pratik Jagtap Managing Director, CMSP Objectives Why are we here? For participants: Learn basics of MS-based proteomics Learn what s necessary for success using
Quantification with Proteome Discoverer. Bernard Delanghe
 Quantification with Proteome Discoverer Bernard Delanghe Overview: Which approach to use? Proteome Discoverer Quantification Method What When to use Metabolic labeling SILAC Cell culture systems Small
Shotgun Proteomics MS/MS. Protein Mixture. proteolysis. Peptide Mixture. Time. Abundance. Abundance. m/z. Abundance. m/z 2. Abundance.
 Abundance Abundance Abundance Abundance Abundance Shotgun Proteomics Protein Mixture 1 2 3 MS/MS proteolysis m/z 2 3 Time µlc m/z MS 1 m/z Peptide Mixture m/z Block Diagram of a Mass Spectrometer Sample
Accurate Quantification of Lipid Species by Electrospray Ionization Mass Spectrometry Meets a Key Challenge in Lipidomics
 Metabolites 2011, 1, 21-40; doi:10.3390/metabo1010021 Review OPEN ACCESS metabolites ISSN 2218-1989 www.mdpi.com/journal/metabolites/ Accurate Quantification of Lipid Species by Electrospray Ionization
MASS SPECTROMETRY BASED METABOLOMICS. Pavel Aronov. ABRF2010 Metabolomics Research Group March 21, 2010
 MASS SPECTROMETRY BASED METABOLOMICS Pavel Aronov ABRF2010 Metabolomics Research Group March 21, 2010 Types of Experiments in Metabolomics targeted non targeted Number of analyzed metabolites is limited
Mass Spectrometry and Proteomics - Lecture 4 - Matthias Trost Newcastle University
 Mass Spectrometry and Proteomics - Lecture 4 - Matthias Trost Newcastle University matthias.trost@ncl.ac.uk previously Peptide fragmentation Hybrid instruments 117 The Building Blocks of Life DNA RNA Proteins
LC/MS/MS SOLUTIONS FOR LIPIDOMICS. Biomarker and Omics Solutions FOR DISCOVERY AND TARGETED LIPIDOMICS
 LC/MS/MS SOLUTIONS FOR LIPIDOMICS Biomarker and Omics Solutions FOR DISCOVERY AND TARGETED LIPIDOMICS Lipids play a key role in many biological processes, such as the formation of cell membranes and signaling
Essential Lipidomics Experiments using the LTQ Orbitrap Hybrid Mass Spectrometer
 Application Note: 367 Essential Lipidomics Experiments using the LTQ rbitrap Hybrid Mass Spectrometer Thomas Moehring 1, Michaela Scigelova 2, Christer S. Ejsing 3, Dominik Schwudke 3, Andrej Shevchenko
Biological Mass spectrometry in Protein Chemistry
 Biological Mass spectrometry in Protein Chemistry Tuula Nyman Institute of Biotechnology tuula.nyman@helsinki.fi MASS SPECTROMETRY is an analytical technique that identifies the chemical composition of
Metabolomics: quantifying the phenotype
 Metabolomics: quantifying the phenotype Metabolomics Promises Quantitative Phenotyping What can happen GENOME What appears to be happening Bioinformatics TRANSCRIPTOME What makes it happen PROTEOME Systems
Ion Source. Mass Analyzer. Detector. intensity. mass/charge
 Proteomics Informatics Overview of spectrometry (Week 2) Ion Source Analyzer Detector Peptide Fragmentation Ion Source Analyzer 1 Fragmentation Analyzer 2 Detector b y Liquid Chromatography (LC)-MS/MS
Metabolomic fingerprinting of serum samples by direct infusion mass spectrometry
 Metabolomic fingerprinting of serum samples by direct infusion mass spectrometry Raúl González-Domínguez * Department of Chemistry, Faculty of Experimental Sciences. University of Huelva, Spain. * Corresponding
LOCALISATION, IDENTIFICATION AND SEPARATION OF MOLECULES. Gilles Frache Materials Characterization Day October 14 th 2016
 LOCALISATION, IDENTIFICATION AND SEPARATION OF MOLECULES Gilles Frache Materials Characterization Day October 14 th 2016 1 MOLECULAR ANALYSES Which focus? LOCALIZATION of molecules by Mass Spectrometry
Learning Objectives. Overview of topics to be discussed 10/25/2013 HIGH RESOLUTION MASS SPECTROMETRY (HRMS) IN DISCOVERY PROTEOMICS
 IN DISCOVERY PROTEOMICS") HIGH RESOLUTION MASS SPECTROMETRY (HRMS) IN DISCOVERY PROTEOMICS A clinical proteomics perspective Michael L. Merchant, PhD School of Medicine, University of Louisville Louisville, KY Learning Objectives
HIGH RESOLUTION MASS SPECTROMETRY (HRMS) IN DISCOVERY PROTEOMICS A clinical proteomics perspective Michael L. Merchant, PhD School of Medicine, University of Louisville Louisville, KY Learning Objectives
Don t miss a thing on your peptide mapping journey How to get full coverage peptide maps using high resolution accurate mass spectrometry
 Don t miss a thing on your peptide mapping journey How to get full coverage peptide maps using high resolution accurate mass spectrometry Kai Scheffler, PhD BioPharma Support Expert,LSMS Europe The world
A Definitive Lipidomics Workflow for Human Plasma Utilizing Off-line Enrichment and Class Specific Separation of Phospholipids
 A Definitive Lipidomics Workflow for Human Plasma Utilizing Off-line Enrichment and Class Specific Separation of Phospholipids Jeremy Netto, 1 Stephen Wong, 1 Federico Torta, 2 Pradeep Narayanaswamy, 2
MASS SPECTROMETRY IN METABOLOMICS
 For personal use only. Please do not reuse or reproduce without the author s permission MASS SPECTRMETRY IN METABLMICS Pavel Aronov Stanford Mass Spectrometry Users Meeting August 21, 2008 rigin of Metabolomics
Supporting information
 Supporting information Figure legends Supplementary Table 1. Specific product ions obtained from fragmentation of lithium adducts in the positive ion mode comparing the different positional isomers of
Protein sequence mapping is commonly used to
 Reproducible Microwave-Assisted Acid Hydrolysis of Proteins Using a Household Microwave Oven and Its Combination with LC-ESI MS/MS for Mapping Protein Sequences and Modifications Nan Wang and Liang Li
Supporting Information. Lysine Propionylation to Boost Proteome Sequence. Coverage and Enable a Silent SILAC Strategy for
 Supporting Information Lysine Propionylation to Boost Proteome Sequence Coverage and Enable a Silent SILAC Strategy for Relative Protein Quantification Christoph U. Schräder 1, Shaun Moore 1,2, Aaron A.
Application Note # LCMS-89 High quantification efficiency in plasma targeted proteomics with a full-capability discovery Q-TOF platform
 Application Note # LCMS-89 High quantification efficiency in plasma targeted proteomics with a full-capability discovery Q-TOF platform Abstract Targeted proteomics for biomarker verification/validation
Biological Mass Spectrometry. April 30, 2014
 Biological Mass Spectrometry April 30, 2014 Mass Spectrometry Has become the method of choice for precise protein and nucleic acid mass determination in a very wide mass range peptide and nucleotide sequencing
The detergent-solubilized and gel filtration purified rhodopsin was partitioned against
 Supplement Jastrzebska et al. Materials and Methods The detergent-solubilized and gel filtration purified rhodopsin was partitioned against H 2 O/MeOH/CHCl 3, and the bottom layer was removed, dried down,
Quantitation of Protein Phosphorylation Using Multiple Reaction Monitoring
 Quantitation of Protein Phosphorylation Using Multiple Reaction Monitoring Application Note Authors Ning Tang, Christine A. Miller and Keith Waddell Agilent Technologies, Inc. Santa Clara, CA USA This
NIH Public Access Author Manuscript J Proteome Res. Author manuscript; available in PMC 2014 July 05.
 NIH Public Access Author Manuscript Published in final edited form as: J Proteome Res. 2013 July 5; 12(7): 3071 3086. doi:10.1021/pr3011588. Evaluation and Optimization of Mass Spectrometric Settings during
Multiplex Protein Quantitation using itraq Reagents in a Gel-Based Workflow
 Multiplex Protein Quantitation using itraq Reagents in a Gel-Based Workflow Purpose Described herein is a workflow that combines the isobaric tagging reagents, itraq Reagents, with the separation power
Mass Spectrometry and Proteomics. Professor Xudong Yao Bioanalytical Chemistry Spring 2007
 Mass Spectrometry and Proteomics Professor Xudong Yao Bioanalytical Chemistry Spring 2007 Proteomics and -omics Roles of mass spectrometry Comparative proteomics Chemical proteomics Protein, Proteome and
Mass spectra of peptides and proteins - and LC analysis of proteomes Stephen Barnes, PhD
 Mass spectra of peptides and proteins - and LC analysis of proteomes Stephen Barnes, PhD 4-7117 sbarnes@uab.edu Overview A mass spectrum Electrospray MS Analysis of intact proteins Molecular weight calculations
Comprehensive Lipid Profiling of Human Liver Tissue Extracts of Non-Alcoholic Fatty Liver Disease
 Comprehensive Lipid Profiling of Human Liver Tissue Extracts of Non-Alcoholic Fatty Liver Disease Multiplexed Precursor Ion Scanning and LipidView Software Brigitte Simons 1 and Bianca Arendt 2 1 AB SCIEX,
Phosphorylation of proteins Steve Barnes Feb 19th, 2002 in some cases, proteins are found in a stable, hyperphosphorylated state, e.g.
 Phosphorylation of proteins Steve Barnes Feb 19th, 2002 in some cases, proteins are found in a stable, hyperphosphorylated state, e.g., casein more interestingly, in most other cases, it is a transient
Comprehensive Two-Dimensional HPLC and Informative Data Processing for Pharmaceuticals and Lipids
 PO-CON1576E Comprehensive Two-Dimensional HPLC and Informative Data Processing for Pharmaceuticals and Lipids HPLC 2015 PSB-MULTI-06 Yoshiyuki WATABE, Tetsuo IIDA, Daisuke NAKAYAMA, Kanya TSUJII, Saki
Solving practical problems. Maria Kuhtinskaja
 Solving practical problems Maria Kuhtinskaja What does a mass spectrometer do? It measures mass better than any other technique. It can give information about chemical structures. What are mass measurements
New Instruments and Services
 New Instruments and Services Liwen Zhang Mass Spectrometry and Proteomics Facility The Ohio State University Summer Workshop 2016 Thermo Orbitrap Fusion http://planetorbitrap.com/orbitrap fusion Thermo
Greazy: Open-Source Software for Automated Phospholipid MS/MS Identification. Michael Kochen
 Greazy: Open-Source Software for Automated Phospholipid MS/MS Identification By Michael Kochen Thesis Submitted to the Faculty of the Graduate School of Vanderbilt University in partial fulfillment of
Proteins: Proteomics & Protein-Protein Interactions Part I
 Proteins: Proteomics & Protein-Protein Interactions Part I Jesse Rinehart, PhD Department of Cellular & Molecular Physiology Systems Biology Institute DNA RNA PROTEIN DNA RNA PROTEIN Proteins: Proteomics
Biomolecular Mass Spectrometry
 Lipids ot different than other organic small molecules Carbohydrates Polymers of monosaccharides linked via glycosidic bonds (acetals/ ketals) many different combinationsvery interesting no time ucleic
MS/MS to Targeted Proteomics (MRM)
") MS/MS to Targeted Proteomics (MRM) How it worked on the Human Lens Proteome Jayson Falkner PhD jay@singleorganism.com Genes Show Limited Value in Predicting Diseases With only a few exceptions, what the
MS/MS to Targeted Proteomics (MRM) How it worked on the Human Lens Proteome Jayson Falkner PhD jay@singleorganism.com Genes Show Limited Value in Predicting Diseases With only a few exceptions, what the
Thermo Scientific LipidSearch Software for Lipidomics Workflows. Automated Identification and Relative. Quantitation of Lipids by LC/MS
 Thermo Scientific LipidSearch Software for Lipidomics Workflows Automated Identification and Relative of Lipids by LC/MS The promise of lipidomics Lipidomics is a new field of study crucial for understanding
1. Sample Introduction to MS Systems:
 MS Overview: 9.10.08 1. Sample Introduction to MS Systems:...2 1.1. Chromatography Interfaces:...3 1.2. Electron impact: Used mainly in Protein MS hard ionization source...4 1.3. Electrospray Ioniztion:
Improved method for the quantification of lysophospholipids including enol ether
 Supplemental Material Improved method for the quantification of lysophospholipids including enol ether species by liquid chromatography-tandem mass spectrometry James G. Bollinger *, Hiromi Ii*, Martin
Proteomics/Peptidomics
 Proteomics/Peptidomics System biology tools and preclinical models for translational research in endometriosis, ESHRE Campus workshop, 4-5 September 2009 E. Waelkens Proteomics: What? Proteins Proteomics
The Comparison of High Resolution MS with Triple Quadrupole MS for the Analysis of Oligonucleotides
 The Comparison of High Resolution MS with Triple Quadrupole MS for the Analysis of Oligonucleotides Mohammed Abrar Unilabs York Bioanalytical Solutions Outline Introduction Why LC-MS/MS? Limitations of
MASS SPECTROMETRY STRATEGIES FOR COMPREHENSIVE LIPIDOME ANALYSIS OF COLORECTAL CANCER CELLS AND THEIR SECRETED EXOSOMES. Cassie J.
 MASS SPECTROMETRY STRATEGIES FOR COMPREHENSIVE LIPIDOME ANALYSIS OF COLORECTAL CANCER CELLS AND THEIR SECRETED EXOSOMES By Cassie J. Fhaner A DISSERTATION Submitted to Michigan State University in partial
Advances in Hybrid Mass Spectrometry
 The world leader in serving science Advances in Hybrid Mass Spectrometry ESAC 2008 Claire Dauly Field Marketing Specialist, Proteomics New hybrids instruments LTQ Orbitrap XL with ETD MALDI LTQ Orbitrap
One Gene, Many Proteins. Applications of Mass Spectrometry to Proteomics. Why Proteomics? Raghothama Chaerkady, Ph.D.
 Applications of Mass Spectrometry to Proteomics Raghothama Chaerkady, Ph.D. McKusick-Nathans Institute of Genetic Medicine and the Department of Biological Chemistry Why Proteomics? One Gene, Many Proteins
Glycosylation analysis of blood plasma proteins
 Glycosylation analysis of blood plasma proteins Thesis booklet Eszter Tóth Doctoral School of Pharmaceutical Sciences Semmelweis University Supervisor: Károly Vékey DSc Official reviewers: Borbála Dalmadiné
Phospholipid characterization by a TQ-MS data based identification scheme
 P-CN1716E Phospholipid characterization by a TQ-MS data based identification scheme ASMS 2017 MP-406 Tsuyoshi Nakanishi 1, Masaki Yamada 1, Ningombam Sanjib Meitei 2, 3 1 Shimadzu Corporation, Kyoto, Japan,
Rapid Lipid Profiling of Serum by Reverse Phase UPLC-Tandem Quadrupole MS
 Rapid Lipid Profiling of Serum by Reverse Phase UPLC-Tandem Quadrupole MS Mark Ritchie and Evelyn Goh Waters Pacific Pte Ltd., Singapore A P P L I C AT ION B E N E F I T S Delivers a rapid 10-min MRM method
Quantification of PtdInsP 3 molecular species in cells and tissues by mass spectrometry
 Nature Methods Quantification of PtdInsP 3 molecular species in cells and tissues by mass spectrometry Jonathan Clark, Karen E Anderson, Veronique Juvin, Trevor S Smith, Fredrik Karpe, Michael J Wakelam,
Data Independent MALDI Imaging HDMS E for Visualization and Identification of Lipids Directly from a Single Tissue Section
 Data Independent MALDI Imaging HDMS E for Visualization and Identification of Lipids Directly from a Single Tissue Section Emmanuelle Claude, Mark Towers, and Kieran Neeson Waters Corporation, Manchester,
Application of a new capillary HPLC- ICP-MS interface to the identification of selenium-containing proteins in selenized yeast
 Application of a new capillary HPLC- ICP-MS interface to the identification of selenium-containing proteins in selenized yeast Application note Food supplements Authors Juliusz Bianga and Joanna Szpunar
SelexION Technology for Lipid Analysis: Pushing the Boundaries of Lipidomics
 ANSWERS FOR SCIENCE. KNOWLEDGE FOR LIFE. SelexION Technology for Lipid Analysis: Pushing the Boundaries of Lipidomics Baljit Ubhi, Ph.D ASMS Baltimore, June 2014 Lipidomics Profiling Needs and Deliverables
Agilent Solutions for Lipidomics. Greater Insight into
 Agilent Solutions for Lipidomics Greater Insight into Lipid Metabolism Understanding Lipidomics What is Lipidomics? The term "lipidome" refers to all the lipids that exist in an organism and their effects
Impact of Chromatography on Lipid Profiling of Liver Tissue Extracts
 Impact of Chromatography on Lipid Profiling of Liver Tissue Extracts Application Note Clinical Research Authors Mark Sartain and Theodore Sana Agilent Technologies, Inc. Santa Clara, California, USA Introduction
Double charge of 33kD peak A1 A2 B1 B2 M2+ M/z. ABRF Proteomics Research Group - Qualitative Proteomics Study Identifier Number 14146
 Abstract The 2008 ABRF Proteomics Research Group Study offers participants the chance to participate in an anonymous study to identify qualitative differences between two protein preparations. We used
Mass Spectrometry Infrastructure
 Mass Spectrometry Infrastructure Todd Williams, Ph.D. Director KU Mass Spectrometry and Analytical Proteomics Laboratory Mass Spectrometry Lab B025 Malott Hall Mission The Mass Spectrometry and analytical
Applying a Novel Glycan Tagging Reagent, RapiFluor-MS, and an Integrated UPLC-FLR/QTof MS System for Low Abundant N-Glycan Analysis
 Applying a Novel Glycan Tagging Reagent, RapiFluor-MS, and an Integrated UPLC-FLR/QTof MS System for Low Abundant N-Glycan Analysis Ying Qing Yu Waters Corporation, Milford, MA, USA APPLICATION BENEFITS
Protein Analysis using Electrospray Ionization Mass Spectroscopy *
 OpenStax-CNX module: m38341 1 Protein Analysis using Electrospray Ionization Mass Spectroscopy * Wilhelm Kienast Andrew R. Barron This work is produced by OpenStax-CNX and licensed under the Creative Commons
More structural information with MS n
 PRODUCT SPECIFICATIONS The LTQ XL linear ion trap mass spectrometer More structural information with MS n The LTQ XL linear ion trap mass spectrometer delivers more structural information faster and with
Increased Identification Coverage and Throughput for Complex Lipidomes
 Increased Identification Coverage and Throughput for Complex Lipidomes Reiko Kiyonami, David Peake, Yingying Huang, Thermo Fisher Scientific, San Jose, CA USA Application Note 607 Key Words Q Exactive
Improve Protein Analysis with the New, Mass Spectrometry- Compatible ProteasMAX Surfactant
 Improve Protein Analysis with the New, Mass Spectrometry- Compatible Surfactant ABSTRACT Incomplete solubilization and digestion and poor peptide recovery are frequent limitations in protein sample preparation
MALDI Imaging Drug Imaging Detlev Suckau Head of R&D MALDI Bruker Daltonik GmbH. December 19,
 MALDI Imaging Drug Imaging Detlev Suckau Head of R&D MALDI Bruker Daltonik GmbH December 19, 2014 1 The principle of MALDI imaging Spatially resolved mass spectra are recorded Each mass signal represents
New Instruments and Services
 New Instruments and Services http://planetorbitrap.com/orbitrap fusion Combining the best of quadrupole, Orbitrap, and ion trap mass analysis in a revolutionary Tribrid architecture, the Orbitrap Fusion
Lipid Mass Spectrometry: Core Technologic Research and Development I.) INTRODUCTION TO MASS SPECTROMETRY OF COMPLEX LIPIDS 4
 INTRODUCTION TO MASS SPECTROMETRY OF COMPLEX LIPIDS 4") Lipid Mass Spectrometry: Core Technologic Research and Development PAGE I.) INTRODUCTION TO MASS SPECTROMETRY OF COMPLEX LIPIDS 4 II.) MASS SPECTROMETRY OF GLYCEROLIPIDS.. 8 A.) Neutral Acylglycerols and
Lipid Mass Spectrometry: Core Technologic Research and Development PAGE I.) INTRODUCTION TO MASS SPECTROMETRY OF COMPLEX LIPIDS 4 II.) MASS SPECTROMETRY OF GLYCEROLIPIDS.. 8 A.) Neutral Acylglycerols and
Automating Mass Spectrometry-Based Quantitative Glycomics using Tandem Mass Tag (TMT) Reagents with SimGlycan
 Reagents with SimGlycan") PREMIER Biosoft Automating Mass Spectrometry-Based Quantitative Glycomics using Tandem Mass Tag (TMT) Reagents with SimGlycan Ne uaca2-3galb1-4glc NAcb1 6 Gal NAca -Thr 3 Ne uaca2-3galb1 Ningombam Sanjib
PREMIER Biosoft Automating Mass Spectrometry-Based Quantitative Glycomics using Tandem Mass Tag (TMT) Reagents with SimGlycan Ne uaca2-3galb1-4glc NAcb1 6 Gal NAca -Thr 3 Ne uaca2-3galb1 Ningombam Sanjib
Relative Quantitation of Human Polymorphonuclear Leukocyte Cell Membrane GPEtn Lipids
 Relative Quantitation of Human Polymorphonuclear Leukocyte Cell Membrane GPEtn Lipids Using the QTRAP System with mtraq Reagents Karin A. Zemski-Berry 1, John M. Hevko 2, and Robert C. Murphy 1 1 Department
1. Methodology of lipidomics: Tandem mass spectrometry of ether phospholipids
 Transworld Research Network 37/661 (2), Fort P.O. Trivandrum-695 023 Kerala, India Lipidomics: Sea Food, Marine Based Dietary Supplement, Fruit and Seed, 2012: 1-19 ISBN: 978-81-7895-573-5 Editor: 1. Methodology
Non targeted Lipidomic Analysis by Direct Infusion Mass Spectrometry. Jianzhong Chen, PhD Assistant Professor School of Optometry UAB
 Non targeted Lipidomic Analysis by Direct Infusion Mass Spectrometry Jianzhong Chen, PhD Assistant Professor School of Optometry UAB 1 Lipidome: A subset of Metabolome https://en.wikipedia.org/wiki/lipidomics
Annotation of potential isobaric and isomeric lipid species measured with the AbsoluteIDQ p180 Kit (and p150 Kit)
") We provide the Phenotype to the Genotype! DocNr. 35017 V 2 2017-02 Annotation of potential isobaric and isomeric lipid species measured with the (and p150 Kit) Introduction Lipidomics, a branch of metabolomics
We provide the Phenotype to the Genotype! DocNr. 35017 V 2 2017-02 Annotation of potential isobaric and isomeric lipid species measured with the (and p150 Kit) Introduction Lipidomics, a branch of metabolomics
Lipid Class Separation Using UPC 2 /MS
 Michael D. Jones, 1,3 Giorgis Isaac, 1 Giuseppe Astarita, 1 Andrew Aubin, 1 John Shockcor, 1 Vladimir Shulaev, 2 Cristina Legido-Quigley, 3 and Norman Smith 3 1 Waters Corporation, Milford, MA, USA 2 Department
Measuring Lipid Composition LC-MS/MS
 Project: Measuring Lipid Composition LC-MS/MS Verification of expected lipid composition in nanomedical controlled release systems by liquid chromatography tandem mass spectrometry AUTHORED BY: DATE: Sven
(III) MALDI instrumentation
 MALDI instrumentation") Dr. Sanjeeva Srivastava (I) Basics of MALDI-TF (II) Sample preparation In-gel digestion Zip-tip sample clean-up Matrix and sample plating (III) MALDI instrumentation 2 1 (I) Basics of MALDI-TF Analyte
Dr. Sanjeeva Srivastava (I) Basics of MALDI-TF (II) Sample preparation In-gel digestion Zip-tip sample clean-up Matrix and sample plating (III) MALDI instrumentation 2 1 (I) Basics of MALDI-TF Analyte
Agilent Protein In-Gel Tryptic Digestion Kit
 Agilent 5188-2749 Protein In-Gel Tryptic Digestion Kit Agilent Protein In-Gel Tryptic Digestion Kit Instructions Kit Contents The Protein In-Gel Tryptic Digestion Kit includes sufficient reagents for approximately
SWATH Acquisition Enables the Ultra-Fast and Accurate Determination of Novel Synthetic Opioids
 SWATH Acquisition Enables the Ultra-Fast and Accurate Determination of Novel Synthetic Opioids Data Independent Acquisition on TripleTOF and X-Series QTOF Systems for Seized Drug Analysis Oscar G. Cabrices
High-throughput lipidomic analysis of fatty acid derived eicosanoids and N-acylethanolamines
 High-throughput lipidomic analysis of fatty acid derived eicosanoids and N-acylethanolamines Darren S. Dumlao, Matthew W. Buczynski, Paul C. Norris, Richard Harkewicz and Edward A. Dennis. Biochimica et
LECTURE-15. itraq Clinical Applications HANDOUT. Isobaric Tagging for Relative and Absolute quantitation (itraq) is a quantitative MS
 is a quantitative MS") LECTURE-15 itraq Clinical Applications HANDOUT PREAMBLE Isobaric Tagging for Relative and Absolute quantitation (itraq) is a quantitative MS based method for quantifying proteins subject to various different
LECTURE-15 itraq Clinical Applications HANDOUT PREAMBLE Isobaric Tagging for Relative and Absolute quantitation (itraq) is a quantitative MS based method for quantifying proteins subject to various different
Ion fragmentation of small molecules in mass spectrometry
 Ion fragmentation of small molecules in mass spectrometry Jeevan Prasain jprasain@uab.edu 6-2612 Nomenclature: the main names and acronyms used in mass spectrometry Molecular ion: Ion formed by addition
LC/MS Method for Comprehensive Analysis of Plasma Lipids
 Application Note omics LC/MS Method for Comprehensive Analysis of Plasma s Authors Tomas Cajka and Oliver Fiehn West Coast Metabolomics Center, University of California Davis, 451 Health Sciences Drive,
Methods in Mass Spectrometry. Dr. Noam Tal Laboratory of Mass Spectrometry School of Chemistry, Tel Aviv University
 Methods in Mass Spectrometry Dr. Noam Tal Laboratory of Mass Spectrometry School of Chemistry, Tel Aviv University Sample Engineering Chemistry Biology Life Science Medicine Industry IDF / Police Sample
Supplementary Figure 1 (previous page). EM analysis of full-length GCGR. (a) Exemplary tilt pair images of the GCGR mab23 complex acquired for Random
. EM analysis of full-length GCGR. (a) Exemplary tilt pair images of the GCGR mab23 complex acquired for Random") S1 Supplementary Figure 1 (previous page). EM analysis of full-length GCGR. (a) Exemplary tilt pair images of the GCGR mab23 complex acquired for Random Conical Tilt (RCT) reconstruction (left: -50,right:
S1 Supplementary Figure 1 (previous page). EM analysis of full-length GCGR. (a) Exemplary tilt pair images of the GCGR mab23 complex acquired for Random Conical Tilt (RCT) reconstruction (left: -50,right:
SUPPLEMENTARY DATA. Materials and Methods
 SUPPLEMENTARY DATA Materials and Methods HPLC-UV of phospholipid classes and HETE isomer determination. Fractionation of platelet lipid classes was undertaken on a Spherisorb S5W 150 x 4.6 mm column (Waters
AbsoluteIDQ p150 Kit. Targeted Metabolite Identifi cation and Quantifi cation. Bringing our targeted metabolomics expertise to your lab.
 AbsoluteIDQ p150 Kit Targeted Metabolite Identifi cation and Quantifi cation Bringing our targeted metabolomics expertise to your lab. The Biocrates AbsoluteIDQ p150 mass spectrometry Assay Preparation
Mass Spectrometry and Proteomics Xudong Yao
 Mass Spectrometry and Proteomics Xudong Yao Dept of Chemistry University of Connecticut Storrs, CT April 19, 2005 Proteomics and -omics Roles of mass spectrometry Comparative proteomics Gel or non-gel
Quadrupole and Ion Trap Mass Analysers and an introduction to Resolution
 Quadrupole and Ion Trap Mass Analysers and an introduction to Resolution A simple definition of a Mass Spectrometer A Mass Spectrometer is an analytical instrument that can separate charged molecules according