Nour Wattar. A thesis submitted in partial fulfillment of the requirements for the degree of. Master of Science. Nutrition and Metabolism
|
|
|
- Anthony Lewis Jordan
- 5 years ago
- Views:
Transcription
1 Maternal Essential Fatty Acid Status During Pregnancy and Postpartum in the Alberta Pregnancy Outcomes and Nutrition (APrON) Study and Infant Outcomes by Nour Wattar A thesis submitted in partial fulfillment of the requirements for the degree of Master of Science in Nutrition and Metabolism Department of Agriculture Food and Nutritional Sciences University of Alberta Nour Wattar, 2017
2 Abstract Docosahexaenoic (DHA) and arachidonic (AA) acids are essential fatty acids found in breast milk and are important for the infant s brain development and cognitive functions such as those that regulate sleep and crying. The overall goal of this research was to use a large maternal infant cohort, Alberta Pregnancy Outcomes and Nutrition (APrON), to establish the relationship between maternal intake and status of DHA and AA across pregnancy and at three months postpartum, their levels in breast milk and infant sleep and crying outcomes. The cohort participants were mainly older women with a healthy BMI and high socioeconomic status. Dietary intake of DHA and AA was estimated using 24-hr recalls collected at each trimester and at three months postpartum. Food Processor (version 10.6; ESHA Research, Salem, Ore., USA) output was used to estimate AA (n=129, n=564, n=497, n=485 at the four time points, respectively) and a previously established nutrient n-3 database for DHA. DHA from supplement intake was estimated using Supplement Intake Questionnaire (SIQ) and the total DHA intake form diet and supplement was included in the analysis at each time point (n=239, n=998, n=882, n=827, respectively). Maternal blood samples were collected at the same four time points, and the relative percent and concentration of fatty acids in serum PL were assessed by gas liquid chromatography (GLC) (n=280, n=1059, n=713, n=907, respectively). Breast milk samples (n=1038) were obtained at the third month of lactation, and the relative fatty acid composition of DHA and AA was determined using GLC. Brief Infant Sleep Questionnaire (n=785) and Crying Patterns Questionnaire data (n=839) were used to assess the reported durations of infant sleep and crying, and whether parents considered them to be problematic. Statistical analyses were completed using SPSS Version 23.0 (IBM Corporation, Armonk, NY, USA). While AA intake did not change during pregnancy or lactation, DHA intake increased from the second to the third ii
3 trimester (p=0.01), and the median DHA intake estimate for the cohort did not meet the European Consensus recommendation of 200 mg/day at any time point in the study. The serum concentrations of both DHA and AA increased during pregnancy and decreased postpartum and the relative proportion of DHA followed the same pattern (p<0.001 for all). Postpartum, DHA concentration in serum PL was 35±20 µg/ml (2.0±0.9%) and AA at 136±56 µg/ml (7.9±2.1%). The DHA proportion of fatty acids in breast milk (median: 0.2%, IQR: %) was found to be lower than the reported global average, while AA (median: 0.8%, IQR: %) was found to be higher. Breast milk content of DHA was significantly correlated to postpartum DHA concentration in the serum and estimated DHA intake (p<0.001 for all). The proportion of AA in breast milk was found to directly relate to serum concentration (p<0.001) but not dietary intake. Using the data in this study, to achieve a breast milk concentration ( %), women need to consume DHA of mg/day or maintain a maternal PL DHA status of at least 45 µg/ml or 2.7% (w/w) of total serum PL fatty acids. No relationships were found between DHA or AA in breast milk and parental reported infant sleep or crying behaviour. In summary, approximately 75% of women in the APrON cohort were not meeting current dietary recommendations for DHA. The mean concentration of DHA in breast milk at three months postpartum was below the level considered optimal. Using this cohort, we have identified dietary intake recommendations and a maternal status reference that could be useful as a target for dietary interventions to optimize the concentration of DHA in breast milk. iii
4 Preface This thesis is an original work by Nour Wattar. The research project, of which this thesis is a part, received research ethics approval from the University of Alberta Research Ethics Board, Alberta Pregnancy Outcome and Nutrition (APrON), No , April 3, iv
5 Dedication This thesis is dedicated to my beloved parents, husband, children and siblings. To my parents, Khaled and Layla, who have been a source of inspiration to me throughout my life and who have taught me to realize my potential and work hard to achieve my goals. To my dear husband, Ghaith, who has been a constant source of support and encouragement, especially during the months of writing my thesis. To my sweet sons, Amir and Jude, who have been a source of joy in my life and continuously put a smile on my face and teach me new skills. To my dear siblings, Dania, Anas, Aya and Nouha, who have always been there for me. I cannot thank you all enough! v
6 Acknowledgements I would like to express my sincere thanks to my supervisor, Dr. Catherine Field from the Faculty of Agricultural, Life and Environmental Sciences in the Department of Agricultural, Food and Nutritional Science at the University of Alberta, who guided me in the development of my research project, ensured that I had a thorough understanding of the relevant knowledge, challenged me to consider different perspectives, guided me to reach my goals and provided me with the opportunity to present parts of my research. She was always there for me providing timely feedback and encouragement, as well as sharing her immense knowledge in nutrition. Besides my supervisor, I would like to thank my other committee members, Dr. Rhonda Bell, from the Faculty of Agricultural, Life and Environmental Sciences in the Department of Agricultural, Food and Nutritional Science at the University of Alberta, and Dr. Gerald Giesbrecht from the Departments of Paediatrics and Community Health Sciences at the University of Calgary, for their great support, feedback and expertise. Many thanks to Dr. Peyman Pakseresht from the Department of Agricultural, Food and Nutritional Science, University of Alberta, for helping me with the statistical analysis of this thesis. Finally, I would like to thank APrON participants, the APrON study team and the funding organizations for the APrON study: Canadian Institutes of Health Research (CIHR) and Alberta Innovate Health Solutions (AIHS). vi
7 Table of Contents Chapter 1: Introduction and Literature Review Introduction Fatty acids general background Dietary polyunsaturated fatty acids Conversion of ALA and LA to their longer chain derivatives Factors that affect the fatty acid conversion degree Significance of long chain polyunsaturated fatty acids Significance of n-3 and n-6 LCPUFA during pregnancy and lactation Fetal and neonatal DHA and AA status Fatty acid intake recommendations Intake requirements for infants a) LCPUFA in breast milk b) LCPUFA in infant formula c) Optimal breast milk content of DHA and AA Measures of infant outcomes: sleep and crying at three months of age Critical review of the literature: maternal status of DHA and AA during pregnancy and postpartum Changes of maternal status of DHA and AA during pregnancy Change of maternal status of DHA and AA in maternal serum PL from pregnancy to 6 months postpartum Relationship between dietary intake of DHA and AA and essential maternal fatty acid status Summary, limitations and gaps in the literature Chapter 2: Research Plan Rationale Research objectives Lay out of thesis Chapter 3: Methods Subjects and study design Dietary intake data Collection of intake data Estimating dietary intake data Validation of the two dietary recall methods (Dietary Method Validation Study). 46 vii
8 3.2.4 Estimating of meeting the recommendation of dietary intake Biological samples used for fatty acid analyses Maternal blood Breast milk Infant sleep and crying information Collection of potential covariates Statistical analysis Chapter 4: Results Characteristics of study population Dietary intake of fatty acids Dietary Method Validation Study: validation of estimating n-3 LCPUFA intake from the diet using interview and online recall methods in 58 non-pregnant women Maternal dietary intake of n-3 LCPUFA intake during pregnancy and at three months postpartum Change in maternal essential fatty acid status during pregnancy and postpartum Relationship of maternal diet and status of DHA and AA at three months postpartum Breast milk fatty acid pattern at the third month of lactation Relationship of breast milk composition and three-month postpartum maternal intake and status of DHA and AA Infant sleep and crying Relationship of breast milk content DHA and AA postpartum and infant sleep at three months of age Relationship of breast milk content DHA and AA postpartum and parent-reported duration of infant sleep at three months of age Relationship of breast milk content DHA and AA postpartum and whether parents reported their infants sleep to be a problem Relationship of breast milk content DHA and AA postpartum and parent-reported duration of infant cry at three months of age Relationship of breast milk content DHA and AA postpartum and whether parents reported their infants cry to be a problem Relationship of breast milk content DHA and AA postpartum and the reported number of weekly periods of infant persistent cry Chapter 5: Summary and Discussion Summary Discussion Research objectives and main findings viii
9 5.2.2 Maternal dietary intake and serum phospholipid status of AA and DHA across pregnancy and at three months postpartum Optimizing breast milk composition of DHA and AA and infant outcomes Strengths and limitations Future direction References Appendices Appendix I: Standard Operating Procedures (SOP) for calculating and cleaning of APrON maternal serum phospholipid fatty acids Summary of laboratory analysis Data source Data cleaning Notes Appendix II: Supplementary data Appendix III: Selected sleep and crying questionnaire ix
10 List of Tables Table 1.1 N-3 LCPUFA content per 1 serving (75 g) of common foods, sorted by fat content Table 1.2 N-6 LCPUFA (AA) content of selected foods Table 1.3 Adequate Intake values for LA and ALA (g/day) Table 1.4 AMDR for fat by age as a percent of energy Table 1.5 Evidence form observational longitudinal study on the change of maternal serum PL status of DHA and AA during pregnancy and from pregnancy to postpartum Table 3.1 The number of available responses for n-3 intake from the diet, supplement and total dietary intake across pregnancy and at three months postpartum based on dietary recall method Table 3.2 Target total gestational weight gain by pre-pregnancy BMI category Table 4.1 Maternal characteristics of all APrON participants Table 4.2 Characteristics of APrON infants used in the analysis Table 4.3 Intake of n-3 LCPUFA as estimated by online and interview 24-hr recalls (n=58) Table 4.4 Estimated daily dietary intakes of energy, macronutrients and n-3 LCPUFA during 3 trimesters of pregnancy and at three months postpartum in the APrON study Table 4.5 The number of APrON participants with DHA intake below 200 mg Table 4.6 The number of APrON participants with supplement intake of at least 100 mg/day Table 4.7 Maternal serum PL fatty acid profile (in absolute concentrations and relative percentages) at each trimester and at three months postpartum Table 4.8 Breast milk fatty acid composition (as a relative wt/wt proportions) at the third month of lactation of a subset of APrON participants (n=1038), separated by method of feeding Table 4.9 The correlation between DHA and AA in breast milk, with intake and status of DHA and AA postpartum x
11 Table 4.10 The sleep arrangements and reported durations of infant sleep and crying as a day and night total in 24 hours at three months of age and whether parents consider them problems Table A.1 Estimated daily intake of EPA, DPA, DHA and total long chain n-3 fatty acids, during pregnancy and at three months postpartum based on dietary recall method in the APrON cohort Table A.2 Breast milk fatty acid composition (as a relative wt/wt proportions) at the third month of lactation in a subset of APrON participants (n=1038) Table A.3 Univariate analysis of postpartum dietary intake of AA and the maternal status of AA in A) serum concentration and B) serum proportion Table A.4 Univariate analysis of postpartum dietary intake of DHA (up to 1000 mg/day) and the maternal status of DHA in A) serum concentration and B) serum proportion Table A.5 Univariate analysis of postpartum dietary intake of DHA (up to 2000 mg/day) and DHA in breast milk Table A.6 Univariate analysis of DHA in breast milk and the maternal status of DHA in A) serum concentration and B) serum proportion Table A.7 Univariate regression analysis of parent-reported total daily duration of infant sleep with each of A) DHA B) AA and C) AA:DHA in breast milk in exclusively breast-fed infants Table A.8 Step-wise multiple regression analysis of parent-reported total daily duration of infant sleep with A) DHA B) AA and C) AA:DHA in breast milk in exclusively breast-fed infants Table A.9 Univariate regression analysis of parent-reported total daily duration of infant crying with each of A) DHA B) AA and C) AA:DHA in breast milk in exclusively breast-fed infants Table A.10 Step-wise multiple regression analysis of parent-reported total daily duration of infant crying with each of A) DHA B) AA and C) AA:DHA in breast milk in exclusively breastfed infants xi
12 Table A.11 Binary logistic regression analysis of parent-reported total periods of infant persistent crying with each of AA in breast milk in exclusively breast-fed infants xii
13 List of Figures Figure 1.1 N-6 and n-3 fatty acid desaturation and elongation (adapted from Nakamura and Nara, 2004) Figure 1.2 Structure of DHA Figure 1.3 Structure of AA Figure 3.1 Study participants enrolled in APrON cohort with available data and included in the analysis at each time point Figure 4.1 Bland-Altman plots to examine agreement and bias between interview and online 24- hr recall methods for A) unadjusted total n-3, B) energy-adjusted total n-3 and C) fat-adjusted total n-3 LCPUFA intake Figure 4.2 Scatterplot and regression analysis between interview and online recall methods for A) unadjusted total n-3, B) energy-adjusted total n-3 and C) fat-adjusted total n-3 LCPUFA intake Figure 4.3 Percentage of participants consistently grouped into same tertiles of total n-3, energyadjusted n-3 and fat-adjusted n-3 intake from the diet between interview and online dietary recall methods Figure 4.4 Bland-Altman plots to examine agreement and bias between interview and online 24- hr recall methods for DHA, energy-adjusted DHA and fat-adjusted DHA Figure 4.5 Scatterplot and regression analysis between interview and online recall methods for A) unadjusted DHA, B) energy-adjusted DHA and C) fat-adjusted DHA intake Figure 4.6 Percentage of participants consistently grouped into same tertiles of DHA, energyadjusted DHA and fat-adjusted DHA intake from the diet between interview and online dietary recall methods xiii
14 Figure 4.7 Proportion of APrON participants not meeting the 200 mg recommendation during pregnancy and postpartum Figure 4.8 Change in median concentration of DHA and AA in maternal serum PL during 3 trimesters of pregnancy and at three months postpartum Figure 4.9 Change in median proportion of maternal serum PL DHA and AA during 3 trimesters of pregnancy and at three months postpartum in the APrON study Figure 4.10 The relationship between postpartum A) absolute concentration and B) relative proportions of maternal serum PL and dietary intake of DHA in the APrON study Figure 4.11 Pie graph of breast milk fatty acid composition (n=1038) Figure 4.12 Scatter plot and regression analysis of DHA in breast milk and dietary intake of DHA (up to 2000 mg/day) Figure 4.13 Scatter plot and regression analysis of DHA in breast milk and maternal status of DHA as a: A) concentration (μg/ml) and B) as a proportion (wt/wt%) xiv
15 List of Abbreviations µg/ml AA AI ALA AMDR APrON CI CNF DHA DPA DRI EFSA EPA EPDS EU FAO FFQ g hr IOM IQR ISSFAL Microgram per milliliter Arachidonic acid Adequate Intake a-linolenic acid Acceptable Macronutrient Distribution Ranges Alberta Pregnancy Outcomes and Nutrition Confidence Interval Canadian Nutrient File Docosahexaenoic acid Docosapentaenoic acid Dietary Reference Intake European Food Safety Authority Eicosapentaenoic acid Edinburgh Postnatal Depression Scale European Union Food and Agriculture Organization of the United Nations Food Frequency Questionnaire Gram Hour Institute of Medicine Inter Quartile Range International Society for the Study of Fatty Acids and Lipids xv
16 kcal kg LA LCPUFA mg min mo MUFA PE PI PL PS PUFA SFA SIQ SOP USDA WHO wk w/w ω Kilocalorie Kilogram Linoleic acid Long chain polyunsaturated fatty acid Milligram Minute Month Monounsaturated fatty acid Phosphatidylethanolamine Phosphatidylinositol Phospholipid Phosphatidylserine Polyunsaturated fatty acid Saturated fatty acid Supplement Intake Questionnaire Standard Operating Procedure The United States Department of Agriculture World Health Organization Week weight per weight Omega xvi
17 Chapter 1: Introduction and Literature Review 1.1 Introduction Fatty acids general background Fatty acids are hydrocarbon chains that contain methyl (CH3-) and a carboxyl (- COOH) groups. They differ in the lengths of chain and the number of double bonds (degree of unsaturation), and are accordingly classified to saturated (SFA), monounsaturated (MUFA), polyunsaturated (PUFA) and trans fatty acids (Institute of Medicine, 2005). Based on the last double bond relative to the terminal methyl group, unsaturated fatty acids are classified as n-3 (ω-3) and n-6 (ω-6). Fatty acids that have more than 18 carbons are considered long chain fatty acids Dietary polyunsaturated fatty acids In the diet, n-3 PUFA include α-linolenic acid (ALA, C18:3n3), eicosapentaenoic acid (EPA, C20:5n3), docosapentaenoic acid (DPA, C22:5n3) and docosahexaenoic acid (DHA, C22:6n3), while dietary n-6 PUFA include linoleic acid (LA, C18:2n6) and arachidonic acid (AA, C20:4n6). Of these, EPA, DPA, DHA and AA are long chain polyunsaturated fatty acids (LCPUFA). ALA is found in flaxseeds, walnuts and soybeans, and LA is mainly in vegetable oils, nuts and seeds (Canadian Nutrient File, 2015). Pre-formed EPA, DPA and DHA are mainly found in fatty fish (Table 1.1), while AA is found in fish, meat, poultry and eggs (Table 1.2). 1
18 Table 1.1 N-3 LCPUFA content per 1 serving (75 g) of common foods, sorted by fat content Food (Cooked) Total fat (g) EPA (mg) DPA (mg) DHA (mg) Halibut, Greenland (Turbot) Salmon, Atlantic, farmed Omega-3 enriched eggs Eggs Chicken, dark meat Rainbow trout, farmed Jack mackerel, canned Rainbow trout, wild Arctic char Coho salmon, wild Chicken, breast Tilapia Flatfish (e.g. sole) Shrimp Pollock (Boston bluefish) Light tuna, canned Adapted from Health Canada, 2009 and updated from the Canadian Nutrient File, 2015 Abbreviations: DHA, docosahexaenoic acid; DPA, docosapentaenoic acid; EPA, eicosapentaenoic acid Table 1.2 N-6 LCPUFA (AA) content of selected foods Food (cooked) Portion AA (mg) Salmon, Atlantic, farmed 75g 952 Sockeye salmon (canned) 75g 280 Egg, yolk 2 egg yolks 173 Mackerel 55g 142 Herring, pacific 75g 90 Chicken, leg 75g 90 Veal, rib 75g 82 Pepperoni 55g 62 Beef, ground 75g 36 Beef, tenderloin 75g 22 Cheese, cream 30g 15 Source: Canadian Nutrient File, Conversion of ALA and LA to their longer chain derivatives Humans cannot perform de novo n-3 and n-6 fatty acid synthesis, but they can desaturate and elongate fatty acids by a series of enzymatic reactions. LA and ALA are considered dietary essential and must be provided in the diet, and these can be used to 2
19 form AA and DHA, respectively, in the liver (reviewed by Innis, 2003; Nakamura & Nara, 2004). Figure 1.3 shows simplified n-6 and n-3 fatty acid metabolic pathways. The formation of DHA from ALA is limited to 1-5%, whereas the conversion of LA to AA is approximately % (Emkrn et al., 1994; Pawlosky et al., 2001). The biosynthesis of n-3 and n-6 LCPUFA from C18 precursors is variable in healthy individuals and depends on multiple factors that will be discussed next. Figure 1.3 N-6 and n-3 fatty acid desaturation and elongation (adapted from Nakamura & Nara, 2004) 18:2n6 (LA) 18:3n6 20:3n6 20:4n6 (AA) 6 Desaturase Elongase 5 Desaturase Elongase 6 Desaturase 18:3n3 (ALA) 18:4n3 20:4n3 20:5n3 (EPA) 24:5n3 24:6n3 β-oxidation 22:6n3 (DHA) Figure 1.3 N-6 and n-3 fatty acid simplified desaturation and elongation pathways. Abbreviations: AA, arachidonic acid; ALA, α-linolenic acid; DHA, docosahexaenoic acid; DPA, docosapentaenoic acid; EPA, eicosapentaenoic acid; LA, linoleic acid 3
20 1.1.4 Factors that affect the fatty acid conversion degree Endogenous metabolism and dietary intake determine LCPUFA levels in the serum. FADS1 and FADS2 genes encode the Δ6 and Δ5 desaturase enzymes, respectively, hence the genetic varation affects PUFA metabolism (Steer et al., 2013). The rate of n-3 conversion in adult females is reported to by approximately two fold that of males of similar age (Pawlosky et al., 2003). The sex difference in the conversion rate has not been studied in infants. Yet, intervention studies in preterm and term infants reported differences between girls and boys in their responses to supplementation of infant formula with LCPUFA, as measured by anthropometrics and cognitive tests. However, the results have been inconsistent (reviewed by Decsi & Kennedy, 2011). DHA synthesis is 3 times greater in women using 17a-ethynyloestradiol oral contraceptive pills and women on hormonal replacement therapy than those not using them, which strongly supports an upregulation of the conversion pathway by estrogen activity, and a higher conversion rate in pregnancy (reviewed by Williams & Burdge, 2006). Because endogenous synthesis of DHA and AA use the same Δ6 and Δ5 desaturase enzymes, competition between ALA and LA can result (reviewed by Innis, 2003). Increased dietary intakes of EPA or DHA can result in decreased tissue AA due to competition for incorporation into PL, hence when phospholipase is stimulated there is a change in the supply of LCPUFA and this results in a decreased formation of AA derived eicosanoids while increasing n-3 fatty acid derived eicosanoids (reviewed by Innis, 2003). When the long chains are not consumed, the balance of LA and ALA determines 4
21 the amounts of AA, EPA and DHA in tissue lipids, and therefore the dietary adequacy of LA:ALA ratio is important Significance of long chain polyunsaturated fatty acids Long chain polyunsaturated fatty acids are structural components of cellular membranes and are the precursors of eicosanoids that regulate many organ functions. They are also rich in the brain, retina and other neural tissues, and they are critical for normal growth and development. Neural development and maturation of sensory systems are among their most significant effects (reviewed by Uauy et al., 2000). AA and DHA are among these important LCPUFA (Figure 1.1 and 1.2). Figure 1.1 Structure of DHA (adapted from: Figure 1.2 Structure of AA (adapted from: Significance of n-3 and n-6 LCPUFA during pregnancy and lactation The brain requires DHA and AA for growth and function. AA and DHA are major structural components of neural membranes and account for approximately 25% of total fatty acids in the brain, mainly as phospholipids (reviewed by Hadley et al., 2016). The 5
22 phospholipids of brain gray matter contain high amounts of AA in phosphatidylinositol (PI) and high proportions of DHA in phosphatidylethanolamine (PE) and phosphatidylserine (PS). In the outer segments of the retina rods and cones, DHA constitutes 80% of PUFA, 50% of the fatty acids in PE and PS, membranes specialized for rapid light transmission. It also has roles in neurotransmitter metabolism, ion channel activity, signalling pathways, gene expression and immune function markers (reviewed by Innis, 2003). In maternal serum phospholipids (PL), DHA was mainly found in phosphatidylcholine (reviewed by Gil-Sanchez et al., 2012). AA is the n-6 fatty acid in highest concentration in membranes PL throughout the body, mainly in PI. It also has a critical role in synaptic transition, signalling, neuronal firing, gene expression and is important for normal growth. It is the precursor to certain eicosanoids (such as prostaglandins, thromboxanes, leukotrienes and lipoxin) that play roles in immunity through promoting maturation (Richard et al., 2016), the regulation of the inflammatory response (mediating and regulation of inflammation), vasodilation, platelet aggregation and hemodynamics (reviewed by Hadley et al., 2016). It also plays a critical role in the hormonal regulation of normal bone formation and whole body mineral metabolism during growth (reviewed by Hadley et al., 2016). The needs for some nutrients such as folate increase during pregnancy and lactation (IOM, 1998), and the supply of essential fatty acids to the fetus/infant are among the nutrients that are sensitive to maternal nutrition. AA and DHA are required for optimal development of the brain and retina during pregnancy and early in life as they are the major LCPUFA found in the developing nervous system. During the third trimester of 6
23 pregnancy and the first two years of life, the brain rapidly grows. These two fatty acids were found to be lower in the serum, erythrocyte membrane and the brains of infants fed formula without preformed AA and DHA, compared with breastfed infants (reviewed by Heird & Lapillonne, 2005). This supports the need for a dietary source of DHA and AA by the infant. There is increasing evidence that suggests other benefits of n-3 LCPUFA. Recent studies described benefits to n-3 supplementation during pregnancy for the infants and their mothers. A systematic review by Imhoff-Kunsch et al. (2012) found that n-3 LCPUFA supplementation during pregnancy resulted in a modest increase in birth weight and no significant differences in birth length or head circumference. They also found a lower risk of early preterm delivery and a suggested decreased risk of preterm delivery and low birth weight. Another systematic review sand meta-analysis summarized that the evidence does not conclusively support or refute that n-3 LCPUFA supplementation in pregnancy improves cognitive or visual development (Gould et al., 2013). Moreover, epidemiological studies found protective associations from maternal fish intake during pregnancy on atopic or allergic outcomes in infants/children (reviewed by Calder et al., 2010). Studies support the dietary essentiality of DHA for the development of the immune system, but more research is needed to rule out the essentiality of AA in the diet. As demonstrated in intervention studies, infants fed formula supplemented with AA and DHA experienced improvement in many markers of immune function in comparison with unsupplemented formula, which results in beneficial health outcomes such as the risk reduction of developing allergic and atopic disease early in life (reviewed by Richard et al., 2016). 7
24 Other health outcomes have been suggested to maternal supplementation with DHA such as association with lower incidence of respiratory symptoms in children with a history of maternal atopy (Escamilla-Nuñez et al., 2014) and reducing inflammation in obese pregnant women (Haghiac et al., 2015). Interestingly, women who experience slower normalization of functional DHA status after pregnancy have an increased risk of having depressive symptoms postpartum (Otto et al., 2003). Additionally, Jochems et al., 2015 reported a negative association between maternal EPA in early pregnancy and children s fasting glucose at age 7. Randomized trials have reported no adverse effects of daily consumption of up to 2.7 g/day n-3 LC-PUFA or 1 g/day DHA during pregnancy and lactation (consensus statement by Koletzko et al., 2007). However, a high intake of DHA (0.96%) with lower intake of AA (0.64%) early in life was found to significantly reduce AA in brain regions in non-human primates (Hsieh et al., 2007) Fetal and neonatal DHA and AA status All the n-3 and n-6 fatty acids accrued by the fetus before birth originates from the maternal circulation and is available to the fetus through placental transfer (reviewed by Innis, 2003). The placenta selectively transports LCPUFA to the fetus, as in vitro experiments showed transfer preference in the order DHA > AA > ALA > LA. Human in vivo experiments using labelled fatty acids had similar results (reviewed by Hanebutt et al., 2008). The placenta has limited capacity to synthesize LCPUFA from their respective precursors (Crawford, 2000). Numerous studies identified significantly higher AA and DHA concentrations in fetal than in maternal circulation, confirming biomagnification by 8
25 the placenta (reviewed by Gil-Sanchez et al., 2012; Hadley et al., 2016; Hanebutt et al., 2008). A supply of preformed DHA appears to be an important determinant of infant status. Infants born to women with higher intakes of DHA have higher blood concentrations of DHA (reviewed by Innis, 2014). Maternal supplementation with ALA + LA during pregnancy was not found to increase the concentration of DHA + AA in the blood of pregnant women or their infants (de Groot et al., 2004). Although both full-term and pre-term infants can synthesise AA and DHA from LA and ALA, the synthesis rate of these LCPUFA was found to be insufficient as defined by the infant being able to maintaining consistent plasma and red blood cell LCPUFA levels (reviewed by Koletzko et al., 2008) Fatty acid intake recommendations Dietary Reference Intake (DRI) for precursor fatty acids and total fat As per the Institute of Medicine (IOM) 2005, the Adequate Intakes (AI) for both LA and ALA vary based on age and sex, and they go slightly up during pregnancy and lactation. Table 1.3 shows the AI for essential fatty acids for each life stage group. 9
26 Table 1.3 Adequate Intake values for LA and ALA (g/day) for women Life Stage Group LA (g/day) ALA (g/day) Infants 0-6 months Females years years Pregnancy Lactation Source: Institute of Medicine, Abbreviations: ALA, α-linolenic acid; LA, linoleic acid The Acceptable Macronutrient Distribution Ranges (AMDR) presented in Table 1.4 describes the recommended proportions of fat intake as a percentage of energy. Table 1.4 AMDR for fat by age as a percentage of energy Macronutrient Adults Fat (% of energy) n-6 PUFA (LA) 5-10 n-3 PUFA (ALA) Source: Institute of Medicine, Abbreviation: AMDR, Acceptable Macronutrient Distribution Ranges; PUFA, polyunsaturated fatty acids LCPUFA intake recommendations There is no evidence that women of childbearing age with adequate intake of LA need additional dietary intake of AA (consensus statement by Koletzko et al., 2007) and there are no current requirements established for minimal intake of AA by adults. There is currently no DRI set for DHA intake (Kris-Etherton et al., 2009). However, an intake of mg/day is recommended during pregnancy and lactation by many groups such as The European Commission and the International Society for the Study of Fatty Acids and Lipids (ISSFAL). A systematic review (Aranceta & Rodrigo, 2012) describes the recommended intake levels of n-3 LCPUFA set by different regulatory bodies: health organizations (FAO/WHO, Academy of Nutrition and Dietetics, American Heart Association) and governments (France, Belgium, UK, The Netherlands, New Zealand and Australia) 10
27 recommend 1.4 to 2.5 g/day for total n-3 PUFA, with EPA + DHA recommendations ranging from 140 to 600 mg/day. FAO/WHO 2008 advice and AMDR values for n-3 PUFA (ALA + long chain n-3 FA) are at 0.5-2% of energy for adults and g/day for EPA + DHA. National Health and Medical Research Council in Australia and New Zealand recommend adult females, including those of child-bearing age consume 90 mg/day of EPA + DHA + DPA to an upper limit of 3000 mg/day. There is currently no other recommendation set for DPA. The adequate intake value set by European Agency for Food Safety for the total of DHA during pregnancy and lactation is mg/day (Aranceta & Rodrigo, 2012). Dietitians of Canada and the Academy of Nutrition and Dietetics recommend 500 mg/day of n-3 LCPUFA for healthy adults including pregnant and lactating women, which would be achieved by consuming approximately 8 oz of cooked fatty fish per week (Kris-Etherton et al., 2007). Health Canada and the United States Dietary Guidelines recommend everyone including pregnant women to have two servings (150 g, 5 oz) of fish per week (Dietary Guidelines for Americans, 2015; Health Canada, 2009). As outlined in the consensus report by Koletzko et al. (2007), The European Commission and ISSFAL advise pregnant and lactating women to achieve a DHA dietary intake of at least 200 mg/day, and the systematic review by Koletzko et al. (2014) recommends lactating women aim for at least 200 mg/day but advise pregnant women to supplement their intake with 200 mg/day of DHA for a total of at least 300 mg/day Intake requirements for infants In the post-natal period, n-3 and n-6 fatty acids are derived from the breast milk, infant formula or both: 11
28 a) LCPUFA in breast milk Several factors affect total lipid content in breast milk such as the stage of lactation, maternal age, gestational age at birth, mothers nutritional status, parity and certain diseases and medications (reviewed by Jensen, 1999). The fatty acids in breast milk are derived from both the endogenous synthesis in the mammary gland and the uptake from maternal plasma. Maternal nutrition, adipose tissue stores and genetics affect the fatty acid composition of breast milk. DHA levels in human milk have been shown to increase with maternal DHA intake, whether from foods or supplements (reviewed by Innis, 2014). In addition, it is estimated using stable isotopes methods that approximately 30% of breast milk LA is directly transferred from the maternal diet, and 1.2% of milk AA originate from endogenous conversion from dietary LA (Demmelmair et al., 1998). Other factors may play a role in breast milk fatty acid composition. For example, DHA concentration appears to be lower in multiparous compared with primiparous mothers (Keim et al., 2012), and higher BMI (>25 kg/m 2 ) was found to have a positive correlation with breast milk ALA during the first month of lactation (Antonakou et al., 2013). A large number of studies have assessed the fatty acid composition of breast milk. A descriptive meta-analysis by Brenna et al., 2007, included 106 studies of human breast milk from across the world and reported that the mean (SD) relative concentration of DHA in breast milk (by weight) is 0.32±0.22% (range: %) and that of AA is 0.47±0.13% (range: %). Yuhas et al., 2006 measured human milk fatty acid composition in nine countries and confirmed that the fatty acids that was most variable was DHA. DHA levels ranged from 0.17% in the United States and Canada to 0.99% in Japan (global mean of 0.41%). The concentration of AA was found to be relatively 12
29 constant globally with a mean concentration of 0.41% of total fat. The AA:DHA ratio varied widely from 0.51:1 in Japan to 3.16:1 in the United States, and with a mean of 1.63:1. During the past 15 years, DHA concentrations in human milk have been reported to have decreased from 0.4% to 0.2% and AA from 0.7% to 0.4%in Canada (Innis, 2003). b) LCPUFA in infant formula For infants (0-6 months), FAO/WHO, 2008 recommended DHA at levels between % of total fat intake ( % of energy), and AA at % of fat ( % of energy). As per the European Food Safety Authority (EFSA) panel, 2014, it is compulsory to add LA ( g/100 kcal) and ALA ( g/100 kcal) to infant formula but voluntary to add AA, which can reach up to 1.0% of energy and DHA to be available at levels not exceeding total n-6 LCPUFA. The EFSA determined the adequate intake of LCPUFA for infants from 0-6 months to be 100 mg DHA/day but concluded that there was no evidence to set a minimum for AA or a specific ratio for DHA:AA (EFSA Panel, 2014). Since AA is consistently present in breast milk, which is the gold standard for infant feeding, there was an array of scientific papers that came in disagreement with the EFSA panel opinion, especially with the facts that AA is critical for infant health and brain development, infants fed formula without AA have lower AA plasma status than breastfed infants, and high DHA intake significantly reduces AA in brain regions in non-human primates. Therefore, the clinical evidence is lacking to support the safety of the removal of AA from infant formula especially in formulas containing DHA (reviewed by Brenna, 2016; Hadley et al., 2016; Koletzko et al., 2015). Even though it is currently optional in Canada to add DHA and AA to infant 13
30 formula, DHA and AA containing infant formula (derived from algal and fungal oils) have become widely available. Health Canada specifies that infant formula is required to contain adequate amounts of LA and ALA (Health Canada, 2015). It is added that appropriate levels of LA and ALA addition in Canada are established based on information provided by infant formula manufacturers, considering the following recommendations: pre-term infant formula should contain no more than 0.35% DHA and 0.6% AA, of total fatty acids, and that the ratio of AA to DHA should be between 1.5 and 2.0 (as per The Life Sciences Research Office, Federation of American Societies for Experimental Biology). The Food and Nutrition Board, Institute of Medicine, National Academy of Sciences established an adequate intake of 0.5 g/day of n-3 PUFA for infants 0-6 months of age, which includes 0.04 g/day of DHA (Health Canada, 2003). Among the other Canadian requirements for infant formula composition, is the recommendation that it contains (per 100 available kcal) between g of fat and not less than 500 mg of LA in the form of a glyceride (Government of Canada, 2016). Typically, infant formulas contain levels of AA at 140 mg/day and DHA at 100 mg/day, similar to global average of breast milk content (reviewed by Hadley et al., 2016). Reviewing the composition of infant formulas listed in the United States Department of Agriculture (USDA) Food Composition Databases, 2016 revealed that DHA containing formula contain % and % weight of fat of DHA and 20:4 (undifferentiated), respectively. Infant formula composition is not in the Canadian Nutrient File (CNF) database, but these formulas are sold in Canada and the amount of essential fatty acids is regulated by the Food and Drug Act. Compositional information is available on the label and from manufacturers. 14
31 c) Optimal breast milk content of DHA and AA There is no consensus on what proportion of DHA and AA in breast milk is optimal for infant development. However, a recent review (Jackson & Harris, 2016) identified 0.30% DHA as the minimal target level for breast milk, and discussed studies that recommended higher values of DHA in breast milk such as 1.0%. Achieving the target level of 0.3% appeared to provide additional benefits to the infant (such as positive effects on a psychomotor development assessment at 2.5 years and sustained attention tasks at 5 years) compared with the average 0.2% level reported in Western women s milk. However, according to this recent review there is evidence that a breast milk DHA level of 0.3% would deplete mothers DHA stores during lactation (reviewed by Jackson & Harris, 2016). On the other hand, the authors found no clinical evidence that achieving milk DHA levels of 1.0% provided extra benefit to the infant, but that this level this is associated with preventing a decrease in maternal stores and maintaining infant DHA blood concentrations during lactation (reviewed by Jackson & Harris, 2016). Two of the papers reviewed by these authors (Colombo et al., 2011; Colombo et al., 2013) reported beneficial effects on heart rate variability and several developmental tests measured out to 6 years of age in children who had been fed formula fortified with 0.32% and 0.64% DHA (reviewed by Jackson & Harris, 2016). The highest milk DHA concentration administered in this trial (0.96%) was not superior to the two lower doses except on the Stroop test, which supports a target of at least 0.32% for milk DHA (reviewed by Jackson & Harris, 2016). Therefore, based on this recent review of the literature, ensuring a minimum concentration of 0.30% w/w in breast milk and perhaps a range of % w/w might be a population goal. 15
32 Measures of infant outcomes: sleep and crying at three months of age Parents identify sleep and crying as infant behaviour outcomes important to family health (Blumberg et al., 2004; Young et al., 1998). Sleep problems in infancy were strongly associated with postnatal depression (Hiscock & Wake, 2001). Prolonged crying may trigger parents to shake their babies in an effort to sooth them which increases the risk of brain damage or death from shaken baby syndrome (reviewed by St James- Roberts, 2008). Disturbances in sleeping and crying in infancy are early indicators of poor self-regulation, which in older children is defined as developing the ability to comply with caregivers' requests and to control person's own behaviour accordingly (reviewed by Kopp, 1982). In infancy, the modulation of state of arousal, sleep maturation and activation of early behaviors are early form of self-regulation (birth to 2-3 months). These behaviors are mediated by neurophysiological maturation as well parent interaction and routines (e.g. sleeping and feeding routines). By three months of age, infants develop more defined cycles of weakness, corresponding with social definitions of day and night (reviewed by Kopp, 1982). The greatest rate of change in some aspects of sleep consolidation (such as the longest sustained sleep period) was reported to be within the first three months of life in a clinical review (Henderson et al., 2011). Parents frequently seek help for dealing with regulatory problems with their infants (reviewed by St James-Roberts, 2008). While regulatory problems in most infants are transient, a meta-analysis by Hemmi et al. (2011) suggested that children ( years of age) with previous regulatory problems have more behavioural problems than controls, especially in multiple risk families (examples of risk factors include obstetric, interactional or psychosocial problems). There are no consistent diagnostic criteria for 16
33 regulatory problems: excessive crying can be defined as unsoothable intense crying bouts for no apparent reason, and sleeping problems such as difficulties in settling at bedtime, or frequent night wakings (variable among studies, such as >3 wakings per night). Some studies consider poor sleeping and excessive crying as problematic when caregivers report them as problems. Questionnaires such as the Brief Infant Sleep Questionnaire and the Crying Pattern Questionnaire have been developed and validated to screen for infant sleep (Sadeh, 2004) and crying (Wolke et al., 1994) problems in clinical and research settings. There is evidence that nutritional status and dietary intake can influence sleep and crying. AA is a precursor for the sleep promoting prostaglandin D2 (reviewed by Urade & Hayaishi, 2011) and DHA is important for sleep regulation as demonstrated in an animal study (Lavialle et al., 2008). Supplementation with DHA during pregnancy was found to have beneficial impact on infant sleep organization as measured on day 1 and 2 (Judge et al., 2012). Maternal DHA status during pregnancy was associated with higher scores in the sleep rhythm maturation parameters of children at 6 months (Zornoza- Moreno et al., 2014). Higher maternal plasma DHA after delivery was also associated with more mature neonatal sleep-state patterning (measured on day 1 and 2) (Cheruku et al., 2002). Maternal status of other nutrients, such as decreased vitamin B12 status at 12 weeks of pregnancy, was associated with increased prevalence of excessive infant crying at three months of age (Goedhart et al., 2011). Since vitamin B12 has a role in biological methylation, the elongation of fatty acids might be influenced by the status of vitamin B12. This in turn would affect the conversion of ALA and LA to DHA and AA, respectively. 17
34 1.2 Critical review of the literature: maternal status of DHA and AA during pregnancy and postpartum A review of the literature was completed to identify the maternal serum PL status of DHA and AA and their changes across different time points in pregnancy and from pregnancy to postpartum, in longitudinal observational studies. The values were expressed as a concentration (mg/l) or as a percentage of serum PL fatty acids (%wt/wt). Of note, some studies report either the absolute concentrations (mg/l) of serum PL fatty acids or the relative concentrations (%wt/wt), but not both. Table 1.5 summarizes the observational longitudinal studies that have assessed the maternal serum PL status across multiple time points. The direction and magnitude of change of DHA and AA in absolute and relative concentrations in PL are described separately below. Of note, when the percent change of each of the acids was not provided in the study, it was calculated as: 100* (value at 1st time point- value at 2nd time point)/ value at 1st time point Changes of maternal status of DHA and AA during pregnancy Pregnancy changes in the absolute concentrations of DHA and AA (mg/l) in serum PL The absolute concentrations of both DHA and AA are reported to increase early in pregnancy (Otto et al., 2001a) and continue to increase across pregnancy as described in observational studies (Al et al.1995; Otto et al., 1997; Otto et al., 2001a; Rump et al., 2002; Wijendran et al., 1999). The total increase is reported at 30-52% for DHA and 13-23% for AA (Al et al., 1995; Rump et al., 2002), and the increase is larger in early compared to late in pregnancy (Rump et al., 2002). The proportional change in 18
35 concentration was reported to be higher in late pregnancy by Wijendran et al. (1999) but the sample size in this study was very small (only n=15 healthy participants compared to n=889 participants in the study by Rump et al. and n=110 by Al et al.). The population studied also differed as Wijendran et al. (1999) conducted their study in the US, while both Rump et al., 2002 and Al et al., 1995 conducted their study in the Netherlands. A study (Otto et al., 1997) that enrolled participants from centers in five countries (the Netherlands, Hungary, Finland, England and Ecuador) reported that gestational increases occur in the absolute amounts of a DHA and AA but the concentration of DHA increased more rapidly in the Finnish mothers. DHA status of Finnish mothers at the time point measured was higher in DHA than participants from other centers and they had a high fish intake. This suggests that the initial maternal status (influenced by parity and n-3 LCPUFA intake) could have contributed to the changes observed. The maternal dietary intake was estimated in some of the studies, and will be described next in section Since the enrolment criteria were comparable between the studies (mainly healthy, singleton pregnancy), the differences in the reported change rates of absolute concentrations of DHA and AA in maternal plasma AA could be partially due to differences in the sample timing in pregnancy (earlier or later in one trimester) Pregnancy changes in the relative concentrations of DHA and AA (wt/wt%) in serum PL The proportions of both DHA and AA in maternal serum PL increase significantly early in pregnancy up to week 10 of gestation for AA (Otto et al., 2001a) and week 18 for DHA (Al et al., 1995). There was a variation in the reported change of DHA from the first to the second trimester from 2-3% (Dirix et al., 2009; Jochems et al., 2015; Rump et 19
36 al., 2002) to 32% (Otto et al., 2001a; Al et al., 1995). AA gradually decreased by 19% from week 10 to 40 (Al et al., 1995) and the decrease appeared be larger in magnitude in the second trimester (10-15%) (Al et al., 1995; Dirix et al., 2009; Jochems et al., 2015; Meher et al., 2016; Rump et al., 2002) compared to the third trimester (5%) (Dirix et al., 2009). The results by Wijendran et al. (1999) were for the most part in agreement with the aforementioned results, but they specified a 14% decrease in AA proportion in the third trimester and 2% re-increase near the end of gestation. This may have not been captured by other studies as the sampling time points in pregnancy differed between the studies. From the second to the third trimester, the proportion of DHA was reported to decrease to proportions comparable with the first trimester levels (Al et al., 1995; Dirix et al., 2009; Jochems et al., 2015; Meher et al., 2016; Rump et al., 2002). However, these may only be non-biologically important fluctuations in DHA levels as the change was not specifically evaluated in some of these studies. The similar results between these studies is not unexpected as the women studied by Al et al., 1995; Dirix et al., 2009; Jochems et al., 2015; Rump et al., 2002 were recruited from the same area (Maastricht, The Netherlands) and had similar inclusion criteria such as ethnicity. Wijendran et al. (1999) described a slight (3%) re-increase in the DHA proportion near the end of gestation after a significant decrease (13%). The variation in the reported relative proportions of fatty acids could be attributed to the number and total areas of fatty acids peaks identified in the chromatograms, as the identified fatty acids were not reported in the majority of the studies. Additionally, maternal status entering pregnancy and dietary intake influences 20
37 the changes in status during pregnancy, and these were estimated in some of the studies, and will be described in section Change of maternal status of DHA and AA in maternal serum PL from pregnancy to 6 months postpartum After parturition, the concentrations of both DHA and AA were reported to decrease in the three studies that measured this (Al et al., 1995; Otto et al., 2001b; Stark et al., 2005). From the second trimester to three months postpartum, the concentrations of DHA decreased by 39% and by six months postpartum DHA declined by 43% lower than 36-week gestation, which was at levels significantly lower than those seen at 10-week gestation (Al et al., 1995). From the second trimester to three months postpartum, the concentration of AA decreased by only 5% (Stark et al., 2005) and by six months postpartum, the mean absolute amounts were 14% lower than at 36-week gestation, returning to levels similar to those reported at 14 weeks of gestation (Al et al., 1995). Both Otto et al. (2001b) and Stark et al. (2005) reported a decrease in estimated dietary intake of DHA postpartum compared to pregnancy while Al et al. (1995) did not estimate intakes. There was consistency among studies in finding postpartum that the proportion of DHA was lower and AA higher than their proportions during the second half of pregnancy (Al et al., 1995; Holman et al., 1991; Otto et al., 2001b; Stark et al., 2005). By six months postpartum, the DHA status as a proportion of total PL fatty acids is 25% lower than at 36-week gestation, and AA is 14% higher (Al et al., 1995). The differences between the 24-week gestation and delivery time points tended to be smaller in 21
38 magnitude as compared to differences between these two time points and three months postpartum (Stark et al., 2005). The pattern of change of AA in the serum PL postpartum, was not significantly different between the lactating and non-lactating women as reported by Holman et al. (1991) at 6 weeks postpartum and Otto et al. (2001b) from day 2 to week 64 postpartum, which may be partially influenced by the lactating women having a higher intake of DHA and total fat than non-lactating women as reported by Otto et al. (2001b). Furthermore, amenorrhea is a form of nutrient conservation as there is no loss of LCPUFAs in blood and other tissue (reviewed by Makrides & Gibson, 2000), which is an advantage to maintaining DHA status in lactating women. However, the DHA percentage declined to a greater extent in the lactating women, and the decline became larger with extended duration of lactation (Otto et al., 2001b). Stark et al. (2005) found no difference at three months postpartum in the relative decrease in serum PL DHA concentration from delivery in the breastfeeding as compared to non-breastfeeding women. However, in this study only 9% of women were breastfeeding at three months postpartum, which may have made the sample size too small to have sufficient power to compare the two groups. 22
39 1.2.3 Relationship between dietary intake of DHA and AA and essential maternal fatty acid status As some of the differences between studies in the reported changes in maternal status across gestation might be due to differences in LCPUFA intake, six out of the eleven longitudinal observational studies described in this literature review estimated maternal dietary intake at least at one time point (Meher et al., 2016; Otto et al., 2001a; Otto et al., 2001b; Rump et al., 2002; Stark et al., 2005; Wijendran et al., 1999). Wijendran et al. (1999) used repeated 24-hr recalls, while all the other studies used Food Frequency Questionnaire (FFQ). The results of these studies differed and this appears to depend on when in pregnancy/lactation intake was estimated. Although both dietary intake of DHA and maternal status increased early in pregnancy in the study by Otto et al. (2001a), they found no statistical relationship between maternal dietary intake of DHA and changes in maternal serum PL fatty acid DHA concentration. Also, Stark et al. (2005) found no association between DHA and AA intake and maternal PL concentration of these fatty acids at 24-week gestation or delivery. Only weak positive correlations were found between assessed dietary DHA and AA in the third trimester and proportions of these fatty acids in serum PL as reported by Wijendran et al. (1999). In the postpartum period, one study reported that the dietary intakes of DHA and AA were significantly correlated to their amounts in the plasma at three months postpartum (Stark et al., 2005), while another study reported significant positive correlations for DHA only at 32 weeks postpartum and for total n-6 fatty acids at 4 weeks postpartum, but not at another time points during the 64 weeks postpartum (Otto et al., 23
40 2001b). One study reported that higher estimated intake of LA in pregnancy was associated with lower proportion of DHA in maternal serum PL but had no relationship with AA concentrations (Rump et al., 2002). These results, for the most part, are inconsistent with well-established positive association between dietary intake and maternal status of essential LCPUFA in intervention studies during pregnancy (Boseus et al., 2015; Escolano-Margarit et al., 2013; Gepper et al., 2008; Hautero et al., 2013; Helland et al., 2006; Otto et al., 2000; Smuts et al., 2003; Van Houwelingen et al., 1995) and postpartum (Craig et al., 2000; Helland et al., 1998; Helland et al., 2006). There are several factors that could explain not finding an association between dietary intake and status in reviewed cohort studies. The dietary analysis databases may have not been tailored to get a reliable estimate of DHA intake or the variation in intake between women may have been too small to see a relationship. Specifically, Otto et al. (2001a) and Otto et al. (2001b) used Dutch nutrient data bank and converted into dietary intake data by using the extended computerized version of the Dutch food composition table. Rump et al. (2002) used the same encoding system but stated that the version of the Netherlands food table used in the study did not allow the calculation of individual fatty acids other than LA. Wijendran et al. (1999) coded and analyzed dietary recalls by using the University of Minnesota Nutrition Data System, and Stark et al. (2005) did not specify the database used for their analysis. Meher et al. (2016) did not estimate daily intake of fatty acids, but reported participants intake as the frequency of consuming foods containing n-3 using Nutritive Values of Indian Foods. None of the studies commented on supplement use by their subjects or if it were considered. Additionally, as 24
41 the mean estimated dietary intakes were low in these observational studies that estimated DHA intakes (range of DHA means: mg) and their samples sizes were relatively small (range: n=15-157), this is likely not sufficient to detect differences in dietary intake, especially of DHA where high intakes require the use of supplements or fortified foods. On the other hand, intervention studies that reported diet-status relationships (such as Helland et al., 1998; Helland et al., 2006; Otto et al., 2000), had high daily intakes of DHA ( mg). It is possible that the correlation between dietary intake of fatty acids and serum PL becomes harder to detect with small intakes or occurs only within a specific range of intakes. It appears that studies found a relationship between dietary DHA and status postpartum (Otto et al., 2001b; Stark et al., 2005) compared to pregnancy (Otto et al., 2001a; Stark et al., 2005) which may suggest the status of DHA could be more sensitive to maternal diet postpartum compared to pregnancy Summary, limitations and gaps in the literature In summary, the literature suggests that plasma concentrations of both DHA and AA increase during pregnancy and decline postpartum, and the decline is larger in the lactating compared to the non-lactating women. While the proportion of DHA decreases postpartum, the proportion of AA increases. Only one study (Al et al., 1995) estimated fatty acids status across pregnancy in addition to postpartum, and none of these studies used a Canadian population, where the intake of DHA during pregnancy has been reported to be below recommendations (Denomme et al., 2005) and the status to be low (Stark et al., 2016). Intervention studies report a relationship between estimated DHA intake and maternal status postpartum. However, these observational studies that have attempted to estimate dietary intake, as opposed to intervention trials, have not been able 25
42 to establish a consistent association of dietary intake and status of DHA during pregnancy. This could be because all of the reviewed longitudinal studies that estimated dietary intake of DHA and AA reported a smaller dietary intake (range of DHA means: mg) compared to intervention studies ( mg), had relatively small sample sizes (range: n=15-157) and used FFQ (with the exception of one study that used repeated 24-hr recalls). The influence of maternal intake of DHA on status and breast milk composition is well established in intervention studies. As the intake of status early in pregnancy influence the later stages, and increased DHA in maternal diet during pregnancy and postpartum was found to have added benefits to the infants, it is important to ensure adequate intake of fatty acids by the mothers. In the absence of a DRI and reference for DHA intake and status, more studies should be carried on what would be an optimal composition of breast milk fatty acids and to validate the required intake and status of DHA. Additional infant outcomes at multiple ages should be examined further to assess the long-term effects of suboptimal intake and status of DHA. 26
43 Table 1.5 Evidence form observational longitudinal study on the change of maternal serum PL status of DHA and AA during pregnancy and from pregnancy to postpartum Study, location (individuals per group) Time maternal PL fatty acids Maternal status 1st trimester Maternal status 2nd trimester Maternal status 3rd trimester Maternal status postpartum (not at Dietary intake was estimated Results Al et al. (1995), Netherlands (110) analyzed gestation wk 10, 14, 18 22, 26, 30, 32, 34, 36, 38, 40; 6 mo postpartum wk 10: DHA: 47.1±1.69 mg/l (3.79±0.09%) AA: 119.4±2.91 mg/l (9.63±0.13%) wk14: DHA: 55.8±1.48 mg/l (4.07±0.08%) AA: 127.2±2.68 mg/l (9.26±0.12%) wk 18: DHA: 61.3±1.47 mg/l (4.16 ±0.08%) AA: 131.8±2.67 mg/l (8.89±0.11%) wk 22: DHA: 63.8±1.48 mg/l (4.09±0.08%) AA: 133.3±2.68 mg/l (8.51±0.11%) wk 26: DHA: 66.8±1.48 mg/l (4.06±0.08%) AA: ±2.67 mg/l (8.29±0.11%) wk 30 DHA: 69.1±1.47 mg/l (4.05±0.08%) AA: 138.5±2.66 mg/l (8.10±0.11%) wk 32: DHA: 67.9±1.47 mg/l (3.97±0.08%) AA: delivery) 6 mo: DHA: 38.6±1.61 mg/l (2.84±0.08%) AA: 121.8±3.74 mg/l (9.07±0.17%) No The average total amount of fatty acids increased significantly during pregnancy, but the rise became less pronounced towards the end of gestation As a concentration, the total n-6 increased by 44%, the n-3 by 41%, from wk 10 to wk 40. DHA increased by 52% and AA by 23% As a proportion, after a slight increase at the end of the first trimester the n-3 decreased significantly during gestation and levelled off at the end of pregnancy, and the mean proportions of n-6 steadily decreased throughout pregnancy Maternal AA status diminished from 9.6% at wk 10 to 7.8 % at wk 40 whereas maternal DHA temporarily increased until 18 wk of gestation, after which it declined Maternal status of total n-6, and AA returned to levels similar with those at 14 wk of gestation but the mean absolute amounts of DHA 27
44 138.5±2.67 mg/l (8.08±0.11%) and n-3 had declined to levels significantly lower than those at 10 wk gestation wk 34: DHA: 67.8±1.48 mg/l (3.90±0.08%) AA: 138.0±2.67 mg/l (7.95±0.11%) wk 36: DHA: 68.2±1.47 mg/l (3.80±0.08%) AA: 142.3±2.67 mg/l (7.93±0.11%) wk 38: DHA: 69.8±1.51 mg/l (3.80±0.08%) AA: 144.9±2.71 mg/l (7.88±0.12%) 28
45 Dirix et al. (2009), Netherlands (782 motherinfant pairs) Holman et al. (1991), USA (pregnant women: 19, non-pregnant control: 59) gestation wk 16, 22, 32; directly after delivery gestation wk 36, at labor; at 6 wk postpartum. wk 16: DHA: 3.88% (IQR: ) AA: 9.59% (IQR: ) wk 22: DHA: 3.98% (IQR: ) AA: 8.60% (IQR: ) wk 40: DHA: 71.7±1.75 mg/l (3.84±0.09%) AA: 147.4±2.97 mg/l (7.84±0.13%) DHA: wk 32: 3.84% ( ) AA: wk 32: 8.14% ( ) Values not reported Values not reported No Changes in serum PL DHA contents of mothers only early in pregnancy were significantly positively related to birth weight and head circumference of their neonates AA proportion in late pregnancy was negatively related to birth weight and length No The PUFA profile (as a relative percentage) showed that all individual PUFA at 36 weeks of gestation were less than nonpregnant values except 22:5n6, which was significantly elevated The n-6 and n-3 groups of PUFA were 83% and 57% of nonpregnant and levels of AA and 29
46 Jochems et al. (2015), Netherlands (242 motherchild pairs) Meher et al. (2016), India (60 normal birth weight, 51 low birth weight) gestation wk 11, 22, 32; at delivery wk 16 20, wk and at delivery DHA 3.91% (IQR: ) AA: 9.55% (IQR: ) DHA: 4.07% (IQR: ) AA: 8.54% (IQR: ) Normal birth weight: DHA: 1.20±0.38% AA: 6.28±1.26% DHA: 3.92% (IQR: ) AA: 8.14% (IQR: ) Normal birth weight: DHA: 1.03±0.37% AA: 5.35±0.96% EPA were 65% and 42% of nonpregnant values, respectively 6 wk postpartum, serum PL profile in lactating women was very similar to that during pregnancy and at parturition, and the profile of lactating women was very similar to that of non-lactating women, but further from the nonpregnant values No Study findings suggest the importance of maternal n-6 fatty acids in relation to children's glucose metabolism and blood pressure, and n-3 fatty acids in relation to blood lipids at childhood The strengths of these associations seemed stronger with fatty acid concentrations in early compared to late in pregnancy FFQ There was no change in the levels of total n-3 fatty acids, DHA and AA at delivery as compared to week gestation Cord levels of SFA, total n-3 fatty acids, DHA and AA were higher than maternal levels at all the time points Maternal plasma AA at wk was higher in the low birth weight group 30
47 Otto et al. (1997), Netherlands (50), Hungary (54), Finland (49), England (56), Ecuador (26) before gestation wk 18, 22, 32 wk; at delivery wk 10-13: DHA (mg/l) Finland: 74.46±3.20 Netherlands: 58.72±2.86 Ecuador: 62.88±3.49 Hungary: 55.40±1.85 AA(mg/L): Finland: ±3.50 Netherlands: ±5.20 Ecuador: ±6.26 Hungary: ±4.96 Relative weights not reported week 14: DHA: England: 69.68±2.43 mg/l AA England: ±4.27 mg/l Values for wk 22 not reported Values not reported Cord DHA was positively associated with maternal DHA at all time points while Cord AA was negatively associated with maternal AA at delivery No The n-3 fatty acids concentrations were highest in the Finnish and lowest in the Hungarian samples The absolute amounts of all the considered fatty acids including DHA and AA increased during pregnancy The amounts of total maternal serum PL fatty increased during pregnancy, showing similar courses among all centers but the amounts of DHA increased more rapidly in the Finnish mothers When expressed as percentages, almost all essential fatty acids slightly declined during gestation but LA and AA remained stable The patterns for the changes over time of n-3 and n-6 fatty acids were very comparable between the different populations, except for n- 6 which decreased at significantly higher rates in the Hungarian mothers compared with the Finnish mothers There was a strong positive relationship between maternal and 31
48 Otto et al. (2001a), Netherlands (24) Otto et al. (2001b), Netherlands (57 women: 22 exclusively bottlefeeding and 35 breastfeeding ) prepregnancy; gestation wk 4,6,8, wk gestation, at days 2, day 5 and 1, 2, 4, 8, 16, 32, and 64 wk postpartum wk 10: DHA: 52.26±14.47 mg/l (3.93±0.22%) AA: (concentratio n not reported) 9.34±0.35% Values not reported Lactating group: 8 wk: DHA 2.44±0.12% FFQ, before pregnancy and wk 10 of gestation FFQ designed to collect data on fat intake, at 4 and 32 wk postpartu m neonatal n-3 values within each participating group Significant increase in fatty acid concentrations was reported from pre-pregnancy to wk 10 including DHA and AA During the first 10 wk of pregnancy, the ratio of n-6 to n-3 fatty acids dropped significantly No significant relationship was observed between maternal dietary fatty acid intake and changes in maternal serum PL fatty acid concentrations The concentrations of DHA and total n-3 fatty acids showed significant downward trends postpartum and were not significantly different between lactating and non-lactating groups DHA proportion decreased significantly over time in both groups and was significantly lower in the lactating than in nonlactating group between 1 and 16 wk postpartum AA proportion increased significantly postpartum and was significantly different between lactating and non-lactating groups No significant outcomes were found for the interaction terms of the n-6 fatty acids whereas the 32
49 Rump et al. (2002), Netherlands (889 motherinfant pairs) 1 st, 2 nd, 3 rd trimesters; at delivery; umbilical vein at birth DHA: 53.33±16.34 mg/l (3.99±0.88%) AA: ±29.65 mg/l (9.60±1.46%) DHA: 66.64±16.67 mg/l (4.09±0.86%) AA: ±29.49 mg/l (8.61±1.31%) DHA: 69.31±16.39 mg/l (3.93±0.76%) AA: ±29.19 mg/l (8.17±1.22%) n=288 women questione d by a trained dietitian at 2 nd trimester on usual food intake over the preceding 2 mo pattern of DHA change over time was significantly different between the lactating and non-lactating groups Only when the total group was considered, there were significant correlations between maternal fatty acid intake and the respective fatty acid values in serum PL. These significant positive correlations were found only for DHA at 32 wk and for total n-6 fatty acids at 4 wk During pregnancy women tended to maintain their ranking order with respect to their serum PL fatty acid concentrations The total and major individual fatty acids concentration in umbilical serum PL (but not the proportions) were higher in girls than in boys. The length of gestation was related to PUFA composition of umbilical cord serum PL but not to maternal PUFA concentrations at delivery The umbilical serum PL concentration and proportion of DHA but not AA was positively related to gestational age at birth The maternal relative concentration of DHA (%) at delivery was dependent on maternal parity Higher intake of LA was associated with lower proportion 33
50 Stark et al. (2005), USA (157 African American women) Wijendran et al. (1999), gestation wk 24, delivery; 3 mo postpartum gestation wk 27-30, 33-35, DHA: 83±20 μg/ml (1.77±0.44%) AA: 355±82 μg/ml (7.55±1.49%) control group: DHA: wk of gestation: DHA: 51±18 μg/ml (1.37±0.37%) AA: 336±85 μg/ml (9.01±1.35%) FFQ, gestation wk 24, delivery; 3 mo postpartu m Three 24- hr dietary recalls at gestation wk 27-30, (%) of DHA in maternal serum PL but did not relate to higher AA concentrations The DHA proportion decreased postpartum while EPA and AA increased, and the relative percentage of DHA in total LCPUFA was significantly higher at gestation and delivery than at postpartum No difference was found in the decrease in the amount of DHA in plasma from delivery to postpartum in the breastfeeding as compared to non-breastfeeding women The mean DHA in the estimated total circulating plasma was similar at gestation and delivery, but was significantly lower at 3 mo postpartum Postpartum, the women reported a significantly greater energy percent intake of PUFAs. Dietary intakes of DHA and AA were significantly correlated to their amounts in the plasma at 3 mo postpartum, but not at 24 wk gestation or delivery As a concentration, all the PL fatty acids and summed fatty acids increased with gestation during the third trimester, except for LA and 34
51 USA (15 GDM, 15 control) 12.09±1.48 mg/l (3.37±0.20%) wk: 16.51±1.53 mg/l (2.94±0.21%) wk: 15.91±1.48 mg/l (3.03±0.20%) AA: wk 39.26±4.80 mg/l (10.40±0.51 %) wk: 52.19±4.96 mg/l (8.91±0.52%) wk: 48.57±4.80 mg/l (9.11±0.51%) 33-35, EPA, which did not vary significantly The proportion of AA decreased significantly by 12.4% from to wk gestation in control subjects whereas DHA was significantly lower at and wk than at wk of pregnancy Women with GDM, had DHA at a significantly higher concentration and proportion (by <19%) than controls DHA proportion showed a significant negative association with pre-pregnancy BMI in control subjects and was significantly lower in overweight than in normal-weight subjects In control subjects, there were weak positive correlations between mean assessed dietary DHA and AA and mean proportions of corresponding fatty acids in serum PL Abbreviations: AA, arachidonic acid; DHA, docosahexaenoic acid; EPA, eicosapentaenoic acid; LA, linoleic acid; PL, phospholipid; PUFA, polyunsaturated fatty acids; SFA, saturated fatty acids 35
52 2.1 Rationale Chapter 2: Research Plan The quality of maternal diet during pregnancy and lactation is vital to the nutritional status of the mother and the development and growth of her infant. Long chain polyunsaturated fatty acids, such as DHA and AA, are structural components of cellular membranes, precursors of eicosanoids, and are found in high concentration in the brain, retina and other neural tissues (reviewed by Uauy et al., 2000). These essential fatty acids are present in breast milk, and are needed for growth, brain and immune development in the infant. Although DHA can be made from ALA, the conversion rate is very low (1-5%) (Emkrn et al., 1994; Pawlosky et al., 2001) making dietary intake of DHA important in assuring optimal status. AA can be formed from LA and the estimated conversion rate is 11-19% (Emkrn et al., 1994; Pawlosky et al., 2001), thus dietary intake of AA is less important. Increasing the intake of DHA in pregnancy and postpartum resulted in an increase in maternal status of plasma and breast milk DHA, as demonstrated by intervention studies (Escolano et al., 2013; Hautero et al., 2013; Helland et al., 1998), as well as provided more DHA to the infants (Helland et al., 2006). Serum PL fatty acid composition is a biomarker of fatty acid status (reviewed by Fekete et al., 2009). Currently, there is no DRI established for the intake of DHA (Kris-Etherton et al., 2009) and no reference range established for optimal DHA and AA concentrations in maternal serum PL. The dietary intake of DHA during pregnancy and lactation in Guelph, Canada was found to be lower than the available intake recommendations (Denomme et al., 2005) and 36
53 plasma status was found to be low compared to global averages (Stark et al., 2016). The degree of DHA and AA status changes during pregnancy seems to vary from a study population to another (Otto et al., 1997), which could be attributed to the maternal prepregnancy status of fatty acids, parity, dietary intake, weight gain, pregnancy duration, maternal age and maternal health. Maternal status of DHA is reported to decrease postpartum as described in the literature (Al et al., 1995; Holman et al., 1991; Otto et al., 2001b; Stark et al., 2005), and the decrease is greater with the extended duration of lactation (Holman et al., 1991; Otto et al., 2001b). It is unclear what level of maternal intake of DHA should be aimed for and to what extent non-dietary factors, such as weight changes during pregnancy could affect maternal DHA and AA status. Sleep and crying are indicators of self-regulation and infants that cry more than average were found to have continued behaviour problems at the age of 3.5 years (Alvarez & St. James-Roberts, 1996). AA is a precursor for the sleep promoting prostaglandin D2 (reviewed by Urade & Hayaishi, 2011) and DHA is important for sleep regulation as demonstrated in an animal study (Lavialle et al., 2008). Furthermore, maternal status of DHA during pregnancy was associated with higher values in the sleep rhythm maturation parameters of children at 6 months (Zornoza-Moreno et al., 2014) and with more mature neonatal sleep-state patterning (measured on day 1 and 2) (Cheruku et al., 2002). Maternal status of other nutrients, such as vitamin B12 status (which has a role in methylation hence the elongation of fatty acids) at 12 weeks of pregnancy was associated with increase prevalence of excessive infant crying at three months of age (Goedhart et al., 2011). Yet, no studies have assessed the relationship between breast 37
54 milk or formula composition (infant intake) of essential fatty acids and infant sleep or crying outcomes. Globally, there is a large variation of DHA and AA in breast milk, and there is no consensus on what the optimal levels are that women need to consume to achieve these. However, ensuring a minimum concentration of 0.3% w/w in breast milk and perhaps a range of % w/w might be a population goal. Higher values of DHA in breast milk appeared to provide additional benefits to the infant, such as positive effects on a psychomotor development assessment, sustained attention tasks, and beneficial effects on heart rate variability (reviewed by Jackson & Harris, 2016). Yet, more studies are needed to define an optimal breast milk content of DHA and AA for infant development. Studies support the dietary essentiality of DHA for the development of the immune system (reviewed by Richard et al., 2016) and the brain, reviewed by Singh (2005), but more research is needed to rule out the essentiality of AA in the diet. The EFSA panel determined the adequate intake of LCPUFA for infants from 0-6 months at 100 mg DHA/day but concluded that there was no evidence to set a minimum for AA (EFSA Panel, 2014). Since AA is consistently present in breast milk, which is the gold standard for infant feeding, an array of scientific papers has challenged the EFSA panel opinion. It is vital to ensure infants have sufficient amounts of these fatty acids in their diet during critical periods of growth and development, and to define what is optimal by examining associations with important infant health outcomes, such as sleep and crying, which are early indicators of self-regulation. Assessing infant outcomes, maternal status and dietary intake in relation to what is proposed to be optimal breast milk composition is a knowledge gap identified in the 38
55 literature. By establishing the relationship between maternal intake, status and breast milk content of key fatty acids in addition to infant behavioural outcomes, the study results will guide healthcare professionals to identify pregnant women at risk for nutritional deficiency. The established range of status of key fatty acids associated with infant development will provide evidence for future studies that may direct intervention and policy making aimed at improving maternal intake of DHA in pregnancy. These prevention strategies would in turn reduce the burden on the parents and reduce the burden on health care providers and improve the quality of life for the families. 2.2 Research objectives The goal of this research was to use a large maternal-infant cohort in Alberta, the APrON cohort, to describe the maternal intake and status of DHA and AA across the three trimesters of pregnancy and at three months postpartum, and to describe levels of DHA and AA in breast milk and their associations with infant sleep and crying at three months postpartum. The objectives of this research were: 1. to describe the maternal dietary intake of DHA and AA across the three trimesters of pregnancy as well as at three months postpartum; a) to compare n-3 LCPUFA and DHA estimates from interview and online recall methods; b) to update the content of n-3 FA in a previously-established food database and estimate n-3 LCPUFA intake (DHA, EPA, DPA, total n-3) and AA from dietary intake across pregnancy and at three months postpartum; c) to examine the change of DHA and AA intake across the four time points; d) to compare DHA intake with recommendations; 39
56 2. to describe the maternal status of DHA and AA across the three trimesters of pregnancy as well as three months postpartum; a) to describe the change of maternal status of DHA and AA in serum PL across pregnancy and at three months postpartum; 3. to determine the relationship between postpartum dietary intake of DHA and AA and the maternal status of these fatty acids; 4. to describe the breast milk content of DHA and AA; 5. to define the relationship between breast milk DHA and AA, maternal diet and status at three months postpartum; a) to define DHA intake and status levels (in both concentration and proportion of serum PL) that provide ideal breast milk DHA content (or concentrations); 6. to determine the relationship of DHA and AA in breast milk and infant sleep and crying at three months postpartum after controlling for major covariates. More specifically: a) reported daily duration of infant sleep at three months of age; b) reported daily duration of infant cry at three months of age; c) parents perception of sleep quality and crying behaviour. 2.3 Lay out of thesis Chapter 3 describes the APrON s study design and the methods of the thesis; Chapter 4 presents the results of the research objectives including maternal DHA and AA in diet and stats across pregnancy and at three months postpartum and their relationships, breast milk fatty acid composition and its relationship with diet and status, 40
57 as well as breast milk DHA and AA and the relationship with infants sleep and crying postpartum; Chapter 5 summarizes the project findings and provides a general discussion in addition to the overall conclusion and implications for future research. 41
58 Chapter 3: Methods 3.1 Subjects and study design The Alberta Pregnancy Outcomes and Nutrition (APrON) cohort (n=2199) is a longitudinal Canadian study that was used for this research. Participants were pregnant women from Edmonton and Calgary, Alberta, Canada, and their children. Recruitment took place from May 2009 to November 2010 (Manca et al., 2013) through physician clinics and ultrasound offices. Additional recruitment strategies included posters and flyers in areas frequently accessed by pregnant women as well as advertisement through the media (television, radio and print publications) and the internet (such as Mommy blogs and twitter). The inclusion criteria were being at least 16 years of age, less than 27- week gestational age upon study entry, fluent in English and having an intention to stay in the region for the succeeding 6 months. All participants provided informed consent before enrolment in the study. The study was approved by the University of Calgary Health Research Ethics Board and the University of Alberta Health Research Ethics Biomedical Panel. As the number of available responses/samples differed between variables and time points, Figure 3.1 shows the sample sizes available studied for each analysis. 42
59 Figure 3.1 Study participants enrolled in APrON cohort with available data and included in the analysis at each time point First Trimester Second Trimester Third Trimester Postpartum Data available at all time points DHA from diet + supplement (n=239) DHA from diet + supplement (n=998) DHA from diet + supplement (n=882) DHA from diet + supplement (n=827) DHA from diet + supplement (n=162) AA in diet (n=129) AA in diet (n=564) AA in diet (n=497) AA in diet (n=485) AA in diet (n=87) DHA and AA in maternal serum (µg/ml) (n=278) DHA and AA in maternal serum (µg/ml) (n=1048) DHA and AA in maternal serum (µg/ml) (n=712) DHA and AA in maternal serum (µg/ml) (n=891) DHA and AA in maternal serum (µg/ml) (n=103) DHA and AA in maternal serum (wt/wt%) (n=280) DHA and AA in maternal serum (wt/wt%) (n=1059) DHA and AA in maternal serum (wt/wt%) (n=713) DHA and AA in maternal serum (wt/wt%) (n=907) DHA and AA in maternal serum (wt/wt%) (n=103) Breast milk DHA (n=1035) and AA (n=1006) Infant sleep (n=785) and cry (n=839) Exclusively breast-fed infants: sleep (n=724) and cry (n=745) 43
60 3.2 Dietary intake data Collection of intake data Participants were assessed once during each trimester and once at three months postpartum for dietary and supplement intake. Many participants entered the study in the second trimester so data was collected for three time points only. Participants were asked to describe in detail the type and quantity of food and beverage in the previous 24-hour period and dietary supplements consumed during the trimester. For the first 1050 participants, trained nutrition-educated research assistants conducted the food recall interviews using a Multiple Pass Method. Food models were used to help women more accurately estimate portion sizes, and details such as time of eating and cooking methods were also collected. Beginning in August 2010, the validated online Food Behaviour Questionnaire developed at the University of Waterloo was used instead to complete 24- hour food recalls. It also used a multiple-pass-based methodology in which participants completed the online recall on their own, with pictures of foods and pictorial depictions of portion sizes guiding in the online questionnaire (Kaplan et al., 2014). Because the collection of the 24-hr recalls was completed using two different methods, a validation study was carried where non-pregnant women completed the two methods as will be described in section Supplementation usage was assed using a Supplement Intake Questionnaire (SIQ), which was developed specifically for the APrON study. The questionnaire was administered by trained nutrition personnel at each visit who inquired about the brand name, dosage and frequency of consumption for each product (Gómez et al., 2013). For this project, DHA and EPA supplement intake data was obtained from SIQ, and at the 44
61 time of this thesis was only available from all women who completed their 24-hour recalls by interview, but for only 16 participants who completed 24-hour recalls using the online method. Therefore, total intake of DHA and n-3 LCPUFA from both supplement and diet is described only for participants who completed recalls using the interview method. Table 3.1 describes the number of available responses for n-3 intake from the diet, supplement and total dietary intake across pregnancy and at three months postpartum. Only 162 participants had dietary recall information available at all the four time points. Table 3.1 The number of available responses for n-3 intake from the diet, supplement and total intake across pregnancy and at three months postpartum Dietary recall First Second Third Postpartum method trimester trimester trimester Interview Diet Supplement Total Online Diet Supplement Total Estimating dietary intake data Nutrient estimates for energy and macronutrients were obtained from the output of a commercial program (Food Processor version 10.6; ESHA Research, Salem, Ore., USA). Not every participant who had a visit at each time point completed a 24-hour recall. Nutrient intake data was obtained from the APrON database. The intake of n-3 LCPUFA (EPA, DPA and DHA) was calculated using the food names entered in Food Processor, and running in a database that had been previously established for the APrON study as described in Jia et al. (2015). The database included all foods reported in the 24-hour recalls of the first 600 APrON participants and was
62 updated for this project to include food and beverage items consumed by the rest of APrON participants as well as food and beverage reported in the Dietary Method Validation Study (a validation study of the two intake methods). The CNF and the USDA nutrient databases were used as the primary sources of n-3 LCPUFA content of foods, and recipes were created for mixed dishes that included food high in n-3 and were not available in the CNS or USDA databases. Intake data was screened for potential errors, and the estimates of subjects with the highest estimated intake of n-3 LCPUFA from diet and/or supplement were checked and verified for accuracy Validation of the two dietary recall methods (Dietary Method Validation Study) Dietary intake was compared between two 24-hour dietary recall methods: faceto-face interviews and online questionnaires. A group of non-pregnant women of childbearing age (16-40 years) (n=58), able to comprehend written/spoken English and computer-literate, were recruited separately from APrON and completed the two methods. Food and beverage intake was determined using the two methods for the same day, and the order of the collection of type of recall was random. Intakes of EPA, DPA, DHA were calculated using the updated APrON n-3, as described in section The total of n-3 LCPUFA intake was computed by adding up intakes of EPA, DPA and DHA Estimating of meeting the recommendation of dietary intake An estimate for daily dietary macronutrient intake as a proportion of energy at the four time points was compared to the Accepted Macronutrient Distribution Range (AMDR) recommended by the Institute of Medicine for macronutrients. Total DHA 46
63 intake from diet and supplement was compared to the European Union (EU) consensus recommendation of 200 mg of DHA per day. 3.3 Biological samples used for fatty acid analyses Maternal blood Maternal blood samples were collected at four different time points: once at each trimester (1 st trimester, n=280; 2 nd trimester, n=1059; 3 rd trimester, n=713), and once at three months postpartum (n=908). As described in Kaplan et al. (2014), the percent and concentration of phospholipid fatty acids were determined on 300 µl of maternal serum at each of the time points. Initially, 10 µg (100 µl of 10 mg/100 ml) of a phospholipid (phosphatidylcholine) standard (C15:0) was added to the sample, and lipid extraction was performed using a modified Folch method. PL were separated from other major lipid classes and methylated by thin-layer chromatography and the phospholipid band was then visualized and scraped. Prior to methylation with BF3, 10 µg C17:0 triglyceride standard (100 µl of 10 mg/100 ml) was added to the silica. Fatty acids were then separated by automated gas liquid chromatography. Fatty acid status was calculated as a percentage of total serum PLs and as a concentration (correction was made with the C15:0 phospholipid standard that was added at the beginning of the extraction). Appendix I describes the Standard Operating Procedures (SOP) created and used for calculating and cleaning of APrON maternal serum PL fatty acids Breast milk As previously described in Kaplan et al. (2014), breast milk samples (n=1038) were spotted onto chromatography filter paper and were processed by direct methylation using BF3, hexane and heat. The relative percent of fatty acids (w/w%) in each sample 47
64 was determined by gas liquid chromatography, as described in this chapter for maternal blood. 3.4 Infant sleep and crying information Questionnaires were used to collect information about infant sleep and crying from parents perspective (Appendix III). The Brief Infant Sleep Questionnaire data (n=1473) were collected from mothers at three months postpartum. This questionnaire included questions on the sleeping arrangement (infant crib in parent's room, infant crib in a separate room, in parents bed, infant crib in room with sibling, other) and sleeping position (on his/her belly, back or side) of the infant as well as the estimated duration of sleep and crying during the day and night. In addition, questionnaires asked whether the parents consider their infant s sleep to be a problem. Crying Patterns Questionnaire data (n=1588) inquired on the frequency and duration of infant s crying. The number of periods of persistent crying in a week (a period of crying was defined as half an hour or more) in each of the morning, afternoon, evening, or night were estimated, and number of periods were summed to provide an estimate of total weekly periods for use in this project. For this project, the infants were grouped into 0 (no periods of persistent crying), 1-7 (up to one daily period of persistent crying) and 8-25 (more than one daily of persistent crying). Information was also collected about whether parents considered their infant s sleep to be a problem. 3.5 Collection of potential covariates Demographic information included ethnicity, marital status, education level and socioeconomic status. Additional potential confounders were identified from previous studies and for this research included: maternal age, gravidity, parity, fertility treatment, 48
65 alcohol intake and smoking during pregnancy, pre-pregnancy body mass index (BMI) (calculated from maternal reported pre-pregnancy weight and measured height obtained at study entry), pregnancy complications (bleeding, hypertension, diabetes, preeclampsia) and gestational weight gain during pregnancy. Gestational weight gain was determined by calculating the difference between the highest weight in pregnancy and the prepregnancy weight. When the highest weight was not available or was less than the highest measured weight during pregnancy, the third trimester weight measured by study staff was used instead (Jarman et al., 2016). Women were then categorized as meeting, or being above or below the Health Canada and IOM guidelines for recommended amounts of weight gain during pregnancy based on their pre-pregnancy BMI category (Table 3.2). Table 3.2 Target total gestational weight gain by pre-pregnancy BMI category BMI category (kg/m 2 ) Weight Gain Guidelines (kg) Underweight (<18.5) Normal ( ) Overweight ( ) Obesity ( 30) 5-9 Abbreviation: BMI, Body Mass Index Additional outcome variables that were collected for this project included incidence of multiple births, gestational age at delivery, preterm gestation (<37 weeks), delivery type (vaginal or Caesarian), infants Apgar score at 5 minutes, infant anthropometrics at birth (weight, length and head circumference), infant sex and breastfeeding method at three months (exclusive breastfeeding, exclusive formula feeding, or mixed feeding). The maternal health of the mothers at three months postpartum was assessed using Edinburgh Postnatal Depression Scale (EPDS). 49
66 3.6 Statistical analysis Statistical analysis was performed using SPSS Version 23.0 (IBM Corporation, Armonk, NY, USA) and a p-value<0.05 was considered statistically significant for all analyses. The data was analyzed for normality using Kolmogorov-Smirnov test. Data are presented as mean ± SD. For skewed data, median and inter-quartile range (IQR) are added in parenthesis (median, IQR). For the validation study of dietary intake, differences in estimated intake, energyadjusted and fat-adjusted intakes of EPA, DPA, DHA and total n-3 LCPUFA were assessed by Wilcoxon signed-rank test or paired t-test. The strength of association between nutrients estimated by two dietary recall methods was performed using Pearson s or Spearman s correlation analysis. At the group level, Bland-Altman analysis was used to test the agreement and bias. Participants were grouped into tertiles of total n- 3 and DHA intake and energy-adjusted intake from the diet (Tertile 1 to Tertile 3). The number of participants who stayed in the same tertile was calculated using the formula: (online method/interview method) *100. To study the differences in total dietary intake of DHA and AA across the three trimesters and at three months postpartum, a Wilcoxon signed-rank test was used between all pairs of time points that did not have a normal distribution. To examine the differences in DHA and AA (as relative percentages and concentration) in maternal serum across four time points, Wilcoxon signed-rank test was used between all pairs of time points. Associations between postpartum maternal diet and serum DHA and AA were evaluated using univariate linear regression. For DHA, only intake estimates of 1000 mg or lower were included in the final analysis. 50
67 Correlations between maternal diet estimate, serum DHA and AA and breast milk content of these fatty acids was tested using Spearman s non-parametric correlation. Relationships between DHA in breast milk and postpartum maternal dietary intake and status of DHA were investigated using univariate regression analysis. Associations between maternal DHA, AA and AA:DHA ratio in breast milk with the durations of infant sleep and crying were analyzed by multiple linear regression. The following covariates were tested for confounding (excluding samples pair-wise and not list-wise to maximize the use of available samples): maternal age, parity/gravidity, smoking during pregnancy, alcohol intake during pregnancy, delivery kind, fertility treatment, pregnancy complications, gestational age at delivery/whether infants were full term, method of infant feeding, pre-pregnancy BMI/classification, weight gain during pregnancy/classification, maternal depression score, demographics, sleep arrangement, sleep position, birth anthropometrics, Apgar score at 5 minutes and infant sex). Nonparametric tests (Kruskal-Wallis Test) were used to examine the difference between each of DHA, AA and AA:DHA content in breast milk in the groups of infants that were reported to have sleep or cry to be not a problem, somewhat a problem or a serious problem. Similarly, the groups of infants that had 0, 1-7 or 8-25 reported weekly periods of persistent crying were tested for differences in each of DHA, AA and AA:DHA in breast milk, with non-parametric post hoc test (Mann-Whitney U test). Binary logistic regression was used to test the relationship between AA in breast milk in the two groups of persistent crying (group of 1-7 periods, n=137; group of 8-25 periods, n=19) controlling for significant covariates. When assessing the relationships, interaction effects were not tested in the analyses in this project for any of the covariates and outcomes. 51
68 Chapter 4: Results 4.1 Characteristics of study population The characteristics of APrON participants (n=2199) are presented in Table 4.1. The age of women in this cohort ranged from years with a mean age of 31±5 years. The majority of the women were married or living common-law (96%), had completed postsecondary education (88%), were Caucasian (80%), did not receive fertility treatment (92%) and did not report smoking (98%) nor drinking alcohol (96%) during pregnancy. Upon study entry, approximately half the women were multigravida (47%, range 1-9), nulliparous (56%, range: 0-4) and had an annual household income greater than $100,000 CAD (55%). Pre-pregnancy BMI fell in the normal range for the majority of participants (63%) but 51% exceeded the weight gain guidelines for pregnancy. The maternal depression scale at three months postpartum ranged from 0-22 and suggested that the majority of women (87%) did not have depressive symptoms (EPDS<10). Table 4.1 Maternal characteristics of all APrON participants Maternal characteristic (n) 1 Mean ± SD or n (%) Age at recruitment (2148), years 31.1±4.5 Marital status (2103) Married/Common-law 2019 (96) Separated/divorced 15 (0.7) Single 69 (3.3) Highest education (2083) Post university Trade/university High school Household income (2080), CAD >$100 k $ k $ k $ k $< 20 k 472 (22.7) 1352 (64.9) 259 (12.4) 1147 (55.1) 467 (22.5) 279 (13.4) 121 (5.8) 66 (3.2) 52
69 Ethnicity (2097) Gravidity (2096) Parity (2101) Caucasian Other Primigravida Multigravida Nulliparous Primiparous Multiparous Fertility treatment (2108) Yes No Smoking during pregnancy 2 (1858) Yes No Alcohol consumption during pregnancy 3 (1858) Yes No Pre-pregnancy BMI (1948), kg/m 2 Underweight (BMI <18.5) Normal (BMI: ) Overweight (BMI: ) Obese (BMI 30) Weight gain during pregnancy (1736), kg Within recommendations Above Below Maternal EPDS score at three months (1675) < (80.3) 414 (19.7) 990 (47.2) 1106 (52.8) 1184 (56.4) 713 (33.9) 204 (9.7) 160 (7.6) 1948 (92.4) 31 (1.7) 1827 (98.3) 82 (4.4) 1776 (95.6) 24.2± (3.7) 1238 (63.6) 418 (21.5) 220 (11.3) 15.2± (32.2) 877 (50.5) 300 (17.3) 4.9± (87) 219 (13) 1 Maternal age is additionally presented as mean ± SD. Data are presented for all participants (n=2199) but as data were not available for all women, presented individual response rate may vary 2 Smoking during pregnancy was counted as yes if the woman answered yes to I currently smoke in the second or the third trimester of pregnancy 3 Alcohol consumption during pregnancy was counted as yes if the woman answered yes to I currently drink in the second or the third trimester of pregnancy Abbreviations: BMI, Body Mass Index; EPDS, Maternal Edinburgh Postnatal Depression Scale The main maternal characteristics of the women that were included in analysis at three months postpartum (n=1466) did not seem different from the whole APrON cohort. The mean age was 31.5±4.2 years, the majority of women were married (72%), had a 53
70 household income >$70,000 (82%), were Caucasian (84%), had a normal BMI (mean: 24.1±4.7 kg/m 2 ) and a mean weight gain during pregnancy of 15.4±6.0 kg. The characteristics of APrON infants where there was data for breast milk fatty acid composition and completed sleep or cry questionnaires (n=841) are presented in Table 4.2. Most infants were born full term (95%) with an average gestational age of birth of 39.4±1.5 weeks. Three quarters of infants were born vaginally, with a mean birth Apgar score at 5 minutes of 9±1, weight of 3372±485 g, length of 50.9±2.9 cm and head circumference of 34.5±1.7 cm. The proportion of males was slightly higher than female infants (52% and 48%, respectively). At three months postpartum, approximately three quarters of participants reported exclusively breastfeeding their infants (78%). Table 4.2 Characteristics of APrON infants used in the analysis Characteristic (n 1 ) Mean ± SD or n (%) Gestational age (841), weeks 39.4±1.5 Preterm, <37 45 (5) Full term 796 (95) Delivery type Vaginal 615 (76) Caesarian 193 (24) Apgar at 5 min, total (833) 9.0±0.6 Birth anthropometrics Weight (834), g Length (726), cm 3372± ± ±1.7 Head circumference (768), cm Sex Male 434 (52) Female 400 (48) Breastfeeding status at three months (575 2 ) Exclusive breast feeding 451 (78) Mixed (breast and formula) 124 (22) 1 Data are presented for all infants used in the analysis (n=841) but as data were not available for all infants, individual response rate may vary 2 At the time of this thesis, data was only available for a subset of the cohort 54
71 4.2 Dietary intake of fatty acids Dietary Method Validation Study: validation of estimating n-3 LCPUFA intake from the diet using interview and online recall methods in 58 non-pregnant women Comparison of estimated n-3 LCPUFA Estimates of unadjusted, energy- and fat-adjusted intakes of n-3 LCPUFA (EPA, DPA, DHA and their total) for interview and online recall methods of participants in the validation study are presented in Table 4.3. Total n-3 LCPUFA intake from the diet The median unadjusted total intakes of n-3 LCPUFA for the interview and online methods are 59 mg (IQR= 9-234) and 43 mg (IQR= 2-208), respectively. The Bland- Altman plots for unadjusted and adjusted estimates of n-3 LCPUFA are presented in Figure 4.1. The Bland-Altman plots showed less bias and more agreement in the unadjusted total n-3 LCPUFA compared to the energy- and fat-adjusted total n-3 LCPUFA; there was a smaller number of outliers and a more balanced distribution of the data in the plot of the unadjusted total n-3 LCPUFA. When compared to the face-to-face recall, the online method underestimated total n-3; the unadjusted n-3 total was underestimated by 43±444 mg, the energy-adjusted was underestimated by 37±272 mg/1000 kcal and the fat-adjusted n-3 total was underestimated by 235±1203 mg/1000 kcal. There was a slightly stronger correlation between the methods when fat-adjusted total n-3 intake was used (r=0.788, p<0.001) compared to unadjusted (r=0.682, p<0.001) and energy-adjusted total n-3 intakes (r=0.646, p<0.001) (Figure 4.2). 55
72 When total n-3 was stratified by tertiles of dietary intake, there was only a small difference (5%) between the adjusted and unadjusted estimates. For unadjusted total n-3, 84% of participants who were grouped in Tertile 1 using the interview method were also grouped in Tertile 1 using the online method. This is compared to 79% of participants that were grouped in Tertile 1 for both methods when energy- and fat-adjusted total n-3 intakes were used. Similar variability between methods for classification of participants in Tertiles 2 and 3 was observed (Figure 4.3). DHA Intake The median unadjusted total intakes of DHA for the interview and online methods are 23 mg (IQR= 4-139) and 20 mg (IQR= 1-90), respectively. The Bland-Altman plots for unadjusted and adjusted estimates of DHA are presented in Figure 4.4. The Bland- Altman plots showed less bias and more agreement in the unadjusted total n-3 LCPUFA compared to the energy- and fat-adjusted total n-3 LCPUFA: there was a smaller number of outliers and a more balanced distribution of the data in the plot of the unadjusted total n-3 LCPUFA. When compared to the face-to-face recall, the online method underestimated total DHA: the unadjusted DHA was underestimated by 47±302 mg, the energy-adjusted DHA was underestimated by 34±191 mg/1000 kcal and the fat-adjusted DHA was underestimated by 197±886 mg/1000 kcal of fat. There was a slightly stronger correlation between the methods when fat-adjusted DHA intake was used (r=0.773, p<0.001) compared to unadjusted (r=0.657, p<0.001) and energy-adjusted DHA (r=0.620, p<0.001) (Figure 4.5). 56
73 When DHA was stratified by tertiles of dietary intake, there was only a small difference (0-5%) between the adjusted and unadjusted estimates. In all DHA intake measures (energy-adjusted, fat-adjusted and unadjusted), 74% of participants who were grouped in Tertile 1 using the interview method were also grouped in Tertile 1 using the online method. The variability between methods for classification of participants in Tertiles 2 and 3 was slightly higher (5%) than observed in Tertile 1: 65% compared of participants were classified in Tertile 2 when energy-adjusted DHA intake was used compared to 60% when unadjusted or fat-adjusted DHA was used. In both energy- and fat-adjusted DHA, 79% of participants grouped in the same Tertile 3 compared to 74% when unadjusted DHA was used (Figure 4.6). From diet only, 22.4% of participants met the European Union (EU) consensus recommendation of DHA daily intake of 200 mg using the interview method and 22.4% using the online method. In other words, 4 participants had different results between the two intake methods for whether they met DHA recommendation. Main source of discrepancy between the two methods in estimating n-3 In order to determine why n-3 intake estimates of validation study participants differed between the two methods, the food item description and portions of the participants with the highest difference in total n-3 intake were cross checked. Intakes of twelve participants who had estimate difference ranging between mg (as compared other participants with differences of 220 mg and less) were checked. Ten out of the twelve participants had significant difference in the reported portion sizes between the two methods, six of which had underreported tuna intake in the online as compared to the interview recall method. For example, a participant reported consuming 1 can of tuna 57
74 (172 g) in the interview recall but 1 serving (50 g) online. Overestimation resulted when two participants overestimated salmon intakes, one reported having 50 g of tuna sandwich in the online but 0.5 can (86 g) of tuna in the interview, and another participant reported halibut intake on the online but haddock on the interview, as haddock was not specifically identified as a type of white fish in the online food list. Of note, the six participants with the highest difference in the total n-3 met DHA requirement (200 mg/day) using both methods, even with the reported portion size differences. 58
75 Figure 4.1 Bland-Altman plots to examine agreement and bias between interview and online 24-hr recall methods for A) unadjusted total n-3, B) energy-adjusted total n-3 and C) fat-adjusted total n-3 LCPUFA intake 1 A) (913) Mean (43) (-827) 1 Mean intake on the x-axis is a mean of the two methods for each subject. A mean difference of 0 on the y-axis indicates that the two methods are in perfect agreement 59
76 B) (569) Mean (37) (-496) 1 Mean intake on the x-axis is a mean of the two methods for each subject. A mean difference of 0 on the y-axis indicates that the two methods are in perfect agreement C) (2593) Mean (235) (-2123) 1 Mean intake on the x-axis is a mean of the two methods for each subject. A mean difference of 0 on the y-axis indicates that the two methods are in perfect agreement 60
77 Figure 4.2 Scatterplot and regression analysis 1 between interview and online recall methods for A) unadjusted total n-3, B) energy-adjusted total n-3 and C) fat-adjusted total n-3 LCPUFA intake A) 1 Pearson correlation coefficient (r). P-value calculated from Pearson correlation between interview and online methods 61
78 B) 1 Pearson correlation coefficient (r). P-value calculated from Pearson correlation between interview and online methods 62
79 % of participants consistent between methods C) 1 Pearson correlation coefficient (r). P-value calculated from Pearson correlation between interview and online methods Figure 4.3 Percentage of participants consistently grouped into same tertiles 1 of total n-3, energy-adjusted n-3 and fat-adjusted n-3 intake from the diet between interview and online dietary recall methods Tertile 1 Tertile 2 Tertile 3 Unadjusted total n-3 Energy-adjusted total n-3 Fat-adjusted total n-3 1 Participants were grouped into tertiles based on total n-3 intake (Tertile 1 to Tertile 3). The number of participants who stayed in the same tertile was calculated using the formula: (online method/interview method) *100 63
80 Figure 4.4 Bland-Altman plots to examine agreement and bias between interview and online 24-hr recall methods for DHA, energy-adjusted DHA and fat-adjusted DHA 1 A) (638) Mean (47) (-545) 1 Mean intake on the x-axis is a mean of the two methods for each subject. A mean difference of 0 on the y-axis indicates that the two methods are in perfect agreement 64
81 B) (409) Mean (34) (-341) 1 Mean intake on the x-axis is a mean of the two methods for each subject. A mean difference of 0 on the y-axis indicates that the two methods are in perfect agreement C) (1933) Mean (197) (1539) 1 Mean intake on the x-axis is a mean of the two methods for each subject. A mean difference of 0 on the y-axis indicates that the two methods are in perfect agreement 65
82 Figure 4.5 Scatterplot and regression analysis 1 between interview and online recall methods for A) unadjusted DHA, B) energy-adjusted DHA and C) fat-adjusted DHA intake A) 1 Pearson correlation coefficient (r). P-value calculated from Pearson correlation between interview and online methods 66
83 B) 1 Pearson correlation coefficient (r). P-value calculated from Pearson correlation between interview and online methods C) 1 Pearson correlation coefficient (r). P-value calculated from Pearson correlation between interview and online methods 67
84 % of participants consistent between methods Figure 4.6 Percentage of participants consistently grouped into same tertiles 1 of DHA, energy-adjusted DHA and fat-adjusted DHA intake from the diet between interview and online dietary recall methods Tertile 1 Tertile 2 Tertile 3 Unadjusted DHA Energy-adjusted DHA Fat-adjusted DHA 1 Participants were grouped into tertiles based on docosahexaenoic acid (DHA) intake (Tertile 1 to Tertile 3). The number of participants who stayed in the same tertile was calculated using the formula: (online method/interview method) *10 68
85 Table 4.3 Intake of n-3 LCPUFA as estimated by online and interview 24-hr recalls in Dietary Method Validation Study (n=58) Interview 95% CI Online 95% CI Mean (Mean or Median (Mean or Median ±SD) (IQR) 1 ±SD) (IQR) 1 difference 2 P-value 3 Correlation (r) 4 P-value 5 Energy (kcal) 1982± ± ± <0.001* Energy from fat (kcal) 605± ± ± <0.001* EPA (mg/day) 77±145 7 (0-49) 78±167 7 (0-99) -1± <0.001* Energy-adjusted EPA (mg/1000 kcal) 45±89 4 (0-34) 41±84 4 (0-52) 3± <0.001* Fat-adjusted EPA (mg/1000 kcal from fat) 204± (0-116) 168± (0-141) 36± <0.001* DPA (mg/day) 29±50 13 (4-26) 31±70 15 (1-23) -3± <0.001* Energy-adjusted DPA (mg/1000 kcal) 16±28 7 (2-19) 16±34 7 (0-13) 0± <0.001* Fat-adjusted DPA (mg/1000 kcal from fat) 61± (6-63) 59± (1-41) 1± * <0.001* DHA (mg/day) 201± (4-139) 155± (1-90) 47± <0.001* Energy-adjusted DHA (mg/1000 kcal) 118± (2-69) 84± (0-83) 34± <0.001* Fat-adjusted DHA (mg/1000 kcal from fat) 538± (8-232) 341± (1-188) 197± <0.001* Total n-3 LCPUFA (mg/day) 307± (9-234) 264± (2-208) 43± <0.001* Energy-adjusted total n-3 (mg/1000 kcal) 178± (5-137) 141± (1-146) 37± <0.001* Fat-adjusted total n-3 (mg/1000 kcal from fat) 802± (18-463) 1 IQR, interquartile range 2 Mean difference between methods= Interview-Online ± (3-387) 235± <0.001* 69
86 3 P-value was calculated using paired t-test or non-parametric tests to examine the difference between interview and online methods 4 r, Pearson s (for parametric) or Spearman s (for non-parametric data) correlation coefficients 5 P-value was calculated from Pearson s or Spearman s correlation between interview and online methods *indicates significant results (p<0.05) Abbreviations: DHA, docosahexaenoic acid; DPA, docosapentaenoic acid; EPA, eicosapentaenoic acid Summary and recommendations The online method mainly underestimated intakes of total n-3 LCPUFA and DHA. The Bland-Altman plots showed less bias and more agreement in the unadjusted estimates of total n-3 LCPUFA and DHA compared to the energy- and fat-adjusted estimates. There was only a slightly stronger correlation between the methods when fat-adjusted total n-3 and DHA intakes were used as compared to the unadjusted estimates. When total n-3 LCPUFA and DHA estimates were stratified by tertiles of dietary intake, only a small difference (0-5%) was found between the adjusted and unadjusted estimates. The major cause of discrepancy between the two recall methods was the underreported portion sizes (mainly of tuna) in the online as compared to the interview method. As the main source of n-3 intake is seafood, even with the significance difference in the reported portions sizes, the correlation between the methods was high, and most participants who had higher n-3 intake foods tended to fall in the highest quartile, while the ones who had low n-3 foods fell in the lowest quartile, regardless of intake recall method. To combine the two methods, the use of unadjusted intake of total n-3 and DHA is recommended over the adjusted estimates due to less bias observed, but caution is advised as the intakes from the online recalls may be underestimated, especially that tuna is a main source of n- 3 LCPUFA in APrON study (Jia et al., 2015). Also, the population pool of the validation study was different from the APrON population, as they were non-pregnant females of child-bearing age (16-40 years), which may limit the direct comparability between the intake results of the two 70
87 studies. If combining the two methods, the best strategy would be to stratify the intake estimates into tertiles and compare participants with the highest and lowest tertiles of intakes (using unadjusted or energy- adjusted intakes). Categorizing women as meeting or not meeting DHA recommendation (200 mg) also lead to comparable results in the two methods Maternal dietary intake of n-3 LCPUFA intake during pregnancy and at three months postpartum The number of available dietary intakes is listed in the methods chapter (Table 3.1). Of note, not all women provided dietary intake information at all time points and the majority of women entered the APrON study at the second trimester. The intake of APrON participants is described in Table 4.4. The median intake of all macronutrients fell within the Accepted Macronutrient Distribution Range recommended by the IOM. Estimated daily intake of EPA, DPA, DHA and their total intake from the diet, during pregnancy and at three months postpartum based on dietary recall method in the APrON cohort are presented in Appendix II, Table A.1. The median daily intake of AA was 100 mg at all time points. The median total intake of DHA (food plus supplements) ranged from mg/day. Total estimated DHA intake was only significantly different between the second and third trimesters. At none of the four time points did the median DHA intake meet the EU consensus recommendation (Table 4.5). Between 23 and 26% of women met the EU consensus recommendation of 200 mg DHA daily at each of the four time points (Figure 4.7). When considering the dietary intake of DHA in the absence of supplements, a significant change in DHA was identified only between the second and third trimesters (p=0.01). The proportion of women reporting use of a DHA containing supplement at the four time points were 18%, 21%, 26%, 22%, respectively (Table 4.6). 71
88 Table 4.4 Estimated daily dietary intakes of energy, macronutrients and n-3 LCPUFA during 3 trimesters of pregnancy and at three months postpartum in the APrON study 1 Nutrient First trimester (n=233) Second trimester (n=980) Third trimester (n=868) 3 Months postpartum (n=811) AA mg 102±114 (100a 2, 0-200) 104±163 (100a, 0-100) 111±164 (100a, 0-100) 115±189 (100a 0-200) DHA mg 157±320 (37ab 3, 6-144) 186±441 (30a, 5-163) 212±444 (35b, 6-206) 192±402 (34ab, 5-200) EPA mg 135±338 (10, 2-100) 135±326 (9, 2-106) 158±342 (10, 2-180) 146±331 (10, 2-135) DPA mg 24±52 (12, 6-22) 32±91 (12, 6-22) 36±88 (13, 6-23) 34±79 (14, 6-24) N-3 LCPUFA mg % of energy % of fat 316±654 (72, ) 0.15±0.34 (0.03, ) 0.52±1.08 (0.09, ) 352±786 (59, ) 0.16±0.34 (0.02, ) 0.59±1.57 (0.08, ) Energy kcal 2071± ±626 (2165, ) Carbohydrate g % of energy Protein g % of energy Fat (total) g % of energy SFA g % of energy 279±90 (270, ) 54±10 90±32 (86, ) 17±5 (17, 14-20) 72±30 (68, 47-88) 31±8 24±12 (22, 16-32) 10±4 304±94 (296, ) 55±9 (56, 50-61) 90±31 (87, ) 17±4 (16, 14-19) 75±32 (72, 53-96) 30±8 27±13 (25, 17-34) 11±4 (10, 8-13) 406±808 (66, ) 0.18±0.38 (0.03, ) 0.64±1.47 (0.1, ) 2260±614 (2217, ) 312±91 (305, ) 56±9 92±32 (89, ) 17±4 (16, 14-19) 77±33 (74, 53-95) 30±8 27±13 (25, 18-34) 11±4 (10, 8-13) 371±753 (68, ) 0.17±0.35 (0.03, ) 0.55±1.14 (0.10, ) 2089±627 (2049, ) 272±92 (265, ) 52±10 88±31 (84, ) 17±5 (17, 14-20) 74±33 (69, 50-96) 32±9 26±13 (23, 16-33) 11±4 (11, 8-13) 72
89 % of fat 34±8 35±8 (35, 29-41) 35±8 34±9 MUFA g % of energy % of fat 25±13 (23, 16-31) 11±4 (10, 8-13) 35±7 26±12 (25, 17-33) 11±4 (10, 8-13) 35±7 (35, 31-38) 27±14 (25, 17-34) 11±4 (10, 8-13) 35±6 (35, 30-39) 27±14 (25, 17-35) 12±4 (11, 8-14) 36±7 1 Data are presented as mean ± SD. For non-parametric measures, median and inter-quartile range are in parenthesis (median, 25th percentile-75th percentile) 2 Within a row a value that does not share a letter in a common row is significantly differences (p<0.05). Because of missing data, the number of cases available for analysis differed between the time points. For analysis, the 1 st vs. 2 nd trimester n=106; 2 nd vs. 3 rd trimester, n=486; 3 rd trimester vs. postpartum, n=462; 2 nd trimester vs. postpartum, n=474; the 1 st trimester vs. 3 rd trimester, n=102; the 1 st trimester vs. postpartum, n=94. 3 Within a row a value that does not share a letter in a common row is significantly differences (p<0.05). For analysis, the 1 st vs. 2 nd trimester n=204; 2 nd vs. 3 rd trimester, n=848; 3 rd trimester vs. postpartum, n=781; 2 nd trimester vs. postpartum, n=794; the 1 st trimester vs. 3 rd trimester, n=196; the 1 st trimester vs. postpartum, n=177. Abbreviations: AA, arachidonic acid; DHA, docosahexaenoic acid; DPA, docosapentaenoic acid; EPA, eicosapentaenoic acid; LCPUFA, long chain polyunsaturated fatty acids; MUFA, monounsaturated fatty acids; SFA, saturated fatty acids Table 4.5 The number of APrON participants with total DHA intake (from diet + supplement) below 200 mg First Trimester Second Trimester Third Trimester Postpartum Number of participants with DHA intake estimate below 200 mg Total number of participants Table 4.6 The number of APrON participants with supplement intake of at least 100 mg/day First Second Trimester Trimester Third Trimester Postpartum Number of participants with supplement intake of at least 100 mg/day Total number of participants
90 Figure 4.7 Proportion of APrON participants not meeting the 200 mg recommendation during pregnancy and postpartum 100% 90% 80% 70% 60% 50% 40% Above 200mg Below 200mg 30% 20% 10% 0% 4.3 Change in maternal essential fatty acid status during pregnancy and postpartum 1st Trimester (n=238) The maternal fatty acid composition for APrON participants (n=1214) at each trimester and once postpartum are presented in Table 4.7. The number of samples available for analysis differed at each time point and only 103 women had samples available for analysis at all four time points. Repeated measure tests revealed that the absolute (µg/ml) concentrations of both DHA and AA increased significantly across pregnancy and decreased postpartum (Wilcoxon signed-rank test, p<0.001 for all). However, the DHA levels were significantly lower postpartum than the first trimester levels, but AA levels postpartum were comparable to the first trimester levels (Figure 4.8). The proportion of DHA followed the same pattern of change across pregnancy and postpartum (Wilcoxon signed-rank test, p<0.001 for all). Differences in the proportions of AA between time points were very small and unlikely to be of biological importance (Figure 4.9). 2nd Trimester (n=999) 3rd Trimester (n=882) 74 Postpartum (n=827)
91 Table 4.7 Maternal serum PL fatty acid profile (in absolute concentrations and relative percentages) at each trimester and three months postpartum Fatty Acid First trimester (n=280) Second trimester (n=1059) Third trimester (n=713) 3 Months postpartum (n=908) AA % µg/ml DHA % µg/ml EPA % µg/ml DPA % µg/ml N-6 % µg/ml N-3 % µg/ml PUFA % µg/ml MUFA % SFA % µg/ml 7.8± ±56 (128, ) 2.7±1.1 46±24 (43, 28-58) 0.6±0.4 (0.5, ) 10±7 (8, 5-12) 0.6±0.3 (0.5, ) 10±5 (9, 6-12) 30.3±4.3 (30.4, ) 507±179 (470, ) 5.1±1.7 (5.0, ) 84±37 (80, ) 35.3±4.8 (36.1, ) 591±202 (559, ) 14.8±1.8(14.7, ) 247±79(238, ) 7.6± ±59 (142, ) 3.0±1.2 (3.0, ) 59±30 (56, 36-78) 0.5±0.4 (0.4, ) 10±8 (8, 5-12) 0.5±0.2 (0.5, ) 11±5 (9, 6-13) 30.4±4.1 (31.0, ) 588±193(573, ) 5.3±1.8 (5.1, ) 101±44 (97, ) 35.7±4.6 (36.6, ) 689±221(674, ) 15.1±1.8 (15.0, ) 291±95(277, ) 7.7± ±53 (174, ) 3.6±1.1 82±32 (79, ) 0.6±0.5 (0.4, ) 13±11 (10, 7-15) 0.6±0.2 (0.5, ) 13±6 (12, 9-15) 31.4±3.2 (31.7, ) 724±189 (720, ) 6.0±2.4 (5.4, ) 133±53 (128, ) 37.4±3.6 (38.2, ) 857± ±1.9 (15.1, ) 352±96 (348, ) 7.9± ±56 (129, ) 2±0.9 (1.9, ) 35±20 (31, 19-47) 0.9±0.6 (0.7, ) 15±10 (12, 8-19) 0.6±0.2 (0.6, ) 11±5 (10, 7-15) 32.0±4.2 (32.7, ) 545±178 (530, ) 4.6±1.5 (4.5, ) 78±33 (72, 55-97) 36.7±4.5 (37.8, ) 623±198(605, ) 14.6±1.7 (14.5, ) 246±76 (236, ) µg/ml 48.9±4.3(48.1, ) 801 ±202 (786, ) 48.5±4.1 (47.9, ) 918±227 (897, ) 46.8±3.5 (46.3, ) 1066±229 Data are presented as mean ± SD. For skewed data, median and inter-quartile range (IQR) are in parenthesis (median, IQR) Abbreviations: AA, arachidonic acid; DHA, docosahexaenoic acid; DPA, docosapentaenoic acid; EPA, eicosapentaenoic acid; MUFA, monounsaturated fatty acids; PUFA, polyunsaturated fatty acids; SFA, saturated fatty acids 48.1±4.1 (47.4, ) 798±196 (785, ) 75
92 Figure 4.8 Change in median concentration of DHA and AA in maternal serum PL during 3 trimesters of pregnancy and at three months postpartum A) 76
93 B) Figure 4.8 The concentrations of A) docosahexaenoic acid (DHA) and B) arachidonic acid (AA) in maternal serum PL in each trimester and at three months postpartum. At each time point, medians that do not share a common letter are significantly different (p<0.001 using Wilcoxon signed-rank tests). For analysis, the 1 st vs. 2 nd trimester, n=238; 2 nd vs. 3 rd trimester, n=606; 3 rd trimester vs. postpartum, n=525; 2 nd trimester vs. postpartum, n=786; the 1 st trimester vs. 3 rd trimester, n=141; the 1 st trimester vs. postpartum, n=
94 Figure 4.9 Change in median proportion of maternal serum PL DHA and AA during 3 trimesters of pregnancy and at three months postpartum in the APrON study 78
95 B) Figure 4.9 The proportion of A) docosahexaenoic acid (DHA) and B) arachidonic acid (AA) in maternal serum PL in each trimester and at three months postpartum. At each time point, medians that do not share a common letter are significantly different (p<0.05 using Wilcoxon signed-rank tests). For analysis, the 1 st vs. 2 nd trimester, n=239; 2 nd vs. 3 rd trimester, n=607; 3 rd trimester vs. postpartum, n=527; 2 nd trimester vs. postpartum, n=802; the 1 st trimester vs. 3 rd trimester, n=141; the 1 st trimester vs. postpartum, n= Relationship of maternal diet and status of DHA and AA at three months postpartum Using univariate linear regression analysis (Appendix II, Table A.3) there was no relationship between postpartum dietary intake of AA and the maternal status of AA in concentration (p=0.995, n=433) or proportion (p=658, n=434). Regression analysis (Appendix II, Table A.4) revealed a positive relationship (p<0.001, n=532) between dietary intake of DHA 79
96 (up to 1000 mg) and DHA absolute (line slope: 0.018) and relative (line slope: 0.001) concentrations in serum PL and is illustrated in the scatter plots in Figure Figure 4.10 The relationship between postpartum dietary intake of DHA and A) absolute concentration and B) relative proportions of maternal serum PL in the APrON study A) 80
97 B) 4.5 Breast milk fatty acid pattern at the third month of lactation At three months of age, the majority of infants in the APrON study were being breastfed as only 16 women (1%) reported exclusive formula feeding. The breast milk relative content of AA and DHA is described in Table 4.8, stratified by the method of breastfeeding (exclusive breastfeeding versus mixed feeding (combined formula and breastfeeding). There was no significant difference (p>0.05) between the two groups in the breast milk content of AA, DHA, total n-6, total n-3, PUFA, MUFA or SFA. The median AA for the total analyzed samples was 0.8% (IQR: %) and median DHA was 0.2% (IQR: %). The complete breast milk 81
98 fatty acid profile (%wt/wt) at the third month of lactation (n=1038) can be found in Table A1 (Appendix II). Table 4.8 Breast milk fatty acid composition (as a relative wt/wt proportions) at the third month of lactation of a subset of APrON participants (n=1038), separated by method of feeding 1,2 Fatty acid in All methods 3 Exclusive breast Mixed feeding 4 breast milk feeding n Mean % (w/w) ±SD (median, 25 th -75 th percentile) AA 1.2±1 (0.8, ) 1.0±0.9 (0.7, ) 1.1±0.9 (0.8, ) DHA 0.3±0.3 (0.2, ) 0.3±0.3 (1.8, ) 0.3±0.2 (0.2, ) AA/DHA 6.8±8.6 (4.1, ) 6.8±9.6 (3.6, ) 6.0±6.1 (3.9, ) Total n ± ± ±3.4 Total n ±1 (2.2, ) 2.3±1.0 (2.2, ) 2.3±0.8 (2.2, ) N6/N3 7.3±2.4 (7.0, ) 7.3±2.4 (6.9, ) 7.2±2.6 (6.8, ) PUFA 17.9±4 17.6± ±3.9 MUFA 44.2± ± ±4.7 SFA 37.9±6 38.4± ±6.2 1 Values are expressed as mean ± SD. For skewed data, (median, 25 th percentile-75 th percentile) are added 2 No statistical significance was found between the two groups of mothers for any of the fatty acids described in this table (Mann-Whitney U Test/T-test p>0.05) 3 All includes exclusive breast feeding, mixed feeding (breast feeding and formula feeding) and mothers with missing information on the feeding method but where a breast milk sample had been obtained 4 Mixed feeding is mothers who provided a breast milk sample and reported some formula feeding 5 Total n6: sum of proportions of C18:2n6+C20:2n6+C20:3n6+C20:4n6(AA)+C22:5n6 6 Total n3: sum of proportions of C18:3n3+C20:5n3+22:5n3+C22:6n3(DHA) Abbreviations: AA, arachidonic acid; DHA, docosahexaenoic acid; MUFA, monounsaturated fatty acids; PUFA, polyunsaturated fatty acids; SFA, saturated fatty acids 82
99 Figure 4.11 Pie graph of breast milk fatty acid composition (n=1038) SFA 38±6% PUFA 18±4% 1.2±1% AA MUFA 44±4% 0.3±0.3% DHA Figure 4.11 Major fatty acid composition of breast milk (n=1038) presented as mean ± standard deviation (SD). Abbreviations: AA, arachidonic acid; DHA, docosahexaenoic acid; MUFA, monounsaturated fatty acids; PUFA, polyunsaturated fatty acids; SFA, saturated fatty acids 4.6 Relationship of breast milk composition and three-month postpartum maternal intake and status of DHA and AA Spearman s non-parametric correlation coefficients found for DHA and AA in breast milk with diet and status of these two fatty acids is presented in Table 4.9. The estimated dietary intake of DHA but not AA at three months postpartum was significantly positively related to DHA and AA in breast milk. DHA in the serum (both as a concentration and a relative percent) was positively related to its levels in breast milk, whereas AA in serum was negatively related to its levels in breast milk and positively related to DHA proportion in breast milk. 83
100 Table 4.9 The correlations between intake or status of DHA and AA postpartum and DHA and AA in breast milk Independent variable (available AA in breast milk DHA in breast Milk n1, available n2) r P-value r P-value AA intake postpartum (n=349, n=378) * DHA intake postpartum (n=560, n=589) <0.001* AA in serum PL (w/w%) postpartum (n=564, n=593) <0.001* AA in serum PL (µg/ml) postpartum (n=557, n=586) <0.001* DHA in serum PL (w/w%) postpartum (n=564, n=593) <0.001* <0.001* DHA in serum PL (µg/ml) postpartum (n=557, n=586) <0.001* <0.001* *indicates significant results (p<0.05) Univariate regression analysis (Appendix II, Table A.5) (n=580) of DHA proportion in breast milk and DHA intake (up to 2000 mg/day) had a regression coefficient R 2 =0.103 (p<0.001). Using the line equation (Y= E-4*X), a DHA concentration in breast milk ( % w/w) can be achieved by mg of daily intake of DHA postpartum. The univariate regression analysis and distribution of supplement and non-supplement users (supplement users with at least 100 mg/day of supplement) with intakes up to 2000 mg/day is presented in Figure
101 Figure 4.12 Scatter plot and regression analysis of DHA in breast milk and dietary intake of DHA (up to 2000 mg/day) Univariate analysis (Appendix II, Table A.6) of DHA in breast milk and DHA in serum is illustrated in Figure 4.13 A) as a concentration (µg/ml) (R 2 =0.034, p<0.001, n=585), slope of the line: and B) as a proportion (wt/wt%) (R 2 =0.061, p<0.001, n=592), line slope: Using the line equations (Y= E-3*X and Y= *X), reaching a DHA in breast milk at 0.30% w/w can be achieved by having at least 54 µg/ml or 2.7% of DHA in serum PL postpartum. 85
102 Figure 4.13 Scatter plot and regression analysis of DHA in breast milk and maternal status of DHA as a A) concentration (µg/ml) and B) as a proportion (wt/wt%) A) 86
103 B) 4.7 Infant sleep and crying Parent reported duration of infant sleep (n=785) and duration of crying (n=839) at three months of age and whether they considered either of these to be problems is presented in Table The total reported sleep duration ranged from min/day with a mean of 849±140 min/day, and cry ranged from min/day (mean: 107±92 min/day). The majority of parents did not report infant sleep (81%) or crying (85%) to be a problem. Most infants were put to sleep on their backs (86%), and they were put in infant cribs in a separate room (37%) or in parents room (38%). The majority of women (62%) reported 0 periods of persistent crying per week. 87
104 Table 4.10 The sleeping arrangements and reported durations of infant sleep and crying as a day and night total in 24 hours at three months of age and whether parents consider them problems Infant outcome (n) 1 Mean ±SD Total duration of sleep in 24hr, min (770) 849±140 Total duration of cry in 24hr, min (813) 107±92 n (%) Sleep position On his/her side 70 (9) On his/her belly 39 (5) On his/her back 676 (86) Sleep arrangement Infant crib in a separate room Infant crib in parent's room In parent's bed Infant crib in room with sibling Other Parents reporting sleep is a problem Not a problem at all Somewhat of a problem A serious problem Number of periods of persistent crying per week Parents reporting crying is a problem Not a problem at all Somewhat of a problem 292 (37) 300 (38) 108 (14) 9 (1) 76 (10) 632 (81) 143 (18) 9 (1) 517 (62) 283 (34) 37 (4) 716 (85) 122 (15) 1 (<1) A serious problem 1 Periods of persistent crying in a week were defined as continuous crying for half an hour or more, in each of the morning, afternoon, evening or night. They were summed to provide an estimate of total weekly periods 4.8 Relationship of breast milk content DHA and AA postpartum and infant sleep at three months of age Relationship of breast milk content DHA and AA postpartum and parent-reported duration of infant sleep at three months of age Univariate regression analysis (Appendix II, Table A.7) of parent-reported total daily duration of infant sleep (min) with each of DHA, AA and the ratio of AA:DHA in breast milk in exclusively breast-fed infants showed no significant results (p=0.68, 0.12 and 0.65, respectively). 88
105 The covariates tested for confounding (where cases where excluded pair-wise) were: maternal age, parity/gravidity, smoking during pregnancy, alcohol intake during pregnancy, delivery kind, fertility treatment, pregnancy complications, gestational age at delivery and whether infants were full term, method of infant feeding, pre-pregnancy BMI/classification, weight gain during pregnancy/classification, maternal depression score, household income, maternal education, ethnicity, sleep arrangement, sleep position, birth anthropometrics, Apgar score at 5 min and infant sex). However, only parity had a significant effect in the model. Longer duration of sleep was reported by participants that had more children. When DHA, AA and AA:DHA in breast milk were used in the multiple linear regression models (Appendix II, Table A.8), nonsignificant effects were found (p=0.82, p=0.18 and p=0.66, respectively), but parity remained significant. Infants of women with a larger number of children reported higher duration of sleep in their infants Relationship of breast milk content DHA and AA postpartum and whether parents reported their infants sleep to be a problem Using nonparametric tests, no significant differences were identified between the three groups that reported their infants sleep to be not a problem, somewhat a problem or a serious problem in terms of each of their DHA in breast milk, AA in breast milk, or AA:DHA ratio (Kruskal-Wallis Test, p=0.83 and n=632, p=0.87 and n=612, p=0.93 and n=762, respectively). The lack of a difference did not change when the two groups that considered their infants sleep to be somewhat a problem or a serious problem were combined, and the results also did not change when only exclusive breastfed infants were included in the analysis. 89
106 4.8.3 Relationship of breast milk content DHA and AA postpartum and parent-reported duration of infant cry at three months of age Univariate regression analysis (Appendix II, Table A.9) of parent reported total daily duration of infant crying (min) with each of DHA (n=435), AA (n=426) and AA:DHA (n=426) in breast milk revealed no significant results (p=0.38, p=0.39 and p=0.79, respectively). After correcting for major covariates, the multiple regression analysis (Appendix II, Table A.10) of DHA, AA and AA:DHA in breast milk and infant duration of cry were still not significant. However, parity, the EPDS score and delivery mode were significant in the model (p<0.05). Women with higher number of children and lower EPDS scores reported shorter durations of daily infant cry Relationship of breast milk content DHA and AA postpartum and whether parents reported their infants cry to be a problem Using nonparametric tests, no significant differences were identified amongst the three groups that reported their infants cry to not be a problem, somewhat a problem or a serious problem in breast milk DHA or AA content, or AA:DHA ratio (Kruskal-Wallis Test, p=0.38 and n=697; p=0.27 and n=697; p=0.36 and n=716, respectively). These results did not change when the two groups that considered their infants crying to be somewhat a problem or a serious problem were combined, and the results also did not change when only exclusive breastfed infants were included in the analysis Relationship of breast milk content DHA and AA postpartum and the reported number of weekly periods of infant persistent cry When the number of weekly periods of persistent infant crying in exclusively breastfed infants was grouped into: none (n=440), 1-7 (n=146) and 8-25 (n=21) periods, non- 90
107 parametric test revealed no significant results among the groups in DHA in breast milk (Kruskal- Wallis Test, p=0.07) or AA:DHA ratio (p=068), but there was a significant difference in AA content in breast milk (p=0.048). Post-hoc analysis revealed that AA in breast milk was significantly different between the group of 1-7 and group of 8-25 weekly periods of crying (Mann-Whitney U test: p=0.022) but not between the group of no reported periods (n=273) and each of the other two groups (p=0.07 and p=0.16). The group with the highest number of periods of persistent infant crying had higher AA in breast milk. The group of 8-25 periods (n=21) had median (IQR) AA of 1.4% ( ) whereas the group of 1-7 periods (n=146) had median AA of 1.0% ( ). However, the group of mothers that reported 8-25 periods had also higher depression scores than the group with 1-7 periods. All major covariates were tested for confounding including: pregnancy complications, parity, ethnicity, socioeconomic status, prepregnancy BMI/classification, gestational weight gain/classification, Apgar score, delivery type, smoking, gestational age at birth and birth anthropometrics. Only maternal depression score was significant in the final model (p=0.005). Logistic regression of the two groups of persistent crying (group of 1-7 periods, n=137; group of 8-25 periods, n=19) revealed that AA in breast milk was not (p=0.097) a significant predictor after controlling for maternal depression score in addition to maternal age and infant sex in the final model (Appendix II, Table A.11). 91
108 Chapter 5: Summary and Discussion 5.1 Summary In summary, in this cohort of high socioeconomic status, the majority of women (~75%) did not meet the DHA recommendation of 200 mg/day at any time point during pregnancy or at three months postpartum. The serum concentrations of both DHA and AA increased during pregnancy and decreased postpartum and the relative percent of DHA followed the same pattern. The DHA proportion of fatty acids in breast milk (median: 0.2%, IQR: %) was found to be lower than the reported global average, while AA (median: 0.8%, IQR: %) was found to be higher. Breast milk content of DHA was significantly correlated to postpartum DHA concentrations in the serum and estimated DHA intake, while the proportion of AA was correlated to the serum concentration but not to dietary intake. Using the data in this study, achieving an ideal breast milk concentration range ( %) requires a dietary intake of DHA of: mg/day or a maternal PL fatty acid status of DHA: at least 45 µg/ml or at least 2.7% (w/w) of total serum PL fatty acids. No relationships were found between DHA or AA in breast milk and infant sleep and crying outcomes. DHA status is not optimal in this cohort of healthy women and we have identified dietary intake and maternal status reference that could be useful as a target for dietary interventions to optimize the concentration of DHA in breast milk. 5.2 Discussion Research objectives and main findings The goal of this research was to use the APrON cohort to describe the maternal intake and status of DHA and AA across the three trimesters of pregnancy as well as three months 92
109 postpartum, their levels in breast milk and the associations with infant sleep and crying at three months postpartum. This goal addressed several objectives: 1. To describe the maternal dietary intake of DHA and AA across the three trimesters of pregnancy, as well as at three months postpartum The Dietary Method Validation Study concluded that the online method underestimated intake of DHA compared to the face-to-face recalls by 47±302 mg. However, when looking at meeting or not meeting DHA recommendation (200 mg) or stratifying the intake estimates into tertiles and comparing participants with the highest and lowest tertiles of intakes (using unadjusted or energy- adjusted intakes), the methods were comparable. This should be used in future studies that include intake from both of the methods. The median maternal total intake of DHA from diet (using the face-to-face method) and supplement across the four time points ranged from mg/day, and increased significantly only between the second and third trimester. Only 23-26% of the women in the cohort met the 200 mg recommendation at each time point. The median intake estimate of AA was 100 mg at all time points and did not significantly change across pregnancy and lactation. 2. To describe the maternal status of DHA and AA across the three trimesters of pregnancy as well as at three months postpartum The absolute (µg/ml) and relative (wt/wt%) concentrations of DHA progressively increased across pregnancy, and decreased postpartum (p<0.001). DHA status postpartum fell to levels below the first trimester. The absolute concentration of AA also increased progressively during pregnancy and decreased postpartum (p<0.001). Postpartum, AA decreased from the third trimester but to levels comparable with the first trimester. The 93
110 difference in the proportions of AA between time points were very small and unlikely to be of biological importance, and the proportions postpartum were comparable with the first trimester proportions. 3. To determine the relationship between postpartum dietary intake of DHA and AA and the maternal status of these fatty acids Dietary intake of DHA was positively associated with maternal status of DHA. No relationship was found between postpartum dietary intake of AA and status of AA. 4. To describe the breast milk content of DHA and AA At the third month of lactation, the median proportions of DHA and AA were 0.2% and 0.8%, respectively. DHA in breast milk was lower while AA higher than global averages. 5. To define the relationship between DHA and AA in maternal diet, status and breast milk concentration at three months postpartum Postpartum dietary intake of AA was not related to AA in breast milk. Maternal status of AA, however, was negatively associated with AA concentration in breast milk. Dietary intake and status of DHA was positively related to DHA in breast milk. A DHA concentration in breast milk ( % w/w) could be achieved by mg/day intake of DHA postpartum or by achieving at least 54 μg/ml or 2.7% w/w DHA in serum PL. 6. To determine the relationship of breast milk content of DHA and AA and infant sleep and crying at three months postpartum after controlling for major covariates There was no relationship between DHA, AA or ratio of AA:DHA in breast milk and the total duration of infant sleep and crying after controlling for major covariates. No difference in DHA, AA or DHA:AA content in breast milk was found among the groups of infants that were reported to have either sleeping or crying to be not a problem, somewhat 94
111 a problem, or a serious problem. Neither DHA nor AA:DHA in breast milk was significantly different between the groups of infants that were reported to have different numbers of weekly periods of persistent crying. There was no difference in AA concentration in breast milk amongst the infants whose parents reported more excessive crying periods (8-25 weekly periods) than infants reported to cry less (1-7 weekly periods) after controlling for major covariates Maternal dietary intake and serum phospholipid status of AA and DHA across pregnancy and at three months postpartum The median daily dietary intake of AA in this study was estimated at 100 mg at all time points which was comparable to the reported estimate of 106 mg/day in Connecticut, the United States (Wijendran et al., 1999), mg/day in (Stark et al., 2005) and 99 mg/day in Guelph, Canada (Denomme et al., 2005), but lower than 121 mg/day estimated in an earlier study in Vancouver, Canada (Innis & Elias, 2003). Although it was much higher than the daily intake estimate of Dutch pregnant women of mg (Otto et al., 2001), the authors identified that the Dutch food composition table used did not contain information on the amounts of AA in red meat. No study was found to estimate the change in dietary intake of AA across pregnancy and postpartum. In this study, no relationship between dietary intake of AA and maternal serum phospholipid status of AA was found, consistent with the Canadian study by Innis & Elias (2003). This may be explained by the high intake and conversion of LA to AA. The maternal serum PL status of AA in pregnancy and postpartum as a concentration was higher than previously reported by Al et al. (1995) and Rump et al. (2002) in the Netherlands and Wijendran et al. (1999) in Connecticut, United States, as well as the concentrations in Finland, Ecuador and England (Otto et al., 1997), but lower than the concentrations in Hungary and the 95
112 Netherlands (Otto et al., 1997), and lower than the study by Stark et al. (2005) in the Michigan, United States. As a proportion of serum PL, our results were lower than the proportions by in several Dutch studies (Al et al., 1995; Dirix et al., 2009; Jochems et al., 2015; Otto et al., 2001a), but higher than the proportions reported by Meher et al. (2016) in India and Stark et al. (2005) in Michigan, United States. Of note, the majority of studies only included women who had normal pregnancies and full-term infants, whereas our analysis included all available data (~7% had low birth weight infants). This could contribute to our high median status of AA, as mothers of low birth weight infants were reported to have higher serum AA at wk of gestation compared to normal birth weight infants (Meher et al., 2016). Additionally, the intake of animal products and high LA oils could influence the status of AA due to hepatic conversion of LA to AA. The estimated mean consumption of LA was reported previously in the APrON study at ~11 g (Jia et al., 2015), which was similar to results by Wijendran et al. (1999), but lower than intake of reported by others. For example, Stark et al. (2005) reported g, Rump et al. (2002),16 g, Otto et al. (2001a), 13 g and Otto et al. (2001b), g. The pattern of change in the absolute concentrations of AA in serum PL across pregnancy found in this project was consistent with the literature (Al et al.1995; Otto et al., 2001a; Otto et al., 1997; Rump et al., 2002; Wijendran et al., 1999). The median concentration of AA increased during pregnancy by 11% from the first to the second trimester followed by an increase of 23% from the second to the third trimester. However, these proportional increases were higher than previously reported in the Netherlands by Al et al. (1995) and Rump et al. (2002), which may be explained by the higher weight gain observed in this cohort than reported by Dutch studies (Dirix et al., 2009; Otto et al., 2001a; Otto et al., 2001b; Rump et al., 2002). 96
113 At the postpartum period, changes in the maternal status of AA were consistent with previous studies as while the concentrations of AA decreased postpartum (Al et al., 1995; Otto et al., 2001b; Stark et al., 2005), the proportion increased (Al et al., 1995; Holman et al., 1991; Otto et al., 2001b; Stark et al., 2005). AA returned to levels comparable with the first trimester at three months postpartum in both concentration and proportion values. Although Al et al., 1995 reported that AA returned to the first trimester levels by 6 months postpartum, this may be explained by the initial maternal status in our study, as the concentration of AA in the first and second trimesters were mainly found to be higher than previously reported (Al et al., 1995; Otto et al., 1997; Rump et al., 2002). The present study showed that in this high socioeconomic cohort, the majority of women (~75%) were not meeting DHA recommendations for pregnancy and lactation, which was consistent with previous studies in Guelph and Vancouver, Canada (Denomme et al., 2005; Innis & Elias, 2003) and Michigan, United States (Nochera et al., 2011). To our knowledge, this was the largest study to estimate the intake of DHA in pregnant women and the first to estimate intakes at all trimesters in addition to postpartum. The median maternal daily intakes of DHA during pregnancy and lactation (30-37 mg) were similar to the mean intake estimated in Connecticut, the United States of 38 mg (Wijendran et al., 1999), but lower than other estimates of mg/day in the Michigan, United States (Stark et al., 2005), 82 mg (Denomme et al., 2005) in Guelph, Canada, 160 mg/day (Innis & Elias, 2003) in Vancouver, Canada and mg/day in the Netherlands (Otto et al., 2001a; Otto et al., 2001b). This could be partially related to the median fat intakes at the four times points in our study (69-74 g) being similar to estimate of 73 g by Wijendran et al. (1999) but lower than the intake of g reported by Stark et al. (2005), 80 g by Innis & Elias (2003), g by Otto et al. (2001a) and g by Otto et al. 97
114 (2001b). Additionally, the difference may be due to supplement use as the mean intakes in the four time points ( mg) in our cohort were influenced by ~22% of the women taking a daily supplement of at least 100 mg/day and their intakes were much higher than the median intakes of mg, thus higher than the mean estimates from the other studies. The estimated median daily intake of DHA in pregnancy and lactation (30-37 mg) changed slightly and only increased statistically (p=0.001) from the second to the third trimester, which may be related to the increase in energy intake reported in the APrON study at the same time point (Jia et al., 2015). No study reported intakes estimates at all four time points; however, studies that estimated DHA intake at more than one time point in pregnancy/postpartum did not report significant change in estimated intake of DHA (Otto et al., 2001a; Otto et al., 2001b; Stark et al., 2005). This suggests than women in North America have a higher overall energy intake in pregnancy, as women in our study had higher mean gestational weight gain (15 kg) than the Dutch studies (~12 kg by Dirix et al., 2009; Otto et al., 2001b, Rump et al., 2002) but lower than 17 kg by Wijendran et al. (1999) in Connecticut, the United States. There was a positive relationship between dietary intake and maternal serum phospholipid status of DHA in this study, which was consistent with the established relationship in intervention studies (Craig et al., 2000; Helland et al., 1998; Helland et al., 2006). This may be explained by the limited conversion rate of ALA to DHA making DHA status more reliant on maternal intake of DHA. The low observed maternal DHA status in this population at all time points was consistent with a review by Stark et al. (2016) that found healthy North Americans to have low status (expressed as a proportion of total fatty acids) of DHA. The maternal status of DHA in pregnancy and postpartum expressed as either concentration or a relative percent of serum PL was lower than reported in the Dutch studies by Al et al., 1995; Dirix et al., 2009; Jochems et al., 98
115 2015; Otto et al., 1997; Otto et al., 2001a; Otto et al., 2001b; Rump et al., 2002 and the American study by Stark et al., The exception being that the proportion of DHA in serum PL during the second trimester and the DHA concentration in PL during the third trimester were higher than that reported in the study by Stark et al. (2005) and Al et al. (1995), respectively. The DHA pregnancy status was also higher than reported by Wijendran et al. (1999) in the Connecticut, United States and Meher et al. (2016) in India. The pattern of the change in the absolute concentration of DHA in serum PL across pregnancy found in this project was consistent with the literature (Al et al., 1995; Otto et al., 1997; Otto et al., 2001a; Rump et al., 2002; Wijendran et al., 1999). The median concentration of DHA increased during pregnancy by 30% from the first to the second trimester followed by an increase of 41% from the second to the third trimester. The proportion of DHA increased from the second to the third trimester (the median changed by 17%), which was inconsistent with Al et al., 1995; Dirix et al., 2009; Jochems et al., 2015; Meher et al., 2016; Rump et al., 2002 who reported a decrease or no change in DHA proportion. Since status of DHA is influenced by dietary intake, shown in intervention studies (Jensen et al., 2000; Smut et al., 2003), the increase in dietary intake of DHA that was only seen between these two time points, may explain the observed increase in the DHA proportion in this study. Additionally, the participants in this study had lower initial relative proportion of DHA in serum (in the first and second trimesters) than previously reported (Al et al., 1995; Dirix et al., 2009; Jochems et al., 2015; Otto et al., 2001a; Rump et al., 2002) and the increase did not result in women having a higher DHA status than what was reported in the studies in which women had a decrease in DHA proportion. Postpartum, the changes in the maternal status of DHA was consistent with previous studies as the concentrations of DHA (Al et al., 1995; Otto et al., 2001b; Stark et al., 2005), as 99
116 well as the proportion, decreased postpartum (Al et al., 1995; Holman et al., 1991; Otto et al., 2001b; Stark et al., 2005). The maternal DHA status was found to be lower than the first trimester status. This may be explained by the maternal initial status as the concentration of DHA in the first and second trimesters were found to be lower than previously reported (Al et al., 1995; Otto et al., 1997; Rump et al., 2002; Stark et al., 2005). Additionally, mg of DHA go into breast milk everyday (reviewed by Makrides & Gibson, 2000) and the vast majority (~99%) of women in this study were breast feeding, yet 75% of the women did not meet the 200 mg DHA recommendations postpartum. Lactating women were reported in the literature to have a greater decrease in DHA status postpartum compared to non-lactating women (Otto et al., 2001b). This would further explain the decrease in DHA status observed in this study postpartum. The increase in absolute amounts of fatty acids in maternal serum PL throughout normal pregnancy was reported to be due to the enhanced PL concentration during pregnancy (Desoye et al., 1987) and to physiological hypertriglyceridemia in pregnancy (Matorras et al., 2001). The pregnancy-associated increase in DHA and AA concentrations might reflect an adjustment in the hepatic synthesis of these fatty acids, with a greater or selective incorporation of DHA and AA into PL. This, in turn, suggests enhanced synthesis of these from their precursors, mobilization from maternal stores and/or reduced oxidation to meet the increased needs and synthesis of fetal and infant tissue (Al et al., 1995; Otto et al., 2001a). As DHA synthesis is 3 times greater in women using 17a-ethynyloestradiol oral contraceptive pills and women on hormonal replacement therapy than those not using them, an upregulation of the conversion pathway by estrogen activity and a higher conversion rate in pregnancy is likely (reviewed by Williams & Burdge, 2006). 100
117 5.2.3 Optimizing breast milk composition of DHA and AA and infant outcomes In this study, the median DHA (0.2%) was found to be lower while AA (0.8%) higher than the recently reported global averages of 0.37% and 0.55%, respectively (Fu et al., 2016). This was in agreement with previous studies, where Canada was identified to be among the countries with the lowest DHA concentration in breast milk (Brenna et al., 2007; Fu et al., 2016; Yuhas et al., 2006). As breast milk content of DHA was shown in this study (R 2 =0.103, p<0.001) and previous studies (Jensen et al., 2000; Makrides et al., 1996) to be correlated positively with DHA intake, it was not surprising to find low levels of DHA in breast milk in our population. We previously reported low fish consumption in APrON women (Jia et al., 2015). Maternal status of DHA was also found to be a predictor of breast milk DHA at the same time point both in concentration (R 2 =0.029, p<0.001) and proportion (R 2 =0.056, p<0.001), consistent with the significant correlation reported in the intervention study by Helland et al. (1998). Higher breast milk concentrations of DHA and AA have been associated with other favourable infant outcomes such as beneficial effects on heart rate variability and several developmental tests (reviewed by Jackson & Harris, 2016). Using these studies, we identified an optimal proportion of DHA in breast milk of % w/w of fatty acids. Using our intake data, we suggest a target intake of DHA of at least 340 mg/day, to achieve the bottom of the optimal range of DHA in breast milk. This estimate is higher than the previous 200 mg recommendation (consensus statement by Koletzko et al., 2007; systematic review by Koletzko et al., 2014) for lactating women. However, the systematic review by Koletzko et al. (2014) described achieving a mean milk DHA level of 0.30% required at least 200 mg of DHA, although their intervention study in which intake of DHA and DHA in breast milk were used had a small sample size of 10 (Fidler et al., 2000). Using the APrON cohort, it appears that 101
118 supplementation is necessary to meet this recommended intake to achieve the minimal proportion of DHA in breast milk. However, 340 mg of DHA can be achieved by having 1 serving of fatty fish such as salmon, 3 high-dha eggs, or 1-3 capsules of fish oil per day, which is higher than current weekly 2-serving recommendation by Health Canada. Previous studies have reported that supplementation with DHA during pregnancy had beneficial impact on infant sleep organization as assessed on day 1 and 2 (Judge et al., 2012), and that maternal DHA status during pregnancy and after delivery were associated with higher values in the sleep rhythm maturation parameters of children at 6 months and more mature neonatal sleep-state patterning on day 1 and 2, respectively (Cheruku et al., 2002; Zornoza- Moreno et al., 2014). Since breast milk DHA content has been shown to correlate positively with the maternal serum PL DHA status, which in turn, is influenced significantly by dietary intake (Jensen et al., 2000; Makrides et al., 1996), breast milk DHA was predicted to influence infant sleep. However, breast milk concentrations of AA and DHA as well as AA:DHA in this study were not found to be predictors of the parent-reported total duration of infant sleep or cry and whether parents consider infant sleep or cry to be problematic at three months of age, after controlling for major covariates. To our knowledge this was the first study to examine the relationship between breast milk DHA concentration and infant sleep and crying. A larger sample size may be needed to detect small differences in infant sleep and crying, as at the time of this thesis, less than half APrON infants (n=841) had sleep and crying data available, were exclusively breastfed, and had breast milk samples analyzed. Also, studies that found relationships measured sleep and crying while our study used parental reporting of sleep and crying and the precision of this measure was not determined in our study. Sleep maturation may be shown in sleep consolidation (e.g. having distant differences between sleep in day and 102
119 night as well as having a lower number of night wakings). Therefore, using the total daily durations of infant sleep and crying in this project may have not reflected infant behaviours differences. Other factors related to infant sleep and crying behaviors, such as parenting and parental interactions with infants, were not included in the analysis. Finally, having a low median and mean breast milk DHA in our study population may have not enabled us to identify beneficial outcomes. 5.2 Strengths and limitations This study was from a large cohort (n=2199) and, to our knowledge, was the first in Canada to estimate dietary intake of DHA at each trimester and once postpartum, measure maternal fatty acid status in serum PL (both as a concentration and a percentage), assess breast milk fatty acid composition and examine infant outcomes. This was in addition to using data from birth records and controlling for major covariates such as smoking, alcohol intake, prepregnancy BMI and weight gain during pregnancy. The longitudinally prospective design minimized recall bias and allowed repeated measurements of the same variables three times during pregnancy, relating maternal and infant baseline characteristics with the developed outcomes of interests such as infant sleep and crying. With the large sample size of the data gathered and samples measured, it strengthened linking breast milk to maternal status as well as diet and infant outcomes. In this study, the dietary assessment of DHA was performed not only by using repeated measure dietary recalls and SIQ, but also by a tailored n-3 database for APrON study that has n-3 data mainly from the CNF (as described in Jia et al., 2015), which allowed the calculation of DHA in foods that had missing values in Food Processor. We have previously published this methodology (Jia et al., 2015). 103
120 A limitation of this study is that 24-hour dietary intake recalls are memory-dependant and represent a snap-shot in time, which may not capture the intake of foods such as fish throughout the trimester. However, finding significant correlation between dietary intake of DHA and the serum phospholipid biomarker validated the accuracy of dietary intake estimate. Many participants had entered the study at the second trimester and there was some missing data for the third and postpartum time points. As the study entry time point in pregnancy was different among participants, there is discrepancy on the timing of assessments performed in the second trimester. Also, at that time of this thesis, supplement intake data was not entered for approximately half the cohort which, when entered and cleaned, could increase the power in predicting breast milk DHA content from diet. Other PUFA such as ALA, LA, EPA and DPA affect the metabolism of DHA and AA and were not included in the analysis in this study. As maternal status in pregnancy is affected by initial status, having pre-pregnancy status and prepregnancy dietary intake of DHA and AA estimated (which was obtained from a FFQ) would enable one to estimate the change in dietary intake when women become pregnant. The data for inter-pregnancy interval and FADs genetics, which are related to initial maternal status, and methyl-mercury exposure from fish, can be confounders when assessing maternal status across pregnancy, and were not available for use in the analysis in this thesis. Finally, the sleep and crying data were not objectively measured but were reported by parents at one time point, which may have under or overestimated the sleep and crying outcomes. 5.3 Future direction This study provided data and evidence an increased intake of DHA during lactation and the required maternal serum status to achieve a more desirable breast milk fatty acid composition. In addition to the fatty acids in the maternal diet, multiple factors influence the 104
121 breast milk content of fatty acids such as the length of fish oil supplementation, baseline milk DHA levels, FADS gene variants, and the rate of fatty acid release from adipose tissue stores (reviewed by Jackson & Harris, 2016). Hence, future research should aim at using a multivariate model when establishing the relationship of breast milk and dietary intake of DHA when additional data is available for use. This includes intake of dietary PUFA (LA, EPA, DPA) which can strengthen the results as they relate to DHA and AA status as well as fat mass gain during pregnancy (using skinfold measurements) to accurately estimate fat mass changes as opposed to fluid retention. As participants in this cohort completed a pre-pregnancy FFQ in addition to the repeated 24-hr recalls, this can be used to estimate pre-pregnancy intake and relate with pregnancy intake and status. To better determine if a relationship exists, the relationship between DHA, AA and AA:DHA with infant sleep and cry can be examined further by analyzing the day and night sleep and crying durations separately, as well as considering the number of infant wakings per night. Finally, a future study could use the maternal and infant data in this thesis and examine longer term infant health outcomes extending the period studied to include the 6-month postpartum follow up and children at older ages to examine the relationship between breast milk composition of fatty acids and long-term cognitive and behaviour outcomes such as Intelligence Coefficient (IQ) at three years of age. 105
122 References Al, M. D., Van Houwelingen, A. C., Kester, A. D., Hasaart, T. H., De Jong, A. E., & Hornstra, G. (1995). Maternal essential fatty acid patterns during normal pregnancy and their relationship to the neonatal essential fatty acid status. British Journal of Nutrition, 74(01), Alvarez, M., & St James-Roberts, I. (1996). Infant fussing and crying patterns in the first year in an urban community in denmark. Acta Paediatrica, 85(4), Antonakou, A., Skenderi, K. P., Chiou, A., Anastasiou, C. A., Bakoula, C., & Matalas, A. (2013). Breast milk fat concentration and fatty acid pattern during the first six months in exclusively breastfeeding greek women. European Journal of Nutrition, 52(3), doi: /s Aranceta, J., & Pérez-Rodrigo, C. (2012). Recommended dietary reference intakes, nutritional goals and dietary guidelines for fat and fatty acids: A systematic review. The British Journal of Nutrition, 107 Suppl 2, S8-S22. doi: /s Blumberg, S. J., Halfon, N., & Olson, L. M. (2004). The national survey of early childhood health. Pediatrics, 113(Supplement 5), Bosaeus, M., Hussain, A., Karlsson, T., Andersson, L., Hulthén, L., Svelander, C.,... Holmäng, A. (2015). A randomized longitudinal dietary intervention study during pregnancy: Effects on fish intake, phospholipids, and body composition. Nutrition Journal, 14(1), 1. Brenna, J. T. (2016). Arachidonic acid needed in infant formula when docosahexaenoic acid is present. Nutrition Reviews, 74(5), doi: /nutrit/nuw007 [doi] Brenna, J. T., Varamini, B., Jensen, R. G., Diersen-Schade, D. A., Boettcher, J. A., & Arterburn, L. M. (2007). Docosahexaenoic and arachidonic acid concentrations in human breast milk worldwide. The American Journal of Clinical Nutrition, 85(6), doi:85/6/1457 [pii] Calder, P. C., Kremmyda, L. S., Vlachava, M., Noakes, P. S., & Miles, E. A. (2010). Is there a role for fatty acids in early life programming of the immune system?. Proceedings of the Nutrition Society, 69(03), Canadian Nutrient File. (2015). Retrieved on Sept 09, 2016 from: Cheruku, S. R., Montgomery-Downs, H. E., Farkas, S. L., Thoman, E. B., & Lammi-Keefe, C. J. 106
123 (2002). Higher maternal plasma docosahexaenoic acid during pregnancy is associated with more mature neonatal sleep-state patterning. The American Journal of Clinical Nutrition, 76(3), Colombo, J., Carlson, S. E., Cheatham, C. L., Fitzgerald-Gustafson, K. M., Kepler, A., & Doty, T. (2011). Long-chain polyunsaturated fatty acid supplementation in infancy reduces heart rate and positively affects distribution of attention. Pediatric research, 70(4), Colombo, J., Carlson, S. E., Cheatham, C. L., Shaddy, D. J., Kerling, E. H., Thodosoff, J. M.,... & Brez, C. (2013). Long-term effects of LCPUFA supplementation on childhood cognitive outcomes. The American journal of clinical nutrition, 98(2), Crawford, M. A. (2000). Placental delivery of arachidonic and docosahexaenoic acids: implications for the lipid nutrition of preterm infants. The American journal of clinical nutrition, 71(1), 275S-284S. De Groot, R. H., Hornstra, G., van Houwelingen, A. C., & Roumen, F. (2004). Effect of α- linolenic acid supplementation during pregnancy on maternal and neonatal polyunsaturated fatty acid status and pregnancy outcome. The American journal of clinical nutrition, 79(2), Decsi, T., & Kennedy, K. (2011). Sex-specific differences in essential fatty acid metabolism. The American Journal of Clinical Nutrition, 94(6 Suppl), 1914S-1919S. doi: /ajcn [doi] Demmelmair, H., Baumheuer, M., Koletzko, B., Dokoupil, K., & Kratl, G. (1998). Metabolism of U13C-labeled linoleic acid in lactating women. Journal of Lipid Research, 39(7), Denomme, J., Stark, K. D., & Holub, B. J. (2005). Directly quantitated dietary (n-3) fatty acid intakes of pregnant Canadian women are lower than current dietary recommendations. The Journal of nutrition, 135(2), Desoye, G., Schweditsch, M. O., Pfeiffer, K. P., Zechner, R., & Kostner, G. M. (1987). Correlation of Hormones with Lipid and Lipoprotein Levels During Normal Pregnancy and Postpartum*. The Journal of Clinical Endocrinology & Metabolism, 64(4), Dietary Guidelines for Americans (2015). Retrieved on Sept 12, 2016 from: 107
124 Dirix, C. E., Kester, A. D., & Hornstra, G. (2009). Associations between neonatal birth dimensions and maternal essential and trans fatty acid contents during pregnancy and at delivery. British Journal of Nutrition, 101(03), EFSA Panel on Dietetic Products, Nutrition, and Allergies. (2014). Scientific opinion on the essential composition of infant and follow-on formulae. EFSA J, 12, Emken, E. A., Adlof, R. O., & Gulley, R. M. (1994). Dietary linoleic acid influences desaturation and acylation of deuterium-labeled linoleic and linolenic acids in young adult males. Biochimica Et Biophysica Acta, 1213(3), Escamilla-Nuñez, M. C., Barraza-Villarreal, A., Hernández-Cadena, L., Navarro-Olivos, E., Sly, P. D., & Romieu, I. (2014). Omega-3 fatty acid supplementation during pregnancy and respiratory symptoms in children. CHEST Journal, 146(2), Escolano-Margarit, M. V., Campoy, C., Ramírez-Tortosa, M. C., Demmelmair, H., Miranda, M. T., Gil, A.,... Koletzko, B. V. (2013). Effects of fish oil supplementation on the fatty acid profile in erythrocyte membrane and plasma phospholipids of pregnant women and their offspring: A randomised controlled trial. Br J Nutr, 109(9), Fekete, K., Marosvölgyi, T., Jakobik, V., & Decsi, T. (2009). Methods of assessment of n 3 long-chain polyunsaturated fatty acid status in humans: a systematic review. The American journal of clinical nutrition, ajcn-27230i. Fidler, N., Sauerwald, T., Pohl, A., Demmelmair, H., & Koletzko, B. (2000). Docosahexaenoic acid transfer into human milk after dietary supplementation: a randomized clinical trial. Journal of Lipid Research, 41(9), Folch, J., Lees, M., & Sloane-Stanley, G. H. (1957). A simple method for the isolation and purification of total lipids from animal tissues. J biol Chem, 226(1), Fu, Y., Liu, X., Zhou, B., Jiang, A. C., & Chai, L. (2016). An updated review of worldwide levels of docosahexaenoic and arachidonic acid in human breast milk by region. Public health nutrition, Gil-Sanchez, A., Koletzko, B., & Larque, E. (2012). Current understanding of placental fatty acid transport. Current Opinion in Clinical Nutrition and Metabolic Care, 15(3), doi: /mco.0b013e b6e [doi] Goedhart, G., van der Wal, M. F., van Eijsden, M., & Bonsel, G. J. (2011). Maternal vitamin B- 108
125 12 and folate status during pregnancy and excessive infant crying. Early human development, 87(4), Gómez, M. F., Field, C. J., Olstad, D. L., Loehr, S., Ramage, S., & McCargar, L. J. (2015). Use of micronutrient supplements among pregnant women in Alberta: results from the Alberta Pregnancy Outcomes and Nutrition (APrON) cohort. Maternal & child nutrition, 11(4), Gould, J. F., Smithers, L. G., & Makrides, M. (2013). The effect of maternal omega-3 (n-3) LCPUFA supplementation during pregnancy on early childhood cognitive and visual development: A systematic review and meta-analysis of randomized controlled trials. The American Journal of Clinical Nutrition, 97(3), doi: /ajcn Government of Canada. (2016). Food and Drug Regulations. Retrieved on Sept 13, 2016 from: Hadley, K. B., Ryan, A. S., Forsyth, S., Gautier, S., & Salem, N. (2016). The essentiality of arachidonic acid in infant development. Nutrients, 8(4), 216. Haghiac, M., Yang, X., Presley, L., Smith, S., Dettelback, S., Minium, J.,... Hauguel-de Mouzon, S. (2015). Dietary omega-3 fatty acid supplementation reduces inflammation in obese pregnant women: A randomized double-blind controlled clinical trial. PloS One, 10(9), e Hanebutt, F. L., Demmelmair, H., Schiessl, B., Larqué, E., & Koletzko, B. (2008). Long-chain polyunsaturated fatty acid (LC-PUFA) transfer across the placenta. Clinical Nutrition, 27(5), Hautero, U., Laakso, P., Linderborg, K., Niinivirta, K., Poussa, T., Isolauri, E., & Laitinen, K. (2013). Proportions and concentrations of serum n-3 fatty acids can be increased by dietary counseling during pregnancy. European Journal of Clinical Nutrition, 67(11), doi: /ejcn Health Canada. (2003). Archived-Novel Food Information-DHASCO and ARASCO as Sources of Docosahexaenoic Acid and Arachidonic Acid in Infant Formulas. Retrieved on Oct from: Health Canada. (2009). Prenatal Nutrition Guidelines for Health Professionals-Fish and Omega-3 109
126 Fatty Acids. Retrieved on Sept 12 from: Health Canada. (2015). Nutrition for Healthy Term Infants: Recommendations from Birth to Six Months. Retrieved on Sept from: Heird, W. C., & Lapillonne, A. (2005). The role of essential fatty acids in development. Annu.Rev.Nutr., 25, Helland, I. B., Saarem, K., Saugstad, O. D., & Drevon, C. A. (1998). Fatty acid composition in maternal milk and plasma during supplementation with cod liver oil. European Journal of Clinical Nutrition, 52(11), Helland, I. B., Saugstad, O. D., Saarem, K., Van Houwelingen, A. C., Nylander, G., & Drevon, C. A. (2006). Supplementation of n-3 fatty acids during pregnancy and lactation reduces maternal plasma lipid levels and provides DHA to the infants. The Journal of Maternal- Fetal & Neonatal Medicine, 19(7), Hemmi, M. H., Wolke, D., & Schneider, S. (2011). Associations between problems with crying, sleeping and/or feeding in infancy and long-term behavioural outcomes in childhood: A meta-analysis. Archives of Disease in Childhood, 96(7), doi: /adc [doi] Henderson, J. M., France, K. G., & Blampied, N. M. (2011). The consolidation of infants' nocturnal sleep across the first year of life. Sleep medicine reviews, 15(4), Hiscock, H., & Wake, M. (2001). Infant sleep problems and postnatal depression: A communitybased study. Pediatrics, 107(6), Holman, R. T., Johnson, S. B., & Ogburn, P. L. (1991). Deficiency of essential fatty acids and membrane fluidity during pregnancy and lactation. Proceedings of the National Academy of Sciences of the United States of America, 88(11), Hsieh, A. T., Anthony, J. C., Diersen-Schade, D. A., Rumsey, S. C., Lawrence, P., Li, C.,... & Brenna, J. T. (2007). The influence of moderate and high dietary long chain polyunsaturated fatty acids (LCPUFA) on baboon neonate tissue fatty acids. Pediatric research, 61, Imhoff-Kunsch, B., Briggs, V., Goldenberg, T., & Ramakrishnan, U. (2012). Effect of n-3 long- 110
127 chain polyunsaturated fatty acid intake during pregnancy on maternal, infant, and child health outcomes: A systematic review. Paediatric and Perinatal Epidemiology, 26 Suppl 1, doi: /j x Innis, S. M. (2003). Perinatal biochemistry and physiology of long-chain polyunsaturated fatty acids. The Journal of Pediatrics, 143(4), 1-8. Innis, S. M. (2014). Impact of maternal diet on human milk composition and neurological development of infants. The American Journal of Clinical Nutrition, 99(3), 734S-41S. doi: /ajcn [doi] Innis, S. M., & Elias, S. L. (2003). Intakes of essential n 6 and n 3 polyunsaturated fatty acids among pregnant Canadian women. The American journal of clinical nutrition, 77(2), Institute of Medicine (US) Standing Committee on the Scientific Evaluation of Dietary Reference Intakes. (1998). Dietary reference intakes for thiamin, riboflavin, niacin, vitamin B6, folate, vitamin B12, pantothenic acid, biotin, and choline. National Academies Press (US). Institute of Medicine. (2005). Dietary Reference Intakes for Energy, Carbohydrate, Fiber, Fat, Fatty Acids, Cholesterol, Protein, and Amino Acids. Washington, DC: The National Academy Press. page Retrieved on Sept 08, 2016 from: Jackson, K. H., & Harris, W. S. (2016). Should there be a target level of docosahexaenoic acid in breast milk?. Current Opinion in Clinical Nutrition & Metabolic Care, 19(2), Jarman, M., Yuan, Y., Pakseresht, M., Shi, Q., Robson, P. J., & Bell, R. C. (2016). Patterns and trajectories of gestational weight gain: A prospective cohort study. CMAJ Open, 4(2), E338. Jensen, C. L., Maude, M., Anderson, R. E., & Heird, W. C. (2000). Effect of docosahexaenoic acid supplementation of lactating women on the fatty acid composition of breast milk lipids and maternal and infant plasma phospholipids. The American Journal of Clinical Nutrition, 71(1 Suppl), 292S-9S. Jensen, R. G. (1999). Lipids in human milk. Lipids, 34(12), Jia, X., Pakseresht, M., Wattar, N., Wildgrube, J., Sontag, S., Andrews, M.,... Field, C. J. (2015). Women who take n-3 long-chain polyunsaturated fatty acid supplements during 111
128 pregnancy and lactation meet the recommended intake. Applied Physiology, Nutrition, and Metabolism, 40(5), Jochems, S. H., Gielen, M., Rump, P., Hornstra, G., & Zeegers, M. P. (2015). Potential programming of selected cardiometabolic risk factors at childhood by maternal polyunsaturated fatty acid availability in the MEFAB cohort. Prostaglandins, Leukotrienes and Essential Fatty Acids (PLEFA), 100, Judge, M. P., Cong, X., Harel, O., Courville, A. B., & Lammi-Keefe, C. J. (2012). Maternal consumption of a DHA-containing functional food benefits infant sleep patterning: an early neurodevelopmental measure. Early human development, 88(7), Kaplan, B. J., Giesbrecht, G. F., Leung, B. M., Field, C. J., Dewey, D., Bell, R. C.,... Pop, V. J. (2014). The Alberta Pregnancy Outcomes and Nutrition (APrON) cohort study: Rationale and methods. Maternal & Child Nutrition, 10(1), Keim, S. A., Daniels, J. L., Siega-Riz, A., Herring, A. H., Dole, N., & Scheidt, P. C. (2012). Breastfeeding and long-chain polyunsaturated fatty acid intake in the first 4 post-natal months and infant cognitive development: An observational study. Maternal & Child Nutrition, 8(4), doi: /j x Koletzko, B., Boey, C. C., Campoy, C., Carlson, S. E., Chang, N., Guillermo-Tuazon, M. A.,... & Su, Y. (2014). Current information and Asian perspectives on long-chain polyunsaturated fatty acids in pregnancy, lactation, and infancy: systematic review and practice recommendations from an early nutrition academy workshop. Annals of Nutrition and Metabolism, 65(1), Koletzko, B., Carlson, S. E., & van Goudoever, J. B. (2015). Should infant formula provide both omega-3 DHA and omega-6 arachidonic acid? Annals of Nutrition & Metabolism, 66(2-3), doi: / [doi] Koletzko, B., Cetin, I., & Thomas Brenna, J. (2007). Dietary fat intakes for pregnant and lactating women. British Journal of Nutrition, 98(05), Koletzko, B., Lien, E., Agostoni, C., Böhles, H., Campoy, C., Cetin, I.,... & Uauy, R. (2008). The roles of long-chain polyunsaturated fatty acids in pregnancy, lactation and infancy: review of current knowledge and consensus recommendations. Journal of perinatal medicine, 36(1), Kopp, C. B. (1982). Antecedents of self-regulation: A developmental perspective. 112
129 Developmental Psychology, 18(2), 199. Kris-Etherton, P. M., Grieger, J. A., & Etherton, T. D. (2009). Dietary reference intakes for DHA and EPA. Prostaglandins, Leukotrienes and Essential Fatty Acids, 81(2), Kris-Etherton, P. M., Innis, S., & Ammerican, D. A. (2007). Position of the American Dietetic Association and Dietitians of Canada: dietary fatty acids. Journal of the American Dietetic Association, 107(9), Lavialle, M., Champeil-Potokar, G., Alessandri, J. M., Balasse, L., Guesnet, P., Papillon, C.,... & Denis, I. (2008). An (n-3) polyunsaturated fatty acid deficient diet disturbs daily locomotor activity, melatonin rhythm, and striatal dopamine in Syrian hamsters. The Journal of nutrition, 138(9), Makrides, M., & Gibson, R. A. (2000). Long-chain polyunsaturated fatty acid requirements during pregnancy and lactation. The American journal of clinical nutrition, 71(1), 307S- 311S. Makrides, M., Neumann, M. A., & Gibson, R. A. (1996). Effect of maternal docosahexaenoic acid (DHA) supplementation on breast milk composition. European journal of clinical nutrition, 50(6), Manca, D. P., O Beirne, M., Lightbody, T., Johnston, D. W., Dymianiw, D., Nastalska, K.,... Kaplan, B. J. (2013). The most effective strategy for recruiting a pregnancy cohort: A tale of two cities. BMC Pregnancy and Childbirth, 13(1), 1. Matorras, R., Ruiz, J. I., Perteagudo, L., Barbazan, M. J., Diaz, A., Valladolid, A., & Sanjurjo, P. (2001). Longitudinal study of fatty acids in plasma and erythrocyte phospholipids during pregnancy. Journal of perinatal medicine, 29(4), Meher, A., Randhir, K., Mehendale, S., Wagh, G., & Joshi, S. (2016). Maternal fatty acids and their association with birth outcome: A prospective study. PloS One, 11(1), e Nakamura, M. T., & Nara, T. Y. (2004). Structure, function, and dietary regulation of Δ6, Δ5, and Δ9 desaturases. Annu.Rev.Nutr., 24, Nochera, C. L., Goossen, L. H., Brutus, A. R., Cristales, M., & Eastman, B. (2011). Consumption of DHA+ EPA by low-income women during pregnancy and lactation. Nutrition in Clinical Practice, 26(4), Otto, S. J., Houwelingen, A. C., Antal, M., Manninen, A., Godfrey, K., Lopez-Jaramillo, P., & 113
130 Hornstra, G. (1997). Maternal and neonatal essential fatty acid status in phospholipids: An international comparative study. European Journal of Clinical Nutrition, 51(4), Otto, S. J., van Houwelingen, A. C., Badart-Smook, A., & Hornstra, G. (2001a). Changes in the maternal essential fatty acid profile during early pregnancy and the relation of the profile to diet. The American Journal of Clinical Nutrition, 73(2), Otto, S. J., van Houwelingen, A. C., Badart-Smook, A., & Hornstra, G. (2001b). Comparison of the peripartum and postpartum phospholipid polyunsaturated fatty acid profiles of lactating and nonlactating women. The American Journal of Clinical Nutrition, 73(6), Otto, S., De Groot, R., & Hornstra, G. (2003). Increased risk of postpartum depressive symptoms is associated with slower normalization after pregnancy of the functional docosahexaenoic acid status. Prostaglandins, Leukotrienes and Essential Fatty Acids, 69(4), Otto, S., Van Houwelingen, A., & Hornstra, G. (2000). The effect of supplementation with docosahexaenoic and arachidonic acid derived from single cell oils on plasma and erythrocyte fatty acids of pregnant women in the second trimester. Prostaglandins, Leukotrienes and Essential Fatty Acids (PLEFA), 63(5), Pawlosky, R. J., Hibbeln, J. R., Novotny, J. A., & Salem, N., J. (2001). Physiological compartmental analysis of alpha-linolenic acid metabolism in adult humans. Journal of Lipid Research, 42(8), Pawlosky, R., Hibbeln, J., Lin, Y., & Salem, N.,Jr. (2003). N-3 fatty acid metabolism in women. The British Journal of Nutrition, 90(5), Richard, C., Lewis, E. D., & Field, C. J. (2016). Evidence for the essentiality of arachidonic and docosahexaenoic acid in the postnatal maternal and infant diet for the development of the infant s immune system early in life 1. Applied Physiology, Nutrition, and Metabolism, 41(5), Rump, P. (2002). Polyunsaturated fatty acids and the fetal origins hypothesis: a study on cardiovascular risk indicators in children (Doctoral dissertation, Maastricht university). Sadeh, A. (2004). A brief screening questionnaire for infant sleep problems: Validation and findings for an internet sample. Pediatrics, 113, e570-e
131 Singh, M. (2005). Essential fatty acids, DHA and human brain. The Indian Journal of Pediatrics, 72(3), Smuts, C. M., Borod, E., Peeples, J. M., & Carlson, S. E. (2003). High-DHA eggs: Feasibility as a means to enhance circulating DHA in mother and infant. Lipids, 38(4), St James-Roberts, I. (2008). Infant crying and sleeping: helping parents to prevent and manage problems. Primary Care: Clinics in Office Practice, 35(3), Stark, K. D., Beblo, S., Murthy, M., Buda-Abela, M., Janisse, J., Rockett, H.,... Salem, N.,Jr. (2005). Comparison of bloodstream fatty acid composition from african-american women at gestation, delivery, and postpartum. Journal of Lipid Research, 46(3), doi:m jlr200 [pii] Stark, K. D., Van Elswyk, M. E., Higgins, M. R., Weatherford, C. A., & Salem, N. (2016). Global survey of the omega-3 fatty acids, docosahexaenoic acid and eicosapentaenoic acid in the blood stream of healthy adults. Progress in lipid research, 63, Steer, C. D., Lattka, E., Koletzko, B., Golding, J., & Hibbeln, J. R. (2013). Maternal fatty acids in pregnancy, FADS polymorphisms, and child intelligence quotient at 8 y of age. The American Journal of Clinical Nutrition, 98(6), doi: /ajcn Uauy, R., Mena, P., & Rojas, C. (2000). Essential fatty acids in early life: Structural and functional role. The Proceedings of the Nutrition Society, 59(1), United States Department of Agriculture, Agricultural Research Service. (2016). USDA Food Composition Database retrieved on Sept 15, 2016 from: Urade, Y., & Hayaishi, O. (2011). Prostaglandin D 2 and sleep/wake regulation. Sleep medicine reviews, 15(6), Van Houwelingen, A. C., Søsrensen, J. D., Hornstra, G., Simonis, M. M., Boris, J., Olsen, S. F., & Secher, N. J. (1995). Essential fatty acid status in neonates after fish-oil supplementation during late pregnancy. British Journal of Nutrition, 74(05), Wijendran, V., Bendel, R. B., Couch, S. C., Philipson, E. H., Thomsen, K., Zhang, X., & Lammi-Keefe, C. J. (1999). Maternal plasma phospholipid polyunsaturated fatty acids in pregnancy with and without gestational diabetes mellitus: Relations with maternal factors. The American Journal of Clinical Nutrition, 70(1), Williams, C. M., & Burdge, G. (2006). Long-chain n 3 PUFA: Plant v. marine sources. 115
132 Proceedings of the Nutrition Society, 65(01), Wolke, D., Meyer, R., & Gray, P. (1994). Validity of the crying pattern questionnaire in a sample of excessively crying babies. Journal of Reproductive and Infant Psychology, 12(2), World Health Organization. (2008). Interim summary of conclusions and dietary recommendations on total fat & fatty acids. From the Joint FAO/WHO Expert Consultation on Fats and Fatty Acids in Human Nutrition, Young, K. T., Davis, K., Schoen, C., & Parker, S. (1998). Listening to parents: A national survey of parents with young children. Archives of Pediatrics & Adolescent Medicine, 152(3), Yuhas, R., Pramuk, K., & Lien, E. L. (2006). Human milk fatty acid composition from nine countries varies most in DHA. Lipids, 41(9), Zornoza-Moreno, M., Fuentes-Hernández, S., Carrión, V., Alcántara-López, M. V., Madrid, J. A., López-Soler, C.,... & Larqué, E. (2014). Is low docosahexaenoic acid associated with disturbed rhythms and neurodevelopment in offsprings of diabetic mothers?. European journal of clinical nutrition, 68(8). 116
133 Appendices Appendix I: Standard Operating Procedures (SOP) for calculating and cleaning of APrON maternal serum phospholipid fatty acids Summary of laboratory analysis Blood samples were collected at four different time points: once at each trimester (called A, B and C) and once at three months postpartum (called E). As described in Kaplan et al. (2014), the percent and concentration of phospholipid fatty acids were determined on 300 µl of maternal serum at each of the time points. Initially, 10 µg (100 µl of 10 mg/100 ml) of a phospholipid (phosphatidylcholine) standard (C15:0) was added to the sample, and lipid extraction was performed using a modified Folch method (Folch et al., 1957). PL were separated from other major lipid classes and methylated by thin-layer chromatography and the phospholipid band was then visualized and scraped. Prior to methylation with BF3, 10 µg C17:0 triglyceride standard (100 µl of 10 mg/100 ml) was added to the silica. Fatty acids were then separated by automated gas liquid chromatography. Fatty acid status was calculated as a percentage of total serum PL and as a concentration (correction was made with the C15:0 phospholipid standard that was added at the beginning of the extraction). Data source GC chromatographs were used to identify 31 fatty acids. Data was obtained from GC analyses for the area [pa*s] of the peaks of these identified fatty acids (the other peaks were removed): 117
134 15:0 (PL Standard, (10.6 µg) 17:0 (TG Standard) 14:0 16:0 16:1 18:0 t18:1 18:1n9 18:1c11 E- unknown D- unknown C- unknown B- unknown A- unknown 18:2n6 20:0 18:3n6 18:3n3 20:2n6 20:3n3- there will be 2 peaks close together one is this peak and the other 20:3(6), if there is only one then it is 20:3(3) 20:3n6 G- unknown 20:4n6 20:4n3 20:5n3 24:0 24:1n9 22:4n6 22:5n6 22:5n3 22:6n3 Some calculated sums are also available as % (sum of %) and concentration (sum of concentrations): Sum of Saturated Fatty Acids (SFA)= 14:0+16:0+18:0+20:0+24:0 Sum of Monounsaturated Fatty Acids (MUFA)= 16:1+18:1b+a +18:1c+24:1n9 Sum of Polyunsaturated Fatty Acids (PUFA)= 18:2+18:3+20:2n6+20:3n6+20:3n3+20:4n3+20:4n6+20:5n3+22:4n6+22:5n6+22:5n3+22:6n3 Sum of n-6= 18:2+18:3n6+20:2n6+20:3n6+20:4n6+22:4n6+22:5n6 Sum of n-3= 18:3n3+20:3n3+20:4n3+20:5n3+22:5n3+22:6n3 Total= SFA+MUFA+n-3+n-6 Sum of long chains= 20:0+20:2n6+20:3n6+20:3n3+20:4n3+20:4n6+20:5n3+24:0+24:1n9+22:4n6+22:5n6+22:5n3+ 22:6n3 As in the following example of a GC chromatograph (C , time point A): 118
135 119
136 After entering /exporting the output of the areas into excel, the data was separated into tabs by the four time points (first trimester A, second trimester B, third trimester C and at three months postpartum E ) The total area was calculated using SUM function. For each of these maternal phospholipid fatty acids (FA), calculations for status were made using Excel functions as the following: Percent of total PL: %FA= FA area/sum *100 Concentration of fatty acid in serum PL: FA µg/ml= (FA area*10 µg/c15 area)*3.33, except the first cohort (FA area*10.6 µg/c15 area)*3.33. A few times there was a slight change in the formula used, as for some samples more standard was added, or only 200 µl of serum was extracted (FA area*10.0 µg/c15 area *5). There is a note in the original spreadsheet on this. If the C15 standard was not added, then there will not be a calculation for µg/ml. As the data was analyzed by multiple staff/students, participant ID was color coded to identify the source of the data, and a tab called Analyzed FA was included to specify the source. Data was separated into tabs by time points (A, B, C and E), and participants IDs were completed to match APrON s format (e.g. C ) Functions (shown below in brackets) were inserted to obtain summary stats: Mean (AVERAGE), SD (STDEV), Mean-2*SD, Mean+2*SD, Median (MEDIAN), Minimum (MIN), Maximum (MAX), SE (=SD/SQRT[n]) and n (COUNT) Data cleaning 1. Clean one time-point at a time 2. Using a data filter in Excel, sort each column in an ascending order 120
137 3. Check for any interruption/gap in the data and highlight in yellow data that are separate from others, and in red cells that are very different (e.g. 3 times the second max value) 4. Highlight the ID cell in yellow if the value was outside of 2 SD and/or if there as a suspected error in any of its fatty acid values 5. Check for trends in one batch (since each batch of analyzed fatty acids is color coded, sometimes the data for one fatty acid would fall all in the lowest or highest values indicating an error in analysis or while compiling data) 6. Check participant ID issues by adding a column for length of the name (excel function LEN), and correct any IDs that has a number of characters different from Highlight duplicate IDs in red borders using conditional formatting 8. Filter the data set by ID color- yellow 9. If the error is in red and it is in a minor fatty acid (e.g. fatty acid A ), delete and insert a note, if it is yellow and only in the area of the fatty acid (not percentage nor concentration), ignore 10. Remove to to fix tab if there is any red cell, or if there are more than two yellow cells: to verify 11. Verify yellow and red cells against original/ raw files to check for copy errors, using the Analyzed FA tab as a guide for original data source 12. Use excel to check data for errors to identify for formula consistency issues and fix those formulas 13. Check column Sum % and highlight any cells that are not equal to 100, and recheck the entire row to fix 14. Review formulas with show formulas 121
138 15. Move to check the next time point to see if there are similar errors 16. After fixing typos/function issues, re-sort and check the columns again (step 2) as fixing one fatty acid would affect the total area hence affecting the estimation of the other fatty acids 17. Check for duplicates: a. If the values for the duplicates are different, remove the sample that has: highlighted errors, a small sample volume, missing standard, or has values very different from the other time points for the same participant b. If the values are similar, average those, add a note, and keep the original data into the tab called duplicates Notes 1. The original files of all the fatty acids have been loaded into RedCap. For general use only, the key ones are available without further discussion with the guardian of the data 2. The template used for calculations was of the first APrON s cohort, of two files called Completed Maternal Fatty Acids and There was a smaller number of batches received for time point C 4. A value of 0 indicates the absence of a peak, while an empty cell means not analyzed. However, sometimes a zero is displayed by excel as a result of calculations on an empty cell and these need to be verified when pulling data 5. 18:4n3 was misidentified and removed from all of the chromatograms. If interested, would have to go back to the chromatograms and try to pull this off 122
139 6. Some small fatty acids were inconsistently identified (such as E, D, C, B, A and 18:4n3) and 20:3n6 and 20:3n3 which, in the future might be identified and would require going back to the original chromatograms 7. C20:3 (n-6) vs C20:3 (n-3): if there is one peak it is C20:3(6) if two then the first peak is C20:3(n-6) and the second is C20:3(n-3) 8. C18:3(3) was identified in the first cohort as the C18:3(6) will be small or non existent, and C18:3n3 and C18:3n6 identified in the later data (instead) 9. C16:1 µg/ml values in the batch of July/Aug 2016 (IDs are in orange) seem to be lower than the rest of the data, which could be that less peak integration for these peaks was done. If needed, will have to go back to the original chromatograms and collect the extra tiny peak 10. An ID marked by a star indicates leakage in the sample (inaccurate) such as C0602* For the first APrON cohort, there are printed chromatograms for all the fatty acids, for the remaining they are stored on GC files and one would need to load these up and print them to look at them 123
140 Appendix II: Supplementary data Table A.1 Estimated daily intake of EPA, DPA, DHA and total long chain n-3 fatty acids, during pregnancy and at three months postpartum based on dietary recall method in the APrON cohort Pregnancy 1 Postpartum Dietary recall method Interview Online Interview Online n Energy intake (kcal/day) 2217±533 (2181, ) 2163±530 (2129, ) 2086±624 (2049, ) 2072±625 (2028, ) EPA 44±101 (7, 3-25) 63±153 (7, 1-28) 55±179 (4, 1-16) 76±256 (3, 0-15) DPA 33±66 (15, 9-24) 34±69 (13,5-26) 34±79 (14, 6-25) 41±121 (10, 1-25) DHA 113±259 (26, 9-70) 127±294 (26, 5-74) 123±340 (17, 3-63) 151±526 (14, 1-58) Energy-adjusted DHA 5±13 (1, 0-3) 6±14 (1, 0-3) 6±17 (1,0-3) 7±25 (1, 0-3) Total n-3 LCPUFA 189±416 (49, ) 224±508 (50, ) 212±580 (40, ) 268±892 (34, 5-94) Energy-adjusted total n-3 9±20 (2, 1-5) 10±25 (2, 1-6) 11±29 (2, 1-5) 13±43 (2, 0-5) 1 Pregnancy represents the mean of available 24-hr recalls for first, second and/or third trimester of pregnancy Data are presented as mean ±SD. Skewed data is also presented as (median, 25 th percentile-75 th percentile) Abbreviations: AA, arachidonic acid; APrON, Alberta Pregnancy Outcomes and Nutrition; DHA, docosahexaenoic acid; DPA, docosapentaenoic acid; EPA, eicosapentaenoic acid; LCPUFA, long chain polyunsaturated fatty acids 124
141 Table A.2 Breast milk fatty acid composition (as a relative wt/wt proportions) at the third month of lactation in a subset of APrON participants (n=1038) Fatty Acid Mean ± SD % of total fatty acids C10:0 0.7±0.4 C12:0 4.7±1.8 C14:0 5.6±1.8 C15:0 0.3±0.2 C16:0 20.1±3.6 C17:0 0.3±0.2 C18:0 6.1±1.6 C20:0 0.2±0.1 C16:1 3.1±1 C18:1(1+2) 39.6±4.2 C18:1 (3) 1.6±0.6 C18:2n6 13.6±3.1 C20:2n6 0.3±0.3 C20:3n6 0.4±0.2 C20:4n6 1.2±1 C22:5n6 0.1±0.1 C18:3n3 1.8±0.7 C20:5n3 0.1±0.1 C22:5n3 0.2±0.2 C22:6n3 0.3±0.3 SFA 37.9±6 MUFA 44.2±4.3 PUFA 17.9±4 N ±3.4 N-3 2.4±1 n6/n3 7.3±2.4 AA/DHA 6.8±8.6 Abbreviations: AA, arachidonic acid; APrON, Alberta Pregnancy Outcomes and Nutrition; DHA, docosahexaenoic acid; MUFA, monounsaturated fatty acids; SFA, saturated fatty acids 125
142 Table A.3 Univariate analysis of postpartum dietary intake of AA and the maternal status of AA in A) serum concentration and B) serum proportion A) 126
143 B) 127
 and the")
144 Table A.4 Univariate analysis of postpartum dietary intake of DHA (up to 1000 mg/day) and the maternal status of DHA in A) serum concentration and B) serum proportion A) 128
145 B) 129
146 Table A.5 Univariate analysis of postpartum dietary intake of DHA (up to 2000 mg/day) and DHA in breast milk 130
147 Table A.6 Univariate analysis of DHA in breast milk and the maternal status of DHA in A) serum concentration and B) serum proportion A) 131
148 B) 132
149 Table A.7 Univariate regression analysis of parent-reported total daily duration of infant sleep with each of A) DHA B) AA and C) AA:DHA in breast milk in exclusively breast-fed infants A) 133
150 B) 134
151 C) 135
152 Table A.8 Step-wise multiple regression analysis of parent-reported total daily duration of infant sleep with A) DHA B) AA and C) AA:DHA in breast milk in exclusively breast-fed infants A) 136
153 137
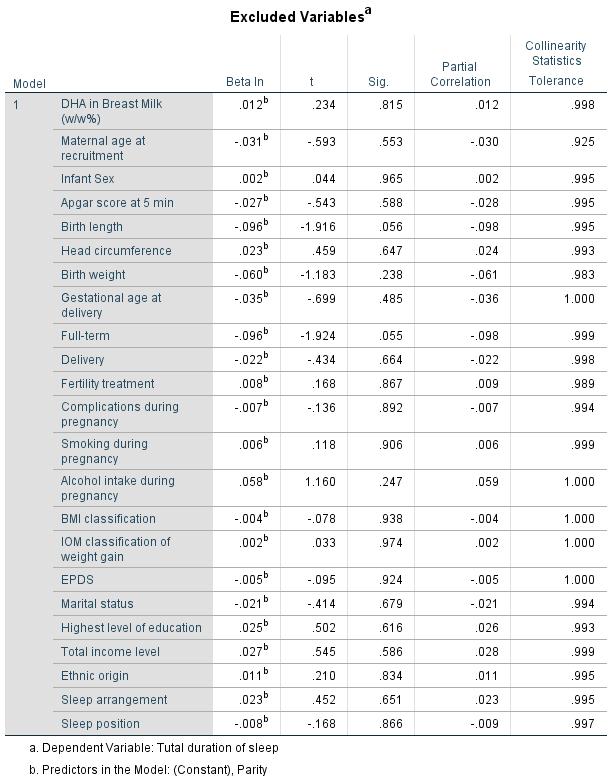
154 138
155 B) 139
156 140
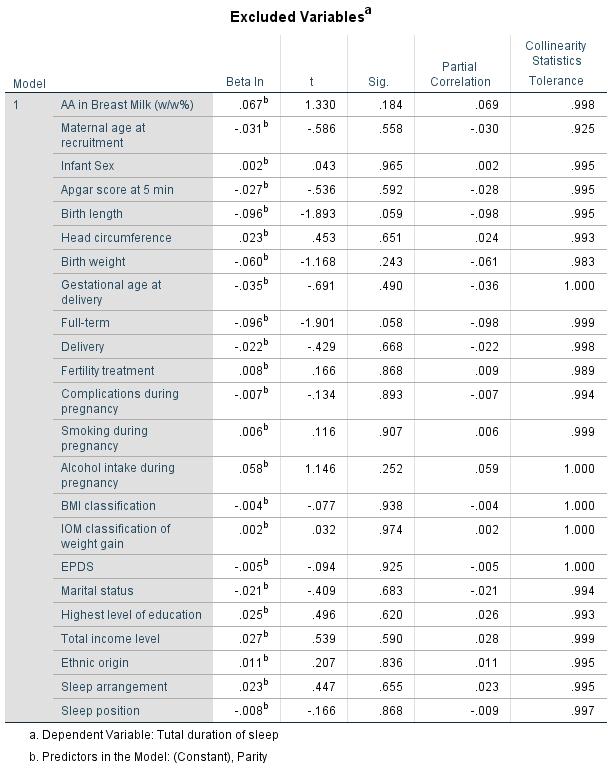
157 141
158 C) 142
159 143
160 144
161 Table A.9 Univariate regression analysis of parent-reported total daily duration of infant crying with each of A) DHA B) AA and C) AA:DHA in breast milk in exclusively breast-fed infants A) 145
162 B) 146
163 C) 147
164 Table A.10 Step-wise multiple regression analysis of parent-reported total daily duration of infant crying with each of A) DHA B) AA and C) AA:DHA in breast milk in exclusively breastfed infants A) 148
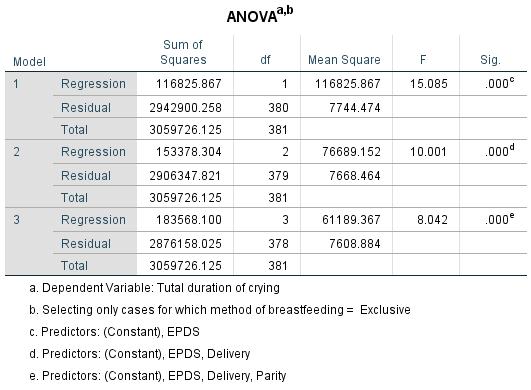
165 149
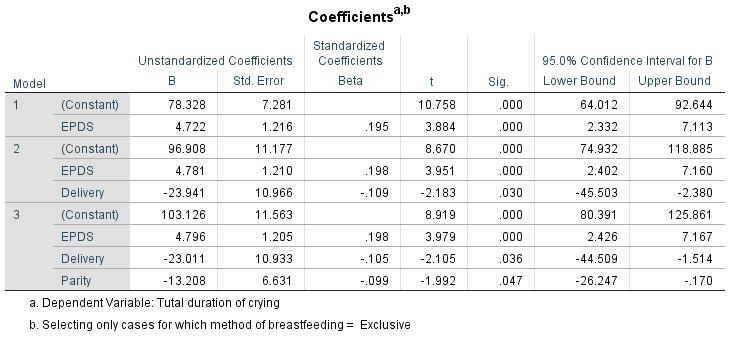
166 150
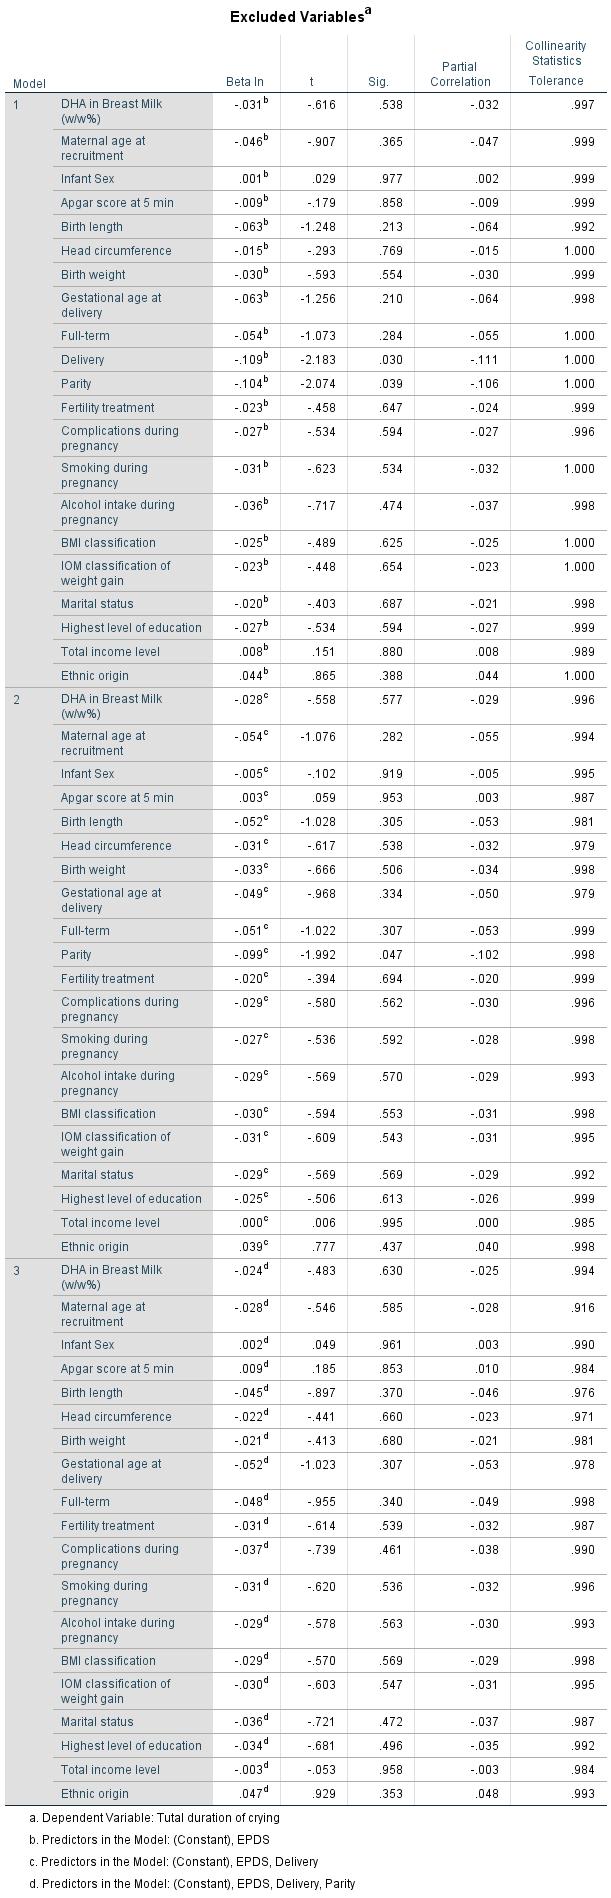
167 151
168 B) 152
169 153
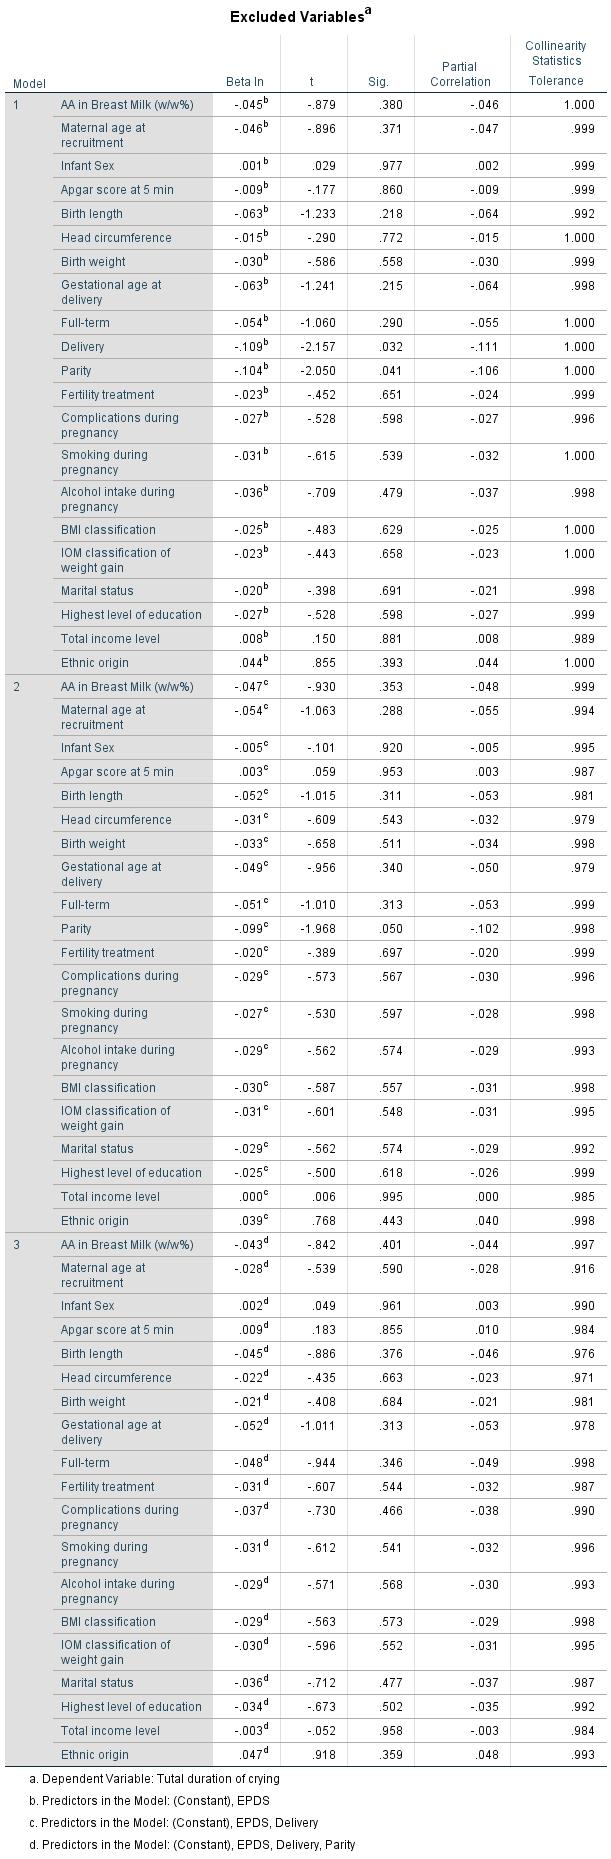
170 154
171 C) 155
172 156
173 157


174 Table A.11 Binary logistic regression analysis of parent-reported total periods of infant persistent crying with each of AA in breast milk in exclusively breast-fed infants 158
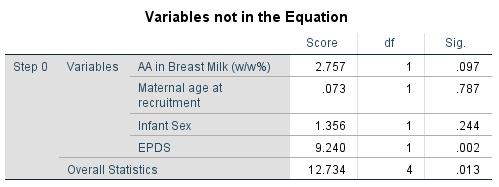

175 159
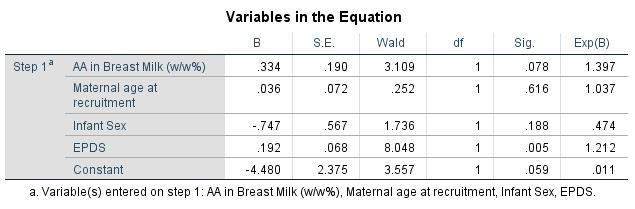
176 160
Seafood consumption, the DHA content of mothers' milk and prevalence rates of postpartum depression: a cross-national, ecological analysis
 Seafood consumption, the DHA content of mothers' milk and prevalence rates of postpartum depression: a cross-national, ecological analysis 1 Journal of Affective Disorders: Volume 69, Issues 1-3, May 2002,
Gender-specific differences in essential fatty acid metabolism
 Note: for non-commercial purposes only Gender-specific differences in essential fatty acid metabolism Tamás Decsi and Kathy Kennedy Department of Paediatrics, University of Pécs, Pécs, Hungary Nutrition
Professor, of Human Nutrition
 ω-3 fatty acids: The Effects during Pregnancy and Breast feeding Antonis Zampelas Professor, of Human Nutrition Director, Laboratory of Food Chemistry and Human Nutrition, Department of Food Science and
Fabio Akira Ito. Technical Services South America Pharma Ingredients & Services. Internal
 Fabio Akira Ito Technical Services South America Pharma Ingredients & Services 1 Omega-3s and Health Benefits 2 Production of Omega-3 products 3 Argentinian Market 2 Definition of Major Omega-3 Polyunsaturated
Facts on Fats. Ronald P. Mensink
 Facts on Fats Ronald P. Mensink Department of Human Biology NUTRIM, School for Nutrition, Toxicology and Metabolism Maastricht University Maastricht The Netherlands Outline of the Presentation Saturated
: Overview of EFA metabolism
 Figure 1 gives an overview of the metabolic fate of the EFAs when consumed in the diet. The n-6 and n-3 PUFAs when consumed in the form of dietary triglyceride from various food sources undergoes digestion
Carlo Agostoni Fondazione IRCCS Department of Maternal and Pediatric Sciences University of Milan, Italy
 Carlo Agostoni Fondazione IRCCS Department of Maternal and Pediatric Sciences University of Milan, Italy Energy Protein Fat quality docosahexaenoic acid Micronutrients Vitamin D Dieting during lactation?
FATS The Facts. compiled by the Nestlé Research Center
 FATS The Facts compiled by the Nestlé Research Center Dietary fats are a public health concern Dietary fats are necessary for ensuring optimal health. Recent dietary guidelines focus on fat quality and
Role of DHA in Early Life Nutrition in the First 1000 days
 Role of DHA in Early Life Nutrition in the First 1000 days Role of DHA in Early Life Nutrition in the First 1000 days Professor Barbara School of Medicine, University of Wollongong, NSW, Australia Docosahexaenoic
Understanding the potential of cognitive ingredients. Dr Carrie Ruxton Freelance Dietitian
 Understanding the potential of cognitive ingredients Dr Carrie Ruxton Freelance Dietitian Cognitive health important across the lifecycle Higher IQ Diet & Supplements Brain development Slower cognitive
Do pigs benefit from omega-3 fatty acids?
 Do pigs benefit from omega-3 fatty acids? Denise Beaulieu Assistant Professor Animal & Poultry Science Introduction What are omega-3 fatty acids? Outline Why would we consider augmenting the diet of growing
Wise Food & Lifestyle Choices For Better Overall Health THE IMPORTANCE OF OMEGA-3 IN YOUR DIET FOOD FOR THOUGHT
 Wise Food & Lifestyle Choices For Better Overall Health THE IMPORTANCE OF OMEGA-3 IN YOUR DIET FOOD FOR THOUGHT WHY OMEGA-3 FATS MATTER Did you know omega-3 fats are vital for your health? They play important
Table 1: Dietary Sources of Omega-3 and Omega-3 Fatty Acids. Fatty Acid. Food Sources. (i) Omega-6 Types. LA, linoleic acid (18:2 n-6)
 Omega-6 Types. LA, linoleic acid (18:2 n-6)") As for saturated and monounsaturated fatty acids, the omega-6 and omega-3 polyunsaturated fatty acids (PUFA) are chemically linked to fat structures known as triglycerides in the various foods and oils
As for saturated and monounsaturated fatty acids, the omega-6 and omega-3 polyunsaturated fatty acids (PUFA) are chemically linked to fat structures known as triglycerides in the various foods and oils
OPINION. of the French Food Safety Agency on the update of French population reference intakes (ANCs) for fatty acids. Maisons-Alfort, 1 March 2010
 for fatty acids. Maisons-Alfort, 1 March 2010") Maisons-Alfort, 1 March 2010 OPINION THE DIRECTOR GENERAL of the French Food Safety Agency on the update of French population reference intakes (ANCs) for fatty s 1. REVIEW OF THE REQUEST The French Food
Maisons-Alfort, 1 March 2010 OPINION THE DIRECTOR GENERAL of the French Food Safety Agency on the update of French population reference intakes (ANCs) for fatty s 1. REVIEW OF THE REQUEST The French Food
There are three major types of omega-3 fatty acids that are ingested in foods and used by the body:
 Long-chain fatty acids (LC-PUFAs: ARA, DHA and EPA) AT A GLANCE Introduction LC-PUFAs or long chain polyunsaturated fatty acids are mainly found in the form of two families of conditionally essential fatty
Future directions for nutritional and therapeutic research in omega-3 3 lipids
 Future directions for nutritional and therapeutic research in omega-3 3 lipids Philip Calder Professor of Nutritional Immunology University of Southampton Aim To review dietary sources and intakes of long
of Nebraska - Lincoln
 University of Nebraska - Lincoln DigitalCommons@University of Nebraska - Lincoln Nutrition & Health Sciences Dissertations & Theses Nutrition and Health Sciences, Department of 5-2013 Reliability and validity
Understanding the Science behind Guiding Stars
 Understanding the Science behind Guiding Stars The Guiding Stars nutrition guidance program is based on national and international dietary recommendations and aligns with the most current 2015 Dietary
Maternal and Infant Nutrition Briefs
 Maternal and Infant Nutrition Briefs A research-based newsletter prepared by the University of California for professionals interested in maternal and infant nutrition March/April 2003 New Guidelines on
The Role of LCPUFA in Obesity. M.Tom Clandinin. The Alberta Institute for Human Nutrition The University of Alberta Edmonton, Alberta, Canada
 The Role of LCPUFA in Obesity by M.Tom Clandinin The Alberta Institute for Human Nutrition The University of Alberta Edmonton, Alberta, Canada How big is the Conceptual Problem? Some assumptions: 150lb
Comment from Professor Holub:
 The Medical Officer and associates for Toronto Public Health have just released a major Technical Report entitled 'Fish Consumption: Benefits and Risks for Women in Childbearing Years and Young Children'.
Differentiating omega-3 fatty acids from SPMs (specialized pro-resolving lipid mediators)
") NIHR Southampton Biomedical Research Centre in nutrition Differentiating omega-3 fatty acids from SPMs (specialized pro-resolving lipid mediators) Philip Calder Professor of Nutritional Immunology University
NIHR Southampton Biomedical Research Centre in nutrition Differentiating omega-3 fatty acids from SPMs (specialized pro-resolving lipid mediators) Philip Calder Professor of Nutritional Immunology University
Essential Fatty Acids Essential for Good Health SIE
 Page 1 of 6 Essential Fatty Acids Essential for Good Health SIE By Yousry Naguib, PhD Essential fatty acids (EFAs) must be obtained through the diet and cannot be synthesized by the human body. EFAs are
Fatty Acids: The Basics
 Fatty Acids: The Basics Fatty Acids 101 Fatty acids are necessary nutrients found in our food. The problem is how much we eat of each: The historical ratio of omega-6s to omega- 3s may have been 1-to-1.
LIPIDOMIC PROFILE MEMBRANE Assessment of the lipidomic profile of the erthyrocyte membrane
 TEST RESULTS: Cod. ID: 123456 CCV: 2c9 Date: 01/01/2013 Patient: Rossi Mario Rapport de: NatrixLab Via Cavallotti, 16 42122 Reggio Emilia Aut.n. 67 del 26.01.10 Direttore Sanitario Dott. Michele Cataldo
The effect of FADS genotypes, fatty acids, and fish intake on mental development in children
 The effect of FADS genotypes, fatty acids, and fish intake on mental development in children Results from the ALSPAC study Eva Lattka Colin D Steer, Pauline M Emmett, Norman Klopp, Thomas Illig and Berthold
Lipid & Fat: Overview
 Lipid & Fat: Overview What is a lipid? Triglycerides, Phospholipids and Sterols Triglycerides = Fat Saturated & unsaturated Essential fatty acids ü Omega 3 & Omega 6 Trans fat Why do you need fat? How
Dietary Fat Guidance from The Role of Lean Beef in Achieving Current Dietary Recommendations
 Dietary Fat Guidance from 1980-2006 The Role of Lean Beef in Achieving Current Dietary Recommendations Penny Kris-Etherton, Ph.D., R.D. Department of Nutritional Sciences Pennsylvania State University
Fatty Acids and Their Importance for Human Health
 bio vis DIAGNOSTIK Fatty Acids and Their Importance for Human Health Summary Dietetic Principles of Fatty Acids and Diagnostic Options at biovis Diagnostik www.biovis.de www.thanyapurahealth.com Fatty
OUTLINE. The need for fat. What is fat? Types of fats. Dietary sources of the different types of fat
 DIETARY FATS OUTLINE The need for fat What is fat? Types of fats Dietary sources of the different types of fat Evidence for cardiovascular health benefit of fish omega-3 and omega-6 fatty acids Possible
Lipids Types, Food Sources, Functions
 Lipids Types, Food Sources, Functions What Are Lipids? Lipids Diverse group of molecules that are insoluble in water Fats The lipid content of diets and foods 1 Lipids in Body Cells and Tissues Types of
High Alpha-Linolenic Acid Intake; Detrimental to DHA Status?
 High Alpha-Linolenic Acid Intake; Detrimental to DHA Status? This article at a glance The conversion of alpha-linolenic acid (ALA) to longer chain and more desaturated omega-3 polyunsaturated fatty acids
FOOD-CT FOOD-CT EARNEST
 FOOD-CT-2005-007036 EARNEST EARly Nutrition programming- long term follow up of Efficacy and Safety Trials and integrated epidemiological, genetic, animal, consumer and economic research Instrument: Thematic
FOCUS. Ann Nutr Metab 2016;69(suppl 1):23 28 Docosahexaenoic Acid and Neurodevelopmental Outcomes of Term Infants by Suzanne Meldrum and Karen Simmer
:23 28 Docosahexaenoic Acid and Neurodevelopmental Outcomes of Term Infants by Suzanne Meldrum and Karen Simmer") FOCUS The importance of DHA during CNS development has led to the hypothesis that early diet modulation of DHA may alter the normal trajectory of brain development. Docosahexaenoic Acid and Neurodevelopmental
FOCUS The importance of DHA during CNS development has led to the hypothesis that early diet modulation of DHA may alter the normal trajectory of brain development. Docosahexaenoic Acid and Neurodevelopmental
Heart Health and Fats
 ww Heart Health and Fats By Marie Spano, M.S., R.D., C.S.C.S., Contributing Editor Dietary-fat recommendations for heart health are more specific now then ever, breaking down different types of polyunsaturated
QUANTITY VERSUS QUALITY OF FAT IN THE DIET. Marius Smuts
 QUANTITY VERSUS QUALITY OF FAT IN THE DIET Marius Smuts Centre of Excellence in Nutrition marius.smuts@nwu.ac.za CONTENT Background on fatty acids Roles of Essential fats Quantity of fat in the diet Quality
Activity 3-F: Micronutrient Activity Station
 Activity 3-F: Micronutrient Activity Station 1 Vitamin A deficiency 1 Instructions Please read through this Vitamin A information package and discuss amongst your group. You have 15 minutes to review this
Aquaculture s Role In Nixing the 6, and Eating More Omega-3 s
 Aquaculture s Role In Nixing the 6, and Eating More Omega-3 s EPA & DHA most clinically studied ingredient in history Over 2400 on Omega-3s The First 1000 Days of Life Encourage omega-3 intake in women
OBJECTIVE. Lipids are largely hydrocarbon derivatives and thus represent
 Paper 4. Biomolecules and their interactions Module 20: Saturated and unsaturated fatty acids, Nomenclature of fatty acids and Essential and non-essential fatty acids OBJECTIVE The main aim of this module
Results! In This Issue. Toxic Heavy Metals and Inflammatory Pathways Continued on page 2. Results RNA
 For Integrative Practitioners Results! The Journal of Results RNA Issue V In This Issue Toxic Heavy Metals and Inflammatory Pathways... 2 Toxic Heavy Metals and Inflammatory Pathways By Lyn Hanshew, M.D.
Activity 3-F: Micronutrient Activity Station
 Activity 3-F: Micronutrient Activity Station 1 Vitamin A deficiency 1 Instructions Please read through this Vitamin A information package and discuss amongst your group. You have 15 minutes to review this
Omega-3 requirements - length matters!
 Omega-3 requirements - length matters! http://www.rejuvenal.info/ images/terminology/omega3.png Professor Peter Howe Nutritional Physiology Research Centre University of South Australia Food Industry Forum
Lisa Sasson Clinical Assistant Professor NYU Dept Nutrition and Food Studies
 Lisa Sasson Clinical Assistant Professor NYU Dept Nutrition and Food Studies Introduction Nutrients Components of food required for the body s functioning Roles: Provide energy Building material Maintenance
Case study: An overview of progress on modifying the composition of meat in relation to dietary guidelines for heart health
 Case study: An overview of progress on modifying the composition of meat in relation to dietary guidelines for heart health Katleen Raes Stefaan De Smet Ghent University Laboratory for Animal Nutrition
Nutritional Recommendations for the Diabetes Managements
 In the name of God Nutritional for the Diabetes Managements Zohreh Mazloom. PhD Shiraz University of Medical Sciences School of Nutrition and Food Sciences Department of Clinical Nutrition OVERVIEW Healthful
MULTIPLE CHOICE. Choose the one alternative that best completes the statement or answers the question.
 Exam Name MULTIPLE CHOICE. Choose the one alternative that best completes the statement or answers the question. 1) Which of the following is TRUE about essential fatty acids? 1) A) No vegetables contain
Understanding Ingredients. Fats and Oils
 Understanding Ingredients Fats and Oils Topics Types of Fats and Oils Structures of Fats and Oils Nutritive Value of Fats and Oils Choice and Storage of Fats and Oils Uses of Fats and Oils in Cooking /
Dietary Reference Values: a Tool for Public Health
 HOGE GEZONDHEISRAAD Dietary Reference Values: a Tool for Public Health CONSEIL SUPERIEUR DE LA SANTE Belgian Dietary Reference Values for Energy and Macronutrients: FATS G. De Backer Brussels, February
Omega-3 Fatty Acid Status in Overweight Pregnant Women of Louisiana
 Louisiana State University LSU Digital Commons LSU Master's Theses Graduate School 2015 Omega-3 Fatty Acid Status in Overweight Pregnant Women of Louisiana Adriana Virginia Gaitan Louisiana State University
The Effects of Lipids on the Body
 The Effects of Lipids on the Body Review: 3 general types 1. Triglycerides Major type of fat found in food and in bodies 2. Phospholipids In body: Carry food back and forth across cell membranes In food:
Depression, omega 3 fatty acid therapy 13
 Subject Index Adhesion molecules fish oil effects 12, 13 omega 3 fatty acid desaturase transfection effects on expression in endothelial cells 31 Alzheimer s disease (AD), omega 6 fatty acid/omega 3 fatty
Lipids. PBHL 211 Darine Hachem, MS, LD
 Lipids PBHL 211 Darine Hachem, MS, LD Outline Functions of lipids in our body Types of lipids Sources of lipids Recommendation of fat intake Fat association with heart diseases Provide energy (9Kcal/g
Subject: Codex Committee on Nutrition and Foods for Special Dietary Uses:
 Ms Janine Lewis 25 November 2016 Principal Nutritionist Codex Contact Point, Department of Agriculture and Water Resources GPO Box 858 Canberra ACT 2601 Email: Codex.Contact@agriculture.gov.au Dear Janine,
Maternal and Infant Nutrition Briefs
 Maternal and Infant Nutrition Briefs January/February 2004 A research-based newsletter prepared by the University of California for professionals interested in maternal and infant nutrition What are Infants
ESSENTIAL FATTY ACIDS - RED CELL
 Healthscope Functional Pathology 1868 Dandenong Road, Clayton, Victoria 3168, Australia www.functionalpathology.com.au ABN 62 006 823 089 T 1300 55 44 80 F 03 8540 5555 infofp@healthscope.com.au LAB No:
Essential Fatty Acids in Human Breastmilk
 Essential Fatty Acids in Human Breastmilk Center for Studies of Sensory Impairment, Ageing and Metabolism (CeSSIAM) Heike Rolker September 2017 1 Overview (1)About me (2)Essential Fatty Acids a. In Human
Long-chain n-3 fatty acids in seafood and child nutrition
 Long-chain n-3 fatty acids in seafood and child nutrition Lotte Lauritzen, Faculty of Life Sciences, Copenhagen University, Denmark LL 24/4-2007, DTU ph.d.course Nordic recommendations Infants 6-12 mo
Executive summary. 9 Executive summary
 Executive summary In, the former ood and Nutrition Council of the Netherlands published dietary reference intakes. These were primarily aimed at the prevention of deficiency symptoms. In recent years,
13/09/2012. Dietary fatty acids. Triglyceride. Phospholipids:
 CARDIOVASCULAR DISEASES (CVD) and NUTRITION Major cause of morbidity & mortality in Canada & other developed countries e.g., majority of approved health claims on food labels relate to lowering CVD Relation
All About Essential Fatty Acids
 By Cassandra Forsythe-Pribanic, PhD, RD, CSCS To many people, fat is one of those three-letter words that instils fear of heart disease, obesity, and a lifetime of bad hair days (I m kidding about that
SCIENTIFIC OPINION. EFSA Panel on Dietetic Products, Nutrition and Allergies (NDA) 2, 3. European Food Safety Authority (EFSA), Parma, Italy
 2, 3. European Food Safety Authority (EFSA), Parma, Italy") EFSA Journal 2011;9(4):2130 SCIENTIFIC OPINION Scientific Opinion on the substantiation of a health claim related to alpha-linolenic acid and contribution to brain and nerve tissue development pursuant
EFSA Journal 2011;9(4):2130 SCIENTIFIC OPINION Scientific Opinion on the substantiation of a health claim related to alpha-linolenic acid and contribution to brain and nerve tissue development pursuant
Dietary Fats & Health
 Dietary Fats & Health Navigating the Slippery Slope Ed Cox, M.D. Fat is good for you Repeat after me: Fat in my diet is good for me The myth USDA, American Heart Assn, American Cancer Society have kept
Impact of trans fats on health EFSA s work related to trans Fatty acids
 Setting the scene Impact of trans fats on health EFSA s work related to trans Fatty acids Prof. Ambroise Martin Member of the EFSA WG on DRVs (former chair 2006-2015) and NDA Panel 2006-2015 (former chair
Metabolism and functional effects of plantderived omega 3 fatty acids in humans
 Metabolism and functional effects of plantderived omega 3 fatty acids in humans Article Accepted Version Creative Commons: Attribution Noncommercial No Derivative Works 4.0 Baker, E. J., Miles, E. A.,
Optimising lipid nutrition in early developing flatfish larvae
 Optimising lipid nutrition in early developing flatfish larvae Dr Gordon Bell, Nutrition Group, Institute of Aquaculture, University of Stirling, Stirling FK9 4LA, Scotland, U.K. What are essential fatty
Omega-3 fatty acids in clinical nutrition
 Omega-3 fatty acids in clinical nutrition Alastair Forbes With thanks to Jon Shaffer, UK and many ESPEN colleagues Omega-3 fatty acids in clinical nutrition Review of lipids in nutrition Why and how lipids
The Role of Docosahexaenoic Acid in the First 1,000 Days
 The Role of Docosahexaenoic Acid in the First 1,000 Days Editors Maria Makrides, Adelaide, S.A. Jatinder Bhatia, Augusta, Ga. Editorial Board Jatinder Bhatia, Augusta, Ga. Carlos Lifschitz, Buenos Aires
Lipid & Fat: Overview
 Lipid & Fat: Overview What is a lipid? Triglycerides, Phospholipids and Sterols Triglycerides = Fat Saturated & unsaturated Essential fatty acids ü Omega 3 & Omega 6 Trans fat Why do you need fat? How
Metabolic Programming. Mary ET Boyle, Ph. D. Department of Cognitive Science UCSD
 Metabolic Programming Mary ET Boyle, Ph. D. Department of Cognitive Science UCSD nutritional stress/stimuli organogenesis of target tissues early period critical window consequence of stress/stimuli are
Polyunsaturated fatty acid content of breast milk from women with and without gestational diabetes mellitus
 Louisiana State University LSU Digital Commons LSU Master's Theses Graduate School 2009 Polyunsaturated fatty acid content of breast milk from women with and without gestational diabetes mellitus Julissa
DIETARY LIPIDS, IMMUNE FUNCTION AND PATHOGENESIS OF DISEASE IN FISH
 DIETARY LIPIDS, IMMUNE FUNCTION AND PATHOGENESIS OF DISEASE IN FISH Santosh P. Lall and Joyce E. Milley National Research Council Canada, Institute for Marine Biosciences, 1411 Oxford Street, Halifax,
ALTERNATIVE SOURCES OF OMEGA-3 OILS FOR BARRAMUNDI, Lates calcarifer, AQUACULTURE
 ALTERNATIVE SOURCES OF OMEGA-3 OILS FOR BARRAMUNDI, Lates calcarifer, AQUACULTURE By Ramez Alhazzaa B.Sc., Grad. Dip. Animal Husbandry A thesis submitted in fulfilment of the requirements for the degree
Weight Loss NOTES. [Diploma in Weight Loss]
![Weight Loss NOTES. [Diploma in Weight Loss]](/thumbs/82/86567947.jpg "Weight Loss NOTES. [Diploma in Weight Loss]") Weight Loss NOTES [Diploma in Weight Loss] Fat s: The good, the bad and the ugly Fat s function in your body 1. Energy stores 2. Muscle fuel 3. Transportation 4. Cell membrane 5. Padding 6. Muscle fuel
Weight Loss NOTES [Diploma in Weight Loss] Fat s: The good, the bad and the ugly Fat s function in your body 1. Energy stores 2. Muscle fuel 3. Transportation 4. Cell membrane 5. Padding 6. Muscle fuel
Weeks 25 to Birth. Major Events in weeks 31-35
 The Third Trimester Weeks 25 to Birth 7 th Month 8 th Month 9 th Month Major Events in Weeks 26-30 Cerebral cortex of brain develops rapidly Fetus is 17 long and weighs 3 lbs Major Events in weeks 31-35
Roles of Lipids in the body
 Roles of Lipids in the body 1- Energy storage : Lipids contain a lot of calories in a small space. Since Lipids are generally insoluble in polar substances such as water, they are stored in special ways
Full Analyses of Meal Plans Summary Tables
 Is a vegetarian diet adequate? Concepts and Controversies in Plant-based Nutrition Meeting the Nutrient Reference Values on a Vegetarian Diet: Full Analyses of Meal Plans Summary Tables An Australian first,
Copyright 2018 DPO International. All right reserved
 Following up on our previous exclusive article Healthy Fats for Children, we have highlighted why healthy fats are vital in children s growth and development. To further emphasize the benefits of healthy
BASF Canola oil: Convenient Healthy Food for Your Heart and Brain. Andy Beadle UK Parliamentary Food and Health Forum 16th March 2010
 e BASF Canola oil: Convenient Healthy Food for Your Heart and Brain Andy Beadle UK Parliamentary Food and Health Forum 16th March 2010 Plant biotechnology at BASF BASF Plant Science Plant Science Sweden
Nutrition & Health Claims
 1 Nutrition & Health Claims European Regulation 1924/2006 Jean Pottier FPS Health, Food Chain Safety and Environment Division Food, Feed and other consumption product 2 1 L Echo, 5/09/08 3 4 2 5 General
Prevention of Food Allergy. From Pre-conception to Early Post- Natal Life
 Prevention of Food Allergy From Pre-conception to Early Post- Natal Life Does Atopic Disease Start in Foetal Life? [Jones et al 2000] Foetal cytokines are skewed to the Th2 type of response Suggested that
Estimating intake of omega-3 fatty acids during pregnancy
 Graduate Theses and Dissertations Graduate College 2010 Estimating intake of omega-3 fatty acids during pregnancy Rebecca Me Filipowicz Iowa State University Follow this and additional works at: http://lib.dr.iastate.edu/etd
David M. Klurfeld Agricultural Research Service Beltsville, MD
 David M. Klurfeld Agricultural Research Service Beltsville, MD Disclaimers The views presented here are those of the speaker and do not necessarily reflect official positions of the USDA or the Agricultural
Current perceptions regarding the importance and safety of fish consumption and omega-3 fatty acid supplementation among pregnant women
 Eastern Michigan University DigitalCommons@EMU Master's Theses and Doctoral Dissertations Master's Theses, and Doctoral Dissertations, and Graduate Capstone Projects 2010 Current perceptions regarding
Re: Food-frequency questionnaire for assessing long-chain ω-3 fatty-acid intake
 University of Wollongong Research Online Faculty of Science, Medicine and Health - Papers Faculty of Science, Medicine and Health 2013 Re: Food-frequency questionnaire for assessing long-chain ω-3 fatty-acid
Nutritional Risk Factors for Peripheral Vascular Disease: Does Diet Play a Role?
 Nutritional Risk Factors for Peripheral Vascular Disease: Does Diet Play a Role? John S. Lane MD, Cheryl P. Magno MPH, Karen T. Lane MD, Tyler Chan BS, Sheldon Greenfield MD University of California, Irvine
Pro-health effects of active substances of Omee3 med bars for proper growth and development of children.
 Pro-health effects of active substances of Omee3 med bars for proper growth and development of children. Presently, there is no doubt that essential polyunsaturated fatty acids (PUFA)* omega-3 and omega-6
The New Folic Acid. What does choline do? Does the need for choline increase during pregnancy and lactation? Yes.
 ? The New Folic Acid Although discovered in 1862, choline wasn t recognized as a nutrient essential for human health until 1998 when the Food and Nutrition Board of the Institute of Medicine established
THE EFFECT OF OMEGA-3 AND OMEGA-6 POLYUNSATURATED FATTY ACIDS ON ILLNESS IN CHILDREN UP TO 4 YEARS OF AGE. Amanda M. Foiles
 THE EFFECT OF OMEGA-3 AND OMEGA-6 POLYUNSATURATED FATTY ACIDS ON ILLNESS IN CHILDREN UP TO 4 YEARS OF AGE by Amanda M. Foiles Submitted to the graduate degree program in Dietetics and Nutrition and the
Dyerberg Discovery. Greenland Eskimos have low rates of heart disease while their diet is high in saturated fat and cholesterol. That s strange. Why?
 Omega-3 Dyerberg Discovery Greenland Eskimos have low rates of heart disease while their diet is high in saturated fat and cholesterol. That s strange. Why? They eat a large amount of omega-3 (10g /d)
Note: for non-commercial purposes only. Fatty acid composition in blood and obesity in childhood. Marie Standl
 Note: for non-commercial purposes only Fatty acid composition in blood and obesity in childhood Marie Standl Helmholtz Zentrum München Institute of Epidemiology I Munich, 13/03/14 Background Genetic and
Omega-3 Fatty Acids and Athletics. Current Sports Medicine Reports July 2007, 6:
 Omega-3 Fatty Acids and Athletics 1 Current Sports Medicine Reports July 2007, 6:230 236 Artemis P. Simopoulos, MD The Center for Genetics, Nutrition and Health, Washington, DC, USA EIB exercise-induced
MOTION FOR A RESOLUTION
 EUROPEAN PARLIAMT 2009-2014 Plenary sitting 24.2.2011 B7-0000/2011 MOTION FOR A RESOLUTION pursuant to Rule 88(2) of the Rules of Procedure by Glenis Willmott, Daciana Sarbu, Nessa Childers and Karin Kadenbach
Going Coconut over Saturated Fat? Why So Much Confusion? Part 1 Interpreting Conflicting Research
 Going Coconut over Saturated Fat? Why So Much Confusion? Part 1 Interpreting Conflicting Research Disclosures Alice H Lichtenstein Board Member/Advisory Panel Food and Nutrition Board, National Academies
The Potential Effects of Flaxseed and its Related Products on the Reproductive Performances of Sows
 The Potential Effects of Flaxseed and its Related Products on the Reproductive Performances of Sows L. Eastwood and P. Leterme Department of Animal and Poultry Science, University of Saskatchewan Saskatoon,
PREGNANCY PROJECT RACHEL CRAWFORD
 PART I (I-V): PREGNANCY PROJECT RACHEL CRAWFORD I. Identifying data A. First name: Aija B. Description of the individual: Aija is the wife of a gamer who works at Blizzard entertainment in the customer
Cardiovascular risk potential of dietary saturated fats: an update and some implications
 Cardiovascular risk potential of dietary saturated fats: an update and some implications Gerard Hornstra, PhD Med" Prof. Em. of Experimental Nutrition" Maastricht University" The Netherlands" Cardiovascular
NUTRITION IN PREGNANCY & INFANCY
 NUTRITION IN PREGNANCY & INFANCY NUTR 2050 Nutrition for Nursing Professionals Mrs. Deborah A. Hutcheon, MS, RD, LD Lesson Objectives At the end of the lesson, the student will be able to: 1. Define the
Forages, fat, fitness and flavour
 Forages, fat, fitness and flavour Richard Dewhurst and Nigel Scollan Fatty acids in grasses Fatty acids in grass silage Fatty acids and beef Effects of fatty acids on meat appearance and flavour Richard
ZINZINO BALANCE TEST REPORT
 ZINZINO BALANCE TEST REPORT Your id: B286NS749 Date: 23.06.2017 Country: Netherlands Sex: Female Age: 45 BalanceOil: No BalanceShake: No Other omega 3: Yes Indicators Target Your score Your Protection