Tennessee s Tenth Report on Healthcare-Associated Infections: Overview of Report, Methodology, and Format
|
|
|
- Bethany West
- 5 years ago
- Views:
Transcription

1 Tennessee s Tenth Report on Healthcare-Associated Infections: Overview of Report, Methodology, and Format TDH HAI Team September 3, 2015
2 Acknowledgements THA/TCPS for hosting this webinar TDH HAI Team CSTE HAI Data Analysis and Presentation Standardization Workgroup Everyone who collected and reported the data!
 Describe SIR calculations")

3 Objectives Background Explain standardized infection ratio (SIR) Describe SIR calculations Aggregate TN Data Describe structure of Tennessee s report on HAI Draft examples Report for Healthcare Consumers
4 Standardized Infection Ratio (SIR) SIR = Observed O HAIs Predicted P HAIs To calculate O, sum the number of HAIs among a group To calculate P, requires the use of the appropriate aggregate data (risk-adjusted rates) (e.g., national NHSN data for ) SIR > 1.0: # infections are HIGHER than predicted SIR= 1.5: # infections = 50% HIGHER than predicted SIR < 1.0: # infections are LOWER than predicted SIR= 0.4: # infections = 60% LOWER than predicted
5 Facility-Specific Data This report follows minimum thresholds for presenting rates and/or SIRs (based on CDC recommendations): At least 50 device days (central line or urinary catheter days) for CLABSI/CAUTI At least 20 procedures for SSI CMS does not report facility-specific SIRs for facilities with <1.0 predicted infection This report follows this convention and will not report facility-specific SIRs for facilities with <1.0 predicted infection
6 Risk Adjustment
7 CLABSI/CAUTI Risk Adjustment Facility Type Infection Type Location(s) NHSN National Baseline Year(s) Acute Care Hospitals CLABSI CAUTI Adult/Pediatric ICUs and Wards, Neonatal ICUs Adult/Pediatric ICUs and Wards Long-Term Acute Care (LTAC) Facilities Inpatient Rehabilitation Facilities (IRF) CLABSI/CAUTI All locations 2013 CAUTI All IRF locations (includes freestanding IRFs and IRF units within acute care hospitals) 2013
8 Annual NHSN Report Edwards JR et al. Am J Infect Control 2009;37:
9 SSI Risk Adjustment Model Procedures Included* SSI Events Included All SSI SIR All (inpatient and outpatient) Superficial incisional primary SSI Deep incisional primary SSI Organ/space SSI Identified on admission, readmission & via post-discharge surveillance Complex Admission/ Readmission (A/R) SIR Complex 30-day SSI Used for CMS IPPS Inpatient only Inpatient only In-plan only Adult patients (>18 yrs) COLO and HYST Deep incisional primary SSI Organ/space SSI Identified on admission or readmission to your facility Deep incisional primary Organ/space Within 30 days of procedure *Procedures with outlier or missing/incomplete variables are excluded from all SSI SIR models
10 SSI Risk Adjustment COLO HYST All SSI SIR Age Anesthesia ASA, >2vs 2 Duration Endoscope Medical school affiliation Bed size Wound class Age Anesthesia ASA (1, 2, 3/4/5) Duration Endoscope Bed size Complex A/R SIR* Age, 75 vs >75 ASA, >2 vs 2 Duration Endoscope Medical school affiliation Bed size Wound class Age ASA (1, 2, 3/4/5) Duration Bed size
11 Logistic Regression Model Number of predicted infections calculated with a logistic regression model: logit (p ) = α + β1 X1+ β2 X2 + β3 X3 + β4 X4 Patient-level risk adjustment performed, summed across population Risk factors vary by procedure type
12 LabID Event Risk Adjustment LabID Event Adjustment MRSA - Bacteremia CDI CO Admission Prevalence Rate Facility Bed Size ( 400 vs. <400) Major Teaching vs. Other Test Type (NAAT/PCR vs. EIA vs. Other) CO Admission Prevalence Rate Facility Bed Size (>245 vs vs. 100) Major Teaching vs. Graduate Teaching vs. Other
13 Binomial Regression Model Predicted = e ( β0+β1 X1+ β2 X2 ) *patient days SIRs available for data since 2012 Patient- and facility-level risk factors included in adjustment Observed infections: MRSA bacteremia: Number of healthcare-onset MRSA blood LabID events with no previous positive MRSA blood culture within 14 days CDI: Number incident* healthcare-onset CDI LabID events *incident refers to a CDI LabID event from a specimen obtained >8 weeks after the most recent CDI LabID Event (or with no previous CDI LabID Event documented) for that patient
14 State Aggregate Data
15 Tennessee s Tenth Report Aggregate Data State-aggregate data: CLABSI in adult, ped, and neonatal ICUs (Jan 2012-Dec 2014) CLABSI in adult/ped medical, surgical, and med/surg wards (Apr 2014-Dec 2014) CLABSI in LTACs (Jan Dec 2014) CAUTI in adult and pediatric ICUs (Jan Dec 2014) CAUTI in adult/ped medical, surgical, and med/surg wards (Jul 2014-Dec 2014) CAUTI in LTACs and IRFs (Oct Dec 2014) SSI (COLO and HYST) (Jan Dec 2014) SSI (CBGB/C) (Jan Dec 2014) LabID Events (MRSA bacteremia and CDI) for acute care hospitals and LTACs (Jan Dec 2014)
16 Central Line-Associated Blood Stream Infections (CLABSI)
17 CLABSI (Adult/Pediatric ICU) SIRs by Quarter, TN (Jan Dec 2014) Provisional Data
18 CLABSI (Neonatal ICU) SIRs by Quarter, TN (Jul Dec 2014) Provisional Data
19 CLABSI (Adult/Pediatric Wards) SIRs by Quarter, TN (Apr Dec 2014) Provisional Data
20 CLABSI (LTAC) SIRs by Quarter, TN (Jan Dec 2014) Provisional Data
21 CLABSI (LTAC) Crude Rate by Quarter, TN (Jul Dec 2014) Provisional Data
22 Catheter-Associated Urinary Tract Infections (CAUTI)
23 CAUTI (Adult/Pediatric ICU) SIRs by Quarter, TN (Jan Dec 2014) Provisional Data
24 CAUTI (Adult/Pediatric Wards) SIRs by Quarter, TN (Jul Dec 2014) Provisional Data
25 CAUTI (LTAC) SIRs by Quarter, TN (Jan Dec 2014) Provisional Data
26 CAUTI (LTAC) Crude Rate by Quarter, TN (Oct Dec 2014) Provisional Data
27 CAUTI (IRF) SIRs by Quarter, TN (Jan Dec 2014) Provisional Data
28 CAUTI (IRF) Crude Rate by Quarter, TN (Oct Dec 2014) Provisional Data

29 Surgical Site Infections (SSI)
30 SSI (CBGB/C) SIRs by Quarter, TN (Jan Dec 2014) Provisional Data
31 SSI (COLO) SIRs by Quarter, TN (Jan Dec 2014) Provisional Data
32 SSI (HYST) SIRs by Quarter, TN (Jan Dec 2014) Provisional Data
33 Laboratory-Identified (LabID) Events
34 MRSA Bacteremia LabID Event (Acute Care Hospital) SIRs by Quarter, TN (Jan Dec 2014) Provisional Data
35 CDI LabID Event (Acute Care Hospital) SIRs by Quarter, TN (Jan Dec 2014) Provisional Data
36 Healthcare Personnel Influenza Vaccination
37 Healthcare Personnel Influenza Vaccination Data (Acute Care Hospitals) TN FLU SEASON HEALTHCARE PERSONNEL CATEGORY No. MEAN HCP VACCINATION RATE DISTRIBUTION OF HCP VACCINATION RATE 10% 25% 50% 75% 90% 2014/ /2014 Employees % 68.5% 75.8% 86.7% 97.5% 98.7% Licensed Independent Practitioners Students/Trainees/ Volunteers % 29.0% 54.3% 66.6% 91.1% 100% % 49.7% 76.3% 93.1% 100% 100% Overall % 67.2% 73.4% 84.1% 92.1% 96.6% Employees % 65.1% 75.4% 84.6% 96.4% 98.7% Licensed Independent Practitioners Students/Trainees/ Volunteers % 19.4% 35.5% 63.6% 87.5% 97.3% % 37.1% 66.7% 90.0% 99.0% 100% Overall % 63.5% 68.0% 80.8% 90.8% 95.8% Data reported as of August 13, 2015 No. = number of facilities reporting HCP = Healthcare Personnel Provisional Data
38 Healthcare Personnel Influenza Vaccination Data (LTACs) TN, 2014/2015 Flu Season FLU SEASON HEALTHCARE PERSONNEL CATEGORY No. MEAN HCP VACCINATION RATE DISTRIBUTION OF HCP VACCINATION RATE 10% 25% 50% 75% 90% 2014/2015 Employees % 69.1% 84.7% 92.4% 98.4% 99.7% Licensed Independent Practitioners Students/Trainees/ Volunteers % 0.6% 53.6% 74.2% 87.9% 100% % 16.7% 95.2% 98.3% 100% 100% Overall % 48.3% 81.6% 85.8% 91.5% 97.1% Data reported as of August 13, 2015 No. = number of facilities reporting HCP = Healthcare Personnel Provisional Data
39 Healthcare Personnel Influenza Vaccination Data (IRFs) TN, 2014/2015 Flu Season FLU SEASON HEALTHCARE PERSONNEL CATEGORY No. MEAN HCP VACCINATION RATE DISTRIBUTION OF HCP VACCINATION RATE 10% 25% 50% 75% 90% 2014/2015 Employees % 64.1% 74.4% 82.3% 95.8% 97.8% Licensed Independent Practitioners Students/Trainees/ Volunteers % 0.0% 50.0% 70.8% 98.2% 100% % 50.0% 79.2% 95.9% 100% 100% Overall % 63.6% 77.1% 83.7% 95.5% 97.1% Data reported as of August 13, 2015 No. = number of facilities reporting HCP = Healthcare Personnel Provisional Data
40 Facility-Specific Data
41 Overview: Facility-Specific Data Acute Care Hospitals CLABSI in adult, pediatric, and neonatal ICUs ( ); excluding burn and trauma units CAUTI in adult and pediatric ICUs ( ) SSI (COLO and HYST) ( ) LabID Event (MRSA and CDI) ( ) Healthcare Personnel Influenza Vaccination Summary (2014/15 Flu Season)
42 Overview: Facility-Specific Data, cont. Facility-specific CLABSI SIR, all ICUs combined (excluding burn and trauma) and Neonatal ICUs Number of ICUs Number of observed CLABSIs Number of predicted CLABSIs Number of central line-days SIR Graphical representation SIR point estimates + 95% confidence intervals Color coded to reflect statistical significance compared to national (NHSN ) SIR of 1.0
43 Overview: Facility-Specific Data, cont. Facility-specific CAUTI SIR, all ICUs combined Number of ICUs Number of observed CAUTIs Number of predicted CAUTIs Number of urinary catheter days SIR Graphical representation SIR point estimates + 95% confidence intervals Color coded to reflect statistical significance compared to national (NHSN- 2009) SIR of 1.0
44 Overview: Facility-Specific Data, cont. Facility-specific SSI SIR, by procedure (COLO and HYST) Number of observed SSIs Number of predicted SSIs Number of procedures performed SIR Graphical representation SIR point estimates + 95% confidence intervals Color coded to reflect statistical significance compared to national (NHSN ) SIR of 1.0
45 Overview: Facility-Specific Data, cont. Facility-specific SSI SIR, by procedure (COLO and HYST) Note: Facility-specific data uses Complex A/R SIR which includes only: Inpatient Procedures Deep incisional primary (DIP) and Organ/space SSIs SSIs identified during admission (A) or readmission (R) to your facility More details: pdf
46 Overview: Facility-Specific Data, cont. Facility-specific LabID SIR (MRSA and CDI) Number of observed healthcare-onset (HO) events Number of predicted healthcare-onset (HO) events Number of patient days SIR Graphical representation SIR point estimates + 95% confidence intervals Color coded to reflect statistical significance compared to national (NHSN ) SIR of 1.0
47 Overview: Facility-Specific Data, cont. Healthcare Personnel Influenza Vaccination Summary ( ) Healthcare Personnel Vaccinated (%) Employees Licensed Independent Practitioners Students/Trainees/Volunteers Overall Graphical representation Bar graph Color-coded to reflect progress toward HHS Healthy People 2020 Goal (90%)

48 Facility-Specific SIR Figures
49 Interpreting Facility-Specific SIR Figures CAUTI Standardized Infection Ratio (SIR) for Adult and Pediatric Intensive Care Units in Acute Care Facilities, Tennessee, 01/01/ /31/2014 Data Reported as of August 13, 2015 N = number of types of units reporting OBS = observed number of CAUTI PRED = statistically 'predicted' number of CAUTI, based on NHSN baseline data SIR = standardized infection ratio (observed/predicted number of CAUTI) UCD = number of urinary catheter days N/A = Data not shown for facilities with <50 urinary catheter days / SIR not calculated for facilities with <1 predicted infection ** Significantly higher than national baseline ^^ Significantly lower than national baseline * Zero infections, but not statistically significant
50 Interpreting Facility-Specific SIR Figures, cont. CAUTI Standardized Infection Ratio (SIR) for Adult and Pediatric Intensive Care Units in Acute Care Facilities, Tennessee, 01/01/ /31/2014 Standardized infection ratio (SIR), summary measure for each facility Data Reported as of August 13, 2015 N = number of types of units reporting OBS = observed number of CAUTI PRED = statistically 'predicted' number of CAUTI, based on NHSN baseline data SIR = standardized infection ratio (observed/predicted number of CAUTI) UCD = number of urinary catheter days N/A = Data not shown for facilities with <50 urinary catheter days / SIR not calculated for facilities with <1 predicted infection ** Significantly higher than national baseline ^^ Significantly lower than national baseline * Zero infections, but not statistically significant
51 Interpreting Facility-Specific SIR Figures, cont. CAUTI Standardized Infection Ratio (SIR) for Adult and Pediatric Intensive Care Units in Acute Care Facilities, Tennessee, 01/01/ /31/2014 Reporting period: January December 2014 Data Reported as of August 13, 2015 N = number of types of units reporting OBS = observed number of CAUTI PRED = statistically 'predicted' number of CAUTI, based on NHSN baseline data SIR = standardized infection ratio (observed/predicted number of CAUTI) UCD = number of urinary catheter days N/A = Data not shown for facilities with <50 urinary catheter days / SIR not calculated for facilities with <1 predicted infection ** Significantly higher than national baseline ^^ Significantly lower than national baseline * Zero infections, but not statistically significant
52 Interpreting Facility-Specific SIR Figures, cont. CAUTI Standardized Infection Ratio (SIR) for Adult and Pediatric Intensive Care Units in Acute Care Facilities, Tennessee, 01/01/ /31/2014 Facility names in alphabetical order, all ICU types included Data Reported as of August 13, 2015 N = number of types of units reporting OBS = observed number of CAUTI PRED = statistically 'predicted' number of CAUTI, based on NHSN baseline data SIR = standardized infection ratio (observed/predicted number of CAUTI) UCD = number of urinary catheter days N/A = Data not shown for facilities with <50 urinary catheter days / SIR not calculated for facilities with <1 predicted infection ** Significantly higher than national baseline ^^ Significantly lower than national baseline * Zero infections, but not statistically significant
53 Interpreting Facility-Specific SIR Figures, cont. CAUTI Standardized Infection Ratio (SIR) for Adult and Pediatric Intensive Care Units in Acute Care Facilities, Tennessee, 01/01/ /31/2014 Total number of ICU types in each facility Data Reported as of August 13, 2015 N = number of types of units reporting OBS = observed number of CAUTI PRED = statistically 'predicted' number of CAUTI, based on NHSN baseline data SIR = standardized infection ratio (observed/predicted number of CAUTI) UCD = number of urinary catheter days N/A = Data not shown for facilities with <50 urinary catheter days / SIR not calculated for facilities with <1 predicted infection ** Significantly higher than national baseline ^^ Significantly lower than national baseline * Zero infections, but not statistically significant
54 Interpreting Facility-Specific SIR Figures, cont. CAUTI Standardized Infection Ratio (SIR) for Adult and Pediatric Intensive Care Units in Acute Care Facilities, Tennessee, 01/01/ /31/2014 Total number of observed CAUTIs in each facility across all ICUs Data Reported as of August 13, 2015 N = number of types of units reporting OBS = observed number of CAUTI PRED = statistically 'predicted' number of CAUTI, based on NHSN baseline data SIR = standardized infection ratio (observed/predicted number of CAUTI) UCD = number of urinary catheter days N/A = Data not shown for facilities with <50 urinary catheter days / SIR not calculated for facilities with <1 predicted infection ** Significantly higher than national baseline ^^ Significantly lower than national baseline * Zero infections, but not statistically significant
55 Interpreting Facility-Specific SIR Figures, cont. CAUTI Standardized Infection Ratio (SIR) for Adult and Pediatric Intensive Care Units in Acute Care Facilities, Tennessee, 01/01/ /31/2014 Total number of predicted CAUTIs in each facility across all ICUs Data Reported as of August 13, 2015 N = number of types of units reporting OBS = observed number of CAUTI PRED = statistically 'predicted' number of CAUTI, based on NHSN baseline data SIR = standardized infection ratio (observed/predicted number of CAUTI) UCD = number of urinary catheter days N/A = Data not shown for facilities with <50 urinary catheter days / SIR not calculated for facilities with <1 predicted infection ** Significantly higher than national baseline ^^ Significantly lower than national baseline * Zero infections, but not statistically significant
56 Interpreting Facility-Specific SIR Figures, cont. CAUTI Standardized Infection Ratio (SIR) for Adult and Pediatric Intensive Care Units in Acute Care Facilities, Tennessee, 01/01/ /31/2014 Total number of urinary catheter days in each facility across all ICUs Data Reported as of August 13, 2015 N = number of types of units reporting OBS = observed number of CAUTI PRED = statistically 'predicted' number of CAUTI, based on NHSN baseline data SIR = standardized infection ratio (observed/predicted number of CAUTI) UCD = number of urinary catheter days N/A = Data not shown for facilities with <50 urinary catheter days / SIR not calculated for facilities with <1 predicted infection ** Significantly higher than national baseline ^^ Significantly lower than national baseline * Zero infections, but not statistically significant
57 Interpreting Facility-Specific SIR Figures, cont. CAUTI Standardized Infection Ratio (SIR) for Adult and Pediatric Intensive Care Units in Acute Care Facilities, Tennessee, 01/01/ /31/2014 Standardized infection ratio (SIR) for each facility across all ICUs (observed/ predicted) Data Reported as of August 13, 2015 N = number of types of units reporting OBS = observed number of CAUTI PRED = statistically 'predicted' number of CAUTI, based on NHSN baseline data SIR = standardized infection ratio (observed/predicted number of CAUTI) UCD = number of urinary catheter days N/A = Data not shown for facilities with <50 urinary catheter days / SIR not calculated for facilities with <1 predicted infection ** Significantly higher than national baseline ^^ Significantly lower than national baseline * Zero infections, but not statistically significant
 for Adult and Pediatric Intensive Care Units in Acute Care Facilities, Tennessee, 01/01/2014 12/31/2014 Point estimate of the SIR (1.")
58 Interpreting Facility-Specific SIR Figures, cont. CAUTI Standardized Infection Ratio (SIR) for Adult and Pediatric Intensive Care Units in Acute Care Facilities, Tennessee, 01/01/ /31/2014 Point estimate of the SIR (1.9 for Hospital E) Data Reported as of August 13, 2015 N = number of types of units reporting OBS = observed number of CAUTI PRED = statistically 'predicted' number of CAUTI, based on NHSN baseline data SIR = standardized infection ratio (observed/predicted number of CAUTI) UCD = number of urinary catheter days N/A = Data not shown for facilities with <50 urinary catheter days / SIR not calculated for facilities with <1 predicted infection ** Significantly higher than national baseline ^^ Significantly lower than national baseline * Zero infections, but not statistically significant
59 Facility-Specific HCP Influenza Vaccination Figures

60 Interpreting Facility-Specific HCP Flu Vaccination Figures

61 Facility-Specific Summary Pages

62 Interpreting Facility-Specific Summary Pages
63 Interpreting Facility-Specific Summary Pages, cont. Facility information: Check this carefully


64 Interpreting Facility-Specific Summary Pages, cont. Healthcare-Associated Infections (HAI) Summary: Details facility-specific reporting requirements for your facility
 Data Table: Summarize")
65 Interpreting Facility-Specific Summary Pages, cont. Standardized Infection Ratio (SIR) Data Table: Summarize facility-specific 2014 data

66 Interpreting Facility-Specific Summary Pages, cont. Healthcare Personnel Influenza Vaccination data, 2014/2015 Influenza Season
67 SIR Caterpillar Plots <1 Predicted Infection
68 SIR Caterpillar Plots Reporting Period: for CLABSI, CAUTI, SSI for LabID Events (MRSA/CDI)
69 SIR Caterpillar Plots Number of unit types reporting (CLABSI/CAUTI only)
70 SIR Caterpillar Plots Number of observed infections
71 SIR Caterpillar Plots Number of predicted infections
72 SIR Caterpillar Plots Number of: Central line days (CLABSI) Urinary catheter days (CAUTI) Procedures (SSI) Patient days (MRSA/CDI LabID Events)
73 SIR Caterpillar Plots Standardized infection ratio (SIR) Observed/Predicted Infections
74 SIR Caterpillar Plots 2014 Tennessee SIR
75 SIR Caterpillar Plots NHSN Baseline SIR
76 SIR Caterpillar Plots Point estimate of the SIR (1.4 for 2012)
77 SIR Caterpillar Plots Interpretation: This facility s 2014 SIR (0.8) was not significantly different from the NHSN baseline SIR of 1
78 TN s Report on HAIs for Healthcare Consumers


79 Report for Healthcare Consumers Written to an audience of healthcare consumers Simplified tables and information
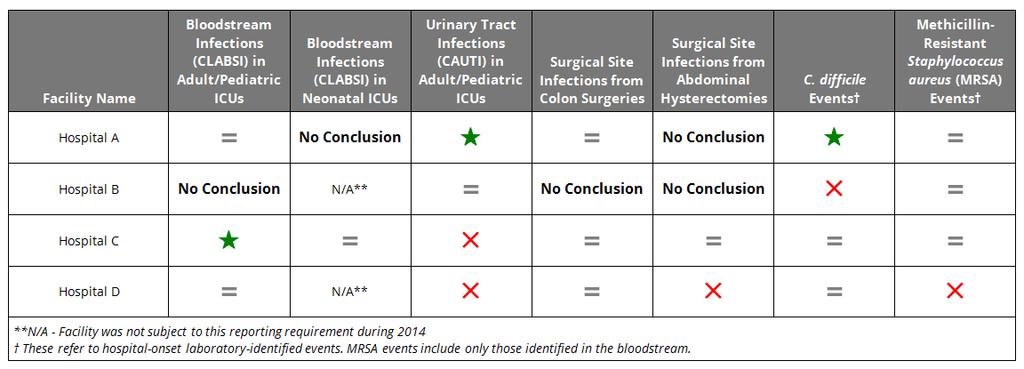
80 Interpreting HAI Data Tables How Does This Facility Compare to the National Experience? Colors and symbols are used to help you quickly understand and interpret the facility s data. This is the take-home message about healthcare-associated infections in this facility. Indicates that the facility had fewer infections than were predicted (better than the national experience) = Indicates that the facility had about the same number of infections as were predicted (same as the national experience) Indicates that the facility had more infections than were predicted (worse than the national experience) No Conclusion: Indicates that this facility reported data, but there was not enough information to make a reliable comparison to the national experience (number of predicted infections was less than 1).

81 HAI Data Tables

82 HAI Data Tables
83 Interpreting Healthcare Worker Flu Vaccination Data Tables How Does This Facility Compare to the Healthy People 2020 Goal? 1. Vaccination is higher (better) than the Healthy People 2020 Goal: better 2. Vaccination is similar to the Healthy People 2020 Goal: = same 3. Vaccination is lower (worse) than the Healthy People 2020 Goal: worse

84 Healthcare Worker Flu Vaccination Data Tables
85 Frequently Asked Questions (FAQs)
86 FAQs Q: My facility entered 9 HYST procedures but I only see 3. Why? A: In this report, we use the Complex Admission/Readmission SIR. This metric only includes inpatients procedures, and deep incisional primary (DIP) and organ/space SSIs identified during admission or readmission to your facility.
87 FAQs Q: This report shows 22 LabID events but I entered 30 for Why? A: The LabID SIR includes healthcare-onset events only (i.e., specimen was collected on or after day 4 of admission). For MRSA, only blood specimens are included. If you entered an event that was within 14 days of another event for the same location and the same patient, it is not included in the SIR, but may still appear on your line list.
88 FAQs Q: My facility s name is incorrect in the report. A: If your facility s name has changed since the last report, you need to notify the HAI team by sending an to HAI.Health@tn.gov. Q: My facility s bed size is listed incorrectly A: We use the 2014 NHSN annual survey to gather this information for the 10 th report. If your survey is wrong, please correct it and notify us via HAI.Health@tn.gov.
89 FAQs Q: The person who should have received the preview report didn t receive it OR Someone who should not have received the preview report received it A: Please let us know at HAI.health@tn.gov
90 Questions? Contact TDH HAI Team at with any corrections by close of business Tuesday, September 8th
Reporting Options History of NHSN
 The National Healthcare Safety Network (NHSN) and Ambulatory Surgery Centers Ashlie Dowdell HAI Surveillance Coordinator Wisconsin Division of Public Health June 10, 2014 Objectives Provide an overview
NHSN Tips for CMS Hospital IQR Program: MRSA Bacteremia and CDI LabID Healthcare Personnel Influenza Vaccination
 NHSN Tips for CMS Hospital IQR Program: MRSA Bacteremia and CDI LabID Healthcare Personnel Influenza Vaccination Maggie Dudeck, MPH, CPH Epidemiologist National Provider Education Webcast May 1, 2013 National
Nancy Hailpern, Director, Regulatory Affairs K Street, NW, Suite 1000 Washington, DC 20005
 Summary of Infection Prevention Issues in the Centers for Medicare & Medicaid Services (CMS) FY 2014 Inpatient Prospective Payment System (IPPS) Final Rule Hospital Readmissions Reduction Program-Fiscal
August 29, Dear Dr. Berwick:
 August 29, 2011 Donald Berwick, MD Administrator Centers for Medicare & Medicaid Services U.S. Department of Health and Human Services 200 Independence Avenue, SW Room 445-G Washington, DC 20201 Re: Proposed
Knowledge to Practice; Applying New Skills
 Knowledge to Practice; Applying New Skills Linda R. Greene, RN, BS, MPS,CIC UR Highland Hospital Rochester, NY linda_greene@urmc.rochester.edu Kim M. Delahanty, RN, BSN, PHN,MBA/HCM,CIC UCSD Health System
Improving Influenza Vaccination Rates in Critical Access Hospitals 10/26/2016
 Improving Influenza Vaccination Rates in Critical Access Hospitals 10/26/2016 Objectives Provide an overview of OP 27 Influenza Vaccination Among Healthcare Personnel (HCP) and IMM 2 Immunization for influenza
Troubleshooting Audio
 Welcome! Audio for this event is available via ReadyTalk Internet streaming. No telephone line is required. Computer speakers or headphones are necessary to listen to streaming audio. Limited dial-in lines
APIC NHSN Webinar 9/8/2015. Topic Overview. Overall Learning Objectives
 APIC NHSN Webinar Janet Brooks, Cindy Gross, Denise Leaptrot, & Eileen Scalise Subject Matter Experts September 9, 2015 National Center for Emerging and Zoonotic Infectious Diseases Place Descriptor Here
Healthcare Personnel Safety Component. Healthcare Personnel Vaccination Module Influenza Vaccination Summary. Outpatient Dialysis Facilities
 Healthcare Personnel Safety Component Healthcare Personnel Vaccination Module Influenza Vaccination Summary Outpatient Dialysis Facilities National Center for Emerging and Zoonotic Infectious Diseases
CCHHSQualityDashboard-DRAFT
 CCHHSQualityDashboard-DRAFT9..8 Falswith Injury Pressure Injury(Stage I&IV) Aug-7 Nov-7 Feb-8 May-8 Aug-8 Aug-7 Nov-7 Feb-8 May-8 Aug-8 0 4 9 8 5 5 6 5 HospitalAcquiredConditions 07Q 07Q4 08Q 08Q 0.00
Great Lakes Partners for Patients: Hospital Improvement Innovation Network - Encyclopedia of Measures Frequently Asked Questions
 Great Lakes Partners for Patients: Hospital Improvement Innovation Network - Encyclopedia of Measures Frequently Asked Questions Contents Great Lakes Partners for Patients: Hospital Improvement Innovation
PPS Exempt Cancer Hospital Quality Reporting (PCHQR) Program Relationship Matrix of Program Measures by Years and Quarters
 Program Relationship Matrix of Program Measures by Years and Quarters") PPS Exempt Cancer Quality (PCHQR) Relationship Matrix of Measures by and This reference document for PCHQR participants provides the following: Specific measures with their National Quality Forum (NQF)
PPS Exempt Cancer Quality (PCHQR) Relationship Matrix of Measures by and This reference document for PCHQR participants provides the following: Specific measures with their National Quality Forum (NQF)
Medicare Value Based Purchasing Andrew B. Wheeler Vice President of Federal Finance
 Medicare Value Based Purchasing - 101 Andrew B. Wheeler Vice President of Federal Finance What is Medicare s VBP System? Incentive program to improve outcomes, safety, patient satisfaction, and efficiency
Great Lakes Partners for Patients: Hospital Improvement Innovation Network - Encyclopedia of Measures Frequently Asked Questions
 Great Lakes Partners for Patients: Hospital Improvement Innovation Network - Encyclopedia of Measures Frequently Asked Questions Contents Great Lakes Partners for Patients: Hospital Improvement Innovation
Surgical Site Infection (SSI) Surveillance Update (with special reference to Colorectal Surgeries)
 Surveillance Update (with special reference to Colorectal Surgeries)") Surgical Site Infection (SSI) Surveillance Update (with special reference to Colorectal Surgeries) Where we started and where we re going Anjum Khan MBBS MSc CIC Infection Control Professional Department
Surgical Site Infection (SSI) Surveillance Update (with special reference to Colorectal Surgeries) Where we started and where we re going Anjum Khan MBBS MSc CIC Infection Control Professional Department
Advanced Training Program Infection Prevention and Control By Dr. Ahmad Farouk EBFM, MRCGP, CIC
 Advanced Training Program Infection Prevention and Control By Dr. Ahmad Farouk EBFM, MRCGP, CIC Tel: +973 172 80 8 50 Mobile: +973 343 58 323 Fax: +973 a 11446 Address: BMMI Tower, Office 1423, 14 th Floor,
New Mexico Healthcare-associated Infections Annual Report
 New Mexico Healthcare-associated Infections Annual Report Prepared by: New Mexico Healthcare-associated Infections Advisory Committee August 2013 This document and further New Mexico healthcare-associated
Surveillance and Epidemiological Investigation
 Surveillance and Epidemiological Investigation Objectives The participant will be able to identify at least 4 types of data used for surveillance of infections. The participant will be able to define outbreak.
USING THE WEBEX Q&A FEATURE
 USING THE WEBEX Q&A FEATURE All lines are placed on mute to block out background noises. However, you can send in questions to the panelists via the Q&A button. Follow the directions below to use the Q&A
Medicare Hospital Acquired Conditions Reduction Program Andrew B. Wheeler Vice President of Federal Finance
 Medicare Hospital Acquired Conditions Reduction Program - 201 Andrew B. Wheeler Vice President of Federal Finance Value-Based Hospital Acquired Purchasing Conditions FFY 2018 FFY -2016 2020 AHRQ Claims
Troubleshooting Audio
 Welcome Audio for this event is available via ReadyTalk Internet streaming. No telephone line is required. Computer speakers or headphones are necessary to listen to streaming audio. Limited dial-in lines
Quarterly Dialysis Facility Compare - Preview for April 2018 Report DFC Dialysis Facility State: XX Network: 99 CCN: SAMPLE
 Quarterly Dialysis Facility Compare -- Preview for April 2018 Report This Quarterly DFC Preview Report includes data specific to CCN(s): 999999 Purpose of the Report This report provides you with advance
Performance Measure. Inpatient Clinical Process of Care Measures
 Acute Myocardial Infarction (AMI) 's Maryland Hospital Performance Evaluation System: Inpatient s Quality Based Reimbursement () Measures Highlighted in Green (02/27/2014) Inpatient Clinical Process of
Troubleshooting Audio
 Welcome! Presentation slides can be downloaded from www.qualityreportingcenter.com under Upcoming Events on the right-hand side of the page. Audio for this event is available via ReadyTalk Internet streaming.
Troubleshooting Audio
 Welcome! Audio for this event is available via ReadyTalk Internet Streaming. No telephone line is required. Computer speakers or headphones are necessary to listen to streaming audio. Limited dial-in lines
Infectious Diseases-HAI Hawaii Department of Health, Disease Outbreak Control Division. Honolulu, Hawaii. Assignment Description
 Infectious Diseases-HAI Hawaii Department of Health, Disease Outbreak Control Division Honolulu, Hawaii Assignment Description The CSTE Fellow would be assigned to DOCD under the mentorship of Dr. Park
Immunization of HCP. Ed Septimus, MD, FACP, FIDSA, FSHEA. Medical Director Infection Prevention and Epidemiology Clinical Services Group, HCA
 Immunization of HCP Ed Septimus, MD, FACP, FIDSA, FSHEA Medical Director Infection Prevention and Epidemiology Clinical Services Group, HCA Professor Internal Medicine Texas A&M Professor, Distinguished
Validation of HAI Reporting in New Hampshire Hospitals: Data from
 Validation of HAI Reporting in New Hampshire Hospitals: Data from 2014-15 Nancy Reinhalter, RN CCRC JSI Research & Training Institute, Inc. February 22, 2017 ACKNOWLEDGEMENTS JSI Team Priscilla Davis Paddy
CMS Measures - Fiscal Year 2019
 ID Me asure Name NQF # Value- (VBP) - (HACRP) (HRRP) ID Me asure Name NQF # Value- (VBP) - (HACRP) (HRRP) CMS s - Fiscal Year 2019 ID Name NQF # The Centers for Medicare & Medicaid Services (CMS) Improvement
APIC NHSN Webinar. May 16, National Center for Emerging and Zoonotic Infectious Diseases
 National Center for Emerging and Zoonotic Infectious Diseases APIC NHSN Webinar May 16, 2018 Denise Leaptrot Lindsey Weiner LaTasha Powell Dominique Godfrey Disclosures The following speakers discloses
CMS Hospital Inpatient Quality Reporting (IQR) Program Measures for the FY 2019 Payment Update
 Program Measures for the FY 2019 Payment Update") CMS Inpatient Quality Reporting (IQR) Program Measures for the Update Measures Required to Meet IQR Program APU Requirements NHSN Submission CAUTI National Healthcare Safety Network (NHSN) Catheter-Associated
CMS Inpatient Quality Reporting (IQR) Program Measures for the Update Measures Required to Meet IQR Program APU Requirements NHSN Submission CAUTI National Healthcare Safety Network (NHSN) Catheter-Associated
Healthcare Associated Infection Report February 2016 data
 Healthcare Associated Infection Report February 2016 data Section 1 Board Wide Issues Section 1 of the HAIRT covers Board wide infection prevention and control activity and actions. For reports on individual
State of New Hampshire HEALTHCARE-ASSOCIATED INFECTIONS 2013 HOSPITAL REPORT
 of New Hampshire HEALTHCARE-ASSOCIATED INFECTIONS 2013 HOSPITAL REPORT Prepared by New Hampshire Department of Health and Human Services Division of Public Health Services Infectious Disease Surveillance
The Centers for Medicare & Medicaid Services (CMS) Acute Care Hospital Fiscal Year (FY) 2018 Quality Improvement Program Measures
 Acute Care Hospital Fiscal Year (FY) 2018 Quality Improvement Program Measures") ID M easure Name NQF # H os pital M easurement Period H os pital H os pital Value-Bas ed Purchas ing M easurement Period H os pital H ealth Record (EH R) Incentive M easurement Period H os pital H os pital-
ID M easure Name NQF # H os pital M easurement Period H os pital H os pital Value-Bas ed Purchas ing M easurement Period H os pital H ealth Record (EH R) Incentive M easurement Period H os pital H os pital-
NHSN and Public Reporting. Linda R. Greene, RN,MPS,CIC Manager Infection Prevention Highland Hospital Rochester, NY linda_
 1 NHSN and Public Reporting Linda R. Greene, RN,MPS,CIC Manager Infection Prevention Highland Hospital Rochester, NY linda_ greene@urmc.rochester.edu 2 Objectives Describe challenges and opportunities
Measure Applications Partnership. Hospital Workgroup In-Person Meeting Follow- Up Call
 Measure Applications Partnership Hospital Workgroup In-Person Meeting Follow- Up Call December 21, 2016 Feedback on Current Measure Sets for IQR, HACs, Readmissions, and VBP 2 Previously Identified Crosscutting
Troubleshooting Audio
 Welcome! Audio for this event is available via ReadyTalk Internet Streaming. No telephone line is required. Computer speakers or headphones are necessary to listen to streaming audio. Limited dial-in lines
Creating a Quality Improvement Project With Your Flu Data
 Creating a Quality Improvement Project With Your Flu Data Mary Ellen Wiegand, RN, LHRM, CASC, CNOR Quality Improvement Specialist Health Services Advisory Group (HSAG) ------------------------.... IO,UOOWJ'
2016 Hospital Measures
 2016 Hospital Measures Vicki Tang Olson, Stratis Health Statewide Quality Reporting and Measurement System (SQRMS) Annual Forum June 22, 2015 Objectives Share the process used for 2016 hospital measures
NH State HAI Program Overview
 New Hampshire Healthcare-Associated Infections (HAI) Annual NHSN Workshop: February 22, 2017 NH State HAI Program Overview Katrina Hansen, MPH, Chief, Infectious Disease Surveillance Healthcare-Associated
Elizabeth Rausch-Phung, M.D., M.P.H. Director, Bureau of Immunization
 November 2014 Dear Administrator: The purpose of this letter is to inform you that the Healthcare Personnel Influenza Vaccination Report will open on Wednesday, November 19, 2014 and must be electronically
SURGICAL SITE INFECTIONS: SURVEILLANCE & PREVENTION
 SURGICAL SITE INFECTIONS: SURVEILLANCE & PREVENTION Facts There were an estimated 157,500 surgical site infections associated with inpatient surgeries in 2011. SSIs were the most common healthcare-associated
CMS Hospital Inpatient Quality Reporting (IQR) Program Measures for the FY 2020 Payment Update
 Program Measures for the FY 2020 Payment Update") CMS Inpatient Quality Reporting (IQR) Program Measures for the Payment Update Measures Required to Meet IQR Program APU Requirements Healthcare-Associated Infection on CAUTI National Healthcare Safety
CMS Inpatient Quality Reporting (IQR) Program Measures for the Payment Update Measures Required to Meet IQR Program APU Requirements Healthcare-Associated Infection on CAUTI National Healthcare Safety
Appendix G Explanation/Clarification Summary
 Appendix G Explanation/Clarification Summary Summary of Changes for Recommendations Alignment of measures with VBP by fiscal year Measures and service dates were adjusted to be consistent with the FY2016
Weekly Influenza Surveillance Summary
 For more information visit: http://kanehealth.com /flu.htm Weekly Influenza Surveillance Summary WEEK 1 : DECEMBER 31, 2017 -JANUARY 6, 2018 JANUARY 12, 2018 Overview Influenza surveillance for Kane County
Lauren DiBiase, MS, CIC Associate Director Public Health Epidemiologist Hospital Epidemiology UNC Hospitals
 Lauren DiBiase, MS, CIC Associate Director Public Health Epidemiologist Hospital Epidemiology UNC Hospitals Statistics Numbers that describe the health of the population The science used to interpret these
Weekly Influenza Surveillance Summary
 For more information visit: http://kanehealth.com /flu.htm Weekly Influenza Surveillance Summary WEEK 5: JAN. 28-FEB. 3, 2018 FEBRUARY 9, 2018 Overview Influenza surveillance for Kane County Health Department
Centers for Disease Control and Prevention Coordinating Center for Infectious Diseases
 Centers for Disease Control and Prevention Coordinating Center for Infectious Diseases National Center for Preparedness, Detection, and Control of Infectious Diseases Rima Khabbaz, M.D. Director Major
IPAC PANA April 28, Sandra Callery RN MHSc CIC
 IPAC PANA April 28, 2015 Sandra Callery RN MHSc CIC World Youth Day - Toronto 2002 World Youth Day Downsview Park 2002 #1 issue =Heat-related illness. A rehydration ward was established on-site (300 beds)
Weekly Influenza Surveillance Summary
 For more information visit: http://kanehealth.com /flu.htm Weekly Influenza Surveillance Summary WEEK 10: March 0- March 09, 019 Ma rch 15, 019 Overview Influenza surveillance for Kane County Health Department
PIN BENCHMARKING DATA DEFINITIONS DICTIONARY
 CORE MEASURES PIN BENCHMARKING DATA DEFINITIONS DICTIONARY 1 Total number of CAH acute care patient admissions. Report all CAH acute care only patient admissions for the quarter. Exclude CAH swing bed,
SCORES FOR 4 TH QUARTER, RD QUARTER, 2014
 SCORES FOR 4 TH QUARTER, 2013 3 RD QUARTER, 2014 PATIENT SATISFACTION SCORES (HCAHPS): 4 STARS OUT OF 5 (ONLY 4 AREA ACUTE CARE HOSPITALS RECEIVED A 4-STAR RATING. NONE ACHIEVED 5-STARS). STRUCTURAL MEASURES:
Influenza: Wrap- Up and Preview of the Upcoming Season. October 6, 2016 Anita Valiani, MPH
 Influenza: 2015-2016 Wrap- Up and Preview of the Upcoming Season October 6, 2016 Anita Valiani, MPH Anita.valiani@dhhs.nc.gov NC SHARPPS Surveillance for Healthcare-Associated Infections and Resistant
PUBLIC HEALTH OFFICER MANDATE AND HEALTHCARE WORKER VACCINATION
 PUBLIC HEALTH OFFICER MANDATE AND HEALTHCARE WORKER VACCINATION Eric C. McDonald, MD, MPH, FACEP Medical Director, Epidemiology and Immunizations Services, Public Health Services County of San Diego Health
Surgical Site Infection (SSI) Reporting Through NHSN: Tips, Trips and Best Practices
 Reporting Through NHSN: Tips, Trips and Best Practices") Surgical Site Infection (SSI) Reporting Through NHSN: Tips, Trips and Best Practices Kathy Allen-Bridson RN, BSN, MScPH, CIC Nurse Consultant Division of Healthcare Quality Promotion Centers for Disease
Surgical Site Infection (SSI) Reporting Through NHSN: Tips, Trips and Best Practices Kathy Allen-Bridson RN, BSN, MScPH, CIC Nurse Consultant Division of Healthcare Quality Promotion Centers for Disease
Healthcare Personnel Influenza Vaccination Report
 Healthcare Personnel Influenza Vaccination Report Introduction As of Friday, November 1, 2013, the Healthcare Personnel Influenza Vaccination Report is available for facilities to complete through the
Infectious Diseases-HAI Idaho Department of Health and Welfare, Division of Public Health Boise, Idaho. Assignment Description
 Infectious Diseases-HAI Idaho Department of Health and Welfare, Division of Public Health Boise, Idaho Assignment Description The Fellow s assignments will primarily focus on projects within the HAI and
Flu Watch. MMWR Week 3: January 14 to January 20, and Deaths. Virologic Surveillance. Influenza-Like Illness Surveillance
 Flu Watch MMWR Week 3: January 14 to January 2, 218 All data are provisional and subject to change as more reports are received. Geographic Spread South Carolina reported widespread activity this week.
FluSafe: Tool for Tracking Healthcare Worker Immunizations in IIS
 FluSafe: Tool for Tracking Healthcare Worker Immunizations in IIS Aaron Bieringer Data Quality Analyst, MIIC Program September 20, 2012 Outline FluSafe Overview Current Process Proposed Enhancements Next
L. Clifford McDonald, MD. Senior Advisor for Science and Integrity September 16, 2015
 Controversies and Current Issues in Diagnosis, Surveillance, and Treatment of Clostridium difficile infeciton L. Clifford McDonald, MD Senior Advisor for Science and Integrity September 16, 2015 Division
Flu Watch. MMWR Week 4: January 21 to January 27, and Deaths. Virologic Surveillance. Influenza-Like Illness Surveillance
 Flu Watch MMWR Week 4: January 21 to January 27, 218 All data are provisional and subject to change as more reports are received. Geographic Spread South Carolina reported widespread activity this week.
Influenza-Associated Hospitalization and Death Surveillance: Dallas County
 Influenza-Associated Hospitalization and Death Surveillance: Dallas County 2009 2015 Sonya Hughes, MPH, CPH Epidemiology Surveillance Coordinator July 22, 2015 Dallas County Health and Human Services Overview:
National Healthcare Safety Network (NHSN) Prevention Process Measure (PPM) Training for Participation in Network Quality Improvement Activities
 Prevention Process Measure (PPM) Training for Participation in Network Quality Improvement Activities") National Healthcare Safety Network (NHSN) Prevention Process Measure (PPM) Training for Participation in Network Quality Improvement Activities Christi Lines, MPH April 1, 2015 2 3 pm Outline CMS QIP Rule
National Healthcare Safety Network (NHSN) Prevention Process Measure (PPM) Training for Participation in Network Quality Improvement Activities Christi Lines, MPH April 1, 2015 2 3 pm Outline CMS QIP Rule
Seasonal Influenza Report
 Key findings for the 2017 2018 flu season Seasonal Influenza Report 2017 2018 Influenza activity is widely circulating in California. As of week 52 (December 24 30, 2017), the statewide geographic distribution
Sustained CAUTI and CLABSI Improvements Using a Bundled Approach
 Sustained CAUTI and CLABSI Improvements Using a Bundled Approach Experiences of a Level 1 Trauma Center Angela Booth-Jones, PHD, MS, CIC Director, Infection Prevention 1 2 3 Miami Valley Hospital MVH has
End-Stage Renal Disease Quality Incentive Program (ESRD QIP) Status Type NQF Measure Title
 Status Type NQF Measure Title") End-Stage Renal Disease Quality Incentive Program (ESRD QIP) Status Type NQF Measure Title NQF Status ID Implemented Outcome 1454 Proportion of patients with hypercalcemia 0256 Vascular Access Type Catheter
End-Stage Renal Disease Quality Incentive Program (ESRD QIP) Status Type NQF Measure Title NQF Status ID Implemented Outcome 1454 Proportion of patients with hypercalcemia 0256 Vascular Access Type Catheter
Seasonal Influenza Report
 Key findings for the 218 219 flu season Current Week (Week 2) Current Season Summary January 6 January 12, 219 ICU cases under 65 years: Deaths September 3, 218 January 12, 219 3 ICU cases under 65 years:
Using Big Data to Prevent Infections
 Using Big Data to Prevent Infections A thought paper by Scalable Health Big Data Analytics Reduces Infections in Hospitals Healthcare Associated Infections (HAIs) are developed while patients are receiving
Infection Control: Meeting the Challenge
 22nd Annual Midas+ User Symposium June 2 5, 2013 Tucson, Arizona Infection Control: Meeting the Challenge Wednesday, June 5, 2:30 pm The data demands placed on Infection Control departments have significantly
Seasonal Influenza Report
 Seasonal Influenza Report 218 219 CDC Disease Week 45 (November 4 November 1, 218) Updated November 13, 218 Key findings for the 218 219 flu season Current Week (Week 45) Current Season Summary November
COOK COUNTY HEALTH Meaningful Metrics
 COOK COUNTY HEALTH Meaningful Metrics 2018-2019 Ronald Wyatt MD MHA January 18, 2019 2 Meaningful Measures 3 Meaningful Measures Framework Meaningful Measure Areas Achieve: High quality healthcare Meaningful
CMS Hospital IQR Program Measure Comparison Tables FY 2018 (CY 2016) Measures Required to Meet Hospital IQR APU Requirements NHSN Submission
 Measures Required to Meet Hospital IQR APU Requirements NHSN Submission") CMS IQR Program Measure Comparison Tables (CY 2016) NHSN Submission CLABSI Central Line-Associated Bloodstream Infection (CLABSI) Required NHSN CAUTI Catheter-Associated Urinary Tract Infection (CAUTI)
CMS IQR Program Measure Comparison Tables (CY 2016) NHSN Submission CLABSI Central Line-Associated Bloodstream Infection (CLABSI) Required NHSN CAUTI Catheter-Associated Urinary Tract Infection (CAUTI)
Table of Contents. Claims Based Measures Calculated by CMS (Outpatient) Imaging Efficiency Page 10
 Imaging Efficiency Page 10") Current Proposed Quality Measures Table of Contents Inpatient Measures Collected Submitted by Hospital Acute Myocardial Infarction/Emergency Department Page2 Immunization/Heart Failure/Pneumonia/Stroke
Current Proposed Quality Measures Table of Contents Inpatient Measures Collected Submitted by Hospital Acute Myocardial Infarction/Emergency Department Page2 Immunization/Heart Failure/Pneumonia/Stroke
Prevention of CAUTI is discussed in the CDC/HICPAC document, Guideline for Prevention of Catheter-associated Urinary Tract Infection 4.
 Urinary Tract Infection (Catheter-Associated Urinary Tract Infection [CA] and Non-Catheter-Associated Urinary Tract Infection []) and Other Urinary System Infection [USI]) Events Introduction: Urinary
Williamson County Influenza Surveillance
 Williamson County Influenza Surveillance 2014-2015 Williamson County and Cities Health District Weekly Update as of 10-16-2014 (Provisional Data) Current Influenza Activity: Low Number of Reporters by
Questions and Answers for Health Care Worker (HCW) Influenza Immunization Coverage Reporting by Ontario Hospitals and Long-Term Care Homes (LTCHs)
 Influenza Immunization Coverage Reporting by Ontario Hospitals and Long-Term Care Homes (LTCHs)") Questions and Answers for Health Care Worker (HCW) Influenza Immunization Coverage Reporting by Ontario Hospitals and Long-Term Care Homes (LTCHs) Part 1: Reporting for the 2016-2017 season 1. Are HCW
Questions and Answers for Health Care Worker (HCW) Influenza Immunization Coverage Reporting by Ontario Hospitals and Long-Term Care Homes (LTCHs) Part 1: Reporting for the 2016-2017 season 1. Are HCW
Basics of Epidemiology Answer Key
 Basics of Epidemiology Answer Key Pre-Quiz Question (slide 4) Q, A reservoir is the habitat where an infectious disease lives, multiplies and grows. Which of these could be a reservoir? A. Chronic carrier
HEALTHCARE ASSOCIATED INFECTION PREVENTION AND CONTROL REPORT SEPTEMBER 2014
 Borders NHS Board HEALTHCARE ASSOCIATED INFECTION PREVENTION AND CONTROL REPORT SEPTEMBER Aim The purpose of this paper is to update Board members of the current status of Healthcare Associated Infections
Healthcare-Associated Infections Across the Spectrum of Care
 MODULE 9: HEALTHCARE-ASSOCIATED INFECTIONS ACROSS THE SPECTRUM OF CARE Healthcare-Associated Infections Across the Spectrum of Care Susan E. Coffin, MD, MPH UPENN School of Medicine, Department of Pediatrics
2018 CNISP HAI Surveillance Case definitions
 2018 CNISP HAI Surveillance Case definitions The following case definitions for the surveillance of healthcare-associated infections (HAIs) are used by all acute-care hospitals that participate in the
Healthcare Associated Infection Report. April 2016 data
 Healthcare Associated Infection Report Key Healthcare Associated Infection Headlines April 20 data Section 1 Board Wide Issues Section 1 of the HAIRT covers Board wide infection prevention and control
Williamson County Influenza Surveillance
 Williamson County Influenza Surveillance 217-218 Williamson County and Cities Health District Weekly Update as of 12-21-17 (Provisional Data) Last Week s Influenza Activity: Moderate Total Reports Confirmed
Williamson County Influenza Surveillance
 Williamson County Influenza Surveillance 216-217 Williamson County and Cities Health District Weekly Update as of 1-3-17 (Provisional Data) Last Week s Influenza Activity: Low Influenza-like Illness (ILI)
Williamson County Influenza Surveillance Williamson County and Cities Health District Final Report August 25, 2015
 Williamson County Influenza Surveillance 2014-2015 Williamson County and Cities Health District Final Report August 25, 2015 Influenza-like Illness (ILI) and Flu by Week (End Date) Total Reports Confirmed
Table of Contents. Current and Proposed CMS Quality Measures for Reporting in 2017 through 2023 Revised 8/8/2017
 Table of Contents Current and Proposed CMS Quality Measures Inpatient Measures Collected and Submitted by Hospital AMI/ED/IMM/Pneumonia/Sepsis/Stroke Page 2 Surgical Care Improvement/VTE/Perinatal Care/Pediatric
Seasonal Influenza Report
 Key findings for the 2017 2018 flu season Seasonal Influenza Report 2017 2018 Influenza activity remains elevated throughout California. As of 2018 week 9 (February 25 March 3, 2018), the statewide geographic
Prevention of CAUTI is discussed in the CDC/HICPAC document, Guideline for Prevention of Catheter-associated Urinary Tract Infection.
 Urinary Tract Infection (Catheter-Associated Urinary Tract Infection [CA] and Non-Catheter-Associated Urinary Tract Infection []) and Other Urinary System Infection [USI]) Events Introduction: Urinary
2018 Ascension Infection Prevention. 1. Course. 1.1 Infection Prevention. 1.2 Main Objectives
 2018 Ascension Infection Prevention 1. Course 1.1 Infection Prevention 1.2 Main Objectives Additional Objectives Understand the purpose of the Corporate Responsibility Program State examples of expected
Surveillance will occur in all inpatient locations in Kuwait Ministry of Health hospitals.
 Urinary Tract Infection (Catheter-Associated Urinary Tract Infection [CAUTI] Non-Catheter-Associated Urinary Tract Infection [UTI]) Other Urinary System Infection [USI]) Events Settings: Surveillance will
CONEMAUGH HEALTH SYSTEM EMPLOYEE HEALTH POLICY MANUAL
 CONEMAUGH HEALTH SYSTEM EMPLOYEE HEALTH POLICY MANUAL TITLE: INFLUENZA IMMUNIZATION POLICY STATEMENT OF POLICY: The Conemaugh Health System (CHS) is committed to providing a safe and healing environment
Dialysis Event Reporting ESRD Network 8 LAN June 18, 2014
 Dialysis Event Reporting ESRD Network 8 LAN June 18, 2014 Meredith Kanago, MSPH Epidemiologist, Healthcare Associated Infections and Antimicrobial Resistance Program, Tennessee Department of Health Acknowledgements
Update on Healthcare Personnel Influenza Vaccination
 Update on Healthcare Personnel Influenza Vaccination Raymond A. St rikas, MD, MPH Immunization Services Division National Center for Immunization and Respiratory Diseases October 23, 2012 National Center
ARIZONA INFLUENZA SUMMARY Week 1 (1/4/2015 1/10/2015)
") ARIZONA INFLUENZA SUMMARY Week 1 (1/4/2015 1/10/2015) 2014-2015 Season (9/28/2014 10/3/2015) Synopsis: Influenza activity is increasing in Arizona. Arizona reported Widespread activity for week 1. Influenza
ARIZONA INFLUENZA SUMMARY Week 1 (1/4/2015 1/10/2015) 2014-2015 Season (9/28/2014 10/3/2015) Synopsis: Influenza activity is increasing in Arizona. Arizona reported Widespread activity for week 1. Influenza
TITLE OF PRESENTATION
 TITLE OF PRESENTATION Can C. Subtitle difficile of Infection Presentation Rates Be Used to Judge Prevention Success for Hospitals? David P. Calfee, MD, MS Associate Professor of Medicine and Public Health
MBQIP Activities : Data & Resources
 MBQIP Activities 2015-17: Data & Resources Alex Evenson Communications Coordinator Flex Monitoring Team University of Minnesota RHRC November 18, 2015 TASC 90 Webinar Required MBQIP Activities Outpatient
SURGICAL SITE INFECTIONS: SURVEILLANCE & PREVENTION
 SURGICAL SITE INFECTIONS: SURVEILLANCE & PREVENTION Disclosures: I have No conflicts of interest No commercial support No specific product will be endorsed during this presentation Facts There were an
Utah Influenza Report This report contains data through the week ending 12/15/2012 (MMWR week 50).
.") This report contains data through the week ending 12/15/212 (MMWR week 5). Overview of Influenza Surveillance: Surveillance for the 212 213 influenza season officially began on September 3, 212. The Utah
This report contains data through the week ending 12/15/212 (MMWR week 5). Overview of Influenza Surveillance: Surveillance for the 212 213 influenza season officially began on September 3, 212. The Utah
Central Line-Associated Infections (CLABSI) Settings Toolkit
 Settings Toolkit") Central Line-Associated Infections (CLABSI) in Non-Intensive Care Unit (non-icu) Settings Toolkit Activity C: ELC Prevention Collaboratives Alex Kallen, MD, MPH and Priti Patel, MD, MPH Division of Healthcare
Central Line-Associated Infections (CLABSI) in Non-Intensive Care Unit (non-icu) Settings Toolkit Activity C: ELC Prevention Collaboratives Alex Kallen, MD, MPH and Priti Patel, MD, MPH Division of Healthcare