Research Article Epidemic Spread Modeling with Time Variant Infective Population Using Pushdown Cellular Automata
|
|
|
- Ferdinand Parsons
- 5 years ago
- Views:
Transcription
1 Computational Environmental Sciences, Article ID , 10 pages Research Article Epidemic Spread Modeling with Time Variant Infective Population Using Pushdown Cellular Automata Senthil Athithan, 1 Vidya Prasad Shukla, 1 and Sangappa Ramachandra Biradar 2 1 Mody University of Science and Technology, Lakshmangarh, Rajasthan , India 2 SDM College of Engineering, Hubli-Dharwad, Karnataka , India Correspondence should be addressed to Senthil Athithan; senthilathithan@hotmail.com Received 20 July 2014; Revised 3 October 2014; Accepted 5 October 2014; Published 12 November 2014 Academic Editor: Wen-Cheng Liu Copyright 2014 Senthil Athithan et al. This is an open access article distributed under the Creative Commons Attribution License, which permits unrestricted use, distribution, and reproduction in any medium, provided the original work is properly cited. The world without a disease is a dream of any human being. The disease spread if not controlled could cause an epidemic situation to spread and lead to pandemic. To control an epidemic we need to understand the nature of its spread and the epidemic spread model helps us in achieving this. Here we propose an epidemic spread model which considers not only the current infective population around the population but also the infective population which remain from the previous generations for computing thenext generation infected individuals. A pushdown cellularautomata model which is an enhanced version of cellular automata by adding a stack component is being used to model the epidemic spread and the model is validated by the real time data of H1N1 epidemic in Abu Dhabi. 1. Introduction Computational models in epidemics provide insight into dynamics of the disease spread across a geographical region. Givenasmallamountofrelevantrealtimedatathemodel wouldgiveusaftercertainamountoftimewhatwouldbethe epidemic situation across the geographical region. Cellular automata (CA) models are considered to be very handy and efficient in handling the real time simulation problems in epidemiology. The reason behind the simplicity of this CA model is its ability to attain the global behavior from the local behavior by the interaction of its cells [1 3]. The power of CA has been utilized to solve wide variety of problems like solving Weyl, Dirac, and Maxwell equations [4], diffusion equation [5], and Poisson equations [6]. Epidemic spread modeling through cellular automata has been an importance to many of the researchers. An efficient epidemic spread model through CA is given by Hoya White et al. [7]; in this model the population is assumed to be constant andtherulesforthecaareconsideredtobestatic.the movement of population and its effects during an epidemic spread are given by Sirakoulis et al. [8]. The population when grouped under patches and their movement during an epidemic spread are discussed in our earlier work [9]. The spatial pattern and its dynamics along with noise in epidemics are being provided by Sun et al. [10]. Stochastic model for epidemic spread with quarantine and vaccination strategies have been provided by Wang Jeffrey [11]. In all these works discussed above, the susceptible population is infected by the infected population available in the current time step. There are no considerations for the populationswhoareinfectedattheprevioustimesteps.if weconsidertheinfectedpopulationatcurrenttimeast,then the population which was infected at the previous time steps is considered as t 1, t 2,andsoforth.Thisworklargely focusses on how the latent infected population, that is, the ones which are infected at t 1, t 2, has an effect in infecting the current set of susceptible population in a cell. This relates to a question: how could we segregate or handle the infected populations at t 1or t 2? The solution is to append a stack to each cell of the cellular automaton and call the modified CA as pushdown cellular automaton or PCA [12]. The idea
2 2 Computational Environmental Sciences Table 1: Structure of the cell status word. Cell id CPV I value R value M value is to hold the infective population at different time steps at different levels of stack and use them for computation for the next time step accordingly. In this research paper we begin introducing the cellular automata in Section 2.1, then in Section 2.2 we introduce the usage of cellular automata in epidemic spread simulation and the cellular automata with stack configuration would be handled in Section 2.3 followedbyvariousmodificationsin stack configured cellular automata model in the next sections. The results and discussions are dealt with in Section 3 followed by conclusion and the future scope of the model. 2. Materials and Methods 2.1. Cellular Automata. Cellular automata is a universal Turing machine which is capable of solving many complex problems ranging from simulating forest fire spread, landmine detection, robotic movements, and object avoidance to understanding the spread of epidemics [15]. It consists of agridofcells,whichisthebasicbuildingcomponentofa cellular automaton. Each cell could be in one of the finite amount of states. The next state of each cell depends on the state of the current cell and states of the neighboring cells. The neighborhood configuration can be many but mostly Von- Neumann neighborhood or Moore neighborhood is used depending upon which of the surrounding cells we consider for computing the next state of the current cell Cellular Automata for Epidemic Spread. Acellularautomaton can be configured for simulating an epidemic spread. The following assumptions would be applied for configuring the cellular automata. A cell could be in one of the following finite number of states: susceptible, infected, and recovered/removed (dead). We assume the epidemic model to be of SIR type with equal birth and death rate so the population as a whole remains constant. The neighborhood configuration would be of Moore s neighborhood which considers the top, down, left, right, and the diagonal neighbors as well. The population count in each cell is assumed to be constant and no movement between the cells is permitted. Thisassumptionisfortheverybasicmodelwhereasin real time the movement of population between the cells is permitted. The initial configuration of the cellular automata and the cellularstatuswordforeachcellisasdescribedinourwork [9]. The cell status word (CSW) (see Table 1) has five parameters, namely, (1) Cell id which is the current cell denoted by C(x, y), (2) CPV (critical population value) which is the fraction of infected population over total population in the cell, (3) I value which takes Boolean value 0/1: 0 means the cell is free of infective population; 1 means some percentage of cell is infected so we consider that the cell is infected, (4) R value which will also take either 0 or 1 depending upon whether the population inside the cell is recovered from the disease or not, and (5)M valuewhichisthemovementflagforaparticular cell used to control the movement of the population from one cell to another. If the value is 0 it means no movement possible from the cell. The critical population value is computed by CPV = IPC x,y TPC x,y, (1) whereipcrepresentstheinfectedpopulationcountinthecell and TPC represents the total population count in the cell. The critical population value for a cell at the next time step would be the function of the CPVs of the current cell at time t and the CPVs of the neighboring cells; that is, CPV t+1 x,y =fn(cpvt x,y, CPVt x+1,y, CPVt x 1,y, CPVt x,y+1, CPV t x,y 1, CPVt x+1,y+1, CPVt x+1,y 1, CPV t x 1,y 1, CPVt x 1,y+1 ). Sizeofthegridorcellulararraydependsontheuserand the type of geographical area under consideration. The bigger the cellular array is the longer it takes for the simulation to run Pushdown Cellular Automata for Time Variant Infective Population. A modified cellular automata with added stack to each cell is termed as pushdown cellular automata. The concept of time variant infective population comes to importance in the case of population movement across the cells. In each time step a certain percentage of population moves from one cell to another based on the configuration of the cellular array. During the movement a certain percentage of infective, susceptible, and recovered population moves from one cell to another and the count is considered to be random across all the three sets of populations. So some amount of infective population moves from current cell to another, and some remains within the current cell. So there can be two categories of infective population in the current cell, that is, the ones which remain from the previous time step and the ones which couldcomefromanothercelltothecurrentone.theinfective population which remain from the previous time step would be termed as I t 1 and the infective population which come intothecurrentcellwouldbetermedasi t. The degree of infection caused by the newly infected infective population and the infection caused by the older ones would be different. Sothecellupdaterulewillbemodifiedtoaccommodatethe effect of these current infective population and the older ones. Here in this research work we consider three time steps t, t 1, and t 2, respectively. So the stack size would be 3 (plus one to hold the bottom symbol $ which indicates the bottom of the stack). (2)
3 Computational Environmental Sciences 3 Table2:Structureofthecellstatusword. Cell id SP I value R value M value $ Table 3: Structure of the CSW at time t=0. Cell id SP I value R value M value $ Table 4: Structure of the CSW at time t=1. Cell id SP I value R value M value I t 1 $ Table 5: Structure of the CSW at time t=2. Cell id SP I value R value M value I t 2 I t 1 $ 2.4. Modification of CSW with Stack. The cell status word is modified to hold the stack contents for storing the critical population values of the previous time steps. The modified CSW will look like Table 2. CPVpartisreplacedbySP(stackpointer)whichpoints to the top of the stack attached to the current cell. Default value/initial value of the SP would be $ which indicates the bottom symbol of the stack and also the emptiness of the stack. The structure of the CSW during the three time steps is given by Tables 3, 4,and5. In every time step the current cell is updated based on the status of itself and the status of the neighboring cells Configuration of PDCA. The PDCA has the following components. Finite set of states (S, I, R): neighborhood configuration would be Moore neighborhood (all cells surrounding the cell to be considered for update). The neighborhood status is divided into three categories based on the number of infected cells out of the eight neighborhood cells. The status is minimum denoted by m when the number of the infected cells surrounding the current cell is less than 4. The status is half denoted by h when the number of the infected cells surrounding the current cell is either 4 or 5. The status is full denoted by f when the number of the infected cells surrounding the current cell is more than 5. Given below is the various neighborhood status. White indicates susceptible state, red indicates infected state, and green indicates removed or recovered state (Figure 1). Stack of size three is attached to each CSW of the cell with the following stack symbols: $: special symbol to indicate the bottom of the stack, I t 1 : number of infective remaining from the previous time step, I t 2 :numberofinfectivepopulationremainingfromthe previous to previous time step. Transition function (δ)isgivenbythefollowing. Minimum (m) status Half (h) status Full (f) status Figure 1: Neighborhood status configuration. Initially all the cells are assumed to be in the susceptible state (S). Each transition function will be of the following form: δ ( current state of the cell, state of the neighborhood, stack content before transition ) ( state of the cell after transition, stack content after transition ) (i) δ(s, λ, λ) (S, $) (pushing the $ on to the stack before starting the computation). The biological meaning of $ can be considered as the residual infective population whose impact is not severe and remains in every cell: (ii) δ(s, m, $) (S,m,I t 1 $). Whenthecellisinsusceptiblestateandtheneighborhood is in the minimum status with the stack top being $ then the cell remains in susceptible state and the neighborhood also in minimum status and the number of infective population that remainsinthecellwouldbepushedasi t 1 on top of the stack. The biological meaning would be that current location is not infective (which means the number of infective population is less) and surrounding is also having less number of infective population; then in the next time step the cell is not infected and remains in susceptible state: (iii) δ(s, h, $) (S,h,I t 1 $) (I,f,I t 1 $). Whenthecellisinsusceptiblestateandtheneighborhood is in the half status with the stack top being $ then the cell remainsinsusceptiblestateandtheneighborhoodalsoinhalf status and the number of infective population that remains in the cell would be pushed as I t 1 on top of the stack. The other choice of this state to the next time step would be changed to infective state, and the neighborhood status changes from half to full and the I t 1 wouldbepushedontop of the stack. The choice would be selected at random as in real time cases this randomness helps us in introducing the noise factor into the system which is very appropriate since the epidemic situation is a nondeterministic one. As the number of infective population increases around the surroundings the current cell can change from susceptible state to infective state: (iv) δ(s, f, $) (I,f,I t 1 $). Whenthecellisinsusceptiblestateandtheneighborhood is in full status with stack top being $ then the cell changes its state to infective with the neighborhood remaining in
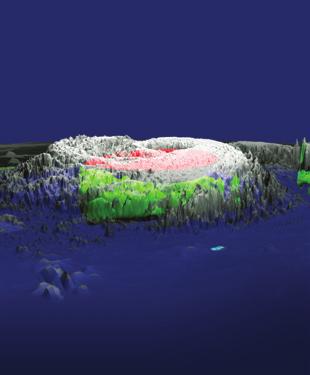
![4 Computational Environmental Sciences Figure 2: Mapping of cellular grid with map of Abu Dhabi [13, 14]. Figure 3: Mapped grid with boundaries blocked used for simulation.](/docs-images/89/99025162/images/4-0.jpg "full status and I t 1 is pushed onto the stack.")
4 4 Computational Environmental Sciences Figure 2: Mapping of cellular grid with map of Abu Dhabi [13, 14]. Figure 3: Mapped grid with boundaries blocked used for simulation. full status and I t 1 is pushed onto the stack. Likewise the remaining transition functions for various states of the PDCA are (i) δ(s, m, I t 1 $) (S,m,I t 2 I t 1 $), (ii) δ(s, h, I t 1 $) (I,h,I t 2 I t 1 $), (iii) δ(s, m, I t 2 I t 1 $) (I,m,I t 1 $), (iv) δ(i, h, I t 2 I t 1 $) (I,h,I t 2 I t 1 $) (R, m, I t 1 $), (v) δ(i, m, I t 1 $) (I,h,I t 2 I t 1 $) (R, m, $), (vi) δ(i, f, I t 1 $) (I,f,I t 2 I t 1 $) (I,h,I t 1 $) Assumptions Regarding the Stack. The following assumptions were taken into account with regard to the stack. (i) Here we consider only two time steps before t 1, t 2 so the stack size becomes three along with the bottom symbol $. If we increase the time steps to unlimited amount, this will lead to the proportionate amount of increase in the size of stack (memory) which will definitely affect the efficiency of the computation. (ii) There is no movement of the population which is inside the stack Setting Up the Model. The first step in designing the cellular automata model is defining the size of the grid. The size of the grid would be inversely proportional to the speed of computation [8, 9]. The grid would be taken with the background of the city of Abu Dhabi since we would be simulating our results with the data of H1N1 database of Abu Dhabi (Figure 2). After mapping the grid with the map of the city the boundaries are drawn for the simulation area (Figure 3). We presume that the epidemic would not spread beyond these boundaries since it is surrounded by sea. Overlapping top andbottomrowsandleftandrightrowsofthegridarenota feasible assumption as the city is surrounded by the sea and three sides. Initial conditions are as follows: (i) cellular array size defined by the user, (ii) number of persons in each cell 100, (iii) I value 0forallcells, (iv) R value 0forallcells, (v) infection period defined by the user as per the type of disease, (vi) M value 0 no movement in initial configuration. The critical population value (CPV) would be now calculated by the following way: CPV = IPCt x,y + IPCt 1 x,y + IPCt 2 x,y. (3) TPC x,y TheCPVofacellinthenexttimestepwouldbecalculated in the same way after transition into a new state based on the transition function Homogeneous PDCA without Movement of Population. In this configuration the number of persons in each cell is kept the same and the movement of population between the cells is also restricted by giving the M value in CSW to 0. This configuration is not the right one to model the real time environment but necessary to understand the basic parameters during the simulation The Algorithm for Homogeneous PDCA (Equal Population in Each Cell with No Movement) Step 0.Gettheinputfromtheuser:thevalueoftr(timeperiod for recovery), tg (number of generations), and ti (time period
5 Computational Environmental Sciences 5 for immunity). Block the boundary cells so as to control the infection spread. Step 1. Initialize the generation counter to 0 and push $ on to the stack for all the cells. Step 2. Initialize all the cells with equal number of populations. Step 3. InitializetheM valueofthecswofallcellsto0to control the movement of population. Step 4. Infect the desired cell. Step 5. Increment the generation counter by 1. Step 6. Find out the region of cells which are infected and the region of cells which are not infected by checking the R value and I value. Step 7. Based on the top symbol of the stack and the status of the neighborhood change the state of the current cell and modify the stack according to appropriate transition function. Step 8.IfR value is 1 then go to 9. Else calculate the CPV value based on the cellular automata update rule to find the fraction of infected population. Step 9. If the number of generations is less than tg then go to step 4. Step 10.Stop Heterogeneous Population with Movement. In this configuration, the population in each cell varies and moreover the movement of population between the cells is also possible. The movement of population from a particular cell is possible only if the cell s CSW-M value is 1; otherwise movement cannot be done from that cell. If we consider a geographical area (city or town) to which the grid is mapped then all those cells which are in line with the streets or bridges of the city are enabled for movement. After deciding which cells allow the movement of population, we need to identify the amount of populationthatwouldbemovingfromthecellandthetime of movement. The amount of population which can move from one cell to another cell would be 5% to 7% and we can deploy two techniques to trigger the movement of the population. First oneisthataftersomerandomamountoftimeorwhenthe infected fraction of population reaches more than 15% of the total population the movement is done. The second choice wouldbemorenaturalinthesensethatthepeopletendto move from one place to another when there would be more infection around Algorithm for Heterogeneous Population with Movement Step 0.Gettheinputfromtheuser:thevalueoftr(timeperiod for recovery), tg (number of generations), and ti (time period for immunity). Step 1. Initialize the generation counter to 0 and set enable field of CSW to 1 for all those cells except the boundary cells. Step 2. Initialize all the enabled cells with variable populations. Step 3.InitializetheM valueofthecswofallcellswhichare in the pathway to 1 in order to enable the movement. Step 4. Push $ on the stack and infect the desired cells. Step 5. Increment the generation counter by 1. Step 6.Findouttheregionofenabledcellswhichareinfected and the region of cells which are not infected by checking the R value and I value. Step 6.1. Based on the top symbol of the stack and the status of the neighborhood change the state of the current cell and modify the stack according to appropriate transition function. Step 7. Check if the infected percentage is greater than 15%. If yesthengotostep8;elsegotostep9. Step 8. Check whether the cell is movement enabled or not by checking M value to be 1. If yes then go to step 8.1; else go to 9. Step 8.1. If the cell is within the boundary limits transfer the 0 to 5% amount of population taken at random to the next cell in the neighborhood to the direction in which there is a pathway available. Step 9.IfR value is 1 then go to 10. Else calculate the CPV value by (3) based on the cellular automata update rule to find the fraction of infected population. Step 10. If the number of generations is less than tg then go to step 4. Step 11.Stop. The PDCA could be slightly modified for considering the movement factor. The modification would be in terms of the neighborhood configuration; instead of using the traditional Moore neighborhood we can use the extended neighborhoodconceptsoastorealisticallymodelthesituation. The extended neighborhood combines the traditional Moore neighborhood and randomly selects the cells across the neighborhood cells. As we extend the neighborhood to broader radius say to 2 or 3 then the region of neighborhood increases for 8 to 16 or 24 cells, so the more the radius the less the probability of contact and infection. So the radius is confined to 1.
6 6 Computational Environmental Sciences If the current cell is C i,j, M ij refers to the Moore neighborhood and E i,j refers to the cells that are chosen randomly; then the extended neighborhood of C i,j =M i,j +E i,j (4) and accordingly the cell update rule will also change for the extended neighborhood [16]: CPV t+1 x,y =fn(cpvt x,y, CPVt x+1,y, CPVt x 1,y, CPVt x,y+1, CPV t x,y 1, CPVt x+1,y+1, CPVt x+1,y 1, CPV t x 1,y 1, CPVt x 1,y+1 )+E i,j. This random choosing of cells in the neighborhood part and the random selection of individual for the movement give us the source for the noise addition in the model as the model we are considering is of nature which is not a deterministic one. The stack rules will remain the same and the transition functions based on stack will also be maintained similar to the previous one Important Parameters in the Epidemic Spread. Susceptible population denoted by S is the population which is not infected but prone to infection when it is around the infected set of population. In this simulation environment we consider all the population initially to be susceptible. There may be many cases where certain population can be immune to the disease under consideration, so they may not be part of the susceptible set. Infected population denoted by I is the population which is actually infected by the disease under consideration. Certain amount of individuals from the susceptible set is infected by the infection rate denoted by β. Here in our model we consider three different types of infective population; those are the ones present in the cell at current time I 0,theones which remain from the previous time step I t 1, and the ones from I t 2 time step. The current ones are considered in the cell and in the next time step it is pushed onto the stack as I t 1. Sincewehavethreedifferenttypesofinfectivepopulation,the infection rate also would be different for them; the infection rate will increase for the infected population if not treated or vaccinated. We define three different infection rates for the three sets of infected population. They are β 0, β 1,andβ 2 for I 0, I t 1,and I t 2, respectively. We can define the relation between the three typesofinfectionratesby (5) β 0 β 1 β 2. (6) The above equation is valid in case there is no treatment or vaccination. So the infection rate increases as the time progresses and the infected individuals would be capable of infecting more numbers of susceptible population: β 0 β 1 β 2. (7) Theaboveequationisapplicablewhenthereisatreatment or vaccination strategy is underway to the infected set of population. Initially when the treatment starts the effect will not be visible but after certain time period the infection rate startsreducing.thatisthereasonwhyβ 1 is greater than both β 0 and β 2. Recovered populations denoted by R are those which are recovered from the infected population and become immunetothedisease.therateofrecoveryfromtheinfected population is given by γ.therecoveryratewouldbedirectly proportional to the level of vaccination strategy used for the infected population. Reproduction number denoted by R 0 which is the important component in the epidemic environment denotes the amount of individuals infected by a single infected individual in a cell placed along with fully susceptible population: R 0 = β μ+γ, (8) where β is the infection rate, μ is the birth and death rate considered to be equal which means that the amount of birth is equal to the amount of death, and γ represents the recovery rate. When R 0 is less than 1 then the system is in infectionfree stable state. When R 0 is greater than 1 the system is in endemic stable state. Always the objective is to reduce the R 0 to less than one by increasing the recovery rate. The above given equation is the general one and for estimating R 0 in the cellular automata paradigm with various radius of neighborhood the solution is given by m 1 1 R 0 =2m(1 4r (r+1) ) (1 e k ), (9) where 2m is the average number of connections per cell, (1 e k ) is the probability that susceptible cells become infected, and r is the neighborhood radius Controlling the Spread of Epidemics. There are various strategies for controlling the epidemics; quarantine and vaccination stand out amongst them Quarantine. There are two terms in the world of epidemic which needs to be clarified before dealing with quarantine. The terms are isolation and quarantine; what is the difference between these two? The clarification rightly given by Center for Disease Control (CDC-USA) [17] is as follows. Isolation. It applies to person who is known to be ill with a contagious disease. Quarantine. It applies to those who have been exposed to a contagiousdiseasebutwhomayormaynotbecomeill. Quarantine strategy is implemented by blocking 9 cells with a boundary and stating that the population outside the cell is susceptible to infection. The probability of the infection would be 1 (1 β) rn where r is the escape rate, which means number of persons who can go through the quarantine defense [11]. This could be more realistic because we consider no quarantine system is full proof. The quarantine is analyzed with10%and25%escaperate.
7 Computational Environmental Sciences 7 Figure 4: Quarantine setup. Quarantine area Boundary The area to be quarantined can be identified using the full status of the stack given in the figure (Figure 4). The stack full status indicates that more numbers of infective population with different infection rates are accumulated when compared to the other region Vaccination. The most common and effective technique in dealing with control of epidemics is the vaccination technique. There can be many methods of vaccination: one is to continuously vaccinate for particular amount of time and the other one is to vaccinate for a small amount of time in intervals which is known as pulse vaccination. Here continuous vaccination after the 30th generation is done for another 10 generations. The epidemic spread simulation techniques help to reach cost effective technique in implementingthevaccination.theareaswherethediseasespread is more have to be identified and vaccinated accordingly. The important concept in vaccination is the efficacy of the vaccine; vaccine efficacy is defined as the reduction in effect of diseaseamongpeoplewhohavebeenvaccinatedcomparedto the effect in unvaccinated people [18]. The influenza vaccine efficacy rate is considered to be 85% [19]. The probability of infection spread in the vaccinated area is (1 r)(1 β) n where r is the efficacy rate. Randomly selected cells which have large number of infective population starting from the 30thgenerationarebeingvaccinatedandtheresultshave been found. Simulation environment: simulation is done using MAT- LABVer.2013(64bit).TheprocessorusedisIntelCore-i5and RAM capacity is 8 GB. 3. Results and Discussion 3.1. Homogeneous Model. Homogeneous model is the model in which there is a fixed amount of population in every cell. A cellular grid (optimal grid size is the tradeoff between time, size, and accuracy) is used to simulate the epidemic spread as per the available surveillance data of H1N1 infection in Abu Dhabi [13, 14]. The black colored blocks in the grid are the boundary which is traced out from the Abu Dhabi city map. We have infected certain cells randomly in the left side ofthegridandstartedthesimulationandthesnapshotsof Table 6: Number of infected population in Abu Dhabi over 12 months [13, 14]. Months Confirmed cases Recovered cases 9-May Jun Jul Aug Sep Oct Nov Dec Jan Feb Mar Apr 2 2 Total each of the 30 generations are provided here which clearly depicts how the infection spreads out in the beginning and is erased out in the end. The last two parts of the figure provide information about the cells in which the augmented stack is full and empty. The epidemic spread is simulated using the data of H1N1 infection in Abu Dhabi [13, 14]overtheperiod of twelve months with the parameters of μ = 1/12; β 0 = 1.32; β 1 = 1.46; β 2 = 1.78.Averageβ comes out to be 1.52, γ = 1.39, and R 0 = The average infection period of a cell as a whole is around 15 to 20 generations (Table 6). Figure 6 shows the curve of SIR model which matches with the ideal epidemic SIR curve and the number of infective population peak during the 4th and 5th month, respectively. Figure 7 givesusthepictureofhowthenumberofinfective population increases during the 4-5th month along with the increase in the number of stacks getting full by I t 2, I t 1, I t. Figure 8 showsusthenumberofconfirmedcaseswith the effect of no quarantine, quarantine with 25% escape rate, and quarantine with 10% escape rate. 10% escape rate is considered to be optimum. Figure 9 gives the picture of how the number of infective population decreases with the random vaccination done every 30 generations across the cells in the grid Heterogeneous Population with Movement. Population movement is enabled in those CSWs where the stacks were full which is identified from Figure 5(k) (Figure 10). Simulation is done for another 300 generations and the infection spread reach is calculated from the start location to the various identified locations in the grid (Table 7). This analysishelpsusinplanningthevaccination,quarantine,and evacuation procedure which is a very important phase in epidemic situation. 4. Conclusion and Future Scope The epidemic spread model using pushdown cellular automata has been considered here in this work to examine the
 Initial status (b)")
 Generation 90")
 Generation 180 (i)")
 Generation 270 (l) Generation")
 Areas")
 to (m)) Simulation results")

8 8 Computational Environmental Sciences (a) Initial status (b) Generation 1 (c) Generation 30 (d) Generation 60 (e) Generation 90 (f) Generation 120 (g) Generation 150 (h) Generation 180 (i) Generation 210 (j) Generation 240 (k) Generation 270 (l) Generation 300 (m) Generation 330 (n) Areas where stacks were full (o) Areas where stacks were empty Figure 5: ((a) to (m)) Simulation results showing the geographical spread of infection. (n) and (o) shows full and empty stack regions.
 R I Confirmed cases 1000 900 800 700 600 500 400 300 200 100 No quarantine 25% escape rate 10% escape rate 2 4 6 8 10 12 Time (months) Susceptibles (S) Infective")
9 Computational Environmental Sciences 9 S(t), I(t), R(t) S Time (months) R I Confirmed cases No quarantine 25% escape rate 10% escape rate Time (months) Susceptibles (S) Infective population (I) Recovered (R) Figure 8: Effect of quarantine. Number of stacks that went full Figure 6: SIR curve for the simulated data. Number of infective population Confirmed cases Time (months) Figure 9: Effect of vaccination. Time (months) Figure 7: Variation of number of infective population over stack fullness. A B Table 7: Number of generations for the infection to reach from start to specified position. Position Infection reaches in generation Start 0 A 64 B 92 C 123 D 197 effects of the time variant infective population that remain in a cell for a certain time period. The effective use of the stack to hold these infective population of the previous time periods and effect of these infective population on the infection spread in the coming time steps are studied with two models: one with the homogeneous population across all the cells with no movements between the cells and the other one with different sizes of population in each cell with movement between the cells across the desired locations. The effect of quarantine and the vaccination process is also beinginvestigatedwiththehomogeneousmodel.theanalysis helps us to understand the nature of the epidemic spread across the geographical region and to plan the quarantine Start Figure 10: Movement enabled cells and start position. and evacuation strategy in case of a pandemic. This model has been tested with the H1N1 data for Abu Dhabi over theperiodoftwelvemonthsfrommay2009toapril2010. Futureworkcanbecarriedoutinthisareabyconsidering 3D cellular automata which can take care of the population density like the people living in buildings on multiple floors. The other variation of considering two different types of influenza infection which has got two different recovery rates also can be explored. Conflict of Interests The authors declare that there is no conflict of interests regarding the publication of this paper. C D
10 10 Computational Environmental Sciences References [1] A. Ilachinski, Cellular Automata A Discrete Universe, World Scientific, [2] M. Sipper, Evolution of Parallel Cellular Machines: The Cellular Programming Approach, Springer, [3] J. von Neumann, TheoryofSelfReproducingAutomata,University of Illinois, Urbana, Ill, USA, [4] I. Bialynicki-Birula, Weyl, Dirac, and Maxwell equations on a lattice as unitary cellular automata, Physical Review D,vol.49, no. 12, pp , [5] B. Chopard and M. Droz, Cellular automata model for the diffusion equation, Statistical Physics, vol. 64, no. 3-4, pp , [6] H. Chen, W. H. Matthaeus, and L. W. Klein, Theory of multicolor lattice gas: a cellular automaton Poisson solver, Computational Physics, vol. 88, no. 2, pp , [7] S.HoyaWhite,A.M.delRey,andG.R.Sànchez, Using cellular automata to simulate epidemic diseases, Applied Mathematical Sciences,vol.3,no.20,pp ,2009. [8] G. C. Sirakoulis, I. Karafyllidis, and A. Thanailakis, A cellular automaton model for the effects of population movement and vaccination on epidemic propagation, Ecological Modelling, vol. 133, no. 3, pp , [9] A. Athithan, V. P. Shukla, and S. R. Biradar, Dynamic cellular automata based epidemic spread model for population in patches with movement, Computational Environmental Sciences,vol.2014,ArticleID518053,8pages,2014. [10] G.-Q. Sun, Z. Jin, L.-P. Song, A. Chakraborty, and B.-L. Li, Phase transition in spatial epidemics using cellular automata with noise, Ecological Research,vol.26,no.2,pp ,2011. [11] B. Wang Jeffrey, School s Out? Designing Epidemic Containment Strategies with a spatial stochastic method, 2010, [12] M. Kutrib, Pushdown cellular automata, Theoretical Computer Science,vol.215,no.1-2,pp ,1999. [13] F. Ahmed, F. A. Hosani, A. Al Mannaie, and O. Harrison, Early outcomes of pandemic influenza (H1N1) 2009 surveillance in Abu Dhabi Emirate, May-August 2009, Eastern Mediterranean Health Journal,vol.18,no.1,pp.31 36,2012. [14] F. A. Rihan, SIR Model of Swine Influenza Epidemic in Abu Dhabi, Public Health Frontier,vol.1,no.4,pp.85 89, [15] Nandita Gandhi and A. Senthil, Optimized Landmine Detection Simulation Using Cellular Automata, Lambert Academic Publications, [16] C. Guan, W. Yuan, and Y. Peng, A cellular automaton model with extended neighborhood for epidemic propagation, in Proceedings of the 4th International Joint Conference on Computational Sciences and Optimization (CSO 11), pp , Yunnan, China, April [17] Centers for Disease Control and Prevention, Understand Quarantine and Isolation, [18] G. A. Weinberg and P. G. Szilagyi, Vaccine epidemiology: efficacy, effectiveness, and the translational research roadmap, Infectious Diseases,vol.201,no.11,pp ,2010. [19] K. M. Neuzil and K. M. Edwards, Influenza vaccines in children, Seminars in Pediatric Infectious Diseases, vol. 13, no. 3, pp , 2002.


11 Waste Management The Scientific World Journal International Ecology Environmental and Public Health Scientifica Ecosystems International Oceanography Submit your manuscripts at International Marine Biology Atmospheric Sciences International Biodiversity Geological Research Computational Environmental Sciences Earthquakes International Forestry Research Geophysics International Applied & Environmental Soil Science Climatology Advances in Environmental Chemistry Advances in Meteorology
Cellular Automata Model for Epidemics
 Cellular Automata Model for Epidemics Sharon Chang UC Davis Physics shschang@ucdavis.edu Cellular automata models are used to simulate the spread of disease across a population. Two types of infections
Simulation of HIV/AIDS distribution using GIS based cellular automata model.
 Biomedical Research 2017; 28 (9): 4053-4057 ISSN 0970-938X www.biomedres.info Simulation of HIV/AIDS distribution using GIS based cellular automata model. Shu Yang 1, Daihai He 2, Jing Luo 3, Weizhong
Mathematical Modelling of Effectiveness of H1N1
 ISSN: 2455-2631 April 216 IJSDR Volume 1, Issue 4 Mathematical Modelling of Effectiveness of H1N1 1 Fenny J. Narsingani, 2 Dr. M.B.Prajapati 1 Assistant Professor, L.D.College of Engineering, Ahmedabad,
Sensitivity analysis for parameters important. for smallpox transmission
 Sensitivity analysis for parameters important for smallpox transmission Group Members: Michael A. Jardini, Xiaosi Ma and Marvin O Ketch Abstract In order to determine the relative importance of model parameters
Strategies for containing an emerging influenza pandemic in South East Asia 1
 Strategies for containing an emerging influenza pandemic in South East Asia 1 Modeling pandemic spread and possible control plans of avian flu H5N1 BBSI, Nicole Kennerly, Shlomo Ta asan 1 Nature. 2005
SIS-SEIQR Adaptive Network Model for Pandemic Influenza
 SIS-SEIQR Adaptive Network Model for Pandemic Influenza WANNIKA JUMPEN,2, SOMSAK ORANKITJAROEN,2, PICHIT BOONKRONG,2 BOONMEE WATTANANON, BENCHAWAN WIWATANAPATAPHEE,2 Department of Mathematics, Faculty
Agent-Based Models. Maksudul Alam, Wei Wang
 Agent-Based Models Maksudul Alam, Wei Wang Outline Literature Review about Agent-Based model Modeling disease outbreaks in realistic urban social Networks EpiSimdemics: an Efficient Algorithm for Simulating
Abstract of the PhD Thesis Intelligent monitoring and early warning system of pandemic viruses
 FACULTY OF AUTOMATION AND COMPUTER SCIENCE Abstract of the PhD Thesis Intelligent monitoring and early warning system of pandemic viruses PhD Student: eng. Adina-Violeta Pop Thesis advisor: Prof.Dr.Eng.
A Flexible Automata Model for Disease Simulation
 A Flexible Automata Model for Disease Simulation Shih Ching Fu and George Milne School of Computer Science and Software Engineering The University of Western Australia 35 Stirling Highway, Crawley, 6009,
Effects of a Vaccine-Adverse Minority on Vaccination Dynamics
 Effects of a Vaccine-Adverse Minority on Vaccination Dynamics Olivia J Conway August 3, 2017 1 1 Abstract Previous research has applied a game-theoretic model to a population s vaccination compliance when
Complete a large project that embodies the major course topics Project should be simple but expandable The project should include:
 CSE 466: Course Project Complete a large project that embodies the major course topics Project should be simple but expandable The project should include: Multiple device communication Deal with constrained
The roadmap. Why do we need mathematical models in infectious diseases. Impact of vaccination: direct and indirect effects
 Mathematical Models in Infectious Diseases Epidemiology and Semi-Algebraic Methods Why do we need mathematical models in infectious diseases Why do we need mathematical models in infectious diseases Why
SEIQR-Network Model with Community Structure
 SEIQR-Network Model with Community Structure S. ORANKITJAROEN, W. JUMPEN P. BOONKRONG, B. WIWATANAPATAPHEE Mahidol University Department of Mathematics, Faculty of Science Centre of Excellence in Mathematics
Module 5: Introduction to Stochastic Epidemic Models with Inference
 Module 5: Introduction to Stochastic Epidemic Models with Inference Instructors:, Dept. Mathematics, Stockholm University Ira Longini, Dept. Biostatistics, University of Florida Jonathan Sugimoto, Vaccine
Flu Watch. MMWR Week 3: January 14 to January 20, and Deaths. Virologic Surveillance. Influenza-Like Illness Surveillance
 Flu Watch MMWR Week 3: January 14 to January 2, 218 All data are provisional and subject to change as more reports are received. Geographic Spread South Carolina reported widespread activity this week.
Modelling the H1N1 influenza using mathematical and neural network approaches.
 Biomedical Research 2017; 28 (8): 3711-3715 ISSN 0970-938X www.biomedres.info Modelling the H1N1 influenza using mathematical and neural network approaches. Daphne Lopez 1, Gunasekaran Manogaran 1*, Jagan
Complete a large project that embodies the major course topics Project should be simple but expandable The project should include:
 CSE 466: Course Project Complete a large project that embodies the major course topics Project should be simple but expandable The project should include: Multiple device communication Deal with constrained
Flu Watch. MMWR Week 4: January 21 to January 27, and Deaths. Virologic Surveillance. Influenza-Like Illness Surveillance
 Flu Watch MMWR Week 4: January 21 to January 27, 218 All data are provisional and subject to change as more reports are received. Geographic Spread South Carolina reported widespread activity this week.
Module 5: Introduction to Stochastic Epidemic Models with Inference
 Module 5: Introduction to Stochastic Epidemic Models with Inference Instructors: Tom Britton, Dept. Mathematics, Stockholm University Ira Longini, Dept. Biostatistics, University of Florida Jonathan Sugimoto,
Simulation of the Spread of Epidemic Disease Using Persistent Surveillance Data
 Excerpt from the Proceedings of the COMSOL Conference 2010 Boston Simulation of the Spread of Epidemic Disease Using Persistent Surveillance Data Yu Liang 1*, Zhenjun Shi 1, Subramania I. Sritharan 2 and
Stochastic Modelling of the Spatial Spread of Influenza in Germany
 Stochastic ling of the Spatial Spread of Influenza in Germany, Leonhard Held Department of Statistics Ludwig-Maximilians-University Munich Financial support by the German Research Foundation (DFG), SFB
Modeling of epidemic spreading with white Gaussian noise
 Article Statistical Physics and Mathematics for Complex Systems December 20 Vol.56 No.34: 3683 3688 doi: 0.007/s434-0-4753-z SPECIAL TOPICS: Modeling of epidemic spreading with white Gaussian noise GU
AN EPIDEMIOLOGIC MODELING AND DATA INTEGRATION FRAMEWORK
 AN EPIDEMIOLOGIC MODELING AND DATA INTEGRATION FRAMEWORK Pfeifer B 1, Seger M 1, Netzer M 1, Osl M 1, Modre-Osprian R 2, Schreier G 2, Hanser F 3, Baumgartner C 1 Abstract In this work a cellular automaton
arxiv: v1 [cs.si] 29 Jan 2018
![arxiv: v1 [cs.si] 29 Jan 2018](/thumbs/75/72689274.jpg "arxiv: v1 [cs.si] 29 Jan 2018") Detecting the impact of public transit on the transmission of epidemics Zhanwei Du 1,* and Yuan Bai 1 1 Jilin University, Changchun, Jilin, 130012, China * duzhanwei0@gmail.com ABSTRACT arxiv:1801.09333v1
Detecting the impact of public transit on the transmission of epidemics Zhanwei Du 1,* and Yuan Bai 1 1 Jilin University, Changchun, Jilin, 130012, China * duzhanwei0@gmail.com ABSTRACT arxiv:1801.09333v1
Modelling to Contain Pandemic Influenza A (H1N1) with Stochastic Membrane Systems: A Work-in-Progress Paper
 with Stochastic Membrane Systems: A Work-in-Progress Paper") Modelling to Contain Pandemic Influenza A (H1N1) with Stochastic Membrane Systems: A Work-in-Progress Paper Lei Xu Key Laboratory of Image Processing and Intelligent Control Department of Control Science
Modelling to Contain Pandemic Influenza A (H1N1) with Stochastic Membrane Systems: A Work-in-Progress Paper Lei Xu Key Laboratory of Image Processing and Intelligent Control Department of Control Science
Contents. Mathematical Epidemiology 1 F. Brauer, P. van den Driessche and J. Wu, editors. Part I Introduction and General Framework
 Mathematical Epidemiology 1 F. Brauer, P. van den Driessche and J. Wu, editors Part I Introduction and General Framework 1 A Light Introduction to Modelling Recurrent Epidemics.. 3 David J.D. Earn 1.1
A Simulation Model Including Vaccination and Seasonality for Influenza A-H1N1 Virus
 Applied Mathematical Sciences, Vol. 10, 2016, no. 26, 1269-1276 HIKARI Ltd, www.m-hikari.com http://dx.doi.org/10.12988/ams.2016.511694 A Simulation Model Including Vaccination and Seasonality for Influenza
Exercises on SIR Epidemic Modelling
 Exercises on SIR Epidemic Modelling 1 Epidemic model (from Wikipedia) An epidemic model is a simplified means of describing the transmission of communicable disease through individuals. The modeling of
Modelling global epidemics: theory and simulations
 Modelling global epidemics: theory and simulations Marc Barthélemy CEA, IPhT, France marc.barthelemy@cea.fr Manchester meeting Modelling complex systems (21-23 june 2010) Outline Introduction Metapopulation
Structured models for dengue epidemiology
 Structured models for dengue epidemiology submitted by Hannah Woodall for the degree of Doctor of Philosophy of the University of Bath Department of Mathematical Sciences September 24 COPYRIGHT Attention
= Λ μs βs I N, (1) (μ + d + r)i, (2)
 (μ + d + r)i, (2)") Advanced Studies in Biology, Vol., 29, no. 8, 383-39 Mathematical Model of the Influenza A(HN) Infection K. Hattaf and N. Yousfi 2 Laboratory Analysis, Modeling and Simulation Department of Mathematics
Advanced Studies in Biology, Vol., 29, no. 8, 383-39 Mathematical Model of the Influenza A(HN) Infection K. Hattaf and N. Yousfi 2 Laboratory Analysis, Modeling and Simulation Department of Mathematics
Use of a Montecarlo simulation model for the re-planning of. bluetongue surveillance in Italy
 Vet. Ital., 4 (3), 36-364 Use of a Montecarlo simulation model for the re-planning of bluetongue surveillance in Italy P. Calistri, A. Giovannini, A. Conte & V. Caporale Istituto Zooprofilattico Sperimentale
Mathematics for Infectious Diseases; Deterministic Models: A Key
 Manindra Kumar Srivastava *1 and Purnima Srivastava 2 ABSTRACT The occurrence of infectious diseases was the principle reason for the demise of the ancient India. The main infectious diseases were smallpox,
Review Article A Modeling and Experiment Framework for the Emergency Management in AHC Transmission
 Computational and Mathematical Methods in Medicine, Article ID 897532, 18 pages http://dx.doi.org/1.1155/214/897532 Review Article A Modeling and Experiment Framework for the Emergency Management in AHC
Information and Communication Technologies EPIWORK. Developing the Framework for an Epidemic Forecast Infrastructure.
 Information and Communication Technologies EPIWORK Developing the Framework for an Epidemic Forecast Infrastructure http://www.epiwork.eu Project no. 231807 D1.1 Analysis of Epidemic Dynamics on Clustered
Mathematical modelling of infectious disease transmission
 Mathematical modelling of infectious disease transmission Dennis Chao Vaccine and Infectious Disease Division Fred Hutchinson Cancer Research Center 11 May 2015 1 / 41 Role of models in epidemiology Mathematical
Modeling Consequences of Reduced Vaccination Levels on the Spread of Measles
 Bridgewater State University Virtual Commons - Bridgewater State University Honors Program Theses and Projects Undergraduate Honors Program 5-2016 Modeling Consequences of Reduced Vaccination Levels on
Telehealth Data for Syndromic Surveillance
 Telehealth Data for Syndromic Surveillance Karen Hay March 30, 2009 Ontario Ministry of Health and Long-Term Care Public Health Division, Infectious Diseases Branch Syndromic Surveillance Ontario (SSO)
FUNNEL: Automatic Mining of Spatially Coevolving Epidemics
 FUNNEL: Automatic Mining of Spatially Coevolving Epidemics By Yasuo Matsubara, Yasushi Sakurai, Willem G. van Panhuis, and Christos Faloutsos SIGKDD 2014 Presented by Sarunya Pumma This presentation has
Mathematical modeling of cholera
 Mathematical modeling of cholera Dennis Chao Center for Statistics and Quantitative Infectious Diseases (CSQUID) Vaccine and Infectious Disease Division Fred Hutchinson Cancer Research Center 22 April,
MAE 298, Lecture 10 May 4, Percolation and Epidemiology on Networks
 MAE 298, Lecture 10 May 4, 2006 Percolation and Epidemiology on Networks Processes on networks Search for information Spreading processes Interplay of topology and function Epidemiology Understanding how
Modeling Influenza Pandemic Response Effectiveness in Canada
 Zack Jacobson ARAD Health Canada zack.jacobson@hc-sc.gc.ca Ben Houston Exocortex Technologies Canada ben@exocortex.org 1.0 INTRODUCTION As the risk of a global influenza pandemic increases there is growing
Infectious disease modeling
 Infectious disease modeling Matthew Macauley Department of Mathematical Sciences Clemson University http://www.math.clemson.edu/~macaule/ Math 4500, Spring 2017 M. Macauley (Clemson) Infectious disease
Network Science: Principles and Applications
 Network Science: Principles and Applications CS 695 - Fall 2016 Amarda Shehu,Fei Li [amarda, lifei](at)gmu.edu Department of Computer Science George Mason University Spreading Phenomena: Epidemic Modeling
Simulation of Influenza Epidemics with a Hybrid Model - Combining Cellular Automata and Agent Based Features
 Simulation of Influenza Epidemics with a Hybrid Model - Combining Cellular Automata and Agent Based Features Štefan Emrich 1), Felix Breitenecker 1), Günther Zauner 2), Nikolas Popper 2), 1) Institute
Timing of vaccination campaigns against pandemic influenza in a population dynamical model of Vancouver, Canada
 Timing of vaccination campaigns against pandemic influenza in a population dynamical model of Vancouver, Canada Jessica M. Conway 1,2, Rafael Meza 2, Bahman Davoudi-Dehagi 2, Ashleigh Tuite 3, Babak Pourbohloul
Research Article Epidemiological Patterns of Varicella in the Period of 1977 to 2012 in the Rijeka District, Croatia
 Epidemiology Research International, Article ID 193678, 4 pages http://dx.doi.org/1.1155/214/193678 Research Article Epidemiological Patterns of Varicella in the Period of 1977 to 212 in the Rijeka District,
Dynamics and Control of Infectious Diseases
 Dynamics and Control of Infectious Diseases Alexander Glaser WWS556d Princeton University April 9, 2007 Revision 3 1 Definitions Infectious Disease Disease caused by invasion of the body by an agent About
MIGRATION, MINES AND MORES: THE HIV EPIDEMIC IN SOUTHERN AFRICA
 MIGRATION, MINES AND MORES: THE HIV EPIDEMIC IN SOUTHERN AFRICA John Hargrove Introduction to the Applications of Mathematics in Biology and Medicine AIMS, Muizenberg 2 July 2012 The colonial map of Africa
Abstract. Keywords. Gelayol Nazari Golpayegani 1, Amir Homayoun Jafari 2,3*, Nader Jafarnia Dabanloo 1
 J. Biomedical Science and Engineering, 2017, 10, 77-106 http://www.scirp.org/journal/jbise ISSN Online: 1937-688X ISSN Print: 1937-6871 Providing a Therapeutic Scheduling for HIV Infected Individuals with
Infectious Disease Epidemiology and Transmission Dynamics. M.bayaty
 Infectious Disease Epidemiology and Transmission Dynamics M.bayaty Objectives 1) To understand the major differences between infectious and noninfectious disease epidemiology 2) To learn about the nature
Simulating the Tumor Growth with Cellular Automata Models
 Simulating the Tumor Growth with Cellular Automata Models S. Zouhri Université Hassan II- Mohammédia, Faculté des Sciences Ben M'sik Département de Mathématiques, B.7955, Sidi Othmane, Casablanca, Maroc
Infectious Disease Spread Prediction Models and Consideration
 1 1 1 SIR BBS SARS truncated SIR truncated Infectious Disease Spread Prediction Models and Consideration Hideo Hirose 1 and Kazuhiro Matsuguma Tatenori Sakumura 1, 1 For infectious disease spread prediction
Introduction to Reproduction number estimation and disease modeling
 Introduction to Reproduction number estimation and disease modeling MISMS Latin America Influenza Meeting and Training Workshop 25 June 2012 Gerardo Chowell & Cécile Viboud Generation time The time from
Type and quantity of data needed for an early estimate of transmissibility when an infectious disease emerges
 Research articles Type and quantity of data needed for an early estimate of transmissibility when an infectious disease emerges N G Becker (Niels.Becker@anu.edu.au) 1, D Wang 1, M Clements 1 1. National
Lauren DiBiase, MS, CIC Associate Director Public Health Epidemiologist Hospital Epidemiology UNC Hospitals
 Lauren DiBiase, MS, CIC Associate Director Public Health Epidemiologist Hospital Epidemiology UNC Hospitals Statistics Numbers that describe the health of the population The science used to interpret these
BIOST/STAT 578 A Statistical Methods in Infectious Diseases Lecture 16 February 26, Cholera: ecological determinants and vaccination
 BIOST/STAT 578 A Statistical Methods in Infectious Diseases Lecture 16 February 26, 2009 Cholera: ecological determinants and vaccination Latest big epidemic in Zimbabwe Support International Vaccine
Towards Real Time Epidemic Vigilance through Online Social Networks
 Towards Real Time Epidemic Vigilance through Online Social Networks SNEFT Social Network Enabled Flu Trends Lingji Chen [1] Harshavardhan Achrekar [2] Benyuan Liu [2] Ross Lazarus [3] MobiSys 2010, San
Mathematical Structure & Dynamics of Aggregate System Dynamics Infectious Disease Models 2. Nathaniel Osgood CMPT 394 February 5, 2013
 Mathematical Structure & Dynamics of Aggregate System Dynamics Infectious Disease Models 2 Nathaniel Osgood CMPT 394 February 5, 2013 Recall: Kendrick-McKermack Model Partitioning the population into 3
USAID s approach to the control of avian and pandemic influenza
 USAID s approach to the control of avian and pandemic influenza Murray Trostle, Dr. PH Deputy Director Avian and Pandemic Influenza Unit USAID December 19, 2006 USAID goals Prevent an influenza pandemic
Middle East respiratory syndrome coronavirus (MERS-CoV) and Avian Influenza A (H7N9) update
 and Avian Influenza A (H7N9) update") 30 August 2013 Middle East respiratory syndrome coronavirus (MERS-CoV) and Avian Influenza A (H7N9) update Alert and Response Operations International Health Regulations, Alert and Response and Epidemic
30 August 2013 Middle East respiratory syndrome coronavirus (MERS-CoV) and Avian Influenza A (H7N9) update Alert and Response Operations International Health Regulations, Alert and Response and Epidemic
LAB 1 The Scientific Method
 From the LAMC Bio 3 Lab Manual 6 th edition, by Mike Reynolds & Stephen Brown Modified by Diane Livio LAB 1 The Scientific Method Objectives 1. Apply the basic principles of the scientific method. 2. Generate
Article Epidemic Analysis and Mathematical Modelling of H1N1 (A) with Vaccination
 with Vaccination") Article Epidemic Analysis and Mathematical Modelling of H1N1 (A) with Vaccination Jagan Mohan Jonnalagadda and Kartheek Gaddam Department of Mathematics, Birla Institute of Technology & Science Pilani,
Article Epidemic Analysis and Mathematical Modelling of H1N1 (A) with Vaccination Jagan Mohan Jonnalagadda and Kartheek Gaddam Department of Mathematics, Birla Institute of Technology & Science Pilani,
MODELLING THE SPREAD OF PNEUMONIA IN THE PHILIPPINES USING SUSCEPTIBLE-INFECTED-RECOVERED (SIR) MODEL WITH DEMOGRAPHIC CHANGES
 MODEL WITH DEMOGRAPHIC CHANGES") MODELLING THE SPREAD OF PNEUMONIA IN THE PHILIPPINES USING SUSCEPTIBLE-INFECTED-RECOVERED (SIR) MODEL WITH DEMOGRAPHIC CHANGES Bill William M. Soliman 1, Aldous Cesar F. Bueno 2 1, 2 Philippine Science
MODELLING THE SPREAD OF PNEUMONIA IN THE PHILIPPINES USING SUSCEPTIBLE-INFECTED-RECOVERED (SIR) MODEL WITH DEMOGRAPHIC CHANGES Bill William M. Soliman 1, Aldous Cesar F. Bueno 2 1, 2 Philippine Science
Block-upscaling of transport in heterogeneous aquifers
 158 Calibration and Reliability in Groundwater Modelling: From Uncertainty to Decision Making (Proceedings of ModelCARE 2005, The Hague, The Netherlands, June 2005). IAHS Publ. 304, 2006. Block-upscaling
MMCS Turkey Flu Pandemic Project
 MMCS Turkey Flu Pandemic Project This is a group project with 2 people per group. You can chose your own partner subject to the constraint that you must not work with the same person as in the banking
2 Motivation from two dependent Markov Chains
 Modeling treatment costs associated with a multi-stage pandemic Michael A. Ekhaus Gibraltar Analytical Minneapolis, Minnesota Email: mekhaus@gibraltaranalytical.com Abstract Abstract: Introduced is an
Some Mathematical Models in Epidemiology
 by Department of Mathematics and Statistics Indian Institute of Technology Kanpur, 208016 Email: peeyush@iitk.ac.in Definition (Epidemiology) It is a discipline, which deals with the study of infectious
Essentials of Aggregate System Dynamics Infectious Disease Models
 Essentials of Aggregate System Dynamics Infectious Disease Models Nathaniel Osgood CMPT 394 February 5, 2013 Comments on Mathematics & Dynamic Modeling Many accomplished & well-published dynamic modelers
What do epidemiologists expect with containment, mitigation, business-as-usual strategies for swine-origin human influenza A?
 What do epidemiologists expect with containment, mitigation, business-as-usual strategies for swine-origin human influenza A? Dr Thomas TSANG Controller, Centre for Health Protection, Department of Health
A Mathematical Approach to Characterize the Transmission Dynamics of the Varicella-Zoster Virus
 Proceedings of The National Conference On Undergraduate Research (NCUR) 2012 Weber State University, Ogden Utah March 29 31, 2012 A Mathematical Approach to Characterize the Transmission Dynamics of the
Global Health Security: Preparedness and Response: can we do better and stay safe?
 Global Health Security: Preparedness and Response: can we do better and stay safe? John Watson Health Protection Directorate, Public Health England Formerly Deputy Chief Medical Officer, Department of
Spreading of Epidemic Based on Human and Animal Mobility Pattern
 Spreading of Epidemic Based on Human and Animal Mobility Pattern Yanqing Hu, Dan Luo, Xiaoke Xu, Zhangang Han, Zengru Di Department of Systems Science, Beijing Normal University 2009-12-22 Background &
Mobile Health Surveillance: The Development of Software Tools for. Monitoring the Spread of Disease
 Mobile Health Surveillance: The Development of Software Tools for Monitoring the Spread of Disease Albert Gerovitch 1 and Andrew Gritsevskiy 2 and Gregory Barboy 3 Abstract Disease spread monitoring data
Tuberculosis Tutorials
 Tuberculosis Tutorials These tuberculosis (TB) tutorials were created for the EMOD QuickStart v1.8. Later versions of the QuickStart may not be completely compatible with these tutorials as installation
Tumor cut segmentation for Blemish Cells Detection in Human Brain Based on Cellular Automata
 Tumor cut segmentation for Blemish Cells Detection in Human Brain Based on Cellular Automata D.Mohanapriya 1 Department of Electronics and Communication Engineering, EBET Group of Institutions, Kangayam,
A Brief Introduction to Queuing Theory
 A Brief Introduction to Queuing Theory With an Application to Biological Processes Prepared by: Arthur Shih Student, Chemical Engineering University of Michigan Prepared for: Dan Burns Jr. Professor, Mathematics
Modern Epidemiology A New Computational Science
 Modern Epidemiology A New Computational Science Facilitating Epidemiological Research through Computational Tools Armin R. Mikler Computational Epidemiology Research Laboratory Department of Computer Science
Time series analyses and transmission models for influenza
 Time series analyses and transmission models for influenza Cécile Viboud Division of Epidemiology and International Population Studies Fogarty International Center, National Institutes of Health Bethesda,
The effect of infectiousness, duration of sickness, and chance of recovery on a population: a simulation study
 Research Article The effect of infectiousness, duration of sickness, and chance of recovery on a population: a simulation study McKayla Johnson, Tashauna Gilliam, and Istvan Karsai East Tennessee State
Modelling the Dynamic of the Foot-and Mouth Disease in England 2001
 Modelling the Dynamic of the Foot-and Mouth Disease in England 2001 Seminar on Veterinary Epidemiology Franz Rubel Budapest, 28 May 2003 Mathematical Epidemiology Group, Institute for Medical Physics and
Supporting Information Identification of Amino Acids with Sensitive Nanoporous MoS 2 : Towards Machine Learning-Based Prediction
 Supporting Information Identification of Amino Acids with Sensitive Nanoporous MoS 2 : Towards Machine Learning-Based Prediction Amir Barati Farimani, Mohammad Heiranian, Narayana R. Aluru 1 Department
Certificate Courses in Biostatistics
 Certificate Courses in Biostatistics Term I : September December 2015 Term II : Term III : January March 2016 April June 2016 Course Code Module Unit Term BIOS5001 Introduction to Biostatistics 3 I BIOS5005
A Statistical Method for Modelling Hepatitis A Vaccination in Bulgaria
 A Statistical Method for Modelling Hepatitis A Vaccination in Bulgaria DAVID GREENHALGH () AND NIKOLAOS SFIKAS () () Department of Statistics and Modelling Science University of Strathclyde Livingstone
Data Visualization - Basics
 Data Visualization - Basics The Visualization Process ACQUIRE PARSE FILTER MINE REPRESENT REFINE INTERACT Sales Data (US $ in thousands) Region Jan Feb Mar Apr May Jun Jul Aug Sep Oct Nov Dec Domestic
Full Season Immunization: A New Paradigm Is Evolving Update
 Full Season Immunization: A New Paradigm Is Evolving 28 Update Why Is a New Paradigm Needed? It is medically relevant to vaccinate throughout the entire influenza season Influenza immunization recommendations
Rapid loss of immunity is necessary to explain historical cholera epidemics
 Rapid loss of immunity is necessary to explain historical cholera epidemics Ed Ionides & Aaron King University of Michigan Departments of Statistics and Ecology & Evolutionary Biology Bengal: cholera s
Influenza Surveillance Animal and Public Health Partnership. Jennifer Koeman Director, Producer and Public Health National Pork Board
 Influenza Surveillance Animal and Public Health Partnership Jennifer Koeman Director, Producer and Public Health National Pork Board Outline Background on influenza surveillance in swine Case example animal
Essentials of Aggregate System Dynamics Infectious Disease Models. Nathaniel Osgood CMPT 858 FEBRUARY 3, 2011
 Essentials of Aggregate System Dynamics Infectious Disease Models Nathaniel Osgood CMPT 858 FEBRUARY 3, 2011 Mathematical Models Link Together Diverse Factors Typical Factors Included Infection Mixing
MODELING DISEASE FINAL REPORT 5/21/2010 SARAH DEL CIELLO, JAKE CLEMENTI, AND NAILAH HART
 MODELING DISEASE FINAL REPORT 5/21/2010 SARAH DEL CIELLO, JAKE CLEMENTI, AND NAILAH HART ABSTRACT This paper models the progression of a disease through a set population using differential equations. Two
SARS Outbreak Study 2
 This week in Epiville, you will continue with the remaining steps of the outbreak investigation and begin to learn how to frame a hypothesis, design a study, and draw conclusions from your investigation.
The role of dynamic modelling in drug abuse epidemiology
 Offprint from Bulletin on Narcotics, vol. LIV, Nos 1 and 2, 2002 The role of dynamic modelling in drug abuse epidemiology C. ROSSI Department of Mathematics, University of Rome Tor Vergata, Rome ABSTRACT
Measles: United States, January 1 through June 10, 2011
 Measles: United States, January 1 through June 10, 2011 Preeta K. Kutty, MD, MPH Measles, Mumps, Rubella and Polio Team Division of Viral Diseases Centers for Disease Control and Prevention Atlanta, GA
Outbreak Response/Epidemiology Influenza Weekly Report Arkansas
 Nathaniel Smith, MD, MPH, Director and State Health Officer Outbreak Response/Epidemiology Influenza Weekly Report Arkansas 2018-2019 Week Ending Saturday 10/20/2018 Dirk Haselow, MD, PhD State Epidemiologist,
Seasonality of influenza activity in Hong Kong and its association with meteorological variations
 Seasonality of influenza activity in Hong Kong and its association with meteorological variations Prof. Paul Chan Department of Microbiology The Chinese University of Hong Kong Mr. HY Mok Senior Scientific
A Model for the CD4 Cell Counts in an HIV/AIDS Patient and its Application in Treatment Interventions
 American Journal of Infectious Diseases (): 6-65, 5 ISSN: 553-63 5 Science Publications A Model for the CD4 Cell Counts in an HIV/AIDS Patient and its Application in Treatment Interventions Richard O.
Epidemic Modelling Using Cellular Automata
 Epidemic Modelling Using Cellular Automata Shih Ching Fu and George Milne School of Computer Science & Software Engineering Faculty of Engineering, Computing and Mathematics The University of Western Australia
Digital Disease Detection: MERS, Ebola, and Measles. Maimuna S. Majumder
 Digital Disease Detection: MERS, Ebola, and Measles Maimuna S. Majumder 2 Roadmap Digital Disease Detection What is DDD? Strengths & Weaknesses Common Uses Outbreak Dynamics Case Fatality Rate Mortality