Rspondin-1 Deficiency Enhances Beta. Cell Neogenesis in a Murine Model of Diabetes. Jasleen Chahal
|
|
|
- Pierce McGee
- 5 years ago
- Views:
Transcription
1 Rspondin-1 Deficiency Enhances Beta Cell Neogenesis in a Murine Model of Diabetes by Jasleen Chahal A thesis submitted in conformity with the requirements for the degree of Master of Science Graduate Department of Physiology University of Toronto Copyright by Jasleen Chahal (2013)
2 ABSTRACT OF THESIS Rspondin-1 Deficiency Enhances Beta Cell Neogenesis in a Murine Model of Diabetes Master of Science 2013 Jasleen Chahal Graduate Department of Physiology University of Toronto The cwnt activator, Rspondin-1 (Rspo1), has been identified as a regulator of β-cell growth and function, although its role in pathophysiological conditions such as streptozotocin (STZ)- induced diabetes is unknown. Hence, I hypothesized that Rspo1 deficiency stimulates β-cell neogenesis in STZ-diabetes. There was no difference in oral glucose handling between STZinduced Rspo1mice, although, Rspo1 -/- mice demonstrated increased insulin sensitivity compared to wild-type littermates. Moreover, β-cell mass and the total number of islets did not differ between STZ-induced Rspo1 +/+ and Rspo1 -/- mice, although mice with Rspo1 deficiency had reduced β-cell apoptosis and significantly enhanced numbers of insulinpositive ductal cells suggestive of β-cell neogenesis. Furthermore, the increased β-cell regeneration observed in knockout animals appeared to be associated with a more differentiated/mature β-cell phenotype in Rspo1 -/- versus Rspo1 +/+ mice. Collectively, these findings indicate a role for Rspo1 as a negative regulator of in vivo β-cell neogenesis and survival in the face of STZ-induced diabetes. ii
3 ACKNOWLEDGEMENTS First and foremost, I would like to thank my supervisor Dr. Patricia Brubaker for her continuous support and guidance throughout my Master s project. I am extremely grateful that Dr. Brubaker took me into her lab despite the fact that she had not been expecting to take on a graduate student at the time. For this, I can really not express enough gratitude. Being a part of the Brubaker lab has helped me become more confident in myself as a scientist, and I will always be grateful for being given the opportunity to grow and learn from such a remarkable role model and mentor. I would also like to thank all the members of the Brubaker lab for welcoming me into the lab and providing continuous support, guidance and advice whenever it was needed. I d like to especially thank Shivangi Trivedi, Charlotte Dong, Samantha Li and Manuel Gil Lozano for their companionship and our numerous venting sessions! I thank Angelo Izzo for all his technical support and for teaching me many of the techniques that I have used to perform my experiments. I would also like to thank both Leila Tick and Sara Johnson for taking great care of my research animals. Thank you to my committee members Dr. Allen Volchuk and Dr. Minna Woo for their feedback and guidance throughout the course of this research project. Finally, thank you to my wonderful family and friends for their constant support and encouragement. I would not be here without their massive support and patience. I feel that the last two years in the Brubaker lab has allowed me to grow both as a student and as a person. Once again, I am very grateful for the experience I gained in the Brubaker lab and I hope to continue to build on the knowledge that I have acquired here in my future endeavors. iii
4 TABLE OF CONTENTS ABSTRACT OF THESIS...ii ACKNOWLEDGEMENTS...iii TABLE OF CONTENTS...iv LIST OF FIGURES vi LIST OF ABBREVIATIONS...vii 1. INTRODUCTION Rationale Beta cell development and regeneration Development of the endocrine pancreas Pre- and post-natal beta cell growth and function Modulators of beta cell mass Potential sources of new beta cells Beta cell transdifferentiation Beta cell neogenesis from non-beta cell precursors Canonical Wnt signaling Canonical Wnt signaling pathway cwnt signaling pathway in pancreatic development cwnt signaling pathway in mature pancreatic islets R-spondin Function of R-spondin proteins R-spondin proteins and the cwnt signaling pathway R-spondin proteins in mature beta-cells Hypothesis and aims METHODS Animals Metabolic tests Immunohistochemistry/Immunofluorescence RNA isolation and semi-quantitative real-time PCR..37 iv
5 2.5 Primary ductal cell culture Statistical Analysis RESULTS Phenotypes of Rspo1 +/+ and Rspo1 -/- mice are similar throughout the STZ-studies Rspo1 +/+ and Rspo1 -/- mice have similar glycemic control but improved insulin sensitivity by the end of the STZ-studies Rspo1 -/- mice have reduced β-cell apoptosis and increased β-cell neogenesis in response to STZ-induced diabetes Ductal insulin-positive cells express markers of β-cell maturity DISCUSSION REFERENCES v
6 LIST OF FIGURES 1.1 Overview of pancreas development and the transcription factors involved Overview of the canonical Wnt (cwnt) signaling pathway Rspo-mediated activation of cwnt signaling Characterization of Rspo1 mice genotypes Experimental protocol for 6- and 32-d STZ-induced diabetes studies Fed glycemia of Rspo1 +/+ and Rspo1 -/- mice does not differ throughout the STZ-induced studies Rspo1 +/+ and Rspo1 -/- mice have similar body weights throughout the STZ-induced studies Pancreatic weights are similar between Rspo1 +/+ and Rspo1 -/- mice until the end of the STZ-induced studies Control Rspo1 +/+ and Rspo1 -/- mice have similar glycemic control in response to an oral glucose load d STZ-induced diabetic Rspo1 +/+ and Rspo1 -/- mice have similar glucose handling in response to an oral glucose load Rspo1 -/- mice have increased insulin sensitivity by the end of the 32-d STZ studies Plasma insulin concentrations do not differ between Rspo1 +/+ and Rspo1 -/- mice β-cell mass differs between Rspo1 +/+ and Rspo1 -/- control mice only Rspo1 +/+ and Rspo1 -/- mice have similar islet profiles Rspo1 -/- mice have reduced B-cell apoptosis Rspo1 -/- mice have increased β-cell neogenesis Validation of immunofluorescence staining Insulin-positive cells arise from ductal epithelium Insulin + cells within ducts are not bi-hormonal Insulin + cells in ducts of Rspo1 -/- mice express markers of β-cell maturity Rspo1 -/- mice have more mature small islets.68 vi
7 LIST OF TABLES 2.1 Primary antibodies used for IHC staining..36 vii
8 LIST OF ABBREVIATIONS ABC Avidin/biotin complex Amer1/WTX APC member recruitment 1/Wilms tumour gene on the X chromosome ANOVA Analysis of variance APC Adenomatous polyposis coli gene product Arx Aristaless related homeobox AUC Area-under-the-curve β-trcp β-transducin repeat-containing protein BCM β-cell mass Brn4 Brain 4 BSA Bovine, from serum albumin BSC Biological safety cabinet CA-II Carbonic anhydrase-ii CK-19 Cytokeratin-19 cdna Complementary deoxyribonucleic acid CK1 Casein kinase 1 CMF-PBS Calcium-magnesium free phosphate buffered saline Cre Cyclization recombination cwnt Canonical Wnt Dvl/Dsh Disheveled DAB Diaminobenzidine DAPI 4',6-diamidino-2-phenylindole DKK Dickkopf DNA Deoxyribonucleic acid e Embryonic day EGF Epidermal growth factor ELISA Enzyme-linked immunosorbent assay Ex4 Exendin-4 FBS Fetal bovine serum FCCM Fat cell-conditioned medium FoxM1 Forkhead box protein M1 Frz Frizzled GLP-1 Glucagon-like peptide-1 GIP Glucose-dependent insulinotropic polypeptide GLUT2 Glucose transporter 2 GSIS Glucose-stimulated insulin secretion GSK3 Glycogen synthase kinase 3 HBSS Hank s buffered saline solution Hes-1 Hairy and enhancer of split 1 Hnf1β Hepatocyte nuclear factor 1β Hnf6 Hepatocyte nuclear factor 6 HRP Horseradish peroxidase IAPP Islet amyloid polypeptide ip Intraperitoneal Ins2 Insulin2 ITS Insulin-transferrin-selenium viii
9 ITT Insulin tolerance test IRS2 Insulin receptor substrate 2 Irx1/2 Iroquois homeobox protein 1/2 K ATP ATP-sensitive potassium channel KGF Keratinocyte growth factor LEF T cell factor/lymphoid enhancer factor LGR 4/5 Leucine-rich repeat containing G-protein-coupled receptor 4/5 LIF Leukemia inhibitory factor LRP 5/6 Low-density lipoprotein receptor-related protein 5/6 MACS Magnetic assisted cell sorting Maf v-maf musculoaponeurotic fibrosarcoma oncogene homolog mrna Messenger ribonucleic acid Myc Myelocytomatosis oncogene Ngn3 Neurogenin 3 Nkx2.2 Nk2 homeobox 2 Nkx6.1 Nk6 homeobox 1 NeuroD1 Neurogenic differentiation 1 OGTT Oral glucose tolerance test Pax Paired box PBS Phosphate buffered saline Pdx1 Pancreatic and duodenal homeobox 1 PI3-kinase Phosphoinositide-3 kinase PO Per os PP Pancreatic polypeptide Ptf1a Pancreas specific transcription factor 1a qrt-pcr Quantitative real-time polymerase chain reaction RNA Ribonucleic acid Rspo1 Roof plate spondin-1 sirna Small interfering RNA Sox9 SRY-box containing gene 9 SNARE Soluble N-ethylmaleimide-sensitive factor attachment protein receptor SNP Single nucleotide polymorphism STZ Streptozotocin T1DM Type 1 (insulin-dependent) diabetes mellitus T2DM Type 2 (insulin-independent) diabetes mellitus TCF T-cell factor TCF7L2 Transcription factor 7-like 2 TBST Tris buffered saline and Tween TGFα Transforming growth factor α TSP1 Thrombospondin type 1 TNFα Tumour necrosis factor alpha ub Ubiquitin VEGF Vascular endothelial growth factor WD Week of human development Wnt Wg (wingless) + Int1 (chromosomal integration site of mouse mammary tumor virus on mouse chromosome 15) ZNFR3 Zinc and ring finger 3 ix
10 Symbols and Units α β δ γ Alpha Beta Delta Gamma k Kilo- (x10 3 ) m Milli- (x10-3 ) µ Micro- (x10-6 ) n Nano- (x10-9 ) % Percent o C Degrees Celsius sec Second (s) hr Hour (s) min Minute (s) d Day kda Kilodalton U Units g Gram l Litre t Time w/v Weight per volume xg Times gravity (relative centrifugal force) rpm Revolutions per min M Molar mol Moles x
11 1 1. INTRODUCTION 1.1 Rationale Diabetes mellitus is characterized by hyperglycemia as a result of insulin deficiency or insulin resistance. This complex metabolic disorder can be classified into two main categories: insulin-dependent diabetes mellitus (T1DM) and insulin-independent diabetes mellitus (T2DM). T1DM is an autoimmune disease that results in the selective destruction of pancreatic β-cells, resulting in absolute insulin deficiency. It accounts for 5-10% of all diabetes and is associated with the presence of islet-cell antibodies (1). The second, more common form of diabetes, is T2DM, which comprises more than 90% of patients with the disease (1). T2DM is a complicated metabolic disorder but, put simply, it can be characterized by a progressive decline in β-cell mass and function, as well as chronic insulin resistance (2). T2DM has become a major global problem, as over 300 million people worldwide are currently diagnosed with this disease (1). Concurrent with the obesity epidemic, the diabetes epidemic is taking place in both developed and developing nations, mainly due to increased urbanization and changes in increasingly sedentary lifestyles (3). The severe economic burden on governments and individuals incurred by diabetes and its associated complications highlights the importance of developing new therapeutic interventions that promote the formation of new β-cells, either in vitro for transplantation, or in vivo through increased β-cell regeneration (4). It is thus crucial to further understand the biology of β-cell regeneration to achieve this end. This goal of this study was to better understand the regulatory effects of R-spondin 1 (Rspo1) on the β-cell under conditions of metabolic stress such as diabetes, thereby providing a potential therapeutic target for the preservation and/or restoration of pancreatic β-cell mass.
12 2 1.2 Beta cell development and regeneration Development of the endocrine pancreas The pancreas consists of three main cell types: exocrine acinar tissue which produces digestive enzymes, endocrine cells (islets of Langerhans) which produce key hormones that regulate blood glucose levels, and ductal cells which collect digestive enzymes produced from acinar cells. Exocrine cells make up the majority of the pancreas, while endocrine islet cells constitute only 1-2% of the total pancreatic mass. The pancreatic islets are comprised of four main endocrine cell types: α, β, δ, and pancreatic polypeptide (PP) cells, which produce the hormones glucagon, insulin, somatostatin, and pancreatic polypeptide, respectively. In mice, the first morphological signs of pancreas formation begin at embryonic day (e) 9.5 (5). At this point, the dorsal pancreatic bud begins to form, followed by the two ventral/lateral buds one day later (5). As the buds appear, the expanding pancreatic epithelium initiates the expression of the transcription factors Pdx1 (pancreatic duodenal homeobox gene-1), Sox9 (SRY-box containing gene 9), Nkx2.2 (Nk2 homeobox 2), Nkx6.1 (Nk6 homeobox 1), Ptf1a (pancreas transcription factor 1a), and Hnf1β (hepatocyte nuclear factor 1β), thereby forming a pool of multipotent progenitor cells for exocrine and endocrine cell formation in what is termed the first developmental transition (5-7). Expansion of the dorsal and ventral buds continues, followed by rotation of the gut, allowing for the fusion of the two buds into a single organ at e12.5-e14 (5;6). A limited number of these first transition epithelial cells differentiate into immature endocrine cells expressing glucagon (e9.5) and/or co-expressing glucagon and insulin (e10-e10.5) (6). However, the contribution of these early endocrine cells to mature islet formation is unclear (7). The second developmental transition marks the period when the majority of endocrine cell differentiation occurs (e12.5-e16.5) (7). Several gain- and loss-of-function
13 3 models have been utilized to demonstrate the expression of various transcription factors during pancreatic development, using approaches such as immunohistochemical, protein and/or mrna analyses. The most important transcription factor for driving pancreatic progenitor cells towards an endocrine cell fate is neurogenin 3 (Ngn3) (7). Ngn3 is expressed in pancreatic endocrine precursors (8), hence making it a useful marker of immature endocrine cells (Figure 1.1). Its expression starts on e9-e9.5, peaks on e15.5 during the major wave of endocrine cell formation, and then is greatly reduced at birth, with very low but detectable levels in the adult pancreas (6;7;9). Ngn3 expression is required for the development of all four endocrine cell lineages of the pancreas, as mice lacking Ngn3 fail to develop any pancreatic endocrine cells and die postnatally from hyperglycemia (8). Early transcription factors such as Sox9 (10) and Hnf6 (hepatocyte nuclear factor 6) (11) function as positive regulators of Ngn3 expression, while Hes-1 (hairy and enhancer of split-1) inhibits Ngn3 expression and endocrine differentiation through the Notch signaling pathway (9). The Notch signaling pathway is crucial in pancreas development, as normal Notch signaling results in the expression of Hes-1 and adoption of the exocrine cell fate; enforced activation of Notch signaling results in impaired differentiation of pancreatic progenitors; and reduced Notch signaling leads to an up-regulation of Ngn3 expression (9;12). Increased Ngn3 through the inhibition of Notch signaling subsequently allows for the activation of a number of endocrine transcription factors required for the various endocrine lineages, such as NeuroD1 (neurogenic differentiation 1) (5;8). These transcription factors are differentially and temporally regulated, but basically, PP-cells are characterized by Nkx2.2; δ-cells by Pax4 (paired box 4), Pax6 (paired box 6) and Pdx1; α-cells by Arx (aristaless related homeobox), Irx1/2 (iroquois homeobox protein 1/2), Brn4 (brain 4), Pax6, and MafB (v-maf musculoaponeurotic fibrosarcoma oncogene homolog B); and β-cells by MafA (v-maf
14 4 musculoaponeurotic fibrosarcoma oncogene homolog A), Nkx2.2, Nkx6.1, Pax4, Pax6 and Pdx1 (reviewed in (5;6)). Finally, the third developmental transition (e16.5-birth) involves formation of individual endocrine cells in organized islet-like clusters (6). However, the islets are not fully mature and functional until after birth, and undergo additional remodeling and maturation for 2-3 weeks after birth until weaning (6).


15 Figure 1.1 Overview of pancreas development and the transcription factors involved. The transition of pancreatic progenitor cells to mature endocrine cells is regulated by the sequential activation and interaction of several transcription factors. Most epithelial cells of the early pancreatic buds are pre-differentiated precursors of exocrine and endocrine cells. These cells express a combination of transcription factors, including Pdx1, Sox9, Nkx2.2, Nkx6.1, Ptf1a and Hnf1β. Activation of the Notch signaling pathway results in the expression of Hes-1 and adoption of the exocrine fate, resulting in the formation of mature acinar cells. Inactivation of Notch signaling results in an up-regulation of Ngn3 expression, thereby producing a pool of committed endocrine precursors. These Ngn3-expressing endocrine precursor cells subsequently result in the activation of a number of endocrine transcription factors required for the various endocrine lineages, such as NeuroD1. PP-cells are characterized by Nkx2.2; δ-cells by Pax4, Pax6 and Pdx1; α-cells by Arx, Irx1/2, Brn4, Pax6, and MafB; and β-cells by MafA, Nkx2.2, Nkx6.1, Pax4, Pax6 and Pdx1 (Modified from Van Hoof et al. (5)) 5
16 Pre- and post-natal beta cell growth and function The most considerable increases in fetal β-cell mass occur during the second and third developmental transitions, as mentioned above. During late fetal gestation (e16-e20), the numbers of β-cells double approximately every day (13), with the greatest increase in β-cell mass occurring during the last 2 days of gestation in rats (14). However, in the rat fetus, β- cell division only accounts for 10-20% of total β-cell growth (14). The remaining 80-90% of growth is attributed to differentiation of pancreatic progenitor cells to β-cells, a process called neogenesis (14). In human fetal pancreas, β-cell mass expands rapidly from ~20 weeks (15). The extremely low replication rate of endocrine cells noted in human fetal pancreas suggests that, similar to rodents, massive differentiation from nonendocrine progenitor cells is likely to be the major mechanism of β-cell expansion during this period (16). In support of this theory, large numbers of proliferative islet precursors expressing insulin and the ductspecific marker, cytokeratin, have been observed during fetal islet formation (17), suggesting that the conversion of ductal cells to β-cells may contribute to the expansion of β-cell mass seen in late fetal gestation. In neonatal rodents, β-cell expansion is still evident, although at a reduced rate compared with late fetal growth (13). Interestingly, although β-cell volume continues to increase with age, α- and δ-cells do not appear to exhibit further growth after postnatal day 25 (18). As with prenatal islet growth, both β-cell replication and neogenesis contribute to newly formed β-cells in the postnatal rodent pancreas (19). Furthermore, an increased rate of β-cell apoptosis is observed at weaning, resulting in substantial remodeling of the pancreas (20). However, these changes do not result in a reduced β-cell mass, as new and more functionally mature β-cells compensate for the loss (21). In adult rodents, increases in β-cell number (hyperplasia) and β-cell size, as well as low rates of β-cell apoptosis, contribute to a
17 7 linear increase in β-cell mass with age and body weight (22). Dor et al. (23) reported that β- cell replication, and not β-cell neogenesis, is the primary mechanism of increased β-cell growth in the adult rodent. However, the presence of potential β-cell progenitor cells has been found in the adult human pancreas, including the exocrine compartment and ductal epithelium, although it is not clear whether these β-cell precursors contribute to adult β-cell growth under normal conditions, or only under specific circumstances such as obesity or pregnancy (24). The maturation of β-cell function is an important step in the culmination of β-cell development. In mature rodent β-cells, glucose enters the cell via glucose transporter 2 (GLUT2) (25) and becomes phosphorylated by the rate-limiting enzyme glucokinase (26). Glucose metabolism in the β-cell ultimately results in a net increase in the ATP/ADP ratio, thus triggering depolozarization of the plasma membrane by closure of the ATP-sensitive potassium (K ATP ) channels (1;27). Membrane depolarization subsequently induces the initiation of calcium influx via voltage-dependent calcium channels (27). In response to increases in intracellular calcium concentration, insulin granules fuse with the plasma membrane via soluble N-ethylmaleimide-sensitive factor attachment protein receptor (SNARE) machinery (27). The rapid exocytosis of insulin granules through these SNAREdependent processes occurs within the initial 5-10 min of stimulation and is referred to as the first phase of insulin secretion (27). The subsequent sustained, but less robust, release is referred to as the second phase of insulin secretion (27), thus resulting in a biphasic pattern of insulin secretion. However, this biphasic insulin secretion does not fully mature until after birth, as a low response to glucose was reported in fetal rat islets at e19.5, likely due to defective β-cell membrane depolarization (28). Nevertheless, by postnatal day 2-3, insulin
18 8 secretion returned to levels seen in adults, likely due to increased expression of K ATP channels (28;29) Modulators of beta cell mass β-cell mass is dynamic throughout adulthood and fluctuates in response to various physiological (i.e. aging and pregnancy) and pathophysiological (i.e. obesity and insulin resistance) states. The mechanisms responsible for alterations in β-cell mass involve changes in β-cell replication/proliferation, β-cell neogenesis, β-cell size and β-cell death/apoptosis. The regenerative and proliferative capacity of most organs declines with age. In the pancreas, β-cell hypertrophy and hyperplasia contribute to increased β-cell mass in young (1-7-month old) rats, but only β-cell hypertrophy is responsible for increases in β-cell mass found in 20-month-old rats (22). Furthermore, β-cells of aged (1-year-old) mice have extremely low rates of replication (30). Hence, the rarity of β-cell replication in aged mice, as well as minimal evidence of β-cell turnover, suggests that murine aged β-cells are mostly in a quiescent G 0 state (30). This is also seen in aged human islets (50.2 ± 3.5 years), as β-cell replication decreases in an age-dependent manner, whereas rates of β-cell apoptosis and islet neogenesis are not significantly altered (31). The reduced β-cell proliferation associated with aging may in part be due to age-related decreases in the expression of cell cycle activators (i.e. forkhead box M1 (FoxM1)) with simultaneous increases in cell cycle inhibitors (reviewed in (32)). Since β-cell replication contributes to adaptations in β-cell mass, albeit at low levels, these changes may restrict the ability of the aging pancreas to adapt to changing demands for insulin secretion and thus increase the risk of developing T2DM (31). Physiological alterations in β-cell mass also occur during pregnancy. Rodent studies have shown that β-cell mass increases 50% during pregnancy in order to compensate for the increased metabolic demands of the developing fetus (33;34). This occurs primarily through
19 9 increases in β-cell size and β-cell proliferation, induced by the pregnancy hormones prolactin and placental lactogen (34). However, in contrast to rodents, adaptive increases in pancreatic β-cell area during pregnancy in humans are not accompanied by changes in mean β-cell size, replication, or apoptosis frequency (35). Instead of an increase in islet size or β-cells per islet, increased β-cell expansion is due to a greater number of small islets (35). Furthermore, Butler et al. (35) observed an increased incidence of ductal cells positive for insulin, as well as scattered single β-cells. Therefore, in humans, increases in β-cell adaptation during pregnancy are a result of an increased number of β-cells in new small islets (35). After pregnancy, decreased β-cell replication and reduced β-cell size, along with concomitant increases in β-cell apoptosis, ensures the return of β-cell mass to normal levels, at least in postpartum rodents (36). Failure to compensate for the increased metabolic demands of pregnancy can lead to gestational diabetes and an increased risk of developing T2DM later in life (21). β-cell plasticity is further demonstrated in obese individuals who do not develop diabetes. These individuals exhibit a compensatory increase in β-cell mass in order to adapt to the increased metabolic load and obesity-associated insulin resistance (37). In obese humans, increased β-cell mass occurs through increases in β-cell replication, neogenesis and β-cell hypertrophy (2;37). Similarly, obese rodents demonstrate an expansion in β-cell mass as a result of massively increased islet size and β-cell replication (38); both glucokinase and insulin receptor substrate 2 (IRS2) are required for this β-cell hyperplasia to occur (39). Although there is an initial compensatory increase in β-cell mass, 25-30% of obese individuals eventually lose the ability to adapt to increasing insulin resistance (40). Consequently, a progressive decline in β-cell mass results in the development of T2DM (37). This β-cell loss and reduced β-cell mass is attributed to a marked increase in β-cell apoptosis,
20 10 with no significant changes in the levels of β-cell replication seen in either humans or rodents (2;41). Although rodents exhibit a decrease in the rate of β-cell neogenesis (41), no change in neogenesis was observed in islets from diabetic humans (2). Many factors could trigger the increase in β-cell apoptosis that occurs during the development of T2DM (37). For example, genetic factors, the development of endoplasmic reticulum stress, chronic hyperglycemia, chronic hyperlipidemia, oxidative stress, and certain cytokines can lead to the activation of β- cell apoptotic signaling cascades (37). It is unclear whether the β-cell failure associated with diabetes is due only to a reduced β-cell number (as described above) or also to an impairment in β-cell function (42). Several rodent studies have shown that hyperglycemia results in reduced expression of key hormones, transcription factors, and β-cell metabolic enzymes necessary for the maintenance of normal β-cell differentiation and function (42-44). For example, islets of diabetic rats exhibit a marked decrease in the mrna expression levels of insulin, islet amyloid polypeptide (IAPP), GLUT2 and glucokinase, as well as β-cell ion channels/pumps (43;44). A recent study by Talchai et al. (42) challenges the widely accepted belief of increased β-cell apoptosis as being the major contributor of β-cell failure. Using a variety of models, these authors demonstrated that the failure of sustainable β-cell mass and function under metabolic stress (i.e. pregnancy, aging, obesity) is due to β-cell dedifferentiation, not β-cell death (42). Levels of β-cell apoptosis were not found to be significantly altered, although the number of dedifferentiated β-cells expressing markers of progenitor cells was increased (42). However, the contribution of β-cell dedifferentiation in human conditions of metabolic stress is unknown.
21 Potential sources of new beta cells The generation of new β-cells to restore functional β-cell mass in diabetic patients would be a promising therapeutic intervention that could lead to islet replacement therapies. The issue of β-cell regeneration in the pancreas is a controversial aspect of diabetes research due to the continual debate over the source of endogenous pancreatic progenitor cells. The potential mechanisms of β-cell regeneration include proliferation of β-cells (as discussed above), transdifferentiation from one differentiated cell type into another, and neogenesis from non-β-cell precursors Beta cell transdifferentiation Recently, two reports have shown that transdifferentiation of α-cells to β-cells can be a source of insulin-positive cells in the adult mouse (45;46). Thorel et al. (46) used a transgenic model of diphtheria-toxin-induced β-cell-ablation, and showed that lineage-tracing to label glucagon-producing α-cells reveals large numbers of newly generated β-cells deriving from α-cells. Similarly, Chung et al. (45) demonstrated that neogenic β-cells arise primarily from α-cells. Hence, following pancreatic duct ligation and alloxan treatment, α- cell proliferation is induced, followed by intermediate cells co-expressing both glucagon and insulin (45). These double-hormone positive cells gradually decline in number as β-cells with a mature phenotype, defined as lack of glucagon and expression of MafA, become predominant (45). Interestingly, another study by Collombat et al. (47) showed that Pax4 misexpression in glucagon-expressing cells results in a conversion of α-cells to β-like cells. This causes a decrease in circulating glucagon, which results in the reactivation of neurogenin-3 in cells within the ductal epithelium and their subsequent differentiation into α- cells to compensate for the glucagon shortage (47). The newly formed α-cells then continue their conversion into β-like cells with Pax4 misexpression (47). Thus, transdifferentiation of
22 12 α-cells to β-cells appears to play an important role in β-cell regeneration, at least under some conditions. Exocrine acinar cells have also been evaluated as a possible source of pancreatic progenitor cells. Baeyens et al. (48) showed that the addition of epidermal growth factor (EGF) and leukemia inhibitory factor (LIF) to adult rat exocrine cells in vitro results in a dramatic increase in β-cell number. These newly formed β-cells express Pdx1, GLUT2 and C-peptide, and are able to restore normoglycemia when transplanted into diabetic mice, suggesting that they have differentiated into mature β-cells (48). Consistent with this finding, Zhou et al. (49) demonstrated that fully differentiated exocrine cells can be directly reprogrammed into β-cell-like cells in adult animals through the ectopic expression of Ngn3, Pdx1, and MafA. Although these cells do not organize into islet structures and remain as single cells or small clusters, they express markers of mature and functional β-cells (i.e. GLUT2, glucokinase, Nkx6.1 and Nkx2.2) (49). Therefore, transdifferention of exocrine acinar cells to β-cells may also contribute to β-cell regeneration under the correct stimuli. Finally, several studies have demonstrated that treatment with specific growth factors or transcription factors is sufficient to cause transdifferentiation of non-pancreatic tissue such as hepatocytes (50), bone marrow (51) and intestinal cells (52) towards a mature β-cell phenotype. Thus, the formation of new β-cells from transdifferentiation of various pancreatic and non-pancreatic tissues represents one method of generating β-cells in adult life Beta cell neogenesis from non-beta cell precursors Islet neogenesis refers to the formation of insulin-producing cells from the adult stem/progenitor cells of the pancreas (53). Xu et al. (54) reported that exendin-4 (Ex4), a glucagon-like peptide 1 (GLP-1) receptor agonist, increases β-cell mass when administered to rats with 90-95% partial pancreatectomy. This effect is due to increased β-cell
23 13 proliferation and neogenesis, and results in the amelioration of glucose intolerance in these animals (54). These authors found that the GLP1-receptor is expressed in both ducts and β- cells, and later studies demonstrated the positive effects of GLP-1 in inducing the differentiation of Pdx1-positive pancreatic ductal cells into insulin-secreting cells (55). Several studies provide strong support that the newly generated insulin-positive cells after pancreatic injury are also derived from pancreatic ducts. For example, Bonner-Weir et al. (56) demonstrated that following expansion, human ductal tissue can be directed to differentiate into islet endocrine cells with Matrigel overlay and the addition of keratinocyte growth factor (KGF). These cultivated human islet buds are composed of cytokeratin-19 (CK-19) positive duct cells and hormone-positive islet cells, and are able to secrete insulin in response to high glucose (20 mm) (56). Furthermore, the Bonner-Weir group (57;58) genetically marked ductal cells using carbonic-anhydrase II (CA-II) as a duct-cell-specific promoter in lineage-tracing experiments using the Cre-Lox system, and found that following ductal ligation, CA-II expressing ductal cells act as pancreatic progenitors to give rise to new β-cells. Li and colleagues (59) have also examined the mechanisms by which adult pancreatic duct cells may contribute to regeneration of the pancreas. After 90% partial pancreatecomy in adult rats, pancreatic duct cells experience a loss of differentiated phenotype with decreased expression of Hnf6 (59). This results in enhanced proliferation and increased expression of progenitor-like markers such as Pdx1, Sox9 and Ngn3 (59). As insulin-positive cells bud from the ducts, expression of Sox9 and Ngn3 is reduced, whereas expression of Nkx6.1, GLUT2, and MafA gradually increases (59). Therefore, it is proposed that following injury, duct cells dedifferentiate to a progenitor-like phenotype, followed by expansion and redifferentiation into differentiated endocrine cells following the normal embryonic developmental program (59). Therefore, several studies show that the ductal
24 14 epithelium in humans and rodents contains pancreatic progenitor cells that are capable of producing insulin-positive cells. Similar to Inada and colleagues (57), Solar et al. (60) employed the Cre-Lox system to genetically mark ductal cells using Hnf1β as a duct-cell-specific promoter in lineage-tracing experiments. In contrast to the studies mentioned above, these authors found that the ductal epithelium does not make significant contributions to exocrine or endocrine cell regeneration after birth (60). Partial duct ligation (PDL), as well as alloxan followed by EGF and gastrin treatment, resulted in increased β-cell mass as expected (60). However, there was very little contribution of Hnf1β-expressing cells, suggesting that the pancreatic duct epithelium does not does not contribute a significant source of progenitors in the β-cell growth response seen after PDL (60). These findings support the work of Dor and colleagues (23), as these authors used lineage tracing of genetically marked β-cells in mice to demonstrate that no new β-cells are formed from non-insulin expressing stem cells or progenitor cells, either postnatally or following 70% pancreatectomy (23;61). Consequently, the ductal cell neogenesis hypothesis remains controversial and further studies are required to fully understand whether and how new islets originate postnatally from ducts (61). 1.3 Canonical Wnt (Wg (wingless) + Int1 (chromosomal integration site of mouse mammary tumor virus on mouse chromosome 15)) signaling Canonical Wnt signaling pathway Wnts are a large family of highly-conserved secreted glycoproteins that are associated with the regulation of many developmental processes, including proliferation of stem/progenitor cell populations, cell fate determination, and tissue homeostasis (62-64). The most heavily studied Wnt pathway is the canonical (c), or β-catenin-dependent, Wnt
25 15 signaling pathway. In the absence of Wnt ligands, the Wnt antagonists Dickoff (DKK) and Kremen inhibit the Wnt-induced complex of the seven-transmembrane receptor protein, frizzled (Frz) and its co-receptor, lipoprotein receptor-related protein 5 or 6 (LRP5/6) (65). As a result, cytosolic β-catenin is targeted by a degradation complex composed of axin, adenomatous polyposis coli gene product (APC), APC member recruitment 1/Wilms tumour gene on the X chromosome (Amer1/WTX), casein kinase 1 α (CK1 α), and glycogen synthase kinase 3 (GSK3) (Figure 1.2; (65-67)). CK1 and GSK3 sequentially phosphorylate conserved serine and threonine residues on the amino terminal of β-catenin, resulting in β- catenin recognition by an E3 ubiquitin (ub) ligase subunit, β-trcp (β-transducin repeatcontaining protein), and its subsequent ubiquitination and proteosomal degradation (65;68). This continual degradation of β-catenin prevents β-catenin from reaching the nucleus, ensuring that the repressor protein Groucho is free to bind to members of the T cell factor/lymphoid enhancer factor (TCF/LEF) family of transcription factors, thereby preventing the transcription of cwnt target genes (65). Activation of cwnt signaling requires interaction between Wnt ligands and the Frz and LRP5/6 co-receptors (65). Wnt binding leads to internalization of the Frz and LRP co-receptor, as well as the recruitment of the intracellular scaffolding protein dishevelled (Dvl/Dsh), which then results in the recruitment of WTX to the plasma membrane and phosphorylation of LRP6 by CK1γ and GSK3, thereby dissociating the degradation complex (65-67). This leads to inhibition of β-catenin phosphorylation and degradation. Stabilization of β-catenin allows for β-catenin to accumulate and enter the nucleus where it forms complexes with TCF/LEF and activates the transcription of cwnt target genes such as cyclin D1 and/or c-myc (65).


26 Figure 1.2 Overview of the canonical Wnt (cwnt) signaling pathway. OFF state: In the absence of a Wnt ligand, β-catenin is targeted by the degradation complex of Axin, APC, GSK3β, and other co-factors. This results in the ubiquintination and subsequent degradation of β-catenin, thereby preventing its translocation into the nucleus to activate cwnt target gene expression. ON state: In the presence of Wnt ligands, Wnt binding to the Frizzled receptor and LRP co-receptors induces phosphorylation of LRP and recruitment of Axin, thus dismantling and inhibiting the degradation complex. This allows β-catenin to accumulate and enter the nucleus, where it interacts with the TCF/LEF family of transcription factors to activate the transcription of cwnt target genes. 16
27 cwnt signaling pathway in pancreatic development Wnt proteins play crucial roles in the development of multiple tissues, including the pancreas. Indeed, components of the cwnt pathway have been found to be expressed in the developing mouse pancreas (69). For example, several Wnt ligands and various Frz receptors, in addition to other modulators of Wnt signaling such as LRP co-receptors, Wnt antagonists, GSK3, Dvl, secreted DKK proteins, and β-catenin have been found in the surrounding mesenchyme and/or epithelium of the developing mouse pancreas (69), in addition to postnatal human pancreas, human and rodent islets, and rodent cell lines (70;71). The TCF7L2 (formerly known as TCF4) gene has also been found to be expressed in human and rodent islets, as well as β-cell lines (64;70;72-74). Although the presence of cwnt components suggests that Wnt signaling is present and likely active in these tissues, the role of cwnt signaling in pancreatic development remains controversial, as several studies report conflicting results on its role in exocrine versus endocrine development. For example, in the studies of Murtaugh et al. (75) and Wells et al. (76), deletion of the β-catenin gene in pancreatic epithelium of the developing mouse pancreas results in a severe reduction of exocrine cell mass, due to decreased proliferation among early exocrine progenitors and a subsequent near-complete loss of acinar cells. Furthermore, both studies found that β-catenin is essential for the formation of exocrine acini, but is dispensable for endocrine differentiation and function, as the conditional β- catenin knockout in the developing pancreas causes no significant alterations in endocrine cell mass or function, leaving pancreatic islets generally intact (75;76). In addition, an initial study reported that the overexpression of Wnt1 or Wnt5a in the developing mouse pancreas disrupts normal development, causing a reduction in endocrine cell number and lack of islet
28 18 formation (69). These studies indicate that cwnt signaling may not have a dominant role in the development or function of islets (64). In contrast, studies from Dessimoz et al. (77) found defects in the development of endocrine pancreas in the absence of β-catenin. In addition, Figeac et al. (78) showed that in vivo knockdown of TCF7L2 results in an almost 30% reduction of total β-cell mass in the pancreases of 7-day-old neonatal Wistar rats. Therefore, these studies demonstrate that, in contrast to the previously mentioned studies, inactivation of cwnt signaling alters β-cell growth in the developing rodent pancreas (76). Differences in timing and expression levels of Cre recombinase between different Pdx1-Cre lines may be one possible explanation for the contrasting phenotypes observed in some of these studies (64;76). Alternatively, Heiser et al. (79) reported that the expression of constitutively active β-catenin early in development prevents proper differentiation and expansion of pancreatic progenitor cells, whereas expression later in development causes increased proliferation that result in dramatically enhanced pancreatic growth. These observations strongly suggest that the timing of the activation or inactivation of Wnt signaling is essential in regulating proper pancreatic development (68) cwnt signaling pathway in mature pancreatic islets In addition to pancreatic development, the cwnt pathway is involved in β-cell growth and function in mature pancreatic islets. For example, Rulifson et al. (63) demonstrated that Wnt signaling stimulates islet β-cell proliferation. The addition of Wnt3a protein to MIN6 β- cells (63;71) and mouse islets (63) enhanced β-cell proliferation in vitro through the upregulation of essential β-cell cycle regulators. Furthermore, overexpression of activated β- catenin in β-cells in vivo results in β-cell expansion, increased insulin production and serum levels, and enhanced glucose handling (63). Moreover, overexpression of TCF7L2 in isolated
29 19 human and mouse islets protects islets from glucotoxicity and cytokine-induced apoptosis and improved insulin secretion and function (73), indicating a protective effect on β-cell survival. In contrast, activation of axin, a negative regulator of cwnt signaling, results in impaired β-cell growth and reduced β-cell mass (BCM) with a corresponding downregulation in cwnt target gene expression, leading to impaired glucose tolerance (63). Similarly, mice expressing constitutively active GSK3β, another inhibitor of cwnt signaling, under the control of the rat insulin promoter exhibit impaired glucose tolerance as a result of decreased β-cell proliferation and mass (80). Consistent with these findings, reduced TCF7L2 gene expression by sirna-mediated knockdown in human and rodent islets results in increased β- cell apoptosis, decreased β-cell proliferation, and reduced levels of active Akt, an important β-cell survival factor (73). Likewise, depletion of β-catenin or knockdown of TCF7L2 in rodent β-cells also results in decreased β-cell proliferation and reduced glucose-stimulated insulin secretion (GSIS) (72;81). In addition to these findings, Fujino et al. (82) showed that LRP5 contributes to glucose-induced insulin secretion, as mice with LRP5 deficiency show impaired glucose tolerance as a result of decreased glucose-induced insulin secretion, whereas the addition of Wnt3a and Wnt5a to isolated islets from LRP5 wild-type mice stimulates glucose-induced insulin secretion. Consistent with this data, Wong et al. (71) demonstrated that the addition of Wnt3a stimulates glucose-independent insulin secretion in MIN6 β-cells. Similarly, mice lacking the Wnt antagonist DKK-2 demonstrate reduced basal blood glucose and improved glucose tolerance, as well as decreased hepatic glucose output and enhanced hepatic glycogen accumulation (83). Furthermore, Schinner et al. (84) reported that activation of Wnt signaling with adipocyte-derived Wnt molecules in fat cell-conditioned medium results in increased insulin secretion and activation of cyclin D1 and glucokinase gene transcription in
30 20 islets and INS-1 cells. Thus, cwnt signaling appears to be greatly beneficial for β-cell growth and survival, as well as endocrine cell function. In support of this notion, Grant et al. (85) found that single nucleotide polymorphisms (SNPs) within the gene TCF7L2 contribute to an increased risk of developing T2DM in Icelandic, Danish, and US cohorts. Since then, several studies have confirmed that the TCF7L2 gene is probably the strongest genetic marker for individuals with T2DM in various ethnic populations (86). However, the mechanisms through which TCF7L2 variants affect glucose metabolism are not fully understood. It has been proposed that the incretin hormone GLP-1 may be a link between TCF7L2 function and the development of TD2M. Indeed, it has been demonstrated that TCF7L2 is involved in the regulation of proglucagon gene transcription and the production of GLP-1 (an insulin secretagogue) in the intestinal endocrine L-cells (87). Additionally, it has recently been shown that mice expressing the dominant negative form of TCF7L2 specifically in glucagon-expressing cells have reduced glucagon, and consequently, reduced GLP-1 expression, in the gut and brain, although no effect was seen on glucagon expression in the pancreas of these mice (21;88). As a result, these mice had impaired oral glucose handling in association with attenuated plasma insulin levels (88). Moreover, Ip et al. (89) found that TCF7L2 represses hepatic gluconeogenesis as a result of increased insulin- and feedingstimulated expression of TCF7L2, as well as increased insulin activated phosphorylation of β-catenin. In human studies, Schafer et al. (90) reported that non-diabetic subjects with TCF7L2 risk alleles have impaired insulin secretion due to a reduced response to GLP-1. Since there were no defects in GLP-1 secretion, the impaired GLP-1-induced insulin secretion is likely to be a result of a functional defect in GLP-1 signaling in β-cells rather than a reduction in GLP-1 secretion (90). Consistent with these findings, depletion of TCF7L2 with sirna in
31 21 human islets leads to a decreased ability of GLP-1 to stimulate GSIS, thus providing further support for the hypothesis that changes in TCF7L2 result in a functional defect of GLP-1 signaling (73). Interestingly, islets from humans with T2DM and isolated human islets treated with TCF7L2 sirna both have decreased expression of receptors for the incretin hormones, GLP-1 and glucose-dependent insulinotrophic polypeptide (GIP), resulting in impaired glucose-, GLP-1- and GIP-stimulated insulin secretion (74). This study thereby offers an alternative mechanism for the impaired β-cell function seen with changes in TCF7L2 in T2DM. The majority of studies, such as those described above, associate reduced β-cell cwnt activity and the resulting decreased levels of TCF7L2 with impaired β-cell function. In contrast, Lyssenko et al. (91) found that TCF7L2 mrna expression levels are increased in human islets of diabetic patients. Furthermore, the level of TCF7L2 expression in islets was found to be inversely correlated with insulin secretion (91), thereby suggesting that increased, rather than decreased, levels of TCF7L2 in islets increases the risk of T2DM by inhibiting insulin secretion. On the other hand, Shu et al. (74) found that, although mrna levels of TCF7L2 were increased in islets from three diabetic rodent models, protein levels were decreased. This finding was further supported by a drastic downregulation of TCF7L2 protein expression in pancreatic sections from patients with T2DM (74). Thus, this study demonstrated for the first time that TCF7L2 mrna and protein levels are oppositely regulated in diabetes, thereby providing a potential answer for the conflicting data.
32 R-spondin Function of R-spondin proteins The roof plate-specific spondin (R-spondin; Rspo) protein family is a group of four secreted proteins (Rspo1-4) that have been implicated as agonists of the cwnt signaling pathway. The Rspo family members are evolutionary conserved proteins that share 40-60% amino acid sequence identity and are approximately 35 kda in size (92). All four Rspo family members contain an N-terminal signal peptide, two cysteine-rich furin-like domains, one thrombospondin type 1 (TSP1) domain, and a C-terminal region with positively charged amino acids (93). It has been suggested that the furin-like domains are required for activation of cwnt signaling, whereas the TSP1 and C-terminal domains are dispensable for function (93-95). Despite their significant structural similarities, the developmental expression patterns of the Rspo proteins have been found to be strikingly different (96). Mouse Rspo1 was first identified by Kamata et al. (93) from the screening of genes specifically expressed in the central nervous system during development. Rspo1 expression was found in the boundary region between the roof plate and neuroepithelium of mouse embryos, suggesting that Rspo1 may contribute to dorsal neural tube development (93). This study was one of the first to demonstrate a link between Rspo1 and the cwnt signaling pathway, as the expression of Rspo1 was reduced in Wnt1/3a double knockout mice (93). Consistent with this finding, Kazanskaya et al. (94) showed that Rspo2 synergizes with Wnt3a to enhance activation of nuclear β-catenin and upregulate expression of myogenic markers, thereby indicating that Rspo2 is required for cwnt-mediated myogenesis in Xenopus muscle development. Furthermore, the expression of Rspo2, Wnt8, and Wnt3a were found to significantly overlap in Xenopus embryos (94), therefore providing support for the notion that expression of Rspo proteins overlaps with expression of Wnt proteins during
33 23 development (93;94). Since then, numerous studies have shown that Rspo proteins act as secreted activators of the cwnt signaling pathway, thus leading to the induction of cwnt target genes (92;94;95;97-102). Wnt signaling is essential in cell fate determination during embryonic development. Therefore, Rspo s ability to positively modulate cwnt signaling and play a role in embryogenesis is of no surprise. Indeed, several studies have demonstrated the importance of Rspo1 as a regulator of sexual development and in the development of the female reproductive system (98; ). For example, Chassot et al. (98) showed that differentiation of female gonads requires activation of the cwnt signaling pathway by Rspo1, as overexpression of β-catenin rescues the masculinization of the reproductive system seen in female Rspo1 knockout mice. Furthermore, Rspo1 is required for normal mammalian mammary gland and ovary development (103;106). In humans, mutations in the Rspo1 gene have been identified in XX individuals with female to male sex reversal, palmoplantar hyperkeratosis and predisposition to squamous cell carcinoma of the skin (105). In addition, both Rspo1 and Rspo2 have been found to play roles in Wnt-mediated osteoblast differentiation and bone development (107;108). Rspo2 signaling through the cwnt pathway is also required for skeletal myogenesis and limb development (99), as well as normal development of lungs (109). Likewise, Rspo3 is required for mouse placental development (110), and both Rspo1 and Rspo3 triggered Wnt activation of vascular endothelial growth factor (VEGF) further mediates the effects of these two Rspo proteins on angioblast and vascular development (111;112). Finally, Rspo4 plays a crucial role in nail morphogenesis, as individuals with autosomal recessive mutations in the furin-like cysteine-rich domain of this protein exhibit an absence or severe hypoplasia of all fingernails and toenails (anonychia and hyponychia, respectively) (113).
34 24 In addition to its role during vertebrate development, Rspo1 has been described as a potent mitogen for gastrointestinal epithelial cells in normal mice (100;114). For example, injection of human Rspo1 into normal mice leads to the significant proliferation of intestinal crypt epithelial cells in the small intestine and colon through the activation of β-catenin (114). Rspo1 s mitogenic effects have also proven to be beneficial in an animal model of inflammatory bowel disease by stimulating crypt cell growth, accelerating mucosal regeneration, and restoring intestinal architecture (114;115). Moreover, Rspo1 significantly reduces the overproduction of proinflammatory cytokines and preserves mucosal barrier function in inflammatory bowel disease, hence demonstrating that Rspo1 may have therapeutic potential in this disease. Interestingly, although Kim et al. (114) found that treatment with human Rspo1 of the murine colon carcinoma cell line CT26 had no effect on tumour volume, a recent report has demonstrated the presence of recurrent gene fusions involving Rspo2 and Rspo3 in 10% of colon tumours (116), although the reasons for the conflicting results are not well known. Lastly, Rspo1 treatment in a tumour necrosis factor alpha (TNFα)-transgenic mouse model of arthritis protects bone and cartilage from inflammation-related damage by preserving the structural integrity of joints (108). Therefore, these data show that Rspo1 can have therapeutic effects in two different models of inflammation-associated disease R-spondin proteins and the cwnt signaling pathway Although Rspo proteins have been linked to the cwnt signaling pathway, the exact mechanism by which these proteins regulate the cwnt pathway are not clearly defined. Initial studies report conflicting results about the receptors for Rspo proteins (95;97;100;102). For example, it was first demonstrated that Rspo proteins function as ligands for the Wnt receptors Frz8 and LRP6, thereby allowing for LRP6 phosphorylation
35 25 and activation of endogenous β-catenin levels, ultimately leading to induced expression of cwnt target genes (95;102). In contrast, two other papers report that, instead of directly activating LRP6, Rspo1 interferes with the Wnt antagonists DKK-1 and Kremen (97;100). Rspo1 antagonizes DKK-1 through an interaction with Kremen, thus preventing internalization of LRP6 and allowing increased levels of LRP6 to remain on the cell surface for Wnt activation (97;100). Interestingly, this group also reported that although all four Rspo proteins activate the cwnt pathway to some extent, Rspo2 and Rspo3 are more potent than Rspo1, and Rspo4 is relatively inactive (97). It has recently been reported that, in contrast to the previous studies, Rspo proteins actually function as ligands of the leucine-rich repeat containing G-protein-coupled receptors 4 and 5 (LGR4 and LGR5, respectively) ( ). These studies have shown that Rspo binding to the LGR4 and LGR5 receptors by their furin-like cysteine-rich domains potentiates cwnt signaling, and consequently increases β-catenin activity, through enhanced LRP6 phosphorylation and Frz-LRP complexes ( ). A recent paper by Hao et al. (120) took a more in-depth look into the mechanism by which Rspo proteins and LGR4/5 receptors potentiate Wnt signaling. These authors identified the transmembrane E3 ubiquitin ligase zinc and ring finger 3 (ZNRF3) as a negative regulator of the Wnt pathway, as ZNRF3 inhibits Wnt signaling through ubiquitination-mediated degradation of Frz and LRP6 (120). Moreover, Hao et al. (120) demonstrated that Rspo inhibits the actions of ZNRF3. Rspo binding to the extracellular domain of ZNRF3 induces the association of ZNRF3 and LGR4, resulting in membrane clearance of ZNRF3 (Figure 1.3; (120)). This allows for accumulation of Frz and LRP receptors on the plasma membrane and therefore enhances Wnt signaling (120). Thus, multiple receptor complexes have been proposed for Rspo-induced potentiation of Wnt signaling: 1) Rspo-LGR4/5-ZNRF3; 2) Rspo-induced inhibition of DKK1-Kremen-

36 LRP5/6; 3) Rspo-Frz-LRP5/6; and 4) Frz-LRP6-LGR4/5 supercomplexes in the presence of both Wnt and Rspo ligands (117;118;120;121). 26 Figure 1.3 Rspo-mediated activation of cwnt signaling. A ZNRF3 inhibits Wnt signaling through ubiquitination-mediated degradation of the Frizzled and LRP5/6 receptors. B Rspo binding to the extracellular domain of ZNRF3 induces the association of ZNRF3 and LGR4/5, resulting in the autoubiquitination and membrane clearance of ZNRF3. This allows Frizzled and LRP5/6 receptors to accumulate on the plasma membrane. C The stabilization of Frizzled and LRP5/6 receptors allows for Wnt ligands to bind to the Frz-LRP5/6 receptor complex and activate the cwnt signaling pathway. Thus, Rspo-mediated activation of several receptor complexes for the potentiation of cwnt signaling have been reported: 1) Rspo- LGR4/5-ZNRF3; 2) Rspo-induced inhibition of DKK1-Kremen-LRP5/6; 3) Rspo-Frz- LRP5/6; and 4) Frz-LRP6-LGR4/5 supercomplexes in the presence of both Wnt and Rspo ligands. (Modified from MacDonald & He (121))
37 R-spondin proteins in mature beta cells Rspo1 has been reported to be expressed in mature human pancreas (114) as well as in murine pancreas and islets and in the murine MIN6 and βtc β-cell lines in vitro (71). Previous in vitro studies from our laboratory have shown that Rspo1 induces cwnt signaling in MIN6 β-cells, leading to elevated levels of nuclear β-catenin and increased transcription of the cwnt target gene c-myc (71). In addition, treatment with Rspo1 increases MIN6 and murine β-cell proliferation, prevents cytokine-induced apoptosis, and stimulates insulin secretion in a glucose-independent manner (71). Moreover, Rspo1 mrna expression levels are upregulated by Ex4, a GLP-1 receptor agonist, in a time-, dose- and PI3-kinasedependent manner, although this effect is only seen under high glucose conditions (71). Therefore, these findings are consistent with previous reports of a role for Rspo1 in cwnt signaling and demonstrate, for the first time, the effects of Rspo1 as a β-cell growth factor and insulin secretagogue in vitro (71). As expected, and in further support of a link between Rspo1 and cwnt signaling, mice with global Rspo1 deficiency have reduced levels of islet nuclear β-catenin-positive cells, as well as decreased mrna expression of cwnt target genes, c-myc and cyclin D1 (122). However, unexpectedly, under basal conditions, Rspo1 -/- mice display better oral glucose tolerance (122). Furthermore, in contrast with the in vitro studies, mice lacking Rspo1 have increased β-cell proliferation, as well as an increased number of insulin-positive ductal cells in the pancreas suggestive of increased β-cell neogenesis (122). This results in an increased β-cell mass in these mice, as well as increased mrna expression levels of insulin2, Pdx1, glucokinase, and GLUT2 (122). Together, these data demonstrate that Rspo1 is a regulator of whole-body glucose homeostasis and a negative regulator of β-cell neogenesis, at least under basal, physiological conditions (122).
38 Hypothesis and aims The cwnt activator, Rspo1, has recently been identified as a novel β-cell growth factor and insulin secretagogue in vitro, and a regulator of β-cell function, growth and neogenesis in vivo. However, there are no reports to-date examining β-cell responses to Rspo1 under pathophysiological conditions of metabolic stress, such as diabetes. Streptozotocin (STZ) is one widely used model to induce experimental diabetes similar to T1DM (via one single high-dose injection) and T2DM (via multiple low-dose injections) in rodents ( ). STZ acts as a toxic glucose analogue that enters β-cells via GLUT2 transporters, thus causing β- cell death through the alkylation of DNA and subsequent repair-induced depletion of cellular NAD + and ATP stores (126). As a result, STZ-induced diabetes results in gradual hyperglycemia and pancreatic insulitis in certain inbred mouse strains (124). Furthermore, STZ-induced diabetes is considered a model of β-cell growth and neogenesis in several rodent studies ( ). Hence, the hypothesis for the current study states that Rspo1 deficiency stimulates β-cell neogenesis in STZ-induced diabetes. My aims were therefore to i) examine the role of Rspo1 in STZ-induced metabolic challenge as a model of apoptosis and neogenesis and ii) examine the developmental patterns of insulin-positive ductal cells suggestive of β-cell neogenesis after insult with STZ.
39 29 2. METHODS 2.1 Animals Rspo1 -/- mice were generated by inserting the LacZ gene into exon3 of Rspo1, followed by a neomycin resistance cassette (98). Mice were genotyped as previously described (Figure 2.1) (98). Briefly, the Rspo1 alleles were determined using primers P2 (5 - ATCCAGGGTCCCTCTTGATC-3 ) and P12 (5 - TTGAGGCAACCGTTGACTTC-3 ) for wild-type (Rspo1 +/+ ) mice with an expected band size of 605 base pairs, and primers P2 and LacZ50 (5 - AATATCGCGGCTCATTCGAGG-3 ) for knockout (Rspo1 -/- ) mice with an expected band size of 416 base pairs (98). Real-time polymerase chain reaction (RT-PCR) was performed using the following conditions: i) 1 cycle at 94 o C for 3 min; ii) 1 cycle at 80 o C for 2 min; iii) 35 cycle at 94 o C for 45 sec, 58 o C for 30 sec, and 72 o C for 45 sec; iv) 1 cycle at 72 o C for 7 min; and v) 0 o C forever. Although the Rspo1 -/- mice were generated in France on a C57Bl/6 and SV129 mixed strain (98), the Toronto Rspo1 -/- mice were backcrossed onto a mixed CD1 background (C57Bl/6/SV129/CD1) (122). A comparison of the phenotype of the two strains of mice showed no differences (122); therefore all studies were performed using mice from the Toronto colony only. Mice were genotyped as previously described (98) and were given ad libitum access to water and standard rodent chow with a 12-hr light/dark cycle. Age- and sex-matched wild-type and Rspo1 -/- littermates from heterogeneous crossings were used in all experiments, and all animal protocols were approved by the University of Toronto Animal Care Committee. To determine the effects of Rspo1 deficiency in a model of STZ-induced diabetes, a modified protocol was used as previously described (132). Briefly, after a 5 hr fast, STZ (40 mg/kg body weight; Sigma-Aldrich, Oakville, ON, Canada) was freshly prepared in 0.1 mm

40 30 sodium citrate ph 5.5 and approximately 200 ul was injected intraperitoneally (ip), once daily for five consecutive days. The specific dose of STZ was chosen based on (124;132). Figure 2.1 Characterization of Rspo1 mice genotypes. 2.2 Metabolic tests Body weight and morning blood glucose was measured periodically throughout the experimental period (Figure 2.2) using the One Touch Basic glucose meter (a kind gift from Lifescan, Canada, Burnaby, BC, Canada). Mice were fasted overnight for oral glucose tolerance tests (OGTT) or 6 hr for insulin tolerance tests (ITT). Basal blood samples were collected from the tail vein at t = 0 min for measurement of glucose using the One Touch Basic glucose meter. Mice were then gavaged with glucose (1.5 mg/g; po) for the OGTT or injected (ip) with human biosynthetic insulin (0.3 U/kg; Humalog, Eli Lilly, Toronto, ON, Canada) for the ITT. Additional blood samples were collected from the tail vein at t=10, 20, 30, 60, 90 and 120 min for glucose measurements. For the OGTT, a blood sample was also collected from the tail vein at t=10 min for measurement of plasma insulin concentrations using an Insulin enzyme-linked immunosorbent assay (ELISA) for small sample volumes (Crystal Chem, Chicago, IL, USA). The trapezoidal rule for area-under-the-curve (AUC) calculations was used to measure glucose excursions from both the OGTTs and ITTs.
41 Figure 2.2 Experimental protocol for 6-d and 32-d STZ-induced diabetes studies. 31
42 Immunohistochemistry/Immunofluorescence Mouse pancreatic tissues were divided into three sections and the head of the pancreas was weighed, fixed in formalin (Sigma-Aldrich), paraffin-embedded and sectioned at the Pathology Research Program Laboratory (Toronto General Hospital, Toronto, ON, Canada). The remaining splenic and body of the pancreas were flash-frozen for mrna (messenger ribonucleic acid) analysis. For determination of β-cell mass (BCM), pancreatic sections were de-waxed with xylene, rehydrated through a series of graded (100%, 95%, and 70%) ethanol baths, and washed in phosphate buffered saline (PBS). Slides were then treated for 30 min at room temperature in 3% hydrogen peroxide made fresh in PBS prior to use. Epitope antigen retrieval was performed by heating slides in 10 mm sodium citrate buffer ph 6.0 on high power for 20 min and then for 5 min at power 6. Slides were allowed to cool down to room temperature before blocking for 30 min at room temperature with normal serum block (Covance Signet, Princeton, NJ, USA) in a humid chamber. Sections were then incubated overnight at 4 o C with a guinea pig anti-insulin antibody (1:200 dilution; Dako Diagnostics, Mississauga, ON, Canada). Slides were washed in PBS, incubated for 1 hr at room temperature with biotinylated anti-guinea pig antibody (1:500 dilution; Vector Laboratories, Burlington, ON, Canada) and subsequently treated for 1 hr at room temperature with either avidin/biotin complex (Vectastain Elite ABC Kit; Vector Laboratories) or streptavidinlabeled horseradish peroxidase (HRP) (Covance Signet). Subsequently, slides were stained with diaminobenzidine (DAB; Sigma-Aldrich) for 5 min, washed in distilled water, and counterstained with hematoxylin (Sigma-Aldrich). Finally, slides were dehydrated through a series of graded ethanol baths and mounted with Permount mounting medium (Fisher Scientific, Ottawa, ON, Canada). All dilutions were made in PBS. Pancreatic slides were
43 33 then scanned at the Advanced Optical Microscopy Facility (Princess Margaret Hospital, Toronto, ON, Canada) and Aperio ImageScope software (Aperio Technologies, Vista, CA, USA) was used to measure β-cell and total pancreatic area per section. Total BCM for each pancreas was determined as the product of the total cross-sectional β-cell area over the total pancreatic area and the weight of the pancreas. For determination of β-cell proliferation, co-staining of insulin and the proliferative marker, Ki67, was performed as described above. Briefly, after blocking with normal serum block, slides were incubated for 1 hr at room temperature using a rat anti-mouse Ki67 antibody (1:150 dilution; Dako Diagnostics). Slides were then washed in PBS, incubated for 1 hr at room temperature using a biotinylated mouse anti-rat secondary antibody (1:200 dilution; Vector Laboratories), and labeled with streptavidin HRP for 30 min in a humid chamber. Pancreatic slides were washed and immunoreactivity was visualized with DAB as described above. Subsequently, slides were washed in PBS, re-treated with normal serum block for 30 min, and incubated overnight at 4 o C with a guinea pig-anti insulin antibody (Dako Diagnostics). Slides were then washed in PBS and incubated for 1 hr at room temperature with biotinylated anti-guinea pig antibody (1:500 dilution; Vector Laboratories, Burlington, ON, Canada). After labeling the slides for 30 min at room temperature with avidin/biotin complex (Vectastain Elite ABC Kit; Vector Laboratories), slides were subsequently treated with Warp Red chromagen (Biocare Medical, Concord, CA, USA) for 2 min at room temperature. Slides were washed, dehydrated, and mounted as described above, and all dilutions were made in PBS. Staining of negative controls in all procedures was performed in the same manner as positive sections, with the exception of the primary antibody being omitted. Representative images are shown in Figure The number of
44 34 proliferating β-cells was calculated as the total number of Ki67 + :insulin + cells over the total number of insulin + cells. For determination of β-cell apoptosis, co-staining of insulin and the apoptotic marker, cleaved caspase 3, was performed using a rabbit anti-cleaved caspase 3 antibody (1:200 dilution; Cell Signaling Technology, Danvers, MA, USA) as described above. Slides were incubated for 1 hr at room temperature using a biotinylated goat anti-rabbit secondary antibody (1:200 dilution; Vector Laboratories) and further visualized as previously described. Slides were then incubated overnight at 4 o C with a guinea pig-anti insulin antibody (Dako Diagnostics), followed by a wash and 1 hr incubation at room temperature with a biotinylated anti-guinea pig antibody (1:500 dilution; Vector Laboratories, Burlington, ON, Canada), as described above. Representative images are shown in Figure The number of apoptotic β-cells was calculated as the total number of cleaved caspase 3 + :insulin + cells over the total number of insulin + cells. For determination of β-cell neogenesis, sections were co-stained for insulin and Ki67 or cleaved caspase 3, as described above. Representative images are shown in Figure β- cell neogenesis was determined as the total number of insulin + ductal cells per section. To analyze the developmental patterns of newly formed β-cells, immunofluorescence costaining was performed with a variety of antibodies/antisera. Pancreatic sections were dewaxed and rehydrated as described above, and antigen retrieval was performed by heating slides in 10 mm sodium citrate buffer ph 6.0 as previously mentioned. Slides were allowed to cool down to room temperature before sections were blocked with 10% normal donkey serum (made in Tris buffered saline and Tween; TBST) and incubated overnight at 4 o C with a guinea pig anti-insulin antibody (1:200 dilution; Dako Diagnostics) and one of the following primary antibodies/antisera (also shown in Table 2.1): rabbit anti-carbonic
45 35 anhydrase II (CA-II; 1:1000 dilution; Abcam, Cambridge, MA, USA), rabbit anticytokeratin-19 (CK-19; 1:100 dilution; Abcam), rabbit anti-glucagon (1:200 dilution; Dako Diagnostics), rabbit anti-glut2 (1:1000 dilution; Millipore, Billerica, CA, USA), rabbit anti-amylin/iapp (1:100 dilution; Abcam), rabbit anti-mafa (1:2000 dilution; Bethyl Laboratories, Montgomery, TX, USA), and mouse anti-nkx6.1 (1:1000 dilution; Beta Cell Biology Consortium, Nashville, TN, USA). The sections were then washed in TBST for 30 min and incubated for 1 hr at room temperature with Alexa Fluor 488-conjugated donkey anti-guinea pig IgG (H+L) and Cy3-conjugated donkey anti-rabbit or anti-mouse IgG (H+L), all of which were performed at a 1:400 dilution in TBST and obtained from Jackson ImmunoResearch Laboratories (West Grove, PA, USA). Multiple dilutions in TBST were attempted in the various antisera for optimization of staining. Nuclear counterstaining was performed using 4',6-diamidino-2-phenylindole (DAPI; Vector Laboratories) and immunofluorescent images were acquired using a Zeiss AxioPlan confocal microscope (Carl Zeiss Canada, Toronto, ON, Canada). Staining of negative controls in all procedures was performed in the same manner as positive sections, with the exception of the primary antibody being omitted, as described above. Representative images of control and positive staining are shown in Figure 3.12.
46 36 Table 2.1. Primary antibodies used for IHC staining ANTIGEN SPECIES SOURCE DILUTION Ki67 Rat Dako Diagnostics 1:150 (M7249) Cleaved Caspase 3 Rabbit Cell Signaling 1:200 Technology (9661; Asp175) Insulin Guinea Pig DAKO (A0564) 1:250 Carbonic Rabbit Abcam (ab6621) 1:1000 Anhydrase II (CA- II) Cytokeratin-19 Rabbit Abcam (ab15463) 1:100 (CK-19) Glucagon Rabbit Dako Diagnostics 1:200 (A0565) GLUT-2 Rabbit Millipore ( ) 1: IAPP (Amylin) Rabbit Abcam (ab53952) 1:100 MafA Rabbit Bethyl Laboratories (IHC-00352) 1:2000 Nkx6.1 Mouse Beta Cell Biology Consortium (F55A10) 1:1000
47 Ribonucleic acid (RNA) isolation and semi-quantitative real-time polymerase chain reaction (qrt-pcr) The splenic end of the pancreas was used for RNA extraction. Samples were sonicated in β-mercaptoethanol (Sigma-Aldrich) and Buffer RLT (RNeasy kit; Qiagen, Toronto, ON, Canada) and total RNA isolated using the RNeasy kit according to the manufacturer s instructions (Qiagen). RNA was quantified by spectrophotometry in a Synergy Mx Monochromator-Based Multi-Mode Microplate Reader (BioTek, Winooski, VT, USA) using Gen Reader Control and Data Analysis Software (BioTek). A ratio of absorbance at 260 nm and 280 nm around 2.0 ( ) was considered as valid purification of RNA for further experiments. RNA was then converted to complementary deoxyribonucleic acid (cdna) by reverse transcription using Superscript II Reverse Transcriptase, according to the manufacturer s instructions (Invitrogen Life Technologies Inc, Burlington, ON, Canada). First-strand cdnas were treated with ribonuclease H to remove RNA, and semi-quantitative RT-PCR (qrt-pcr) was performed using Taqman Universal PCR Master Mix (Applied Biosytems, Foster City, CA, USA) in a Chromo4 Continuous Fluorescence Detection unit with Opticon Monitor Analysis Software V 3.1 (Bio-Rad Laboratories, Mississauga, ON, Canada). Taqman Gene Expression Assays were used (ribosomal protein 18S no. Hs _s1, insulin2 no. Mm _gH and glucagon no. Mm _ml; Applied Biosystems) and all reactions were performed in duplicate. Ribosomal protein 18s RNA was used as the endogenous control for all quantitative analyses of mrna expression. Relative quantification of insulin2 (ins2) and glucagon mrna expression was calculated using the ΔΔ cycle threshold [ΔΔC(t)] method (133).
48 Primary ductal cell culture Although the in vitro primary ductal cell culture methods were unsuccessful, they have been included in this thesis for the sake of completeness. Pancreatic duct components were isolated from 8-9 week old Rspo1 +/+ and Rspo1 -/- mice using the following two protocols. The first protocol was adapted from Kitamura et al. (134). Mice were anesthetized using isoflourane (Abbott Laboratories, Chicago, IL, USA) and 1-2 ml of M199 medium (Gibco Life Technologies, Burlington, ON, Canada) containing 1 mg/ml collagenase P (Roche Applied Science, Mississauga, ON, Canada) was injected into the common bile duct. The swollen pancreas was then removed and incubated in the same solution for 17 min at 37 o C with gentle shaking every 3-4 min to disrupt the pancreas until the suspension turned homogenous. After incubation, cellular aggregates were diluted in 30 ml of ice-cold M199 medium containing 10% fetal bovine serum (FBS) to stop the digestion reaction, and the digested pancreata was dispersed by gently pipetting up and down with a glass pipette, using 30 ml of the same medium. The tissue suspension was applied onto a pre-wet 500 µm polyester mesh (Corning Incorporated, Corning, NY, USA) and the collected tissue was spun down to collect the pellet. The pellet was then resuspended in RPMI 1640 medium (Gibco Life Technologies) supplemented with 10% FBS, 5.5 mm glucose, and Antibiotic- Antimycotic (10000 U/mL of penicillin, µg/ml of streptomycin, 25 µg/ml amphotericin B; Gibco Life Technologies) and cultured at 37 o C in 5% CO 2. After 3 days in culture, medium was changed with fresh RPMI supplemented medium. After 7 days in culture, medium was replaced with serum-free RPMI supplemented with 8 mm glucose and 2 g/l BSA (Sigma-Aldrich). Nicotinamide (10 mm; Sigma-Aldrich), 1 g/l ITS (1.0 mg/ml recombinant human insulin, 0.55 mg/ml human transferrin, 0.5 μg/ml sodium selenite; Sigma-Aldrich), and 10 ng/ml keratinocyte growth factor (KGF; Sigma-Aldrich), were added
49 39 immediately prior to use, with medium changed every 2-3 days. At this point, small clusters of cobblestone -shaped cells indicative of ductal cells would begin to appear, but these all died off by week 3 of culturing. The second protocol for ductal cell isolation was adapted from Dr. Susan Bonner-Weir s group (personal communication; (135)). Once again, mice were anesthetized and the pancreas was removed as described above. After digestion for 17 min at 37 o C, the digested pancreas was placed on a Ficoll gradient as previously described (136). Briefly, Ficoll 400 (Sigma-Aldrich) was diluted to 6 ml of 25% (w/v), and 4 ml each of 23%, 20% and 11% (w/v) with sterile 1xHank s buffered saline solution (HBSS). Ficoll were layered in a sterile 50 ml Falcon tube in order of decreasing density with the digested pancreas laid carefully on top. This was then centrifuged at 1350xg for 10 min at 4 o C with acceleration set to slow and the deceleration turned off. The rest of the experiment was done on ice in a biological safety cabinet (BSC) when possible and centrifuged at 4 o C. The pellet was collected and, after adding 40 ml of RPMI medium, this islet-depleted tissue was divided into four 50 ml tubes, centrifuged at 57xg for 5 min, washed with calcium and magnesium free-phosphate buffered saline (CMF-PBS), and centrifuged again at 57xg for 5 min. For dispersion of the cells, a freshly prepared Trypsin solution containing 1.5 ml of 0.25% Trypsin EDTA in 20 ml PBS- CMF was added to each tube and vortexed for 15 sec. The dispersed cells were then placed in a 37 o C Precision Scientific Reciprocal Shaking Bath (Model 25; Thermo Scientific, Rockford, IL, USA) at 25xg for 4 min. After shaking, 10 ml of ice-cold RPMI medium was added to all tubes to halt the enzymatic reaction with gentle pipetting on ice. Next, the sample was run through a pre-wet 40 µm cell strainer (Falcon BD Biosciences, Mississauga, ON, Canada), placed in a 50 ml tube, and centrifuged at 57xg for 5 min. The pellet was resuspended in 2-3 ml of de-gassed PBS-CMF buffer solution supplemented with 750 mg/l
50 40 EDTA(Bioshop Canada, Burlington, ON, Canada) and 5 g/l BSA (Sigma-Aldrich), and vortexed. At this point, cell number was determined using a hemocytometer and trypan blue (Sigma-Aldrich), as a cell count of at least 10 5 cells was required for further steps as per requirements of the Magnetic Assisted Cell Sorting (MACS) system (Miltenyi Biotech, Auburn, CA, USA). The remaining isolation of ductal cells was performed as described by the MACS system using the MS column for positive selection of small sample sizes ( MiltenyiBiotec_DataSheet_Anti-Rat-IgG-MicroBeads_ pdf; a kind gift from Miltenyi Biotech). After magnetic separation, the positive fraction was centrifuged at 228xg for 5 min and resuspended in 5 ml of RPMI medium supplemented with 11 mm glucose, 10% FBS and Antibiotic-Antimycotic (10000 units/ml of penicillin, µg/ml of streptomycin, 25 µg/ml amphotericin B; Gibco Life Technologies). Cells were recounted as described above and >10 4 cells were plated on 10 cm petri dishes with the same RPMI medium. After 3 days in suspension, aggregated tissue was collected and separated by centrifugation (5 min) three times. Cells were then collected, washed, and plated onto collagen-coated plates (rat tail collagen type 1; Sigma-Aldrich) in DMEM/F12 medium (Gibco Life Technologies) supplemented with 17 mm glucose, 10% FBS, 20 ng/ml epidermal growth factor (EGF; Cedarlane, Burlington, ON, Canada) and Antibiotic- Antimycotic (10000 U/mL of penicillin, µg/ml of streptomycin, 25 µg/ml amphotericin B; Gibco Life Technologies). After 24 hrs in this culture medium, the media was changed to serum-free DMEM/F12 medium supplemented with 17 mm glucose, with 1 g/l ITS, 2 g/l BSA, 10 nmol/l nicotinamide, 5 nmol/l exendin-4 (Bachem, Torrance, CA, USA) and 20 ng/ml EGF added fresh immediately prior to use. After 5-7 days in culture, cells were then layered with Matrigel (VWR International, Mississauga, ON, Canada)
51 41 according to the manufacturer s instructions for thin gel overlay ( delines.pdf), with the exception of an overnight gelling time at 37 o C. The cells were then coated with Matrigel and allowed to gel overnight before additional serum-free DMEM/F12 supplemented media was added. At this point, the presence of cobblestone -shaped cells was noticeable, but cell numbers were very low even after 2-3 weeks in culture with growth factors. 2.6 Statistical Analysis All results are presented as mean ± SEM. Statistical analysis was performing using Statistical Analysis System software (SAS v 9.1.3, SAS Institute, Cary, NC, USA) using oneor two-way analysis of variance (ANOVA), followed by a Student s t test or one-way ANOVA, as well as post hoc analysis, as appropriate. Statistical significance was defined as p<0.05.
52 42 3. RESULTS 3.1 Phenotypes of Rspo1 +/+ and Rspo1 -/- mice are similar throughout the STZ-studies. To examine the effects of Rspo1 deficiency in a model of diabetes, mice were injected (ip) with multiple low-doses of STZ (40 mg/kg body weight) for five consecutive days. Although mice treated with STZ had similar levels of non-fasting blood glucose in the first days of STZ administration (Figure 3.1A), they developed progressive hyperglycemia by the end of the 32-d STZ study (Figure 3.1B), with blood glucose levels reaching similar values as previously reported (132). However, no marked differences in morning-fed blood glucose levels were noted between wild-type and knockout mice throughout the STZ studies. Wild-type and knockout mice demonstrated similar trends in body weight throughout both the short- (6-d) and long- (32-d) term STZ studies (Figure 3.2). Although there was a slight decrease in body weights of Rspo1 +/+ mice between day 4-20 in the long-term STZ studies, by the end of the experimental protocol, body weights were similar for both groups of mice (Figure 3.2B). Pancreatic weights of Rspo1 +/+ and Rspo1 -/- mice in non-stz-treated control (Figure 3.3A) and 6-d STZ (Figure 3.3B) studies were not different between the two groups of mice. Interestingly, pancreatic weights of Rspo1 -/- mice were significantly reduced compared to their wild-type littermates by the end of the 32-d STZ studies (p<0.05; Figure 3.3C).
 and Rspo1 -/- (black squares) mice over the course of 6-d (A; n = 9-11) and 32-d (B; n =")
53 Figure 3.1 Fed glycemia of Rspo1 +/+ and Rspo1 -/- mice does not differ throughout the STZ-induced studies. Non-fasting blood glucose levels of Rspo1 +/+ (white squares) and Rspo1 -/- (black squares) mice over the course of 6-d (A; n = 9-11) and 32-d (B; n = 11-16) STZ studies. *p<0.05 by Student s t-test 43
 and Rspo1 -/- (black squares) mice over the course of 6-d (A; n = 9-11) and 32-d (B; n = 11-16)")
54 Figure 3.2 Rspo1 +/+ and Rspo1 -/- mice have similar body weights throughout the STZinduced studies. Delta body weights of Rspo1 +/+ (white squares) and Rspo1 -/- (black squares) mice over the course of 6-d (A; n = 9-11) and 32-d (B; n = 11-16) STZ studies. *p<0.05 by Student s t-test. 44

 and Rspo1 -/- (black bars) mice")
55 Figure 3.3 Pancreatic weights are similar between Rspo1 +/+ and Rspo1 -/- mice until the end of the STZ-induced studies. Pancreatic weights of Rspo1 +/+ (white bars) and Rspo1 -/- (black bars) mice normalized to body weights in control (A; n = 4-5), 6-d (B; n = 9-11), and 32-d (C; n =11-16) STZ studies. *p<0.05 by Student s t-test. 45
56 Rspo1 +/+ and Rspo1 -/- mice have similar glycemic control but improved insulin sensitivity by the end of the STZ-studies. To examine the effect of Rspo1 deficiency in endocrine pancreas function following induction of STZ diabetes, I performed metabolic tests for whole-body glucose homeostasis. I first examined this effect in non-stz-treated control wild-type and knockout mice. Similar to previous reports (122), fasting blood glucose levels were in the normal range for both Rspo1 +/+ and Rspo1 -/- mice, with no difference noted between the two groups (Figure 3.4A inset). However, in contrast to previous work (122), there was no difference in glucose handling between Rspo1 +/+ and Rspo1 -/- mice after an oral glucose challenge (Figure 3.4A). Consistent with this finding, there was also no difference in the AUC of the glucose excursions at 0 to 120 min after an oral glucose load (Figure 3.4B). These studies were repeated in 32-d STZ-induced mice when hyperglycemia was present (Figure 3.1B). There was no difference in fasting glycemia between Rspo1 +/+ and Rspo1 -/- mice by the end of the long-term studies, although Rspo1 +/+ STZ-induced mice demonstrated impaired glucose handling in response to an OGTT (p< by two-way ANOVA between Figure 3.4B and Figure 3.5B), as expected. However, there was no difference in glycemic responses to oral glucose administration between Rspo1 +/+ and Rspo1 -/- mice after insult with STZ (Figure 3.5A-B). Although oral glucose handling was determined to be similar between the two groups of mice, intraperitoneal ITTs were performed to examine possible differences in insulin sensitivity between Rspo1 +/+ and Rspo1 -/- mice. Blood glucose levels after a 6 hr fast were similar between Rspo1 +/+ and Rspo1 -/- mice in both 6-d (Figure 3.6A) and 32-d (Figure 3.6B) STZ studies although, as expected, mice exhibited impaired fasting glycemia by the end of the STZ studies (p<0.05). The glycemic response to an ITT (Figure 3.6C) was not different between Rspo1 +/+ and Rspo1 -/- mice by day 6 of the STZ study. However, by the end of the
57 47 long-term STZ study, Rspo1 -/- mice had significantly better glycemic responses to an ITT (p< ; Figure 3.6D), suggesting increased insulin sensitivity in these animals. Plasma levels of insulin after a 5 hr fast were not statistically different between Rspo1 +/+ and Rspo1 -/- mice in non-stz-treated control mice, as well as in mice from both the 6-d and 32-d STZ studies (Figure 3.7A-C). Furthermore, no change was observed in plasma insulin levels at t = 10 min following an oral glucose load in both wild-type and knockout animals in both the non-stz-treated control and 32-d STZ-induced studies (Figure 3.7D-E).

.")
58 Figure 3.4 Control Rspo1 +/+ and Rspo1 -/- mice have similar glycemic control in response to an oral glucose load. A Glycemic profiles in control Rspo1 +/+ (white squares) and Rspo1 -/- (black squares) mice in response to an OGTT after an overnight fast (n = 6). B Areaunder-the-curve (AUC) of the glucose excursions at 0 to 120 min after administration of an oral glucose load (n = 6) in control mice. 48
 and Rspo1 -/- (black squares) mice in response to an OGTT after an overnight fast (n = 5-16).")
59 49 Figure d STZ-induced diabetic Rspo1 +/+ and Rspo1 -/- mice have similar glucose handling in response to an oral glucose load. A Glycemic profiles in 32-d STZ-induced Rspo1 +/+ (white squares) and Rspo1 -/- (black squares) mice in response to an OGTT after an overnight fast (n = 5-16). B Area-under-the-curve (AUC) of the glucose excursions at 0 to 120 min after administration of an oral glucose load (n = 6) in 32-d STZ-induced mice.

60 50
61 51 Figure 3.6 Rspo1 -/- mice have increased insulin sensitivity by the end of the 32-d STZ studies. Blood glucose levels after a 6 hr fast in 6-d (A; n = 5-7) and 32-d (B; n = 5-16) STZ studies. C Glycemic responses in Rspo1 +/+ (white squares) and Rspo1 -/- (black squares) mice during an intraperitoneal insulin tolerance test (ITT) at the end of the 6-d STZ study (n = 5-7). D Glycemic responses in Rspo1 +/+ and Rspo1 -/- mice to an intraperitoneal ITT at the end of the 32-d STZ study (n = 5-16). *p<0.05, **p<0.01, ****p< by Student s t-test.
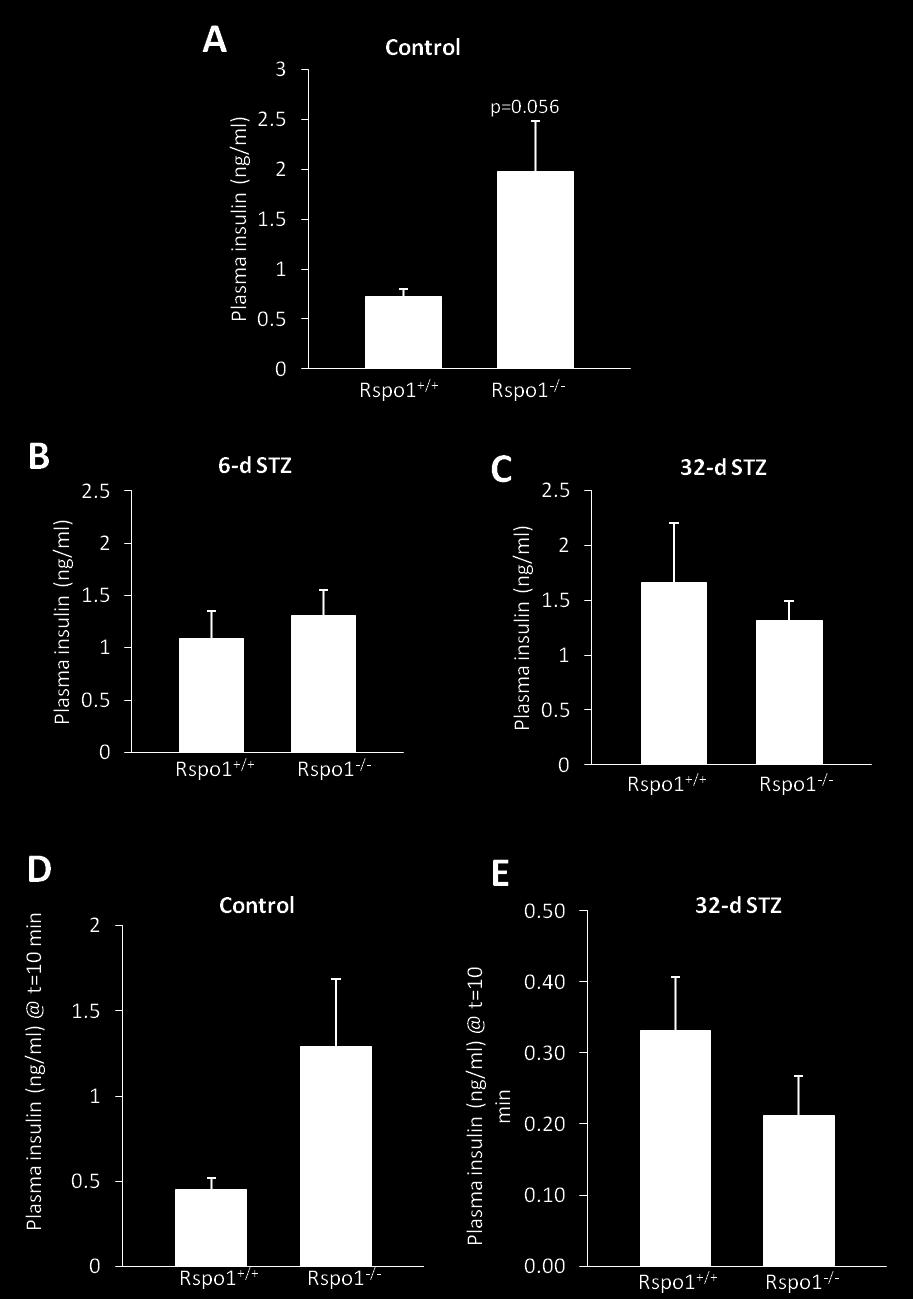
62 52
63 Figure 3.7 Plasma insulin concentrations do not differ between Rspo1 +/+ and Rspo1 -/- mice. Levels of plasma insulin in Rspo1 +/+ (white bars) and Rspo1 -/- (black bars) mice in control (A; n = 6), 6-d STZ (B; n = 9-11), and 32-d STZ (C; n = 11-16) studies after a 5 hr fast, as determined by radioimmunoassay. Plasma insulin levels in control (D; n = 3-6) and 32-d STZ (E; n = 9-13) studies at t =10 min after administration of an OGTT, as determined by an insulin ELISA Rspo1 -/- mice have reduced β-cell apoptosis and increased β-cell neogenesis in response to STZ-induced diabetes. Rspo1 deficiency has previously been shown to increase β-cell mass under basal conditions (122). Thus, in order to determine whether mice lacking Rspo1 would continue to demonstrate this effect under STZ-stressed conditions, pancreatic sections were stained for insulin to examine total β-cell mass. Consistent with previous work (122), Rspo1 -/- mice from the non-stz-treated control group had significantly increased β-cell mass, by 1.9-fold relative to wild-type controls (p<0.05; Figure 3.8). Insult with STZ failed to decrease β-cell mass in Rspo1 +/+ mice as had been expected, although STZ administration significantly reduced β-cell mass in Rspo1 -/- mice compared to basal levels. However, there was no difference in β-cell mass between Rspo1 +/+ and Rspo1 -/- mice throughout the STZ experimental periods (Figure 3.8A). Thus, interestingly, Rspo1 -/- mice had a greater decrease in β-cell mass after administration of STZ than their wild-type counterparts (p<0.0001), suggesting that these mice may have increased sensitivity to the early effects of the STZ. Similar trends were observed in β-cell area (Figure 3.8B-D), and no differences in the total number of islets or in islet distribution by size (arbitrarily set as 1, 2-99, or 100 and greater β- cells) were apparent between Rspo1 +/+ and Rspo1 -/- mice throughout the STZ experimental protocols (Figure 3.9A-B). Since Rspo1 deficiency has been found to increase β-cell proliferation and neogenesis in control animals (122), we investigated whether this effect would be continued after the
64 54 administration of STZ. Co-immunostaining for insulin and the proliferative marker, Ki67, in pancreatic sections of Rspo1 +/+ and Rspo1 -/- mice failed to demonstrate any significant differences in cell proliferation after insult with STZ in both the 6-d (Figure 3.10A) and 32-d (Figure 3.10B) STZ studies. However, examination of β-cell apoptosis, detected by insulin and cleaved-caspase 3 co-staining, revealed that apoptosis was significantly reduced (p<0.05) in Rspo1 -/- mice relative to wild-type mice in the 6-d STZ animals (Figure 3.10C), with a similar trend (p=0.051) observed in 32-d STZ animals (Figure 3.10D). Consistent with previous studies (122), Rspo1 -/- mice also had significantly increased levels of insulinpositive ductal cells (by 3.1-fold, p<0.05; Figure 3.11A), suggestive of β-cell neogenesis. Most importantly, Rspo1 -/- mice continued to display markedly higher levels of insulinpositive ductal cells as compared to wild-type mice in both the 6-d (by 3-fold, p<0.05; Figure 3.11B) and 32-d (by 2.2-fold, p<0.05; Figure 3.11C) STZ studies, whereas wild-type mice exhibited no change in the levels of insulin-positive ductal cells between control and STZ experimental studies. Increased mrna expression of Ins2 was also seen in the Rspo1 -/- mice relative to wild-type animals at the end of the 6-d STZ study (p<0.05; Figure 3.11D). However, this difference in Ins2 expression was lost by the end of the 32-d STZ study (Figure 3.11E). Collectively, these data indicate that Rspo1 -/- mice have increased β-cell neogenesis and enhanced protection against β-cell apoptosis compared to wild-type littermates in the face of STZ-induced diabetes.
 and β-cell area (B-D) was determined in control (n = 4-5), 6-d STZ (n = 9-11), and 32-d STZ (n =11-16) studies in insulin-stained pancreatic sections from Rspo1 +/+ and Rspo1 -/-")
65 Figure 3.8 β-cell mass differs between Rspo1 +/+ and Rspo1 -/- control mice only. β-cell mass (BCM; A) and β-cell area (B-D) was determined in control (n = 4-5), 6-d STZ (n = 9-11), and 32-d STZ (n =11-16) studies in insulin-stained pancreatic sections from Rspo1 +/+ and Rspo1 -/- mice. *p<0.05 vs. control wild-type mice, ###p< as indicated by twoway ANOVA, followed by one-way ANOVA and n-1 custom hypotheses post- hoc tests. 55
 and 32-d (B; n = 11-16) STZ studies were determined in insulin-stained pancreatic sections from Rspo1 +/+ (white bars)")
66 Figure 3.9 Rspo1 +/+ and Rspo1 -/- mice have similar islet profiles. Size distribution and total number of islets per section in 6-d (A; n = 9-11) and 32-d (B; n = 11-16) STZ studies were determined in insulin-stained pancreatic sections from Rspo1 +/+ (white bars) and Rspo1 -/- (black bars) mice. Islets were arbitrarily distributed based on size as single insulin-positive β- cells, between 2 to 99 insulin-positive β-cells, or 100 or more insulin-positive β-cells. 56
 in 6-d (A; n =")

67 57 Figure 3.10 Rspo1 -/- mice have reduced B-cell apoptosis. Proliferating β-cells were determined by co-staining for insulin and Ki67 (# of Ki67 + :insulin + cells/total # of insulin + cells) in 6-d (A; n = 9-11) and 32-d (B; n = 11-16) STZ studies. Apoptotic β-cells were determined by co-staining for insulin and cleaved caspase-3 (# of cleaved caspase 3 + :insulin + cells/total # of insulin + cells) in 6-d (C; n = 9-11) and 32-d (D; n = 11-16) STZ studies. Representative pictures are shown; arrows indicate Ki67- and caspase3-positive cells. Scale bars represent 50 μm. *p<0.05 by Student s t-test.


68 58
69 Figure 3.11 Rspo1 -/- mice have increased β-cell neogenesis. β-cell neogenesis was determined as the number of insulin-positive cells in the pancreatic ducts of control (A; n = 4-5), 6-d STZ (B; n = 9-11), and 32-d STZ (C; n = 11-16) studies. Representative pictures are shown; arrows indicate insulin-positive cells. qrt-pcr analyses of insulin2 mrna in pancreatic lysates of 6-d (D; n = 9-11) and 32-d (E; n = 11-16) STZ studies. Relative expression levels were normalized to 18S rrna expression. *p<0.05 by Student s t-test Ductal insulin-positive cells express markers of β-cell maturity. To analyze the developmental patterns of insulin-positive ductal cells, immunofluorescence co-staining was performed with a variety of antibodies/antisera (control and positive staining are shown in Figure 3.12). To delineate whether the ductal insulinpositive cells arise from duct cells or another pancreatic cell type, co-immunofluorescence staining for insulin and the duct-cell specific markers cytokeratin-19 (CK-19) and carbonic anhydrase II (CA-II) was performed in pancreatic sections of both Rspo1 +/+ and Rspo1 -/- mice from the 32-d STZ studies. A lack of co-expression was seen in all insulin-positive ductal cells from both 6-d and 32-d STZ studies (Figure 3.13), suggesting that these β-cells have progressed past the duct cell phenotype and towards a more mature β-cell phenotype. To examine this further, we next probed the differentiation stage of the duct cellderived insulin-positive cells. Several studies have demonstrated that transdifferentiation of α-cells to β-cells can be a source of insulin-positive cells in the adult mouse (45-47;137). If this was the case in the present study, we would expect immature, bi-hormonal glucagon- and insulin-positive cells within the ducts. We found no evidence for either glucagon-positive or co-expression of glucagon within insulin-positive ductal cells of Rspo1 +/+ and Rspo1 -/- mice from the 32-d STZ study (Figure 3.14). This data indicates that the insulin-positive cells seen within the ducts are not bi-hormonal and have not transdifferentiated from an α- to β-cell state.
70 60 To further assess if the insulin-positive cells within ducts resembled adult β-cells, we examined key markers of functional, mature β-cells (i.e. GLUT2, Nkx6.1, MafA and IAPP). In general, both 6-d and 32-d STZ-induced Rspo1 +/+ and Rspo1 -/- mice had normal islet expression of these markers. No GLUT2 expression was evident in insulin-positive ductal cells from 6-d STZ-induced Rspo1 +/+ and Rspo1 -/- mice (Figure 3.15A-B), although Nkx6.1 expression was seen in 6-d STZ-induced Rspo1 -/- mice only (Figure 3.15E-F). However, by the end of the long-term STZ study, GLUT2 expression was seen in some insulin-positive ductal cells in Rspo1 -/- mice, although its expression was still absent from Rspo1 +/+ mice (Figure 3.15C-D). Similarly, Rspo1 -/- mice from the 32-d STZ study demonstrated increased expression of Nkx6.1 (Figure 3.15G-H) and MafA (Figure 3.15I-J) in insulin-positive ductal cells of Rspo1 -/- mice, although no expression was seen in Rspo1 +/+ mice from the same studies. Finally, preliminary studies demonstrated that Rspo1 -/- mice had greater expression of IAPP in small islets (containing 1-5 β-cell nuclei) than Rspo1 +/+ mice from the 32-d STZ studies (Figure 3.16A-B), suggesting that these small islets are more differentiated in the knockout animals compared to their wild-type littermates. However, there was no marked difference in the expression of GLUT2, Nkx6.1 or MafA in small islets between Rspo1 +/+ and Rspo1 -/- mice in both 6-d and 32-d STZ studies.

71 61
 and positive (right-hand panels) immunofluorescence")
, islet amyloid polypeptide (IAPP; E), GLUT2 (F), MafA (G) and Nkx6.1 (H).")
72 Figure 3.12 Validation of immunofluorescence staining. Negative (control; left-hand panels) and positive (right-hand panels) immunofluorescence staining for insulin (A), cytokeratin-19 (CK-19; B), carbonic anhydrase II (CA-II; C), glucagon (D), islet amyloid polypeptide (IAPP; E), GLUT2 (F), MafA (G) and Nkx6.1 (H). Insets show representative islets. Scale bars represent 50 μm. 62
 and the duct-cell specific markers CK-19 (red; A-B; n = 5-6) and CA-II (red; C-D; n = 3) in 32-d STZ Rspo1 +/+ and Rspo1 -/-")
73 Figure 3.13 Insulin-positive cells arise from ductal epithelium. Immunofluorescence with insulin (green) and the duct-cell specific markers CK-19 (red; A-B; n = 5-6) and CA-II (red; C-D; n = 3) in 32-d STZ Rspo1 +/+ and Rspo1 -/- mice. Insets show representative β-cells; arrows indicate positive cells. Scale bars represent 50 μm. 63
 and glucagon (red) in 32-d STZ Rspo1 +/+ (A; n = 3) and Rspo1 -/- (B; n = 3) mice.")
74 Figure 3.14 Insulin-positive cells within ducts are not bi-hormonal. Immunofluorescence with insulin (green) and glucagon (red) in 32-d STZ Rspo1 +/+ (A; n = 3) and Rspo1 -/- (B; n = 3) mice. Insets show representative β-cells; arrows indicate positive cells. Scale bars represent 50 μm. 64


75 65

76 66
 and GLUT2 (red) in 6-d (n = 3) and 32-d (C-D; n = 3) STZ Rspo1 +/+ and Rspo1 -/- mice. E-F Immunofluorescence with insulin (green) and Nkx6.")
77 Figure 3.15 Insulin-positive cells in ducts of Rspo1 -/- mice express markers of β-cell maturity. A-B Immunofluorescence with insulin (green) and GLUT2 (red) in 6-d (n = 3) and 32-d (C-D; n = 3) STZ Rspo1 +/+ and Rspo1 -/- mice. E-F Immunofluorescence with insulin (green) and Nkx6.1(red) in 6-d (n = 3) and 32-d (G-H; n = 3) STZ Rspo1 +/+ and Rspo1 -/- mice. I-J Immunofluorescence with insulin (green) and MafA (red) in 32-d (n = 3) STZ Rspo1 +/+ and Rspo1 -/- mice. Insets show representative β-cells; arrows indicate positive cells. Scale bars represent 50 μm. 67
 and IAPP (red) in 32-d")

78 Figure 3.16 Rspo1 -/- mice have more mature small islets. A-B Immunofluorescence with insulin (green) and IAPP (red) in 32-d (n = 3) STZ Rspo1 +/+ and Rspo1 -/- mice. Insets show representative β-cells; arrows indicate positive cells. Scale bars represent 50 μm. 68
α-cell role in β-cell generation and regeneration
 Islets ISSN: 1938-2014 (Print) 1938-2022 (Online) Journal homepage: http://www.tandfonline.com/loi/kisl20 α-cell role in β-cell generation and regeneration Joel F. Habener & Violeta Stanojevic To cite
Discussion & Conclusion
 Discussion & Conclusion 7. Discussion DPP-4 inhibitors augment the effects of incretin hormones by prolonging their half-life and represent a new therapeutic approach for the treatment of type 2 diabetes
Week 3 The Pancreas: Pancreatic ph buffering:
 Week 3 The Pancreas: A gland with both endocrine (secretion of substances into the bloodstream) & exocrine (secretion of substances to the outside of the body or another surface within the body) functions
Control of Glucose Metabolism
 Glucose Metabolism Control of Glucose Metabolism The pancreas is both an exocrine and endocrine gland. It secretes digestive enzymes into the duodenum (exocrine) and 3 specific hormones into the bloodstream
Journal Club WS 2012/13 Stefanie Nickl
 Journal Club WS 2012/13 Stefanie Nickl Background Mesenchymal Stem Cells First isolation from bone marrow 30 ys ago Isolation from: spleen, heart, skeletal muscle, synovium, amniotic fluid, dental pulp,
NIH Public Access Author Manuscript Diabetologia. Author manuscript; available in PMC 2014 February 01.
 NIH Public Access Author Manuscript Published in final edited form as: Diabetologia. 2013 February ; 56(2): 231 233. doi:10.1007/s00125-012-2788-6. Lipotoxicity impairs incretin signalling V. Poitout 1,2
Glucose Homeostasis. Liver. Glucose. Muscle, Fat. Pancreatic Islet. Glucose utilization. Glucose production, storage Insulin Glucagon
 Glucose Homeostasis Liver Glucose Glucose utilization Glucose production, storage Insulin Glucagon Muscle, Fat Pancreatic Islet Classification of Diabetes Type 1 diabetes Type 2 diabetes Other types of
Neoplasia 18 lecture 6. Dr Heyam Awad MD, FRCPath
 Neoplasia 18 lecture 6 Dr Heyam Awad MD, FRCPath ILOS 1. understand the role of TGF beta, contact inhibition and APC in tumorigenesis. 2. implement the above knowledge in understanding histopathology reports.
Maturity-onset diabetes of the young (MODY) is a heterogeneous group
 is a heterogeneous group") Over the years, different forms of maturity-onset diabetes of the young (MODY) have been identified, with mutations in a number of different genes associated with a MODY-like phenotype. Depending on the
Over the years, different forms of maturity-onset diabetes of the young (MODY) have been identified, with mutations in a number of different genes associated with a MODY-like phenotype. Depending on the
CHAPTER 6 SUMMARIZING DISCUSSION
 CHAPTER 6 SUMMARIZING DISCUSSION More than 20 years ago the founding member of the Wnt gene family, Wnt-1/Int1, was discovered as a proto-oncogene activated in mammary gland tumors by the mouse mammary
KEY CONCEPT QUESTIONS IN SIGNAL TRANSDUCTION
 Signal Transduction - Part 2 Key Concepts - Receptor tyrosine kinases control cell metabolism and proliferation Growth factor signaling through Ras Mutated cell signaling genes in cancer cells are called
History of Investigation
 Acini - Pancreatic juice (1º) (2º) Secretions- neuronal and hormonal mechanisms 1) Secretin - bicarbonate rich 2) Cholecystokinin - enzyme rich Islets of Langerhans (contain 4 cell types) Alpha cells (α)-
What systems are involved in homeostatic regulation (give an example)?
?") 1 UNIVERSITY OF PNG SCHOOL OF MEDICINE AND HEALTH SCIENCES DIVISION OF BASIC MEDICAL SCIENCES DISCIPLINE OF BIOCHEMISTRY AND MOLECULAR BIOLOGY GLUCOSE HOMEOSTASIS (Diabetes Mellitus Part 1): An Overview
1 UNIVERSITY OF PNG SCHOOL OF MEDICINE AND HEALTH SCIENCES DIVISION OF BASIC MEDICAL SCIENCES DISCIPLINE OF BIOCHEMISTRY AND MOLECULAR BIOLOGY GLUCOSE HOMEOSTASIS (Diabetes Mellitus Part 1): An Overview
Cell Therapy for Diabetes: Generating Functional Islets from Human Exocrine Tissue
 Cell Therapy for Diabetes: Generating Functional Islets from Human Exocrine Tissue Kevin Docherty University of Aberdeen ELRIG Drug Discovery 2016 ACC Liverpool 14 th October 2016 Autoimmune destruction
Meeting Report. From December 8 to 11, 2012 at Atlanta, GA, U.S.A
 Meeting Report Affiliation Department of Transfusion Medicine and Cell Therapy Name Hisayuki Yao Name of the meeting Period and venue Type of your presentation Title of your presentation The 54 th Annual
ENERGY FROM INGESTED NUTREINTS MAY BE USED IMMEDIATELY OR STORED
 QUIZ/TEST REVIEW NOTES SECTION 1 SHORT TERM METABOLISM [METABOLISM] Learning Objectives: Identify primary energy stores of the body Differentiate the metabolic processes of the fed and fasted states Explain
Solution Key EXAM 3 (4 / 29 / 13)
") Solution Key- 7.013 EXAM 3 (4 / 29 / 13) Question 1 (20 points) Diabetes occurs either due to a reduced insulin hormone production by the pancreatic β cells or the resistance of target cells to insulin.
Solution Key- 7.013 EXAM 3 (4 / 29 / 13) Question 1 (20 points) Diabetes occurs either due to a reduced insulin hormone production by the pancreatic β cells or the resistance of target cells to insulin.
Supplemental Experimental Procedures
 Cell Stem Cell, Volume 2 Supplemental Data A Temporal Switch from Notch to Wnt Signaling in Muscle Stem Cells Is Necessary for Normal Adult Myogenesis Andrew S. Brack, Irina M. Conboy, Michael J. Conboy,
Hormonal Regulations Of Glucose Metabolism & DM
 Hormonal Regulations Of Glucose Metabolism & DM What Hormones Regulate Metabolism? What Hormones Regulate Metabolism? Insulin Glucagon Thyroid hormones Cortisol Epinephrine Most regulation occurs in order
Week 3, Lecture 5a. Pathophysiology of Diabetes. Simin Liu, MD, ScD
 Week 3, Lecture 5a Pathophysiology of Diabetes Simin Liu, MD, ScD General Model of Peptide Hormone Action Hormone Plasma Membrane Activated Nucleus Cellular Trafficking Enzymes Inhibited Receptor Effector
Analysis on the mechanism of reduced nephron number and the pathological progression of chronic renal failure in Astrin deficient rats
 Analysis on the mechanism of reduced nephron number and the pathological progression of chronic renal failure in Astrin deficient rats Summary of Doctoral Thesis Hidenori Yasuda Graduate School of Veterinary
Cell Signaling part 2
 15 Cell Signaling part 2 Functions of Cell Surface Receptors Other cell surface receptors are directly linked to intracellular enzymes. The largest family of these is the receptor protein tyrosine kinases,
Maternal malnutrition programmes a prediabetic phenotype in the progeny
 Note: for non-commercial purposes only Maternal malnutrition programmes a prediabetic phenotype in the progeny Brigitte Reusens Institut des Sciences de la vie, Université catholique de Louvain, Louvain-la-Neuve,
MBios 401/501: Lecture 12.1 Signaling IV. Slide 1
 MBios 401/501: Lecture 12.1 Signaling IV Slide 1 Pathways that require regulated proteolysis 1. Notch and Delta 2. Wnt/ b-catenin 3. Hedgehog 4. NFk-B Our last topic on cell signaling are pathways that
UNIVERSITY OF PNG SCHOOL OF MEDICINE AND HEALTH SCIENCES DIVISION OF BASIC MEDICAL SCIENCES DISCIPLINE OF BIOCHEMISTRY AND MOLECULAR BIOLOGY
 1 UNIVERSITY OF PNG SCHOOL OF MEDICINE AND HEALTH SCIENCES DIVISION OF BASIC MEDICAL SCIENCES DISCIPLINE OF BIOCHEMISTRY AND MOLECULAR BIOLOGY GLUCOSE HOMEOSTASIS An Overview WHAT IS HOMEOSTASIS? Homeostasis
Receptor mediated Signal Transduction
 Receptor mediated Signal Transduction G-protein-linked receptors adenylyl cyclase camp PKA Organization of receptor protein-tyrosine kinases From G.M. Cooper, The Cell. A molecular approach, 2004, third
MPB333:Molecular Endocrinology of Obesity and Diabetes
 MPB333:Molecular Endocrinology of Obesity and Diabetes The Use of Stem Cells as a Cure for Type 1 Diabetes January 15, 2010 Trish Labosky 9415C MRBIV trish.labosky@vanderbilt.edu In theory. 2. ~Easy and
Insulin Resistance. Biol 405 Molecular Medicine
 Insulin Resistance Biol 405 Molecular Medicine Insulin resistance: a subnormal biological response to insulin. Defects of either insulin secretion or insulin action can cause diabetes mellitus. Insulin-dependent
18. PANCREATIC FUNCTION AND METABOLISM. Pancreatic secretions ISLETS OF LANGERHANS. Insulin
 18. PANCREATIC FUNCTION AND METABOLISM ISLETS OF LANGERHANS Some pancreatic functions have already been discussed in the digestion section. In this one, the emphasis will be placed on the endocrine function
Maternal diet induced micrornas and mtor underlie b cell dysfunction in offspring
 Maternal diet induced micrornas and mtor underlie b cell dysfunction in offspring Emilyn U. Alejandro,, Peter Arvan, Ernesto Bernal- Mizrachi J Clin Invest. 2014;124(10):4395-4410. https://doi.org/10.1172/jci74237.
HORMONES AND CELL SIGNALLING
 HORMONES AND CELL SIGNALLING TYPES OF CELL JUNCTIONS CHEMICAL SIGNALS AND MODES OF ACTION Endocrine system produces chemical messages = hormones that are transported from endocrine gland to target cell
Principles of cell signaling Lecture 4
 Principles of cell signaling Lecture 4 Johan Lennartsson Molecular Cell Biology (1BG320), 2014 Johan.Lennartsson@licr.uu.se 1 Receptor tyrosine kinase-induced signal transduction Erk MAP kinase pathway
Supplementary Figure 1.
 Supplementary Figure 1. Increased expression of cell cycle pathway genes in insulin + Glut2 low cells of STZ-induced diabetic islets. A) random blood glucose measuers of STZ and vehicle treated MIP-GFP
Lecture 15. Signal Transduction Pathways - Introduction
 Lecture 15 Signal Transduction Pathways - Introduction So far.. Regulation of mrna synthesis Regulation of rrna synthesis Regulation of trna & 5S rrna synthesis Regulation of gene expression by signals
Supplementary Figure 1.TRIM33 binds β-catenin in the nucleus. a & b, Co-IP of endogenous TRIM33 with β-catenin in HT-29 cells (a) and HEK 293T cells
 and HEK 293T cells") Supplementary Figure 1.TRIM33 binds β-catenin in the nucleus. a & b, Co-IP of endogenous TRIM33 with β-catenin in HT-29 cells (a) and HEK 293T cells (b). TRIM33 was immunoprecipitated, and the amount of
Supplementary Figure 1.TRIM33 binds β-catenin in the nucleus. a & b, Co-IP of endogenous TRIM33 with β-catenin in HT-29 cells (a) and HEK 293T cells (b). TRIM33 was immunoprecipitated, and the amount of
Cordoba 01/02/2008. Slides Professor Pierre LEFEBVRE
 Cordoba 01/02/2008 Slides Professor Pierre LEFEBVRE Clinical Research in Type 2 Diabetes : Current Status and Future Approaches Pierre Lefèbvre* University of Liège Belgium Granada, Spain, February 2008
In Vitro Differentiation and Expansion of Human Pluripotent Stem Cell-Derived Pancreatic Progenitors
 Reprint from The Review of DIABETIC STUDIES Vol 11 No 1 2014 Special Edition Stem Cells and Pancreas Regeneration The Review of DIABETIC STUDIES REVIEW In Vitro Differentiation and Expansion of Human Pluripotent
EAT TO LIVE: THE ROLE OF THE PANCREAS. Felicia V. Nowak, M.D., Ph.D. Ohio University COM 22 January, 2008
 EAT TO LIVE: THE ROLE OF THE PANCREAS Felicia V. Nowak, M.D., Ph.D. Ohio University COM 22 January, 2008 THE ROLE OF THE PANCREAS Exocrine pancreas Endocrine pancreas THE ROLE OF THE PANCREAS EXOCRINE
SUPPLEMENTARY INFORMATION
 SUPPLEMENTARY INFORMATION doi:1.138/nature11463 %Sox17(+) 9 8 7 6 5 4 3 2 1 %Sox17(+) #Sox17(+) d2 d4 d6 d8 d1 d12 d14 d18 25 2 15 1 5 Number of Sox17(+) cells X 1 Supplementary Figure 1: Expression of
Chapter 9. Cellular Signaling
 Chapter 9 Cellular Signaling Cellular Messaging Page 215 Cells can signal to each other and interpret the signals they receive from other cells and the environment Signals are most often chemicals The
Defects in glucose utilization & GLP-1
 Defects in glucose utilization & GLP-1 Song, Dae-Kyu Department of Physiology & Chronic Disease Research Center Keimyung University School of Medicine 2800 dalgubeol-daero, Dalseo-gu, Daegu, 704-701, Korea
Cell Quality Control. Peter Takizawa Department of Cell Biology
 Cell Quality Control Peter Takizawa Department of Cell Biology Cellular quality control reduces production of defective proteins. Cells have many quality control systems to ensure that cell does not build
Signal Transduction Cascades
 Signal Transduction Cascades Contents of this page: Kinases & phosphatases Protein Kinase A (camp-dependent protein kinase) G-protein signal cascade Structure of G-proteins Small GTP-binding proteins,
Gene therapy: State of the art. Ramon Gomis MD, PhD, MAE. Hospital Clínic. IDIBAPS. University of Barcelona.
 Gene therapy: State of the art Ramon Gomis MD, PhD, MAE. Hospital Clínic. IDIBAPS. University of Barcelona. Gene Therapy: First Steps Type 1 diabetes: An islet disease Alpha cell Beta cell Pancreatic
Molecular Cell Biology - Problem Drill 19: Cell Signaling Pathways and Gene Expression
 Molecular Cell Biology - Problem Drill 19: Cell Signaling Pathways and Gene Expression Question No. 1 of 10 1. Which statement about cell signaling is correct? Question #1 (A) Cell signaling involves receiving
2013 W. H. Freeman and Company. 12 Signal Transduction
 2013 W. H. Freeman and Company 12 Signal Transduction CHAPTER 12 Signal Transduction Key topics: General features of signal transduction Structure and function of G protein coupled receptors Structure
PANCREATIC BETA CELLS PRODUCE AND SECRETE
 15 March, 2018 PANCREATIC BETA CELLS PRODUCE AND SECRETE Document Filetype: PDF 374.06 KB 0 PANCREATIC BETA CELLS PRODUCE AND SECRETE Among the oldest and cheapest drugs for diabetes are the drugs that
Pathogenesis of Diabetes Mellitus
 Pathogenesis of Diabetes Mellitus Young-Bum Kim, Ph.D. Associate Professor of Medicine Harvard Medical School Definition of Diabetes Mellitus a group of metabolic diseases characterized by hyperglycemia
Cellular Signaling Pathways. Signaling Overview
 Cellular Signaling Pathways Signaling Overview Signaling steps Synthesis and release of signaling molecules (ligands) by the signaling cell. Transport of the signal to the target cell Detection of the
SUPPLEMENTARY DATA. Supplementary Table 2. Antibodies used for Immunofluoresence. Supplementary Table 3. Real-time PCR primer sequences.
 Supplementary Table 2. Antibodies used for Immunofluoresence. Antibody Dilution Source Goat anti-pdx1 1:100 R&D Systems Rabbit anti-hnf6 1:100 Santa Cruz Biotechnology Mouse anti-nkx6.1 1:200 Developmental
Phospho-AKT Sampler Kit
 Phospho-AKT Sampler Kit E 0 5 1 0 0 3 Kits Includes Cat. Quantity Application Reactivity Source Akt (Ab-473) Antibody E021054-1 50μg/50μl IHC, WB Human, Mouse, Rat Rabbit Akt (Phospho-Ser473) Antibody
Model Answer. M.Sc. Zoology (First Semester) Examination Paper LZT 103 (Endocrinology)
 Examination Paper LZT 103 (Endocrinology)") Model Answer M.Sc. Zoology (First Semester) Examination-2013 Paper LZT 103 (Endocrinology) Section A 1. (i) d (ii) b (iii) b (iv) c (v) c (vi) a (vii) c (viii) a (ix) d (x) b Section B Q.2 Answer Hormonal
Model Answer M.Sc. Zoology (First Semester) Examination-2013 Paper LZT 103 (Endocrinology) Section A 1. (i) d (ii) b (iii) b (iv) c (v) c (vi) a (vii) c (viii) a (ix) d (x) b Section B Q.2 Answer Hormonal
T cell maturation. T-cell Maturation. What allows T cell maturation?
 T-cell Maturation What allows T cell maturation? Direct contact with thymic epithelial cells Influence of thymic hormones Growth factors (cytokines, CSF) T cell maturation T cell progenitor DN DP SP 2ry
Principles of Genetics and Molecular Biology
 Cell signaling Dr. Diala Abu-Hassan, DDS, PhD School of Medicine Dr.abuhassand@gmail.com Principles of Genetics and Molecular Biology www.cs.montana.edu Modes of cell signaling Direct interaction of a
Signal Transduction: G-Protein Coupled Receptors
 Signal Transduction: G-Protein Coupled Receptors Federle, M. (2017). Lectures 4-5: Signal Transduction parts 1&2: nuclear receptors and GPCRs. Lecture presented at PHAR 423 Lecture in UIC College of Pharmacy,
Generating Mouse Models of Pancreatic Cancer
 Generating Mouse Models of Pancreatic Cancer Aom Isbell http://www2.massgeneral.org/cancerresourceroom/types/gi/index.asp Spring/Summer 1, 2012 Alexandros Tzatsos, MD PhD Bardeesy Lab: Goals and Objectives
BIOL 4374/BCHS 4313 Cell Biology Exam #1 February 13, 2001
 BIOL 4374/BCHS 4313 Cell Biology Exam #1 February 13, 2001 SS# Name This exam is worth a total of 100 points. The number of points each question is worth is shown in parentheses. Good luck! 1. (2) The
Summary and Concluding Remarks
 Summary and Concluding Remarks Chapter 6 The intestinal epithelium provides an excellent model system for investigating molecular mechanisms regulating cell lineage establishment, stem cell proliferation,
Introduction to Genetics
 Introduction to Genetics Table of contents Chromosome DNA Protein synthesis Mutation Genetic disorder Relationship between genes and cancer Genetic testing Technical concern 2 All living organisms consist
Impact of transcription factor 7-like 2 (TCF7L2) on pancreatic islet function and morphology in mice and men.
 on pancreatic islet function and morphology in mice and men.") Impact of transcription factor 7-like 2 (TCF7L2) on pancreatic islet function and morphology in mice and men. Renström, Erik Published in: Diabetologia DOI: 10.1007/s00125-012-2659-1 Published: 2012-01-01
Impact of transcription factor 7-like 2 (TCF7L2) on pancreatic islet function and morphology in mice and men. Renström, Erik Published in: Diabetologia DOI: 10.1007/s00125-012-2659-1 Published: 2012-01-01
Journal Club. 03/04/2012 Lama Nazzal
 Journal Club 03/04/2012 Lama Nazzal NOTCH and the kidneys Is an evolutionarily conserved cell cell communication mechanism. Is a regulator of cell specification, differentiation, and tissue patterning.
Revision. camp pathway
 االله الرحمن الرحيم بسم Revision camp pathway camp pathway Revision camp pathway Adenylate cyclase Adenylate Cyclase enzyme Adenylate cyclase catalyses the formation of camp from ATP. Stimulation or inhibition
METABOLIC REGULATION: THE ROLE OF INSULIN/GLUCAGON IN DIABETES
 METABOLIC REGULATION: THE ROLE OF INSULIN/GLUCAGON IN DIABETES Helena Caria Biomedical Sciences Department, School of Health, Polytechnic Institute of Setubal helena.caria@ess.ips.pt 8/12/2016 Glucose
GENETICS Can we Really Blame it all on Our Genes?
 GENETICS Can we Really Blame it all on Our Genes? Lecture 3: Understanding the Genetics of some Common Diseases and Disorders Thursday, May 12th, 2016 Medical Sciences Building 150 Jane Gair, Ph. D. Upcoming
What would you observe if you fused a G1 cell with a S cell? A. Mitotic and pulverized chromosomes. B. Mitotic and compact G1 chromosomes.
 What would you observe if you fused a G1 cell with a S cell? A. Mitotic and pulverized chromosomes. B. Mitotic and compact G1 chromosomes. C. Mostly non-compact G1 chromosomes. D. Compact G1 and G2 chromosomes.
Molecular biology :- Cancer genetics lecture 11
 Molecular biology :- Cancer genetics lecture 11 -We have talked about 2 group of genes that is involved in cellular transformation : proto-oncogenes and tumour suppressor genes, and it isn t enough to
BIOLOGY. Cell Communication CAMPBELL. Reece Urry Cain Wasserman Minorsky Jackson. Lecture Presentation by Nicole Tunbridge and Kathleen Fitzpatrick
 CAMPBELL BIOLOGY TENTH EDITION Reece Urry Cain Wasserman Minorsky Jackson 11 Cell Communication Lecture Presentation by Nicole Tunbridge and Kathleen Fitzpatrick Cellular Messaging Cells can signal to
Type 1 Diabetes 2/23/2015. Endocrine System Hormones. Living with Type 1 Diabetes
 Endocrine System Hormones 2007-2008 Living with Type 1 Diabetes Type 1 Diabetes results from the autoimmune destruction of the insulin- producing beta-cells in the pancreas. The lack of insulin leads to
G-Protein Signaling. Introduction to intracellular signaling. Dr. SARRAY Sameh, Ph.D
 G-Protein Signaling Introduction to intracellular signaling Dr. SARRAY Sameh, Ph.D Cell signaling Cells communicate via extracellular signaling molecules (Hormones, growth factors and neurotransmitters
Lecture: CHAPTER 13 Signal Transduction Pathways
 Lecture: 10 17 2016 CHAPTER 13 Signal Transduction Pathways Chapter 13 Outline Signal transduction cascades have many components in common: 1. Release of a primary message as a response to a physiological
The Endocrine Pancreas *
 OpenStax-CNX module: m47773 1 The Endocrine Pancreas * Steven Telleen Based on The Endocrine Pancreas by OpenStax This work is produced by OpenStax-CNX and licensed under the Creative Commons Attribution
GENERAL CHARACTERISTICS OF THE ENDOCRINE SYSTEM FIGURE 17.1
 GENERAL CHARACTERISTICS OF THE ENDOCRINE SYSTEM FIGURE 17.1 1. The endocrine system consists of glands that secrete chemical signals, called hormones, into the blood. In addition, other organs and cells
Hepatogenesis I Liver development
 Hepatogenesis I Liver development HB 308 George Yeoh Room 2.59 MCS Building yeoh@cyllene.uwa.edu.au Topics Early liver development Tissue interaction - role of morphogens and cytokines Liver enriched transcription
Hormonal regulation of. Physiology Department Medical School, University of Sumatera Utara
 Hormonal regulation of nutrient metabolism Physiology Department Medical School, University of Sumatera Utara Homeostasis & Controls Successful compensation Homeostasis reestablished Failure to compensate
By the name of Allah
 By the name of Allah Receptors function and signal transduction ( Hormones and receptors Types) We were talking about receptors of the neurotransmitters; we have 2 types of receptors: 1- Ionotropic receptors
T-cell activation T cells migrate to secondary lymphoid tissues where they interact with antigen, antigen-presenting cells, and other lymphocytes:
 Interactions between innate immunity & adaptive immunity What happens to T cells after they leave the thymus? Naïve T cells exit the thymus and enter the bloodstream. If they remain in the bloodstream,
Making Mature Human Islet Cells from Stem Cells to Model Disease and Treat Diabetes
 University of British Columbia Departments of Surgery and Cellular & Physiological Sciences Making Mature Human Islet Cells from Stem Cells to Model Disease and Treat Diabetes 2016 International Conference
Sarah Jaar Marah Al-Darawsheh
 22 Sarah Jaar Marah Al-Darawsheh Faisal Mohammad Receptors can be membrane proteins (for water-soluble hormones/ligands) or intracellular (found in the cytosol or nucleus and bind to DNA, for lipid-soluble
Figure legends Supplemental Fig.1. Glucose-induced insulin secretion and insulin content of islets. Supplemental Fig. 2.
 Figure legends Supplemental Fig.. Glucose-induced insulin secretion and insulin content of islets. Insulin secretory responses to.,., and. mm glucose (A) (n = 7-), and the insulin content in the islets
Cell Communication and Cell Signaling
 Cell Communication and Cell Signaling Why is cell signaling important? Why is cell signaling important? Allows cells to communicate and coordinate functions/activities of the organism Usually involves
Asma Karameh Omar Sami
 5 Asma Karameh Omar Sami Mohammad khatatbeh Happy day friends! This lecture will be discussing what we have said in the previous lectures relating to different mechanisms of transport across a biological
T cell development October 28, Dan Stetson
 T cell development October 28, 2016 Dan Stetson stetson@uw.edu 441 Lecture #13 Slide 1 of 29 Three lectures on T cells (Chapters 8, 9) Part 1 (Today): T cell development in the thymus Chapter 8, pages
Wnt signaling. Ramray Bhat.
 Wnt signaling Ramray Bhat ramray@mrdg.iisc.ernet.in Starting with animal biology and viral infections The discovery of certain laboratory murine strains that were highly susceptible to mammary gland cancer.
b Cells led astray by transcription factors and the company they keep
 b Cells led astray by transcription factors and the company they keep Peter Thompson, Anil Bhushan J Clin Invest. 2017;127(1):94-97. https://doi.org/10.1172/jci91304. Commentary Pancreatic b cells have
Cell Injury MECHANISMS OF CELL INJURY
 Cell Injury MECHANISMS OF CELL INJURY The cellular response to injurious stimuli depends on the following factors: Type of injury, Its duration, and Its severity. Thus, low doses of toxins or a brief duration
Enzyme-coupled Receptors. Cell-surface receptors 1. Ion-channel-coupled receptors 2. G-protein-coupled receptors 3. Enzyme-coupled receptors
 Enzyme-coupled Receptors Cell-surface receptors 1. Ion-channel-coupled receptors 2. G-protein-coupled receptors 3. Enzyme-coupled receptors Cell-surface receptors allow a flow of ions across the plasma
A Central Role of MG53 in Metabolic Syndrome. and Type-2 Diabetes
 A Central Role of MG53 in Metabolic Syndrome and Type-2 Diabetes Yan Zhang, Chunmei Cao, Rui-Ping Xiao Institute of Molecular Medicine (IMM) Peking University, Beijing, China Accelerated Aging in China
VIII Curso Internacional del PIRRECV. Some molecular mechanisms of cancer
 VIII Curso Internacional del PIRRECV Some molecular mechanisms of cancer Laboratorio de Comunicaciones Celulares, Centro FONDAP Estudios Moleculares de la Celula (CEMC), ICBM, Facultad de Medicina, Universidad
Final Review Sessions. 3/16 (FRI) 126 Wellman (4-6 6 pm) 3/19 (MON) 1309 Surge 3 (4-6 6 pm) Office Hours
 126 Wellman (4-6 6 pm) 3/19 (MON) 1309 Surge 3 (4-6 6 pm) Office Hours") Final Review Sessions 3/16 (FRI) 126 Wellman (4-6 6 pm) 3/19 (MON) 1309 Surge 3 (4-6 6 pm) Office ours 3/14 (WED) 9:30 11:30 am (Rebecca) 3/16 (FRI) 9-11 am (Abel) Final ESSENTIALS Posted Lecture 20 ormonal
Final Review Sessions 3/16 (FRI) 126 Wellman (4-6 6 pm) 3/19 (MON) 1309 Surge 3 (4-6 6 pm) Office ours 3/14 (WED) 9:30 11:30 am (Rebecca) 3/16 (FRI) 9-11 am (Abel) Final ESSENTIALS Posted Lecture 20 ormonal
Signaling Vascular Morphogenesis and Maintenance
 Signaling Vascular Morphogenesis and Maintenance Douglas Hanahan Science 277: 48-50, in Perspectives (1997) Blood vessels are constructed by two processes: vasculogenesis, whereby a primitive vascular
The Endocrine System 2
 The Endocrine System 2 Continuing on from the previous instalment, we will now look at the adrenal glands, the pancreas and the gonads as parts of the endocrine system. Adrenal Glands The adrenal glands
Hypertrophy of cardiac muscle in the left ventricular chamber.
 The increase in the size of cells and consequently in the size of the affected organ. caused by specific hormone stimulation or by increased functional demand. ü ü Pregnancy: an adaptive response muscular
Cell Biology Lecture 9 Notes Basic Principles of cell signaling and GPCR system
 Cell Biology Lecture 9 Notes Basic Principles of cell signaling and GPCR system Basic Elements of cell signaling: Signal or signaling molecule (ligand, first messenger) o Small molecules (epinephrine,
Ayman Mesleh & Leen Alnemrawi. Bayan Abusheikha. Faisal
 24 Ayman Mesleh & Leen Alnemrawi Bayan Abusheikha Faisal We were talking last time about receptors for lipid soluble hormones.the general mechanism of receptors for lipid soluble hormones: 1. Receptors
Vets 111/Biov 111 Cell Signalling-2. Secondary messengers the cyclic AMP intracellular signalling system
 Vets 111/Biov 111 Cell Signalling-2 Secondary messengers the cyclic AMP intracellular signalling system The classical secondary messenger model of intracellular signalling A cell surface receptor binds
Cell morphology. Cell organelles structure and function. Chapter 1: UNIT 1. Dr. Charushila Rukadikar
 UNIT 1 Cell morphology Cell organelles structure and function Chapter 1: Dr. Charushila Rukadikar Assistant Professor Department Of Physiology ZMCH, Dahod Physiology The science that is concerned with
MECHANISM AND MODE OF HORMONE ACTION. Some definitions. Receptor: Properties of receptors. PRESENTED BY MBUNKUR GLORY NKOSI.
 MECHANISM AND MODE OF HORMONE ACTION. PRESENTED BY MBUNKUR GLORY NKOSI. OUTLINE. Introduction Some definitions Hormone secretion, transport, and clearance from the blood. Feedback control of hormone secretion.
Stem Cells and The Endometrium. Director, Division of Reproductive Endocrinology and infertility
 Stem Cells and The Endometrium Hugh S. Taylor, M.D. Director, Division of Reproductive Endocrinology and infertility Nothing to disclose Stem Cells Cells that are capable of both self-renewal and have
The Endocrine Pancreas (Chapter 10) *
 *") OpenStax-CNX module: m62118 1 The Endocrine Pancreas (Chapter 10) * Ildar Yakhin Based on The Endocrine Pancreas by OpenStax This work is produced by OpenStax-CNX and licensed under the Creative Commons
OpenStax-CNX module: m62118 1 The Endocrine Pancreas (Chapter 10) * Ildar Yakhin Based on The Endocrine Pancreas by OpenStax This work is produced by OpenStax-CNX and licensed under the Creative Commons