Prediction of the Effects of Renal Impairment on the Clearance for Organic Cation Drugs that. undergo Renal Secretion: A Simulation-Based Study
|
|
|
- Noah Newton
- 5 years ago
- Views:
Transcription
1 DMD Fast Forward. Published on February 28, 2018 as DOI: /dmd This article has not been copyedited and formatted. The final version may differ from this version. Prediction of the Effects of Renal Impairment on the Clearance for Organic Cation Drugs that undergo Renal Secretion: A Simulation-Based Study Kristin E. Follman and Marilyn E. Morris Department of Pharmaceutical Sciences, School of Pharmacy and Pharmaceutical Sciences, University at Buffalo, State University of New York, Buffalo, New York (KEF and MEM) Downloaded from dmd.aspetjournals.org at ASPET Journals on October 13,
2 DMD Fast Forward. Published on February 28, 2018 as DOI: /dmd This article has not been copyedited and formatted. The final version may differ from this version. Running Title: Effects of RI on renal secretion of OCT substrates Corresponding author: Dr. Marilyn E. Morris, Department of Pharmaceutical Sciences, School of Pharmacy and Pharmaceutical Sciences, University at Buffalo, The State University of New York, Buffalo, NY 14214, USA; Phone: ; Fax: ; Number of text pages: 21 Number of tables: 2 Number of figures: 10 Number of references: 39 Abstract: 250 words Introduction: 748 words Discussion: 1500 words Downloaded from dmd.aspetjournals.org at ASPET Journals on October 13, 2018 Non-standard abbreviations RI: renal impairment; RF: renal function; CL R : renal clearance; MM: Michaelis-Menten; TDI: toxin drug interaction; DT: drug transporter; DME: drug metabolizing enzyme; GFR: glomerular filtration rate; PK: pharmacokinetics; PBPK: physiologically based pharmacokinetic model 2
3 DMD Fast Forward. Published on February 28, 2018 as DOI: /dmd This article has not been copyedited and formatted. The final version may differ from this version. Abstract: Renal Impairment (RI) is a major health concern with a growing prevalence. RI leads to various physiological changes, in addition to a decrease in GFR, that impact the pharmacokinetics (PK) and specifically the renal clearance (CL R ) of compounds, including alterations of drug transporter (DT)/drug metabolizing enzyme expression and activity, as well as protein binding. The objectives of this study were to utilize the physiologically based pharmacokinetic (PBPK) modeling platform, Simcyp to (1) assess the impact of alterations in DT expression, toxin-drug interactions (TDIs) and free fraction (f u ) on PK predictions for the OCT2/MATE1 substrate, metformin, in RI populations, and (2) utilize available in vitro data to improve predictions of Cl R for two actively secreted substrates, metformin and ranitidine. The goal was to identify changes in parameters other than glomerular filtration rate, namely f u, and DT expression/activity, that are consistent with in vitro and clinical data in RI, and predict the importance of these parameters on the PK of metformin and ranitidine in RI patients. Our results demonstrated that including alterations in DT expression and f u, and including TDIs affecting DT activity, as indicated by in vitro data, improved the simulated predictions of CL R and other PK parameters for both metformin and ranitidine in RI. Our simulations suggest that modifications of DT expression/activity and f u are necessary for improved predictions of CL R in RI for compounds that are actively secreted, and that improvement of PK predictions in RI populations for metformin and ranitidine can be obtained by incorporating in vitro data. Downloaded from dmd.aspetjournals.org at ASPET Journals on October 13,
4 DMD Fast Forward. Published on February 28, 2018 as DOI: /dmd This article has not been copyedited and formatted. The final version may differ from this version. Introduction: Renal impairment (RI) is a major health concern; the current prevalence of RI is 13.2% with a projected prevalence in 2030 of 16.7% in the United States alone (Hoerger et al., 2015). RI accompanies many other disease states including nephritis, glomerulonephritis, Type 2 diabetes and auto-immune diseases, such as lupus erythematosus (National Kidney Foundation, 2014). Since renal clearance (CL R ) is a major route of elimination for many drugs, kidney function is a relevant factor in the pharmacokinetics (PK) of these compounds. The FDA currently recommends clinical trials be conducted in RI populations for drugs where 30% or more of the drug is eliminated renally (FDA, 2010). Further characterization of the impact of RI on the PK of drugs is desirable because it may improve the accuracy of predictions for PK in RI populations. RI is characterized by a decrease in the glomerular filtration rate (GFR), with decreasing estimates of GFR leading to more severe classes of RI (Inker et al., 2014). However, many other changes have been reported to occur in RI that are relevant to the clearance and distribution of drugs, including changes in drug transporter (DT) and drug metabolizing enzyme expression, as well as changes in protein binding (Keller et al., 1984; Vanholder et al., 1988; Dreisbach and Lertora, 2008; Nolin et al., 2008; Naud et al., 2011). In addition to these changes, some compounds are known to accumulate to toxic concentrations in RI, and some of these compounds have been shown to inhibit the activity of major DTs including members of the SLC and ABC families (Nigam et al., 2015; Katsube et al., 2017). One such compound, creatinine, has been Downloaded from dmd.aspetjournals.org at ASPET Journals on October 13, 2018 shown to specifically inhibit transport via Organic Cation Transporter 2 (OCT2), a major secretory transporter located on the basolateral membrane in the kidney proximal tubule (Ciarimboli et al., 2012; Sauzay et al., 2016). The presence of elevated levels of uremic toxins introduces the possibility of toxin-drug interactions (TDIs), resulting in altered drug clearance. The impact of RI on PK is of particular interest for drugs that are actively secreted in the kidney, such as metformin, an antidiabetic drug, and ranitidine, an H 2 -receptor antagonist (Roberts, 1984; Gusler et al., 2001). Both metformin and ranitidine are actively transported from 4
5 DMD Fast Forward. Published on February 28, 2018 as DOI: /dmd This article has not been copyedited and formatted. The final version may differ from this version. the blood to the proximal tubule via OCT2, and subsequently out of the proximal tubule cell into the kidney lumen via multidrug and toxin extrusion protein 1 (MATE1) (Neuhoff, 2013; Hacker et al., 2015; Burt et al., 2016). OCT2 substrates are of particular interest as the FDA recommends testing drugs that are actively secreted in the kidney to determine if they are substrates for OCT2. (FDA, 2012). Metformin and ranitidine are well characterized in RI populations making them attractive model substrates for this study (Tucker et al., 1981; Zech et al., 1983; Roberts, 1984; Garg et al., 1986; Dixon et al., 1994; Sambol et al., 1995; Koch et al., 1997). It is currently difficult to predict potential changes in drug PK based on in vitro data and in vivo PK studies in normal volunteers. Using simulations based on metformin and ranitidine, which incorporate in vitro DT data as well as PK data in normal volunteers and RI patients, we can identify mechanisms that are important for the PK alteration in RI patients. This information will be important for further predictions for other OCT2/MATE1 substrates in assessing the potential changes in PK in RI. Physiologically based pharmacokinetic (PBPK) modeling has been increasingly utilized for prediction of PK in specialized populations (Rowland et al., 2015). The PBPK modeling platform Simcyp is useful for this approach, as it contains specialized populations, including those for RI. The advantage of PBPK platforms is they incorporate physiologically relevant information about specialized populations, including organ size and function and are able to incorporate additional information from in vitro studies. The objectives of this work were to utilize the physiologically based pharmacokinetic Downloaded from dmd.aspetjournals.org at ASPET Journals on October 13, 2018 modeling platform, Simcyp to (1) assess the impact of alterations in glomerular filtration rate (GFR), DT expression and free fraction (f u ), as well as toxin-drug interactions (TDIs), on PK predictions for metformin in RI populations, and (2) utilize available in vitro data to improve predictions of renal clearance (CL R ) for two OCT2/MATE1 substrates, metformin and ranitidine. Simulated data will be compared to observed clinical data for these drugs in RI. These studies will identify significant changes in protein binding, GFR, DT expression/activity that are consistent 5
6 DMD Fast Forward. Published on February 28, 2018 as DOI: /dmd This article has not been copyedited and formatted. The final version may differ from this version. with in vitro and clinical data, and predictive of the PK alterations of metformin and ranitidine in RI patients. Downloaded from dmd.aspetjournals.org at ASPET Journals on October 13,
7 DMD Fast Forward. Published on February 28, 2018 as DOI: /dmd This article has not been copyedited and formatted. The final version may differ from this version. Materials and Methods: Model for metformin in Simcyp : Simulations were performed in Simcyp V15.1 simulator (Cerata), using the SV-metformin (3-(diaminomethylidene)-1,1-dimethylguanidine) substrate file. This model was developed and validated previously by Burt et al. 2016, the PBPK model scheme is presented in Supplementary Figure 1 and parameter values are available in the previous publication (Burt et al., 2016). This file was modified with regards to MATE1/2-K (SLC47A) transport, since the compound file did not contain J max and K M for MATE1/2-K transport, only the CL int obtained from Ito et al. (Ito et al., 2012). Estimations for J max and K M were obtained from this same publication for MATE1, based on the Eadie-Hofstee plots for metformin transport in hmate1 transfected HEK293 cells (Ito et al., 2012). The data was normalized per microgram protein, and then transformed to per million cells (the units compatible with Simcyp ) using the conversion 0.93 mg protein/10 6 HEK293 cells (Burt et al., 2016). An estimate for J max was obtained from the y-intercept of digitized data (3245 pmol/min/10 6 cells) and the K M was obtained from the negative slope of the data (306.2 pmol/µl). The estimates were utilized for MATE transport in the kidney, with the assumption that MATE1 transport would be dominant, and therefore drive the apical transport of metformin. This assumption was tested by running simulations using the estimated J max /K M for metformin and MATE1, compared with using the provided CL int for metformin and MATE transport. The PK parameters agreed very well for both parametrizations; therefore, the estimated J max /K M for Downloaded from dmd.aspetjournals.org at ASPET Journals on October 13, 2018 MATE1 were utilized for all simulations (Supplementary Table 1). This was done to allow for the manipulation of J max /K M in order to incorporate changes in DT expression and activity. The determined J max /K M was scaled to human kidney transport through the same relative activity factor (RAF) determined by Burt et al. via fitting (Burt et al., 2016). A representation of metformin transport in the kidney is provided in Figure 1. Renal clearance is a result of several processes, including renal filtration (CL RF or f u GFR), renal secretion (CL RS ), and renal reabsorption (eq. 1). This study highlights the impact of 7
8 DMD Fast Forward. Published on February 28, 2018 as DOI: /dmd This article has not been copyedited and formatted. The final version may differ from this version. mechanistic modification of the renal secretion component of CL R for compounds that are actively secreted, such as metformin and ranitidine. 1 eq. 1 Dose Dependency of CL R : Simulations were performed utilizing both healthy and RI populations in Simcyp. Sim- Healthy Volunteers, Sim_RenalGFR_30-60 (moderate RI) and Sim_RenalGFR_less_30 (severe RI) populations were used to represent GFR of 100, 50 and 10%, respectively. Two sets of simulations were performed, in exclusively male and female populations, to determine if there was a gender specific effect of RI as well. The doses utilized were 500, 1250, and 2000 mg. Impact of DT Expression on CL R : In order to assess the impact of DT expression on the CL R of metformin in the presence and absence of RI, simulations were performed with varying DT expression in healthy and RI populations. The same populations (Healthy Volunteers, Sim_RenalGFR_30-60 and Sim_RenalGFR_less_30) were used to represent healthy, moderate and severe RI with an approximate GFR of 100, 50 and 10%, respectively. DT expression changes were incorporated in the model indirectly by altering transporter function via J max to reflect changes in protein expression (capacity). Both OCT2 and MATE1 were altered individually for each simulation by ±2- and ±5-fold. A single dose of 2000 mg metformin was administered in a fasted state. Simulations were performed separately in exclusively male and female populations, with each Downloaded from dmd.aspetjournals.org at ASPET Journals on October 13, 2018 simulation including 10 trials of 10 individuals. Impact of TDI on RI induced changes in CL R : TDIs were incorporated into the model in the form of inhibition through the manipulation of J max and K M. This was done with the parameter R, which is defined as the ratio of the concentration of the inhibitor (I), to its inhibition constant (K i ) (eq. 2). This parameter was used to include competitive, non-competitive and uncompetitive inhibition in the model via equations 3, 4 and 5, respectively. 8
9 DMD Fast Forward. Published on February 28, 2018 as DOI: /dmd This article has not been copyedited and formatted. The final version may differ from this version. eq. 2 eq. 3 eq. 4 eq. 5 R was varied from 0 to 100 to assess the impact of inhibition over a wide range of possible concentrations and potencies of inhibitors. Using this method, the degree of inhibition was constant throughout the simulation. This would be most relevant in the case of a TDI caused by a uremic toxin. Simulations were performed with varying R values (0, 1, 10 and 100) for OCT2 and MATE1 separately. This resulted in four simulations being run for each transporter in each of the three populations representing varying renal function (Sim-Healthy Volunteers, Sim_RenalGFR_30-60 and Sim_RenalGFR_less_30). This set of 24 simulations was repeated for each type of inhibition. All simulations were performed for a single oral dose of 2000 mg metformin administered in a fasted state, and simulations included 10 trials with 10 subjects in each. Simulations were performed separately for male and female populations. Impact of f u on RI induced changes in CL R with varying DT expression: Downloaded from dmd.aspetjournals.org at ASPET Journals on October 13, 2018 In order to assess the impact of potential changes in f u in RI populations, simulations were performed with metformin with varying degrees of f u, from 0 to 1. This was also assessed with varying degrees of DT (OCT2/MATE1) expression, in order to establish the potential relationship between these two factors. As with the TDI simulations, a single oral dose of 2000 mg metformin was administered in a fasted state, simulations included 10 trials with 10 subjects in each, and these were performed separately in male and female populations. Simulations were performed 9
10 DMD Fast Forward. Published on February 28, 2018 as DOI: /dmd This article has not been copyedited and formatted. The final version may differ from this version. for varying f u values (0.0, 0.1, ) for each population (Sim-Healthy Volunteers, Sim_RenalGFR_30-60 and Sim_RenalGFR_less_30), resulting in a set of 12 simulations. This set of simulations was repeated with varying DT expression, by changing the J max of OCT2/MATE1 together, ±2 and ±5 fold. Impact of f u on RI induced changes in CL R in the presence and absence of TDI: The impact of varying f u was also investigated in the presence of TDI. As with the previously described TDI studies, competitive, non-competitive and uncompetitive inhibition was incorporated via the parameter R, as described through equations 2-5. Simulations were performed with Sim-Healthy Volunteers, Sim_RenalGFR_30-60 and Sim_RenalGFR_less_30 populations to represent GFR of 100, 50 and 10%, respectively. Inhibition was incorporated into the simulations through manipulation of J max, K M and J max /K M, for each transporter separately. For each population, f u was varied (0, 0.1, 0.9 and 1.0) for each value of R (0, 1, 10, 100) tested, leading to a total of 48 simulations per transporter. A dose of 2000 mg metformin was administered in a fasted state to an exclusively male population; each simulation included 10 trials with 10 subjects in each. Simulations were not performed in a female population due to the observed similarity in trends and overall results between male and females. Assessment of Clinical Relevance of RI changes: In order to assess whether the potential additional changes in RI, beyond a decrease in GFR, were important to predictions of PK in RI populations, simulations were performed with the Downloaded from dmd.aspetjournals.org at ASPET Journals on October 13, 2018 available RI populations in Simcyp with additional changes supported by literature. Literature references of clinical data in healthy and RI populations were used for comparison for metformin and ranitidine ((E)-1-N'-[2-[[5-[(dimethylamino)methyl]furan-2-yl]methylsulfanyl]ethyl]-1-Nmethyl-2-nitroethene-1,1-diamine) (Sambol et al., 1995; Koch et al., 1997). For the clinical ranitidine reference, PK parameters from groups 2 and 3 were averaged to represent the moderate RI population. The same was done for groups 4 and 5 to represent the severe RI population. The observed area under the curve (AUC) for ranitidine was calculated as dose/total 10
11 DMD Fast Forward. Published on February 28, 2018 as DOI: /dmd This article has not been copyedited and formatted. The final version may differ from this version. clearance (CL), and the amount excreted into urine (A e ) was calculated as the ratio of CL R to CL multiplied by dose. A previously developed compound file for ranitidine was utilized for simulations of ranitidine PK (Neuhoff, 2013). Simulations included 5 trials with 5 subjects each. For metformin, the reference did not state the proportion of female subjects in the study, and therefore a reasonable proportion of 0.34 was chosen for these simulations (Sambol et al., 1995). For ranitidine, the reported proportion of females was used (0.17) (Koch et al., 1997). For both metformin and ranitidine simulations, age ranges were manipulated to match the reference. Relevant PK parameters were obtained from simulations and compared to observed values. Changes reported in literature relevant to metformin and ranitidine PK were then incorporated into the simulations and PK parameters were obtained for comparison. The relevant changes included a decrease in OCT2 expression to 20% of its original value for both metformin and ranitidine. This reduction in expression is based on protein expression data obtained in adenine-induced CRF rat kidneys (Komazawa et al., 2013). Changes in Organic Anion Transporter 3 (OAT3) were also included for ranitidine, as this transporter is also involved in the basolateral uptake of ranitidine in the kidney. OAT3 expression for ranitidine simulations was reduced to 10% of its original expression based on data from CRF rat kidneys (Komazawa et al., 2013). MATE1 expression was not reduced, as a transgenic mouse model of RI demonstrated no change in MATE1 mrna in RI (Pedersen et al., 2016). Organic cation Transporter 1 (OCT1) mediates metformin uptake into the liver (Burt et al., 2016). OCT1 expression was shown to Downloaded from dmd.aspetjournals.org at ASPET Journals on October 13, 2018 decrease to 10% of its original expression in adenine-induced CRF rat kidneys. While expression data was not available for OCT1 in the liver, simulations were performed to incorporate this reduction in OCT1 expression to investigate the impact of this transporter if hepatic and renal expression was affected in a similar manner by RI (Komazawa et al., 2013). Protein binding was not altered since both metformin and ranitidine are not extensively protein bound (Roberts, 1984; Burt et al., 2016). 11
12 DMD Fast Forward. Published on February 28, 2018 as DOI: /dmd This article has not been copyedited and formatted. The final version may differ from this version. Finally, TDI was included for OCT2, OAT3 and for organic anion transporting polypeptide 1B3 (OATP1B3), a hepatic uptake transporter for ranitidine. This was based on available literature reports on potency of uremic toxins and the concentrations of these toxins in RI populations. Acrolein, a polyamine breakdown product and uremic toxin, was identified to inhibit OCT transport in vitro with a K i of 93 ± 16 µm and demonstrating competitive or mixed-type inhibition (Schophuizen et al., 2013). The concentration of acrolein present in uremic populations has been reported to be mm (total) or 1.35 µm (free). Based on these values, the R ([I]/K i ) would be 1.7 for total acrolein. An IC 50 for creatinine inhibition of OCT2 has also been reported as 580 µm (Ciarimboli et al., 2012). The unbound concentration of creatinine in uremic patients is 1200 µm, and if IC 50 is substituted for K i, this would lead to an approximation of R of 2.0 (Hsueh et al., 2016). Therefore, competitive inhibition with an R of 2 was incorporated into the simulations as a potential TDI for OCT2. For OAT3, several IC 50 values have been identified for various uremic toxins, including creatinine (Hsueh et al., 2016). When compared with the concentrations of these toxins in uremic patients, the approximations of R over 1 were 1.3, 2.7 and 7.1 (Hsueh et al., 2016). For simplicity, competitive inhibition with an average R of 4 was incorporated into simulations as potential TDIs for OAT3. For hepatic uptake via OATP1B3, indoxyl sulfate has been demonstrated to inhibit methotrexate uptake in OATP1B3 expressing HEK293 cells (Sato et al., 2014). Sato et al. reported that indoxyl sulfate inhibited 40% of methotrexate transport at a concentration of 1000 Downloaded from dmd.aspetjournals.org at ASPET Journals on October 13, 2018 µm (Sato et al., 2014). Since indoxyl sulfate has been reported to reach plasma concentrations as high as 940 µm, and if 1000 µm is approximated as the IC 50 (this is the IC 50 for the inhibition of methotrexate transport via OATP1B3 by indoxyl sulfate), this would lead to a possible approximation of R of 1 in RI populations (Vanholder et al., 2003; Sato et al., 2014). For this reason, competitive inhibition (R of 1) of ranitidine OATP1B3 hepatic uptake was investigated in this study. Other uremic toxins may be present in plasma concentrations that are greater than 12
13 DMD Fast Forward. Published on February 28, 2018 as DOI: /dmd This article has not been copyedited and formatted. The final version may differ from this version. their IC 50 or K i values, resulting in potential TDIs. This study was intentionally limited to potential changes for which there is supporting literature. For metformin, the parameters assessed for improvement of prediction were time of maximal concentration (t max ), maximal concentration (C max ), AUC, CL R, and A e. For ranitidine, the parameters assessed for improvement of prediction were AUC, CL, CL R and A e. Improvement of prediction was based on the predicted/observed ratio for the mean parameter value. The absolute value of the difference between this ratio and 1 was determined (eq. 6) for each simulation, and is termed δ. This was computed for each parameter for each simulation, when δ was less than the value obtained with the base RI populations in Simcyp (Sim_RenalGFR_30-60 and Sim_RenalGFR_less_30), there was considered to be an improvement in the prediction of that parameter. As δ approaches 0, the predicted value approaches the observed value. δ = 1 eq. 6 In order to assess the improvement in the overall prediction for a specific simulation, the δ for each parameter was summed and compared to the sum for the base RI populations. When the sum of δ for all parameters (Σδ all ) was less than that of Σδ all for the base RI population, this was considered to be an improvement in the overall prediction. This was also assessed separately for the renal clearance parameters, Cl R and A e, as the sum of δ for CL R and A e alone, and is termed Σδ R. When the Σδ R for a particular simulation was less than Σδ R for the base RI population, this was considered to be an improvement in the prediction of renal clearance, Downloaded from dmd.aspetjournals.org at ASPET Journals on October 13, 2018 specifically. The results as discussed in terms of which conditions led to an improvement for each parameter, which conditions led to the three lowest Σδ all, and which led to the lowest Σδ R. Results: Dose Dependency of CL R : The CL R of metformin did not exhibit dose-dependency. CL R decreased as RI increased (i.e. GFR was decreased). There was an approximate 1.8-fold reduction in CL R when the severe 13
14 DMD Fast Forward. Published on February 28, 2018 as DOI: /dmd This article has not been copyedited and formatted. The final version may differ from this version. RI population was used as opposed to the healthy population, regardless of dose (Fig. 2, Supplementary Table 2). While values for CL R were slightly lower for females than males, the trend of the impact of RI, as well as the magnitude of the impact of changes, remained consistent for both sexes. Figures and tables regarding the results in females are provided for completeness in the supplementary information for all evaluations (Supplementary Fig. 5-8, Supplementary Tables 30-38). Impact of DT Expression on CL R : CL R increased as DT expression increased and decreased as DT expression decreased (Fig. 3, Supplementary Table 3). In a healthy population, when DT expression was increased 5- fold, CL R was increased 1.6-fold (Fig. 3, Supplementary Table 3). The impact of altering DT expression increased as renal function decreased. For a severe RI population, when DT expression was increased 5-fold, Cl R was increased 2.2-fold (Fig. 3, Supplementary Table 3). When DT expression was decreased 5-fold in a healthy and severe RI population respectively, CL R decreased 2.1- and 2.9-fold (Fig. 3, Supplementary Table 3). Impact of TDI on CL R : The impact of all types of inhibition on the CL R of metformin was greater for OCT2 than for MATE1, the results for non-competitive inhibition are shown in Figure 4. Competitive and noncompetitive inhibition yielded almost identical results for OCT2 inhibition, with maximum inhibition tested (R of 100) resulting in 4-, 6- and 9-fold reductions in CL R for healthy, moderate and severe Downloaded from dmd.aspetjournals.org at ASPET Journals on October 13, 2018 RI populations, respectively (Fig. 4A and Supplementary Fig. 2A, Supplementary Table 4 and 5). OCT2 uncompetitive inhibition had slightly greater effects, compared to competitive and noncompetitive inhibition, with 4, 7 and 11 fold reductions in CL R for healthy, moderate and severe RI populations, respectively (Supplementary Fig. 2B, Supplementary Table 6). Competitive inhibition of MATE1 resulted in no change in CL R, or any other PK parameter (Supplementary Fig. 2C, Supplementary Table 4). Non-competitive inhibition had a slight effect, leading to 1.2-, 1.6- and 2-fold reductions in CL R for healthy, moderate and severe RI populations, 14
15 DMD Fast Forward. Published on February 28, 2018 as DOI: /dmd This article has not been copyedited and formatted. The final version may differ from this version. respectively (Fig. 4B, Supplementary Table 5). As with OCT2, the effects of uncompetitive inhibition were slightly greater than those of non-competitive inhibition, with reductions in CL R of 1.4-, 1.8- and 2.2-fold for healthy, moderate and severe RI populations (Supplementary Fig. 2D, Supplementary Table 6). Impact of f u on RI induced changes in CL R with varying DT expression: When f u was increased from 0.1 to 1 in a healthy population, CL R of metformin increased 5.6-fold (Fig. 5A, Supplementary Table 7). The effect of increasing f u was slightly more pronounced as renal function decreased, with the moderate and severe RI populations resulting in 5.8- and 5.9-fold increasing in CL R for the same change in f u (Fig.5A, Supplementary Table 7). When DT expression was increased, the effect of f u on CL R was minimized. When DT expression was increased 5-fold and f u was increased from 0.1 to 1.0, CL R increased 2.7-, 3.0- and 3.3-fold for healthy, moderate and severe RI populations, respectively (Fig. 5C, Supplementary Table 8). Again, as renal function decreased, f u had a greater effect on CL R. When DT expression was decreased 5-fold, the effect of f u on CL R was magnified; for all degrees of RI, CL R was increased an average of 8-fold when f u was increased from 0.1 to 1.0 (Fig. 5E, Supplementary Table 9). When DT expression was decreased, unlike normal and increased expression, the effect of f u decreased slightly as renal function decreased. CL R increased 8.5-fold for the healthy population when f u increased from 0.1 to 1.0, but increases were slightly less (8.2- and 7.7-fold) for moderate and severe RI populations, respectively (Fig. 5E, Downloaded from dmd.aspetjournals.org at ASPET Journals on October 13, 2018 Supplementary Table 9). Similar effects were observed when DT expression was altered ±2-fold (Fig. 5B and 5D, Supplementary Tables 10 and 11). Impact of f u on RI induced changes in CL R in the presence and absence of TDI: For both OCT2 and MATE1, the greatest reduction in CL R was observed with uncompetitive inhibition and when f u was minimal (Figs. 6 and 7, Supplementary Tables 12-17). As f u was increased, with the same degree of inhibition (R), the impact of inhibition of CL R was minimized. When f u was minimal (0.1), maximal uncompetitive inhibition of OCT2 (R of 100) led 15
16 DMD Fast Forward. Published on February 28, 2018 as DOI: /dmd This article has not been copyedited and formatted. The final version may differ from this version. to a reduction in CL R of metformin of 7-, 10-, and 15-fold for healthy, moderate and severe RI populations (Fig. 6, Supplementary Tables 12-14). For the same degree of inhibition and renal impairment when f u was increased to its maximal value (1.0), CL R was reduced 4-, 7-, and 11- fold. For uncompetitive inhibition of MATE1, the reduction in CL R for healthy, moderate and severe RI populations was 5.5-, 6.9- and 7.7-fold when f u was minimal (0.1), and 1.4-, 1.7- and 2.1-fold when f u was maximal (1.0) (Fig. 7, Supplementary Tables 15-17). Competitive and non-competitive inhibition yielded very similar results, and the trend with regards to f u was the same as uncompetitive inhibition. When f u was minimal (0.1), maximal competitive and non-competitive inhibition of OCT2 (R of 100) led to a 7-, 9- and 13-fold reduction in CL R for healthy, moderate and severe RI populations, respectively (Supplementary Fig. 3, Supplementary Tables 18-23). For the same type and degree of inhibition, and degree of renal impairment, CL R was reduced 4-, 6-, and 9-fold when f u was maximal (1.0). For MATE1, competitive inhibition did not impact CL R, regardless of changes in f u (Supplementary Fig. 4A-C, Supplementary Tables 24-26). For non-competitive and uncompetitive inhibition of MATE1, the same trend was observed where an increase in f u minimized the effect of inhibition on CL R (Fig. 7 and Supplementary Fig. 4D-F). Again, this effect was much more pronounced for uncompetitive inhibition than non-competitive inhibition. For noncompetitive inhibition of MATE1, the reduction in CL R for healthy, moderate and severe RI populations was 1.4-, 1.7- and 2.2-fold when f u was minimal (0.1), and 1.2-, 1.5- and 1.9-fold when Downloaded from dmd.aspetjournals.org at ASPET Journals on October 13, 2018 f u was maximal (1.0) (Supplementary Fig. 4D-F, Supplementary Tables 27-29). Assessment of Clinical Relevance of RI changes: For metformin, δ was lower for the majority of simulations that included additional changes in RI with respect to OCT2 and OCT1 expression and function compared to the simulations for the base RI populations (Table 1 and Supplementary Table 39). The parameter for which there was the least improvement was A e ; this was true for both moderate and severe RI, but was more pronounced with severe RI (Table 1 and Supplementary Table 39). This was due to the base 16
17 DMD Fast Forward. Published on February 28, 2018 as DOI: /dmd This article has not been copyedited and formatted. The final version may differ from this version. severe RI population producing an accurate prediction of A e with a δ of only (Table 1). For both RI populations, inclusion of a modification in OCT2 transport resulted in the best overall prediction and prediction of renal clearance parameters (lowest Σδ all and Σδ R, respectively). For moderate RI, the inclusion of a reduction in OCT2 expression to 20% of its original value resulted in the best predictions (4- and 10-fold reduction for Σδ all and Σδ R, respectively), while inclusion of inhibition of OCT2 (R of 2), not an expression change, resulted in the best prediction for severe RI (3- and 6-fold reduction for Σδ all and Σδ R, respectively) (Table 1). The improvement in prediction of observed clinical data is presented in Figure 8, where the prediction by the base Simcyp RI population is plotted for both moderate and severe RI (Fig. 8A and 8C). The most improved simulation, determined by the most improvement in parameter predictions given in Table 1, are plotted for moderate and severe RI (Fig. 8B and 8D). While the observed data is not completely predicted, most notably there is an under-prediction of later time points for all simulations, the inclusion of expression changes and inhibition of OCT2 does lead to an improvement of prediction for both RI populations. For ranitidine, inclusion of expression and activity changes for OCT2, OCT1 and OATP1B3 did result in some degree of improvement for both populations (Table 2 and Supplementary Table 40). More improvement was observed for the severe RI population; δ was lower for the majority of simulations for severe RI populations when compared to the δ for the base RI population provided in Simcyp. Fewer improvements were observed for the moderate Downloaded from dmd.aspetjournals.org at ASPET Journals on October 13, 2018 RI populations, as the base moderate RI population provided reasonably accurate estimates for the PK parameters. The greatest improvements for the moderate RI population were observed in the CL R and A e parameters for ranitidine, (Table 2 and Supplementary Table 40). As with metformin, modification of the expression and activity of OCT2 led to the greatest improvements in CL R and A e for ranitidine. The greatest improvement was seen with the inclusion of inhibition of OCT2 (R of 2), with a Σδ R of 0.142, followed by a decrease in the expression of OCT2 to 20% of its original value with a Σδ R of (Table 2). These two conditions led to a decrease in Σδ R 17
18 DMD Fast Forward. Published on February 28, 2018 as DOI: /dmd This article has not been copyedited and formatted. The final version may differ from this version. of over 4- and 3-fold when compared to the Σδ R for the base moderate RI population, respectively (Table 2). The greatest improvement in overall prediction of the PK parameters was observed with modification of OAT3, not OCT2. When OAT3 expression was reduced to 10% of its original value and inhibition was included (R of 4), the lowest value for Σδ all was achieved. This set of conditions also led to a similar improvement in Σδ R as was achieved with reduction of OCT2 expression, with a Σδ R of (Table 2). For the severe RI population, nearly every simulation which included expression and activity changes for OCT2, OCT1 and OATP1B3 resulted in a reduction in δ for every parameter when compared to the base severe RI population δ (Table 2 and Supplementary Table 40). The conditions that improved the Σδ all and Σδ R were mainly identical between the two doses tested (50 and 25 mg). The lowest values for Σδ all and Σδ R were achieved when the expression and activity of both OCT2 and OAT3 were reduced. Expression was reduced to 20 and 10% respectively, for OCT2 and OAT3, and inhibition was included for both transporters with an R of 2 and 4, respectively. When these changes were included, Σδ all and Σδ R were both reduced by approximately 30- and 5-fold for the 50 and 25 mg dose, respectively when compared to Σδ all and Σδ R for the predictions obtained from the base severe RI population in Simcyp (Table 2). The next most accurate simulation was obtained with the same conditions, with the removal of the inhibition of OAT3. For this simulation, Σδ all and Σδ R were both reduced by approximately 21- and 4- fold for the 50 and 25 mg dose, respectively when compared to Σδ all and Σδ R for the predictions Downloaded from dmd.aspetjournals.org at ASPET Journals on October 13, 2018 obtained from the base severe RI population in Simcyp (Table 2). The most improved predictions are depicted in Figure 9 for ranitidine. The base RI populations for moderate and severe RI provide a reasonable prediction of the ranitidine plasma profile; however, inclusion of additional conditions in RI did lead to an improvement in prediction for both RI populations. The predictions given by the Simcyp moderate and severe RI populations are given in Figure 9A and 9C, respectively. The most improved simulation, as indicated in Table 2, is plotted for moderate RI and includes a reduction in OAT3 expression to 10% of normal, and competitive inhibition of OAT3 18
19 DMD Fast Forward. Published on February 28, 2018 as DOI: /dmd This article has not been copyedited and formatted. The final version may differ from this version. with an R of 4 (Fig. 9B). For severe RI, the most improved simulation included the same modification of OAT3 as with moderate RI (10% and R4 OAT3), along with a reduction in OCT2 expression (20% of normal) and competitive inhibition of OCT2 (R of 2) (Fig. 9D). Downloaded from dmd.aspetjournals.org at ASPET Journals on October 13,
20 DMD Fast Forward. Published on February 28, 2018 as DOI: /dmd This article has not been copyedited and formatted. The final version may differ from this version. Discussion: RI is a major and growing health concern worldwide which can occur alone, or can accompany a number of disease states (National Kidney Foundation, 2014; Hoerger et al., 2015). While a decrease in GFR characterizes this disease state, numerous other changes can occur within RI that have the potential to alter the PK of compounds. These changes are of particular interest for drugs that are actively secreted in the kidney, as alterations in expression of major drug transporters in the kidney, as well as inhibition of these transporters with accumulated uremic toxins in RI have been reported (Vanholder et al., 2003; Dreisbach and Lertora, 2008; Nolin et al., 2008; Naud et al., 2011; Ciarimboli et al., 2012; Komazawa et al., 2013; Schophuizen et al., 2013; Sato et al., 2014; Hsueh et al., 2016; Sauzay et al., 2016). Beyond changes in transporter expression and activity, changes in drug metabolizing enzyme expression and activity, as well as modifications in protein binding can occur in RI (Keller et al., 1984; Vanholder et al., 1988; Dreisbach and Lertora, 2008; Nolin et al., 2008; Naud et al., 2011). In order to assess the potential impact of these changes, this study utilized Simcyp and two well characterized model substrates which undergo active secretion in the kidney involving OCT2, and MATE1, metformin and ranitidine. The impact of dose, DT expression, TDIs, and the impact of altering f u along with DT expression and TDIs were systematically investigated utilizing metformin, in order to establish quantitative relationships for the impact of these factors on CL R and overall PK for metformin. Downloaded from dmd.aspetjournals.org at ASPET Journals on October 13, 2018 Neither the dose of metformin nor the sex of individuals in the trials altered the impact of RI on the predictions of metformin PK. This is a significant finding as any trends that are determined to be vital to the proper prediction of metformin PK in RI populations will not be affected by these factors. As expected, renal DT expression had an impact on the CL R of metformin. As DT expression was decreased, there was an accompanying decrease in CL R of metformin, as the active secretion component of CL R was minimized. The impact was greater when renal function 20
21 DMD Fast Forward. Published on February 28, 2018 as DOI: /dmd This article has not been copyedited and formatted. The final version may differ from this version. was reduced. This suggests that any observed changes in DT expression in RI populations will be an increasingly important factor in prediction of PK as renal function decreases. The same trend was seen with inhibition of OCT2 and MATE1, as renal function was decreased, the impact of the same degree of inhibition resulted in greater decreases in CL R. TDIs are likely to be more severe as renal function declines. The accumulation of uremic toxins occurs with declining renal function; therefore, the CL R may be more drastically reduced than expected, based on a reduction in GFR in RI populations, if interactions with uremic toxins occurs with actively secreted compounds. It is also of note that the type of inhibition (competitive, noncompetitive, uncompetitive) did not lead to very different estimates of metformin PK, suggesting the type of inhibition is not a major factor in the determining the impact of TDIs on PK. Overall, our simulations indicated that inhibition of OCT2 played a much larger role in metformin PK than inhibition of MATE1. This may suggest that OCT2 transport is the rate-limiting step in the active secretion of metformin. However, cimetidine, a more potent inhibitor of MATE1 than OCT2, has been shown to clinically alter the CL R of metformin (Somogyi et al., 1987; Wang et al., 2008). This discrepancy may be explained by investigating the interplay between metformin efflux via MATE1 and influx via OCT2. OCT2 is an electrogenic transporter, and reduction of metformin efflux has been shown to increase the concentration of metformin and thereby reduce the driving force for metformin uptake via OCT2 in the proximal tubule (Burt et al., 2016). Incorporation of the electrogenic nature of OCT2 results in an increase in metformin plasma Downloaded from dmd.aspetjournals.org at ASPET Journals on October 13, 2018 concentrations when MATE1/2-K inhibition is included in simulations (Burt et al., 2016). This is consistent with our findings using the conventional (non-electrogenic) version of the metformin model in Simcyp that OCT2 inhibition is an important predictor of CL R of metformin and MATE1 inhibition, on its own, is not. MATE1 inhibition would likely prove to be more significant when its effect on OCT2 transport is incorporated. RI may cause a decrease in protein binding due to uremia, hypoalbuminemia, or drug interactions (Keller et al., 1984). In this study we varied f u from 0.1 to 1.0 in order to investigate 21
22 DMD Fast Forward. Published on February 28, 2018 as DOI: /dmd This article has not been copyedited and formatted. The final version may differ from this version. the maximal effects of potential changes in f u, despite the fact that metformin is negligibly protein bound even in healthy populations (Burt et al., 2016). As f u was increased, there was a large increase in Cl R which was magnified as renal function decreased. This indicates that changes in f u may have a greater effect as RI progresses. When DT expression was increased, the effect of f u on CL R was minimized, while when DT expression was decreased, the effect of f u was magnified. This indicates that DT expression can modulate the effect of f u on CL R. In a case, such as metformin, where OCT2 is a major DT that contributes to its CL R, if OCT2 expression decreases, any changes in f u may be magnified and play a more significant role than if normal expression was expected. For changes in f u with concurrent TDI, it was observed that an increase in f u minimized the impact of inhibition on reducing CL R. When maximal inhibition was included in the simulation, the reduction in CL R was reduced when f u was increased. This suggests that if a TDI is expected to occur in RI, the expected reduction in CL R may be over-predicted if the f u of the drug of interest is also increased in RI. Incorporation of changes in protein binding, when they are expected to be significant, may lead to more accurate predictions of overall PK and CL R. In order to improve the predictions of PK in RI populations, in vitro data was incorporated into the model for both metformin and ranitidine. For these simulations, a reduction in the activity and expression of OCT2 was included for both metformin and ranitidine (Ciarimboli et al., 2012; Komazawa et al., 2013; Schophuizen et al., 2013). Alterations in MATE1 transport were not Downloaded from dmd.aspetjournals.org at ASPET Journals on October 13, 2018 included in simulations for comparison to clinical data as no change in mrna was observed in a transgenic mouse model of RI (Pedersen et al., 2016). Alterations in OAT3 were also included in simulations for ranitidine, as this transporter is involved in the renal uptake of the compound (Komazawa et al., 2013; Hsueh et al., 2016). Inhibition of hepatic transport for metformin (OCT1) and ranitidine (OATP1B3) was also evaluated (Vanholder et al., 2003; Ciarimboli et al., 2012; Komazawa et al., 2013; Schophuizen et al., 2013; Sato et al., 2014). 22
23 DMD Fast Forward. Published on February 28, 2018 as DOI: /dmd This article has not been copyedited and formatted. The final version may differ from this version. For metformin, including modifications of OCT2 expression and activity led to the most accurate predictions of overall PK and of renal clearance parameters (CL R and A e ). For moderate RI, reducing OCT2 expression led to the most accurate prediction, while inhibiting OCT2 transport led to the most accurate predictions for severe RI. For ranitidine the base moderate RI population in Simcyp provided a reasonably accurate prediction of ranitidine overall PK; despite this, improvements were still observed with the inclusion of some of these additional changes, especially for the renal clearance parameters CL R and A e. As with metformin, alterations in OCT2 expression and activity led to the two best predictions of CL R and A e for moderate RI. However, alterations in OAT3 expression and activity led to the best predictions of overall PK. This suggests that the impact of alteration of OAT3, not OCT2, in RI may be more significant for ranitidine at least when RI is still moderate. For the severe RI populations, inclusion of additional changes in DT expression and activity resulted in an almost universal improvement in prediction over the base severe RI population in Simcyp. The conditions for simulation which provided the most accurate predictions of overall PK and for CL R and A e, were identical for both doses and included a decrease in both OCT2 and OAT3 expression, as well as inhibition of both of these transporters. These results highlight the importance of including the impact of RI on OCT2 and OAT3 in order to produce accurate predictions of ranitidine PK. Due to the changes in transporter expression induced in RI, it is possible that some compensatory mechanisms occur. This possibility was not explored in the Downloaded from dmd.aspetjournals.org at ASPET Journals on October 13, 2018 current study. This study highlights the importance of understanding the impact of RI on CL R on a mechanistic level with regards to DT expression, TDIs and f u in RI populations (Figure 10). The most accessible way to obtain mechanistic information about these factors is through in vitro studies, and we have demonstrated the usefulness of this data in improving the predictions of CL R for two OCT2/MATE1 substrates, metformin and ranitidine, in clinical RI populations. This 23
24 DMD Fast Forward. Published on February 28, 2018 as DOI: /dmd This article has not been copyedited and formatted. The final version may differ from this version. information will enable more accurate prediction of other OCT2/MATE1 substrates and a similar approach may allow for more accurate predictions for substrates of other transporters. Downloaded from dmd.aspetjournals.org at ASPET Journals on October 13,
25 DMD Fast Forward. Published on February 28, 2018 as DOI: /dmd This article has not been copyedited and formatted. The final version may differ from this version. Acknowledgements: Authorship Contributions: Participated in research design: Follman and Morris. Conducted experiments: Follman. Performed data analysis: Follman and Morris Wrote or contributed to the writing of the manuscript: Follman and Morris. Downloaded from dmd.aspetjournals.org at ASPET Journals on October 13,
26 DMD Fast Forward. Published on February 28, 2018 as DOI: /dmd This article has not been copyedited and formatted. The final version may differ from this version. References: Burt HJ, Neuhoff S, Almond L, Gaohua L, Harwood MD, Jamei M, Rostami-Hodjegan A, Tucker GT, and Rowland-Yeo K (2016) Metformin and cimetidine: Physiologically based pharmacokinetic modelling to investigate transporter mediated drug-drug interactions. Eur J Pharm Sci 88: Ciarimboli G, Lancaster CS, Schlatter E, Franke RM, Sprowl JA, Pavenstadt H, Massmann V, Guckel D, Mathijssen RH, Yang W, Pui CH, Relling MV, Herrmann E, and Sparreboom A (2012) Proximal tubular secretion of creatinine by organic cation transporter OCT2 in cancer patients. Clin Cancer Res 18: Dixon JS, Borg-Costanzi JM, Langley SJ, Lacey LF, and Toon S (1994) The effect of renal function on the pharmacokinetics of ranitidine. Eur J Clin Pharmacol 46: Dreisbach AW and Lertora JJ (2008) The effect of chronic renal failure on drug metabolism and transport. Expert Opin Drug Metab Toxicol 4: FDA (2012) Drug Interaction Studies Study Design, Data Analysis, Implications for Dosing, and Labeling Recommendations (Administration USDoHaHSFaD ed. FDA ( 2010 ) Guidance for Industry Pharmacokinetics in Patients with Impaired Renal Function Study Design, Data Analysis, and Impact on Dosing and Labeling, U.S. Department of Health and Human Services Food and Drug Administration. Garg DC, Baltodano N, Jallad NS, Perez G, Oster JR, Eshelman FN, and Weidler DJ (1986) Downloaded from dmd.aspetjournals.org at ASPET Journals on October 13, 2018 Pharmacokinetics of ranitidine in patients with renal failure. J Clin Pharmacol 26: Gusler G, Gorsline J, Levy G, Zhang SZ, Weston IE, Naret D, and Berner B (2001) Pharmacokinetics of metformin gastric-retentive tablets in healthy volunteers. J Clin Pharmacol 41:
27 DMD Fast Forward. Published on February 28, 2018 as DOI: /dmd This article has not been copyedited and formatted. The final version may differ from this version. Hacker K, Maas R, Kornhuber J, Fromm MF, and Zolk O (2015) Substrate-Dependent Inhibition of the Human Organic Cation Transporter OCT2: A Comparison of Metformin with Experimental Substrates. PLoS One 10:e Hoerger TJ, Simpson SA, Yarnoff BO, Pavkov ME, Rios Burrows N, Saydah SH, Williams DE, and Zhuo X (2015) The future burden of CKD in the United States: a simulation model for the CDC CKD Initiative. Am J Kidney Dis 65: Hsueh CH, Yoshida K, Zhao P, Meyer TW, Zhang L, Huang SM, and Giacomini KM (2016) Identification and Quantitative Assessment of Uremic Solutes as Inhibitors of Renal Organic Anion Transporters, OAT1 and OAT3. Mol Pharm 13: Inker LA, Astor BC, Fox CH, Isakova T, Lash JP, Peralta CA, Kurella Tamura M, and Feldman HI (2014) KDOQI US commentary on the 2012 KDIGO clinical practice guideline for the evaluation and management of CKD. Am J Kidney Dis 63: Ito S, Kusuhara H, Yokochi M, Toyoshima J, Inoue K, Yuasa H, and Sugiyama Y (2012) Competitive inhibition of the luminal efflux by multidrug and toxin extrusions, but not basolateral uptake by organic cation transporter 2, is the likely mechanism underlying the pharmacokinetic drug-drug interactions caused by cimetidine in the kidney. J Pharmacol Exp Ther 340: Katsube Y, Tsujimoto M, Koide H, Ochiai M, Hojyo A, Ogawa K, Kambara K, Torii N, Shima D, Furukubo T, Izumi S, Yamakawa T, Minegaki T, and Nishiguchi K (2017) Cooperative Downloaded from dmd.aspetjournals.org at ASPET Journals on October 13, 2018 inhibitory effects of uremic toxins and other serum components on OATP1B1-mediated transport of SN-38. Cancer Chemother Pharmacol 79: Keller F, Maiga M, Neumayer HH, Lode H, and Distler A (1984) Pharmacokinetic effects of altered plasma protein binding of drugs in renal disease. Eur J Drug Metab Pharmacokinet 9: Koch KM, Liu M, Davis IM, Shaw S, and Yin Y (1997) Pharmacokinetics and pharmacodynamics of ranitidine in renal impairment. Eur J Clin Pharmacol 52:
28 DMD Fast Forward. Published on February 28, 2018 as DOI: /dmd This article has not been copyedited and formatted. The final version may differ from this version. Komazawa H, Yamaguchi H, Hidaka K, Ogura J, Kobayashi M, and Iseki K (2013) Renal uptake of substrates for organic anion transporters Oat1 and Oat3 and organic cation transporters Oct1 and Oct2 is altered in rats with adenine-induced chronic renal failure. J Pharm Sci 102: National Kidney Foundation (2014) About Chronic Kidney Disease, National Kidney Foundation Naud J, Michaud J, Beauchemin S, Hebert MJ, Roger M, Lefrancois S, Leblond FA, and Pichette V (2011) Effects of chronic renal failure on kidney drug transporters and cytochrome P450 in rats. Drug Metab Dispos 39: Neuhoff S (2013) A dynamic physiologically-based pharmacokinetic model for Ranitidine including permeability-limited submodels for liver and kidney. Nigam SK, Wu W, Bush KT, Hoenig MP, Blantz RC, and Bhatnagar V (2015) Handling of Drugs, Metabolites, and Uremic Toxins by Kidney Proximal Tubule Drug Transporters. Clin J Am Soc Nephrol 10: Nolin TD, Naud J, Leblond FA, and Pichette V (2008) Emerging evidence of the impact of kidney disease on drug metabolism and transport. Clin Pharmacol Ther 83: Pedersen L, Jensen JB, Wogensen L, Munk OL, Jessen N, Frokiaer J, and Jakobsen S (2016) Renal PET-imaging with (11)C-metformin in a transgenic mouse model for chronic kidney disease. EJNMMI Res 6:54. Roberts CJ (1984) Clinical pharmacokinetics of ranitidine. Clin Pharmacokinet 9: Downloaded from dmd.aspetjournals.org at ASPET Journals on October 13, 2018 Rowland M, Lesko LJ, and Rostami-Hodjegan A (2015) Physiologically Based Pharmacokinetics Is Impacting Drug Development and Regulatory Decision Making. CPT Pharmacometrics Syst Pharmacol 4: Sambol NC, Chiang J, Lin ET, Goodman AM, Liu CY, Benet LZ, and Cogan MG (1995) Kidney function and age are both predictors of pharmacokinetics of metformin. J Clin Pharmacol 35:
29 DMD Fast Forward. Published on February 28, 2018 as DOI: /dmd This article has not been copyedited and formatted. The final version may differ from this version. Sato T, Yamaguchi H, Kogawa T, Abe T, and Mano N (2014) Organic anion transporting polypeptides 1B1 and 1B3 play an important role in uremic toxin handling and druguremic toxin interactions in the liver. J Pharm Pharm Sci 17: Sauzay C, White-Koning M, Hennebelle I, Deluche T, Delmas C, Imbs DC, Chatelut E, and Thomas F (2016) Inhibition of OCT2, MATE1 and MATE2-K as a possible mechanism of drug interaction between pazopanib and cisplatin. Pharmacol Res 110: Schophuizen CM, Wilmer MJ, Jansen J, Gustavsson L, Hilgendorf C, Hoenderop JG, van den Heuvel LP, and Masereeuw R (2013) Cationic uremic toxins affect human renal proximal tubule cell functioning through interaction with the organic cation transporter. Pflugers Arch 465: Somogyi A, Stockley C, Keal J, Rolan P, and Bochner F (1987) Reduction of metformin renal tubular secretion by cimetidine in man. Br J Clin Pharmacol 23: Tucker GT, Casey C, Phillips PJ, Connor H, Ward JD, and Woods HF (1981) Metformin kinetics in healthy subjects and in patients with diabetes mellitus. Br J Clin Pharmacol 12: Vanholder R, De Smet R, Glorieux G, Argiles A, Baurmeister U, Brunet P, Clark W, Cohen G, De Deyn PP, Deppisch R, Descamps-Latscha B, Henle T, Jorres A, Lemke HD, Massy ZA, Passlick-Deetjen J, Rodriguez M, Stegmayr B, Stenvinkel P, Tetta C, Wanner C, Zidek W, and European Uremic Toxin Work G (2003) Review on uremic toxins: Downloaded from dmd.aspetjournals.org at ASPET Journals on October 13, 2018 classification, concentration, and interindividual variability. Kidney Int 63: Vanholder R, Van Landschoot N, De Smet R, Schoots A, and Ringoir S (1988) Drug protein binding in chronic renal failure: evaluation of nine drugs. Kidney Int 33: Wang ZJ, Yin OQ, Tomlinson B, and Chow MS (2008) OCT2 polymorphisms and in-vivo renal functional consequence: studies with metformin and cimetidine. Pharmacogenet Genomics 18:
30 DMD Fast Forward. Published on February 28, 2018 as DOI: /dmd This article has not been copyedited and formatted. The final version may differ from this version. Zech PY, Chau NP, Pozet N, Labeeuw M, and Hadj-Aissa A (1983) Ranitidine kinetics in chronic renal impairment. Clin Pharmacol Ther 34: Downloaded from dmd.aspetjournals.org at ASPET Journals on October 13,
31 DMD Fast Forward. Published on February 28, 2018 as DOI: /dmd This article has not been copyedited and formatted. The final version may differ from this version. Footnote: This work was supported by the National Institutes of Health National Institute on Drug Abuse [grant R01DA023223]. Kristin E. Follman was supported in part by a fellowship from Bristol-Myers Squibb. Downloaded from dmd.aspetjournals.org at ASPET Journals on October 13,
32 DMD Fast Forward. Published on February 28, 2018 as DOI: /dmd This article has not been copyedited and formatted. The final version may differ from this version. Legends for Figures: Figure 1. Schematic Representation of Metformin Transport in the Kidney. OCT2 and MATE1 participate in the active secretion of metformin. Metformin is taken up from the blood via OCT2 and transported into the proximal tubule cell. Metformin is effluxed out of the proximal tubule cell via MATE1 and MATE2-K. Figure 2. Impact of Renal Impairment (RI) on the Dose Dependency of Metformin. Simulations were performed in Simcyp with oral metformin at 500, 1250 and 2000 mg. Simulations were performed in a male population with healthy and RI populations. Sim-Healthy Volunteers, Sim_RenalGFR_30-60 and Sim_RenalGFR_less_30 populations were used to represent GFR of 100, 50 and 10%, respectively. Each simulation included 10 trials with 10 subjects in each. Figure 3. Impact of Renal Impairment (RI) and Drug Transporter Expression on the Renal Clearance of Metformin. Simulations were performed in Simcyp with Sim-Healthy Volunteers, Sim_RenalGFR_30-60 and Sim_RenalGFR_less_30 populations to represent GFR of 100, 50 and 10%, respectively. A dose of 2000 mg metformin was administered in a fasted state to an exclusively male population. Expression of OCT2 and MATE1 was changed by altering J max ±2- or ±5-fold. Each simulation included 10 trials with 10 subjects in each. Figure 4. Effect of Renal Impairment (RI) and Inhibition on the Renal Clearance of Metformin in Males. Simulations were performed in Simcyp with Sim-Healthy Volunteers, Sim_RenalGFR_30-60 and Sim_RenalGFR_less_30 populations to represent GFR of 100, 50 Downloaded from dmd.aspetjournals.org at ASPET Journals on October 13, 2018 and 10%, respectively. A dose of 2000 mg metformin was administered in a fasted state to an exclusively male population. Inhibition was incorporated through the parameter, R ([I]/K i ), which modified K M or J max for competitive and non-competitive inhibition, respectively. R was varied from 0 to 100 to investigate varying levels of inhibition. Inhibition was applied to each transporter (OCT2/MATE1) separately. A non-competitive inhibition of OCT2; B non-competitive inhibition of MATE1. Each simulation included 10 trials with 10 subjects in each. 32
33 DMD Fast Forward. Published on February 28, 2018 as DOI: /dmd This article has not been copyedited and formatted. The final version may differ from this version. Figure 5. Effect of Renal Impairment (RI) and Fraction Unbound on the Renal Clearance of Metformin with Varying Expression of OCT2 and MATE1 in Males. Simulations were performed in Simcyp with Sim-Healthy Volunteers, Sim_RenalGFR_30-60 and Sim_RenalGFR_less_30 populations to represent GFR of 100, 50 and 10%, respectively. A dose of 2000 mg metformin was administered in a fasted state to an exclusively male population. Fraction unbound was varied from 0.1 to 1.0. Expression of OCT2 and MATE1 was altered by increasing or decreasing J max 2 or 5 fold. A, original expression (J max ) of OCT2/MATE1; B/D, ± 2-fold expression (J max ) of OCT2/MATE1; C/E, ± 5-fold expression (J max ) of OCT2/MATE1. Each simulation included 10 trials with 10 subjects in each. Figure 6. Effect of Renal Impairment (RI) and Fraction Unbound on the Renal Clearance of Metformin with Accompanying Inhibition of OCT2. Simulations were performed in Simcyp with Sim-Healthy Volunteers (A), Sim_RenalGFR_30-60 (B) and Sim_RenalGFR_less_30 (C) populations to represent GFR of 100, 50 and 10%, respectively. A dose of 2000 mg metformin was administered in a fasted state to an exclusively male population. Fraction unbound was varied from 0.1 to 1.0. R ([I]/K i ), which modified K M and J max for uncompetitive inhibition. R was varied from 0 to 100 to investigate varying levels of inhibition. Each simulation included 10 trials with 10 subjects in each. Figure 7. Effect of Renal Impairment (RI) and Fraction Unbound on the Renal Clearance of Metformin with Accompanying Inhibition of MATE1. Simulations were performed in Simcyp with Downloaded from dmd.aspetjournals.org at ASPET Journals on October 13, 2018 Sim-Healthy Volunteers (A), Sim_RenalGFR_30-60 (B) and Sim_RenalGFR_less_30 (C) populations to represent GFR of 100, 50 and 10%, respectively. A dose of 2000 mg metformin was administered in a fasted state to an exclusively male population. Fraction unbound was varied from 0.1 to 1.0. R ([I]/K i ), which modified K M and J max for uncompetitive inhibition. R was varied from 0 to 100 to investigate varying levels of inhibition. Each simulation included 10 trials with 10 subjects in each. 33
34 DMD Fast Forward. Published on February 28, 2018 as DOI: /dmd This article has not been copyedited and formatted. The final version may differ from this version. Figure 8. Metformin Plasma Profiles for Observed and Simulated Renally Impaired Populations. Observed plasma concentrations for metformin were plotted (black dots) for both moderate (A, B) and severe (C,D) renally impaired populations following an 850 mg oral dose of metformin obtained from Sambol et al (Sambol et al., 1995). The mean, 5 th and 95 th percentile data from simulations with Simcyp were then overlaid with the observed data for comparison. Simulations were performed with demographics and study conditions to match Sambol et al The pictured simulations include the base Simcyp RI population, and the most improved simulation as determined by improvement in the prediction/observed values for parameters given in Table 1. A. Sim_RenalGFR_30-60 B. Sim_RenalGFR_30-60 with 20% OCT2 expression (compared to normal expression) C. Sim_RenalGFR_less_30 D. Sim_RenalGFR_less_30 with OCT2 inhibition of R2 (competitive). Each simulation included 10 trials with 10 subjects in each. Figure 9. Ranitidine Plasma Profiles for Observed and Simulated Renally Impaired Populations. Observed plasma concentrations for ranitidine were plotted (black dots) for both moderate (A, B) and severe (C,D) renally impaired populations following a 50 mg intravenous dose of ranitidine obtained from Koch et al 1997 (Koch et al., 1997). The mean, 5 th and 95 th percentile data from simulations with Simcyp were then overlaid with the observed data for comparison. Simulations were performed with demographics and study conditions to match Koch et al The pictured simulations include the base Simcyp RI population, and the most improved simulation as determined by improvement in the prediction/observed values for parameters given in Table 2. Downloaded from dmd.aspetjournals.org at ASPET Journals on October 13, 2018 A. Sim_RenalGFR_30-60 B. Sim_RenalGFR_30-60 with 10% OAT3 expression (compared to normal expression) and OAT3 inhibition of R2 (competitive) C. Sim_RenalGFR_less_30 D. Sim_RenalGFR_less_30 with 10% OAT3 expression (compared to normal expression), OAT3 inhibition of R2 (competitive), 20% OCT2 expression (compared to normal expression), and OCT2 inhibition of R2 (competitive). Each simulation included 10 trials with 10 subjects in each. Figure 10. Summary of the Potential Physiological Impact of Renal Impairment (RI) on Metformin and Ranitidine. Simulations show that for the probe substrate metformin, a decrease 34
35 DMD Fast Forward. Published on February 28, 2018 as DOI: /dmd This article has not been copyedited and formatted. The final version may differ from this version. in protein binding leads to an increase in renal clearance (CL R ), while a decrease in GFR, drug transporter (DT) expression, and toxin drug interactions (TDIs) all lead to a decrease in CL R. Inclusion of a decrease in DT expression and TDIs also lead to an improvement of clinical PK in RI populations for metformin and ranitidine. Downloaded from dmd.aspetjournals.org at ASPET Journals on October 13,
36 DMD Fast Forward. Published on February 28, 2018 as DOI: /dmd This article has not been copyedited and formatted. The final version may differ from this version. Table 1. Comparison of predicted and observed values for PK parameters for Metformin. Simulation conditions are listed by rank order according to Σδ all. δ is the absolute difference between one and the ratio of the predicted value of the parameter over the observed value, as defined by equation 6 in the methods section. Supplementary Table 39 provides actual parameter estimates as well as δ values. Table 1. Comparison of δ Σδ all Σδ R predicted and observed values for PK parameters for Metformin t max C max AUC CL R A e Healthy Sim Healthy Volunteers Moderate RI Sim GFR OCT2 20% OCT2 20% OCT2 R OCT2 20% OCT1 10% OCT2 20% OCT1 10% OCT2 R2 OCT2 R Downloaded from dmd.aspetjournals.org at ASPET Journals on October 13, 2018 OCT1 10% OCT2 R OCT1 10% Severe RI Sim GFR less than OCT2 R OCT1 10% OCT2 R
37 DMD Fast Forward. Published on February 28, 2018 as DOI: /dmd This article has not been copyedited and formatted. The final version may differ from this version. OCT2 20% OCT2 20% OCT1 10% OCT2 20% OCT2 R OCT1 10% OCT2 20% OCT1 10% OCT2 R Downloaded from dmd.aspetjournals.org at ASPET Journals on October 13,
38 DMD Fast Forward. Published on February 28, 2018 as DOI: /dmd This article has not been copyedited and formatted. The final version may differ from this version. Table 2. Comparison of predicted and observed values for PK parameters for Ranitidine Simulation conditions are listed by rank order according to Σδ all. δ is the absolute difference between one and the ratio of the predicted value of the parameter over the observed value, as defined by equation 6 in the methods section. This table has been abbreviated to contain only the top five simulations for each dose/ri combination. Supplementary Table 40 provides values for each simulation including actual parameter estimates as well as δ values. δ Σδ all Σδ R Table 2. Comparison of predicted and observed Dose values for PK parameters for Ranitidine AUC CL CL R A e mg Healthy Sim Healthy Volunteers Sim Healthy Volunteers Moderate RI Sim GFR OAT3 10% OAT3 R OAT3 10% OAT3 R OCT2 R OCT2 20% Downloaded from dmd.aspetjournals.org at ASPET Journals on October 13, 2018 Severe RI Sim GFR less than OCT2 20% OAT3 10% OCT2 R2 OAT3 R OCT2 20% OAT3 10% OCT2 R OCT2 20% OCT2 R2 OAT3 R OCT2 20% OAT3 10% OAT3 R
39 DMD Fast Forward. Published on February 28, 2018 as DOI: /dmd This article has not been copyedited and formatted. The final version may differ from this version. OCT2 20% OAT3 10% Sim GFR less than OCT2 20% OAT3 10% OCT2 R2 OAT3 R OCT2 20% OAT3 10% OCT2 R OCT2 20% OCT2 R2 OAT3 R OCT2 20% OAT3 10% OCT2 R2 OAT3 R OATP1B3 R1 OCT2 20% OAT3 10% OCT2 R2 OATP1B3 R Downloaded from dmd.aspetjournals.org at ASPET Journals on October 13,
40 DMD Fast Forward. Published on February 28, 2018 as DOI: /dmd This article has not been copyedited and formatted. The final version may differ from this version. Figures: Figure 1. Downloaded from dmd.aspetjournals.org at ASPET Journals on October 13,

41 DMD Fast Forward. Published on February 28, 2018 as DOI: /dmd This article has not been copyedited and formatted. The final version may differ from this version. Figure 2. Downloaded from dmd.aspetjournals.org at ASPET Journals on October 13,


42 DMD Fast Forward. Published on February 28, 2018 as DOI: /dmd This article has not been copyedited and formatted. The final version may differ from this version. Figure 3. Downloaded from dmd.aspetjournals.org at ASPET Journals on October 13,


43 DMD Fast Forward. Published on February 28, 2018 as DOI: /dmd This article has not been copyedited and formatted. The final version may differ from this version. Figure 4. Downloaded from dmd.aspetjournals.org at ASPET Journals on October 13,


44 DMD Fast Forward. Published on February 28, 2018 as DOI: /dmd This article has not been copyedited and formatted. The final version may differ from this version. Figure 5. Downloaded from dmd.aspetjournals.org at ASPET Journals on October 13,


45 DMD Fast Forward. Published on February 28, 2018 as DOI: /dmd This article has not been copyedited and formatted. The final version may differ from this version. Figure 6. Downloaded from dmd.aspetjournals.org at ASPET Journals on October 13,


46 DMD Fast Forward. Published on February 28, 2018 as DOI: /dmd This article has not been copyedited and formatted. The final version may differ from this version. Figure 7. Downloaded from dmd.aspetjournals.org at ASPET Journals on October 13,
47 DMD Fast Forward. Published on February 28, 2018 as DOI: /dmd This article has not been copyedited and formatted. The final version may differ from this version. Figure 8. Downloaded from dmd.aspetjournals.org at ASPET Journals on October 13,
48 DMD Fast Forward. Published on February 28, 2018 as DOI: /dmd This article has not been copyedited and formatted. The final version may differ from this version. Figure 9. Downloaded from dmd.aspetjournals.org at ASPET Journals on October 13,


49 DMD Fast Forward. Published on February 28, 2018 as DOI: /dmd This article has not been copyedited and formatted. The final version may differ from this version. Figure 10. Downloaded from dmd.aspetjournals.org at ASPET Journals on October 13,
50 Supplemental Information Prediction of the Effects of Renal Impairment on the Clearance for Organic Cation Drugs that undergo Renal Secretion: A Simulation-Based Study Kristin E. Follman and Marilyn E. Morris Drug Metabolism & Disposition
51 Supplementary Table 1. Comparison of PK Parameters Utilizing J max /K M Values or CL int for OCT2 and MATE1 Transport Sim Population Dose Female CLR Ae AUC CL Cmax Tmax (h) fm (%) fe (%) Name (mg) proportion (mg) (mg/l*h) (mg/l) Sim2r Healthy E E Sim3r GFR30_ E E Sim4r GFRlessthan_ E E Sim5r Healthy E E Sim6r GFR30_ E E Sim7r GFRlessthan_ E E Sim1* Healthy E E Sim4* GFR30_ E E Sim12* GFRlessthan_ E E Sim9* Healthy E E Sim10* GFR30_ E E Sim11* GFRlessthan_ E E *CLint values provided in the metformin compound file were utilized, as opposed to the J max /K M values (given for OCT2, estimated for MATE1). CL R Renal clearance A e Amount excreted in urine AUC Area under the curve CL Total clearance C max Maximum concentration T max Time to maximum concentration f m fraction metabolized f e fraction excreted in urine
52 Supplementary Table 2. Impact of Renal Impairment (RI) on the Dose Dependency of Metformin Sim Name Population Dose (mg) Female proportion CLR Ae (mg) AUC (mg/l*h) CL Cmax (mg/l) Tmax (h) fm (%) fe (%) Sim2r Healthy E E Sim3r GFR30_ E E Sim4r GFRlessthan_ E E Sim5r Healthy E E Sim6r GFR30_ E E Sim7r GFRlessthan_ E E Sim13r Healthy E E Sim14r GFR30_ E E Sim15r GFRlessthan_ E E Sim16r Healthy E E E Sim17r GFR30_ E E E Sim18r GFRlessthan_ E E Sim19r Healthy E E Sim20r GFR30_ E E Sim21r GFRlessthan_ E E Sim22r Healthy E E Sim23r GFR30_ E E Sim24r GFRlessthan_ E E CL R Renal clearance A e Amount excreted in urine AUC Area under the curve CL Total clearance C max Maximum concentration T max Time to maximum concentration f m fraction metabolized f e fraction excreted in urine
53 Supplementary Table 3. Impact of Renal Impairment (RI) and Drug Transporter Expression on the Renal Clearance of Metformin in Males. Sim Population Ex. CLR Ae (mg) AUC CL Name (mg/l*h) Cmax (mg/l) Tmax (h) fm (%) fe (%) Sim13 Healthy E E E Sim160 Healthy E E E Sim184 Healthy E E E Sim208 Healthy E E Sim232 Healthy E E Sim14 GFR30_ E E Sim164 GFR30_ E E E Sim188 GFR30_ E E E Sim212 GFR30_ E E Sim236 GFR30_ E E Sim15 GFRlessthan_ E E Sim168 GFRlessthan_ E E E Sim192 GFRlessthan_ E E E Sim216 GFRlessthan_ E E Sim240 GFRlessthan_ E E Ex. Drug Transporter Expression (fold change) CL R Renal clearance A e Amount excreted in urine AUC Area under the curve CL Total clearance C max Maximum concentration T max Time to maximum concentration f m fraction metabolized f e fraction excreted in urine
54 Supplementary Table 4. Effect of Renal Impairment (RI) and Competitive Inhibition on the PK of Metformin in Males Sim Population R DT Jmax Km CLR Ae (mg) AUC CL Name (mg/l*h) Cmax (mg/l) Tmax (h) fm (%) fe (%) Sim34r Healthy 1 OCT2 2.11E E E E Sim35r Healthy 10 OCT2 Sim36r Healthy 100 OCT2 Sim37r GFR30_60 1 OCT2 Sim38r GFR30_60 10 OCT2 Sim39r GFR30_ OCT2 Sim40r GFRlessthan_30 1 OCT2 Sim41r GFRlessthan_30 10 OCT2 Sim42r GFRlessthan_ OCT2 2.11E E E E E E E E E E E E E E E E E E E E E E E E E E E E E E E E Sim70 Healthy 1 MATE1 3.25E E E E Sim71 Healthy 10 MATE1 Sim72 Healthy 100 MATE1 Sim73 GFR30_60 1 MATE1 Sim74 GFR30_60 10 MATE1 Sim75 GFR30_ MATE1 Sim76 GFRlessthan_30 1 MATE1 Sim77 GFRlessthan_30 10 MATE1 Sim78 GFRlessthan_ MATE1 3.25E E E E E E E E E E E E E E E E E E E E E E E E E E E E E E E E R Inhibition factor ([I]/K i ) DT Drug transporter J max Maximal transport velocity K M Affinity constant for transport CL R Renal clearance A e Amount excreted in urine AUC Area under the curve CL Total clearance C max Maximum concentration T max Time to maximum concentration f m fraction metabolized f e fraction excreted in urine
55 Supplementary Table 5. Effect of Renal Impairment (RI) and Non-competitive Inhibition on the PK of Metformin in Males Sim Name Population R DT Jmax Km CLR Ae (mg) AUC (mg/l*h ) CL Cmax (mg/l) Tmax (h) fm (%) fe (%) Sim25r Healthy 1 OCT2 1.05E E E E Sim26r Healthy 10 OCT2 1.92E E E E Sim27r Healthy 100 OCT E E E Sim28r GFR30_60 1 OCT2 1.05E E E E Sim29r GFR30_60 10 OCT2 1.92E E E E Sim30r GFR30_ OCT E E E Sim31r GFRlessthan_30 1 OCT2 1.05E E E E Sim32r GFRlessthan_30 10 OCT2 1.92E E E E Sim33r GFRlessthan_ OCT E E E Sim61 Healthy 1 MATE1 1.62E E E E Sim62 Healthy 10 MATE E E E Sim63 Healthy 100 MATE E E Sim64 GFR30_60 1 MATE1 1.62E E E Sim65 GFR30_60 10 MATE E E Sim66 GFR30_ MATE E E Sim67 GFRlessthan_30 1 MATE1 1.62E E E Sim68 GFRlessthan_30 10 MATE E E Sim69 GFRlessthan_ MATE E E R Inhibition factor ([I]/K i ) DT Drug transporter J max Maximal transport velocity K M Affinity constant for transport CL R Renal clearance A e Amount excreted in urine AUC Area under the curve CL Total clearance C max Maximum concentration T max Time to maximum concentration f m fraction metabolized f e fraction excreted in urine
56 Supplementary Table 6. Effect of Renal Impairment (RI) and Uncompetitive Inhibition on the PK of Metformin in Males Sim Population R DT Jmax Km CLR Ae (mg) AUC CL Cmax Tmax Name (mg/l*h) (mg/l) (h) Sim106 Healthy 1 OCT2 1.05E E E E Sim107 Healthy 10 OCT2 1.92E E E E Sim108 Healthy 100 OCT E E E Sim109 GFR30_60 1 OCT2 1.05E E E E Sim110 GFR30_60 10 OCT2 1.92E E E E Sim111 GFR30_ OCT E E E Sim112 GFRlessthan_30 1 OCT2 1.05E E E E Sim113 GFRlessthan_30 10 OCT2 1.92E E E E Sim114 GFRlessthan_ OCT E E E Sim115 Healthy 1 MATE1 1.62E E E E Sim116 Healthy 10 MATE E E E E Sim117 Healthy 100 MATE E E E Sim118 GFR30_60 1 MATE1 1.62E E E Sim119 GFR30_60 10 MATE E E E Sim120 GFR30_ MATE E E E Sim121 GFRlessthan_30 1 MATE1 1.62E E E Sim122 GFRlessthan_30 10 MATE E E E Sim123 GFRlessthan_ MATE E E E fm (%) fe (%) R Inhibition factor ([I]/K i ) DT Drug transporter J max Maximal transport velocity K M Affinity constant for transport CL R Renal clearance A e Amount excreted in urine AUC Area under the curve CL Total clearance C max Maximum concentration T max Time to maximum concentration f m fraction metabolized f e fraction excreted in urine
57 Supplementary Table 7. Effect of Renal Impairment (RI) and Fraction Unbound on the PK of Metformin in Males Sim Population fu CLR Ae (mg) AUC CL Name (mg/l*h) Cmax Tmax (mg/l) (h) fm (%) fe (%) Sim13 Healthy E E E Sim142 Healthy E E E Sim143 Healthy E E E Sim144 Healthy E E Sim14 GFR30_ E E Sim145 GFR30_ E E E Sim146 GFR30_ E E Sim147 GFR30_ E E Sim15 GFRlessthan_ E E Sim148 GFRlessthan_ E E Sim149 GFRlessthan_ E E Sim150 GFRlessthan_ E E f u Fraction unbound CL R Renal clearance A e Amount excreted in urine AUC Area under the curve CL Total clearance C max Maximum concentration T max Time to maximum concentration f m fraction metabolized f e fraction excreted in urine
58 Supplementary Table 8. Effect of Renal Impairment (RI) and Fraction Unbound on the PK of Metformin in Males with a Five-Fold Increase in OCT2/MATE1 Expression Sim Population fu CLR Ae (mg) AUC CL Cmax (mg/l) Tmax (h) fm (%) fe (%) Name (mg/l*h) Sim184 Healthy E E E Sim185 Healthy E E E Sim186 Healthy E E E Sim187 Healthy E E E Sim188 GFR30_ E E E Sim189 GFR30_ E E E Sim190 GFR30_ E E E Sim191 GFR30_ E E E Sim192 GFRlessthan_ E E E Sim193 GFRlessthan_ E E E Sim194 GFRlessthan_ E E E Sim195 GFRlessthan_ E E f u Fraction unbound CL R Renal clearance A e Amount excreted in urine AUC Area under the curve CL Total clearance C max Maximum concentration T max Time to maximum concentration f m fraction metabolized f e fraction excreted in urine
59 Supplementary Table 9. Effect of Renal Impairment (RI) and Fraction Unbound on the PK of Metformin in Males with a Five-Fold Decrease in OCT2/MATE1 Expression Sim Population fu CLR Ae AUC CL Name (mg) (mg/l*h) Cmax (mg/l) Tmax (h) fm (%) fe (%) Sim232 Healthy E E Sim233 Healthy E E Sim234 Healthy E E Sim235 Healthy E E Sim236 GFR30_ E E Sim237 GFR30_ E E Sim238 GFR30_ E E Sim239 GFR30_ E E Sim240 GFRlessthan_ E E Sim241 GFRlessthan_ E E Sim242 GFRlessthan_ E E Sim243 GFRlessthan_ E E f u Fraction unbound CL R Renal clearance A e Amount excreted in urine AUC Area under the curve CL Total clearance C max Maximum concentration T max Time to maximum concentration f m fraction metabolized f e fraction excreted in urine
60 Supplementary Table 10. Effect of Renal Impairment (RI) and Fraction Unbound on the PK of Metformin in Males with a Two-Fold Increase in OCT2/MATE1 Expression Sim Name Population fu CLR Ae (mg) AUC (mg/l*h) CL Cmax (mg/l) Tmax (h) fm (%) fe (%) Sim160 Healthy E E E Sim161 Healthy E E E Sim162 Healthy E E E Sim163 Healthy E E Sim164 GFR30_ E E E Sim165 GFR30_ E E E Sim166 GFR30_ E E E Sim167 GFR30_ E E Sim168 GFRlessthan_ E E E Sim169 GFRlessthan_ E E E Sim170 GFRlessthan_ E E E Sim171 GFRlessthan_ E E f u Fraction unbound CL R Renal clearance A e Amount excreted in urine AUC Area under the curve CL Total clearance C max Maximum concentration T max Time to maximum concentration f m fraction metabolized f e fraction excreted in urine
61 Supplementary Table 11. Effect of Renal Impairment (RI) and Fraction Unbound on the PK of Metformin in Males with a Two-Fold Decrease in OCT2/MATE1 Expression Sim Population fu CLR Ae AUC CL Name (mg) (mg/l*h) Cmax Tmax (mg/l) (h) fm (%) fe (%) Sim208 Healthy E E Sim209 Healthy E E Sim210 Healthy E E Sim211 Healthy E E Sim212 GFR30_ E E Sim213 GFR30_ E E Sim214 GFR30_ E E Sim215 GFR30_ E E Sim216 GFRlessthan_ E E Sim217 GFRlessthan_ E E Sim218 GFRlessthan_ E E Sim219 GFRlessthan_ E E f u Fraction unbound CL R Renal clearance A e Amount excreted in urine AUC Area under the curve CL Total clearance C max Maximum concentration T max Time to maximum concentration f m fraction metabolized f e fraction excreted in urine
62 Supplementary Table 12. Effect of Renal Impairment (RI) and Fraction Unbound on the Renal Clearance of Metformin with Accompanying Uncompetitive Inhibition of OCT2 in a Healthy Population. Sim Name fu R Jmax Km CLR Ae (mg) AUC (mg/l*h) CL Cmax (mg/l) Tmax (h) fm (%) fe (%) Sim E E E E E Sim E E E E E Sim E E E E E Sim E E E E Sim E E E E Sim E E E E Sim E E E E Sim E E E E Sim E E E E Sim E E E E Sim E E E E Sim E E E E Sim E E E Sim E E E Sim E E E Sim E E E R Inhibition factor ([I]/K i ) f u Fraction unbound J max Maximal transport velocity K M Affinity constant for transport CL R Renal clearance A e Amount excreted in urine AUC Area under the curve CL Total clearance C max Maximum concentration T max Time to maximum concentration f m fraction metabolized f e fraction excreted in urine
63 Supplementary Table 13. Effect of Renal Impairment (RI) and Fraction Unbound on the Renal Clearance of Metformin with Accompanying Uncompetitive Inhibition of OCT2 in a Moderate RI Population. Sim Name fu R Jmax Km CLR R Inhibition factor ([I]/K i ) f u Fraction unbound J max Maximal transport velocity K M Affinity constant for transport CL R Renal clearance A e Amount excreted in urine AUC Area under the curve CL Total clearance C max Maximum concentration T max Time to maximum concentration f m fraction metabolized f e fraction excreted in urine Ae (mg) AUC (mg/l* h) CL Cmax (mg/l) Tmax (h) fm (%) fe (%) Sim E E E E Sim E E E E E Sim E E E E Sim E E E E Sim E E E E Sim E E E E Sim E E E E Sim E E E E Sim E E E E Sim E E E E Sim E E E E Sim E E E E Sim E E E Sim E E E Sim E E E Sim E E E
64 Supplementary Table 14. Effect of Renal Impairment (RI) and Fraction Unbound on the Renal Clearance of Metformin with Accompanying Uncompetitive Inhibition of OCT2 in a Severe RI Population. Sim fu R Jmax Km CLR Name Sim Sim Sim Sim Sim Sim Sim Sim Sim Sim Sim Sim Sim Sim Sim Sim Ae (mg) AUC (mg/l*h) CL Cmax (mg/l) Tmax (h) fm (%) fe (%) 2.11E E E E E E E E E E E E E E E E E E E E E E E E E E E E E E E E E E E E E E E E E E E E E E E E E E E E E E E E E E E E R Inhibition factor ([I]/K i ) f u Fraction unbound J max Maximal transport velocity K M Affinity constant for transport CL R Renal clearance A e Amount excreted in urine AUC Area under the curve CL Total clearance C max Maximum concentration T max Time to maximum concentration f m fraction metabolized f e fraction excreted in urine
65 Supplementary Table 15. Effect of Renal Impairment (RI) and Fraction Unbound on the Renal Clearance of Metformin with Accompanying Uncompetitive Inhibition of MATE1 in a Healthy Population. Sim Name Sim Sim Sim Sim Sim Sim Sim Sim Sim Sim Sim Sim Sim Sim Sim Sim fu R Jmax Km CLR Ae (mg) AUC (mg/l*h) CL Cmax (mg/l) Tma x (h) 3.25E E E E E E E E E E E E E E E E E E E E E E E E E E E E E E fm (%) fe (%) E E E E E E E E E E E E E E E E E E E E E E E E E E E R Inhibition factor ([I]/K i ) f u Fraction unbound J max Maximal transport velocity K M Affinity constant for transport CL R Renal clearance A e Amount excreted in urine AUC Area under the curve CL Total clearance C max Maximum concentration T max Time to maximum concentration f m fraction metabolized f e fraction excreted in urine
66 Supplementary Table 16. Effect of Renal Impairment (RI) and Fraction Unbound on the Renal Clearance of Metformin with Accompanying Uncompetitive Inhibition of MATE1 in a Moderate RI Population. Sim Name Sim Sim Sim Sim Sim Sim Sim Sim Sim Sim Sim Sim Sim Sim Sim Sim fu R Jmax Km CLR Ae (mg) AUC (mg/l*h) CL Cmax (mg/l) 3.25E E E E E E E E E E E E E E E E E E E E E E E E E E Tmax (h) fm (%) fe (%) E E E E E E E E E E E E E E E E E E E E E E E E E R Inhibition factor ([I]/K i ) f u Fraction unbound J max Maximal transport velocity K M Affinity constant for transport CL R Renal clearance A e Amount excreted in urine AUC Area under the curve CL Total clearance C max Maximum concentration T max Time to maximum concentration f m fraction metabolized f e fraction excreted in urine
67 Supplementary Table 17. Effect of Renal Impairment (RI) and Fraction Unbound on the Renal Clearance of Metformin with Accompanying Uncompetitive Inhibition of MATE1 in a Severe RI Population. Sim Name Sim Sim Sim Sim Sim Sim Sim Sim Sim Sim Sim Sim fu R Jmax Km CLR Sim Sim Sim Sim Ae (mg) AUC (mg/l*h) CL Cmax (mg/l) Tmax (h) fm (%) fe (%) 3.25E E E E E E E E E E E E E E E E E E E E E E E E E E E E E E E E E E E E E E E E E E E E E E E E R Inhibition factor ([I]/K i ) f u Fraction unbound J max Maximal transport velocity K M Affinity constant for transport CL R Renal clearance A e Amount excreted in urine AUC Area under the curve CL Total clearance C max Maximum concentration T max Time to maximum concentration f m fraction metabolized f e fraction excreted in urine
68 Supplementary Table 18. Effect of Renal Impairment (RI) and Fraction Unbound on the Renal Clearance of Metformin with Accompanying Competitive Inhibition of OCT2 in a Healthy Population. Sim fu R Jmax Km CLR Name Sim Sim Sim Sim Sim Sim Sim Sim Sim Sim Sim Sim Sim Sim Sim Sim Ae (mg) AUC (mg/l*h) CL Cmax (mg/l) 2.11E E E E E E E E E E E E E E E E E E E E E E E E E E E E E E E E E E E E E E E E E E E E E E E E E E E E E E E E E E E E E E E E E E E Tmax (h) fm (%) fe (%) R Inhibition factor ([I]/K i ) f u Fraction unbound J max Maximal transport velocity K M Affinity constant for transport CL R Renal clearance A e Amount excreted in urine AUC Area under the curve CL Total clearance C max Maximum concentration T max Time to maximum concentration f m fraction metabolized f e fraction excreted in urine
69 Supplementary Table 19. Effect of Renal Impairment (RI) and Fraction Unbound on the Renal Clearance of Metformin with Accompanying Competitive Inhibition of OCT2 in a Moderate RI Population. Sim Name Sim Sim Sim Sim Sim Sim Sim Sim Sim Sim Sim Sim fu R Jmax Km CLR Sim Sim Sim Sim Ae (mg) AUC (mg/l*h) CL Cmax (mg/l) 2.11E E E E E E E E E E E E E E E E E E E E E E E E E E E E E E E E E E E E E E E E E E E E E E E E E E E E E E E E E E E E E E E E E Tmax (h) fm (%) fe (%) R Inhibition factor ([I]/K i ) f u Fraction unbound J max Maximal transport velocity K M Affinity constant for transport CL R Renal clearance A e Amount excreted in urine AUC Area under the curve CL Total clearance C max Maximum concentration T max Time to maximum concentration f m fraction metabolized f e fraction excreted in urine
70 Supplementary Table 20. Effect of Renal Impairment (RI) and Fraction Unbound on the Renal Clearance of Metformin with Accompanying Competitive Inhibition of OCT2 in a Severe RI Population. Sim fu R Jmax Km CLR Name Sim Sim Sim Sim Sim Sim Sim Sim Sim Sim Sim Sim Sim Sim Sim Sim Ae (mg) AUC (mg/l*h) CL Cmax (mg/l) Tmax (h) fm (%) fe (%) 2.11E E E E E E E E E E E E E E E E E E E E E E E E E E E E E E E E E E E E E E E E E E E E E E E E E E E E E E E E E E E E E E E E R Inhibition factor ([I]/K i ) f u Fraction unbound J max Maximal transport velocity K M Affinity constant for transport CL R Renal clearance A e Amount excreted in urine AUC Area under the curve CL Total clearance C max Maximum concentration T max Time to maximum concentration f m fraction metabolized f e fraction excreted in urine
71 Supplementary Table 21. Effect of Renal Impairment (RI) and Fraction Unbound on the Renal Clearance of Metformin with Accompanying Noncompetitive Inhibition of OCT2 in a Healthy Population. Sim Name Sim Sim Sim Sim Sim Sim Sim Sim Sim Sim Sim Sim fu R Jmax Km CLR Sim Sim Sim Sim Ae (mg) AUC (mg/l*h) CL Cmax (mg/l) 2.11E E E E E E E E E E E E E E E E E E E E E E E E E E E E E E E E E E E E E E E E E E E E E E E E E E E Tmax (h) fm (%) fe (%) E E E E E E E E E E E E R Inhibition factor ([I]/K i ) f u Fraction unbound J max Maximal transport velocity K M Affinity constant for transport CL R Renal clearance A e Amount excreted in urine AUC Area under the curve CL Total clearance C max Maximum concentration T max Time to maximum concentration f m fraction metabolized f e fraction excreted in urine
72 Supplementary Table 22. Effect of Renal Impairment (RI) and Fraction Unbound on the Renal Clearance of Metformin with Accompanying Noncompetitive Inhibition of OCT2 in a Moderate RI Population. Sim Name Sim Sim Sim Sim Sim Sim Sim Sim Sim Sim Sim Sim fu R Jmax Km CLR Sim Sim Sim Sim R Inhibition factor ([I]/K i ) f u Fraction unbound J max Maximal transport velocity K M Affinity constant for transport CL R Renal clearance A e Amount excreted in urine AUC Area under the curve CL Total clearance C max Maximum concentration T max Time to maximum concentration f m fraction metabolized f e fraction excreted in urine Ae (mg) AUC (mg/l*h) CL Cmax (mg/l) Tmax (h) fm (%) fe (%) 2.11E E E E E E E E E E E E E E E E E E E E E E E E E E E E E E E E E E E E E E E E E E E E E E E E E E E E E E E E E E E E E E
73 Supplementary Table 23. Effect of Renal Impairment (RI) and Fraction Unbound on the Renal Clearance of Metformin with Accompanying Noncompetitive Inhibition of OCT2 in a Severe RI Population. Sim Name Sim Sim Sim Sim Sim Sim Sim Sim Sim Sim Sim Sim fu R Jmax Km CLR Sim Sim Sim Sim Ae (mg) AUC (mg/l*h) CL Cmax (mg/l) Tmax (h) fm (%) fe (%) 2.11E E E E E E E E E E E E E E E E E E E E E E E E E E E E E E E E E E E E E E E E E E E E E E E E E E E E E E E E E E E E R Inhibition factor ([I]/K i ) f u Fraction unbound J max Maximal transport velocity K M Affinity constant for transport CL R Renal clearance A e Amount excreted in urine AUC Area under the curve CL Total clearance C max Maximum concentration T max Time to maximum concentration f m fraction metabolized f e fraction excreted in urine
74 Supplementary Table 24. Effect of Renal Impairment (RI) and Fraction Unbound on the Renal Clearance of Metformin with Accompanying Competitive Inhibition of MATE1 in a Healthy Population. Sim Name Sim Sim Sim Sim Sim Sim Sim Sim Sim Sim Sim Sim fu R Jmax Km CLR Sim Sim Sim Sim Ae (mg) AUC (mg/l*h) CL Cmax (mg/l) 3.25E E E E E E E E E E E E E E E E E E E E E E E E E E E E E E E E E E E E E E E E E E E E E E E E E E E E E E E E E E E E E E E E E E E E E E E E E E Tmax (h) fm (%) fe (%) 3.25E E E E E R Inhibition factor ([I]/K i ) f u Fraction unbound J max Maximal transport velocity K M Affinity constant for transport CL R Renal clearance A e Amount excreted in urine AUC Area under the curve CL Total clearance C max Maximum concentration T max Time to maximum concentration f m fraction metabolized f e fraction excreted in urine
75 Supplementary Table 25. Effect of Renal Impairment (RI) and Fraction Unbound on the Renal Clearance of Metformin with Accompanying Competitive Inhibition of MATE1 in a Moderate RI Population. Sim Name Sim Sim Sim Sim Sim Sim Sim Sim Sim Sim Sim Sim fu R Jmax Km CLR Sim Sim Sim Sim R Inhibition factor ([I]/K i ) f u Fraction unbound J max Maximal transport velocity K M Affinity constant for transport CL R Renal clearance A e Amount excreted in urine AUC Area under the curve CL Total clearance C max Maximum concentration T max Time to maximum concentration f m fraction metabolized f e fraction excreted in urine Ae (mg) AUC (mg/l*h) CL Cmax (mg/l) 3.25E E E E E E E E E E E E E E E E E E E E E E E E E E E E E E E E E E E E E E E E E E E E E E E E E E E E E E E E E E E E E E E E E Tmax (h) fm (%) fe (%)
76 Supplementary Table 26. Effect of Renal Impairment (RI) and Fraction Unbound on the Renal Clearance of Metformin with Accompanying Competitive Inhibition of MATE1 in a Severe RI Population. Sim Name Sim Sim Sim Sim Sim Sim Sim Sim Sim Sim Sim Sim fu R Jmax Km CLR Sim Sim Sim Sim R Inhibition factor ([I]/K i ) f u Fraction unbound J max Maximal transport velocity K M Affinity constant for transport CL R Renal clearance A e Amount excreted in urine AUC Area under the curve CL Total clearance C max Maximum concentration T max Time to maximum concentration f m fraction metabolized f e fraction excreted in urine Ae (mg) AUC (mg/l*h) CL Cmax (mg/l) Tmax (h) fm (%) fe (%) 3.25E E E E E E E E E E E E E E E E E E E E E E E E E E E E E E E E E E E E E E E E E E E E E E E E E E E E E E E E E E E
77 Supplementary Table 27. Effect of Renal Impairment (RI) and Fraction Unbound on the Renal Clearance of Metformin with Accompanying Noncompetitive Inhibition of MATE1 in a Healthy Population. Sim Name Sim Sim Sim Sim Sim Sim Sim Sim Sim Sim Sim Sim fu R Jmax Km CLR Sim Sim Sim Sim Ae (mg) AUC (mg/l*h) CL Cmax (mg/l) Tmax (h) fm (%) fe (%) 3.25E E E E E E E E E E E E E E E E E E E E E E E E E E E E E E E E E E E E E E E E E E E E E E E E E E E R Inhibition factor ([I]/K i ) f u Fraction unbound J max Maximal transport velocity K M Affinity constant for transport CL R Renal clearance A e Amount excreted in urine AUC Area under the curve CL Total clearance C max Maximum concentration T max Time to maximum concentration f m fraction metabolized f e fraction excreted in urine
78 Supplementary Table 28. Effect of Renal Impairment (RI) and Fraction Unbound on the Renal Clearance of Metformin with Accompanying Noncompetitive Inhibition of MATE1 in a Moderate RI Population. Sim Name Sim Sim Sim Sim Sim Sim Sim Sim Sim Sim Sim Sim fu R Jmax Km CLR Sim Sim Sim Sim Ae (mg) AUC (mg/l*h) CL Cmax (mg/l) 3.25E E E E E E E E E E E E E E E E E E E E E E E E E E E E Tmax (h) fm (%) fe (%) E E E E E E E E E E E E E E E E E E E R Inhibition factor ([I]/K i ) f u Fraction unbound J max Maximal transport velocity K M Affinity constant for transport CL R Renal clearance A e Amount excreted in urine AUC Area under the curve CL Total clearance C max Maximum concentration T max Time to maximum concentration f m fraction metabolized f e fraction excreted in urine
79 Supplementary Table 29. Effect of Renal Impairment (RI) and Fraction Unbound on the Renal Clearance of Metformin with Accompanying Noncompetitive Inhibition of MATE1 in a Severe RI Population. Sim Name Sim Sim Sim Sim Sim Sim Sim Sim Sim Sim Sim Sim fu R Jmax Km CLR Sim Sim Sim Sim Ae (mg) AUC (mg/l*h) CL Cmax (mg/l) Tmax (h) fm (%) fe (%) 3.25E E E E E E E E E E E E E E E E E E E E E E E E E E E E E E E E E E E E E E E E E E R Inhibition factor ([I]/K i ) f u Fraction unbound J max Maximal transport velocity K M Affinity constant for transport CL R Renal clearance A e Amount excreted in urine AUC Area under the curve CL Total clearance C max Maximum concentration T max Time to maximum concentration f m fraction metabolized f e fraction excreted in urine
80 Supplementary Table 30. Impact of Renal Impairment (RI) and Drug Transporter Expression on the Renal Clearance of Metformin in Females. Sim Name Population Ex. CLR Ae (mg) AUC (mg/l*h) Sim16 Healthy 0 Sim172 Healthy +2 Sim196 Healthy +5 Sim220 Healthy -2 Sim244 Healthy -5 Sim17 GFR30_60 0 Sim176 GFR30_60 +2 Sim200 GFR30_60 +5 Sim224 GFR30_60-2 Sim248 GFR30_60-5 Sim18 GFRlessthan_30 0 Sim180 GFRlessthan_30 +2 Sim204 GFRlessthan_30 +5 Sim228 GFRlessthan_30-2 Sim252 GFRlessthan_30-5 CL Cmax (mg/l) Tmax (h) fm (%) fe (%) E E E E E E E E E E E E E E E E E E E E E E E E E E E E E E E E E E E E E E E Ex. Drug Transporter Expression (fold change) CL R Renal clearance A e Amount excreted in urine AUC Area under the curve CL Total clearance C max Maximum concentration T max Time to maximum concentration f m fraction metabolized f e fraction excreted in urine
81 Supplementary Table 31. Effect of Renal Impairment (RI) and Competitive Inhibition on the PK of Metformin in Females Sim Name Population R DT Jmax Km CLR Sim52r Healthy 1 OCT2 Sim53r Healthy 10 OCT2 Sim54r Healthy 100 OCT2 Sim55r GFR30_60 1 OCT2 Sim56r GFR30_60 10 OCT2 Sim57r GFR30_ OCT2 Sim58r GFRlessthan_30 1 OCT2 Sim59r GFRlessthan_30 10 OCT2 Sim60r GFRlessthan_ OCT2 Sim97 Healthy 1 MATE1 Sim98 Healthy 10 MATE1 Sim99 Healthy 100 MATE1 Sim100 GFR30_60 1 MATE1 Sim101 GFR30_60 10 MATE1 Sim102 GFR30_ MATE1 Sim103 GFRlessthan_30 1 MATE1 Sim104 GFRlessthan_30 10 MATE1 Sim105 GFRlessthan_ MATE1 Ae (mg) AUC (mg/l*h) CL Cmax (mg/l) Tmax (h) fm (%) fe (%) 2.11E E E E E E E E E E E E E E E E E E E E E E E E E E E E E E E E E E E E E E E E E E E E E E E E E E E E E E E E E E E E E E E E E E E E E E E E E E E E R Inhibition factor ([I]/K i ) f u Fraction unbound J max Maximal transport velocity K M Affinity constant for transport CL R Renal clearance A e Amount excreted in urine AUC Area under the curve CL Total clearance C max Maximum concentration T max Time to maximum concentration f m fraction metabolized f e fraction excreted in urine
82 Supplementary Table 32. Effect of Renal Impairment (RI) and Non-competitive Inhibition on the PK of Metformin in Females Sim Name Population R DT Jmax Km CLR Sim43r Healthy 1 OCT2 Sim44r Healthy 10 OCT2 Sim45r Healthy 100 OCT2 Sim46r GFR30_60 1 OCT2 Sim47r GFR30_60 10 OCT2 Sim48r GFR30_ OCT2 Sim49r GFRlessthan_30 1 OCT2 Sim50r GFRlessthan_30 10 OCT2 Sim51r GFRlessthan_ OCT2 Sim79 Healthy 1 MATE1 Sim80 Healthy 10 MATE1 Sim81 Healthy 100 MATE1 Sim82 GFR30_60 1 MATE1 Sim83 GFR30_60 10 MATE1 Sim84 GFR30_ MATE1 Sim85 GFRlessthan_30 1 MATE1 Sim86 GFRlessthan_30 10 MATE1 Sim87 GFRlessthan_ MATE1 Ae (mg) AUC (mg/l*h) CL Cmax (mg/l) Tmax (h) fm (%) fe (%) 1.05E E E E E E E E E E E E E E E E E E E E E E E E E E E E E E E E E E E E E E E E E E E E E E E E E E E E E E E E E E E R Inhibition factor ([I]/K i ) f u Fraction unbound J max Maximal transport velocity K M Affinity constant for transport CL R Renal clearance A e Amount excreted in urine AUC Area under the curve CL Total clearance C max Maximum concentration T max Time to maximum concentration f m fraction metabolized f e fraction excreted in urine
83 Supplementary Table 33. Effect of Renal Impairment (RI) and Uncompetitive Inhibition on the PK of Metformin in Females Sim Name Population R DT Jmax Km CLR Sim124 Healthy 1 OCT2 Sim125 Healthy 10 OCT2 Sim126 Healthy 100 OCT2 Sim127 GFR30_60 1 OCT2 Sim128 GFR30_60 10 OCT2 Sim129 GFR30_ OCT2 Sim130 GFRlessthan_30 1 OCT2 Sim131 GFRlessthan_30 10 OCT2 Sim132 GFRlessthan_ OCT2 Sim133 Healthy 1 MATE1 Sim134 Healthy 10 MATE1 Sim135 Healthy 100 MATE1 Sim136 GFR30_60 1 MATE1 Sim137 GFR30_60 10 MATE1 Sim138 GFR30_ MATE1 Sim139 GFRlessthan_30 1 MATE1 Sim140 GFRlessthan_30 10 MATE1 Sim141 GFRlessthan_ MATE1 Ae (mg) AUC (mg/l*h) CL Cmax (mg/l) Tmax (h) fm (%) fe (%) 1.05E E E E E E E E E E E E E E E E E E E E E E E E E E E E E E E E E E E E E E E E E E E E E E E E E E E E E E E E E E E E E E E E R Inhibition factor ([I]/K i ) f u Fraction unbound J max Maximal transport velocity K M Affinity constant for transport CL R Renal clearance A e Amount excreted in urine AUC Area under the curve CL Total clearance C max Maximum concentration T max Time to maximum concentration f m fraction metabolized f e fraction excreted in urine
84 Supplementary Table 34. Effect of Renal Impairment (RI) and Fraction Unbound on the PK of Metformin in Females Sim Name Population fu CLR Sim16 Healthy 1 Sim151 Healthy 0.9 Sim152 Healthy 0.5 Sim153 Healthy 0.1 Sim17 GFR30_60 1 Sim154 GFR30_ Sim155 GFR30_ Sim156 GFR30_ Sim18 GFRlessthan_30 1 Sim157 GFRlessthan_ Sim158 GFRlessthan_ Sim159 GFRlessthan_ Ae (mg) AUC (mg/l*h) CL Cmax (mg/l) Tmax (h) fm (%) fe (%) E E E E E E E E E E E E E E E E E E E E E E E E E E E E E E f u Fraction unbound CL R Renal clearance A e Amount excreted in urine AUC Area under the curve CL Total clearance C max Maximum concentration T max Time to maximum concentration f m fraction metabolized f e fraction excreted in urine
85 Supplementary Table 35. Effect of Renal Impairment (RI) and Fraction Unbound on the PK of Metformin in Females with a Five-Fold Increase in OCT2/MATE1 Expression Sim Name Population fu CLR Ae (mg) AUC (mg/l*h) Sim196 Healthy 1 Sim197 Healthy 0.9 Sim198 Healthy 0.5 Sim199 Healthy 0.1 Sim200 GFR30_60 1 Sim201 GFR30_ Sim202 GFR30_ Sim203 GFR30_ Sim204 GFRlessthan_30 1 Sim205 GFRlessthan_ Sim206 GFRlessthan_ Sim207 GFRlessthan_ CL Cmax (mg/l) Tmax (h) fm (%) fe (%) E E E E E E E E E E E E E E E E E E E E E E E E E E E E E E E E E E E E f u Fraction unbound CL R Renal clearance A e Amount excreted in urine AUC Area under the curve CL Total clearance C max Maximum concentration T max Time to maximum concentration f m fraction metabolized f e fraction excreted in urine
86 Supplementary Table 36. Effect of Renal Impairment (RI) and Fraction Unbound on the PK of Metformin in Females with a Five-Fold Decrease in OCT2/MATE1 Expression Sim Name Population fu CLR Sim244 Healthy 1 Sim245 Healthy 0.9 Sim246 Healthy 0.5 Sim247 Healthy 0.1 Sim248 GFR30_60 1 Sim249 GFR30_ Sim250 GFR30_ Sim251 GFR30_ Sim252 GFRlessthan_30 1 Sim253 GFRlessthan_ Sim254 GFRlessthan_ Sim255 GFRlessthan_ Ae (mg) AUC (mg/l*h) CL Cmax (mg/l) Tmax (h) fm (%) fe (%) E E E E E E E E E E E E E E E E E E E E E E E E E f u Fraction unbound CL R Renal clearance A e Amount excreted in urine AUC Area under the curve CL Total clearance C max Maximum concentration T max Time to maximum concentration f m fraction metabolized f e fraction excreted in urine
87 Supplementary Table 37. Effect of Renal Impairment (RI) and Fraction Unbound on the PK of Metformin in Females with a Two-Fold Increase in OCT2/MATE1 Expression Sim Name Population fu CLR Sim172 Healthy 1 Sim173 Healthy 0.9 Sim174 Healthy 0.5 Sim175 Healthy 0.1 Sim176 GFR30_60 1 Sim177 GFR30_ Sim178 GFR30_ Sim179 GFR30_ Sim180 GFRlessthan_30 1 Sim181 GFRlessthan_ Sim182 GFRlessthan_ Sim183 GFRlessthan_ Ae (mg) AUC (mg/l*h) CL Cmax (mg/l) Tmax (h) fm (%) fe (%) E E E E E E E E E E E E E E E E E E E E E E E E E E E E E E E E E E f u Fraction unbound CL R Renal clearance A e Amount excreted in urine AUC Area under the curve CL Total clearance C max Maximum concentration T max Time to maximum concentration f m fraction metabolized f e fraction excreted in urine
88 Supplementary Table 38. Effect of Renal Impairment (RI) and Fraction Unbound on the PK of Metformin in Females with a Two-Fold Decrease in OCT2/MATE1 Expression Sim Name Population fu CLR Sim220 Healthy 1 Sim221 Healthy 0.9 Sim222 Healthy 0.5 Sim223 Healthy 0.1 Sim224 GFR30_60 1 Sim225 GFR30_ Sim226 GFR30_ Sim227 GFR30_ Sim228 GFRlessthan_30 1 Sim229 GFRlessthan_ Sim230 GFRlessthan_ Sim231 GFRlessthan_ Ae (mg) AUC (mg/l*h) CL Cmax (mg/l) Tmax (h) fm (%) fe (%) E E E E E E E E E E E E E E E E E E E E E E E E E E E E f u Fraction unbound CL R Renal clearance A e Amount excreted in urine AUC Area under the curve CL Total clearance C max Maximum concentration T max Time to maximum concentration f m fraction metabolized f e fraction excreted in urine
89 Supplementary Table 39. Comparison of predicted and observed values for PK parameters for Metformin Table S39. Comparison of predicted and observed values for PK parameters for Metformin parameter δ Σδall ΣδR tmax SD Cmax SD AUC SD CLR SD Ae SD tmax Cmax AUC CLR Ae Ranking by Most Improved Healthy h mg/l mg*h/l L/h mg Observed Sim Healthy Volunteers Σδall ΣδR Moderate RI Observed Sim GFR OCT2 20% OCT2 R OCT1 10% OCT2 20% OCT2 R OCT2 20% OCT1 10% OCT1 10% OCT2 R OCT2 20% OCT1 10% OCT2 R Σδall ΣδR Severe RI Observed Sim GFR less than OCT2 20% OCT2 R OCT1 10% OCT2 20% OCT2 R OCT2 20% OCT1 10% OCT1 10% OCT2 R OCT2 20% OCT1 10% OCT2 R CL R Renal clearance A e Amount excreted in urine AUC Area under the curve C max Maximum concentration T max Time to maximum concentration SD Standard deviation
90 S40. Comparison of predicted and observed values for PK parameters for Ranitidine Table S40. Comparison of predicted and observed values for PK parameters for Ranitidine Dose AUC SD CL SD CLR SD Ae SD AUC CL CLR Ae δ Σδall ΣδR Healthy mg mg*h/l L/h L/h mg Ranking by Most Improved Observed Sim Healthy Volunteers Observed Sim Healthy Volunteers Σδall ΣδR Moderate RI Observed Sim GFR OCT2 20% OAT3 10% OCT2 R OAT3 R OATP1B3 R OCT2 20% OAT3 10% OCT2 20% OCT2 R OCT2 20% OAT3 R OCT2 20% OATP1B3 R OAT3 10% OCT2 R OAT3 10% OAT3 R OAT3 10% OATP1B3 R OCT2 R2 OAT3 R OCT2 R2 OATP1B3 R OAT3 R4 OATP1B3 R OCT2 20% OAT3 10% OCT2 R OCT2 20% OAT3 10% OAT3 R OCT2 20% OAT3 10% OATP1B3 R OCT2 20% OCT2 R2 OAT3 R OCT2 20% OCT2 R2 OATP1B3 R1 OCT2 20% OAT3 R4 OATP1B3 R
91 OAT3 10% OCT2 R2 OAT3 R OAT3 10% OCT2 R2 OATP1B3 R1 OAT3 10% OAT3 R4 OATP1B3 R1 OCT2 R2 OAT3 R4 OATP1B3 R1 OCT2 20% OAT3 10% OCT2 R2 OAT3 R4 OCT2 20% OAT3 10% OCT2 R2 OATP1B3 R1 OCT2 20% OAT3 10% OAT3 R4 OATP1B3 R1 OCT2 20% OCT2 R2 OAT3 R4 OATP1B3 R1 OAT3 10% OCT2 R2 OAT3 R4 OATP1B3 R1 OCT2 20% OAT3 10% OCT2 R2 OAT3 R4 OATP1B3 R1 Σδall ΣδR Severe RI Observed Sim GFR less than OCT2 20% OAT3 10% OCT2 R OAT3 R OATP1B3 R OCT2 20% OAT3 10% OCT2 20% OCT2 R OCT2 20% OAT3 R OCT2 20% OATP1B3 R OAT3 10% OCT2 R OAT3 10% OAT3 R OAT3 10% OATP1B3 R OCT2 R2 OAT3 R OCT2 R2 OATP1B3 R OAT3 R4 OATP1B3 R OCT2 20% OAT3 10% OCT2 R2 OCT2 20% OAT3 10% OAT3 R4 OCT2 20% OAT3 10% OATP1B3 R
92 3 OCT2 20% OCT2 R2 OAT3 R Σδall ΣδR OCT2 20% OCT2 R2 OATP1B3 R OCT2 20% OAT3 R4 OATP1B3 R OAT3 10% OCT2 R2 OAT3 R OAT3 10% OCT2 R2 OATP1B3 R1 OAT3 10% OAT3 R4 OATP1B3 R1 OCT2 R2 OAT3 R4 OATP1B3 R1 OCT2 20% OAT3 10% OCT2 R2 OAT3 R4 OCT2 20% OAT3 10% OCT2 R2 OATP1B3 R1 OCT2 20% OAT3 10% OAT3 R4 OATP1B3 R1 OCT2 20% OCT2 R2 OAT3 R4 OATP1B3 R1 OAT3 10% OCT2 R2 OAT3 R4 OATP1B3 R1 OCT2 20% OAT3 10% OCT2 R2 OAT3 R4 OATP1B3 R1 Observed Sim GFR less than OCT2 20% OAT3 10% OCT2 R OAT3 R OATP1B3 R OCT2 20% OAT3 10% OCT2 20% OCT2 R OCT2 20% OAT3 R OCT2 20% OATP1B3 R OAT3 10% OCT2 R OAT3 10% OAT3 R OAT3 10% OATP1B3 R OCT2 R2 OAT3 R OCT2 R2 OATP1B3 R OAT3 R4 OATP1B3 R
93 2 2 OCT2 20% OAT3 10% OCT2 R OCT2 20% OAT3 10% OAT3 R OCT2 20% OAT3 10% OATP1B3 R OCT2 20% OCT2 R2 OAT3 R OCT2 20% OCT2 R2 OATP1B3 R OCT2 20% OAT3 R4 OATP1B3 R OAT3 10% OCT2 R2 OAT3 R OAT3 10% OCT2 R2 OATP1B3 R1 OAT3 10% OAT3 R4 OATP1B3 R1 OCT2 R2 OAT3 R4 OATP1B3 R1 OCT2 20% OAT3 10% OCT2 R2 OAT3 R4 OCT2 20% OAT3 10% OCT2 R2 OATP1B3 R1 OCT2 20% OAT3 10% OAT3 R4 OATP1B3 R1 OCT2 20% OCT2 R2 OAT3 R4 OATP1B3 R1 OAT3 10% OCT2 R2 OAT3 R4 OATP1B3 R1 OCT2 20% OAT3 10% OCT2 R2 OAT3 R4 OATP1B3 R CL R Renal clearance CL Total clearance A e Amount excreted in urine AUC Area under the curve SD Standard deviation
94 Legends for Supplementary Figures: Supplementary Figure 1. Structure of a general PBPK model used to describe the kinetics of metformin (center) and associated nested permeabilitylimited liver (Perf, left) and mechanistic kidney (Mech KiM, right) models. Reprinted from Burt et al (2016) under the terms of the Creative Commons Attribution License (CC BY). Supplementary Figure 2. Effect of Renal Impairment (RI) and Inhibition on the Renal Clearance of Metformin in Males. Simulations were performed in Simcyp with Sim-Healthy Volunteers, Sim_RenalGFR_30-60 and Sim_RenalGFR_less_30 populations to represent GFR of 100, 50 and 10%, respectively. A dose of 2000 mg metformin was administered in a fasted state to an exclusively male population. Inhibition was incorporated through the parameter, R ([I]/K i ), which modified K M, J max and K M /J max for competitive, non-competitive and uncompetitive inhibition, respectively. R was varied from 0 to 100 to investigate varying levels of inhibition. Inhibition was applied to each transporter (OCT2/MATE1) separately. A-B competitive and uncompetitive inhibition of OCT2; C-D competitive and uncompetitive inhibition of MATE1. Each simulation included 10 trials with 10 subjects in each. Supplementary Figure 3. Effect of Renal Impairment (RI) and Fraction Unbound on the Renal Clearance of Metformin with Accompanying Inhibition of OCT2. Simulations were performed in Simcyp with Sim-Healthy Volunteers, Sim_RenalGFR_30-60 and Sim_RenalGFR_less_30 populations to represent GFR of 100, 50 and 10%, respectively. A dose of 2000 mg metformin was administered in a fasted state to an exclusively male population. Fraction unbound was varied from 0.1 to 1.0. R ([I]/K i ), which modified K M or J max for competitive and non-competitive, respectively. R was varied from 0 to 100 to investigate varying levels of inhibition. A-C, competitive inhibition; D-F, non-competitive inhibition. Each simulation included 10 trials with 10 subjects in each. Supplementary Figure 4. Effect of Renal Impairment (RI) and Fraction Unbound on the Renal Clearance of Metformin with Accompanying Inhibition of MATE1. Simulations were performed in Simcyp with Sim-Healthy Volunteers, Sim_RenalGFR_30-60 and Sim_RenalGFR_less_30 populations to represent GFR of 100, 50 and 10%, respectively. A dose of 2000 mg metformin was administered in a fasted state to an exclusively
95 male population. Fraction unbound was varied from 0.1 to 1.0. R ([I]/K i ), which modified K M or J max for competitive and non-competitive, respectively. R was varied from 0 to 100 to investigate varying levels of inhibition. A-C, competitive inhibition; D-F, non-competitive inhibition. Each simulation included 10 trials with 10 subjects in each. Supplementary Figure 5. Impact of Renal Impairment (RI) on the Dose Dependency of Metformin in Females. Simulations were performed in Simcyp with oral metformin at 500, 1250 and 2000 mg. Simulations were performed a female population with healthy and RI populations. Sim- Healthy Volunteers, Sim_RenalGFR_30-60 and Sim_RenalGFR_less_30 populations were used to represent GFR of 100, 50 and 10%, respectively. Each simulation included 10 trials with 10 subjects in each. Supplementary Figure 6. Impact of Renal Impairment (RI) and Drug Transporter Expression on the Renal Clearance of Metformin. Simulations were performed in Simcyp with Sim-Healthy Volunteers, Sim_RenalGFR_30-60 and Sim_RenalGFR_less_30 populations to represent GFR of 100, 50 and 10%, respectively. A dose of 2000 mg metformin was administered in a fasted state to an exclusively female population. Expression of OCT2 and MATE1 was changed by altering Jmax ±2- or ±5-fold. Each simulation included 10 trials with 10 subjects in each. Supplementary Figure 7. Effect of Renal Impairment (RI) and Inhibition on the Renal Clearance of Metformin in Females. Simulations were performed in Simcyp with Sim-Healthy Volunteers, Sim_RenalGFR_30-60 and Sim_RenalGFR_less_30 populations to represent GFR of 100, 50 and 10%, respectively. A dose of 2000 mg metformin was administered in a fasted state to an exclusively female population. Inhibition was incorporated through the parameter, R ([I]/Ki), which modified KM, J max and K M /J max for competitive, non-competitive and uncompetitive inhibition, respectively. R was varied from 0 to 100 to investigate varying levels of inhibition. A-C Competitive, non-competitive and uncompetitive inhibition of OCT2; D-F competitive, non-competitive and uncompetitive inhibition of MATE1. Each simulation included 10 trials with 10 subjects in each.
96 Supplementary Figure 8. Effect of Changes in Renal Impairment (RI) and Fraction Unbound on the Renal Clearance of Metformin with Varying Expression of OCT2 and MATE1 in Females. Simulations were performed in Simcyp with Sim-Healthy Volunteers, Sim_RenalGFR_30-60 and Sim_RenalGFR_less_30 populations to represent GFR of 100, 50 and 10%, respectively. A dose of 2000 mg metformin was administered in a fasted state to an exclusively female population. Fraction unbound was varied from 0.1 to 1.0. Expression of OCT2 and MATE1 was altered by increasing or decreasing J max 2 or 5 fold. A, original expression (J max ) of OCT2/MATE1; B/D, ± 2-fold expression (J max ) of OCT2/MATE1; C/E, ± 5- fold expression (J max ) of OCT2/MATE1. Each simulation included 10 trials with 10 subjects in each.
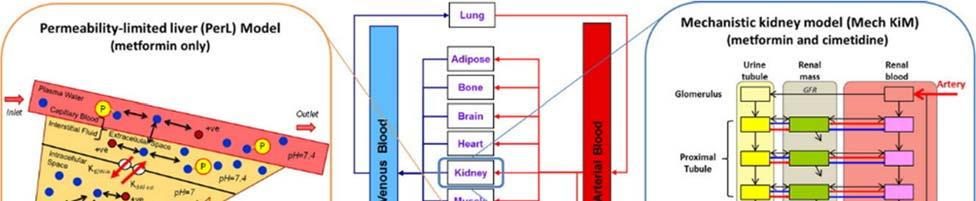
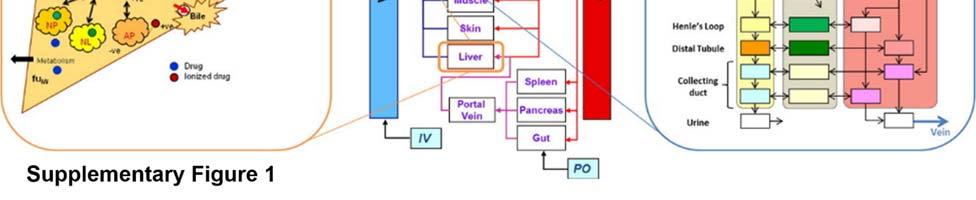
97 Supplementary Figure 1
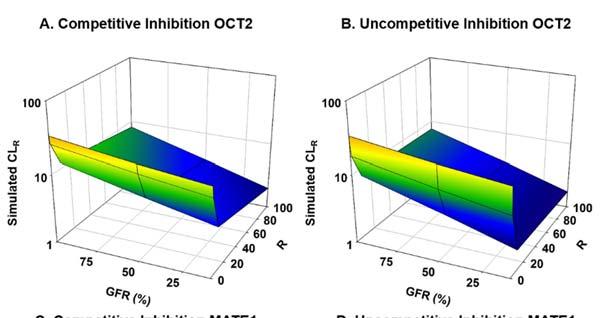
98 Supplementary Figure 2
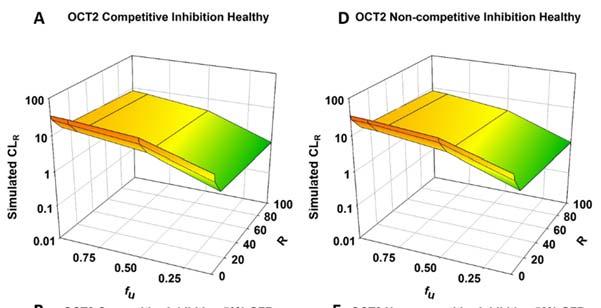
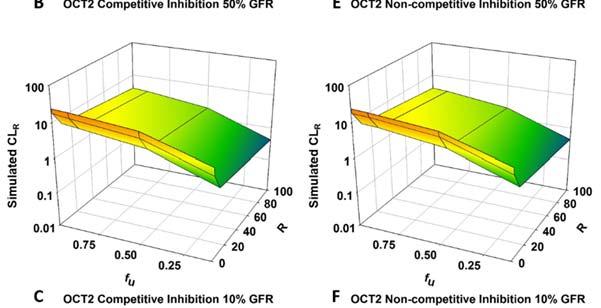
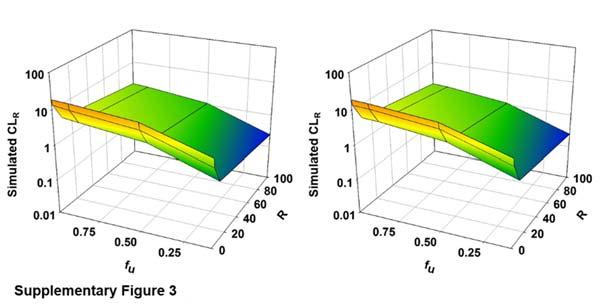
99 Supplementary Figure 3

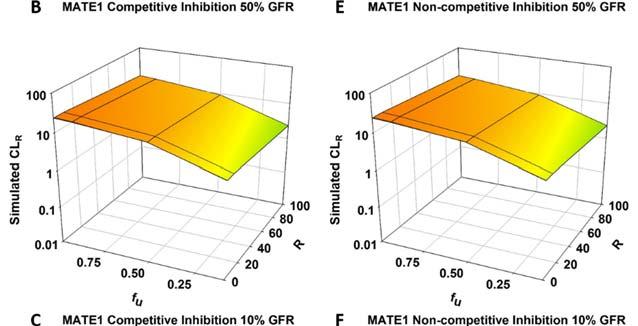
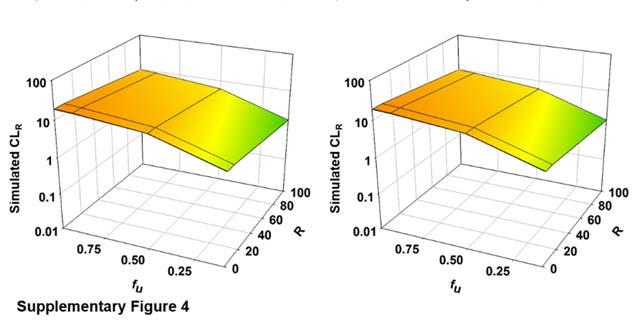
100 Supplementary Figure 4
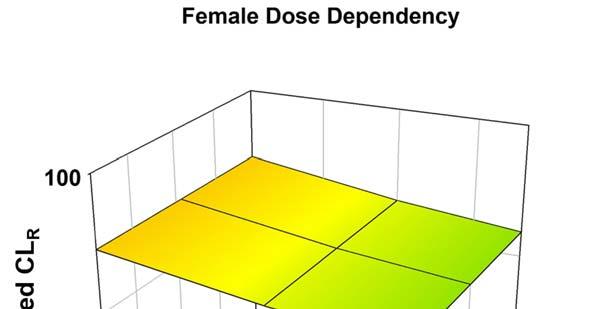
101 Supplementary Figure 5
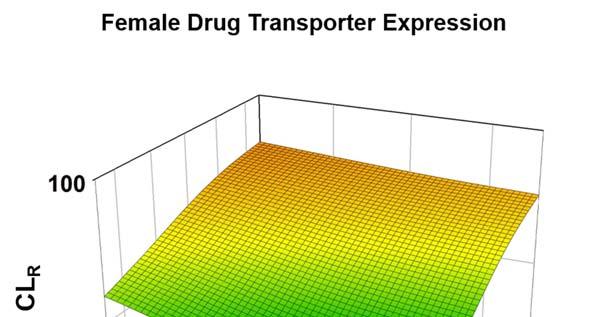
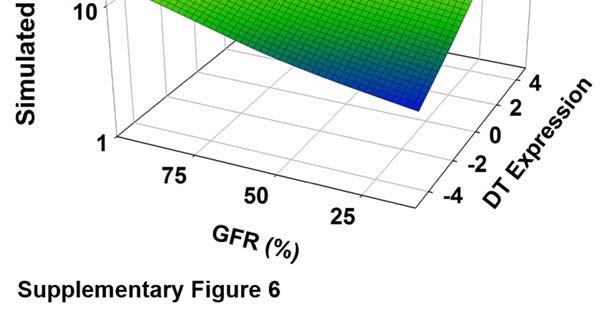
102 Supplementary Figure 6
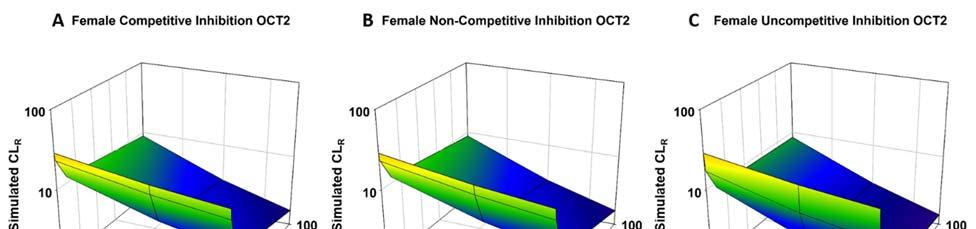
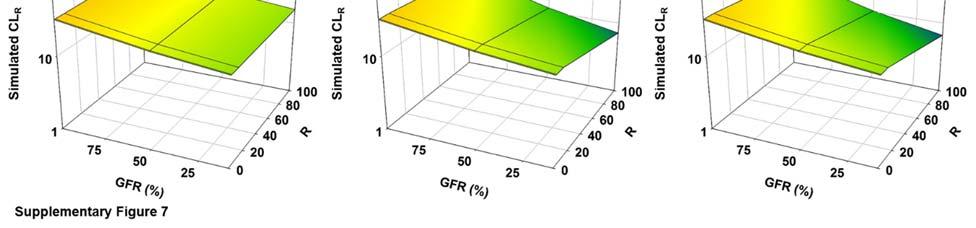
103 Supplementary Figure 7
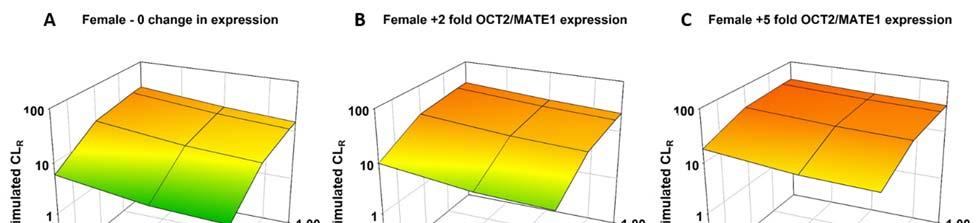
104 Supplementary Figure 8
MODULE PHARMACOKINETICS WRITTEN SUMMARY
 MODULE 2.6.4. PHARMACOKINETICS WRITTEN SUMMARY m2.6.4. Pharmacokinetics Written Summary 2013N179518_00 TABLE OF CONTENTS PAGE 1. BRIEF SUMMARY...4 2. METHODS OF ANALYSIS...5 3. ABSORPTION...6 4. DISTRIBUTION...7
Evaluation and Quantitative Prediction of Renal Transporter-Mediated Drug-Drug Interactions. Bo Feng, Ph.D. DDI 2017 June 19-21, 2017
 Evaluation and Quantitative Prediction of Renal Transporter-Mediated Drug-Drug Interactions Bo Feng, Ph.D. DDI 2017 June 19-21, 2017 Outline Background of renal transporters. Clinically observed transporter-mediated
PBPK modeling of renal impairment what is missing?
 PBPK modeling of renal impairment what is missing? Aleksandra Galetin Centre for Applied Pharmacokinetic Research, University of Manchester, UK Outline of the presentation Physiological changes in renal
PHA5128 Dose Optimization II Case Study I Spring 2013
 Silsamicin is an investigational compound being evaluated for its antimicrobial effect. The route of administration for this drug is via intravenous bolus. Approximately 99.9% of this drug is eliminated
General Principles of Pharmacology and Toxicology
 General Principles of Pharmacology and Toxicology Parisa Gazerani, Pharm D, PhD Assistant Professor Center for Sensory-Motor Interaction (SMI) Department of Health Science and Technology Aalborg University
Monica Edholm Medica Medic l a Pr oducts Agency
 EMA EFPIA workshop Break-out session no. 2 Case Study Title: M&S for dose adjustment in impaired patients M&S for dose adjustment in renally Monica Edholm MedicalProducts Agency Disclaimer: The views expressed
Proteomic Quantification of Kidney Transporters: Methodological Challenges, Interindividual Variability and Application in IVIVE
 Proteomic Quantification of Kidney Transporters: Methodological Challenges, Interindividual Variability and Application in IVIVE Bhagwat Prasad, Ph.D. University of Washington, Seattle, WA (bhagwat@uw.edu)
The Future of In Vitro Systems for the Assessment of Induction and Suppression of Enzymes and Transporters
 The Future of In Vitro Systems for the Assessment of Induction and Suppression of Enzymes and Transporters AAPS, San Diego November 6 th, 2014 Andrew Parkinson, XPD Consulting Lisa Almond, Simcyp-Certara
Renal Function. 1. Glomerular filtration 2. Active tubular secretion 3. Passive tubular reabsorption 4. Excretion
 59-291 Section 1, Lecture 5 Drug Excretion -most drugs are excreted in urine either as unchanged or drug metabolites Renal Function 1. Glomerular filtration 2. Active tubular secretion 3. Passive tubular
PHA Second Exam. Fall On my honor, I have neither given nor received unauthorized aid in doing this assignment.
 PHA 5127 Second Exam Fall 2012 On my honor, I have neither given nor received unauthorized aid in doing this assignment. Name Put all answers on the bubble sheet TOTAL /150 pts 1 Question Set I (True or
Current Approaches and Applications of Phenotyping Methods for Drug Metabolizing Enzymes and Transporters
 Current Approaches and Applications of Phenotyping Methods for Drug Metabolizing Enzymes and Transporters Uwe Fuhr, University Hospital Cologne 1 Definition Phenotyping is quantifying the in vivo activity
Evaluation of Proposed In Vivo Probe Substrates and Inhibitors for Phenotyping Transporter Activity in Humans
 Supplement Article Evaluation of Proposed In Vivo Probe Substrates and Inhibitors for Phenotyping Transporter Activity in Humans The Journal of Clinical Pharmacology (2016), 56(S7) S82 S98 C 2016, The
Effects of Renal Disease on Pharmacokinetics
 Effects of Renal Disease on Pharmacokinetics Juan J. L. Lertora, M.D., Ph.D. Director Clinical Pharmacology Program October 14, 2010 Office of Clinical Research Training and Medical Education National
PHA First Exam Fall 2003
 PHA 5127 First Exam Fall 2003 On my honor, I have neither given nor received unauthorized aid in doing this assignment. Name Question/Points 1. /14 pts 2. /6 pts 3. /15 pts 4. /12 pts 5. /20 pts 6. /10pts
RENAL SYSTEM 2 TRANSPORT PROPERTIES OF NEPHRON SEGMENTS Emma Jakoi, Ph.D.
 RENAL SYSTEM 2 TRANSPORT PROPERTIES OF NEPHRON SEGMENTS Emma Jakoi, Ph.D. Learning Objectives 1. Identify the region of the renal tubule in which reabsorption and secretion occur. 2. Describe the cellular
Basic Pharmacokinetics and Pharmacodynamics: An Integrated Textbook with Computer Simulations
 Basic Pharmacokinetics and Pharmacodynamics: An Integrated Textbook with Computer Simulations Rosenbaum, Sara E. ISBN-13: 9780470569061 Table of Contents 1 Introduction to Pharmacokinetics and Pharmacodynamics.
Strategy on Drug Transporter Investigation Why, How, Which & When. Jasminder Sahi
 Strategy on Drug Transporter Investigation Why, How, Which & When Jasminder Sahi Intestine Drug Absorption PEPT1 OATPs MCTs AE2 Epithelial Cell MCTs MRP3 Liver Excretion via Liver Kidney MRPs OATPs N PT1
Comparison Between the US FDA, Japan PMDA and EMA In Vitro DDI Guidance: Are we Close to Harmonization?
 Comparison Between the US FDA, Japan PMDA and EMA In Vitro DDI Guidance: Are we Close to Harmonization? Brian Ogilvie, Ph.D. VP Scientific Consulting XenoTech, LLC bogilvie@xenotechllc.com 14 Jun, 2018
Welcome to the webinar... We will begin shortly
 Welcome to the webinar... We will begin shortly Evaluation of Ketoconazole and Its Alternative Clinical CYP3A4/5 Inhibitors as Inhibitors of Drug Transporters: The In Vitro Effects of Ketoconazole, Ritonavir,
General Principles of Pharmacology and Toxicology
 General Principles of Pharmacology and Toxicology Parisa Gazerani, Pharm D, PhD Assistant Professor Center for Sensory-Motor Interaction (SMI) Department of Health Science and Technology Aalborg University
Take-Home Exam Distributed: October 19, 2012, at 2:30 p.m. Due: October 24, 2012, at 1:30 p.m.
 20.201 Take-Home Exam Distributed: October 19, 2012, at 2:30 p.m. Due: October 24, 2012, at 1:30 p.m. Directions: This take-home exam is to be completed without help from any other individual except Drs.
Abemaciclib Inhibits Renal Tubular Secretion Without Changing Glomerular Filtration Rate
 Abemaciclib Inhibits Renal Tubular Secretion Without Changing Glomerular Filtration Rate Jill C. Chappell 1, P. Kellie Turner 1, Y. Anne Pak 1, James Bacon 1, Alan Y. Chiang 1, Jane Royalty 2, Stephen
Transporters DDI-2018
 Transporters DDI-2018 Mark S. Warren, Ph.D. June 16, 2018 Senior Director of Assay Services DDI-2018: 21 st Conference on DDIs FDA guidance documents: A 21 year history 1997 2006 2012 2017 Each year, large
BASIC PHARMACOKINETICS
 BASIC PHARMACOKINETICS MOHSEN A. HEDAYA CRC Press Taylor & Francis Croup Boca Raton London New York CRC Press is an imprint of the Taylor & Francis Group, an informa business Table of Contents Chapter
PHA First Exam. Fall 2004
 PHA 5127 First Exam Fall 2004 On my honor, I have neither given nor received unauthorized aid in doing this assignment. Name Put all answers on the bubble sheet. If you need to comment or question a problem
PHA Second Exam. Fall On my honor, I have neither given nor received unauthorized aid in doing this assignment.
 PHA 5127 Second Exam Fall 2011 On my honor, I have neither given nor received unauthorized aid in doing this assignment. Name Put all answers on the bubble sheet TOTAL /200 pts 1 Question Set I (True or
Drug Dosing in Renal Insufficiency. Coralie Therese D. Dimacali, MD College of Medicine University of the Philippines Manila
 Drug Dosing in Renal Insufficiency Coralie Therese D. Dimacali, MD College of Medicine University of the Philippines Manila Declaration of Conflict of Interest For today s lecture on Drug Dosing in Renal
Caveat: Validation and Limitations of Phenotyping Methods for Drug Metabolizing Enzymes and Transporters
 Caveat: Validation and Limitations of Phenotyping Methods for Drug Metabolizing Enzymes and Transporters Uwe Fuhr, University Hospital Cologne 1 How to Safeguard that Metrics Reflect E/T Activity? in healthy
Effect of Ondansetron on Metformin Pharmacokinetics and Response in Healthy Subjects
 Effect of Ondansetron on Metformin Pharmacokinetics and Response in Healthy Subjects Qing Li, Hong Yang, Dong Guo, Taolan Zhang, James E. Polli, Honghao Zhou, Yan Shu Department of Pharmaceutical Sciences,
Impact of Substrate-Dependent Inhibition on Renal Organic Cation. Transporters hoct2 and hmate1/2-k-mediated Drug Transport and
 Impact of Substrate-Dependent Inhibition on Renal Organic Cation Transporters hoct2 and hmate1/2-k-mediated Drug Transport and Intracellular Accumulation Jia Yin, Haichuan Duan, and Joanne Wang Department
Evaluation of Drug-Drug Interactions FDA Perspective
 Evaluation of Drug-Drug Interactions FDA Perspective Kellie Schoolar Reynolds, Pharm.D. Deputy Director Division of Clinical Pharmacology IV Office of Clinical Pharmacology Office of Translational Sciences
Drug Interactions, from bench to bedside
 Drug Interactions, from bench to bedside Candidate to Market, The Paterson Institute for Cancer Research, Manchester, UK Michael Griffin PhD Overview of presentation To understand the importance of drug-drug
REVISITING THE PHARMACOKINETICS IN PATIENTS
 REVISITING THE PHARMACOKINETICS IN PATIENTS WITH IMPAIRED RENAL FUNCTION IN THE LIGHT OF THE LATEST FDA AND EMA GUIDELINES 3 RD CONFERENCE OF EUROPEAN PHARMACOLOGICAL SOCIETIES EUROPEAN COMPETITIVENESS
PHA Second Exam Fall On my honor, I have neither given nor received unauthorized aid in doing this assignment.
 PHA 5127 Second Exam Fall 2013 On my honor, I have neither given nor received unauthorized aid in doing this assignment. Name Question/Points Set I 20 pts Set II 20 pts Set III 20 pts Set IV 20 pts Set
Effects of Renal Disease on Pharmacokinetics October 8, 2015 Juan J. L. Lertora, M.D., Ph.D. Director Clinical Pharmacology Program
 Effects of Renal Disease on Pharmacokinetics October 8, 2015 Juan J. L. Lertora, M.D., Ph.D. Director Clinical Pharmacology Program `Office of Clinical Research Training and Medical Education National
One-Compartment Open Model: Intravenous Bolus Administration:
 One-Compartment Open Model: Intravenous Bolus Administration: Introduction The most common and most desirable route of drug administration is orally by mouth using tablets, capsules, or oral solutions.
Unit 2b: EXCRETION OF DRUGS. Ms.M.Gayathri Mpharm (PhD) Department of Pharmaceutics Krishna Teja Pharmacy college Subject code: 15R00603 (BPPK)
 Department of Pharmaceutics Krishna Teja Pharmacy college Subject code: 15R00603 (BPPK)") Unit 2b: EXCRETION OF DRUGS By Ms.M.Gayathri Mpharm (PhD) Department of Pharmaceutics Krishna Teja Pharmacy college Subject code: 15R00603 (BPPK) Excretion, along with metabolism and tissue redistribution,
Unit 2b: EXCRETION OF DRUGS By Ms.M.Gayathri Mpharm (PhD) Department of Pharmaceutics Krishna Teja Pharmacy college Subject code: 15R00603 (BPPK) Excretion, along with metabolism and tissue redistribution,
The MOLECULES of LIFE
 The MOLECULES of LIFE Physical and Chemical Principles Solutions Manual Prepared by James Fraser and Samuel Leachman Chapter 16 Principles of Enzyme Catalysis Problems True/False and Multiple Choice 1.
Renal Physiology. April, J. Mohan, PhD. Lecturer, Physiology Unit, Faculty of Medical Sciences, U.W.I., St Augustine.
 Renal Physiology April, 2011 J. Mohan, PhD. Lecturer, Physiology Unit, Faculty of Medical Sciences, U.W.I., St Augustine. Office : Room 105, Physiology Unit. References: Koeppen B.E. & Stanton B.A. (2010).
Physiologically-Based Simulation of Daclatasvir Pharmacokinetics With Antiretroviral Inducers and Inhibitors of Cytochrome P450 and Drug Transporters
 Physiologically-Based Simulation of Daclatasvir Pharmacokinetics With Antiretroviral Inducers and Inhibitors of Cytochrome P450 and Drug Transporters Qi Wang, Wenying Li, Ming Zheng, Timothy Eley, Frank
Current and Emerging Transporter Regulatory Themes in Drug Development: Relevance to Understanding PK/PD, DDIs, and Toxicity
 Current and Emerging Transporter Regulatory Themes in Drug Development: Relevance to Understanding PK/PD, DDIs, and Toxicity Maciej Zamek-Gliszczynski, Ph.D. 1940 s Probenecid & anion secretion 1950 s
EVALUATION OF DRUG-DRUG INTERACTION POTENTIAL BETWEEN SACUBITRIL/VALSARTAN (LCZ696) AND STATINS USING A PHYSIOLOGICALLY- BASED PHARMACOKINETIC MODEL
 AND STATINS USING A PHYSIOLOGICALLY- BASED PHARMACOKINETIC MODEL") Drug metabolism and Pharmacokinetics/PK Sciences EVALUATIN F DRUG-DRUG INTERACTIN PTENTIAL BETWEEN SACUBITRIL/VALSARTAN (LCZ696) AND STATINS USING A PHYSILGICALLY- BASED PHARMACKINETIC MDEL Imad Hanna,
Drug metabolism and Pharmacokinetics/PK Sciences EVALUATIN F DRUG-DRUG INTERACTIN PTENTIAL BETWEEN SACUBITRIL/VALSARTAN (LCZ696) AND STATINS USING A PHYSILGICALLY- BASED PHARMACKINETIC MDEL Imad Hanna,
PHA 5127 FINAL EXAM FALL On my honor, I have neither given nor received unauthorized aid in doing this assignment.
 PHA 5127 FINAL EXAM FALL 1997 On my honor, I have neither given nor received unauthorized aid in doing this assignment. Name Question Points 1. /14 pts 2. /10 pts 3. /8 pts 4 /8 pts 5. /12 pts 6. /8 pts
Strategies for Developing and Validating PBPK Models for Extrapolation to Unstudied Population
 Strategies for Developing and Validating PBPK Models for Extrapolation to Unstudied Population Nina Isoherranen Department of Pharmaceutics University of Washington Processes driving drug disposition are
Culture Hepatocytes in Human Plasma to Count the free Concentration of Drug in Evaluation of Drug-drug Interaction. Chuang Lu
 Culture Hepatocytes in Human Plasma to Count the free Concentration of Drug in Evaluation of Drug-drug nteraction Chuang Lu Millennium, The Takeda Oncology Company Cambridge, MA, USA DD 205, Seattle, 6/29/205
PHA Second Exam. Fall On my honor, I have neither given nor received unauthorized aid in doing this assignment.
 PHA 5127 Second Exam Fall 2010 On my honor, I have neither given nor received unauthorized aid in doing this assignment. Name Put all answers on the bubble sheet TOTAL /200 pts 1 Question Set I (True or
Renal Clearance. Dr. Eman El Eter
 Renal Clearance Dr. Eman El Eter Concept of clearance Clearance is the volume of plasma that is completely cleared of a substance each minute. Example: Renal clearance of Substance X is defined as the
Effects of Liver Disease on Pharmacokinetics
 Effects of Liver Disease on Pharmacokinetics Juan J.L. Lertora, M.D., Ph.D. Director Clinical Pharmacology Program October 31, 2013 National Institutes of Health Clinical Center 1 GOALS of Effects of Liver
In vitro substrate-dependent inhibition of OATP1B1 and its impact on DDI prediction
 SSX 3 rd Annual Conference (Oct 11, 2018) In vitro substrate-dependent inhibition of OATP1B1 and its impact on DDI prediction Yoshitane Nozaki, PhD DMPK Tsukuba Organic Anion Transporting Polypeptide (OATP)
Metformin: Mechanistic Absorption Modeling and IVIVC Development
 Metformin: Mechanistic Absorption Modeling and IVIVC Development Maziar Kakhi *, Ph.D. FDA Silver Spring, MD 20993 Maziar.kakhi@fda.hhs.gov Viera Lukacova, Ph.D. Simulations Plus Lancaster, CA 93534 viera@simulations-plus.com
** Accordingly GFR can be estimated by using one urine sample and do creatinine testing.
 This sheet includes the lecture and last year s exam. When a patient goes to a clinic, we order 2 tests: 1) kidney function test: in which we measure UREA and CREATININE levels, and electrolytes (Na+,
Regulation of renal drug transport under physiological and pathological conditions
 October 13, 2010 Regulation of renal drug transport under physiological and pathological conditions Rosalinde Masereeuw Radboud University Nijmegen Medical Centre Nijmegen Centre for Molecular Life Sciences
Modeling and predicting drug pharmacokinetics in patients with renal impairment
 For reprint orders, please contact reprints@expert-reviews.com Modeling and predicting drug pharmacokinetics in patients with renal impairment Expert Rev. Clin. Pharmacol. 4(2), 261 274 (2011) Karen Rowland
BIOL 2402 Renal Function
 BIOL 2402 Renal Function Dr. Chris Doumen Collin County Community College 1 Renal Clearance and GFR Refers to the volume of blood plasma from which a component is completely removed in one minute by all
Na + Transport 1 and 2 Linda Costanzo, Ph.D.
 Na + Transport 1 and 2 Linda Costanzo, Ph.D. OBJECTIVES: After studying this lecture, the student should understand: 1. The terminology applied to single nephron function, including the meaning of TF/P
Nonlinear Pharmacokinetics
 Nonlinear Pharmacokinetics Non linear pharmacokinetics: In some cases, the kinetics of a pharmacokinetic process change from predominantly first order to predominantly zero order with increasing dose or
Diuretic Agents Part-2. Assistant Prof. Dr. Najlaa Saadi PhD Pharmacology Faculty of Pharmacy University of Philadelphia
 Diuretic Agents Part-2 Assistant Prof. Dr. Najlaa Saadi PhD Pharmacology Faculty of Pharmacy University of Philadelphia Potassium-sparing diuretics The Ion transport pathways across the luminal and basolateral
Renal Impairment From Dettli to Guideline: What can we learn?
 Renal Impairment From Dettli to Guideline: What can we learn? SocraMetrics GmbH Mainzerhofplatz 14 99084 Erfurt phone: ++49-361-6020526 fax: ++49-361-6020525 e-mail: meinolf.wonnemann@socrametrics.de SocraMetrics
Pharmacokinetics One- compartment Open Model Lec:2
 22 Pharmacokinetics One- compartment Open Model Lec:2 Ali Y Ali BSc Pharmacy MSc Industrial Pharmaceutical Sciences Dept. of Pharmaceutics School of Pharmacy University of Sulaimani 1 Outline Introduction
Click to edit Master title style
 A Short Course in Pharmacokinetics Chris Town Research Pharmacokinetics Outline Pharmacokinetics - Definition Ideal Pharmacokinetic Parameters of a New Drug How do we optimize PK for new compounds Why
BCH 450 Biochemistry of Specialized Tissues
 BCH 450 Biochemistry of Specialized Tissues VII. Renal Structure, Function & Regulation Kidney Function 1. Regulate Extracellular fluid (ECF) (plasma and interstitial fluid) through formation of urine.
1. remove: waste products: urea, creatinine, and uric acid foreign chemicals: drugs, water soluble vitamins, and food additives, etc.
 Making Water! OR is it really Just Water Just Ask the Nephron!! Author: Patricia L. Ostlund ostlundp@faytechcc.edu (910) 678-9892 Fayetteville Technical Community College Fayetteville, NC 28303 Its just
Excretion of Drugs. Prof. Hanan Hagar Pharmacology Unit Medical College
 Excretion of Drugs Prof. Hanan Hagar Pharmacology Unit Medical College Excretion of Drugs By the end of this lecture, students should be able to! Identify main and minor routes of excretion including renal
Cryo Characterization Report (CCR)
") Human Cryopreserved Hepatocytes Lot number: HUM4061B Date: October 19, 2014 Cryo Characterization Report (CCR) Lot Overview Qualification Catalog Number Quantity Cryopreserved human hepatocytes, Qualyst
Human Cryopreserved Hepatocytes Lot number: HUM4061B Date: October 19, 2014 Cryo Characterization Report (CCR) Lot Overview Qualification Catalog Number Quantity Cryopreserved human hepatocytes, Qualyst
Use of PBPK in simulating drug concentrations in pediatric populations: Case studies of Midazolam and Gabapentin
 Use of PBPK in simulating drug concentrations in pediatric populations: Case studies of Midazolam and Gabapentin WORKSHOP ON MODELLING IN PAEDIATRIC MEDICINES April 2008 Viera Lukacova, Ph.D. Walter Woltosz,
Multiple Interactions of Cimetidine and Probenecid with Valaciclovir and Its Metabolite Acyclovir
 ANTIMICROBIAL AGENTS AND CHEMOTHERAPY, Feb. 2002, p. 458 463 Vol. 46, No. 2 0066-4804/02/$04.00 0 DOI: 10.1128/AAC.46.2.458 463.2002 Copyright 2002, American Society for Microbiology. All Rights Reserved.
Renal Disease and PK/PD. Anjay Rastogi MD PhD Division of Nephrology
 Renal Disease and PK/PD Anjay Rastogi MD PhD Division of Nephrology Drugs and Kidneys Kidney is one of the major organ of drug elimination from the human body Renal disease and dialysis alters the pharmacokinetics
Introduction. Acids, Bases and ph; a review
 0 P a g e Introduction In this sheet, we discuss acidbase balance in our body and the role of kidneys in its establishment. Arrangement of topics is different from that of the lecture, to assure consistency
Effect of Ondansetron on Metformin Pharmacokinetics and Response in Healthy Subjects
 Effect of Ondansetron on Metformin Pharmacokinetics and Response in Healthy Subjects Qing Li, Hong Yang, Dong Guo, Taolan Zhang, James E. Polli, Honghao Zhou, Yan Shu Department of Pharmaceutical Sciences,
You should know the T max for any substance that you use and for PAH ; T max = mg / min
 Tubular function - What is clearance? o clearance referred to the theoretical volume of plasma from which a substance is cleared ( cleaned ) over a period of time and so its unit would be ((ml/min)) -
Biopharmaceutics Lecture-11 & 12. Pharmacokinetics of oral absorption
 Biopharmaceutics Lecture-11 & 12 Pharmacokinetics of oral absorption The systemic drug absorption from the gastrointestinal (GI) tract or from any other extravascular site is dependent on 1. 2. 3. In the
Renal Excretion of Drugs
 Renal Excretion of Drugs 3 1 Objectives : 1 Identify main and minor routes of Excretion including renal elimination and biliary excretion 2 Describe its consequences on duration of drugs. For better understanding:
DRUG METABOLISM AND PHARMACOKINETICS (DMPK) Lena Gustavsson, H. Lundbeck A/S, November 2015
 Lena Gustavsson, H. Lundbeck A/S, November 2015") DRUG METABOLISM AND PHARMACOKINETICS (DMPK), H. Lundbeck A/S, LEGU@lundbeck.com November 2015 DMPK in Drug Discovery and Development Agenda Introduction Optimizing pharmacokinetic properties Absorption
DRUG METABOLISM AND PHARMACOKINETICS (DMPK), H. Lundbeck A/S, LEGU@lundbeck.com November 2015 DMPK in Drug Discovery and Development Agenda Introduction Optimizing pharmacokinetic properties Absorption
Drug elimination and Hepatic clearance Chapter 6
 Drug elimination and Hepatic clearance Chapter 6 DRUG ELIMINATION Drugs are removed from the body by various elimination processes. Drug elimination refers to the irreversible removal of drug from the
1. If the MTC is 100 ng/ml and the MEC is 0.12 ng/ml, which of the following dosing regimen(s) are in the therapeutic window?
 are in the therapeutic window?") Page 1 PHAR 750: Biopharmaceutics/Pharmacokinetics October 23, 2009 - Form 1 Name: Total 100 points Please choose the BEST answer of those provided. For numerical answers, choose none of the above if your
Page 1 PHAR 750: Biopharmaceutics/Pharmacokinetics October 23, 2009 - Form 1 Name: Total 100 points Please choose the BEST answer of those provided. For numerical answers, choose none of the above if your
UNIVERSITY OF THE WEST INDIES, ST AUGUSTINE
 UNIVERSITY OF THE WEST INDIES, ST AUGUSTINE FACULTY OF MEDICAL SCIENCES SCHOOL OF PHARMACY BACHELOR OF SCIENCE IN PHARMACY DEGREE COURSE SYLLABUS COURSE TITLE: COURSE CODE: BIOPHARMACEUTICS, NEW DRUG DELIVERY
Chapter-V Drug use in renal and hepatic disorders. BY Prof. C.Ramasamy, Head, Dept of Pharmacy Practice SRM College of Pharmacy, SRM University
 Chapter-V Drug use in renal and hepatic disorders. BY Prof. C.Ramasamy, Head, Dept of Pharmacy Practice SRM College of Pharmacy, SRM University Estimating renal function An accurate estimation of renal
Chapter 23. Composition and Properties of Urine
 Chapter 23 Composition and Properties of Urine Composition and Properties of Urine (1 of 2) urinalysis the examination of the physical and chemical properties of urine appearance - clear, almost colorless
Development of a Dynamic Physiologically Based Mechanistic Kidney Model to Predict Renal Clearance
 Citation: CPT Pharmacometrics Syst. Pharmacol. (2018) 7, 593 602; doi:10.1002/psp4.12321 ARTICLE Development of a Dynamic Physiologically Based Mechanistic Kidney Model to Predict Renal Clearance Weize
Functional morphology of kidneys Clearance
 Functional morphology of kidneys Clearance Assoc. Prof. MUDr. Markéta Bébarová, Ph.D. Department of Physiology Faculty of Medicine, Masaryk University This presentation includes only the most important
Ch 19: The Kidneys. Functional unit of kidneys:?? Developed by John Gallagher, MS, DVM
 Ch 19: The Kidneys Homeostatic regulation of ECF volume and BP Osmolarity 290 mosm Ion balance Na+ and K+, etc. ph (acid-base balance Excretion of wastes & foreign substances Hormone production EPO Renin
MOLECULAR SIZE, ELECTRICAL CHARGE, AND SHAPE DETERMINE THE FILTERABILITY OF SOLUTES ACROSS THE GLOMERULAR FILTRATION BARRIER
 MOLECULAR SIZE, ELECTRICAL CHARGE, AND SHAPE DETERMINE THE FILTERABILITY OF SOLUTES ACROSS THE GLOMERULAR FILTRATION BARRIER The glomerular filtration barrier consists of three elements: (1) endothelial
Basic Concepts in Pharmacokinetics. Leon Aarons Manchester Pharmacy School University of Manchester
 Basic Concepts in Pharmacokinetics Leon Aarons Manchester Pharmacy School University of Manchester Objectives 1. Define pharmacokinetics 2. Describe absorption 3. Describe distribution 4. Describe elimination
Chapter 2: Identification and Care of Patients With CKD
 Chapter 2: Identification and Care of Patients With CKD Over half of patients in the Medicare 5% sample (aged 65 and older) had at least one of three diagnosed chronic conditions chronic kidney disease
NORMAL POTASSIUM DISTRIBUTION AND BALANCE
 NORMAL POTASSIUM DISTRIBUTION AND BALANCE 98% of body potassium is contained within cells, principally muscle cells, and is readily exchangeable. Only 2% is in ECF. Daily intake exceeds the amount in ECF.
Renal Function and Associated Laboratory Tests
 Renal Function and Associated Laboratory Tests Contents Glomerular Filtration Rate (GFR)... 2 Cockroft-Gault Calculation of Creatinine Clearance... 3 Blood Urea Nitrogen (BUN) to Serum Creatinine (SCr)
Basic Concepts of TDM
 TDM Lecture 1 5 th stage What is TDM? Basic Concepts of TDM Therapeutic drug monitoring (TDM) is a branch of clinical pharmacology that specializes in the measurement of medication concentrations in blood.
Biopharmaceutics. Tips Worth Tweeting. Contributor: Sandra Earle
 Biopharmaceutics C H A P T E R 2 Contributor: Sandra Earle The physiochemical properties of drugs determine how they will move and interact with the body. By understanding a few principles, predictions
What Can Be Learned from Recent New Drug Applications? A Systematic Review of Drug
 Title What Can Be Learned from Recent New Drug Applications? A Systematic Review of Drug Interaction Data for Drugs Approved by the U.S. FDA in 2015 Jingjing Yu, Zhu Zhou, Katie H. Owens, Tasha K. Ritchie,
Quantitative protein estimation of Urine
 Quantitative protein estimation of Urine 1 In a healthy renal and urinary tract system, the urine contains no protein or only trace amounts. The presence of increased amounts of protein in the urine can
Pharmacokinetics of Drugs. Assistant Prof. Dr. Najlaa Saadi PhD Pharmacology Faculty of Pharmacy University of Philadelphia
 Pharmacokinetics of Drugs Assistant Prof. Dr. Najlaa Saadi PhD Pharmacology Faculty of Pharmacy University of Philadelphia Absorption Is the transfer of a drug from its site of administration to the bloodstream.
RENAL TUBULAR ACIDOSIS An Overview
 RENAL TUBULAR ACIDOSIS An Overview UNIVERSITY OF PNG SCHOOL OF MEDICINE AND HEALTH SCIENCES DISCIPLINE OF BIOCHEMISTRY & MOLECULAR BIOLOGY CLINICAL BIOCHEMISTRY PBL MBBS IV VJ. Temple 1 What is Renal Tubular
LECTURE 25: FILTRATION AND CLEARANCE NEPHRON FILTRATION
 LECTURE 25: FILTRATION AND CLEARANCE NEPHRON FILTRATION 1. Everything in the plasma is filtered except large proteins and red blood cells. The filtrate in Bowman s capsule is an isosmotic fluid that is
Stable transfected HEK293-OATP cells for transporter analysis A model system for the assay of drug uptake.
 Stable transfected HEK293-OATP cells for transporter analysis A model system for the assay of drug uptake. PRIMACYT Cell Culture Technology GmbH, Hagenower Str. 73, D-19061 Schwerin, Germany E-mail: info@primacyt.com,
Understanding the Mechanisms to Maintain Glucose
 n posttest n Understanding the Mechanisms to Maintain Glucose Homeostasis: A Review for Managed Care Instructions After reading Understanding the Mechanisms to Maintain Glucose Homeostasis: A Review for
Collin College. BIOL Anatomy & Physiology. Urinary System. Summary of Glomerular Filtrate
 Collin College BIOL. 2402 Anatomy & Physiology Urinary System 1 Summary of Glomerular Filtrate Glomerular filtration produces fluid similar to plasma without proteins GFR ~ 125 ml per min If nothing else
Dr.Nahid Osman Ahmed 1
 1 ILOS By the end of the lecture you should be able to Identify : Functions of the kidney and nephrons Signs and symptoms of AKI Risk factors to AKI Treatment alternatives 2 Acute kidney injury (AKI),
Evaluation of the Cockroft Gault, Jelliffe and Wright formulae in estimating renal function in elderly cancer patients
 Original article Annals of Oncology 15: 291 295, 2004 DOI: 10.1093/annonc/mdh079 Evaluation of the Cockroft Gault, Jelliffe and Wright formulae in estimating renal function in elderly cancer patients G.
Reduction of metformin renal tubular secretion by cimetidine in man
 Br. J. clin. Pharmac. (1987), 23, 545-551 Reduction of metformin renal tubular secretion by cimetidine in man A. SOMOGYI, C. STOCKLEY, J. KEAL, P. ROLAN & F. BOCHNER Department of Clinical and Experimental