Lincoln University Digital Thesis
|
|
|
- Ferdinand McGee
- 5 years ago
- Views:
Transcription

1 Lincoln University Digital Thesis Copyright Statement The digital copy of this thesis is protected by the Copyright Act 1994 (New Zealand). This thesis may be consulted by you, provided you comply with the provisions of the Act and the following conditions of use: you will use the copy only for the purposes of research or private study you will recognise the author's right to be identified as the author of the thesis and due acknowledgement will be made to the author where appropriate you will obtain the author's permission before publishing any material from the thesis.
2 Longitudinal in vivo monitoring of the neuropathology in ovine neuronal ceroid lipofuscinoses A thesis submitted in partial fulfilment of the requirements for the Degree of Doctor of Philosophy at Lincoln University by Katharina Natalie Russell Lincoln University 2017
3 Abstract of a thesis submitted in partial fulfilment of the requirements for the Degree of Doctor of Philosophy. Abstract Longitudinal in vivo monitoring of the neuropathology in ovine neuronal ceroid lipofuscinoses by Katharina Natalie Russell Batten disease or neuronal ceroid lipofuscinoses (NCLs) is one of the most common reasons for childhood dementia, characterized by brain atrophy, blindness, mental decline and premature death. Although animal model neurological research is traditionally conducted using small rodents, large animal models are becoming more popular for several reasons. Longitudinal monitoring of disease progression and individual variations are essential in the development of translational medicine and whereas small rodents have relatively short life spans and different brain structures compared with humans, sheep provide an excellent model for long-term studies of diseases and their treatment. Three naturally occurring ovine models are currently being utilised to increase knowledge about different types of NCL and to aid in development of treatment strategies for translation to humans. These sheep models include a CLN5 Borderdale, a CLN6 South Hampshire and a CLN6 Merino model. This thesis contains investigations of techniques for longitudinal in vivo monitoring that can be correlated with the progression of neuropathological events in all three ovine NCL models, both in the natural progression of the diseases and in trials of potential therapeutic regimes. Previous studies have described the neuropathological development of disease in the CLN5 Borderdale and the CLN6 South Hampshire models. In the present study similar investigations were conducted with the CLN6 Merino model, and the three ovine models compared. The general development of neuropathology in CLN6 Merino sheep follows that of the other two models. Common themes are neuronal loss from the cerebral cortex that proceeds in a regional pattern, with neuroinflammation, neurogenesis and ubiquitous accumulation of storage material within the cells. Immunohistochemistry indicated possible cross-regulation between the CLN5 and CLN6 proteins. In vivo techniques are essential in the monitoring of progressive diseases such as the NCLs. Neuroimaging through computed tomography (CT) and magnetic resonance imaging (MRI) are I
4 suitable tools to describe neuropathological changes without the need to sacrifice animals. Here, current techniques and protocols for CT scanning in ovine NCL research were reviewed and improved. The congruence of brain size and intracranial volume (ICV) in ovine NCL was established and techniques for the monitoring of brain size in therapeutic trials were validated and correlated with neuropathological changes. Furthermore, 3-dimensional reconstruction was used to monitor regionality of the cortical changes and this could be correlated with findings from post examination. CT based surgery planning was used to improve accuracy of intracereboventricular gene therapy delivery and reduce duration of the surgical procedure. Pilot studies on the use of MRI as a longitudinal in vivo monitoring modality in ovine NCL research were conducted and these indicated that MRI will yield enhanced detail compared with CT and that MRI measurements can be closely correlated with the neuropathological changes observed at post mortem examination. However, some specific technical issues were identified and will need to be addressed in the future. These include image quality, fit of templates and an important need to establish ovine-specific image acquisition protocols. Blindness in ovine NCL results from atrophy of photoreceptor cells in the retina as well as changes in the central visual pathways. Treatment should aim not only to treat the atrophy of the brain, but also to prevent or halt the development of blindness. Previous trials have indicated the need for ocular delivery of therapy to achieve this. As for neurodegeneration, in vivo monitoring of retinal pathology is essential for the longitudinal assessment of treatment efficacy. Here, protocols were established for the use of repeated electroretinography (ERG) to monitor the development of blindness in the CLN5 Borderdale and the CLN6 South Hampshire models. The results show that ERG is an invaluable tool for monitoring the progression of retinal degeneration in ovine NCL. Furthermore, it was established that the course of development of retinal changes differs between the two ovine models that were investigated. The measurements enabled some degree of differentiation between the retinal and central components of the blindness in ovine NCL. Finally, it was shown that the in vivo monitoring tools established throughout the studies described in this thesis are invaluable for the assessment of treatment efficacy in gene therapy trials for ovine NCL. The measures evaluated here were shown to correspond with other clinical measures of treatment efficacy, such as behavioural observations, maze-testing and neuropathology. Key words: Neuronal ceroid lipofuscinosis, Batten disease, lysosomal storage disease, large animal models, sheep, neuroimaging, neurodegeneration, neuroinflammation, gene therapy, computed tomography, magnetic resonance imaging, electroretinography, in vivo monitoring. II
5 DECLARATION PRESENTATIONS FROM THIS THESIS Russell KN, Mitchell NL, Wellby MP, Melzer TR, Barrell GK & Palmer DN (2017). Longitudinal in vivo monitoring of disease progression and viral mediated gene therapy in ovine Batten disease. 21st ESGLD Workshop September 2017, Ecully (Lyon), France. p 33. Russell KN, Mitchell NL, Barrell GK & Palmer DN (2017). Longitudinal monitoring of brain development in ovine NCL. Proceedings of the Scientific Meetings of the Health Research Society of Canterbury. p 130 (1459) 80. Russell KN, Mitchell NL, Wellby MP, Barrell GK & Palmer DN (2016). In vivo monitoring of viral mediated gene injection therapy in ovine Batten disease. Proceedings of the 34th International Australasian Winter Conference on Brain Research. p 48. Russell KN, Anderson NG & Palmer DN (2015). Improving longitudinal biomarkers of ovine Batten disease: Neuroimaging and ventricular enlargement in sheep. Proceedings of the 33rd International Australasian Winter Conference on Brain Research. p 74. STATEMENT OF CANDIDATE CONTRIBUTION The data presented in this thesis are original work of the author and do not incorporate material that has been submitted for another degree at any University, except where specifically stated. Nevertheless, as the work described in this thesis is part of the ovine NCL research project at Lincoln University and/or BARN (Batten Animal Research Network), there are collaborative aspects. Merino sheep brains and MRI data were supplied by Assoc. Prof Imke Tammen from the Sydney University, Sydney, AUS. MRI analysis was performed in close collaboration with Dr Tracy Melzer at the New Zealand Brain Research Institute and University of Otago, Christchurch, NZ. The gene therapy trials were led by Dr Nadia Mitchell, University of Otago, at Lincoln University. The data of behavioural observations were provided by Martin Wellby and Dr Nadia Mitchell. III
6 ACKNOWLEDGEMENTS First and foremost I would like to wholeheartedly thank my two supervisors, Professor David Palmer and Associate Professor Graham Barrell. Dave, thank you for taking me on in the first place, I imagine not many PhD positions are being offered in the staff club, and thank you for believing in me all the way through. Your wealth of knowledge and passion for this research is always been an inspiration. Thank you for a good mix of encouragement, friendship and critical comments every time I would try to go the easy way, I would not have gotten to this point without you. Graham, thank you for always being there, even if I had been slack at keeping you up to date with my work. Thank you for your critical eye and your trust in my abilities, and for teaching me surgeries, words I did not know before and how to be a better researcher. Nadia (or Dr Nadia Mitchell to be precise), a million thanks to you for all the little things and all the big ones, for your friendship, for teaching me all the lab-stuff and for helping me with all sorts from trouble shooting my immunohistochemistry to chasing sheep. It has always been a pleasure and inspiration to work with you, and your encouragement has made this journey a lot more fun. Martin Wellby, thank you so much for always being there with a good idea, advice or a helping hand, a lot of things would not be possible around this place if it was not for you. Thank you to all the people at Lincoln University that have helped me throughout the years. Thanks to the staff at JML for looking after my sheep and for helping me with all the work that comes with them and thanks for the numerous people who have helped me with the CT scanning, ERG and image analysis. Also thanks to all the people in RFH that have been supportive and encouraging all the way through and always have supplied good tearoom banter. I would like to thank all the collaborators and advisors I have collected outside of Lincoln University though the last four years. Dr Tracy Melzer, thank you for all your time and effort, for you enthusiasm when it comes to sneaking sheep into the MRI scanner on a Saturday afternoon and thank you for your help with all the MRI things I did not understand. Associate Professor Imke Tammen, thank you for hosting me in Sydney and for letting me take your brains and thank you for your friendship and advice, a big part of this thesis could not have happened without you. Dr Nigel Anderson, thank you for opening the doors into the radiology and med-tech world for me, a lot of good things have come from that already, and who knows what will happen next? I am grateful for the support from the MARS bioimaging group, who have funded my studentship through most of this PhD. Furthermore I would like to acknowledged the travel grants from the IV
7 Neurological Foundation that have enabled me to attend the Australasian Winter Conference on Brain Research twice and the funding from the European Study Group of Lysosomal Storage Diseases who supported my travel to the meeting in Lyon. To my friends, thank you to have shared some of the way or all of this crazy journey with me, you have all done your part to get me to this point. Thank you to all of my flatmates that had to put up with all my ups and downs. Kathryn (again, Dr Kathryn Wigley to be precise), thank you for being my stable and lasting relationship through the entire time, thank you for coffees, chocolate, lunches, gin, short runs, long runs, and all the hours of solving the problems of the world. Thank you to Signe Clasen, Maria Gohr and Stine Daetz for putting up with me being so far away and still sending me your love and support, it means the world to me. Thank you to my two sets of New Zealand parents, Colin and Lorraine Pettigrew and Kerry and Carol O Connell, and my New Zealand siblings David Williams and Line Ulrich Ferriman, who have taken me on, looked after me and given me the feeling of belonging in a place so far away from home. Last but anything else but least, I would like to thank my family. Your love and support is incredible, not only though the last four years but through anything I have come up with so far. There is no way I would be at this point today if it had not been for you. Thank you for all your very valid input and different perspectives on whatever thing needs to be discussed and thank you for always believing in me. You have done very well. V
8 TABLE OF CONTENTS Abstract... i Declaration... iii Presentations from this thesis... iii Statement of candidate contribution... iii Acknowledgements... iv Table of contents... vi List of figures... x List of tables... xi List of abbreviations... xii 1 Introduction Large animal models for translational research of genetic and neurodegenerative diseases General features of the neuronal ceroid lipofuscinoses Overview Classification Accumulation of storage material Selective neuronal loss Neuroinflammation Neurogenesis Blindness CLN5 disease Human CLN5 disease Animal models of CLN5 disease CLN5 gene, mutations and gene product CLN6 disease Human CLN6 disease Animal models of CLN6 disease CLN6 gene, mutations and gene product Current strategies of therapy for the NCLs Enzyme replacement therapies Gene therapies Experimental rationale Research aims and objectives General methods Animals VI
9 2.1.1 Breeding regimes Genotyping Statistics Neuropathology in CLN6 affected Merino sheep Introduction Aims and objectives Materials and methods Tissue collection Histology Immunohistochemistry Microscopy Brain weight data Statistical analyses Results Brain weights and general development Cortical thinning White matter changes Glial activation Neurogenesis CLN5 and CLN6 expression Fluorescent storage material Discussion Conclusion CT Scanning in NCL sheep models Introduction Brain and intracranial volume changes Tissue density and its translation to radiodensity Aim and Objectives Materials and methods Identifying Hounsfield units of sheep brain tissue and CSF on historical data Comparing CT-based ICV and water displacement volume of brains and measuring bone thickness on CT scans Quantitative longitudinal monitoring of changes of ICV and cerebroventricular volume in NCL affected sheep and control animals Statistical analyses Results Radiodensity of brain tissue and CSF spaces Volumetric measurement by CT and water displacement VII
10 4.4.3 ICV and ventricular volume measurements Discussion Conclusion Electroretinography and fundus photography in ovine NCL Introduction Aim and objective Materials and methods Animals Electroretinography Data processing and statistical analysis Results Fundus photography Electroretinography Discussion Conclusion Pilot study for longitudinal magnetic resonance imaging in ovine NCL Introduction Aims and Objectives Materials and methods MRI studies conducted at the University of Sydney MRI study conducted at the New Zealand Brain Research Institute Image analysis Statistical analysis Results Sydney study NZBRI study Discussion Conclusion Applied methods for longitudinal in vivo monitoring of gene therapy trials Introduction Aim and objectives Materials and Methods Animals and viral vectors Surgical procedures and CT guided trajectory planning Longitudinal monitoring of intracranial volume Electroretinography Statistical analysis Results VIII
11 7.4.1 Extension of lifespan CT guided trajectory planning Intracranial volume in treated animals compared with untreated controls Electroretinography Discussion Conclusion General discussion Summary of findings Correlation of neuropathology, longitudinal observations and clinical signs in three forms of ovine NCL Longitudinal monitoring and treatment trials Statistical consideration Future direction Imaging Vision Large animal models in translational research Conclusion References IX
12 LIST OF FIGURES Figure 3.1 Anatomy of the normal sheep brain 26 Figure 3.2 Quantitative assessment of cortical thinning in CLN6 Merino sheep 32 Figure 3.3 Cortical atrophy in CLN6 -/- Merino sheep 33 Figure 3.4 GFAP expression in CLN6 -/- Merino sheep 35 Figure 3.5 Astrocytic activation in brains of CLN6 affected Merino sheep and unaffected control animals 36 Figure 3.6 Activation of microglia in brains of CLN6 affected Merino sheep and unaffected control animals 38 Figure 3.7 GSB4 expression in CLN6 -/- Merino sheep 39 Figure 3.8 PSA-NCAM expression in CLN6 affected animals 40 Figure 3.9 CLN5 and CLN6 expression in CLN6 sheep 41 Figure 3.10 Quantitative assessment of fluorescent storage material accumulation 42 Figure 4.1 Representative brain CT image of a 12-month-old Coopworth sheep 51 Figure 4.2 Skull thickness measurements on computed tomography (CT) images 53 Figure 4.3 Growth of frontal and parietal bones 57 Figure 4.4: ICV development of CLN5 sheep 59 Figure 4.5: ICV development of CLN6 sheep 59 Figure 4.6: Cerebroventricular volumes of CLN5 and CLN6 sheep 60 Figure 5.1 The components of the electroretinogram (ERG) 65 Figure 5.2 Fundus photography in ovine NCL 70 Figure 5.3 Mean amplitudes of electroretinography (ERG) a- and b-waves in CLN5 sheep 71 Figure 5.4 Mean amplitudes of electroretinography (ERG) a- and b-waves in CLN6 sheep 72 Figure 5.5 Individual electroretinography (ERG) traces from CLN5 animals at different ages 73 Figure 5.6 Individual electroretinography (ERG) traces from CLN6 animals at different ages 74 Figure 5.7 Timeline of changes of cognition and vision in CLN5 -/- and CLN6 -/- sheep 77 Figure 6.1 Summary of sheep enrolled in the MRI study at the University of Sydney at different ages 81 Figure 6.2 Volume changes of segmented brain tissues in CLN6 Merino sheep 85 Figure 6.3 Regional volume changes in CLN6 Merino sheep 86 Figure 6.4 Example of segmentation and regional volume measures 87 Figure 6.5 Examples of MRI segmentation from CLN5 affected and control sheep 88 Figure 6.6 Comparison of images aquired on different MRI scanners 91 Figure 7.1 CT guided planning of injection sites for gene therapy in the ovine brain 94 Figure 7.2 CT guided planning of intra-cerebroventricular gene therapy injections 97 Figure 7.3 The effect of gene therapy on the mean accumulative ICV gain and loss 98 Figure 7.4 Representative 3-D models of cranial volumes of treated sheep and controls 99 Figure 7.5 Mean amplitudes of a- and b-waves in treated sheep and controls 100 X
13 LIST OF TABLES Table 1.1 Classification of the NCLs 5 Table 3.1 Summary of brains available at each age for histology and immunohistochemistry 24 Table 3.2 Regions of interest in the brain and sagittal levels on which the regions can be found 25 Table 3.3: Primary and secondary antibodies and standard DAB incubation times 28 Table 3.4 Mean brain weights of affected and control sheep at different ages 31 Table 3.5 Mean brain weight of affected sheep from the three ovine NCL models 43 Table 4.1 Radiodensity of different body materials 50 Table 4.2 Summary of numbers of animals used 55 Table 4.3 Radiodensity of sheep brain tissue and CSF filled spaces 56 Table 4.4 Brain and intracranial volume comparisons 56 Table 5.1 Summary of numbers of animals used 67 Table 6.1 Effect of disaese status on segmented brain tissue volumes of CLN6 merino sheep 84 Table 8.1 Correlation of neuropathological and in vivo measures of disease in CLN6 affected Merino sheep 108 Table 8.2 Correlation of neuropathological and in vivo measures of disease in CLN6 affected South Hampshire sheep 109 Table 8.3 Correlation of neuropathological and in vivo measures of disease in CLN5 affected Borderdale sheep 110 XI
14 LIST OF ABBREVIATIONS Only abbreviations that appear more than once and within the body of the text are shown. Abbreviations within figures or tables are explained in the corresponding legends. 3-D 3-dimensional AAV ANOVA BBB bp cd/m 2 CLN/CLN CN CNS CSF CT DAB DNA DPX ER ERG fmri FOV GABA gdna GFAP GM GSB4 HU ICV IV LFB LGN Adeno-associated viruses Analysis of variance Blood brain barrier Basepair Candela per square metre NCL causing gene/protein Caudate nucleus Central nervous system Cerebrospinal fluid Computed tomography 3, 3 -diaminobenzadine Deoxyribonucleic acid P-xylene-bis(pyridinium bromide) Endoplasmic reticulum Electroretinography Functional MRI Fields of view Γ-aminobutyric acid Genomic DNA Glial fibrillary acidic protein Grey matter Α-D-galactose specific isolectin IB4 from Griffonia simplicifolia Hounsfield unit Intracranial volume Intravenous Luxol fast blue Lateral geniculate nucleus XII
15 LSD Lysosomal storage disease LW Life weight MND Motor neuron disease MRI Magnetic resonance imaging mrna Messenger ribonucleic acid NCL Neuronal ceroid lipofuscinosis NCLs Neuronal ceroid lipofuscinoses NGS Normal goat serum NZBRI New Zealand brain research institute OCT Optical coherence tomography PBS Phosphate buffered saline solution PBST PBS containing 0.3% Triton-X PCR Polymerase chain reaction POC Parieto-occipital PSA-NCAM Polysialylated-neural cell adhesion molecule scaav9-cln5 Self-complementary AAV9 expressing the ovine CLN5 SEM Standard errors of the mean SGZ Subgranular zone SPM8 Statistical Parametric Mapping, Wellcome Department of Imaging Neuroscience Group, UCL, UK; SVZ Subventricular zone T Tesla TMP Tissue probability maps TPP1 Tripeptidyl peptidase 1 V1 Primary visual cortex VEP Visual evoked potentials vlincl Variant late infantile NCL WM White matter XIII
16 1 INTRODUCTION 1.1 LARGE ANIMAL MODELS FOR TRANSLATIONAL RESEARCH OF GENETIC AND NEURODEGENERATIVE DISEASES The use of animals to increase our knowledge about how the human body functions, in both physiological and pathological terms, and for medical research is well established in human culture (Ericsson et al., 2013). Biomedical research has traditionally been based on mouse models that are developed from readily available, well-established and genetically homogenous strains. Furthermore, genetically engineered knock-in and knock-out mouse models of disease are relatively common (Ericsson et al., 2013). Advantageous attributes of mouse models include their genetic homogeneity, short generation interval, large litter size, short life span, and thus short experimental length, as well as their availability in large numbers, ensuring statistical power through large sample sizes. However, some of these attributes have been viewed as disadvantages, and it could be argued that their genetic homogeneity, small body size, and short life span largely fail to mimic human physiology and pathology, leaving a gap between mouse models and their translation to human disease. Examples of this include the failure to show disease phenotype despite of the presence of the genetic lesion in mouse models of neuronal ceroid lipofuscinosis (NCL) type 5 (CLN5), Tay-Sachs disease or cystic fibrosis (Phaneuf et al., 1996; Grubb & Boucher, 1999; Kopra et al., 2004). Furthermore, for neuropathological investigations, the small size and lissencephalic structure of the murine brain does not mimic the gyrencephalic, more complex, and much larger human brain well. The short life span and genetic homogeneity of mice used for translational research largely eliminates the possibility of longitudinal, repeated monitoring of disease development or therapeutic efficacy and limits the extent of individual variation. However, the human population is genetically diverse and individual differences in treatment response need to be anticipated. A traditional alternative to small rodents for translational research has been non-human primates, such as rhesus macaque monkeys, but this introduces a range of practical and ethical issues associated with their use. In 2013 it was estimated that one rhesus macaque monkey for research purpose would cost US $5000-$10,000 to buy, not including housing costs (Morton & Howland, 2013). Ethical concerns arise when non-human primates are used in the research of neurodegenerative diseases, as they develop depression and behavioural issues similar to humans (Morton & Howland, 2013). Larger animals could provide the translational bridge between small rodents and human disease and the most widely used large animal models are dogs and pigs (Casal & Haskins, 2006; Holm et al., 2016; Eaton & Wishart, 2017). Research pigs, such as the Göttingen 1
17 minipig, have been bred to provide genetically homogenous cohorts with little individual variation, leading to some of the same concerns as the use of mouse models (Holm et al., 2016). A canine model for Alzheimer disease exists (Martin et al., 2011) and studies of naturally occurring NCLs in dogs have contributed greatly to the understanding of these diseases. The first detailed description of a naturally occurring NCL in large animals was in English Setter dogs in Norway (Koppang, 1962, 1966) and, since then, a range of NCL cases has been described in several dog breeds (Jolly et al., 1994; Palmer et al., 2011). Regardless of the relatively common occurrence of canine NCLs, currently only one active canine NCL research colony exists, which comprises Dachshunds with CLN2 disease (Katz et al., 2008). Translational results from investigations into enzyme replacement therapy in these dogs has led to clinical trials for enzyme replacement therapy in children with CLN2 disease (Katz et al., 2014; Schulz et al., 2016). The interest in other large animal models to study genetic diseases and for the development of translational therapies has recently increased (Morton & Howland, 2013; Palmer et al., 2015; Pinnapureddy et al., 2015; Roth & Tuggle, 2015; Eaton & Wishart, 2017). Concerns about the social acceptance of using companion animals in research have been raised and need to be considered (Eaton & Wishart, 2017). Initiatives have been established to promote the use of large animal models discovered in farm animal populations such as Sharing Advances on LArge Animal Models (SALAAM) from the European Cooperation in Science & Technology ( and the Online Mendelian Inheritance in Animals (OMIA) catalogue from the University of Sydney ( Nicholas, 2003). A range of naturally occurring and transgenic large animal models has been established for neurodegenerative diseases (reviewed by Eaton & Wishart, 2017). Advantages of farm animals for translational research are the well-established systems for their breeding, housing, handling and transport as well as their similarities to humans in terms of physiology and size (Scheerlinck et al., 2008; Roth & Tuggle, 2015). Sheep in particular have been increasingly utilised as model animals for genetic and neurodegenerative disease research (Morton & Howland, 2013; Palmer et al., 2015; Pinnapureddy et al., 2015) and a fully annotated sequence of the sheep genome is now publicly available ( Jiang et al., 2014). Sheep are docile and easy to handle. They have a similar body size to humans, new-born lambs weighing between 3 and 4 kg and adult ewes between 50 and 100 kg, and a similar physiology with exception of the gastrointestinal tract (Scheerlinck et al., 2008). Sheep are relatively long-lived (10 15 years) and can be kept in simple outdoor grazing conditions. The sheep brain is ideal for the investigation of neurodegenerative disorders, being approximately one tenth of the size of the human brain, gyrencephalic, and similar in structure and organisation (Palmer et al., 2015). All this enables more realistic approximations for human treatment and the up-scaling from sheep to human for both 2
18 treatment dosages and surgical procedures is less extreme than between mice and human. Resources like the Michigan brain atlas ( and a recently developed magnetic resonance imaging (MRI) atlas of the sheep brain (Ella & Keller, 2015; Ella et al., 2017) increase the applicability of sheep as models for human neurodegenerative disease. Furthermore, sheep are suitable for investigations of cognitive functions, as they possess good facial and emotional recognition and memory skills, display executive decision-making ability, and can learn novel tasks (Tate et al., 2006; Morton & Avanzo, 2011; Nowak et al., 2011; Knolle et al., 2017). Currently a range of naturally occurring and induced neurodegenerative diseases in sheep are being utilised as models for human conditions, including the ovine CLN5 and CLN6 NCL models described in this thesis (see sections , and ), and models for Gaucher disease type 1, Tay- Sachs disease and Huntington disease (Jolly & West, 1976; Cook et al., 2002; Jacobsen et al., 2010; Torres et al., 2010; Karageorgos et al., 2011). In the light of the recent and ongoing advances in gene editing techniques, the development of a range of engineered sheep models of other human diseases should be anticipated (Tu et al., 2015; Whitelaw et al., 2016). 1.2 GENERAL FEATURES OF THE NEURONAL CEROID LIPOFUSCINOSES Overview The neuronal ceroid lipofuscinoses (NCLs or Batten disease) are a group of mainly autosomal recessively inherited lysosomal storage diseases (LSDs) leading to degenerative and fatal encephalopathies in children (Haltia, 2006). The estimated incidence of NCL worldwide is 1:12,500 live births (Rider & Rider, 1988). The genetic background of the NCLs is heterogeneous, currently including mutations in 13 different genes, leading to the different forms of NCL ( Despite this genetic diversity, the NCLs are characterised by a range of common features. Affected children develop normally at first but then develop blindness combined with progressive motor degeneration, epilepsy and dementia, eventually reaching total dependency and premature death (Mole et al., 2005, 2011; Kousi et al., 2012). Pathologically the NCLs are unified through severe cerebral neurodegeneration, neuroinflammation and the nearly ubiquitous intracellular accumulation of storage bodies containing specific proteins (Mole et al., 2005; Kousi et al., 2012; Palmer, 2015). Despite these characterising similarities, large individual variations in disease onset, course and severity are observed (Mole et al., 2005; Anderson et al., 2013). 3
19 1.2.2 Classification Traditionally the NCLs were classified based on the age of onset, namely infantile, late-infantile, juvenile and adult (Haltia, 2003). The discovery of more forms, a growing understanding of the genetic background, and the observation of large individual variation, even within the same disease type, has led to a revised nomenclature based on the defective gene (Table 1.1) (Williams & Mole, 2012; Kousi et al., 2012; Warrier et al., 2013). With the ongoing discovery of new NCL forms, such as the more recently described CLN4 and CLN11 CLN14 (Smith et al., 2012, 2013; Bras et al., 2012; Staropoli et al., 2012), there has been ongoing discussion about which criteria should be fulfilled for a disease to be identified as an NCL (Palmer et al., 2013). 4
20 Table 1.1 Classification of the NCLs (modified from Williams et al., 2011; Palmer et al., 2013; Cotman et al., 2013; Kollmann et al., 2013; Warrier et al., 2013) NCL gene (alternative name) Gene product Type of protein Cellular localisation NCL types Storage material CLN1 (PPT1) PPT1 Soluble Lysosomal matrix Classic Infantile, late-infantile, juvenile SAP A and D CLN2 (TPP1) TTP1 Soluble Lysosomal matrix Classic late-infantile, juvenile Subunit c CLN3 CLN3 Transmembrane Endosomal/lysosomal membrane Classic juvenile Subunit c CLN4 (DNAJC5) CSPα, DNAJC5 Soluble Cytosolic, vesicular membrane associated Perry disease (juvenile to adult onset) SAP A and D CLN5 CLN5 Soluble Lysosomal matrix Variant late-infantile, juvenile, adult Subunit c CLN6 CLN7 (MFSD8) CLN8 CLN6 MFSD8 CLN8 ER membrane Variant late-infantile, Kufs A (adult-onset) Subunit c Lysosomal membrane Variant late-infantile, juvenile, adult Subunit c ER/ER-Golgi membrane Late-infantile, Northern epilepsy Subunit c CLN10 (CTSD) Cathepsin D Soluble Lysosomal matrix, extracellular Congenital, late-infantile, adult SAP A and D CLN11 (GRN) Progranulin Soluble Extracellular Adult Not confirmed CLN12 (ATP13A2) ATPase 13A2 Transmembrane Transmembrane Transmembrane Transmembrane Lysosomal membrane Juvenile Not confirmed CLN13 (CTSF) Cathepsin F Soluble Lysosomal matrix Kufs B (adult-onset) Not confirmed CLN14 (KCTD7) KCTD7 Soluble Cytosolic, membrane associated Infantile Subunit c Abbreviations: CLN1 etc. ceroid lipofuscinosis, neuronal 1 etc.; CSPα cysteine string protein alpha; CTSD cathepsin D; CTSF cathepsin F; DNAJC5 DnaJ (Hsp40) homolog, subfamily C, member 5; ER endoplasmic reticulum; KCTD7 potassium channel tetramerization domain-containing protein 7; MFSD8 major facilitator superfamily domain containing 8; PPT1 palmitoyl protein thioesterase 1; SAP sphingolipid activator protein; subunit c of the mitochondrial ATP synthase; TPP1 tripeptidyl peptidase 1 5
21 1.2.3 Accumulation of storage material The accumulation of storage material in the lysosomes of neurons and most other visceral cells is one of the defining features of the NCLs. The material is positive for Sudan black and Luxol fast blue, fluorescent and electron dense and has traditionally been described as resembling the aging pigments lipofuscin and ceroid, giving rise to the name of these diseases (Rider & Rider, 1988). Investigations into the nature of the storage material in the ovine CLN6 South Hampshire sheep model revealed that it did not comprise aging pigments but that at least 50% was made up from the subunit c of the mitochondrial ATP synthase (Palmer et al., 1989; Fearnley et al., 1990). Initial investigations confirmed the same storage material in the human CLN2 and CLN3 diseases (Fearnley et al., 1990; Palmer et al., 1992) and subsequently in the human CLN5, CLN6, CLN7, CLN8, and CLN14 diseases (Hall et al., 1991; Tyynelä et al., 1997; Haltia, 2006; Elleder et al., 2011; Staropoli et al., 2012) as well as in several animal models (Faust et al., 1994; Pardo et al., 1994; Koike et al., 2000; Cook et al., 2002; Jolly et al., 2002). In the CLN1, CLN4 and CLN10 diseases, the storage material mainly consists of the sphingolipid activator proteins A and D (Tyynelä et al., 1993; Nijssen et al., 2003; Siintola et al., 2006; Nosková et al., 2011). No analyses of the material in the remaining newly discovered NCLs (CLN11, CLN12 and CLN13) have been published so far. The reason for the accumulation of storage material still remains elusive. Traditionally it was assumed that a direct connection between storage accumulation and neuronal death existed, however this paradigm has recently been challenged by Palmer and his co-authors (Palmer et al., 2013; Palmer, 2015). Studies have shown independence of neuronal pathology and storage accumulation (Oswald et al., 2005; Kay et al., 2006) and despite the accumulation of storage material in most visceral cells, no consistent pathology is seen in any organs other than the brain (Palmer et al., 2013, 2015). Furthermore, gene therapy trials in a CLN1 mouse model that resulted in successful clearance of storage accumulation in the brain, showed no improvement in clinical disease signs (Griffey et al., 2006). It is, therefore, now assumed that storage accumulation and neuronal pathology are two independent manifestations of the NCLs rather than one being caused by the other (Palmer et al., 2013) Selective neuronal loss A key characteristic of the NCLs is the progressive neuronal loss that leads to remarkable atrophy of the brain, which in human subjects is obvious at post mortem examination or from imaging studies (Autti et al., 1992; Haltia, 2003, 2006; Jadav et al., 2014). Already these basic observations reveal a heterogeneous pattern of atrophy with regional differences and differences between the disease types. For example, is there a varying incidence of cerebellar atrophy depending on disease type that 6
22 is obvious on macroscopic examination (Tyynelä et al., 1997; Jadav et al., 2014) and it has been shown that the cortical atrophy is more pronounced in areas of the brain with primary sensory function compared with those involved in motor function (Mitchison et al., 2004; Oswald et al., 2005). Initial investigations using autopsy tissue from human subjects indicated the selective loss of inhibitory interneurons that use γ-aminobutyric acid (GABA) as a neurotransmitter (i.e. GABAergic neurons) and this has since been confirmed in a variety of animal models (Williams et al., 1977; Cooper et al., 1999; Oswald et al., 2001; Mitchison et al., 2004; Bible et al., 2004; Tyynelä et al., 2004; Kielar et al., 2007). Investigations of several mouse models, such as CLN1 (PPT1 -/- ), CLN10 (CTSD -/- ), CLN8 (mnd/mnd) and others, have shown that initial pathology occurs in the thalamus with loss of mainly sensory relay neurons and is only subsequently followed by cortical neuron loss (Cooper et al., 2006; Kielar et al., 2007; Partanen et al., 2008; Kuronen et al., 2012). However, studies in CLN5 mutant mice have shown a contrasting trend to these findings, as here the neuron loss begins in the cortex and only subsequently reached the thalamic relay nuclei (von Schantz et al., 2009). Similar findings were made from the CLN6 South Hampshire sheep model, where thalamic changes such as the loss of GABAergic interneurons and generalised atrophy were not seen until late-stage disease (Oswald et al., 2005, 2008; Sawiak et al., 2015) Neuroinflammation Over the last two decades the perception about the NCLs being a mainly neuronal disease has changed. Studies of the well characterised CLN6 South Hampshire sheep model have shown that neuroinflammation plays a major role in the development of the disease. Activated astrocytes, positive when immunostained for glial fibrillary acidic protein (GFAP), were present in the developing cerebral white matter of sheep embryos at 40 days, and in the grey matter at 20 days, before birth, and activated perivascular cells were found in the white matter at 40 days before birth (Kay et al., 2006). These changes were most pronounced in the somatosensory and occipital cortices and no activation of neuroinflammatory markers was detected in the cerebellum. Neuroinflammation clearly precedes the neurodegeneration as it has been shown that the brain volumes and cortical thicknesses of affected sheep were similar to those of normal animals at birth and cortical thinning did not commence until 4 months of age (Oswald et al., 2005, 2008; Kay et al., 2006; Mitchell, 2016). Similar findings have been reported for a range of NCL mouse models (Pontikis et al., 2004; Kielar et al., 2007; Partanen et al., 2008; von Schantz et al., 2009; Kuronen et al., 2012; Schmiedt et al., 2012). Neuroinflammation has also been found in other lysosomal storage diseases, Tay-Sachs disease, mucopolysaccharidosis IIIB and Sandhoff disease (Wada et al., 2000; Ohmi et al., 2003; Jeyakumar et al., 2003). The role of neuroinflammation in neurodegenerative diseases remain controversial because astrocytes and other glial cells can have both neuroprotective 7
23 and neurotoxic properties (Sofroniew, 2005; Sofroniew & Vinters, 2010), and therefore the role of these events, especially in relation to the neuropathological cascade, also remains elusive in the NCLs (Palmer et al., 2013; Cooper et al., 2015; Chen, 2016) Neurogenesis The traditional view that neurogenesis in mammals occurs only in the developing brain has been challenged over the last few decades and it is now generally accepted that some degree of neurogenesis also occurs in the adult brain, specifically in the subventricular zone (SVZ) of the lateral ventricles and in the subgranular zone (SGZ) of the dentate gyrus of the hippocampus (reviewed by Ming & Song, 2011). Different pathological states have different effects on adult neurogenesis and self-repair is seen after brain insults, however some functions of neurogenesis remain elusive. For example, the effect of seizure activity on adult neurogenesis has been questioned in mice (Jessberger & Parent, 2015). Also there is some discussion about neurogenesis being a positive mechanism, for example enabling self-repair in epileptic disease, or a negative mechanism, inasmuch as seizure-induced alteration of neurogenesis might contribute further to epileptic disease (Jessberger & Parent, 2015). Signs of self-repair were seen after induced stroke in rats (Arvidsson et al., 2002). Here it was shown that stroke lead to marked increases of cell proliferation in the SVZ and that the cells migrated to, and proliferated into, the area and cell type that was lost during the stroke (Arvidsson et al., 2002). The effect of neurodegeneration on adult neurogenesis is also complex, and different factors in diseases such as Alzheimer, Parkinson and Huntington can have either stimulating or inhibiting effects on adult neurogenesis (reviewed by Winner et al., 2011). Studies in normal sheep have shown that these animals also exhibit adult neurogenesis in the SVZ and SGZ and that the migrating cells follow the rostral migration stream to the olfactory bulbs in a similar way to that seen in humans (Brus et al., 2010, 2013; Low et al., 2013). Increased neurogenesis occurs in the CLN6 South Hampshire and CLN5 Borderdale sheep as well as in the CLN3 -/- and PPT1 -/- mouse models (Dihanich et al., 2009, 2012; Mitchell, 2016) Blindness Loss of vision occurs in most forms of the NCLs and is often one of the first presenting signs of disease (Haltia, 2003; Anderson et al., 2013). The adult-onset forms are exceptions from this generalisation (Berkovic et al., 1988; Arsov et al., 2011). Autopsy findings from eyes of human NCL patients are generally characterized by substantial loss of photoreceptors and their cell bodies from the outer nuclear layer, storage accumulation and infiltration of inflammatory cells such as macrophages, astrocytes and microglia (Goebel et al., 1974; Schochet et al., 1980). In vivo findings from human patients are based on ocular examinations, funduscopy and electroretinography (ERG). 8
24 The rate of retinal degeneration and thus loss of ERG responses varies between the different disease forms, but ultimately an extinct ERG response is observed in most NCL types (Weleber, 1998). A range of differing funduscopic findings have been reported for the different NCL types, including atrophy of the pigment epithelium, peripheral bone spicules, bull s eye maculopathy and variable disk pallor (Hainsworth et al., 2009). Detailed investigations of the pathological changes of the retina have been conducted in various animal models of the NCLs. For instance, retinal degeneration was measured in the CLN6 -/- South Hampshire sheep through ERG and this was correlated to histopathological changes (Graydon & Jolly, 1984; Mayhew et al., 1985). The results showed a progressive loss of photoreceptor cells and nuclei from the outer nuclear layer that coincided with a progressive reduction of ERG responses (Graydon & Jolly, 1984; Mayhew et al., 1985). Ultrastructural investigations showed loss of rod receptor outer segments and inclusion of storage material throughout most retinal cells, and ingested outer segments and melanin granules in the pigment epithelium (Graydon & Jolly, 1984; Mayhew et al., 1985; Goebel, 1992). In contrast to findings from human patients, CLN6 -/- South Hampshire sheep did not show atrophy of the optic disc, vascular attenuation or abnormal pigmentation of the fundus. Both in CLN6 -/- and CLN5 -/- sheep initial visual impairment was seen at 5 8 months of age and severely affected vision by months (Mitchell, 2016). Similar findings were recorded in a dog model of CLN2 (tripeptidyl peptidase 1; TPP1) disease. Here loss of menace response was noticed at 7 months of age and the dogs appeared to be clinically blind by 10 months (Katz et al., 2008). Funduscopy revealed increased granularity and generalised vascular attenuation(katz et al., 2008). At 7 months the dogs also had a reduced ERG response which declined progressively and was abolished by 10 months of age. Storage material was abundant throughout most retinal cells and the photoreceptors had irregularly shaped outer segments and were reduced in number (Katz et al., 2008). A mouse model of CLN5 disease provided similar findings, including progressively declining and eventually diminished ERG recordings, damaged and apoptotic photoreceptors, accumulation of storage bodies in most retinal cells and infiltration by inflammatory cells such as microglia and astrocytes (Leinonen et al., 2017). A different mouse model of CLN3 disease showed less typical phenotype, with late loss of photoreceptors, no change of the fundus or the ERGs, but accumulation of storage bodies was observed (Seigel et al., 2002). The loss of vision in the NCLs also has a central component. The primary visual cortex was found to be the region showing the most severe and earliest signs of both neurodegeneration and inflammation, leading to signs of functional blindness even before the loss of photoreceptors was evident in the CLN6 South Hampshire sheep model (Oswald et al., 2005; Mitchell, 2016). Observations of pathology in other parts of the visual pathway have also been made, such as loss of 9
25 large projection neurons within the lateral geniculate nucleus (Weimer et al., 2006). Whether this is a causative change or a downstream result of atrophy of the retina and the primary visual cortex remains to be determined. 1.3 CLN5 DISEASE Human CLN5 disease CLN5 disease in humans was first identified in Finland as a variant of the late infantile NCL (Finnish vlincl) (Santavuori et al., 1982, 1993; Savukoski et al., 1998) The initial clinical signs of CLN5 disease are mental impairment, visual failure and epilepsy and are typically seen in children at around 5 years of age. The patients die in their teenage years or as young adults (Santavuori et al., 1982). Neurodegeneration spans the entire brain and is characterised by neuronal loss in the cerebrum, destruction of Purkinje cells in the cerebellum, and myelin loss and gliosis in the white matter (Autti et al., 1992; Tyynelä et al., 1997). Imaging studies of CLN5 patients have also found dilation of all cerebral ventricles and hyperintense zones in the white matter on MRI (Autti et al., 1992; Holmberg et al., 2000). Accumulation of subunit c of the mitochondrial ATP synthase and sphingolipid activator protein A and D is present in most visceral cells and is increased in the brain. Retinal degeneration accompanies the degeneration of the brain (Tyynelä et al., 1997) Animal models of CLN5 disease Cln5 mouse An exon 3 knock-out CLN5 mouse model has been created (Kopra et al., 2004). The mice show loss of vision, accumulation of storage material and loss of GABAergic neurons from the cortical grey matter, however most of the other disease phenotypes, such as progressive motor dysfunction and seizures that are evident in humans, are not seen in this mouse model CLN5 Borderdale sheep NCL in Borderdale sheep was first described in 2002 after commercially bred Borderdale sheep were observed to show clinical signs consistent with NCL and a research flock was established (Jolly et al., 2002). The causative mutation was located to the ovine equivalent of the CLN5 gene (Frugier et al., 2008). The initial characterisation of this model revealed that blindness in these sheep is seen at around months, and the pathological changes are severe atrophy of the cerebral cortex, accumulation of fluorescent storage bodies that contain the subunit c of the mitochondrial ATP synthase, neuronal loss and astrocytosis (Jolly et al., 2002; Frugier et al., 2008). Subsequently the ovine CLN5 disease has been described in more detail (Mitchell, 2016). Initial disease signs seen from 10
26 approximately 6 months of age include low head carriage and baulking, especially when passing through gates, laneways, shadows or negotiating steps. From around 11 months of age the sheep become functionally blind, which manifests as reduced or lost visual reflexes such as menace response, pupillary light reflex and dazzle response. At the same age the CLN5 affected Borderdale sheep develop a reduced herding instinct and increased self-segregation. As the disease progresses so does the severity of the clinical signs. Reduced mentation, increased somnolence, and repetitive behaviour such as sham eating and circling can be observed from around 14 months of age. The motor functions of affected sheep also become impaired at this stage, which manifests as proprioceptive dysfunction and intermitted episodes of facial tremors. Towards end-stage disease, after 15 months of age, the sheep show reduced awareness of their surroundings, extended periods of somnolence, low mentation, and lack of responsiveness and loss of body condition. Whole-body tremors can be induced in some sheep from 13 months of age, however there is large individual variation in the severity of disease progression. The humane endpoint for the disease is reached at months of age (Mitchell, 2016). The neuropathological changes in CLN5 affected Borderdale sheep are largely common to the NCLs (Mitchell, 2016). The brain weight of affected animals is close to that of normal sheep at birth but is already reduced to 89% at 4 months. Thereafter the cerebral atrophy continues, reaching 81% of normal brain volume at 12 months, 73% at 18 months and declining to 58% at end-stage disease. Disruption of the laminar architecture of the cerebral grey matter is already mildly evident in the primary visual cortex at birth, obvious in the parieto-occipital and the somatosensory cortices at 4 months and reaches the entire cortical mantle by 6 9 months. At end-stage disease, by 24 months, cellular aggregates are present at the lamina I/II boundary and loss of neurons is evident throughout the entire cortical grey matter. Grey matter thinning observable in the visual, parieto-occipital and somatosensory cortices from birth, reaches the frontal association cortex at 9 months and the remaining cortical areas at 15 months of age. Neuroinflammation characterised by activation of microglia and astrocytes largely follows the same pattern as the grey matter thinning, starting in the visual, parieto-occipital and somatosensory cortices and then spreading to the remaining cortical regions. Initial activation is seen in the upper cortical laminae (II/III) and subsequently reaches the lower layers (IV-VI). Ongoing neurogenesis is evident throughout the entire disease progression with newly generated neurons travelling from the SVZ to the affected cortical areas. The subcortical regions, the cerebellum and the brain stem are largely spared of pathological changes besides of the progressive accumulation of fluorescent storage material ubiquitous in the entire brain and most other cells of the body (Mitchell, 2016). 11
27 1.3.3 CLN5 gene, mutations and gene product The human CLN5 gene is located on chromosome region 13q21.1-q32, consists of four exons and has several potential methionine start sites (Savukoski et al., 1994, 1998; Åberg et al., 2011). Alignment with other species has shown that only the third possible human initiation site is evolutionary conserved, making it most likely to be the true start codon, leading to a protein of 358 amino acids that is soluble and localised to the lysosome but whose function remains elusive (Isosomppi et al., 2002; Holmberg et al., 2004; Kopra et al., 2004; Houweling et al., 2006; Frugier et al., 2008; Schmiedt et al., 2010). A CLN5 gene product consistent with these findings has been identified (Sleat et al., 2007, 2009). Interaction of the CLN5 gene with a range of other NCL genes, namely CLN1/PPT1, CLN2/TPP1, CLN3, CLN6 and CLN8, has been suggested (Vesa et al., 2002; Lyly et al., 2009). To date 36 disease-causing mutations are known in humans ( all leading to a similar disease phenotype (Holmberg et al., 2000; Mole et al., 2005). The most common mutation in human patients is a 2 basepair (bp) deletion in exon 4 (c.1175delat), which results in a truncated protein (Savukoski et al., 1998). The mutation in the Borderdale sheep is a nucleotide substitution (c.571+1g>a) leading to the splicing out of exon 3 and a shortened protein (Frugier et al., 2008). 1.4 CLN6 DISEASE Human CLN6 disease A variant late infantile NCL (vlincl), Kufs disease, and other adult-onset forms of NCL were all assigned to mutations in the CLN6 gene (Lake & Cavanagh, 1978; Sharp et al., 1997; Arsov et al., 2011). The clinical signs of CLN6 deficiency are largely general to the NCLs. The age of onset of the vlincl lies between 18 months and 5 years and although the course of disease may vary, the first signs are usually seizures and motor disabilities, followed by loss of vision and speech, cognitive impairment and premature death before the third decade of life (Teixeira et al., 2003; Mole et al., 2005). CLN6 disease is found in all ethnic groups (Alroy et al., 2011). Besides the vlincl form, type A Kufs disease, an adult-onset NCL, and teenage-onset progressive myoclonus epilepsy have also been attributed to CLN6 deficiencies (Arsov et al., 2011; Andrade et al., 2012). No loss of vision is observed in the teenage onset and adult forms Animal models of CLN6 disease nclf mouse There are three naturally occurring animal models of the human CLN6 deficiency disease. Nclf mice have some clinical and pathological similarities with the human disease, such as progressive motor 12
28 neuron disease, loss of vision and accumulation of fluorescent storage material and it was shown that the nclf gene is located on a region that is homologous for the location of the human CLN6 gene (Bronson et al., 1993, 1998) CLN6 South Hampshire sheep Ovine CLN6 disease was discovered in South Hampshire sheep in the 1970s and the biochemical and pathological features of this model are well characterized (Jolly & West, 1976; Jolly et al., 1980, 1989). The disease progression and neuropathological changes parallel those of human CLN6 disease. Initial studies established that CLN6 affected sheep are born without clinical signs but disease symptoms develop between 10 and 14 months of age (Mayhew et al., 1985; Jolly et al., 1989). These are progressive atrophy of the cerebral cortex leading to psychomotor decline and loss of retinal photoreceptor cells leading to blindness (Mayhew et al., 1985; Jolly et al., 1989). More indepth observations of the development of the clinical status have revealed that initial signs can be detected from 7 months of age, including low head carriage, especially when passing through gateways, races and shadows (Mitchell, 2016). From 9 months visual deficits can be observed and visual reflexes such as the menace response, pupillary light reflex and dazzle response are reduced. Most CLN6 affected South Hampshire sheep are functionally blind from approximately 12.5 months of age. Loss of condition is observed from 10 to 12 months of age and reduced mentation, spontaneous episodes of head nodding and facial twitches become evident from approximately 15.5 months of age. Affected sheep die prematurely at approximately two years of age, but large individual variation in both disease severity and progression should be expected (Mayhew et al., 1985; Jolly et al., 1989; Mitchell, 2016). The accumulation of periodic acid-schiff-positive, fluorescent material that stained with Sudan Black in CLN6 affected South Hampshire sheep was initially described when the disease in these animals was discovered (Jolly & West, 1976). Since then this model has been used to identify the specific storage of subunit c of the mitochondrial ATP synthase which is a common feature for most of the NCLs (section 1.2.3) (Palmer et al., 1989, 1992; Fearnley et al., 1990; Palmer, 2015). The neuropathological changes are well described in the CLN6 South Hampshire sheep. Although prenatal neuroinflammatory changes can be observed, the sheep are born without clinical signs and no macroscopic changes of the brain are seen in the first 4 months of their lives (Oswald et al., 2005; Kay et al., 2006; Mitchell, 2016). At this point however, the brain weights of affected sheep are already reduced to 81% of those of unaffected controls. From then on progressive loss of brain volume is evident; brain weights of affected sheep being reduced to 69% of those of normal sheep at 12 months, and to 54% when the humane endpoint of the disease is reached at 24 months. Although no macroscopic changes are observed early in life, disruption of the cellular architecture of the 13
29 cortical layers of the cerebrum becomes apparent as early as 2 months of age in the primary visual and parieto-occipital cortices, at 6 months in the somatosensory cortex, at 12 months in the primary motor cortex and affects the entire cortical mantel at 18 months. Cortical thinning follows this disruption of cellular architecture. The visual and parieto-occipital cortices show thinning at 2 months of age, then the somatosensory cortex at 9 months, the entorhinal and frontal association cortices at 12 months and the primary motor cortex at 18 months of age (Oswald et al., 2005; Mitchell, 2016). Another hallmark of the NCLs initially described in the South Hampshire CLN6 model are the neuroinflammatory changes that occur in the course of the disease. Astrocytosis and glial activation precede neurodegeneration and cortical atrophy. Activated astrocytes can be detected days before gestation and activated microglia can be found shortly after birth (Kay et al., 2006). Clusters of activated microglia can be seen in the cortical regions most vulnerable to neurodegeneration in pre-symptomatic animals, e.g. the visual and the parieto-occipital cortices (Oswald et al., 2005; Kay et al., 2006; Mitchell, 2016). Astrocytosis and activation of microglia starts in the outer cortical laminae (II and III), and subsequently the infiltration spreads to the lower laminae (IV-VI) until finally the cellular architecture is lost and replaced by a diffuse mesh of activated astrocytes, spanning the entire cortical mantle and also including subcortical regions (Oswald et al., 2005; Mitchell, 2016). Accompanying the neuroinflammation and degeneration is an ongoing neurogenesis where newly formed neurons travel from the SVZ along the white matter tracts towards the cortical regions that are most severely affected by neurodegeneration (Dihanich et al., 2009; Mitchell, 2016). The cerebellum and brain stem are relatively spared from neuropathological changes (Oswald, 2004; Mitchell, 2016) CLN6 Merino sheep The CLN6 disease in Merino sheep was first identified in a commercial Merino flock in 1997 and a research flock was established at the University of Sydney, Australia (Tammen et al., 2001; Cook et al., 2002). The overall clinical and pathological development of CLN6 disease in Merino sheep resembles that of South Hampshire sheep. Clinical signs can be detected between 7 and 12 months of age and include mild behavioural changes, decreased but still measurable visual function, reduced herding instinct and low head carriage that is exaggerated when passing through gates and laneways or over steps (Cook et al., 2002). After the age of 12 months and as the disease progresses, the clinical signs worsen. The sheep show increasing behavioural changes such as poor response to auditory stimuli, reduced awareness of surroundings, somnolence, repetitive behaviour and disturbances of feeding behaviour such as sham eating and drinking which ultimately lead to anorexia and loss of condition. In the later disease course the motor deficits worsen and the sheep 14
30 show proprioceptive issues, episodes of head shaking and tremors of the face and forelimbs. Inducible tremors can be seen when the sheep are kept alive to late-stage disease at a maximum age of 27 months (Cook et al., 2002). Brain atrophy is also a defining feature of CLN6 disease in Merino sheep. The mean brain weights of a group of CLN6 affected Merino sheep aged 10 to 27 months were reduced to 54% of normal, ranging from a low of 38% to 70%, and there was visible loss of the cerebral grey matter on sectioning at post mortem examination (Cook et al., 2002). Accumulation of subunit c of the mitochondrial ATP synthase is evident throughout most cell types of the body and precedes the manifestation of any clinical signs (Cook et al., 2002). Neuropathological changes include loss of cellular architecture, neuronal loss and neuroinflammation. There is a progressive loss of photoreceptor cells in the retina (Cook et al., 2002) CLN6 gene, mutations and gene product The human CLN6 gene located on chromosome 15q23 contains 7 exons and encodes a 311-amino acid membrane protein (Sharp et al., 1997, 2003; Gao et al., 2002; Wheeler et al., 2002). To date, 71 different disease-causing mutations of the CLN6 gene are known in humans ( The ovine CLN6 gene located on sheep chromosome 7q13-15 and the nclf mouse gene located on murine chromosome 9 are both syntenic with the human chromosomal location (Bronson et al., 1998; Broom et al., 1998). The disease-causing mutation in South Hampshire sheep is a 402 bp deletion and 1 bp insertion (g.-251_+150del and g.+150_151insc) leading to the deletion of some 5 UTR, the ATG start codon and the whole of exon 1 (Tammen et al., 2006; Mohd Ismail, 2014). In the affected Merino sheep, CLN6 disease is caused by a missense mutation (c.184c>t) leading to a single amino acid change (p.arg62cys) (Tammen et al., 2006). The mutation in nclf mice is a 1 bp insertion in exon 4 (c.307insc) leading to a frameshift and a premature stop codon (Gao et al., 2002; Wheeler et al., 2002). The CLN6 protein is a transmembrane endoplasmic reticulum (ER) resident protein of 27 kda, modelled to have an N- terminal cytoplasmic domain, seven transmembrane domains and a luminal C-terminus (Heine et al., 2004, 2007; Mole et al., 2004). The function of the CLN6 protein remains unknown, but involvement in lysosomal endocytosis of exogenous protein has been suggested (Heine et al., 2004; Mole et al., 2004). Because the protein is unknown, the effects that the different mutations have on the gene products in humans and the animal models are not resolved. 15
31 1.5 CURRENT STRATEGIES OF THERAPY FOR THE NCLS Because only limited information is available about the downstream effects of the mutations in the different NCLs, most currently investigated treatment strategies are based on replacing either the mutated gene or supplying the affected protein. Because the NCLs appear to affect the entire brain, therapies most likely need to be delivered in a manner that reaches the entire brain (Chang et al., 2011). The blood brain barrier (BBB) limits the possibilities of systemic administration of therapies to the brain. Therefore, the current treatment trials for NCLs are focusing on protein or gene delivery directly to the brain, either through intraparenchymal injections or through delivery via the cerebrospinal fluid by intracerebroventricular or intrathecal injections. Lysosomal proteins are synthesised and glycosylated in the rough endoplasmic reticulum and transported through vesicular trafficking to the Golgi apparatus where they undergo posttranslational modification and sorting processes (Kornfeld, 1987). During these processes soluble lysosomal enzymes receive a mannose or mannose-6-phosphate and bind to a mannose-6- phosphate receptor which allows trafficking towards the lysosome. However, approximately 5-20% of the lysosomal enzymes do not reach the lysosome but are secreted from the plasma membrane of the cell and therefore available for endocytosis by other cells (Kornfeld, 1987). After endocytosis these enzymes can be correctly sorted and trafficked to the lysosome. This enables the phenomenon called cross-correction whereby a cell with a lysosomal enzyme deficiency can be phenotypically corrected though uptake and utilisation of lysosomal enzymes from other cells which are functioning normally (Fratantoni et al., 1968). Cross-correction has, since its discovery, been seen as a promising strategy for treatment of LSDs in general (Sands & Davidson, 2006). However, it is likely that different treatment strategies are needed for the different types of NCLs, depending on whether the involved gene codes for a soluble or membrane bound protein (Chang et al., 2011) Enzyme replacement therapies Current trials are exploring the efficacy of enzyme replacement in the NCLs. It has to be kept in mind that enzyme replacement is likely to have an effect only in the NCLs involving soluble proteins (e.g. CLN1, 2, 5, 11, 10 and 13). CLN2 disease is currently the only NCL for which experimental enzyme replacement therapy in mouse and dog models has led to clinical trials in children, which yielded encouraging results (Vuillemenot et al., 2011; Katz et al., 2014; Schulz et al., 2016). Recombinant CLN2 (TPP1) enzyme is now commercially available for CLN2 patients. Nevertheless, challenges are still to be overcome to improve the long-term feasibility for life-long enzyme replacement therapy in neuropathic LSDs, such as the NCLs. In non-neuropathic LSDs, like Fabray, Gaucher and Pompe diseases, it is possible to deliver the enzyme systemically, either by injection or orally, because it 16
32 does not need to cross the BBB to reach its target (see review by Ortolano et al., 2014). However in NCLs and other neuropathic LSDs, the target is the central nervous system (CNS) and the enzyme replacement trials mentioned above are based on biweekly delivery of the exogenous enzyme directly to the cerebrospinal fluid (CSF) through either intracerebroventricular or intrathecal (lumbar) catheters (Katz et al., 2014; Schulz et al., 2016). One of the dogs in the described study developed asymmetrical hydrocephalus and 46% of the children experienced pyrexia, both of which could be attributed to the implanted catheter (Katz et al., 2014; Schulz et al., 2016). Other studies encountered adverse effects of longitudinal intrathecal catheterisation such as meningeal infiltrates, catheter track inflammation, spinal cord compression, fibrosis and gliosis, and nerve fibre degeneration (Butt, 2011) Gene therapies An alternative option for the treatment of the NCLs and other LSDs is viral mediated gene therapy. Using a recombinant viral vector, a functional copy of the mutated or missing gene can be introduced to diseased cell populations, leading to endogenous expression of the missing gene product, and also enabling cross-correction. This is an advantage in tissues that are hard to access, like the CNS, because not all cells need to be transduced if sufficient amounts of the gene product are secreted from those that are. Viral vectors commonly used for gene therapy are the adenoassociated viruses (AAV) (reviewed by Naso et al., 2017). Recombinant episomal DNA delivered with the AAV does not integrate into the host DNA and can therefore not be transferred from one cell to another. The effect of gene therapy is likely to decline over time as transduced cells die through either natural turnover or pathological events. The first successful gene therapy trial for an NCL was performed in a CLN1 mouse model and led to reduced storage accumulation and increased brain weight and cortical thickness (Griffey et al., 2004). Since then, gene therapy has been performed in several animal models of NCLs, including CLN2 mice, CLN3 mice, CLN2 dogs, and CLN5 and CLN6 sheep yielding promising results (Haskell et al., 2003; Sondhi et al., 2014; Katz et al., 2015; Palmer et al., 2015; Mitchell, 2016; Mitchell et al., 2017). These have led to initial clinical trials in humans for CLN2 disease (Worgall et al., 2008), and more are currently underway ( NCT , NCT ). The current gene therapy research programmes in ovine CLN5 and CLN6 models have also yielded promising results and a human trial for AAV mediated CLN6 gene therapy was initiated in 2016 (NCT ). An important advantage of gene therapy over enzyme replacement therapy is the reduced need for repetition of the therapy. However, there are questions about possible immune responses, especially in the case of repeated treatment, as well as vector safety and possible risks of overexpression of the exogenous gene that need to be addressed (reviewed by Sands & Davidson, 2006). 17
33 1.6 EXPERIMENTAL RATIONALE The well-established ovine models of NCL have contributed greatly to NCL research over recent decades and current gene therapy trials are yielding promising results (Palmer et al., 2015; Mitchell, 2016; Mitchell et al., 2017). An advantage of large animal models for translational research is the capacity for longitudinal in vivo monitoring of disease progression in individual animals, reducing the numbers of animals required and providing insight into individual variation that needs to be anticipated in the human population (section 1.1). Longitudinal monitoring has been fairly limited in ovine NCL research, especially in the descriptions of neuropathological progression of the animals, which has been based largely on time point observations requiring sacrifice of animals. Although in vivo imaging through computed tomography (CT) has been utilised in ovine NCL research for over a decade, the focus has been mainly on time point averages of animal groups instead of individual longitudinal observations (Woods et al., 1993; Bell et al., 2005; Prof. David Palmer, personal communication). Other imaging techniques for the longitudinal in vivo monitoring of neuropathology in ovine NCL have had little investigation so far. One MRI study performed on CLN6 affected South Hampshire sheep (Sawiak et al., 2015) indicated the usefulness of this technique for observing the development of neuropathological events in individual sheep. However, the study was performed entirely on late-stage diseased animals, from 16 to 22 months of age, at which point the neuropathological changes are already well established (Oswald et al., 2005, 2008). Recently, advances have been made within the longitudinal descriptions of behavioural changes, cognition and neurological status in ovine NCL (Mitchell, 2016). Some of these tests rely partly on the ability of animals to see but do not test vision alone. Some observations have been conducted on the development of retinal pathology (section 1.2.7), however currently no techniques for the longitudinal in vivo monitoring of retinal pathology in ovine NCL are established. Recent gene therapy trials that yielded promising results for the treatment of brain atrophy in the sheep NCL models, did not halt the retinal pathology (Mitchell, 2016; Mitchell et al., 2017). To date, three active ovine models of NCL exist (sections ; ; ). The CLN5 Borderdale and CLN6 South Hampshire models are well described in terms of neuropathology and behavioural changes (Oswald et al., 2005, 2008; Mitchell, 2016). Behavioural changes in the CLN6 Merino model are also well described, however the neuropathological cascade in this model is described in less detail than that it is in the two other models (Cook et al., 2002). To be able to utilise all three models fully and to compare their relative disease progression, neuropathology and treatment efficacy, all three models should be described to a similar level of intensity and the techniques for neuropathological assessment and longitudinal in vivo monitoring should be aligned. 18
34 1.6.1 Research aims and objectives The aim of this study was to establish techniques for longitudinal in vivo monitoring that can be correlated with the progression of neuropathological events in all three ovine NCL models, both in the natural progression of the diseases and in trials of potential therapeutic regimes. Initially there was a need to describe the neuropathology of the CLN6 Merino model using histology and immunohistochemistry, to provide a background of information similar to that which has been developed for the CLN6 South Hampshire and the CLN5 Borderdale models (Oswald et al., 2005, 2008; Mitchell, 2016). This enabled all three sheep models to have a standard base for comparison. Secondly, longitudinal in vivo neuroimaging, using both CT and MRI, was employed to determine its utility as a monitoring tool in the different models. Standardised techniques for CT scanning were established for the CLN6 South Hampshire and the CLN5 Borderdale models and MRI scanning was explored in pilot studies involving all three sheep models. To monitor the progression of blindness, ERG was used for the longitudinal in vivo monitoring of retinal pathology in the CLN6 South Hampshire and CLN5 Borderdale models. Finally, the usefulness of these monitoring techniques for assessing the efficacy of experimental therapeutic protocols was explored in the CLN5 Borderdale model. 19
35 2 GENERAL METHODS 2.1 ANIMALS Breeding regimes The sheep described in this study are part of the ovine NCL research flocks that are maintained at Lincoln University and the University of Sydney. The first CLN6 flock was established after the description of the disease in South Hampshire sheep in 1976 (Jolly & West, 1976), and the second one was discovered in 1997 in Merino sheep (Tammen et al., 2001). The CLN5 flock was established after the discovery of NCL in a group of Borderdale sheep in 2002 (Jolly et al., 2002). The South Hampshire and the Borderdale flocks are maintained through mating of heterozygous ewes with homozygous affected rams, which results in a 1:1 ratio of heterozygous and affected offspring born each year. Throughout the maintenance of the two flocks, cross breeding of affected rams with wildtype ewes of other breeds (Friesian, Finn and Coopworth) has been conducted to introduce new genetic material and thereby guarantee genetic diversity and improve sheep characteristics such as fertility, mothering ability and handling behaviour. This has resulted in obligate heterozygous offspring from which the ewes have been included in the subsequent breeding program. The CLN6 Merino research flock is maintained by mating of heterozygous parent animals which results in a 2:1:1 ratio of heterozygous, normal, and affected offspring Genotyping Causative mutations for all the ovine NCL models have been identified (sections and 1.4.3). For the CLN6 South Hampshire and CLN5 Borderdale genotyping, genomic DNA (gdna) was extracted from Whatman FTA cards (Whatman, Brentford, Middelsex, UK) or from EDTA blood samples using Quick-gDNA Miniprep extraction kits (Zymo Research Corp., Irvine, CA, USA). The CLN6 South Hampshire genotyping is based on a gene polymorphism (c.822g>a) used as an indirect disease marker, which is located on the ovine CLN6 gene, 111 bp downstream from the 5 end of exon 7 (Tammen et al., 2006). This leads to a change in the restriction site for the enzyme HaeII, depending on whether the third base of a triplet coding for alanine is either A or G. The South Hampshire research flock is configured so that all affected animals are AA, all normal animals are GG and all carriers are AG. Based on this, all offspring produced in the South Hampshire flock were genotyped by polymerase chain reaction (PCR) amplification from gdna, enzyme cleavage and agarose gel separation (Tammen et al., 2006). This method has produced reliable results over 15 years with over 900 sheep. However, when crossbreeding is carried out to introduce new genetic material into the 20
36 research flock, it has to be borne in mind that screening of other breeds has shown that the A allele is not uncommon in wildtype animals (Tammen et al., 2006). The disease causing mutation in the CLN5 Borderdale flock is a single nucleotide substitution at a consensus splice site (c.571+1g>a), which leads to excision of exon 3 (Frugier et al., 2008). gdna was extracted as described above and amplified through PCR with primers in exon 3 and intron 3 resulting in a 538 bp product. This was then sequenced at the Lincoln University Sequencing Facility on an Applied Biosystems 3130cl Gene Analyser (Applied Biosystems, Foster City, CA, USA). The method for genotyping of CLN6 Merino sheep is based on an alteration of the cleavage site for the restriction enzyme HaeIII enabled by the disease causing single nucleotide substitution (c.184c>t) and is described in detail (Tammen et al., 2006). In brief, gdna is extracted from EDTA blood samples using Qiagen DNeasy blood and tissue kit (Qiagen, Hilden, Germany) and amplified through PCR with primers in exon 2. The resulting 151 bp products are digested with HaeIII (New England Biolabs, Ipswich, MA, USA) and separated on agarose gels. The normal PCR amplicon is cleaved to produce a 50 bp fragment and a 101 bp fragment, but the 151 bp affected gene product remains un-cleaved. Heterozygous carriers have all three products (Tammen et al., 2006). 2.2 STATISTICS All statistical analyses were performed in Microsoft Excel 2013 (Microsoft Corp., Seattle, WA, USA) and GenStat for Windows 16th Edition (VSN International 2011, Hemel Hempstead, UK). For the neuropathological studies, means and standard errors of the mean (SEM) were calculated for each set of measurements for each animal. The means were used to compare affected, normal and treated sheep. Depending on study design, the appropriate type of analysis of variance (ANOVA) was used, i.e. one way, two way or repeated measure ANOVA. Where sample sizes were too small or repeats were too inconsistent to allow for the use of ANOVAs, results were grouped across all ages and Student s t-tests were performed to compare groups. Results were regarded as significant where P The magnitude of effects were expressed either as percentage of normal or by using Cohen s d as measure of effect size. These were regarded as follows: 0.2 = small; 0.5 = medium, 0.8 = large; 1.3 = very large. Cohen s d was calculated as: Chohen s d = (x 1 x 2 ) s pooled Where the pooled standard deviation was calculated as: s pooled = (n 1 1)s (n 2 1)s 2 2 n 1 + n
37 3 NEUROPATHOLOGY IN CLN6 AFFECTED MERINO SHEEP 3.1 INTRODUCTION Neuropathological studies of human NCLs are limited and mainly based on biopsy and post mortem findings, therefore do not describe the entire brain or development of neuropathology systematically. Main findings from these samples include autofluorescent storage bodies, progressive neuronal loss, astrocytosis and macrophage infiltration (Haltia, 2003; Jadav et al., 2014). Using the sheep models to investigate neuropathology at different time points will increase the understanding of the pathologic cascade and help identifying time windows and possible starting points for therapies. Detailed studies regarding the natural history of ovine NCL have been carried out in the CLN6 South Hampshire model and the CLN5 Borderdale model. The general sequence of clinical and neuropathological events in the two models is strikingly similar, with only a slight difference in the time of onset, where CLN5 affected animals show more pronounced neuropathological changes earlier than CLN6 affected South Hampshire sheep (Oswald et al., 2005; Kay et al., 2006; Mitchell, 2016). Another form of ovine CLN6 deficiency disease has been described in Merino sheep (Tammen et al., 2001, 2006; Cook et al., 2002). The genetic cause for the CLN6 disease in these is remarkably different to that of the CLN6 South Hampshire sheep, as the disease causing mutation in the Merino sheep is a (c.184c>t) missense mutation leading to a single amino acid change (p.arg62cys) whereas the one in South Hampshire sheep is a 402 bp deletion and 1 bp insertion (g.-251_+150del and g.+150_151insc) leading to the deletion of some 5 UTR, the ATG start codon and the whole of exon 1 (Tammen et al., 2006; Mohd Ismail, 2014). However, preliminary natural history descriptions have shown that initial clinical signs in CLN6 Merino sheep can be detected from between 7 and 12 months of age and that the macroscopic and microscopic changes resemble those of both the CLN5 Borderdale sheep and the CLN6 South Hampshire sheep at end-stage disease (Cook et al., 2002). To date, 71 disease causing mutations of the CLN6 gene are known in humans ( and 47 of these result in variant late infantile NCL (vlincl). The remainder cause type A and B forms of Kufs disease, as well as other forms of adult NCL, a teenage NCL and a cerebellar ataxia without blindness ( Both known forms of ovine CLN6 disease (Merino and South Hampshire) have been classified as models for vlincl (Tammen et al., 2001; Cook 22
38 et al., 2002). Nevertheless, in the light of the wide range of mutations leading to human vlincl it is important to investigate similarities and differences between these two ovine forms of CLN6 deficiency disease. 3.2 AIMS AND OBJECTIVES The primary aim of this study was to describe the neuropathology of ovine CLN6 disease in Merino sheep so this form of ovine NCL could be compared to the two other known forms. To achieve this, the investigations on brains of CLN6 affected Merino sheep and unaffected controls reflected the work that had been carried out previously with CLN5 Borderdale sheep and CLN6 South Hampshire sheep. The following themes were investigated: gross pathological changes and brain atrophy cortical thinning and changes in cellular architecture white matter changes neuroinflammation neurogenesis expression of the endogenous CLN5 and CLN6 proteins accumulation of fluorescent storage material 3.3 MATERIALS AND METHODS Tissue collection Brains from 8 CLN6 affected (CLN6 -/- ) Merino sheep, both male and female, and from 5 unaffected controls (both CLN6 +/- and CLN6 +/+ ) were included in the study (Table 3.1). The brains were collected at Sydney University and at Lincoln University between the years 2008 to For euthanasia, sheep were either anaesthetised by intravenous (IV) injection of a mixture of 0.5 mg/kg life weight (LW) diazepam and 5 mg/kg LW ketamine, combined in the same syringe, or stunned using a captive bolt device between vertebrae C1 and C2. Anaesthesia or stunning was followed by immediate exsanguination and formalin fixation of the brain. While most brains were fixed by perfusion and removed from the head afterwards, several brains were removed immediately after exsanguination and fixed by immersion in 10% formalin in 0.9% saline solution at ph 7.4. Perfusion fixation and tissue preparation was performed using the method described by Oswald et al. (2005). Using a gravity flow system, blood was flushed from the head through one of the carotid arteries using 0.9% saline solution at 37 C. Once all blood was removed, the heads were perfused using approximately 500 ml 10% formalin in 0.9% saline solution at ph 7.4, 37 C. Following perfusion fixation, the skulls 23
39 were opened and the brains removed intact. The medulla oblongata were severed transversely at a point perpendicular to the caudal margin of the cerebellum and the brains were weighed. The brains were bisected along the sagittal midline and kept in 10% formalin in 0.9% saline solution for one week after collection. Thereafter, the cerebral hemispheres were placed in an equilibration solution consisting of 10% ethylene glycol and 20% sucrose in phosphate buffered saline solution (PBS) at 4 C for up to one week and then stored at -80 C until sectioning. Cryosectioning was performed on a freezing sliding microtome (MICROM International, Walldorf, Germany). Consecutive sagittal 50 µm sections were cut through the mediolateral extent of the hemispheres. The sections were individually placed into the wells of a 96-well plate containing cryoprotectant (30% ethylene glycol, 15% sucrose and 0.05% sodium azide in PBS, ph 7.4) and stored at -20 C until further processing. Following the definitions provided by Oswald et al. (2005), sagittal levels 1 5 were defined during cryosectioning (Figure 3.1). Different brain regions of interest can be identified on different levels (Figure 3.1 and Table 3.2). Table 3.1 Summary of brains available at each age for histology and immunohistochemistry The experiments were: Nissl staining for cortical thickness measurements Nissl; Luxol fast blue staining for measurements of the corpus callosum LFB, glial fibrillary acidic protein to detect astrocytes GFAP; α-dgalactose specific isolectin IB4 from Griffonia simplicifolia to detect microglia GSB4; Polysialylated-neural cell adhesion molecule to detect neurogenesis PSA-NCAM; and detection of autofluorescent storage bodies SB. Controls were both unaffected heterozygous (CLN6 +/- ) and other normal (CLN6 +/+ ) sheep. Staining Age Genotype Nissl LFB GFAP GSB4 PSA- NCAM SB CLN5 CLN6 2 Affected Control Affected Control Affected Control Affected Control Affected Control
40 Table 3.2 Regions of interest in the brain and sagittal levels on which the regions can be found Parieto-occipital cortex POC, lateral geniculate nucleus LGN, entorhinal cortex Ent, somatosensory cortex S1, hippocampal formation HP, frontal association cortex FC, occipital white matter Occ WM, primary visual cortex V1, primary motor cortex M1, caudate nucleus CN, corpus callosum Cc, cerebellum Cer. POC LGN ENT S1 HP FC Level 2 * * * Level 3 * Occ WM V1 M1 CN Cc Cer Level 4 * * * * Level 5 * * * * * 25


41
42 3.3.2 Histology Nissl staining Sections from sagittal levels 2-5 were mounted on glass slides using a chrome alum mounting solution (0.5% gelatine, 0.05% chrome potassium sulphate (CrK(SO 4)2.12H 2O) and 0.05% sodium azide (NaN 3) in water) and air-dried overnight. Sections were dehydrated through a series of increasing ethanol concentrations and cleared with xylene. The sections were then rehydrated through a series of decreasing ethanol concentrations, washed in water and incubated in prewarmed Nissl solution (0.05% cresyl violet acetate, Sigma C5042, Sigma-Aldrich, St. Louis, MO, USA; 0.05% acetic acid in water) at 37 C for 10 min. Thereafter sections were washed in water, dehydrated through the ethanol gradient, cleared with xylene and coverslipped in p-xylenebis(pyridinium bromide) (DPX, BDH, Poole, England) Luxol fast blue Sections from sagittal levels 4 and 5 were kept in individual wells of 6-well plates, were washed in water, dehydrated through an increasing ethanol gradient and incubated in Luxol fast blue (LFB) solution (0.1% Solvent Blue 38, Sigma-Aldrich, St. Louis, MO, USA; in 95% ethanol) at 40 C overnight. Sections were then rinsed in 95% ethanol, rehydrated through a series of decreasing ethanol concentrations and finally rinsed in water. Sections were de-stained in 0.05% lithium carbonate (LiCO 3) for 3 min, rinsed twice with 70% ethanol and flooded with water. Finally, sections were mounted in 1:1 glycerol in water, air-dried briefly, coverslipped with glycerol, pressed for up to 7 days and sealed with nitrocellulose (nail polish). For detection of auto-fluorescent storage bodies, level 5 sections were mounted on glass slides in chrome-alum solution, air-dried, coverslipped in glycerol, pressed and sealed as above Immunohistochemistry All immunohistochemistry was based on an avidin-biotin amplification system and 0.05% (0.5 mg/ml) 3, 3 -diaminobenzadine (DAB; D5637; Sigma-Aldrich) and 0.01% H2O2 in PBS was used to visualize staining. The following primary antibodies were used (Table 3.3): rabbit anti-cow glial fibrillary acidic protein (GFAP, 1:5000, Z0334, polyclonal; Dako, Ely, England) to detect astrocytes; rabbit anti-sheep CLN5 and CLN6 (1:500, polyclonal; Dr Stephanie Hughes, University of Otago, Dunedin, New Zealand) to detect the endogenous proteins; α-d-galactose specific isolectin IB4 from Griffonia simplicifolia (GSB4, biotinylated, 1:500; B-1205; Vector Laboratories, Burlingame, CA, USA) to detect microglia and mouse anti-polysialylated-neural cell adhesion molecule (PSA-NCAM, 1:1000; MAB5324, monoclonal; Chemicon, Temecula, CA, USA) to indicate neurogenesis and migrating 27
43 neurons. Secondary antibodies used were (Table 3.3): biotinylated goat anti-rabbit IgG (1:1000; B7389; Sigma-Aldrich) for GFAP, CLN5 and CLN6 and affinity purified biotin-conjugated IgM (1:500; AP500B; Chemicon) for PSA-NCAM. All antibodies were diluted in 10% normal goat serum (NGS, Life Technologies NZ Ltd, Auckland, NZ) in PBS containing 0.3% Triton-X (PBST). All immunohistochemistry was carried out on free-floating cryosections in 6-well plates on a rocking platform, with a volume of 3 ml of each solution in each well. All sections belonging to the same experiment were processed simultaneously. Sagittal levels used for each experiment were: GFAP and GSB4: levels 2, 4, and 5; CLN5 and CLN6: level 4 and PSA-NCAM: level 5. Sections were washed in PBS prior to the experiment to remove all residual cryoprotectant and each step was followed by three PBS washes. Endogenous peroxidase activity was quenched with either 1% H 2O 2 in PBS (CLN5, CLN6, GFAP, PSA-NCAM) or with 1% H 2O 2 in 50% MeOH in PBS (GSB4) for 30 min at room temperature. Thereafter the sections were blocked in 15% NGS in PBST for at least 60 min prior to incubation with the appropriate primary antibody overnight at 4 C. After this, sections were incubated with the corresponding secondary antibody for 2 h, and then with ExtrAvidin horseradish peroxidase (HRP, 1:1000, E-2886, Sigma-Aldrich) in PBST for 2 h. Staining was visualized through incubation with DAB for a standardized length of time (Table 3.3). The DAB reaction was stopped by applying ice-cold PBS to the wells. After the final set of washes, the sections were mounted on glass slides using the same chrome alum mounting solution as used for histology, air-dried overnight, dehydrated in 100% ethanol, cleared in xylene and coverslipped with DPX. Table 3.3: Primary and secondary antibodies and standard DAB incubation times CLN5 CLN6 Primary antibodies Secondary antibodies, biotinylated DAB Supplier Dilution Host (1 ) Host (2 ) Supplier Dilution incubation time University of Otago 1:500 Rabbit Goat Sigma 1: min University of Otago 1:500 Rabbit Goat Sigma 1: min GFAP Dako 1:5000 Rabbit Goat Sigma 1: min GSB4 Vector 1:500 5 min PSA- NCAM Chemicon 1:1000 Mouse Rabbit Chemicon 1:500 3 min 28
44 3.3.4 Microscopy All microscopy and imaging was carried out on a Nikon Eclipse 50i microscope with a Nikon Digital Sight DSFi1 camera using NIS-Elements Software (Nikon Instruments Inc., Tokyo, Japan). Cortical thicknesses of the following regions were measured perpendicular to the surface from the pia to the boundary between grey and white matter on Nissl stained sections using the x4 microscope lens: primary visual cortex, primary motor cortex, frontal association cortex, somatosensory cortex, parieto-occipital cortex, entorhinal cortex and cerebellum. The thickness of the corpus callosum was measured in the same manner on LFB stained sections. At least 25 measurements were obtained for each region. GFAP and GSB4 stained sections were evaluated for staining intensity of the different cortical layers in the primary visual cortex, motor cortex and parieto-occipital cortex as well as in the lateral geniculate nucleus, the hippocampus, the caudate nucleus and the occipital white matter. All images were taken through the x20 lens at fixed microscope settings for each experiment. From each cortical layer five images were taken containing cortical levels I-III and another five images were taken containing levels IV-VI. Five images were also obtained from each non-cortical region. The images were then analysed in ImageJ 1.51a (National Institutes of Health, Bethesda, MD, USA), using the colour thresholding function to determine the percentage of DAB staining in each image. PSA-NCAM sections were analysed in a descriptive manner. Cell counts were performed in the hilus of the hippocampus on CLN5 and CLN6 stained sections using the x20 lens. Stained cells were counted in 5 fields of view (FOV) for each animal. Cell counts were compared between CLN6 -/-, CLN6 +/- and CLN6 +/+ animals. Fluorescent microscopy of storage material was performed on unstained sections using a nm excitation/510 nm emission filter. Digital photographs were obtained from 5 FOV of the cerebellum, caudate nucleus, primary motor cortex and primary visual cortex from each animal. The images were then analysed in ImageJ 1.51a (National Institutes of Health, Bethesda, MD, USA), using the colour thresholding function to determine the percentage of fluorescence in each image Brain weight data Brain weights were recorded when the brains were collected for neuropathological analysis. Additional recordings of brain weights of CLN6 -/- Merino sheep and unaffected control animals at post mortem examination are included (courtesy Assoc. Prof Imke Tammen and Dr Nadia Mitchell). These brains were collected in a similar matter as for neuropathology. 29
45 3.3.6 Statistical analyses Means and SEM were calculated from each set of measurements for each animal (% area stained, cortical and corpus callosum measures, number of stained cells). Student s t-tests were performed to test each region separately for the effect of genotype. Two-way ANOVA were performed to test for the effects of genotype, brain region and upper and lower cortical layers where appropriate. P 0.05 was regarded as significant. 30
46 3.4 RESULTS Brain weights and general development Brains of normal control sheep grew steadily from birth, reaching a mature weight of 121 g ± 3 g (n = 17) at 18 to 20 months of age. The earliest age when brain weights were available was 3 4 months. Already at this age, the brain weight of affected animals was reduced compared with unaffected control animals (Table 3.4). The loss of brain mass in these animals continued, and at 12 months the brain weight of affected animals was reduced to 68% of that of controls. At end-stage disease, around months of age, it was only 52% of that of controls. Only one brain weight of an animal over 20 months was recorded, and its brain mass was less than half of that of controls (Table 3.4). Table 3.4 Mean brain weights of affected and control sheep at different ages Mean formalin fixed brain weight ± SEM of CLN6 -/- sheep and controls (CLN6 +/- and CLN6 +/+ ) grouped by age. No brains were available to be analysed at those ages where values are missing. Percentages are the ratio of affected to control weights. Age group (months) Control (g) Affected (g) Affected/Control ± 2 (n = 4) 73 ± 4 (n = 3) 82% ± 4 (n = 5) 84 ± 10 (n = 3) 84% (n = 1) 69 ± 3 (n = 4) 68% ± 4 (n = 2) 70 ± 4 (n = 5) 62% ± 6 (n = 4) ± 3 (n = 17) 62 ± 2 (n = 8) 52% Over ± 4 (n = 7) Cortical thinning Cortical thicknesses were measured on Nissl stained sections. No cortical thinning was seen in control animals and the development of cortical thickness largely followed the increase in brain weight, whereas in affected animals cortical thinning was apparent in all regions except the cerebellum compared with controls (Figure 3.2) (P < 0.05). Most severe thinning was seen in the parieto-occipital and primary visual cortices, which were reduced to 35% and 41% respectively of those of normal brains at 19 months of age. Least affected were the somatosensory and primary motor cortices, which were reduced to 61% and 76% respectively compared with normal cortices at 19 months. Cortical thinning was obvious on macroscopic examination of sagittal sections (Figure 3.3) and microscopic examination revealed that the atrophy could be observed in most cortices by 7 months, and loss of cytoarchitecture and layer definition was observable in the primary visual cortex at 13 months of age and reached the motor cortex by end-stage disease at 19 months (Figure 3.3). However, layer V pyramidal cells could still be identified at end-stage disease. Accumulation of cellular aggregates at the layer I/II boundary in the primary visual cortex was evident early, at 7 31
47 months of age, when a few aggregates could be found. From this age on the abundance of aggregates increased and was substantial in the primary visual cortex at 19 months of age (Figure 3.3, B). Cellular aggregates were also present in the parieto-occipital cortex at 13 months, in the frontal association cortex at 16 months and in all cortices that were investigated besides the entorhinal cortex at 19 months. There was no evidence of atrophy in subcortical structures and cerebellum. Cortical thickness (µm) Parieto-occipital cortex 2000 Primary visual cortex 2000 Entorhinal cortex Age (months) Age (months) Age (months) Cortical thickness (µm) Frontal association cortex 2000 Somatosensory cortex 2000 Primary motor cortex Age (months) Age (months) Age (months) Cortical thickness (µm) Cerebellum Age (months) CLN6-/- CLN6+/- Figure 3.2 Quantitative assessment of cortical thinning in CLN6 Merino sheep Brains from affected sheep (CLN6 -/- ) and unaffected controls (CLN6 +/- ) were assessed. For each region, the cortical thickness was measured from the pial border to the beginning of the white matter. Each point represents the mean thickness of 25 measurements per animal at different ages (7 months, 13 months, 16 months and 19 months). Standard errors for each point are not displayed but were within 0.9% - 6.3% of the means. See Table 3.1 for n. Student s t-test showed significant (P < 0.05) cortical thinning in all regions except the cerebellum when compared over all ages. 32


48
49 3.4.3 White matter changes To investigate the effects of disease on white matter, measurements of the thickness of the corpus callosum were performed on LFB stained sections. The thicknesses of the corpus callosum of normal animals increased steadily reaching their maximum (1077 µm ± 30 µm) between 15 and 18 months of age. Those of affected animals were normal at 7 months of age, but were reduced to approximately 60% of normal at 13 months of age and remained relatively stable (658 µm ± 66 µm) throughout the consecutive ages. This difference was significant when compared across all ages after the thinning was observed (P < 0.01). See Table 3.1 for n Glial activation Activated astrocytes GFAP is a marker for activated astrocytes which are a defining feature of neuroinflammation. After immunohistochemical staining for GFAP, thresholding analysis was performed to quantify the astrocytic activation in CLN6 affected animals and controls. A low amount of GFAP staining was seen along the pial surface in control animals of all ages as well as throughout the grey matter and to a greater degree in the white matter, with quiescent astrocytes showing stellate morphology (Figure 3.4). When compared across all ages, brains from affected animals had increased astrocytosis in all regions except the caudate nucleus compared with controls (P < 0.05) (Figure 3.5). The astrocytes present in the affected animals were hypertrophic and formed a dense network in the cortical layers, spreading from the outer layers (I-III) to the lower layers (IV-VI) with disease progression (Figure 3.4). When comparing the stained area in the different regions across all ages in affected animals only, the parieto-occipital (POC) and primary visual (V1) cortices had the highest amount of staining (POC: 25.2% ± 3.7%; V1: 24.5% ± 5.2%), followed in frequency by the primary motor cortex (M1: 17.4% ± 5.7%) (Figure 3.5). The areas stained in the subcortical regions such as the caudate nucleus (CN) and the lateral geniculate nucleus (LGN) were significantly smaller (P < 0.001) than in the cortical regions (CN: 4.0% ± 2.3%; LGN; 5.2% ± 2.2%) (Figure 3.5). The areas stained in the hippocampus and occipital white matter were 14.3% ± 3% and 14.8% ± 3.5%. For the areas stained in the cortical layers I-III and IV-VI, the only region in which a difference was found was the parietooccipital cortex, where the area stained in the upper layers (I-III: 30.6% ± 3.6%) was significantly greater than in the lower layers (IV-VI: 19.8% ± 4.2%) (P < 0.05) (Figure 3.5). 34
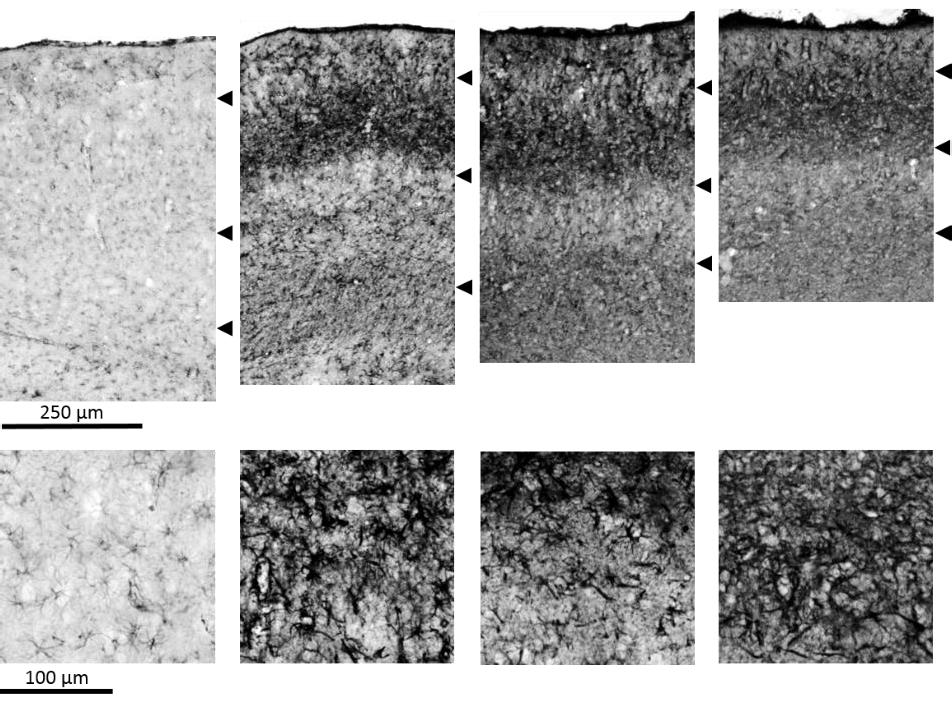


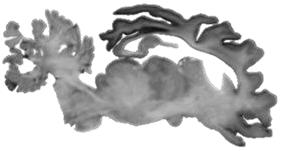


50
51 % of area stained Caudate nucleus 30 Hippocampus 30 Lateral geniculate nucleus 30 Occipital white matter Age (months) Age (months) Age (months) Age (months) 50 Primary motor cortex 50 Parieto-occipital cortex 50 Primary visual cortex CLN6 -/- I-III % of area stained Age (months) Age (months) Age (months) CLN6 +/- I-III CLN6 -/- IV-VI CLN6 +/- IV-VI Figure 3.5 Astrocytic activation in brains of CLN6 affected Merino sheep and unaffected control animals Quantitative thresholding of percentage of area stained after GFAP immunostaining of sagittal sections of brains at different ages expressed as mean percentage of areas stained in 5 fields of view for each animal for each region. Error bars represent standard error of the mean where n 2. See Table 3.1 for n. Results of the primary motor cortex, parieto-occipital cortex and primary visual cortex were analysed seperately for both upper (I-III) and lower (IV-VI) laminae. 36
52 Microglia GSB4 is a marker for activated microglia and thus for neuroinflammation. Thresholding analysis was performed to quantify microglial activation that was revealed by immunohistochemical staining with GSB4 of sagittal brain sections from CLN6 affected animals and unaffected controls at different ages. No activation of microglia was seen in the control animals at any of the ages (Figure 3.6). At all ages, brains from affected animals had increased microglial activation in all cortical regions, the occipital white matter and the lateral geniculate nucleus, but not in the caudate nucleus and hippocampus compared with controls (P < 0.05). The microglia present in the affected animals at 7 months of age were confined to hypertrophic clusters, mainly located in the outer cortical laminae (I-III) (Figure 3.7). By 13 months of age two distinct bands of activated cells were obvious, spanning most of the cortical mantle though layers II-III and V-VI (Figure 3.7). These bands became denser and less distuingishable as the disease progressed and the loss of layer definition described earlier occurred. No difference were observed in the staining density in upper and lower cortical layers in any of the regions (P > 0.05) Neurogenesis The extent of neurogenesis was investigated through immunohistochemical staining with PSA- NCAM, which is a marker for developing and migrating neurons. Some degree of neurogenesis was observed in the 7 month-old control but this was reduced in older control sheep. In contrast, the affected animals showed increased staining with PSA-NCAM over time, indicating ongoing neurogenesis and migration. The staining was largely increased in the rostral end of the SVZ of affected animals of all ages, showing a dense mesh of fibres in this area. Bands of migrating cells extending rostral and dorsal from the SVZ through the white matter tracts were observed in affected animals of all ages. Aggregates of densely stained cells were observed in increasing amounts at the layer I-II boundary of most cortical regions (Figure 3.8). 37
53 % of area stained Caudate nucleus Hippocampus Laterl geniculate nucleus Occipital white matter Age (months) Age (months) Age (months) Age (months) % of area stained Primary motor cortex Parieto-occipital cortex Primary visual cortex CLN6 -/- I-III CLN6 +/- I-III CLN6 -/- IV-VI CLN6 +/- IV-VI Age (months) Age (months) Age (months) Figure 3.6 Activation of microglia in brains of CLN6 affected Merino sheep and unaffected control animals Quantitative thresholding of percentage of area stained after GSB4 immunostaining of sagittal sections of brains at different ages expressed as mean percentage of areas stained in 5 fields of view for each region. Error bars represent standard error of the mean where n 2. See Table 3.1 for n. Results of the primary motor cortex, parietooccipital cortex and primary visual cortex were analysed seperately for both upper (I-III) and lower (IV-VI) laminae. 38


54


55

56
57 3.4.7 Fluorescent storage material The presence of intracellular accumulation of fluorescent storage material is a hallmark of NCL. Thresholding analysis was performed to quantify fluorescence in CLN6 -/- animals and controls. Minimal amounts of fluorescence were observed in control animals. Fluorescence was increased in affected animals compared with controls in all four regions that were assessed when compared across all ages (P < 0.05) (Figure 3.10), and fluorescent storage material was already present at 7 months of age. The amount of fluorescent material was lower in the cerebellum compared with the caudate nucleus and the two cortical regions that were assessed (P < 0.001) and a trend of increase in fluorescence with age could be observed but was not significant. % of area showing fluorescence Cerebellum Age (months) Caudate nucleus Age (months) % of area showing fluorescence Primary motor cortex Age (months) Primary visual cortex Age (months) CLN6 -/- CLN6 +/- Figure 3.10 Quantitative assessment of fluorescent storage material accumulation Quantitative thresholding analysis of percentage of area fluorescing on level 5 sections of brains at different ages. Results are expressed as mean percentage of area that is fluorescent in 5 fields of view for each region. Error bars represent standard error of the mean where n 2. For n see Table 3.1. Increased amounts of fluorescent material were visible across all ages and in all four regions assessed compared with controls (P < 0.05). 42
58 3.5 DISCUSSION The present study provides the first detailed description of the progressive neuropathology of ovine CLN6 disease in Merino sheep and allows the neuropathology of this type of ovine NCL to be compared to the CLN6 disease in South Hampshire sheep and the CLN5 disease in Borderdale sheep. The brain weights and deviation from normal measured in the present study of CLN6 -/- Merino sheep plus the results from previous studies on CLN6 -/- South Hampshire (Oswald, 2004; Mitchell, 2016) and CLN5 -/- Borderdale sheep (Mitchell, 2016) are summarized in Table 3.5. The comparison shows that the brain weights from CLN6 -/- Merino sheep are similar to those from CLN6 -/- South Hampshire sheep at 4, 12 and 18 month of age and overall approximately 10 g lighter than those of CLN5 -/- Borderdale sheep. Based on the generally larger head and body frame size of the Borderdale sheep compared with both Merino and South Hampshire sheep, this difference would be expected. A comparison of the percentage of normal brain weights between the studies reveals a discrepancy between the three different studies which is likely based on the composition of the control groups. The control animals in the present study and the study by Oswald (2004) were of the same breed as the respective affected sheep, however the control group in the study by Mitchell (2016) included both South Hampshire and Borderdale animals. This could have led to an over-estimation of normal brain size in the South Hampshires and an under-estimation of normal brain size in the Borderdales. Table 3.5 Mean brain weight of affected sheep from the three ovine NCL models Weights are in grams and % of normal. The information is compiled from the present study and Oswald (2004) and Mitchell (2016). Age group (months) CLN6 -/- Merino (% of normal) CLN6 -/- South Hampshire (% of normal) Oswald (2004) Mitchell (2016) CLN5 -/- Borderdale (% of normal) Mitchell (2016) (82%) 83 (79%) 75 (81%) 82 (89%) (68%) 70 (74%) 68 (69%) 80 (81%) (52%) 63 (59%) 66 (67%) 71 (73%) The overall pattern of the cortical atrophy and changes of the cytoarchitecture seen in the Merino CLN6 affected sheep resembles those described in the CLN5 Borderdale and CLN6 South Hampshire sheep (Figure 3.2 and Figure 3.3) (Oswald, 2004; Oswald et al., 2005; Mitchell, 2016). In all three types, the parieto-occipital and primary visual cortices were the regions affected earliest and most severely by the atrophy, and the frontal association and primary motor cortices were the last cortical regions to be affected by the disease (Figure 3.2 and Figure 3.3) (Oswald, 2004; Oswald et al., 2005; Mitchell, 2016). Accumulation of cellular aggregates at the layer I/II boundary and the onset of layer definition loss has been observed as early as 2 months of age in CLN6 affected South Hampshire sheep, and at 4 months in CLN5 affected Borderdale sheep. The earliest samples taken in the 43
59 present study were at 7 months of age, and at this stage both of these manifestations were already evident. A remarkable loss of neurons from all cortical regions has been noted at end-stage disease in all three forms of ovine NCL, with only a few pyramidal neurons remaining (Figure 3.3) (Oswald, 2004; Oswald et al., 2005; Mitchell, 2016). The lack of cerebellar and subcortical involvement in atrophic changes is also common to all three forms (Figure 3.2) (Oswald, 2004; Oswald et al., 2005; Mitchell, 2016). The present study has shown that some degree of white matter loss occurs in the CLN6 -/- Merino sheep. The development of the corpus callosum from affected animals followed that of normal sheep until 7 months and thereafter the thickness was reduced to approximately 60% of that of normal sheep. No further thinning of the corpus callosum was seen after this. Previous studies of the other two NCL sheep models have described white matter tract changes as a lack of development rather than active degeneration (Oswald, 2004; Oswald et al., 2005; Mitchell, 2016). The present results show some amount of active thinning that followed the cortical thinning and did not appear to be ongoing. This could indicate that in the CLN6 Merino sheep, loss of white matter is also secondary to the cortical thinning rather than being a primary sign of disease. Progressively increasing neuroinflammation is one of the defining features of the NCLs (section 1.2.5) and therefore it is not surprising that the CLN6 -/- Merino sheep exhibit this. Immunohistochemical staining for both activated astrocytes (GFAP; Figure 3.4 and Figure 3.5) and microglia (GSB4; Figure 3.6 and Figure 3.7) revealed that neuroinflammation was well established at 7 months of age. The development of neuroinflammation paralleled the pattern of atrophy described, and followed that described for the other two forms of ovine NCL (Figure 3.5) (Oswald, 2004; Oswald et al., 2005; Mitchell, 2016); the primary visual and parieto-occipital cortices being the regions that exhibit the earliest and strongest signs of neuroinflammation in all three ovine diseases (Figure 3.4). Typical bands of activated astrocytes that are observed first in individual regions, and finally span almost the entire cortical mantle, are a feature common to all three ovine NCL forms (Figure 3.4) (Oswald, 2004; Oswald et al., 2005; Mitchell, 2016). Ongoing neurogenesis is also a common and still largely elusive theme of the NCLs and other neurodegenerative diseases (section 1.2.6). PSA-NCAM staining revealed ongoing neurogenesis in CLN6 -/- Merino sheep (Figure 3.8). Similar findings have previously been reported for both CLN6 -/- South Hampshire sheep and CLN5 -/- Borderdale sheep, as well as in mouse models of NCLs and human CLN6 patients, suggesting an attempted self-repair process that is instigated to counteract the ongoing loss of neurons in the NCLs (Dihanich et al., 2009, 2012; Mitchell, 2016). Previous investigations have shown that the cell aggregates which accumulate at the lamina I/II boundary in 44
60 the CLN6 -/- South Hampshire sheep contain newly differentiated neurons (Sybille Dihanich, unpublished data). Similar cell aggregates were seen in the present study (Figure 3.3), which could support the existence of an attempted self-repair process in these animals. The present study has shown that the accumulation of fluorescent storage material is ubiquitous throughout the brain including regions with severe atrophy and neuroinflammation such as the cerebral cortex, but also in regions largely spared from atrophy and/or neuroinflammation including the subcortical structures and the cerebellum (Figure 3.10). The same pattern of global and increasing accumulation not limited to areas affected by other disease signs has been described in the two other ovine forms (Oswald et al., 2005; Mitchell, 2016). The present study describes the first attempt at quantification of CLN5 and CLN6 protein expression in ovine NCL. The pattern of CLN5 and CLN6 protein expression in normal sheep recorded here resembles that described by other authors, with a neuronal distribution of expression and representative expression of the proteins in the hippocampus (Thelen et al., 2012; Mitchell, 2016). CLN6 reactivity was much less pronounced than CLN5 reactivity (Figure 3.9), as has been described earlier (Mitchell, 2016), and could indicate either a lower amount of CLN6 protein in tissues or a reduced specificity of the CLN6 antibody used compared with that of the CLN5 antibody. The cell count revealed a tendency of reduced but not abolished CLN6 protein expression in CLN6 -/- Merino sheep. Whether the nature of the mutation has an effect on the amount of protein detectable by immunohistochemistry remains elusive. One possibility is that the mutation in the Merino sheep, being a single nucleotide substitution, results in the production of protein that is not functional but is detectable with the antibody and that the mutation in the South Hampshire sheep, by deleting vital parts of the gene, inhibits the production of protein. The mutation in the CLN6 mutant nclf mice is a single base pair insertion that leads to a premature stop codon (Gao et al., 2002; Wheeler et al., 2002) and mrna expression of CLN6 in nclf mice is reduced to 60 70% compared with wildtype animals (Thelen et al., 2012). This supports the possibility that minor mutations could still lead to the production of some, probably faulty, gene product instead of no product at all. The results of the immunohistochemical staining for the CLN5 protein in CLN6 affected, heterozygous, and CLN6 +/+ control animals presented here indicate a possible cross-regulation of these genes. This has been suggested previously, based on spatial and temporal co-expression of the two proteins (Mitchell, 2016). A possible interaction of CLN5 with several other NCL genes, including CLN6 has been proposed earlier (Lyly et al., 2009). In the present study, CLN5 protein expression was significantly reduced in both heterozygous and affected CLN6 Merino sheep, following a pattern of [CLN6 +/+ > CLN6 +/- > CLN6 -/- ] (Figure 3.9) and the same trends were seen in CLN6 South Hampshire 45
61 sheep (Palmer et al., 2017). This leads to the possibility that the CLN6 protein, being an endoplasmic reticulum resident protein (Heine et al., 2004; Mole et al., 2004), might be involved in the correct processing of the CLN5 protein, leading to an induced CLN5 deficiency in CLN6 affected animals. This hypothesis has since been supported by results of a quantitative PCR study, showing increased CLN5 mrna expression in both CLN6 +/- and CLN6 -/- South Hampshire sheep (Palmer et al., 2017). This could be interpreted as a compensatory attempt to counteract the reduced CLN5 protein expression. Despite the large differences between the mutations in the CLN6 gene of the Merino model (c.184c>t; p.arg62cys) and the South Hampshire model (g.-251_150del and g.+150insc), this phenomenon appears to be present in both breeds and might therefore be regarded as a part of the CLN6 disease rather than a breed specific issue. Despite the large differences in the two CLN6 mutations, the Merino CLN6 model has a natural disease history similar to the South Hampshire CLN6 and the Borderdale CLN5 models. The following main themes characterise the disease in all three ovine NCL models: gross brain atrophy, mainly through cortical thinning and increasing neuroinflammation indicated by glial activation, which follows a very similar pattern of development in all models and spans the entire cortical mantle at end-stage disease; ongoing neurogenesis that could be interpreted as an attempt at self-repair to counteract an ongoing loss of neurons; and finally accumulation of fluorescent storage material in all regions of the brain, including the cerebellum which is otherwise largely spared of the pathological changes. The similarity in neuropathology within the three types of ovine NCL is also reflected in extensive similarities within the clinical development of disease. In all three models, progressive loss of vision and mild behavioural changes such as baulking and low carriage of the head are the first clinical signs to be identified between 5 and 12 months of age (Cook et al., 2002; Mitchell, 2016). Following these, affected sheep of all three breeds develop progressive loss of mentation, increased somnolence, increasing proprioceptive dysfunction, loss of body condition and they all reach premature death at 18 to 24 months of age (Cook et al., 2002; Mitchell, 2016). Looking forward, these results are encouraging for translation to possible treatment trials in humans. Despite the large differences between genetic backgrounds of the three ovine NCL models, the neuropathological pathways that will need to be addressed in the development of therapies for humans are largely similar and thus treatment might not have to be tailored to the individual types of mutation. The same is likely to be true for a potential cross-regulation between the CLN5 and CLN6 protein expression, as it is possible that a single treatment regime could be effective for both types of NCL. 46
62 3.6 CONCLUSION The neuropathology of ovine CLN6 disease in Merino sheep largely follows the same progression as that of CLN6 South Hampshire sheep and CLN5 Borderdale sheep. Gross atrophy of the brain is slightly more pronounced in CLN6 Merino sheep compared with the other two forms of ovine NCL. CLN6 protein is present in CLN6 affected Merino sheep. The occurrence of some CLN5 protein expression in CLN6 affected Merino sheep indicates a connection between or a possible cross-regulation of the CLN5 and CLN6 proteins. 47
63 4 CT SCANNING IN NCL SHEEP MODELS 4.1 INTRODUCTION Previous investigations have indicated that ovine NCL leads to a reduction of intracranial volume (ICV) through ongoing ossification within the skull as it adapts to the atrophying brain (Bell et al., 2005). Although CT scanning and calculations of ICV have been used previously in ovine NCL research, this theory has never been validated. The method for measuring ICV has been based on hand tracing of the inner outline of the braincase followed by integration of the area and a polynomial approach to determine start and end points of the brain (Kay et al., unpublished). This technique was used on CT images obtained through scans with a slice interval of 5 mm, however this is a relatively large slice interval and hand tracing of areas provided only a rough estimation of actual ICV, with a substantial risk of inter-observer variance. Furthermore, the assessment of ventricular spaces also can be inaccurate when calculated from image sets with a high image interval. This inaccuracy is likely to be exacerbated if the positioning of the head in the scanner is not consistent between scans, so that images cannot be registered on the same anatomical location Brain and intracranial volume changes Many physiological factors influence the brain size of an individual. Body mass and size correlate with brain size in most species and sexual dimorphism in these measurements appears to be more pronounced in humans than in sheep (Ebinger, 1974; Gur et al., 1991; Courchesne et al., 2000; Good et al., 2001; Edland et al., 2002; Lenroot & Giedd, 2010; Nuruddin et al., 2013; Nitzsche et al., 2015). The cranial vault of humans increases rapidly in the early years of childhood while the brain is growing, reaching 70% of its maximal size at 5 years of age and its maximal size at around 16 years (Sgouros et al., 1999; Courchesne et al., 2000). Thereafter, the brain volumes of healthy human subjects slowly decline throughout normal aging (Courchesne et al., 2000). Remodelling of the skull is uncommon in human aging and dementia and it is generally assumed that the ICV reflects the maximal brain volume (Courchesne et al., 2000; Farias et al., 2012). Brain atrophy and cerebroventricular enlargement are defining features of NCL in humans, sheep and other animals (Jolly & West, 1976; Armstrong et al., 1983; Jolly et al., 1989; Haltia, 2003; Anderson et al., 2013). In vivo imaging techniques, such as MRI and CT, have been used to monitor the development of brain size and intracerebroventricular volume in both human and ovine NCL (Valavanis et al., 1980; Woods et al., 1993; Lobel et al., 2013; Jadav et al., 2014; Sawiak et al., 2015; Dyke et al., 2016). 48
64 4.1.2 Tissue density and its translation to radiodensity Different tissues have different abilities to attenuate radiation, i.e. different degrees of radiodensity. The CT number or Hounsfield unit (HU) provides quantification of the extent to which a tissue attenuates x-rays. The HU scale was introduced by, and is named after, Sir Godfrey Hounsfield who invented the CT scanner in Air is placed at the bottom of the scale with an HU value of -1000, water has an HU value of zero and most tissues are represented by HU values between 20 and 60. Dense materials such as bone have high HU values, of 500 or more (Hounsfield, 1980). The different HU values of tissues can therefore be used to identify boundaries between adjacent tissues with different radio-densities. However the apparent HU value of a tissue might vary between scanners depending on their calibration and scan settings. Human brain HU values range between 20 and 50, and those of cerebrospinal fluid (CSF) vary between -5 and 20 (Arimitsu et al., 1977; Hacker & Artmann, 1978). Neurodegeneration may influence the radiodensity of brain tissue. An increase in radiodensity of brain tissue was found in both a sheep and a dog model of NCL (Armstrong et al., 1983; Woods et al., 1993). 4.2 AIM AND OBJECTIVES The aim of this study was to improve the resolution, discrimination and accuracy of longitudinal monitoring of ICV and cerebroventricular volumes though in vivo CT imaging in ovine NCL research. To reach these goals, the methods of image analysis needed to be improved and semi-automated. Next, the relationship between ICV reduction and brain atrophy was investigated. Finally, a longitudinal study of unaffected control sheep and CLN5 and CLN6 affected sheep was undertaken using these methods. 49
65 4.3 MATERIALS AND METHODS Identifying Hounsfield units of sheep brain tissue and CSF on historical data To improve accuracy and consistency and to increase automation of ICV data analyses, the radiodensity (Hounsfield units, HU) of sheep brain tissue and CSF spaces had to be identified. The radiodensity of different human tissues is displayed in Table 4.1. Table 4.1 Radiodensity of different body materials Modified from Hounsfield (1980). Hounsfield Units Material Air -90 to -70 Adipose 0 Water 20 to 60 Tissue (other than adipose and bone) >500 Bone CT scans of 72 sheep were analysed to determine the HU values for brains and CSF. These included both males and females, aged between 3.6 and 68.4 months that were CLN5 heterozygous and homozygous Borderdales, CLN6 heterozygous and homozygous South Hampshires, and unrelated control animals of other breeds (Coopworth and Romney-crosses). All image sets were obtained on a GE Prospeed CT scanner (GE Healthcare, Hyogo, Japan) between Images were analysed in ImageJ (Rasband, ImageJ, U. S. National Institutes of Health, Bethesda, Maryland, USA). From each image set, five images were selected to measure the HU values of CSF-filled spaces based on image quality and visibility of the lateral cerebral ventricles. On each of these images, an ellipsoid area within each of the lateral cerebral ventricles was chosen based on visibility and uniformity of tissue type within the area. The HU values of these areas were measured using the measurement tool in ImageJ (Figure 4.1). The same procedure was used to determine the HU of brain tissues (Figure 4.1), where a minimum of 2 circular areas were selected on the same five images used for the ventricular measurements. Following that, the 99.9% confidence intervals representing the range of HU values of brain tissue and CSF spaces were determined. 50
66 A B Figure 4.1 Representative brain CT image of a 12-month-old Coopworth sheep Coronal plane. A) The Hounsfield unit (HU) value of brain tissue was measured in areas only containing brain tissue (red circles). B) HU value of cerebrospinal fluid spaces was measured within the lateral ventricles (blue circles) Comparing CT-based ICV and water displacement volume of brains and measuring bone thickness on CT scans The use of CT-based measurement of ICV is a well-established tool to measure brain size in ovine NCL research. It has been assumed that the ICV reflects the brain size in NCL affected animals and controls and that a constant ossification of the cranial vault occurs in affected animals. This theory is supported by post mortem findings, where the skulls of affected animals appear thicker than those of controls (Martin Wellby, personal communication). However, it has not been established whether the ongoing ossification of the cranial vault is a symptom or a cause of brain atrophy in ovine NCL. This experiment aimed to verify the relationship between brain size and ICV in NCL affected sheep and unaffected controls. Furthermore, the occurrence and rate of ossification of the cranial vault in NCL affected sheep was investigated. Finally, the effect of disease status on the specific gravity of brain tissue was explored General scanning protocol and 3-dimensional reconstruction All CT scans included in this thesis were conducted on a GE Prospeed CT scanner (GE Healthcare, Hyogo, Japan, year 1997). The scans were helical using 120 kv, 100 ma, 1 mm slice thickness and 1 mm slice interval. Image analyses were performed in 3D Slicer freeware ( (Fedorov et al., 2012). For 3-dimensional (3-D) modelling the editor module was used to produce label maps of the regions of interest. The previously established HU thresholds (section 4.3.1) were used to identify brain tissue and CSF spaces. To measure the entire ICV (consisting of both brain tissue and CSF spaces), the threshold paint tool was used with the HU threshold [-12;56], followed by manual corrections for beam hardening and other scanning artifacts. The ICV was labelled from the first image containing the olfactory bulbs to the first image containing 51
67 only spinal cord. A 3-D model of the ICV was created using the MakeModelEffect tool and its volume was recorded. The volumes of the lateral and third cerebral ventricles (hereafter referred to as ventricular volume) were measured using the previously established HU threshold for CSF space [- 12;23] (section 2.3.1), followed by manual correction and measurement of the 3-D model volume, as described above for the ICV. The other CSF filled spaces (the fourth cerebral ventricle, cerebellar aqueduct, and subarachnoid spaces) were not included in the CSF space measurements because the resolution of the CT scans was insufficient for accurate discrimination between brain tissue and CSF in these areas CT measurements and water displacement volumes All sheep that were killed at the Sheep Research Unit at Lincoln University over a period of 6 months were included in this study. These were a heterogeneous group of 25 male and female sheep of different breeds, aged 8 to 69 months, including 11 NCL affected animals and 14 unaffected controls. Following exsanguination, the heads were CT scanned and the ICVs and cerebroventricular volumes were measured following the protocol described above (section ). Following CT scanning, the dorsal parts of the skulls were removed using a hatchet. The meninges were opened, and the brains were removed, leaving the pituitary glands, olfactory bulbs, and the dura mater behind. The spinal cords were severed transversely at a point perpendicular to the caudal margin of the cerebellum, the fresh brain weights recorded, and the brains were then kept at room temperature. Within four hours of collection, brain volumes were measured using a water displacement method. For this, a horizontal line was drawn on the outside of a glass beaker, which was then filled with water at room temperature to this line. After placing each brain in the water, which caused the water level to rise as the brain sank, water was removed using a pipette, until it was back to its initial level and the removed volume was recorded. The ratios of ICV to brain volume were calculated for both affected and normal sheep. The specific gravity of each brain was calculated by dividing the fresh brain weight by the water displacement volume. The effect of disease status on ICV measures, volume displacement results, ratio of ICV to brain volume and specific gravity was investigated Skull growth measurements on CT images A group of 12 animals consisting of CLN6 affected (n = 3) and unaffected (n = 3) South Hampshire sheep and CLN5 affected (n = 3) and unaffected (n = 3) Borderdale sheep, all females, were CT scanned bimonthly for 15 months to monitor changes of ICV (see section 4.3.3). Skull thicknesses were measured at age 5, 9, 13 and 17 months. Measurements were performed using 3D Slicer freeware ( (Fedorov et al., 2012). Initially, each set of images was manually 52
. Bregma (the intersection of the sagittal and coronal suture lines between the frontal and parietal bones) was located on the CT scans.")


 images Axial (red slices), sagittal (yellow slices) and coronal (green slices) views of sheep brain CT")
68 realigned to a standard orientation using the transform module, where zero was placed at the anterior commissure and the dorsal surface of the skull was horizontal (Figure 4.2). Bregma (the intersection of the sagittal and coronal suture lines between the frontal and parietal bones) was located on the CT scans. Two measurements were taken of the frontal bone, 1 cm rostral to Bregma and 1 cm to either side of the mid line and two measurements were taken of the parietal bone, placed 2 cm caudal of Bregma and 1 cm either side of the mid line. Window and level were set to 80 and 40 HU for all measurements and the measurements were taken in the coronal plane perpendicular to the axial plane (Figure 4.2). The average frontal and parietal bone thicknesses were calculated from the two measurements for each animal along with the average growth from 5 to 17 months in NCL affected animals and controls. A B C Figure 4.2 Skull thickness measurements on computed tomography (CT) images Axial (red slices), sagittal (yellow slices) and coronal (green slices) views of sheep brain CT scan. A) Standardised realignment of images with slice intersection in the anterior commissure (crosshair). B) Identification of Bregma (crosshair). C) An example of a measurement of the thickness of the parietal bone. 53
69 4.3.4 Quantitative longitudinal monitoring of changes of ICV and cerebroventricular volume in NCL affected sheep and control animals After the correlation between ICV and brain volume and 3-D modelling techniques were established, these were used to follow a cohort of animals through a longitudinal study to investigate the changes of ICV and ventricular volume in CLN5 and CLN6 affected animals and normal controls. All experiments were performed in accordance with the Lincoln University Code of Ethical Conduct for the Use of Animals (CEC) and the New Zealand Animal Welfare Act 1999 and approved by the Lincoln University Animal Ethics Committee. A total of 24 animals were included, consisting of two age groups, animals born in 2014 (n = 12) and 2015 (n = 12). Each group of 12 contained CLN6 -/- (n = 3) and CLN6 +/- (n = 3) South Hampshire sheep and CLN5 -/- (n = 3) and CLN5 +/- (n = 3) Borderdale sheep. All affected sheep (n = 6) in the 2014 group were males whereas all unaffected sheep (n = 6) were females. All sheep in the 2015 group were females (Table 5.1). The sheep were aged between 3 and 5.8 months when first scanned and scans were performed every 8 weeks until an age of 15 to 19 months, depending on clinical condition. The sheep were kept outdoors within corresponding mobs in a pasture based system. Prior to each CT scan the sheep were fasted for h and weighed. On the day of CT scanning the sheep were anaesthetised by IV injection of a mixture of 0.8 mg/kg LW diazepam (Pamlin injection, Troy Laboratories NZ Pty Ltd, Auckland, NZ) and 17 mg/kg LW of ketamine hydrochloride (Phoenix Ketamine injection, Phoenix Pharm Distributors Ltd, Auckland, NZ). The sheep were intubated and placed on a wooden stretcher in dorsal recumbency and the stretcher was placed in the CT scanner. A series of helical scans of the head were performed for each sheep following the general scanning protocol described in section After the scanning was completed, the general anaesthesia was maintained by inhalation of isoflurane in oxygen (1.5% 3% v/v to effect), as the sheep underwent other tests (Chapter 5). Following completion of these, the sheep were extubated and taken to a padded wake-up area where they remained under observation until they had recovered. After this the sheep were returned to their corresponding mobs. All processing of images and volumetric measurements were performed as described earlier ( ). 54
70 Table 4.2 Summary of numbers of animals used Genotype Breed CLN5 +/- Borderdale CLN5 -/- Borderdale CLN6 +/- South Hampshire CLN6 -/- South Hampshire Disease status Sex Age 3 months 5 17 months 19 months Female Unaffected Male Total Female Affected Male Total Female Unaffected Male Total Female Affected Male Total Statistical analyses Means and corresponding SEM were calculated for all measures, either group wise or per time point. The measures of radiodensity and the measures of CT based ICV measurements and water displacement volumes of brains were compared group wise (affected vs. control) using Student s t- test to investigate significance and Cohen s d to evaluate effect size. The measures from the longitudinal investigations were grouped by breed and genotype (i.e. CLN5 +/-, CLN5 -/-, CLN6 +/-, CLN6 -/- ) and the repeated measurements were allocated into age-groups (3 months, 5 months, 7 months,, 19 months). Means and corresponding SEM were calculated for ICV and ventricular volumes at each age of each group of animals and repeated measure ANOVAs were performed on longitudinal data. The change in ICV was calculated for each animal for each period (3-5 months, 5-7 month,, months) and the mean accumulative ICV gain or loss from 3 to 17 months ± SEM was determined for each genotype and evaluated for effect size using Cohen s d and for significance using Student s t-test as described earlier (section 2.2). 55
71 4.4 RESULTS Radiodensity of brain tissue and CSF spaces The radiodensity of brain tissue in NCL affected animals was greater than that of brain tissue from unaffected control animals. There was no such difference in the density of CSF filled spaces (Table 4.3). The mean brain tissue radio density including both affected and unaffected animals was HU 39.5 with a standard deviation of 5.2 and thus 99.9% of the brain tissue was represented by the HU interval [24;56]. Likewise, 99.9% of CSF spaces was represented in the HU value interval of [-12;23]. Table 4.3 Radiodensity of sheep brain tissue and CSF filled spaces Radiodensity expressed in Hounsfield Units (HU) of brain tissue and cerebrospinal fluid (CSF) filled spaces of NCL affected and unaffected control sheep. Significance was tested by two-sided Student s t-tests. Tissue Disease status HU (mean ± SEM) Student s t-test Brain tissue NCL affected (n = 42) 40.3 ± 0.3 Unaffected control (n = 14) 38.4 ± 0.8 P = CSF NCL affected (n = 42) 5.6 ± 0.5 Unaffected control (n = 18) 5.5 ± 0.6 P = Volumetric measurement by CT and water displacement Brain volumes measured by water displacement and ICVs measured from CT scans were both lower for NCL affected animals compared with those of controls (Table 4.4). The measurements of ICVs and brain volumes in unaffected control animals closely matched, but the ICVs of NCL affected animals measured by CT scanning were approximately 4 ml larger than the compatible brain volumes measured by displacement. Based on this, the ratio of ICV to brain volume was larger in NCL affected animals compared with unaffected controls (Table 4.4). NCL affected animals showed a trend of increased growth of both the parietal and the frontal bones between the age of 5 and 17 months (Figure 4.3). Disease status had no effect on the specific gravity of the brain (Table 4.4). Table 4.4 Brain and intracranial volume comparisons Volumetric brain measurements of NCL affected (n = 11) and unaffected control (n = 14) sheep. Intracranial volumes (ICV) measured on CT scans and brain volumes (Volume) measured by water displacement. P 0.05 regarded as significant. Measurement Affected (mean ± SEM) Control (mean ± SEM) Significance ICV (ml) 80.5 (± 2.3) 99.9 (± 1.7) * Volume (ml) 76.5 (± 2.1) (± 1.7) * Ratio ICV:Volume 1.06 (± 0.02) 0.99 (± 0.01) * Specific gravity of brain tissue (g/cm 3 ) 0.98 (± 0.2) 1.01 (± 0.01) 56
72 Frontal bone Parietal bone Accumulative bone growth (mm) Age (months) Age (months) NCL affected Control Figure 4.3 Growth of frontal and parietal bones Accumulated growth (mean ± SEM) in thickness of frontal and parietal bones of NCL affected animals (NCL affected, n = 6) and unaffected control animals (Control, n = 6) measured on CT scans at 5, 9, 13 and 17 months of age ICV and ventricular volume measurements The progress of changes in ICV of Borderdale sheep is summarised in Figure 4.4. By 3 months, the mean ICV of NCL affected Borderdale sheep was smaller than that of unaffected age- and breed matched controls (Figure 4.4.A). This difference became significant at 5 months and stayed this way until the end of the trial period. The accumulative change of ICV in CLN5 +/- control animals showed an initial increase between 3 and 5 months, then a plateau until approximate nine months, followed by another growth phase, until another plateau from about 15 months of age (Figure 4.4.B). The accumulative ICV change of CLN5 -/- sheep followed a similar trend as that of control animals in the first few months, volume increasing between three and five months. Thereafter the volume decreased, plateaued between seven and eleven months, then decreased rapidly until the end of the trial period at 19 months (Figure 4.4.B). CLN5 -/- sheep lost a total of 6.7 ± 2.6 ml between 3 and 17 months, while control sheep gained 2.7 ± 1.6 ml. Changes in the ICVs of South Hampshire sheep are summarised in Figure 4.5. No significant differences were found between the mean ICVs of NCL affected animals and controls, but a trend of reduction could be seen in the ICV of CLN6 -/- animals (Figure 4.5.A). The accumulative change of ICV in CLN6 +/- control animals showed a pattern similar to that of CLN5 +/- animals. A slow phase of ICV gain was seen until the age of approximately 10 months, followed by a short steep ICV increase until approximately 15 months, when the ICV plateaued (Figure 4.5.B). The accumulative change of ICV in CLN6 -/- animals followed the initial increase seen in control animals, then declined slightly between 5 and 7 months, plateaued until approximately 10 months of age and then declined rapidly until the 57
73 end of the trial period at 17 months (Figure 4.5.B). A total ICV loss of 5.8 ± 2.5 ml was seen in CLN6 -/- sheep between 3 and 17 months, while controls gained 3.8 ± 1.2 ml ICV over the same period. The mean ventricular volumes of CLN5 -/- animals were significantly larger than those of controls throughout the entire trial period (Figure 4.6.A), and although the mean ventricular volumes of CLN6 -/- animals tended to be higher than those of controls throughout the entire trial period, this did not become significant until 17 months (Figure 4.6.B). There were no significant differences between any of the ventricular volumes for any single genotype at any age. 58
74 A B ICV (ml) Accumulative ICV changes (ml) CLN5-/- CLN5+/ CLN5-/- CLN5+/ Age (months) Age (months) Figure 4.4: ICV development of CLN5 sheep ICV development of CLN5 -/- and CLN5 +/- Borderdale sheep between 3 and 19 months (for n see Table 5.1). A) Mean ICV ± SEM at different ages (* indicating significance at P 0.05). B) Mean accumulative ICV gain or loss (± SEM, dotted lines) from 3 months of age. A B ICV (ml) Accumulative ICV changes (ml) CLN6-/- CLN6+/ Age (months) CLN6-/- CLN6+/ Age (months) Figure 4.5: ICV development of CLN6 sheep ICV development of CLN6 -/- and CLN6 +/- South Hampshire sheep between 3 and 17 months (for n see Table 5.1). A) Mean ICV ± SEM at different ages. B) Mean accumulative ICV gain or loss (± SEM, dotted lines) from 3 months of age. 59
75 A CLN5 -/- CLN5 +/- B CLN6 -/- CLN6 +/- 5 5 Ventricular volume (ml) Age (Months) Age (Months) Figure 4.6: Cerebroventricular volumes of CLN5 and CLN6 sheep Volumes of intracerebral ventricles (lateral and third ventricles combined) of CLN5 -/- and CLN6 -/- animals and heterozygous controls (for n see Table 5.1). A) Mean ventricular volumes (± SEM) of CLN5 -/- and CLN5 +/- animals. B) Mean ventricular volumes (± SEM) of CLN6 -/- and CLN6 +/- animals. Significance indicated with * where P
76 4.5 DISCUSSION Neuroimaging has been part of disease monitoring in ovine NCL research for a long time but, until recently, the methods were basic and mainly focused on time-point analysis rather than longitudinal monitoring of individual animals. This study set out to improve and automate methods of image analysis, establish the relationship between the reduction of ICV and brain atrophy and describe the pattern of ICV change in CLN5 affected Borderdale, CLN6 affected South Hampshire, and unaffected control sheep. The range of the radio-densities of brain tissue and CSF spaces in NCL affected sheep and unaffected controls were identified to improve and partly automate image analysis. Increased radiodensity, measured in HU, of brain tissue was observed in affected animals compared with controls and this has also been described in other models of both ovine and canine NCL (Armstrong et al., 1983; Woods et al., 1993). The specific gravity of brain tissue, however, was not increased in affected animals compared with controls, which stands in contrast to the description of brains at post mortem examination, where the brains of NCL affected sheep appear firmer than those of normal sheep (Jolly et al., 1989). The range of HU values representing brain tissue and CSF spaces reported here are in close agreement with findings from similar investigations in humans, where the mean HU value of grey matter was 39, that of white matter 32 and that of CSF ranged between -5 and 20 (Arimitsu et al., 1977; Hacker & Artmann, 1978). These results have enabled semi-automated analyses of CT scans for longitudinal monitoring of treatment trials. The comparison between CT based volumetric measurements of the cranial vault and brain volume measured by water displacement yielded satisfying results. The ratio of ICV to brain volume in normal sheep was close to 1 in this study. However, the ratio for NCL affected animals was 1.06, which was larger than in normal sheep and the measurements therefore show a gap between the ICV and brain volume. The reduction of ICV in NCL affected animals that was seen in the present study supports the theory of an ongoing ossification of the skull in these animals, however the larger ratio of ICV to brain volume shows that the brain atrophy preceded the ossification and that therefore the ossification was not a causative reason for brain atrophy, but rather a symptom of it. An increased space between the atrophied brain and the cranial vault of NCL affected sheep has been reported earlier (Cook et al., 2002). The trend of increased accumulative growth of the parietal and frontal bones of NCL affected animals found in the present study is supported by post mortem observations and is in line with the decrease of ICV in NCL affected animals presented here. However, the mechanism, molecular background and regionality of the skull thickening are still poorly understood, and the current study 61
77 was limited by low image quality and spatial resolution. In human NCLs and other forms of dementia, remodelling of the skull is unusual and is mainly seen as part of diseases that also affect other parts of the skeleton like mucopolysaccharidosis and other skeletal dysplasias (Jelin et al., 2017). More detailed investigation into the molecular mechanism and the regional changes are needed to fully understand the dynamics of ICV changes in ovine NCL or NCL in other species. Overall, the measurements of ICV, brain volume and specific gravity reported here are similar to those found by others. Previous studies have used a volumetric measurement device to determine the displacement volume of different tissues of the human head and found that the human brain tissue density was 1.08 ± g/cm 3 (Barber et al., 1970). Others have estimated the total brain volume of six domestic sheep based on their fresh brain weight and an assumed brain tissue density of g/cm 3, which resulted in an estimated brain volume range from 96.4 to ml (Ebinger, 1974). It has long been established that both CLN5 and CLN6 affected sheep exhibit a loss of brain size (Jolly & West, 1976; Jolly et al., 1982, 2002), nevertheless longitudinal monitoring is essential to describe the rate of this change. As the brain size is greatly affected by overall body size (Ebinger, 1974; Courchesne et al., 2000; Edland et al., 2002), large individual variations were also expected in the measurements of ICV, which might overshadow disease effects. Assessment of the rate of change instead of actual volumes (Figure 4.4 and Figure 4.5) yield a better understanding of disease mechanisms by eliminating the effects of initial body and brain sizes. This becomes particularly clear when comparing the mean ICV data of CLN5 Borderdale and CLN6 South Hampshire sheep, which are two breeds that differ in both build and size. In this trial, CLN5 -/- animals could easily be distinguished from CLN5 +/- animals based on ICV at three months (Figure 4.4). This was not possible in CLN6 animals until the very end of the trial period, as the mean ICV of CLN6 affected animals was similar to that of controls for longer (Figure 4.5). However, the patterns of ICV change in different genotypes become obvious when analysing the accumulative change instead of the mean volume. With this, it is possible to distinguish affected animals from controls from a young age. For both CLN5 and CLN6 sheep, this trial showed that the ICV of affected animals only changed minimally until the approximate age of 10 months, which can be described as an absence of gain rather than an active loss, while the ICV of control animals steadily increased throughout the same period. After this ICVs were reduced in both CLN5 -/- and CLN6 -/- animals, while the ICVs of control animals plateaued. The volumes of the third and lateral ventricles of all four genotypes stayed relatively stable throughout the entire trial period. The ventricular volumes of CLN5 -/- animals were larger than those 62
78 of controls and a similar trend was observed in CLN6 -/- animals, however, this was only significant in the very end of the trial period. Overall, ventricular enlargement was more pronounced in CLN5 -/- animals than in CLN6 -/- animals, which may indicate a different pattern of brain atrophy in the different types of ovine NCL. Recently, a high-resolution sheep brain MRI atlas has been established based on the brains of 18 sheep and the study found the mean volume of the lateral and third ventricles combined was approximately 4.9 ml (Ella & Keller, 2015; Ella et al., 2017). The results presented here indicate that the resolution of the CT scanner used is not sufficient to accurately discriminate tissue borders for small CSF filled spaces, as the range of measurements was wide and the ventricular volume of individual sheep in this study could change dramatically between study dates. 4.6 CONCLUSION The CT based measurement of intracranial volume is a valid surrogate measure for brain size in both normal and NCL affected sheep. The ossification of the cranial vault is increased in ovine NCL. The pattern of change of intracranial and cerebroventricular volumes of healthy sheep and sheep with ovine NCL have been described. These volumetric measures follow the clinical development of ovine NCL and are promising tools to use in the assessment of therapy trials. 63
79 5 ELECTRORETINOGRAPHY AND FUNDUS PHOTOGRAPHY IN OVINE NCL 5.1 INTRODUCTION Since the eye develops as an evagination of the diencephalon in the early development of the nervous system in vertebrates, the retina is essentially an extension of the brain (Chow & Lang, 2001). It is therefore not surprising that blindness is a defining feature of ovine as well as human NCL. In the human disease, blindness is often one of the first presenting clinical signs (Haltia, 2003; Weleber et al., 2004). Blindness in NCL consists of a central and a peripheral component, as both the visual cortex and the retina are affected. The primary visual cortex in sheep shows significant reduction in grey matter thickness that is relatively consistent within all three types of ovine NCL (i.e. Merino CLN6, South Hampshire CLN6 and Borderdale CLN5) (Mayhew et al., 1985; Cook et al., 2002; Oswald et al., 2005; Mitchell, 2016; Chapter 3). In both humans and sheep, retinal involvement leads to an almost complete loss of rods, cones, outer nuclear layer and outer plexiform layer, whereas the inner layers of the retina are spared from the atrophy (Goebel et al., 1974; Jolly et al., 1982; Graydon & Jolly, 1984; Mayhew et al., 1985). Sheep have a mixed retina type similar to humans (Nilsson et al., 1973). Electroretinography (ERG) is used to measure electrical potentials arising from the retina when subjected to a light stimulus. By using a surface electrode placed on the cornea as well as a reference and an earth electrode placed on the skin around the eye, these potentials can be detected and displayed on an oscilloscope. The reading consists of an a-wave that indicates the stimulation of the photoreceptors, a b-wave that originates from the post-synaptic bipolar cells of the inner retina and a c-wave that arises from the retinal pigment epithelium and photoreceptors (Figure 5.1) (Brown & Wiesel, 1961; Brown, 1968). For each wave two measurements can be obtained. One is the latency, which is the duration of time from the stimulus until the peak of the response, and the other is the amplitude that describes the size of the response (Figure 5.1). Rod photoreceptors are stimulated in dim light, or in scotopic conditions, whereas cone photoreceptors respond mainly under background illumination, in photopic conditions. Therefore, different states of adaptation (i.e. light or dark adaptation) of the retina (or the patient) can be used to test these two systems individually. 64

80
81 NCL and has also been described in other species (Katz et al., 2008; Hainsworth et al., 2009). No systematic evaluation of the fundus has been performed in the ovine NCL models however attenuation of the retinal blood vessels was observed on funduscopy carried out in connection with a treatment trial (Mitchell et al., 2017). 5.2 AIM AND OBJECTIVE The aim of this study is to explore the usefulness of electroretinography and fundus photography for longitudinal monitoring in ovine NCL research and to describe the development of retinal blindness using these techniques in CLN5 and CLN6 affected animals. 5.3 MATERIALS AND METHODS Animals All experiments were performed in accordance with the Lincoln University Code of Ethical Conduct for the Use of Animals and the New Zealand Animal Welfare Act 1999, and approved by the Lincoln University Animal Ethics Committee. A total of 24 animals were included, consisting of two age groups: animals born in 2014 (n = 12) and in 2015 (n = 12). Each group contained CLN6 -/- (n = 3) and CLN6 +/- (n = 3) South Hampshire sheep, and CLN5 -/- (n = 3) and CLN5 +/- (n = 3) Borderdale sheep. All affected sheep (n = 6) in the 2014 group were rams whereas all unaffected sheep in the 2014 group (n = 6) were ewes. All sheep in the 2015 group were ewes. The methods were developed during the year of the study (2015) and the 2014 animals were not enrolled until after 11 months of age. All 2015 animals were studied from 3 months of age. Animal numbers at different ages are summarized in Table 5.1. The sheep were kept outdoors within their corresponding mobs on pasture. Prior to each ERG the sheep were brought indoors, fasted for h and weighed. The sheep were held in a pen with artificial lighting until the ERGs were performed. On each day of ERG the sheep were anaesthetised by IV injection of a mixture of 0.8 mg/kg LW diazepam (Pamlin injection, Troy Laboratories NZ Pty Ltd, Auckland, NZ) and 17 mg/kg LW of ketamine hydrochloride (Phoenix Ketamine injection, Phoenix Pharm Distributors Ltd, Auckland, NZ). The sheep were intubated and placed on a wooden stretcher. Before the ERG was conducted, the sheep underwent CT scans of the brains described in Chapter 4. After the CT scans were completed, general anaesthesia was maintained by inhalation of isoflurane in oxygen (1.5% - 3% v/v to effect). To dilate the pupils, a drop of 1% tropicamide (Mydriacyl, 10 mg/ml; Alcon NZ Ltd, Auckland, NZ) was administered onto each eye at least 30 minutes before the ERG was conducted. Following recording of the ERGs, photographs of the fundi of both eyes were obtained using a hand- 66
82 held ClearView fundus camera (Optibrand Ltd., Fort Collins, CO, USA). After this the sheep were extubated and taken to a padded wake-up area where they remained under observation until they had recovered. Finally, the sheep were returned outdoors to their corresponding mobs. Table 5.1 Summary of numbers of animals used Age Genotype Breed Disease status 3 9 months 11 months months 17 months CLN5 +/- Borderdale Unaffected CLN5 -/- Borderdale Affected CLN6 +/- South Hampshire Unaffected CLN6 -/- South Hampshire Affected Electroretinography Electroretinography was conducted using an Eickemeyer Veterinary ERG system (Eickemeyer - Medizintechnik für Tierärzte KG, Tuttlingen, Germany). The live electrode was an ERG-Jet contact lens electrode (Fabrinal SA, La Chaux-De-Fonds, Switzerland) and the reference and earth electrodes were subdermal 12 mm x 29 gauge needle electrodes (LKC Technologies Inc., Gaithersburg, MD, USA). A basic clinical protocol described in the Eickemeyer ERG manual was followed. Each eye was assessed separately, starting with the right eye. A 40 mm Barraquer speculum was used to keep the eye open. The ERG-Jet contact lens electrode was filled with sterile saline solution and placed on the eye. The reference electrode was placed approximately 1 cm lateral to the lateral canthus. The earth electrode was placed on the dorsal surface of the skull about 1 cm lateral to the midline towards the eye that was being measured. The skin was clipped and soaked in saline to improve conduction where both needle electrodes were placed. The flash was placed within 1 cm of the eye. Flash intensity was approximately 2-3 candela per square metre (cd/m 2 ) with a white flash colour. Each reading consisted of the average of four consecutive flashes with a flash interval of 0.8 seconds. Following the Eickemeyer ERG handbook protocol, the first recording was performed with the ambient light turned on (referred to as light adaptation from here). This resulted in a conedominated reading. Then the light was turned off and the second recording was performed immediately (referred to as zero minutes dark adaptation from here). Finally, following five minutes dark adaptation, the third recording was performed (referred to as five minutes dark adaptation from here). Both the zero minutes dark adaptation and the five minutes dark adaptation resulted in mixed-receptor responses. After this, the light was turned on again, and the left eye was prepared for recordings. A minimum time of 10 minutes was allowed between right and left eye 67
83 recordings to allow the left eye to become light adapted before ERGs were conducted. Only the a- and b-waves were assessed in the present study Data processing and statistical analysis For statistical analysis, animals were grouped by breed and genotype (e.g. CLN5 +/-, CLN5 -/-, CLN6 +/-, CLN6 -/- ) and the repeated measurements were allocated into age-groups (3 months, 5 months, 7 months,, 17 months). The ERGs were analysed with the provided software (Eickemeyer). The a- and b-wave latencies and amplitudes were measured for each eye for each type of adaptation (i.e. light adaptation, zero minutes dark adaptation, five minutes dark adaptation) and an average measure was calculated from both eyes. Means and corresponding SEM were calculated for each measurement for each genotype for each age. Two-way repeated measures ANOVAs were performed for each set of measurements to investigate the effects of time and disease status on the latencies and amplitudes of a- and b- waves respectively. Differences were regarded significant where P < RESULTS Fundus photography Fundus photography revealed obvious thinning of the retinal blood vessels in both CLN5 and CLN6 affected animals compared with controls (Figure 5.2). In both genotypes thinning could be observed from 11 months of age and was pronounced at the end of the trial period, 17 months Electroretinography Disease status had an effect on the latencies of the b-waves after zero minutes of dark adaptation in CLN5 -/- and CLN6 -/- animals, where the latencies were consistently lower than those of controls throughout the entire trial period (P < 0.05). The b-waves of CLN5 -/- animals had a mean latency of 16.6 ± 0.3 ms compared with 18.3 ± 0.5 ms in CLN5 +/- controls and that of CLN6 -/- animals was 16.3 ± 0.3 ms compared with 18.3 ± 0.2 ms in CLN6 +/- controls. Neither disease status nor time had an effect on any of the other measures of latency. The light adapted ERG showed a trend of a reduction of the b-wave amplitudes in CLN5 -/- sheep compared with controls and also the a-wave amplitudes tended to be reduced in older sheep (age > 15 months) (Figure 5.3). Although these trends were not significant in the repeated measures ANOVA, most affected animals were distinguishable from controls based on visual assessment of their ERG traces from between 9 and 11 months and most animals had near extinguished amplitudes at 17 months (Figure 5.5). 68
84 The a-wave amplitudes from the zero minutes dark ERGs from CLN5 -/- animals were significantly reduced from 11 months onward, however the b-wave amplitudes were already distinguishable as lower than those from controls at 9 months (Figure 5.3). When comparing the ERGs visually, it was possible to identify affected animals from between 7 and 9 months of age based on the zero minutes dark adaptation ERG, and nearly extinguished amplitudes were seen from 15 to 17 months (Figure 5.5). The five minutes dark adaptation ERG of CLN5 -/- animals showed similar results to the zero minutes dark adaptation (Figure 5.3). The control animals had less stable a-wave amplitude measurements and thus the trend of reduction of amplitude in CLN5 -/- animals did not become significant until 13 months of age, although the traces from affected sheep were visually distinguishable from those of controls after around 7 months of age (Figure 5.5). The amplitudes of b-waves from affected animals after 5 minutes of dark adaptation were visually distinguishable as lower than those from controls at 7 months and were significantly reduced from 9 months and onwards (Figure 5.3 and Figure 5.5). Overall, CLN6 animals showed similar changes in their ERGs to those recorded from CLN5 animals. The a-wave amplitudes of CLN6 -/- animals were stable throughout most of the trial period but became reduced after 15 months of age and extinguished amplitudes were seen in some animals after this age (Figure 5.4 and Figure 5.6). The b-wave amplitudes of light adapted ERGs showed an ongoing reduction throughout the entire trial period which became significant after 11 months of age. Extinguished amplitudes were seen between 15 and 17 months (Figure 5.6). The zero minutes dark adaptation ERGs, taken immediately after the lights were turned off, had reduced amplitudes for both a- and b-waves early in the trial period (Figure 5.4) and the amplitudes were nearly extinguished between 13 and 17 months (Figure 5.6). The five minutes dark adaptation ERGs showed a similar pattern, with amplitudes from CLN6 -/- animals tending to be lower than those from CLN6 +/- animals from 5 months of age. However, a distinct drop in amplitude in ERGs from CLN6 -/- animals was seen between the measurements at 9 and 11 months (Figure 5.4). Extinguished amplitudes became evident in the same timeframe as in the zero minutes dark adaptation ERGs (Figure 5.6). In both CLN5 -/- and CLN6 -/- sheep all ERG readings showed great individual variation. Some animals had abolished ERGs by 13 months, others still had recordable ERGs at 17 months of age when the trial ended. 69

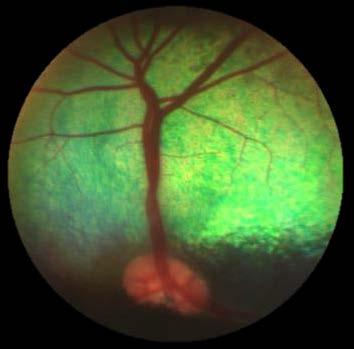


85
86 Amplitude (µv) Amplitude (µv) Amplitude (µv) a-wave amplitude A 200 Light adaptation C 200 Zero minutes dark adaptation E 200 Five minutes dark adaptation Age (months) B D F b-wave amplitude Light adaptation CLN5 +/- CLN5 -/ Zero minutes dark adaptation Five minutes dark adaptation Age (months) Figure 5.3 Mean amplitudes of electroretinography (ERG) a- and b-waves in CLN5 sheep Mean amplitudes (± SEM) from CLN5 affected (CLN5 -/- ) and unaffected controls (CLN5 +/- ) at different ages. For n see Table 5.1. Left column shows a-waves, right column shows b-waves. Light adapted ERGs were obtained first (A, B), followed by a measurement immediately after the light was turned off (C, D) and one after five minutes of dark adaptation (E, F). * indicates where P < 0.05 after repeated measures ANOVA. 71
87 Amplitude (µv) Amplitude (µv) Amplitude (µv) A 200 E a-wave amplitude Light adaptation C 200 Zero minutes dark adaptation Five minutes dark adaptation Age (months) B 400 b-wave amplitude Figure 5.4 Mean amplitudes of electroretinography (ERG) a- and b-waves in CLN6 sheep Mean amplitudes (± SEM) of CLN6 affected (CLN6 -/- ) and unaffected controls (CLN6 +/- ) at different ages. For n see Table 5.1. Left column shows a-waves, right column shows b-waves. Light adapted ERGs were obtained first (A, B), followed by a measurement immediately after the light was turned off (C, D) and one after five minutes of dark adaptation (E, F). * indicates where P < 0.05 after repeated measures ANOVA Light adaptation CLN6 +/- CLN6 -/ D 400 Zero minutes dark adaptation F 400 Five minutes dark adaptation Age (months) 72
88
89
90 5.5 DISCUSSION This study has shown electroretinography and fundus photography to be useful quantitative and qualitative measures of progressive retinal degeneration accompanying the onset and progression of ovine NCL. Blindness is a defining feature of human as well as ovine NCL. Recent and ongoing treatment trials for ovine NCL are yielding promising results for viral mediated gene replacement therapy, preventing or halting brain atrophy, but retinal degeneration leading to blindness continues (Mitchell et al., 2017). Because the retina can be considered as the most distal part of the CNS as far as viral mediated gene therapy is concerned, ocular delivery of gene therapy is likely to be needed to avert retinal atrophy. In the light of future ocular gene injection trials, valid and practical protocols for longitudinal monitoring of disease development and treatment efficacy are going to be required. The results presented here describe gradual and ongoing retinal degeneration in both the ovine CLN5 and CLN6 disease. A previous ERG investigation of the pattern of retinal degeneration in CLN6 sheep revealed a progressive loss of rod photoreceptor function (Graydon & Jolly, 1984). However, the present results provide a comprehensive picture of retinal functional changes occurring in two ovine models of NCL, CLN5 Borderdale and CLN6 South Hampshire, plus the additional information provided by systematic funduscopy. The only change in appearance of the fundus observed in this study was attenuation of the retinal vasculature, indicating retinal degeneration. This is the first description of retinal vascular attenuation in ovine NCL and contrasts previous descriptions where vascular attenuation was not seen in CLN6 -/- sheep (Graydon & Jolly, 1984; Mayhew et al., 1985). This differs from reported findings in several forms of canine NCL, where increased granularity in the mid-peripheral and peripheral tapetal fundus has been described (Katz et al., 2008; Whiting et al., 2015). No other changes in overall fundus appearance were observed in the sheep. However, changes in fundus appearance in NCL tend to be highly individual and vary greatly between patients and disease types, with signs ranging from mild to marked vessel attenuation, and from no changes in appearance to both increased and decreased pigmentation, granularity and mottling of the fundus (Goebel et al., 1974; Weleber et al., 2004; Hainsworth et al., 2009). In the light of the very consistent results from the ERG study presented here, along with the inability to develop a quantitative measure for assessing the images, it is questionable whether the fundus photography in these sheep has yielded any significant additional information that would assist in the monitoring of ovine NCL progression and potential treatment efficacy. 75
91 The ERG results revealed that in both CLN5 and CLN6 affected animals, light adapted b-wave amplitudes were affected by disease status earlier and to a greater extent than a-wave amplitudes. Nevertheless, completely extinguished light adapted ERGs were recorded from some CLN5 and CLN6 affected animals towards the end of the trial period, indicating that the a-wave also becomes extinct in advanced disease. The two mixed receptor measures (zero minutes and five minutes dark adaptation) provided more conclusive information than the light adaptation measures. Both a- and b-wave amplitudes of affected animals were distinguishable from those of controls relatively early in the trial period when comparing the mixed receptor responses. These results are supported by histological and ultrastructural findings described by Graydon and Jolly (1984), who noted that the loss of rod photoreceptor cells preceded that of cones and was more severe. This suggests that a more rod-driven ERG response (i.e. after dark adaptation) would show the effect of retinal atrophy earlier than a cone driven, light adapted ERG, and this is evident from the present study. The patterns of change of the ERG responses presented here differed between the CLN5 and CLN6 affected animals and this was particularly obvious in the five minutes dark adapted measures. In CLN5 -/- animals the amplitudes of both a- and b-waves of these ERG measures followed an almost linear pattern of decline having started already at 5 months of age. On the other hand, the amplitudes of both a- and b-waves in CLN6 -/- animals resembled those of control animals until approximately 9 months of age followed by a sudden reduction that was observed at 11 months of age and amplitudes stayed reduced for the remainder of the trial period. Differences in the pattern of changes of vision and cognition between the CLN6 -/- and the CLN5 -/- animals have been identified in other studies and therefore a difference in the pattern and time course of retinal degeneration would be expected between the two types of disease in sheep (Mitchell, 2016; Mitchell et al., 2017). In CLN5 -/- sheep the earliest observations of behavioural changes were made from 5 6 months and in CLN6 -/- sheep from 7 8 months (Mitchell, 2016; Mitchell et al., 2017). Initial signs are apprehensive walking, ducking of the head when passing through gateways or narrow races, reduced spatial awareness and struggling when moving between sun and shade areas or areas with different types of flooring (Mitchell, 2016; Mitchell et al., 2017). These signs worsen until the sheep s cognitive and visual capabilities are severely affected from between 12 and 14 months. Visual acuity tests such as menace and dazzle responses and corneal, palpebral and pupillary light reflexes are severely reduced from about one year of age in CLN5 -/- animals and from 14 months of age in CLN6 -/- animals (Mitchell, 2016; Mitchell et al., 2017). A maze test has been developed to test cognitive and visual function in ovine NCL (Mitchell, 2016; Mitchell et al., 2017; Martin Wellby, unpublished data). In this maze test, which is based on the sheep s 76
92
93 age in both CLN5 -/- and CLN6 -/- sheep and a loss of neurons from the visual cortex is can be detected from 6 months in CLN6 -/- animals and is significant at 9 months in CLN5 -/- animals (Oswald et al., 2005; Mitchell, 2016). These histological findings in combination with observations of the animals in the field, cognitive and clinical testing, plus ERG and funduscopy results can be used to differentiate the central blindness caused by cerebrocortical atrophy from the peripheral blindness caused by retinal degeneration. Because the early clinical manifestations of blindness considerably precede the age of non-recordable ERGs in both CLN5 -/- and CLN6 -/- animals, it could be argued that the early blindness is caused by atrophy of the visual cortex rather than being attributable to atrophy of the retina. Furthermore, the inability of affected sheep to complete the maze test almost coincides with the time of abolished or at least greatly reduced ERG recordings, indicating complete loss of retinal reactivity at this later stage of disease progression (Figure 5.7). In contrast, other authors claim that a different course of events describes the development of central and retinal blindness. von Schantz et al. (2009) have reported neuronal loss in the primary visual cortex of CLN5 deficient mice that coincides with the onset of blindness in these mice and Leinonen et al. (2017) postulate that this is a symptom of the retinal degeneration rather than a primary cause of blindness in these mice. However, the present results and the development of visual and cognitive changes described above suggest a different pattern, in which atrophy of V1 precedes retinal degeneration. A possible explanation of the pattern of the development of visual loss seen in ovine NCL could be what is termed blindsight in humans. Blindsight refers to a situation where patients with central blindness caused by damage to one or both V1 are able to react unconsciously to visual stimulus presented in the damaged visual field without consciously recalling seeing the visual stimulus (Pöppel et al., 1973; Weiskrantz et al., 1974). Observations have been made on a human patient with bilateral loss of V1 after two strokes, who appeared clinically blind but was still able to negotiate his way through a corridor without hitting obstacles that were placed in the way (de Gelder et al., 2008). Studies in monkeys have shown that after unilateral removal of V1, the monkeys were still noticing a light stimulus, which was indicated by involuntary eye movement towards the stimulus, however they were not performing a learned response to indicate conscious recognition of the stimulus (Cowey & Stoerig, 1997). The explanation of blindsight remains inconclusive and has been reviewed in detail elsewhere (Overgaard, 2012). Nevertheless, some aspects of blindsight could explain the early clinical manifestations of blindness in ovine NCL, where visual acuity is reduced while some awareness of surroundings is still present. 78
94 5.6 CONCLUSION The current study has shown that ERG is an invaluable tool for monitoring the progression of retinal degeneration in ovine NCL. Fundus photography provides corroborative evidence of the retinal degeneration in Batten sheep but does not have sufficient resolution to become useful as an adjunct to ERG for this purpose. The course of development of retinal changes differs between ovine CLN5 and CLN6 disease. These measurements enable some differentiation to be made between retinal and central causes of blindness in ovine NCL. ERG will be useful for monitoring the effectiveness of ocular gene therapy. 79
95 6 PILOT STUDY FOR LONGITUDINAL MAGNETIC RESONANCE IMAGING IN OVINE NCL 6.1 INTRODUCTION Magnetic resonance imaging (MRI) is commonly used in the diagnosis and monitoring of human NCL. Typical findings are diffuse brain atrophy, regional cortical thinning and signal changes in the white matter and thalamus (Autti et al., 1992; Dyke et al., 2013; Jadav et al., 2014). With growing interest in sheep models for translational research (section 1.1), the use of imaging modalities such as CT and MRI has also increased in sheep. For example MRI in sheep has been used to visualize the development of the pituitary gland (Carroll et al., 2007), to study the effects of gonadotrophinreleasing hormone agonist on brain development (Nuruddin et al., 2013) and to study focal epilepsy (Opdam et al., 2002). Furthermore, MRI has been used in sheep for stereotaxic guidance of neurosurgery in a stroke model and during acquisition of brain stem biopsies (Dreyer et al., 2012; Staudacher et al., 2014), and in a dog model of CLN2 disease for stereotaxic placement of intracerebroventricular catheters for the delivery of enzyme replacement therapy (Katz et al., 2008). Recently, an attempt has been made at a longitudinal MRI study of CLN6 disease in South Hampshire sheep to investigate the pattern of brain atrophy and potential regional differences hereof (Sawiak et al., 2015). The animals in this study were aged 17 to 18 months at enrolment and the final scan was performed at 22 to 23 months. Because of the late start of the study, brain atrophy was already pronounced at baseline scanning. The study found that only small numbers of animals were needed for statistical significance, as the differences between affected sheep and controls were large. The study used voxel based morphometry; for which study-specific ovine templates were created based on the animals included in the sample (Sawiak et al., 2015). In recent years, two ovine specific population-averaged MRI brain atlases have been created, facilitating group-wise investigations of ovine MRI. One is based on T1 weighted images from a total of 38 adult Merino sheep acquired on a 1.5 tesla (T) MRI scanner (Nitzsche et al., 2015). The atlas includes tissue probability maps (TPMs) for grey matter (GM), white matter (WM) and cerebrospinal fluid (CSF) of the cerebrum, but not for the cerebellum (Nitzsche et al., 2015). The other atlas is based on both T1 and T2 weighted scans from 18 sheep acquired on a 3 T MRI scanner (Ella & Keller, 2015). TPMs for GM, WM and CSF were created and subsequently a 3-D atlas of 25 external (cortical) and 28 internal (subcortical and ventricle) brain structures were generated, including the cerebellum (Ella & Keller, 2015; Ella et al., 2017). 80
96 6.2 AIMS AND OBJECTIVES The aim of this study was to investigate the usefulness of MRI scanning in longitudinal monitoring of ovine NCL and to establish an image analysis pipeline to facilitate investigation of structural MR images. To achieve this, two pilot studies were performed and the two different ovine specific MRI atlases were applied to the data. 6.3 MATERIALS AND METHODS All animal procedures were performed in accordance with the respective (NZ and Australia) animal welfare acts. Two MRI studies were included. The first study was performed on Merino CLN6 sheep at the University of Sydney, Australia provided by Dr Imke Tammen. The second was performed in collaboration with Dr Tracy Melzer at the New Zealand Brain Research Institute and University of Otago, Christchurch, NZ MRI studies conducted at the University of Sydney The sheep were born at the University of Sydney farms at the Camden campus (New South Wales) in 2009 and 2010 and raised outdoors on pasture. CLN6 affected Merino sheep and unaffected ageand breed-matched controls were included. Their disease status was identified through direct DNA testing (section 2.1.2) (Tammen et al., 2006). Some sheep underwent three MRI scans, others were enrolled in the study later and received only one or two MRI scans. Sheep numbers and genotypes are summarized in Figure 6.1. Normal Affected Age (months) when MRI was recieved Figure 6.1 Summary of sheep enrolled in the MRI study at the University of Sydney at different ages Each line represents one animal, each dot indicates the age(s) at which each animal received an MRI scan. 81
97 The sheep were transported on the same day or a day before MRI to the imaging facility where they were housed in indoor pens. Prior to MRI scanning they were pre-medicated with an intramuscular injection of diazepam (0.2 mg/kg LW) and morphine (0.3 mg/kg LW). Anaesthesia was induced by IV infusion of propofol (4-6 mg/kg LW to effect) followed by endotracheal intubation and maintenance of anaesthesia through inhalation of isoflurane in 100% oxygen (1.5% - 3% v/v to effect). Structural MR images were acquired with a T1-weighted, 3-D gradient echo acquisition (Echo time/repetition time (TE/TR) = 14/34 ms, flip angle = 65 degrees, acquisition matrix = , FOV= 230 mm, slice thickness = 0.9 mm, voxel size = mm 3, total scan time = 10:21 minutes) on a 0.25 T Esaote Vet-MR Grande scanner (Esaote SpA, Genoa, Italy). Dr Mariano Makara performed the MRI scanning. This study will be referred to as the Sydney study MRI study conducted at the New Zealand Brain Research Institute During the course of this project, a collaboration with the New Zealand Brain Research Institute (NZBRI) was established for the development of suitable protocols and procedures for longitudinal MRI scanning of sheep included in gene therapy trials. A total of 8 sheep of varying genotype and treatment status have received MRI scans on three different occasions. Results from one 15 months old CLN5 affected (CLN5 -/- ) and one unrelated (CLN5 +/+ ) age matched control are presented here. The sheep were restricted from food and water for 12 h and transported to the NZBRI immediately before the MRI was conducted. They were anaesthetised by IV injection of a mixture of 0.8 mg/kg LW diazepam (Pamlin injection, Troy Laboratories NZ Pty Ltd, Auckland, NZ) and 17 mg/kg LW of ketamine hydrochloride (Phoenix Ketamine injection, Phoenix Pharm Distributors Ltd, Auckland, NZ) and placed in the MRI scanner in lateral recumbency. Structural MR images were acquired with a 3D T1-weighted, inversion recovery-prepared fast spoiled gradient recalled echo acquisition (BRAVO), tuned to brain tissue (TE/TR/ inversion time (TI) = 5.15/12.44/400 ms, Flip angle = 15 degrees, acquisition matrix = , FOW = 200 mm, slice thickness 0.8 mm, voxel size = mm 3 ) on a 3 T G HDxt Signa scanner using a closed-end 8 channel human head coil (General Electric, Fairfield, Connecticut, USA). Dr Tracy Melzer performed the MRI scanning. This study will be referred to as the NZBRI study Image analysis All image analyses were performed by Dr Tracy Melzer at the NZBRI using SPM8 (Statistical Parametric Mapping, Wellcome Department of Imaging Neuroscience Group, UCL, UK; running in Matlab (R2014a, Mathworks, Massachusetts, USA). The images from the Sydney study were processed twice, using the two different ovine brain tissue probability maps (TPMs) and stereotaxic atlases (Ella & Keller, 2015; Nitzsche et al., 2015; Ella et al., 82
98 2017). It has to be noted that the TPM from Nitzsche et al. (2015) does not include the cerebellum. Based on the results from the Sydney study, the images from the NZBRI study were analysed using the TPMs and atlas from Ella and Keller (2015) and Ella et al. (2017) only. Raw T1-weighted images from each sheep were manually reoriented to the template space and then co-registered to the sheep template using default parameters in SPM8. T1-weighted images were then intensity bias corrected, tissue classified into GM, WM, and CSF, and normalised within a unified model (Ashburner & Friston, 2005), utilizing the sheep specific TPMs. Tissue segments were modulated, thereby preserving actual tissue volumes. Modulated, normalized GM, WM, and CSF segments, in the standardized space of the sheep template, were further analysed. First, the total GM, WM, and CSF volumes were extracted and ICV was defined as the sum of the three tissue segments. Additionally, the ovine specific cortical atlas (Ella et al., 2017) was used to extract GM volume from the following regions, based on their relevance in the neuropathological cascade that was determined earlier (Chapter 3): Parietal cortex, occipital cortex, primary visual cortex, frontal association cortex, somatosensory cortex, primary motor cortex and cerebellar cortex Statistical analysis Based on low animal numbers and only partly repeated measures (Figure 6.1), limited statistical power of the current study was expected. Based on the small sample size, all ages were pooled. Student s t-test was used for cross-sectional comparison between affected and controls and Cohen s d was calculated to evaluate effect sizes (section 2.2). Effect sizes were regarded as follows: 0.2 = small; 0.5 = medium, 0.8 = large; 1.3 = very large. 83
99 6.4 RESULTS Sydney study Segmentation The results from both segmentations (based on Ella and Keller (2015) and based on Nitzsche et al. (2015)) are summarised in Figure 6.2 and Table 6.1. These show a very large significant effect of disease status on total ICV regardless of which segmentation method was used. Both segmentations showed that the biggest loss of tissue occurred in the grey matter, followed by the white matter. The segmentation based on Ella and Keller (2015) showed a very large and significant effect of disease status on CSF volume, (Cohen s d = 7.2), which was increased in affected animals compared with controls. However, the segmentation based on Nitzsche et al. (2015) indicated no significant effect of disease status on CSF volume (Cohen s d = 0.01). It appeared that the ICV was increasing slightly over time when using the template by Ella and Keller (2015), whereas the measures based on the template by Nitzsche et al. (2015) indicated an initial increase of ICV followed by loss of ICV Regional measurements Grey matter volumes from the parietal, occipital, primary visual, frontal associated, somatosensory, primary motor and cerebellar cortices and effect sizes of disease status on grey matter volumes are summarised in Figure 6.3. These regional results were consistent with the global results from the segmentation, showing that grey matter was reduced in CLN6 affected sheep compared with controls. Disease status had the largest effect on the parietal and primary visual cortices volumes, followed by the frontal associated, occipital, somatosensory, and the primary motor cortex. The effect of disease status on the volume of the cerebellar cortex was small and this effect was not significant. When assessing the change of grey matter volume in each of the regions of interest, it appeared that grey matter volume increased in both NCL affected and normal CLN6 Merino sheep over time. Table 6.1 Effect of disaese status on segmented brain tissue volumes of CLN6 merino sheep Segementation of MR images from CLN6 affected Merino sheep and controls based on TPMs from Ella and Keller (2015) and based on TPMs from Nitsche et al. (2015). Volumes were segmented into grey matter (GM), white matter (WM) and cerebrospinal fluid (CSF). Total intracranial volume (ICV) were calculated as sum of the three. Significance was investigated by Student s t-test and effect sizes were calculated as Cohen s d. P 0.05 was regarded as significant. Effect sizes were regarded as: 0.2 = small; 0.5 = medium, 0.8 = large; 1.3 = very large. Based on Ella and Keller (2015) Based on Nitzsche et al. (2015) Effect size P-value Effect size P-value ICV -6.5 < < GM -6.7 < < WM -6.5 < CSF 7.2 <
100 Segmentation based on Ella and Keller (2015) Segmentation based on Nitzsche et al. (2015) 120 ICV 120 ICV Normal Affected Volume (ml) Age (months) Age (months) 80 GM 80 GM Volume (ml) Age (months) Age (months) 80 WM 80 WM Volume (ml) Age (months) Age (months) 80 CSF 80 CSF Volume (ml) Age (months) Age (months) Figure 6.2 Volume changes of segmented brain tissues in CLN6 Merino sheep Mean (±SEM) tissue volumes of grey matter (GM), white matter (WM) and cerebrospinal fluid (CSF) at different ages. Intracranial volumes (ICV) were calculated as sum of all three tissues. MR images were segmented twice, once using a template from Ella and Keller (2015) and once using a template from Nitzsche et al. (2015). See Figure 6.1 for n. 85
101 5 Parietal cortex 5 Occipital cortex 5 Primary visual cortex Volume (ml) Age (months) Age (months) Age (months) 5 Frontal associated cortex 5 Somatosensory cortex 5 Primary motor cortex Volume (ml) Age (months) Age (months) Age (months) 10 8 Cerebellar cortex CLN6+/+ CLN6-/- Region Effect size P-value Parietal cortex -2.0 < Occipital cortex -1.4 < Volume (ml) Primary visual cortex -2.0 < Frontal association cortex -1.8 < Somatosensory cortex -1.2 < Primary motor cortex -1.1 < Cerebellar cortex Age (months) Figure 6.3 Regional volume changes in CLN6 Merino sheep Grey matter volumes from the parietal, occipital, primary visual, frontal association, somatosensory, primary motor and cerebellar cortices were measured on MRI scans from different ages based on the ovine brain template (Ella et al., 2017). CLN6 affected Merino sheep (CLN6-/-) and healthy controls (CLN6+/+) were included. See Figure 6.1 for n. Values are presented as means ± SEM at each age. Significance was investigated using Student s t-test. Effect size of disease status was calculated for each region using Cohen s d. Effect sizes were regarded as follows: 0.2 = small; 0.5 = medium, 0.8 = large; 1.3 = very large. 86
102 6.4.2 NZBRI study Results from two sheep, one CLN5 affected and a control, that each received a single MRI scan at the NZBRI are presented. Volumetric measures from the segmentation of GM, WM and CSF and regional cortical GM measures are summarized in Figure 6.4 and example images from the segmentation are shown in Figure 6.5. The images in Figure 6.5 show that the segmentation fitted well for the control sheep, however some incorrect registration occurred in the images from the NCL affected sheep. It appears that some of the grey matter in the cortical segmentation was registered as CSF instead. This became obvious when comparing the volumetric measures from the segmentation of affected and normal (Figure 6.4). In the normal sheep the GM segment was measured as 48.3 ml and the CSF was 21 ml. In the affected sheep the CSF segment only measured 8.2 ml and the GM segment measured 43 ml. The regional cortical measurements reflected the global results from the segmentation. All regional measures were reduced in the affected animal compared with the control. A 120 B CLN5+/+ volume (ml) volume (ml) CLN5-/ GM WM CSF ICV 0 CER V1 OCC FC M1 PC Figure 6.4 Example of segmentation and regional volume measures Examples of volumetric measurements based on MRI scans of one CLN5 affect (CLN5-/-) and one unrelated control (CLN5+/+) sheep, both aged 15 months based on ovine specific TPMs and stereotaxic atlas (Ella & Keller, 2015; Ella et al., 2017). A) Measures from segmentations of grey matter (GM), white matter (WM) and cerebrospinal fluid (CSF). Intracranial (ICV) was calculated as the sum of GM, WM and CSF. B) Measures from regional cortical measurements from the cerebellar cortex (CER), primary visual cortex (V1), occipital cortex (OCC), frontal association cortex (FC), primary motor cortex (M1) and parietal cortex (PC). 87

.")
103 A B Figure 6.5 Examples of MRI segmentation from CLN5 affected and control sheep Examples of axial images from MRI scans of A) one 15 months old healthy control and B) a 15 months old CLN5 affected Borderdale sheep. Segmentations are based on ovine specific TPMs (Ella & Keller, 2015). Red = grey matter, blue = white matter, green = cerebrospinal fluid (CSF). Note the underrepresentation of GM and overrepresentation of CSF in the affected sheep. 88
104 6.5 DISCUSSION The present study has shown that MRI can be useful to monitor the neuropathological changes in ovine NCL. The results showed that the intracranial volume of CLN6 affected Merino sheep was reduced compared with unaffected controls and that most of the volume loss occurred in the grey matter, with less loss of volume from the white matter. The segmentation based on the template by Ella and Keller (2015) showed an increase of CSF volume in CLN6 affected Merino sheep. Overall, these results mirror what has been described at post mortem examination and through CT imaging in CLN6 -/- Merino sheep and the two other ovine NCL models (Oswald et al., 2008; Mitchell, 2016; Chapters 3 and 4). However, the observed differences were already evident in base-line scanning at approximately 4 to 5 months of age (Figure 6.2) and just slight increases of mean ICV and grey matter volumes were seen over time in both affected animals and controls when the images were analysed using the template provided by Ella and Keller (2015). Based on the same template, white matter volumes of affected Merino sheep decreased slightly over time and the CSF volume was increased at all ages. The measures based on the template by Nitzsche et al. (2015) showed a slight decrease of ICV in affected Merino sheep over time. However, both grey and white matter measures from affected Merino sheep increased over time, and only the CSF measures decreased from the first to the last scan. The same was true for control animals, which also had lower CSF volumes on the last scanning date compared with the previous scans (Figure 6.2). It is also noteworthy, that measurements based on Nitzsche et al. (2015) indicated that disease status had near to no effect on CSF volume, although the measures based on Ella and Keller (2015) indicated a very high effect size (Table 6.1). Possible explanations for this could be the lack of cerebellum in the template by Nitzsche et al. (2015), as through this some amount of CSF is also disregarded, or an error in the segmentation, where most voxels are regarded as either GM or WM and not as CSF. In summary, the current global measures of GM, WM and CSF volumes have failed to display the progressive nature of the brain atrophy that is characteristic in ovine NCL, but were sensitive enough to show that affected animals have reduced overall brain volumes compared with controls. The present study is the first to apply an ovine specific regional brain atlas to MRI scans from NCL affected sheep. Similar to the global measures, the results failed to portray the progressive development of the cortical thinning that has been described at post mortem examination (Oswald et al., 2008; Mitchell, 2016; Chapters 3 and 4). Nevertheless, general trends from the present results follow what was observed at post mortem examination, showing that disease status had the largest effect on the parietal and visual cortices, the smallest effect on the motor cortex and that the cerebellum was largely spared from atrophy (Figure 6.3). Overall, the templates provided by Ella and 89
105 Keller (2015) and Ella et al. (2017) appeared to be more applicable to the data in this study. The cerebellum is largely unaffected in ovine NCL (Oswald et al., 2008; Mitchell, 2016; Chapter 4) and can therefore be regarded as an internal control for volumetric changes of the brain. The lack of the cerebellum in the template by Nitzsche et al. (2015) reduces the usefulness of this template, especially with regard to NCL. Furthermore, the regional atlas from Ella et al. (2017) enabled detailed measurements in vivo that can be compared to histology measures performed at post mortem examination. Similar measurements have been performed recently on children with CLN2 disease (Dyke et al., 2016). Cortical thickness difference between patients and healthy controls were compared by using the surface based MR image analysis tool FreeSurfer ( While debate exists on the optimum method to quantify brain degeneration (Clarkson et al., 2011), both surface-based cortical thickness and voxel-based tissue volume estimation methods converge on similar trends observed between findings of the human trial and from the present study. In both cases, the occipital, visual and parietal cortices showed more atrophy than the frontal and or motor cortices (Dyke et al., 2016). The present study has demonstrated the potential of MRI in ovine NCL research for the longitudinal in vivo collection of detailed translational data. However, the results have indicated a range of issues that need to be addressed to reach this goal. Several factors could have contributed to the discrepancy between MRI measures from the Sydney study and post mortem observations. Only one of the affected animals underwent MRI scanning three times, one received two scans and the remaining two only underwent one MRI scan (Figure 6.1), leading to difficulties describing the pattern of change longitudinally. Future trials should emphasize experimental design to improve statistical power. Furthermore, the image quality of the Sydney study was limited, which was to be expected from a 0.25 T MRI scanner (Figure 6.6). Images exhibited low contrast (low definition between GM, WM, and CSF) as well as coarse spatial resolution, making it difficult to detect tissue boundaries and register tissues correctly. The findings from the NZBRI study, which were obtained on a 3 T scanner, showed that improved image quality enables better segmentation (Figure 6.4). However, the same figure also shows that a better segmentation was achieved on images from the healthy animal than those from the CLN5 affected sheep. This is to be expected as the brains from NCL affected animals not only shrink in size but also are altered in composition. Neuropathology and CT imaging in ovine NCL have shown regional patterns of grey matter loss and increases in CSF volume (Oswald et al., 2005, 2008; Mitchell, 2016; Chapter 4) and MR imaging studies in human NCL have described signal changes of brain tissue (Autti et al., 1992). The TPMs used here are based on healthy animals; which is an important issue to consider when analysing brain scans from animals with gross neuropathological changes. In this case, segmentation and normalization may be 90
.")
.")
106 systematically worse in sheep with gross atrophy or neuropathology. When comparing other aspects of the present studies with those that produced the TPMs, other areas for improvement appear (Ella & Keller, 2015; Ella et al., 2017). Largely improved image quality is achieved by longer acquisition times, and while the present studies both had acquisition times under 15 minutes, the TPMs and the stereotaxic atlas were constructed from scans with total acquisition times of over 3 h per animal (Ella & Keller, 2015; Ella et al., 2017). To achieve this, the sheep were maintained anaesthetised through inhalation of isoflurane in oxygen, for which special MR-comparable anaesthesia equipment is needed (Ella & Keller, 2015; Ella et al., 2017). A Rostral B Rostral WM CSF GM Caudal Caudal Figure 6.6 Comparison of images aquired on different MRI scanners Representative axial ovine brain MR images. Image A) was acquired on a 0.25 T MRI scanner whereas B) was acquired on a 3 T MRI scanner. Note the difference in contrast and spatial resolution between the images. Grey matter (GM), (WM) and cerebrospinal fluid (CSF) are easily distinguishable on image B. This is not the case on image A. 6.6 CONCLUSION MRI is promising to be useful technology for longitudinal in vivo monitoring of neuropathology in ovine NCL. CLN6 affected Merino sheep have reduced ICVs compared with healthy controls. The use of TPMs and stereotaxic atlases derived from healthy cohorts for measurements in affected animals needs to be treated with caution, but provide an opportunity for further study. Longer acquisition times should be applied for future MRI studies in ovine NCL research. 91
107 7 APPLIED METHODS FOR LONGITUDINAL IN VIVO MONITORING OF GENE THERAPY TRIALS 7.1 INTRODUCTION Over the last few decades ovine NCL research has contributed greatly to the understanding of the NCLs in general, including human forms. Translational knowledge has been accumulated from investigations into the natural history of the disease, such as the identification of the storage material subunit c of the mitochondrial ATP synthase (Palmer et al., 1989, 1992; Fearnley et al., 1990; Palmer, 2015) and description of the neuroinflammatory changes (Oswald et al., 2005, 2008; Mitchell, 2016), leading to a different understanding of the pathological cascade (Palmer et al., 2013; Palmer, 2015). The natural progression of this work is the establishment of therapy trials (Palmer et al., 2015). Functions of the proteins that are coded for by the CLN5 and CLN6 genes are still unknown and gene therapy is the most promising treatment option. A significant reduction of storage body accumulation in in vitro CLN5 -/- neuronal cell cultures after gene therapy using a lentiviral vector has been reported (Hughes et al., 2014). Transduction of neurons and neuroblasts could be seen in vivo after intra-cortical injection with a vector expressing green fluorescent protein (Linterman et al., 2011). These studies have led to the current programme of gene therapy trials (Mitchell, 2016). Sheep with naturally-occurring disease have many advantages over other models for these investigations. Their body size is similar to that of humans, lambs weighing kg at birth and adult sheep weighing kg. The gyrencephalic structure of the sheep brain and its spatial organisation is similar to that of humans (Palmer et al., 2011, 2015) and, with an adult sheep brain weight of g, realistic approximations of dosage and routes of drug delivery can be made. The longer lifespan of sheep compared with small research animals and the similarity of their disease course to that of humans allows investigations of long-term effects and possible downstream consequences (Palmer et al., 2015). These include effects on the CNS and also possible systemic effects of disease that are usually not seen because the CNS symptoms overshadow these or because subjects do not live long enough to develop them. Also, possibilities of repeated treatment or combinations of treatments can be investigated in the large animal models. Having a relatively slow disease progression and long generation intervals (the current breeding programme produces one set of offspring each year), leads to the importance of longitudinal in vivo monitoring 92
108 of disease parameters that allow assessment without the need to sacrifice animals for post mortem investigations. 7.2 AIM AND OBJECTIVES The data presented in this section are part of the ongoing gene therapy programme at Lincoln University led by Dr Nadia Mitchell and have in parts been presented elsewhere (Mitchell et al., 2017). Here, the emphasis is to demonstrate the development and use of the techniques for longitudinal in vivo monitoring and for improved surgical planning and their importance for therapy trials. 7.3 MATERIALS AND METHODS Animals and viral vectors All procedures were conducted under the NZ Animal Welfare Act (1999) and approved by the Lincoln University Animal Ethics Committee. Where appropriate, the procedures were also approved by the Lincoln University Biosafety Committee and in compliance with NZ Environmental Protection Authority requirements. The gene therapy trial included four female CLN5 -/- sheep that received post-symptomatic treatment at approximately seven months of age. The sheep were kept under outdoor pastoral conditions together with age- and breed-matched controls. The vector used for the gene therapy treatment was a self-complementary (sc) AAV9 expressing the ovine CLN5 (scaav9- CLN5), produced by the University of North Carolina Gene Therapy Centre (Mitchell et al., 2017) Surgical procedures and CT guided trajectory planning Vector delivery was performed through stereotaxic injection surgery based on methods described by Linterman et al. (2011) using a Kopf stereotaxic frame (Kopf, model 1630; David Kopf Instruments, Tujunga, CA, USA) to target the lateral cerebral ventricles. A total volume of 400 μl containing 4.0 x viral genomes in sterile physiological saline solution was injected into each ventricle (Mitchell et al., 2017). To improve the accuracy of injection planning and to be able to adjust this for the different ages of animals, individual CT-based planning was conducted for each animal. Sheep were CT scanned as described earlier (Chapter 4) and the images were realigned in the same way as described for the skull thickness measurements (section ). After identifying the injection targets within the lateral ventricles and using bregma as a reference point, the rostro-caudal and medio-lateral coordinates for the burr holes in the skull were identified and the depths for the injections established (Figure 7.1). This procedure was repeated for animals included in other gene therapy experiments not presented here. 93
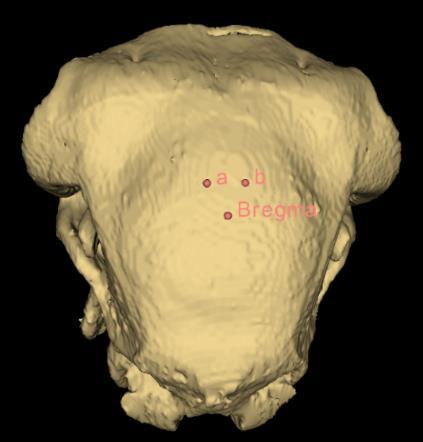


109
110 each ventricle using the same procedure as for the gene therapy surgeries. Then the head was CT scanned again to identify the localisation of the contrast fluid Longitudinal monitoring of intracranial volume As described in Chapter 4, ICV is a valid surrogate measure of brain size in sheep. The sheep included in the gene therapy trial described here received brain CT scans bimonthly and the ICVs were measured following the procedures described earlier (Chapter 4). Additionally, 3-D models of the ICVs were produced to visualise the volumetric changes and to identify possible regional differences within these. In brief, the sheep were starved for 12 h beforehand and anaesthesia was induced by intravenous injection of a mixture of ketamine hydrochloride (17 mg/kg LW; Phoenix Ketamine injection, Phoenix Pharm Distributors Ltd, Auckland, NZ) and diazepam (0.8 mg/kg LW; Pamlin injection, Troy Laboratories NZ Pty Ltd, Auckland, NZ). The sheep were intubated endotracheally and placed in the CT scanner in dorsal recumbency. A series of helical scans was performed with a slice interval and thickness of 1 mm. Scan times were approximately 10 min. Image analysis was performed in 3-D Slicer ( (Fedorov et al., 2012). Threshold-based manual selection of brain tissue and cerebral ventricles was performed, and the volumes were recorded after generating 3-D models from the selected areas Electroretinography Treated sheep underwent ERG bimonthly as described in Chapter 5 to monitor the development of blindness. In brief, following on from the CT procedure, the sheep were placed in sternal recumbency and anaesthesia was maintained by inhalation of isoflurane in oxygen (1.5% - 3% v/v to effect). Each eye was assessed separately, starting with the left eye. A light adaptation, zero minutes dark adaptation and a five minutes dark adaptation recording were performed for each eye. Each recording comprised the average of four consecutive readings obtained with a flash-interval of 0.8 seconds, using a white flash with an intensity approximately 2-3 cd/m 2. Following ERG, the sheep were extubated and brought to a padded wake-up area where they remained under surveillance until they had recovered full consciousness. It was established previously (section 5.5) that of the three recordings (light adapted, zero minutes dark adapted, and five minutes dark adapted), the five minutes dark adaptation recordings, which are mixed-receptor responses, give the best differentiation between affected and normal sheep. Therefore, the other two measures were disregarded in this study. Based on the results of Chapter 5, only the amplitudes of the recordings were measured. 95
111 7.3.5 Statistical analysis Repeated measure ANOVA or Student s t-test was performed where appropriate and Cohen s d was calculated to evaluate effect size (section 2.2). A P-value of 0.05 was regarded as significant and effect sizes were regarded as follows: 0.2 = small; 0.5 = medium, 0.8 = large; 1.3 = very large. 7.4 RESULTS Extension of lifespan The majority of the untreated affected animals reached their humane endpoint for continued survival between 18 and 20 months of age. At the time of writing, two of the treated sheep are still alive in the field at an age of over 25 months. The other two treated sheep were sacrificed at approximately 22.5 months of age for neuropathological examination to be performed by Dr Nadia Mitchell. The latest data included in this thesis is from measures at 22 months, but monitoring of the animals is continuing CT guided trajectory planning The total surgery time and the time from the correct positioning of the head to completion of the first and the second intra-cerebroventricular injections were compared between gene therapy surgeries where individual CT based surgery planning had been performed and those where it had not. There was a reduction of approximately 20% in the average total surgery time when individual CT based planning was employed (P < 0.001, Figure 7.2). The injection of radio-contrast fluid after individual CT based injection confirmed that this technique correctly located the lateral ventricles (Figure 7.2). The average injection coordinates in the present trial were: 8 mm (± 0.0 mm) rostral of bregma; 8 mm (± 1.6 mm) lateral either side from the midline and 16 mm (± 0.7 mm) depth from the top of the skull. 96

112 A Without model With model B Burr hole ** Lateral ventricle Mimutes * * Brain parenchyma 10 0 Total surgery times First injection completed Second injection completed Caudal Rostral Figure 7.2 CT guided planning of intra-cerebroventricular gene therapy injections A) Surgery times were measured for gene therapy surgery with individual CT based modelling (with model; n = 16) and without individual modelling (without model; n = 6). Times were measured from induction of anaesthesia until the anaesthesia was turned off (Complete surgery times), and the time from the positioning of the head in the stereotaxic frame to (First injection completed) and (Second injection completed). All three times were significantly shorter when individual CT modelling was used (*P < 0.05, **P < 0.001). Data are mean values and vertical lines represent ± SEM. B) To visualise the accuracy of the CT based modelling used for the gene therapy injections, the same procedure was conducted on a severed head of a sheep. Instead of injecting a viral vector, a radio-contrast fluid was injected and then visualised through a post-injection CT scan. A representative sagittal image is shown. Both the lateral cerebral ventricle and the burr hole contain the radio-contrast fluid (white medium). Air-filled spaces have arisen within the cranial cavity (black areas) where CSF has flowed out after the head was severed Intracranial volume in treated animals compared with untreated controls The mean ICVs of the treated animals were the same as those of untreated affected sheep at 7 months of age (affected: 88.3 ± 4.2 ml; treated: 89.5 ± 1.2 ml; P = 0.6). The severe and almost linear volume loss that untreated animals experience after 11 months of age did not occur in treated sheep (Figure 7.3).The ICV loss in the treated sheep from 7 months to 22 months was less than a quarter (mean loss: 1.4 ± 1.1 ml) of that in untreated animals between 7 and 17 months (mean loss: 5.8 ± 1.7 ml), showing a large effect of treatment on ICV changes (Figure 7.3). The bulk of the volume loss in treated sheep occurred between 16 and 18 months of age, as the ICVs of treated sheep were unchanged until approximately 16 months, thereafter the volumes declined noticeably until approximately 18 months of age, then plateaued (Figure 7.3). The loss of volume was obvious when the 3-D models of the ICVs of treated, affected and normal sheep were compared (Figure 7.4). The appearance of the ICVs of the treated animals was similar to those of other affected animals at 7 months, but the noticeable progressive shrinkage of the hemispheres evident in untreated affected animals at end-stage disease was not seen in the treated sheep, as the shape of the ICVs of these animals largely stayed the same after the therapy was 97
113 delivered. In affected animals the pronounced cortical atrophy and the sparing of the cerebellum makes the latter appear larger in comparison as the disease progresses (Figure 7.4). In the treated animals, as in other affected sheep, this was already partly evident at 7 months of age. In the later 3- D models (18 months and 22 months), the cerebellum appears to be slightly more pronounced compared with the same sheep at 7 months and some degree of volume loss can be seen in the cortical areas of the cerebrum adjacent to the cerebellum, i.e. the occipital and visual cortices (Figure 7.4). A Accumulative ICV changes (ml) CLN5-/- CLN5+/- AAV 7m Age (months) B ml change (mean ± SEM) P-value Effect size Affected between 7 and 17 months -5.8 ± 1.7 ml Treated between 7 and 18 months -1.3 ± 1.5 ml Treated between 7 and 22 months -1.4 ± 1.1 ml Figure 7.3 The effect of gene therapy on the mean accumulative ICV gain and loss A) Data are expressed as means (solid lines) ± SEM (dotted lines). The intracranial volume (ICV) was measured in CLN5 -/- sheep that received scaav9-cln5 (n = 4) at 7 months of age, untreated CLN5 -/- (n = 6) and healthy CLN5 +/- sheep (n = 6) and the mean accumulative ICV changes were calculated. B) The change of ICV was calculated for the period from 7 to 17 months for affected control animals and for the periods 7 to 18 months and 7 to 22 months for the treated sheep. One-sided Student s t-tests were performed to compare differences and effect size was calculated using Cohen s d. Effect sizes are regarded as: 0.2 = small, 0.5 = medium, 0.8 = large, 1.3 = very large. 98

 from sheep that received scaav9-cln5 gene therapy at 7 months showed plateauing of volume")
 was evident at 7 months of age and was not")

114 Cerebellum 7 months 18 months 22 months Olfactory bulbs Treated at 7 months Caudal Rostral Affected Normal 7 months 17 months 7 months 17 months Figure 7.4 Representative 3-D models of cranial volumes of treated sheep and controls Computer tomography (CT) based 3-D modelling of intracranial volumes (ICV) from sheep that received scaav9-cln5 gene therapy at 7 months showed plateauing of volume compared with the manifest loss of volume observed in untreated affected sheep. Loss of cranial volume and enlargement of lateral cerebral ventricles (blue) was evident at 7 months of age and was not reversed through the therapy. However, the pronounced loss of volume seen in the 17-month-old affected sheep was not seen in the treated animals. Normal controls have almost reached their adult ICV at 7 months. The top row of each block shows the dorsal view, middle row shows the dorsal view semi-opaque so that the lateral ventricles are visible, and the bottom row shows the lateral view. 99
Natural History of JNCL and other NCLs
 Natural History of JNCL and other NCLs Jonathan W. Mink, MD PhD Departments of Neurology, Neurobiology & Anatomy, Brain & Cognitive Sciences, and Pediatrics University of Rochester Neuronal Ceroid Lipofuscinosis
Clinical Summaries. CLN1 Disease, infantile onset and others
 Clinical Summaries CLN1 Disease, infantile onset and others The gene called CLN1 lies on chromosome 1. CLN1 disease is inherited as an autosomal recessive disorder, which means that both chromosomes carry
Neuronal Ceroid Lipofuscinosis (NCL) A practical approach
 A practical approach") Neuronal Ceroid Lipofuscinosis (NCL) A practical approach Joseph Glykys, MD, PhD Massachusetts General Hospital Harvard Medical School Disclosures None Neuronal Ceroid Lipofuscinosis Genetically inherited
Neuronal Ceroid Lipofuscinosis (NCL) A practical approach Joseph Glykys, MD, PhD Massachusetts General Hospital Harvard Medical School Disclosures None Neuronal Ceroid Lipofuscinosis Genetically inherited
SELECTIVE VULNERABILITY (HYPOXIA AND HYPOGLYCEMIA)
") DEFICIENCY OF METABOLITE -HYPOXIA AND HYPOGLYCEMIA -HYPOVITAMINOSIS SELECTIVE VULNERABILITY (HYPOXIA AND HYPOGLYCEMIA) -SPECIFIC CELL TYPE NEURONS>OLIGODENDROCYTES>ASTROCYTES -SPECIFIC BRAIN REGION PYRAMIDAL
DEFICIENCY OF METABOLITE -HYPOXIA AND HYPOGLYCEMIA -HYPOVITAMINOSIS SELECTIVE VULNERABILITY (HYPOXIA AND HYPOGLYCEMIA) -SPECIFIC CELL TYPE NEURONS>OLIGODENDROCYTES>ASTROCYTES -SPECIFIC BRAIN REGION PYRAMIDAL
Glossary of relevant medical and scientific terms
 Glossary of relevant medical and scientific terms Alzheimer's disease The most common dementing illness of the elderly in the UK. The neuropathology of Alzheimer's disease is significantly different from
REVIEW ARTICLE. NCL Disorders: Frequent Causes of Childhood Dementia
 REVIEW ARTICLE NCL Disorders: Frequent Causes of Childhood Dementia How to Cite This Article: Schulz A, Kohlschütter A. NCL Disorders: Frequent Causes of Childhood Dementia. Iran J Child Neurol. 2013 Winter;
Making headway: problem-oriented approaches to neurological disease
 Vet Times The website for the veterinary profession https://www.vettimes.co.uk Making headway: problem-oriented approaches to neurological disease Author : Mark Lowrie Categories : Vets Date : July 4,
ASSUMPTION OF COGNITIVE UNIFORMITY
 The Human Brain cerebral hemispheres: two most important divisions of the brain, separated by the longitudinal fissure corpus callosum: a large bundle of axons that constitutes the major connection between
The Visual System. Anatomical Overview Dr. Casagrande January 21, 2004
 The Visual System Anatomical Overview Dr. Casagrande January 21, 2004 Phone: 343-4538 Email: vivien.casagrande@mcmail.vanderbilt.edu Office: T2302 MCN How the Brain Works Useful Additional Reading: Adler,
Neural stem cells and the neurobiology of ageing. Chen Siyun 1, Dawe G.S. 2
 ABSTRACT Neural stem cells and the neurobiology of ageing Chen Siyun 1, Dawe G.S. 2 Department of Physics, Faculty of Science, National University of Singapore 10 Kent Ridge Road, Singapore 117546 The
Supplementary Materials
 Supplementary Materials Fig. S1. Weights of full-dose treatment groups comparing 1 st, 2 nd, and 3 rd generation gene replacement therapy. Mice were treated at p1 with 4x10 11 GC of the three different
Amicus Establishes Gene Therapy Pipeline for Lysosomal Storage Disorders (LSDs) Conference Call and Webcast September 20, 2018
 Conference Call and Webcast September 20, 2018") Amicus Establishes Gene Therapy Pipeline for Lysosomal Storage Disorders (LSDs) Conference Call and Webcast September 20, 2018 Introduction 2 Safe Harbor This presentation contains "forward-looking statements"
Amicus Establishes Gene Therapy Pipeline for Lysosomal Storage Disorders (LSDs) Conference Call and Webcast September 20, 2018 Introduction 2 Safe Harbor This presentation contains "forward-looking statements"
Gene co-expression networks in the mouse, monkey, and human brain July 16, Jeremy Miller Scientist I
 Gene co-expression networks in the mouse, monkey, and human brain July 16, 2013 Jeremy Miller Scientist I jeremym@alleninstitute.org Outline 1. Brief introduction to previous WGCNA studies in brain 2.
Plasticity of Cerebral Cortex in Development
 Plasticity of Cerebral Cortex in Development Jessica R. Newton and Mriganka Sur Department of Brain & Cognitive Sciences Picower Center for Learning & Memory Massachusetts Institute of Technology Cambridge,
ataxia, head tremors and mild inappentence, was given palliative care
 2013-5-2 Cerebellum, Spleen-Raccoon Ahmed M. Abubakar BOVINE PATHOLOGY CONTRIBUTING INSTITUTION :College of Veterinary Medicine UC Davies Signalment: Wild-caught juvenile male raccoon, ( Procyon lotor)
B108 BC Neurons and Glial Cells *
 OpenStax-CNX module: m62431 1 B108 BC Neurons and Glial Cells * Melodye Gold Based on Human Biology Chapter 17.2: Neurons and Glial Cells by OpenStax Willy Cushwa This work is produced by OpenStax-CNX
The Nervous System. Functions of the Nervous System input gathering To monitor occurring inside and outside the body Changes =
 The Nervous System Functions of the Nervous System input gathering To monitor occurring inside and outside the body Changes = To process and sensory input and decide if is needed output A response to integrated
The human brain. of cognition need to make sense gives the structure of the brain (duh). ! What is the basic physiology of this organ?
. ! What is the basic physiology of this organ?") The human brain The human brain! What is the basic physiology of this organ?! Understanding the parts of this organ provides a hypothesis space for its function perhaps different parts perform different
The human brain The human brain! What is the basic physiology of this organ?! Understanding the parts of this organ provides a hypothesis space for its function perhaps different parts perform different
Organization of the nervous system. The withdrawal reflex. The central nervous system. Structure of a neuron. Overview
 Overview The nervous system- central and peripheral The brain: The source of mind and self Neurons Neuron Communication Chemical messengers Inside the brain Parts of the brain Split Brain Patients Organization
P. Hitchcock, Ph.D. Department of Cell and Developmental Biology Kellogg Eye Center. Wednesday, 16 March 2009, 1:00p.m. 2:00p.m.
 Normal CNS, Special Senses, Head and Neck TOPIC: CEREBRAL HEMISPHERES FACULTY: LECTURE: READING: P. Hitchcock, Ph.D. Department of Cell and Developmental Biology Kellogg Eye Center Wednesday, 16 March
Organization of the nervous system. [See Fig. 48.1]
![Organization of the nervous system. [See Fig. 48.1]](/thumbs/90/103926552.jpg "Organization of the nervous system. [See Fig. 48.1]") Nervous System [Note: This is the text version of this lecture file. To make the lecture notes downloadable over a slow connection (e.g. modem) the figures have been replaced with figure numbers as found
Nervous System [Note: This is the text version of this lecture file. To make the lecture notes downloadable over a slow connection (e.g. modem) the figures have been replaced with figure numbers as found
To understand AD, it is important to
 To understand AD, it is important to know a bit about the brain. This part of Unraveling the Mystery gives an inside view of the normal brain, how it works, and what happens during aging. The brain is
Lecture 3 (Oct 5 th ): NEURONS AND NERVE IMPULSES Lecture Outline
: NEURONS AND NERVE IMPULSES Lecture Outline") Lecture 3 (Oct 5 th ): NEURONS AND NERVE IMPULSES Lecture Outline 1) CNS vs. PNS 2) Structure of Neurons parts of a neuron: soma, dendrites, axons 3) Glial Cells 4) Mitosis and Regeneration in Neurons
Lecture 3 (Oct 5 th ): NEURONS AND NERVE IMPULSES Lecture Outline 1) CNS vs. PNS 2) Structure of Neurons parts of a neuron: soma, dendrites, axons 3) Glial Cells 4) Mitosis and Regeneration in Neurons
INDEX. Genetics. French poodle progressive rod-cone degeneration,
 INDEX Acuity in Stargardt's macular dystrophy, 25-34 ADRP (Autosomal dominant retinitis pigmentosa), see Retinitis pigmentosa and Genetics afgf, 294, 296 Age-related maculopathy, see Macular degeneration
Vision II. Steven McLoon Department of Neuroscience University of Minnesota
 Vision II Steven McLoon Department of Neuroscience University of Minnesota 1 Ganglion Cells The axons of the retinal ganglion cells form the optic nerve and carry visual information into the brain. 2 Optic
THE VISUAL PATHWAY FOR DENTAL STUDENTS
 Neuroanatomy Suzanne S. Stensaas, Ph.D. February 16, 2012 Objectives: THE VISUAL PATHWAY FOR DENTAL STUDENTS A. Draw the expected visual fields seen in classic lesions of the nerve, chiasm, thalamus, optic
Cerebral Cortex 1. Sarah Heilbronner
 Cerebral Cortex 1 Sarah Heilbronner heilb028@umn.edu Want to meet? Coffee hour 10-11am Tuesday 11/27 Surdyk s Overview and organization of the cerebral cortex What is the cerebral cortex? Where is each
Body control systems. Let s start at the top: the human brain. The Cerebrum. The human brain. What parts of your brain are you using right now?
 What parts of your brain are you using right now? Body control systems Quick Sends message directly to target organ Endocrine system Frontal lobe Parietal lobe Movement and conscious thought; Frontal speech
Nervous system, integration: Overview, and peripheral nervous system:
 Nervous system, integration: Overview, and peripheral nervous system: Some review & misc. parts [Fig. 28.11B, p. 573]: - white matter --> looks white due to the myelinated sheaths, which are quite fatty.
Acetylcholine (ACh) Action potential. Agonists. Drugs that enhance the actions of neurotransmitters.
 Action potential. Agonists. Drugs that enhance the actions of neurotransmitters.") Acetylcholine (ACh) The neurotransmitter responsible for motor control at the junction between nerves and muscles; also involved in mental processes such as learning, memory, sleeping, and dreaming. (See
Acetylcholine (ACh) The neurotransmitter responsible for motor control at the junction between nerves and muscles; also involved in mental processes such as learning, memory, sleeping, and dreaming. (See
Anatomy and Physiology (Bio 220) The Brain Chapter 14 and select portions of Chapter 16
 The Brain Chapter 14 and select portions of Chapter 16") Anatomy and Physiology (Bio 220) The Brain Chapter 14 and select portions of Chapter 16 I. Introduction A. Appearance 1. physical 2. weight 3. relative weight B. Major parts of the brain 1. cerebrum 2.
Anatomy and Physiology (Bio 220) The Brain Chapter 14 and select portions of Chapter 16 I. Introduction A. Appearance 1. physical 2. weight 3. relative weight B. Major parts of the brain 1. cerebrum 2.
LOOKING AT BLINDNESS FROM NEUROLOGIST S PERSPECTIVE
 Vet Times The website for the veterinary profession https://www.vettimes.co.uk LOOKING AT BLINDNESS FROM NEUROLOGIST S PERSPECTIVE Author : LAURENT S GAROSI Categories : Vets Date : June 23, 2008 LAURENT
Ch 13: Central Nervous System Part 1: The Brain p 374
 Ch 13: Central Nervous System Part 1: The Brain p 374 Discuss the organization of the brain, including the major structures and how they relate to one another! Review the meninges of the spinal cord and
Nervous System The Brain and Spinal Cord Unit 7b
 Nervous System The Brain and Spinal Cord Unit 7b Chetek High School Mrs. Michaelsen 9.12 Meninges A. Meninges 1. The organs of the CNS are covered by membranes a. The meninges are divided into 3 layers:
MIDTERM EXAM 1 COGNITIVE SCIENCE 107A
 MIDTERM EXAM 1 COGNITIVE SCIENCE 107A FALL 2011 Name: Points: / 100 PID: I. SHORT ANSWERS (6 points each for a total of 30 points) 1. Describe two contributions made by Ramon y Cajal (1852-1934) in terms
UNIT 5 REVIEW GUIDE - NERVOUS SYSTEM 1) State the 3 functions of the nervous system. 1) 2) 3)
 State the 3 functions of the nervous system. 1) 2) 3)") UNIT 5 REVIEW GUIDE - NERVOUS SYSTEM State the 3 functions of the nervous system. Briefly describe the general function(s) of each of the following neuron types: a) SENSORY NEURONS: b) INTERNEURONS: c)
UNIT 5 REVIEW GUIDE - NERVOUS SYSTEM State the 3 functions of the nervous system. Briefly describe the general function(s) of each of the following neuron types: a) SENSORY NEURONS: b) INTERNEURONS: c)
Wetware: The Biological Basis of Intellectual Giftedness
 Wetware: The Biological Basis of Intellectual Giftedness Why is "giftedness" such a puzzle for parents? Why is there so much confusion? The most common plea heard on TAGFAM is "my child is different; please
Unit 3: The Biological Bases of Behaviour
 Unit 3: The Biological Bases of Behaviour Section 1: Communication in the Nervous System Section 2: Organization in the Nervous System Section 3: Researching the Brain Section 4: The Brain Section 5: Cerebral
THREE MUTATIONS THAT CAUSE FIFFERENT FORMS OF CANINE NEURONAL CEROID LIPOFUSCINOSIS. A Thesis presented to the Faculty of the Graduate School
 THREE MUTATIONS THAT CAUSE FIFFERENT FORMS OF CANINE NEURONAL CEROID LIPOFUSCINOSIS A Thesis presented to the Faculty of the Graduate School University of Missouri-Columbia In Partial Fulfillment Of the
CLN2 disease progresses rapidly. Diagnose earlier to treat sooner.
 Brineura (cerliponase alfa) injection for intraventricular use is indicated to slow the loss of ambulation in symptomatic pediatric patients 3 years of age and older with late infantile neuronal ceroid
CASE 49. What type of memory is available for conscious retrieval? Which part of the brain stores semantic (factual) memories?
 memories?") CASE 49 A 43-year-old woman is brought to her primary care physician by her family because of concerns about her forgetfulness. The patient has a history of Down syndrome but no other medical problems.
CASE 49 A 43-year-old woman is brought to her primary care physician by her family because of concerns about her forgetfulness. The patient has a history of Down syndrome but no other medical problems.
biological psychology, p. 40 The study of the nervous system, especially the brain. neuroscience, p. 40
 biological psychology, p. 40 The specialized branch of psychology that studies the relationship between behavior and bodily processes and system; also called biopsychology or psychobiology. neuroscience,
The Brain & Homeostasis. The Brain & Technology. CAT, PET, and MRI Scans
 The Brain & Homeostasis Today, scientists have a lot of information about what happens in the different parts of the brain; however they are still trying to understand how the brain functions. We know
A CASE OF GIANT AXONAL NEUROPATHY HEMANANTH T SECOND YEAR POST GRADUATE IN PAEDIATRICS INSTITUTE OF SOCIAL PAEDIATRICS GOVERNMENT STANLEY HOSPITAL
 A CASE OF GIANT AXONAL NEUROPATHY HEMANANTH T SECOND YEAR POST GRADUATE IN PAEDIATRICS INSTITUTE OF SOCIAL PAEDIATRICS GOVERNMENT STANLEY HOSPITAL CASE HISTORY Nine year old male child Second born Born
Course Calendar
 Clinical Neuroscience BMS 6706C Charles, Ph.D., Course Director charles.ouimet@med.fsu.edu (850) 644-2271 2004 2005 Course Calendar Click here to return to the syllabus Meeting Hours for entire semester:
Characteristic features of CNS pathology. By: Shifaa AlQa qa
 Characteristic features of CNS pathology By: Shifaa AlQa qa Normal brain: - The neocortex (gray matter): six layers: outer plexiform, outer granular, outer pyramidal, inner granular, inner pyramidal, polymorphous
Big brains may hold clues to origins of autism
 VIEWPOINT Big brains may hold clues to origins of autism BY KONSTANTINOS ZARBALIS 23 FEBRUARY 2016 A persistent challenge to improving our understanding of autism is the fact that no single neurological
Introduction to Physiological Psychology
 Introduction to Physiological Psychology Vision ksweeney@cogsci.ucsd.edu cogsci.ucsd.edu/~ksweeney/psy260.html This class n Sensation vs. Perception n How light is translated into what we see n Structure
Shift 1, 8 July 2018, 09:30-13:00
 Shift 1, 8 July 2018, 09:30-13:00 CNS patterning A001-A014 Stem cells: basic biology and postnatal neurogenesis - part I Development of neural systems: Molecular and genetic characterisationa Epigenetic
Huntington s Disease COGS 172
 Huntington s Disease COGS 172 Overview Part I: What is HD? - Clinical description and features - Genetic basis and neuropathology - Cell biology, mouse models and therapeutics Part II: HD as a model in
Biology 218 Human Anatomy
 Chapter 17 Adapted form Tortora 10 th ed. LECTURE OUTLINE A. Overview of the Nervous System (p. 537) 1. The nervous system and the endocrine system are the body s major control and integrating centers.
Olfactory ensheathing glia
 Olfactory ensheathing glia From Wikipedia, the free encyclopedia Neuroglia of the brain shown by Golgi's method. Olfactory ensheathing glia (OEG), also known as olfactory ensheathing cells (OECs) or olfactory
NEURONAL CEROID LIPOFUSCINOSIS CLN8 - FROM GENE TO PROTEIN. Liina Lonka
 NEURONAL CEROID LIPOFUSCINOSIS CLN8 - FROM GENE TO PROTEIN Liina Lonka Folkhälsan Institute of Genetics, Department of Medical Genetics and Neuroscience Center University of Helsinki and Graduate School
Nsci 2100: Human Neuroanatomy Examination 1
 Name KEY Lab Section Nsci 2100: Human Neuroanatomy Examination 1 On this page, write your name and lab section. On your scantron answer sheet, enter your name (last name, space, first name), internet ID
ErbB4 migrazione I parte. 3- ErbB4- NRG1
 ErbB4 migrazione I parte 3- ErbB4- NRG1 1 In rodent brains postnatal neuronal migration is evident in three main areas: the cerebellum (CB), the hippocampus (Hipp) and the rostral migratory stream (RMS).
Name: Period: Chapter 2 Reading Guide The Biology of Mind
 Name: Period: Chapter 2 Reading Guide The Biology of Mind The Nervous System (pp. 55-58) 1. What are nerves? 2. Complete the diagram below with definitions of each part of the nervous system. Nervous System
The Biological Level of Analysis: Studying the Brain
 The Biological Level of Analysis: Studying the Brain In the past the study of the brain was limited to people suffering from head injuries and the effects of accidental damage. It was only possible to
TABLE OF CONTINENTS. PSYC1002 Notes. Neuroscience.2. Cognitive Processes Learning and Motivation. 37. Perception Mental Abilities..
 TABLE OF CONTINENTS Neuroscience.2 Cognitive Processes...21 Learning and Motivation. 37 Perception.....54 Mental Abilities.. 83 Abnormal Psychology....103 1 Topic 1: Neuroscience Outline 1. Gross anatomy
Financial Disclosures
 October 1, 2014 Nonclinical Development of Enzyme Replacement Therapies for Severely Affected Patients of Orphan Diseases: Assessment of Animal Model and Normal Animal Toxicology Data Charles A. O Neill,
Nervous System and Brain Review. Bio 3201
 Nervous System and Brain Review Bio 3201 Dont worry about: glial cells Oligodendrocytes Satelite cells etc Nervous System - Vital to maintaining homeostasis in organisms - Comprised of : brain, spinal
Central nervous system
 Central nervous system By Dr. Mohsen Dashti Clinical Medicine & Pathology 316 7 th Lecture Lecture outline Review of structure & function. Symptoms, signs & tests. Specific diseases. Review of structure
CNS pathology Third year medical students. Dr Heyam Awad 2018 Lecture 1: an introduction
 CNS pathology Third year medical students Dr Heyam Awad 2018 Lecture 1: an introduction CNS course This is a 7 hour course and the topics covered are important for your clinical years and your work as
25/09/2012. Capgras Syndrome. Chapter 2. Capgras Syndrome - 2. The Neural Basis of Cognition
 Chapter 2 The Neural Basis of Cognition Capgras Syndrome Alzheimer s patients & others delusion that significant others are robots or impersonators - paranoia Two brain systems for facial recognition -
PSYC& 100: Biological Psychology (Lilienfeld Chap 3) 1
 1") PSYC& 100: Biological Psychology (Lilienfeld Chap 3) 1 1 What is a neuron? 2 Name and describe the functions of the three main parts of the neuron. 3 What do glial cells do? 4 Describe the three basic
PSYC& 100: Biological Psychology (Lilienfeld Chap 3) 1 1 What is a neuron? 2 Name and describe the functions of the three main parts of the neuron. 3 What do glial cells do? 4 Describe the three basic
Automated detection of abnormal changes in cortical thickness: A tool to help diagnosis in neocortical focal epilepsy
 Automated detection of abnormal changes in cortical thickness: A tool to help diagnosis in neocortical focal epilepsy 1. Introduction Epilepsy is a common neurological disorder, which affects about 1 %
Healthy Brain Development: Protective and Risk Factors
 Healthy Brain Development: Protective and Risk Factors Bryce Geeraert PhD Candidate Developmental Neuroimaging Lab January 31, 2018 About me BSc Psychology, Biomedical Engineering PhD candidate Interest
Development of the Nervous System 1 st month
 Development of the Nervous System 1 st month day 1 - fertilization of egg day 6 - uterine implantation day 18 - trilaminar (3-layered) disc (blastoderm, embryo) ectoderm (dorsal) - nervous system and skin
Principles of Anatomy and Physiology
 Principles of Anatomy and Physiology 14 th Edition CHAPTER 14 The Brain and Cranial Nerves Introduction The purpose of the chapter is to: 1. Understand how the brain is organized, protected, and supplied
Insults to the Developing Brain & Effect on Neurodevelopmental Outcomes
 Insults to the Developing Brain & Effect on Neurodevelopmental Outcomes Ira Adams-Chapman, MD Assistant Professor of Pediatrics Director, Developmental Progress Clinic Emory University School of Medicine
PHY3111 Mid-Semester Test Study. Lecture 2: The hierarchical organisation of vision
 PHY3111 Mid-Semester Test Study Lecture 2: The hierarchical organisation of vision 1. Explain what a hierarchically organised neural system is, in terms of physiological response properties of its neurones.
Genetic test for Bilateral frontoparietal polymicrogyria
 Genetic test for Bilateral frontoparietal polymicrogyria Daniela Pilz, Cardiff UKGTN Genetic testing for neurological conditions; London February 26 th 2013 Region-specific Polymicrogyria (PMG) bilateral
How do individuals with congenital blindness form a conscious representation of a world they have never seen? brain. deprived of sight?
 How do individuals with congenital blindness form a conscious representation of a world they have never seen? What happens to visual-devoted brain structure in individuals who are born deprived of sight?
LEAH KRUBITZER RESEARCH GROUP LAB PUBLICATIONS WHAT WE DO LINKS CONTACTS
 LEAH KRUBITZER RESEARCH GROUP LAB PUBLICATIONS WHAT WE DO LINKS CONTACTS WHAT WE DO Present studies and future directions Our laboratory is currently involved in two major areas of research. The first
Development of the Nervous System. Leah Militello, class of 2018
 Development of the Nervous System Leah Militello, class of 2018 Learning Objectives 1. Describe the formation and fate of the neural tube and neural crest including timing and germ layer involved. 2. Describe
Chapter 11 Introduction to the Nervous System and Nervous Tissue Chapter Outline
 Chapter 11 Introduction to the Nervous System and Nervous Tissue Chapter Outline Module 11.1 Overview of the Nervous System (Figures 11.1-11.3) A. The nervous system controls our perception and experience
Guided Reading Activities
 Name Period Chapter 28: Nervous Systems Guided Reading Activities Big idea: Nervous system structure and function Answer the following questions as you read modules 28.1 28.2: 1. Your taste receptors for
Overview of Brain Structures
 First Overview of Brain Structures Psychology 470 Introduction to Chemical Additions Steven E. Meier, Ph.D. All parts are interrelated. You need all parts to function normally. Neurons = Nerve cells Listen
Bio11: The Nervous System. Body control systems. The human brain. The human brain. The Cerebrum. What parts of your brain are you using right now?
 Bio11: The Nervous System Body control systems Nervous system Quick Sends message directly to target organ Endocrine system Sends a hormone as a messenger to the target organ Can target several organs
Neuroscience 410 Huntington Disease - Clinical. March 18, 2008
 Neuroscience 410 March 20, 2007 W. R. Wayne Martin, MD, FRCPC Division of Neurology University of Alberta inherited neurodegenerative disorder autosomal dominant 100% penetrance age of onset: 35-45 yr
Central nervous system (CNS): brain and spinal cord Collections of cell body and dendrites (grey matter) are called nuclei/nucleus Nucleus can also
: brain and spinal cord Collections of cell body and dendrites (grey matter) are called nuclei/nucleus Nucleus can also") Chapter 3 Part 1 Orientation Directions in the nervous system are described relatively to the neuraxis An imaginary line drawn through the center of the length of the central nervous system, from the bottom
Chapter 3 Part 1 Orientation Directions in the nervous system are described relatively to the neuraxis An imaginary line drawn through the center of the length of the central nervous system, from the bottom
Announcement. Danny to schedule a time if you are interested.
 Announcement If you need more experiments to participate in, contact Danny Sanchez (dsanchez@ucsd.edu) make sure to tell him that you are from LIGN171, so he will let me know about your credit (1 point).
Page 1. Neurons Transmit Signal via Action Potentials: neuron At rest, neurons maintain an electrical difference across
 Chapter 33: The Nervous System and the Senses Neurons: Specialized excitable cells that allow for communication throughout the body via electrical impulses Neuron Anatomy / Function: 1) Dendrites: Receive
Course Calendar - Neuroscience
 2006-2007 Course Calendar - Neuroscience Meeting Hours for entire semester: Monday - Friday 1:00-2:20 p.m. Room 1200, COM August 28 August 29 August 30 August 31 September 1 Course introduction, Neurocytology:
Chapter 14, Part 2! Chapter 14 Part 2 Brain/Cranial Nerves! The Cerebrum and Cranial Nerves! pp !
 Chapter 14, Part 2! The Cerebrum and Cranial pp. 482 505! SECTION 14-9! The cerebrum, the largest region of the brain, contains motor, sensory, and association areas! 2! White Matter of the Cerebrum! 1.
Chapter 3. Biological Processes
 Biological Processes Psychology, Fifth Edition, James S. Nairne What s It For? Biological Solutions Communicating internally Initiating and coordinating behavior Regulating growth and other internal functions
Genesis of cerebellar interneurons and the prevention of neural DNA damage require XRCC1.
 Genesis of cerebellar interneurons and the prevention of neural DNA damage require XRCC1. Youngsoo Lee, Sachin Katyal, Yang Li, Sherif F. El-Khamisy, Helen R. Russell, Keith W. Caldecott and Peter J. McKinnon.
Brain and behaviour (Wk 6 + 7)
") Brain and behaviour (Wk 6 + 7) What is a neuron? What is the cell body? What is the axon? The basic building block of the nervous system, the individual nerve cell that receives, processes and transmits
Brain and behaviour (Wk 6 + 7) What is a neuron? What is the cell body? What is the axon? The basic building block of the nervous system, the individual nerve cell that receives, processes and transmits
Chapter 14, Part 2! The Cerebrum and Cranial Nerves! pp !
 Chapter 14, Part 2! The Cerebrum and Cranial pp. 482 505! SECTION 14-9! The cerebrum, the largest region of the brain, contains motor, sensory, and association areas! 2! 1! ! Chapter 14 Part 2 Brain/Cranial
Lecture 42: Final Review. Martin Wessendorf, Ph.D.
 Lecture 42: Final Review Martin Wessendorf, Ph.D. Lecture 33 cortex Heilbronner 5 lobes of the cortex Lateral view (left side) Mid-saggital view (right side) Cellular organization of cortex White matter
The Nervous System: Central Nervous System
 The Nervous System: Central Nervous System I. Anatomy of the nervous system A. The CNS & the body by: 1. monitoring of the body 2. & information between parts of the body 3. acting as a to gather, store,
Notes: Organization. Anatomy of the Nervous System. Cerebral cortex. Cortical layers. PSYC 2: Biological Foundations - Fall Professor Claffey
 PSYC 2: Biological Foundations - Fall 2012 - Professor Claffey Notes: Organization Version: 10/30/12 - original version Anatomy of the Nervous System Content covered in Hans's lecture: CNS & PNS Directions/Planes
Supplementary Online Content
 Supplementary Online Content Gregg NM, Kim AE, Gurol ME, et al. Incidental cerebral microbleeds and cerebral blood flow in elderly individuals. JAMA Neurol. Published online July 13, 2015. doi:10.1001/jamaneurol.2015.1359.
The Nervous System PART B
 7 The Nervous System PART B PowerPoint Lecture Slide Presentation by Jerry L. Cook, Sam Houston University ESSENTIALS OF HUMAN ANATOMY & PHYSIOLOGY EIGHTH EDITION ELAINE N. MARIEB Central Nervous System
TOXIC AND NUTRITIONAL DISORDER MODULE
 TOXIC AND NUTRITIONAL DISORDER MODULE Objectives: For each of the following entities the student should be able to: 1. Describe the etiology/pathogenesis and/or pathophysiology, gross and microscopic morphology
meninges Outermost layer of the meninge dura mater arachnoid mater pia mater membranes located between bone and soft tissue of the nervous system
 membranes located between bone and soft tissue of the nervous system meninges Outermost layer of the meninge dura mater middle layer of the meninges, contains no blood vessels arachnoid mater Innermost
Investigating the impact of midlife obesity on Alzheimer s disease (AD) pathology in a mouse model of AD
 pathology in a mouse model of AD") Brain@McGill Prize for Neuroscience Undergraduate Research Colleen Rollins Supervisor: Dr. Mallar Chakravarty Revised: August 8, 2017 Investigating the impact of midlife obesity on Alzheimer s disease
Brain@McGill Prize for Neuroscience Undergraduate Research Colleen Rollins Supervisor: Dr. Mallar Chakravarty Revised: August 8, 2017 Investigating the impact of midlife obesity on Alzheimer s disease
1. Processes nutrients and provides energy for the neuron to function; contains the cell's nucleus; also called the soma.
 1. Base of brainstem; controls heartbeat and breathing 2. tissue destruction; a brain lesion is a naturally or experimentally caused destruction of brain tissue 3. A thick band of axons that connects the
Chapter 6 Section 1. The Nervous System: The Basic Structure
 Chapter 6 Section 1 The Nervous System: The Basic Structure Essential Question: How does studying the biology of the brain give us an understanding of our behavior? Draw or type 2 things you already know
Dementia and Healthy Ageing : is the pathology any different?
 Dementia and Healthy Ageing : is the pathology any different? Professor David Mann, Professor of Neuropathology, University of Manchester, Hope Hospital, Salford DEMENTIA Loss of connectivity within association
Broad Integration of Expression Maps and Co-Expression Networks Compassing Novel Gene Functions in the Brain
 Supplementary Information Broad Integration of Expression Maps and Co-Expression Networks Compassing Novel Gene Functions in the Brain Yuko Okamura-Oho a, b, *, Kazuro Shimokawa c, Masaomi Nishimura b,