cvrphone: a Novel Point-of-Care Smartphone Based System for Monitoring the Cardiac and Respiratory Systems
|
|
|
- Maximillian Dickerson
- 5 years ago
- Views:
Transcription
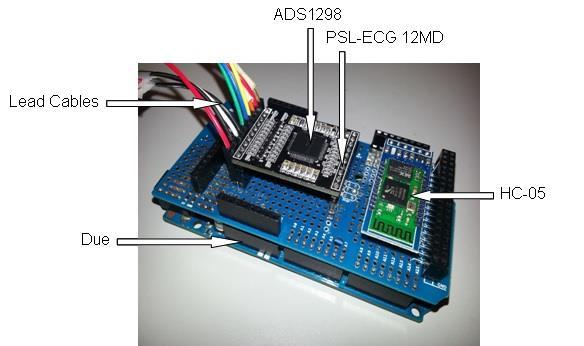
1 cvrphone: a Novel Point-of-Care Smartphone Based System for Monitoring the Cardiac and Respiratory Systems Kwanghyun Sohn, PhD, Faisal M. Merchant, MD, Omid Sayadi, PhD, Dheeraj Puppala, MD, Rajiv Doddamani, MD, Ashish Sahani, PhD Jagmeet P Singh, MD PhD, E Kevin Heist, MD, PhD, Eric M Isselbacher, MD, Antonis A. Armoundas, PhD The cvrphone Hardwre and Software Implementation The cvrphone is composed of three commercially available parts: an ECG module PSL-ECG 12MD (Physiolab) equipped with an ADconverter ADS1298 (Texas Instruments), a microcontroller board Due (Arduino) equipped with a microcontroller AT91SAM3X8E (Atmel), and a Bluetooth module HC-05 (Guangzhou HC Information Technology), as shown in Figure S1. Figure S1 (A) shows pin connections between the three parts, and Figure S1 (B) shows the actual ECG acquisition device, assembly of the three parts. The microcontroller communicates with the AD converter by the serial peripheral interface (SPI), and with the Bluetooth module by the universal asynchronous receiver/transmitter (UART). Two parallel connected 9V PP3 batteries were used to power the Due board. The microcontroller initializes the AD converter and the Bluetooth converter for communication, and transmits digitized ECG data to the Smart-phone (Figure S1 (C)). There are three threads in the Android application for the smartphone: User interface (UI) thread, Bluetooth thread and real-time calculation (RTC) thread (Figure S2). The UI thread consists of three panes. The first panel displays ECG signals of three selected leads, and the second pane displays real-time estimation values of respiration rate (RR), tidal volume (TV) and ischemic index. The third pane is used to record study notes. The Bluetooth thread receives ECG signals from the ECG acquisition device,and sends the signals to UI thread for display on the first pane and to RTC thread for realtime calculations. RTC thread also sends calculation results to UI thread for display on the second pane. 1
2 Comparison of ECG Signals between the Smartphone and Prucka Cardiolab We have used the Prucka Cardiolab electrophysiology system (General Electric) to record body surface ECG signals in our prior studies 1-3. In this study, we compared the 12 lead ECG signals acquired simultaneously at the same leads from Prucka Cardiolab and the smartphone. Figure S3 shows the same ECG morphologies in all leads between the two systems. In Figure S4, the noise levels of the smartphone system are statistically significantly lower than the Prucka Cardiolab (Wilcoxon rank sum test, p < ), probably due to the DC power supply of the smartphone system. Comparison of the Respiratory Rate, Tidal Volume and Ischemic Index Estimated by the Android Application and MATLAB The three estimated parameters in this study RR, TV and ischemic index are primarily based on the algorithms which have been developed in MATLAB in our previous studies 1-3. We sought to evaluate whether each of these applications was accurately transferred to JAVA for the Android, by comparing the results of the two platforms for each application in the same ECG data (Figure S5-S7). In Figure S5, we compare the results of the RR analysis using the data previously reported by Weiss et al 3. It appears that the results are identical at all respiration rates. The RR difference is negligible with the overall mean ± std difference between the two platforms being ± breaths/min, respectively (p= by Wilcoxon rank sum test of the difference). Similarly, in Figure S6, the TV results estimated using the MATLAB and JAVA platforms and ECG data presented by Sayadi et al 2, appear identical at 0.1 ml resolution (p=1.0; Wilcoxon rank sum test). Finally, in Figure S7 we present dynamic changes of ischemic index at baseline (t = 0 min) and following myocardial infarction using ECG data presented by Sayadi et al 1, and the MATLAB and JAVA platforms. The mean ± standard deviation of the difference of MATLAB and JAVA values are x ± x 10-9 (p= (Wilcoxon rank sum test). Algorithm for RR Estimation Following validation of the MATLAB and JAVA respiration rate estimation platforms, we sought to evaluate the effect of the percentage of premature ventricular contractions (PVCs) in estimating the respiration rate (RR). 2
3 In a prior study 3, the RMS amplitude for all abnormal beats was obtained from neighboring RMS values using cubic-spline interpolation. By replacing aberrant beats with interpolated points, rather than the RMS values of the average good beats, we minimized discontinuities in the RMS ratio sequence prior to spectral analysis. In the present study, we used ECG data during which the RR was quasi static, 3 to examine the effect of PVCs (in a 32-beat sequence used to estimate the RR) in estimating the RR, using two different approaches: (i) interpolation of the RMS signal, or (ii) interpolation of the RR. Figure S8 presents the RR estimation error as a function of PVC percentage within a 32-beat sequence: panel (A) presents the number of 32-beat sequences used to estimate the error (in log scale), panel (B) presents the RR estimation error as a function of PVC percentage within each 32-beat sequence, using interpolation of the RMS signal, and panel (C) presents the RR estimation error as a function of PVC percentage within each 32-beat sequence, using interpolation of the RR. One observes that, in the presence of PVCs, interpolation of the RR exhibits a smaller rate increase of the error. Therefore, under quasi-static conditions during which the RR remains relatively constant, we have modified the algorithm so that if there are more than 10% abnormal beats in the 32-beat window then the corresponding RR is interpolated using the cubic spline method. Algorithm for TV Estimation Following validation of the MATLAB and JAVA TV estimating platforms, we sought to examine whether we could further improve the accuracy of the TV estimation 2. Given that the TV estimation from ECG signals relies on respiration-induced modulation of the QRS complex amplitude, we first estimated the respiratory envelope by calculating the beat-to-beat root-mean-square of the QRS complex of each lead, as previously described 2, and estimated the percent modulation (PM) that normalized peak-to-peak amplitude of respiratory envelope, as a surrogate for TV, where PM is defined as 100 (%) (max envelope min envelope)/(max envelope + min envelope)/2 of each cycle of the respiratory envelope. In our prior study, we used the maximum PM value among all leads to estimate the TV at each cycle of respiratory envelope and developed a model that provides the TV from PM, as follows: TV = a PM + b, where coefficients a and b were derived from a least square regression analysis based on our swine studies 2. 3
4 In the present study, we applied the least square regression analysis using six different methods (including the previously used maximum PM method), aiming to improve the accuracy of TV estimation from body surface ECG signals. The six different methods can be classified with respect to the optimization parameter: (i) the percent modulation, PM or (ii) the peak difference (max envelope min envelope), PD The first method selects the lead with the median PM, and uses the PM for TV estimation. The second method selects the lead with the maximum PM, and uses the PM for TV estimation (as previously described 2 ). The third and fourth methods are identical to the first and second ones respectively, but this time the PD is used instead of the PM. The fifth method selects the lead with maximum PD, but uses the PM for TV estimation. And, the sixth method selects the lead with maximum PM, but uses the PD for TV estimation. We employed previously reported 2 ECG data (n=10) to obtain the slope and the intercept for each of the six different methods respectively, and estimated the TV (TV = a PM(PD) + b), using the least square analysis 2. We then compared the error between the estimated and the true TV for each of the six methods. Figure S9 shows the normalized (by the true TV) mean squared error (MSE) and the coefficient of variation (CV), defined as / where, and are the standard deviation and the mean respectively of the estimated TV across animals. Although for the TV estimation, ECG signals were acquired at 0, 250, 500 and 750 ml TVs, 0 ml was excluded in Figure S9, because MSE cannot be normalized by 0 ml and CV cannot be defined at 0 ml. On average, over the three TVs, the first method (median PM) exhibits the smallest NMSE and CV values (Figure S9, panels (B) and (D)), and this is the method that we used for the TV estimation in this study. Changes of the Ischemic Index After Coronary Artery Occlusion Figure S10 shows additional ischemic index estimation results, similar to those presented in Figure 4 of the manuscript: (i) Beat-by-beat ischemic index estimation before and after coronary artery occlusion (t>0 min), of leads II (A) and avf (C), as well as one-minute, running median ischemic index estimation, of leads II (B) and avf (D). 4
5 References 1. Sayadi O, Puppala D, Ishaque N, Doddamani R, Merchant FM, Barrett C, Singh JP, Heist EK, Mela T, Martinez JP, Laguna P, Armoundas AA. A novel method to capture the onset of dynamic electrocardiographic ischemic changes and its implications to arrhythmia susceptibility. J Am Heart Assoc. 2014;3 2. Sayadi O, Weiss EH, Merchant FM, Puppala D, Armoundas AA. An optimized method for estimating the tidal volume from intracardiac or body surface electrocardiographic signals: Implications for estimating minute ventilation. Am J Physiol Heart Circ Physiol. 2014;307:H Weiss EH, Sayadi O, Ramaswamy P, Merchant FM, Sajja N, Foley L, Laferriere S, Armoundas AA. An optimized method for the estimation of the respiratory rate from electrocardiographic signals: Implications for estimating minute ventilation. Am J Physiol Heart Circ Physiol. 2014;307:H

6 (A) (B) 6
, a microcontroller board Due (Arduino) and a Bluetooth module HC-05 (Guangzhou HC Information")
7 (C) Figure S1. The cvrphone. The cvrphone is composed of three commercially available parts: an ECG module PSL-ECG 12MD (Physiolab), a microcontroller board Due (Arduino) and a Bluetooth module HC-05 (Guangzhou HC Information Technology). The ECG module includes an AD converter ADS1298 (Texas Instruments), and the microcontroller board which includes a microcontroller AT91SAM3X8E (Atmel). (A) Pin connections between the three parts. (B) Picture of the hardware. (C) Block-diagram of the microcontroller embedded software. The microcontroller sends ECG data to the smartphone according to user s request. 7
8 Figure S2. Block-diagram of the threads in the Android application. There are three threads in the Android application: user interface (UI) thread, Bluetooth thread and realtime calculation (RTC) thread. UI thread provides users with operation options, and displays ECG signals and real-time calculation results. Bluetooth thread receives ECG signal from the ECG acquisition device and sends it to UI thread for display and to RTC thread for real-time calculations. RTC thread estimates ischemic index, respiration rate and tidal volume in real-time, and sends the estimated values to UI thread for display. 8
9 Figure S3. ECG signals acquired by the smart-phone based system (solid line) and the Prucka Cardiolab electrophysiology system (dashed line) that has been used in our animal studies before. ECG signals were acquired by both systems simultaneously from the same electrodes. The ECG module for the smart-phone system is PSL-ECG 12MD (Physiolab) equipped with an AD converter ADS1298 (Texas Instruments). 9
10 Figure S4. Noise level comparison of ECG signals acquired by the smart-phone system (light gray bars) and the Prucka system (dark gray bars). The noise level of each beat was calculated as the standard deviation in a 20 ms period between the end of the T- wave and the beginning of following P-wave or in the middle of the PR interval. Each bar graph was calculated from 2,500 beats recorded from 5 swine, 500 beats per swine. The five nodes at each bar correspond to the values of 10%, 25%, 50%, 75% and 90%. For all 12 leads, the smart-phone system exhibited significantly lower noise levels compared with the Prucka system (p<0.0001; Wilcoxon rank sum test). 10
11 Figure S5. Comparison of the respiration rate calculated by the Android application (light gray bars) and the MATLAB code (dark gray bars). The same ECG data were used for both calculations 3. The five nodes at each bar correspond to the values of 10%, 25%, 50%, 75% and 90%. The mean and standard deviation of the difference between Android and MATLAB values are x 10-5 ± x 10-4 breaths/min); (p=0.8469; Wilcoxon rank sum test). 11
12 Figure S6. Comparison of the tidal volume calculated by the Android application (light gray bars) and the MATLAB code (dark gray bars). The same ECG data were used for both calculations 2. There are 10 estimation values at each bar plot. The five nodes at each bar correspond to the values of 10%, 25%, 50%, 75% and 90%. The values from Android and MATLAB are identical at 0.1 ml resolution (p=1.0; Wilcoxon rank sum test). 12
13 Figure S7. Comparison of two ischemic indices calculated by the Android application (left side light gray bars) and the corresponding MATLAB code (right side dark gray bars). The ECG signal was obtained from 14 swine, and the same ECG data was used for both calculations 1. The graph shows dynamic changes of the ischemic index at baseline (t = 0 min) and following myocardial infarction. For each time bin, the distribution of ischemic index is averaged for all study subjects. The time bin width is 1 minute for baseline, 30 seconds for the first 5 minutes following balloon occlusion, and 1 minute for 6 to 18 minutes after occlusion. The five nodes at each bar correspond to the values of 10%, 25%, 50%, 75% and 90%. The mean ± standard deviation of the difference of Android and MATLAB values are x ± x 10-9 (p= (Wilcoxon rank sum test). 13
14 (A) (B) (C) Figure S8. The respiration rate estimation error as a function of PVC percentage within a 32-beat sequence. (A) The number of 32-beat sequences used to estimate the error is shown on the top (in log scale). (B) the respiration rate estimation error as a function of PVC percentage within each 32-beat sequence, using interpolation of the RMS signal. (C) the respiration rate estimation error as a function of PVC percentage within each 32- beat sequence, using interpolation of the respiration rate. One observes that, in the presence of PVCs, interpolation of the RR exhibits a smaller error increase rate. 14
 and CV (C) values of the six methods are displayed at three different TV values, while average NMSE (B) and CV (D) values at the three different TVs are average at each method on the left")
15 (A) (B) (C) (D) Figure S9. Normalized (by the true TV value) mean squared error (NMSE) in panels (A- B) and coefficient of variation (CV) in panels (C-D) of six different TV estimation methods. NMSE (A) and CV (C) values of the six methods are displayed at three different TV values, while average NMSE (B) and CV (D) values at the three different TVs are average at each method on the left panels. There are two parameters used for TV estimation: percent modulation (PM) and peak difference (PD). The six different TV estimation methods can be classified by the lead and the parameter that is selected for TV estimation, as: (i) the lead with median PM is selected and the PM is used for TV estimation; (ii) the lead with maximum PM is selected and the PM is used for TV estimation; (iii) the lead with median PD is selected and the PD is used for TV estimation. Max PD; (iv) the lead with maximum PD is selected and the PD is used for TV estimation; (v) the lead with maximum PD is selected and PM of the lead is used for TV estimation; (vi) the lead with maximum PM is selected and PD of the lead is used for TV estimation. 15


16 (A) (B) 16


17 (C) (D) Figure S10. Changes of ischemic index after coronary artery occlusion, as described in Figure 4 of the manuscript. Beat-by-beat ischemic index estimation before and after coronary artery occlusion (t>0 min), of lead II (A) and avf (C). One-minute, running median ischemic index estimation, of lead II (B) and avf (D). 17
A Novel Point-of-Care Smartphone Based System for Monitoring the Cardiac and Respiratory Systems.
 A Novel Point-of-Care Smartphone Based System for Monitoring the Cardiac and Respiratory Systems. Kwanghyun Sohn, Massachusetts General Hospital Faisal Merchant, Emory University Omid Sayadi, Massachusetts
Testing the Accuracy of ECG Captured by Cronovo through Comparison of ECG Recording to a Standard 12-Lead ECG Recording Device
 Testing the Accuracy of ECG Captured by through Comparison of ECG Recording to a Standard 12-Lead ECG Recording Device Data Analysis a) R-wave Comparison: The mean and standard deviation of R-wave amplitudes
A Novel Method to Capture the Onset of Dynamic Electrocardiographic Ischemic Changes and its Implications to Arrhythmia Susceptibility
 A Novel Method to Capture the Onset of Dynamic Electrocardiographic Ischemic Changes and its Implications to Arrhythmia Susceptibility The Harvard community has made this article openly available. Please
Detecting Acute Myocardial Ischemia by Evaluation of QRS Angles
 International Journal of Bioelectromagnetism Vol. 15, No. 1, pp. 77-82, 2013 www.ijbem.org Detecting Acute Myocardial Ischemia by Evaluation of QRS Angles Daniel Romero a,b, Pablo Laguna a,b, Esther Pueyo
Real-time Heart Monitoring and ECG Signal Processing
 Real-time Heart Monitoring and ECG Signal Processing Fatima Bamarouf, Claire Crandell, and Shannon Tsuyuki Advisors: Drs. Yufeng Lu and Jose Sanchez Department of Electrical and Computer Engineering Bradley
Speed - Accuracy - Exploration. Pathfinder SL
 Speed - Accuracy - Exploration Pathfinder SL 98000 Speed. Accuracy. Exploration. Pathfinder SL represents the evolution of over 40 years of technology, design, algorithm development and experience in the
ECG Acquisition System and its Analysis using MATLAB
 ECG Acquisition System and its Analysis using MATLAB Pooja Prasad 1, Sandeep Patil 2, Balu Vashista 3, Shubha B. 4 P.G. Student, Dept. of ECE, NMAM Institute of Technology, Nitte, Udupi, Karnataka, India
Interpreting Electrocardiograms (ECG) Physiology Name: Per:
 Physiology Name: Per:") Interpreting Electrocardiograms (ECG) Physiology Name: Per: Introduction The heart has its own system in place to create nerve impulses and does not actually require the brain to make it beat. This electrical
Interpreting Electrocardiograms (ECG) Physiology Name: Per: Introduction The heart has its own system in place to create nerve impulses and does not actually require the brain to make it beat. This electrical
Real-time Electrocardiogram Monitoring
 Real-time Electrocardiogram Monitoring Project Proposal Department of Electrical and Computer Engineering Calvin Walden, Edward Sandor, and Nicholas Clark Advisors: Dr. Yufeng Lu and Dr. In Soo Ahn December
Assessment of Reliability of Hamilton-Tompkins Algorithm to ECG Parameter Detection
 Proceedings of the 2012 International Conference on Industrial Engineering and Operations Management Istanbul, Turkey, July 3 6, 2012 Assessment of Reliability of Hamilton-Tompkins Algorithm to ECG Parameter
Portable Healthcare System with Low-power Wireless ECG and Heart Sounds Measurement
 Portable Healthcare System with Low-power Wireless ECG and Heart Sounds Measurement Yi-Hsuan Liu, Yi-Ting Lee, and Yu-Jung Ko Department of Electrical Engineering, National Tsing Hua University, Hsinchu,
AUTOMATIC ANALYSIS AND VISUALIZATION OF MULTILEAD LONG-TERM ECG RECORDINGS
 AUTOMATIC ANALYSIS AND VISUALIZATION OF MULTILEAD LONG-TERM ECG RECORDINGS Vessela Tzvetanova Krasteva 1, Ivo Tsvetanov Iliev 2 1 Centre of Biomedical Engineering Prof. Ivan Daskalov - Bulgarian Academy
Real-time ECG monitoring system for the assessment of rural cardiac patients
 Modelling, Measurement and Control C Vol. 79, No. 4, December, 2018, pp. 229-234 Journal homepage: http://iieta.org/journals/mmc/mmc_c Real-time ECG monitoring system for the assessment of rural cardiac
ECG Signal Characterization and Correlation To Heart Abnormalities
 ECG Signal Characterization and Correlation To Heart Abnormalities Keerthi G Reddy 1, Dr. P A Vijaya 2, Suhasini S 3 1PG Student, 2 Professor and Head, Department of Electronics and Communication, BNMIT,
An electrocardiogram (ECG) is a recording of the electricity of the heart. Analysis of ECG
 is a recording of the electricity of the heart. Analysis of ECG") Introduction An electrocardiogram (ECG) is a recording of the electricity of the heart. Analysis of ECG data can give important information about the health of the heart and can help physicians to diagnose
Introduction An electrocardiogram (ECG) is a recording of the electricity of the heart. Analysis of ECG data can give important information about the health of the heart and can help physicians to diagnose
ISSN: ISO 9001:2008 Certified International Journal of Engineering and Innovative Technology (IJEIT) Volume 2, Issue 10, April 2013
 Volume 2, Issue 10, April 2013") ECG Processing &Arrhythmia Detection: An Attempt M.R. Mhetre 1, Advait Vaishampayan 2, Madhav Raskar 3 Instrumentation Engineering Department 1, 2, 3, Vishwakarma Institute of Technology, Pune, India Abstract
ECG Processing &Arrhythmia Detection: An Attempt M.R. Mhetre 1, Advait Vaishampayan 2, Madhav Raskar 3 Instrumentation Engineering Department 1, 2, 3, Vishwakarma Institute of Technology, Pune, India Abstract
Estimation of Systolic and Diastolic Pressure using the Pulse Transit Time
 Estimation of Systolic and Diastolic Pressure using the Pulse Transit Time Soo-young Ye, Gi-Ryon Kim, Dong-Keun Jung, Seong-wan Baik, and Gye-rok Jeon Abstract In this paper, algorithm estimating the blood
ECG-PS ECG SIGNAL MEASUREMENT MODULE. Operation Manual. March 2005
 ECG-PS ECG SIGNAL MEASUREMENT MODULE Operation Manual March 2005 2555 Collins Avenue, Suite C-5 - Miami Beach FL - 33140 - U.S.A. Phone #: (305) 534-5905 Fax: (305) 534-8222 e-mail: info@galix-gbi.com
II. PROCEDURE DESCRIPTION A. Normal Waveform from an Electrocardiogram Figure 1 shows two cycles of a normal ECG waveform.
 Cardiac Monitor with Mobile Application and Alert System Miguel A. Goenaga-Jimenez, Ph.D. 1, Abigail C. Teron, BS. 1, Pedro A. Rivera 1 1 Universidad del Turabo, Puerto Rico, mgoenaga1@suagm.edu, abigailteron@gmail.com,
Design of the HRV Analysis System Based on AD8232
 207 3rd International Symposium on Mechatronics and Industrial Informatics (ISMII 207) ISB: 978--60595-50-8 Design of the HRV Analysis System Based on AD8232 Xiaoqiang Ji,a, Chunyu ing,b, Chunhua Zhao
DIFFERENCE-BASED PARAMETER SET FOR LOCAL HEARTBEAT CLASSIFICATION: RANKING OF THE PARAMETERS
 DIFFERENCE-BASED PARAMETER SET FOR LOCAL HEARTBEAT CLASSIFICATION: RANKING OF THE PARAMETERS Irena Ilieva Jekova, Ivaylo Ivanov Christov, Lyudmila Pavlova Todorova Centre of Biomedical Engineering Prof.
Various Methods To Detect Respiration Rate From ECG Using LabVIEW
 Various Methods To Detect Respiration Rate From ECG Using LabVIEW 1 Poorti M. Vyas, 2 Dr. M. S. Panse 1 Student, M.Tech. Electronics 2.Professor Department of Electrical Engineering, Veermata Jijabai Technological
Comparison of ANN and Fuzzy logic based Bradycardia and Tachycardia Arrhythmia detection using ECG signal
 Comparison of ANN and Fuzzy logic based Bradycardia and Tachycardia Arrhythmia detection using ECG signal 1 Simranjeet Kaur, 2 Navneet Kaur Panag 1 Student, 2 Assistant Professor 1 Electrical Engineering
Portable ECG Electrodes for Detection of Heart Rate and Arrhythmia Classification
 Portable ECG Electrodes for Detection of Heart Rate and Arrhythmia Classification 1 K. Jeeva, 2 Dr. D. Selvaraj, 3 Dr. S. Leones Sherwin Vimal Raj 1 PG Student, 2, 3 Professor, Department of Electronics
ATRIAL FIBRILLATION FROM AN ENGINEERING PERSPECTIVE
 Leif Sörnmo (editor) ATRIAL FIBRILLATION FROM AN ENGINEERING PERSPECTIVE February 26, 2018 Springer Contents 1 A Clinical Perspective on Atrial Fibrillation....................... 4 Pyotr G. Platonov and
DETECTION OF HEART ABNORMALITIES USING LABVIEW
 IASET: International Journal of Electronics and Communication Engineering (IJECE) ISSN (P): 2278-9901; ISSN (E): 2278-991X Vol. 5, Issue 4, Jun Jul 2016; 15-22 IASET DETECTION OF HEART ABNORMALITIES USING
HRV ventricular response during atrial fibrillation. Valentina Corino
 HRV ventricular response during atrial fibrillation Outline AF clinical background Methods: 1. Time domain parameters 2. Spectral analysis Applications: 1. Evaluation of Exercise and Flecainide Effects
A Health Shirt with ECG Real-time Display on Android Platform
 A Health Shirt with ECG Real-time Display on Android Platform Zixiao Shen 1,2, Qingyun He 1, and Ye Li 1 1 Shenzhen Institutes of Advanced Technology, Chinese Academy of Science, Shenzhen 518055, China
Sign Language Interpretation Using Pseudo Glove
 Sign Language Interpretation Using Pseudo Glove Mukul Singh Kushwah, Manish Sharma, Kunal Jain and Anish Chopra Abstract The research work presented in this paper explores the ways in which, people who
Signal Processing of Stress Test ECG Using MATLAB
 Signal Processing of Stress Test ECG Using MATLAB Omer Mukhtar Wani M. Tech ECE Geeta Engineering College, Panipat Abstract -Electrocardiography is used to record the electrical activity of the heart over
MARS Ambulatory ECG Analysis The power to assess and predict
 GE Healthcare MARS Ambulatory ECG Analysis The power to assess and predict Connecting hearts and minds Prevention starts with knowledge Around the world, heart disease is one of our fastest-growing health
The Cross-platform Application for Arrhythmia Detection
 The Cross-platform Application for Arrhythmia Detection Alexander Borodin, Artem Pogorelov, Yuliya Zavyalova Petrozavodsk State University (PetrSU) Petrozavodsk, Russia {aborod, pogorelo, yzavyalo}@cs.petrsu.ru
Χρήση έξυπνων τεχνολογιών στην ανίχνευση κολπικής μαρμαρυγής Use of smart technology in atrial fibrillation detection
 Χρήση έξυπνων τεχνολογιών στην ανίχνευση κολπικής μαρμαρυγής Use of smart technology in atrial fibrillation detection Χάρης Κοσσυβάκης Επιμελητής A Καρδιολογικό Τμήμα Γ.Ν.Α. «Γ. ΓΕΝΝΗΜΑΤΑΣ» Risk of Stroke
Temporal Analysis and Remote Monitoring of ECG Signal
 Temporal Analysis and Remote Monitoring of ECG Signal Amruta Mhatre Assistant Professor, EXTC Dept. Fr.C.R.I.T. Vashi Amruta.pabarekar@gmail.com Sadhana Pai Associate Professor, EXTC Dept. Fr.C.R.I.T.
The Electrocardiogram part II. Dr. Adelina Vlad, MD PhD
 The Electrocardiogram part II Dr. Adelina Vlad, MD PhD Basic Interpretation of the ECG 1) Evaluate calibration 2) Calculate rate 3) Determine rhythm 4) Determine QRS axis 5) Measure intervals 6) Analyze
POWER EFFICIENT PROCESSOR FOR PREDICTING VENTRICULAR ARRHYTHMIA BASED ON ECG
 POWER EFFICIENT PROCESSOR FOR PREDICTING VENTRICULAR ARRHYTHMIA BASED ON ECG Anusha P 1, Madhuvanthi K 2, Aravind A.R 3 1 Department of Electronics and Communication Engineering, Prince Shri Venkateshwara
CCi-MOBILE Research Platform for Cochlear Implants and Hearing Aids HANDS-ON WORKSHOP
 UT DALLAS Erik Jonsson School of Engineering & Computer Science CCi-MOBILE Research Platform for Cochlear Implants and Hearing Aids HANDS-ON WORKSHOP July 18, 2017 CIAP-2017 John H.L. Hansen, Hussnain
IJRIM Volume 1, Issue 2 (June, 2011) (ISSN ) ECG FEATURE EXTRACTION FOR CLASSIFICATION OF ARRHYTHMIA. Abstract
 (ISSN ) ECG FEATURE EXTRACTION FOR CLASSIFICATION OF ARRHYTHMIA. Abstract") ECG FEATURE EXTRACTION FOR CLASSIFICATION OF ARRHYTHMIA Er. Ankita Mittal* Er. Saurabh Mittal ** Er. Tajinder Kaur*** Abstract Artificial Neural Networks (ANN) can be viewed as a collection of identical
ECG FEATURE EXTRACTION FOR CLASSIFICATION OF ARRHYTHMIA Er. Ankita Mittal* Er. Saurabh Mittal ** Er. Tajinder Kaur*** Abstract Artificial Neural Networks (ANN) can be viewed as a collection of identical
Automated Heart Analysis.
 Automated Heart Analysis Yes, 5 minutes or less! Kardi is a revolutionizing non-invasive diagnostic tool used for testing ischaemic heart disease It s technology generates high quality 3D visuals projected
Accepted Manuscript. Identification of Exercise-Induced Ischemia using QRS Slopes. Reza Firoozabadi, Richard E. Gregg, Saeed Babaeizadeh
 Accepted Manuscript Identification of Exercise-Induced Ischemia using QRS Slopes Reza Firoozabadi, Richard E. Gregg, Saeed Babaeizadeh PII: S0022-0736(15)00298-8 DOI: doi: 10.1016/j.jelectrocard.2015.09.001
CARDIOVIT CS-200 Excellence. Designed for high-volume workload, equipped with the latest technology to save time and boost productivity
 CARDIOVIT CS-200 Excellence Designed for high-volume workload, equipped with the latest technology to save time and boost productivity CARDIOVIT CS-200 EXCELLENCE Experience the CARDIOVIT CS-200 Excellence
Delineation of QRS-complex, P and T-wave in 12-lead ECG
 IJCSNS International Journal of Computer Science and Network Security, VOL.8 No.4, April 2008 185 Delineation of QRS-complex, P and T-wave in 12-lead ECG V.S. Chouhan, S.S. Mehta and N.S. Lingayat Department
Embedded Based Hand Talk Assisting System for Dumb Peoples on Android Platform
 Embedded Based Hand Talk Assisting System for Dumb Peoples on Android Platform R. Balakrishnan 1, Santosh BK 2, Rahul H 2, Shivkumar 2, Sunil Anthony 2 Assistant Professor, Department of Electronics and
EKG Monitoring and Arrhythmia Detection
 EKG Monitoring and Arrhythmia Detection Amaris Chen Department of Computer Science & Engineering University of Washington Box 352350 Seattle, WA 98195-2350 amarisch@cs.washington.edu ABSTRACT Cardiovascular
Vital Responder: Real-time Health Monitoring of First- Responders
 Vital Responder: Real-time Health Monitoring of First- Responders Ye Can 1,2 Advisors: Miguel Tavares Coimbra 2, Vijayakumar Bhagavatula 1 1 Department of Electrical & Computer Engineering, Carnegie Mellon
Design and Analysis of QT/QTc Studies Conceptional and Methodical Considerations Based on Experience
 Design and Analysis of QT/QTc Studies Conceptional and Methodical Considerations Based on Experience Dr. Manfred Wargenau, Institute, Düsseldorf OVERVIEW Clinical background The ICH E14 guideline / review
PCA Enhanced Kalman Filter for ECG Denoising
 IOSR Journal of Electronics & Communication Engineering (IOSR-JECE) ISSN(e) : 2278-1684 ISSN(p) : 2320-334X, PP 06-13 www.iosrjournals.org PCA Enhanced Kalman Filter for ECG Denoising Febina Ikbal 1, Prof.M.Mathurakani
USING CORRELATION COEFFICIENT IN ECG WAVEFORM FOR ARRHYTHMIA DETECTION
 BIOMEDICAL ENGINEERING- APPLICATIONS, BASIS & COMMUNICATIONS USING CORRELATION COEFFICIENT IN ECG WAVEFORM FOR ARRHYTHMIA DETECTION 147 CHUANG-CHIEN CHIU 1,2, TONG-HONG LIN 1 AND BEN-YI LIAU 2 1 Institute
LABVIEW based expert system for Detection of heart abnormalities
 LABVIEW based expert system for Detection of heart abnormalities Saket Jain Piyush Kumar Monica Subashini.M School of Electrical Engineering VIT University, Vellore - 632014, Tamil Nadu, India Email address:
Diagnostic capabilities of the implantable therapeutic systems
 Cardiac pacing 2012 and beyound Monday August 27, 2012 Diagnostic capabilities of the implantable therapeutic systems Pekka Raatikainen Heart Center Co. Tampere University Hospital and University of Tampere
Electrocardiography. Hilal Al Saffar College of Medicine,Baghdad University
 Electrocardiography Hilal Al Saffar College of Medicine,Baghdad University Which of the following is True 1. PR interval, represent the time taken for the impulse to travel from SA node to AV nose. 2.
BLOOD GLUCOSE LEVEL MONITORING BY NONINVASIVE METHOD USING NEAR INFRA RED SENSOR
 BLOOD GLUCOSE LEVEL MONITORING BY NONINVASIVE METHOD USING NEAR INFRA RED SENSOR P.Daarani 1 & A.Kavithamani 2 International Journal of Latest Trends in Engineering and Technology pp. 141-147 DOI: http://dx.doi.org/10.21172/1.ires.19
V. Marozas 1, S. Daukantas 1, A. Petrėnas 1, A. Sološenko 1, D. Stankevičius 1, B. Paliakaitė 1, D. Jegelevičius 1, A. Lukoševičius 1, E.
 V. Marozas 1, S. Daukantas 1, A. Petrėnas 1, A. Sološenko 1, D. Stankevičius 1, B. Paliakaitė 1, D. Jegelevičius 1, A. Lukoševičius 1, E. Kaldoudi 2 1 Biomedical Engineering Institute, Kaunas University
ECG Generation using AFG with Arrhythmia. Detection and Analysis
 ECG Generation using AFG with Arrhythmia Detection and Analysis Dattatray Sawant & Y. S. Rao Sardar Patel Institute of Technology,Mumbai-400058, India E-mail : dssawant1@gmail.com, ysrao@spit.ac.in Abstract
Detection of Atrial Fibrillation by Correlation Method
 e-issn 2455 1392 Volume 2 Issue 6, June 2016 pp. 573 586 Scientific Journal Impact Factor : 3.468 http://www.ijcter.com Detection of Atrial Fibrillation by Correlation Method Dr. Shahanaz Ayub1, Gaurav
RASPBERRY PI BASED ECG DATA ACQUISITION SYSTEM
 RASPBERRY PI BASED ECG DATA ACQUISITION SYSTEM Ms.Gauravi.A.Yadav 1, Prof. Shailaja.S.Patil 2 Department of electronics and telecommunication Engineering Rajarambapu Institute of Technology, Rajaramnagar
INTRODUCTION TO ECG. Dr. Tamara Alqudah
 INTRODUCTION TO ECG Dr. Tamara Alqudah Excitatory & conductive system of the heart + - The ECG The electrocardiogram, or ECG, is a simple & noninvasive diagnostic test which records the electrical
MR Advance Techniques. Cardiac Imaging. Class IV
 MR Advance Techniques Cardiac Imaging Class IV Heart The heart is a muscular organ responsible for pumping blood through the blood vessels by repeated, rhythmic contractions. Layers of the heart Endocardium
A Brain Computer Interface System For Auto Piloting Wheelchair
 A Brain Computer Interface System For Auto Piloting Wheelchair Reshmi G, N. Kumaravel & M. Sasikala Centre for Medical Electronics, Dept. of Electronics and Communication Engineering, College of Engineering,
The Efficient and Smart Methods for Diagnosis of SVT 대구파티마병원순환기내과정병천
 The Efficient and Smart Methods for Diagnosis of SVT 대구파티마병원순환기내과정병천 Differentiation Supraventricular Origin from Ventricular Origin on ECG. QRS-Complex Width. 1. Narrow QRS-Complex Tachycardia (
This presentation will deal with the basics of ECG description as well as the physiological basics of
 Snímka 1 Electrocardiography basics This presentation will deal with the basics of ECG description as well as the physiological basics of Snímka 2 Lecture overview 1. Cardiac conduction system functional
Journal of Faculty of Engineering & Technology DESIGN AND IMPLEMENTATION OF A WEARABLE HEALTH DEVICE
 PAK BULLET TRAIN (PBT) JFET 22(2) (2015) 39-44 Journal of Faculty of Engineering & Technology journal homepage: www.pu.edu.pk/journals/index.php/jfet/index DESIGN AND IMPLEMENTATION OF A WEARABLE HEALTH
A bioimpedance-based cardiovascular measurement system
 A bioimpedance-based cardiovascular measurement system Roman Kusche 1[0000-0003-2925-7638], Sebastian Hauschild 1, and Martin Ryschka 1 1 Laboratory of Medical Electronics, Luebeck University of Applied
Genetic Algorithm based Feature Extraction for ECG Signal Classification using Neural Network
 Genetic Algorithm based Feature Extraction for ECG Signal Classification using Neural Network 1 R. Sathya, 2 K. Akilandeswari 1,2 Research Scholar 1 Department of Computer Science 1 Govt. Arts College,
DR QAZI IMTIAZ RASOOL OBJECTIVES
 PRACTICAL ELECTROCARDIOGRAPHY DR QAZI IMTIAZ RASOOL OBJECTIVES Recording of electrical events in heart Established electrode pattern results in specific tracing pattern Health of heart i. e. Anatomical
Rigel UNI-SiM Lite. The most cost-effective patient simulator on the market. Key Features n Compact and cost-effective
 Rigel UNI-SiM Lite The most cost-effective patient simulator on the market The UNI-SiM Lite is a handheld and battery-operated vital signs simulator, designed to be a cost effective and portable solution
II. NORMAL ECG WAVEFORM
 American Journal of Engineering Research (AJER) e-issn: 2320-0847 p-issn : 2320-0936 Volume-5, Issue-5, pp-155-161 www.ajer.org Research Paper Open Access Abnormality Detection in ECG Signal Using Wavelets
CHAPTER IV PREPROCESSING & FEATURE EXTRACTION IN ECG SIGNALS
 CHAPTER IV PREPROCESSING & FEATURE EXTRACTION IN ECG SIGNALS are The proposed ECG classification approach consists of three phases. They Preprocessing Feature Extraction and Selection Classification The
GE Healthcare. Marquette 12SL. ECG Analysis Program. Statement of Validation and Accuracy Revision B
 GE Healthcare Marquette 12SL ECG Analysis Program Statement of Validation and Accuracy Revision B g NOTE: The information in this manual only applies to the Marquette 12SL ECG Analysis Program. Due to
ECE ECE PRINCIPLES OF BIOMEDICAL SYSTEMS & DEVICES LAB 1 - ELECTROCARDIOGRAM
 ECE0909.404.01 ECE 0909.504.03 PRINCIPLES OF BIOMEDICAL SYSTEMS & DEVICES LAB 1 - ELECTROCARDIOGRAM The purpose of this laboratory is to introduce you to electrocardiogram, its acquisition and interpretation.
Heart Rate Calculation by Detection of R Peak
 Heart Rate Calculation by Detection of R Peak Aditi Sengupta Department of Electronics & Communication Engineering, Siliguri Institute of Technology Abstract- Electrocardiogram (ECG) is one of the most
LABORATORY INVESTIGATION
 LABORATORY INVESTIGATION Recording Electrocardiograms The taking of an electrocardiogram is an almost universal part of any complete physical examination. From the ECG record of the electrical activity
GE Healthcare. The GE EK-Pro Arrhythmia Detection Algorithm for Patient Monitoring
 GE Healthcare The GE EK-Pro Arrhythmia Detection Algorithm for Patient Monitoring Table of Contents Arrhythmia monitoring today 3 The importance of simultaneous, multi-lead arrhythmia monitoring 3 GE EK-Pro
REVIEW ON ARRHYTHMIA DETECTION USING SIGNAL PROCESSING
 REVIEW ON ARRHYTHMIA DETECTION USING SIGNAL PROCESSING Vishakha S. Naik Dessai Electronics and Telecommunication Engineering Department, Goa College of Engineering, (India) ABSTRACT An electrocardiogram
Chapter 3 Biological measurement 3.1 Nerve conduction
 Chapter 3 Biological measurement 3.1 Nerve conduction Learning objectives: What is in a nerve fibre? How does a nerve fibre transmit an electrical impulse? What do we mean by action potential? Nerve cells
Electrocardiography Biomedical Engineering Kaj-Åge Henneberg
 Electrocardiography 31650 Biomedical Engineering Kaj-Åge Henneberg Electrocardiography Plan Function of cardiovascular system Electrical activation of the heart Recording the ECG Arrhythmia Heart Rate
VENTRICULAR DEFIBRILLATOR
 VENTRICULAR DEFIBRILLATOR Group No: B03 Ritesh Agarwal (06004037) ritesh_agarwal@iitb.ac.in Sanket Kabra (06007017) sanketkabra@iitb.ac.in Prateek Mittal (06007021) prateekm@iitb.ac.in Supervisor: Prof.
Prediction of Life-Threatening Arrhythmia in Patients after Myocardial Infarction by Late Potentials, Ejection Fraction and Holter Monitoring
 Prediction of Life-Threatening Arrhythmia in Patients after Myocardial Infarction by Late Potentials, Ejection Fraction and Holter Monitoring Yu-Zhen ZHANG, M.D.,* Shi-Wen WANG, M.D.,* Da-Yi Hu, M.D.,**
Panorama. Arrhythmia Analysis Frequently Asked Questions
 Panorama Arrhythmia Analysis Frequently Asked Questions What ECG vectors are used for Beat Detection? 3-wire lead set 5-wire lead set and 12 lead What ECG vectors are used for Beat Typing? 3-wire lead
DEVELOPMENT OF SCREENING TOOL TO IDENTIFY POTENTIAL IMPLANTABLE CARDIAC DEFIBRILLATOR (ICD) RECEIVER
 RECEIVER") DEVELOPMENT OF SCREENING TOOL TO IDENTIFY POTENTIAL IMPLANTABLE CARDIAC DEFIBRILLATOR (ICD) RECEIVER Tan Wei Kiat a, Megalla Packrisamy a, M. B Malarvili b,a Faculty of Biosciences and Medical Engineering,
DEVELOPMENT OF SCREENING TOOL TO IDENTIFY POTENTIAL IMPLANTABLE CARDIAC DEFIBRILLATOR (ICD) RECEIVER Tan Wei Kiat a, Megalla Packrisamy a, M. B Malarvili b,a Faculty of Biosciences and Medical Engineering,
Speech to Text Wireless Converter
 Speech to Text Wireless Converter Kailas Puri 1, Vivek Ajage 2, Satyam Mali 3, Akhil Wasnik 4, Amey Naik 5 And Guided by Dr. Prof. M. S. Panse 6 1,2,3,4,5,6 Department of Electrical Engineering, Veermata
SPECTRAL ANALYSIS OF LIFE-THREATENING CARDIAC ARRHYTHMIAS
 SPECTRAL ANALYSIS OF LIFE-THREATENING CARDIAC ARRHYTHMIAS Vessela Tzvetanova Krasteva, Irena Ilieva Jekova Centre of Biomedical Engineering Prof. Ivan Daskalov - Bulgarian Academy of Sciences Acad.G.Bonchev
Assessment of the Performance of the Adaptive Thresholding Algorithm for QRS Detection with the Use of AHA Database
 Assessment of the Performance of the Adaptive Thresholding Algorithm for QRS Detection with the Use of AHA Database Ivaylo Christov Centre of Biomedical Engineering Prof. Ivan Daskalov Bulgarian Academy
Exercise Testing Interpretation in the Congenital Heart.
 Interpretation in the Congenital Heart. Stephen M. Paridon, MD Medical Director, Exercise Physiology Laboratory The Children s Hospital of Philadelphia Professor of Pediatrics The University of Pennsylvania
ECG Rhythm Analysis by Using Neuro-Genetic Algorithms
 MASAUM Journal of Basic and Applied Sciences, Vol. 1, No. 3, October 2009 522 ECG Rhythm Analysis by Using Neuro-Genetic Algorithms Safaa S. Omran, S.M.R. Taha, and Nassr Ali Awadh Abstract The heart is
SYSTEM FOR MEASURING THE TRANSTHORACIC ELECTRICAL IMPEDANCE TO THE ECG SIGNAL
 INTERNATIONAL CONGRESS ON COMPUTATIONAL BIOENGINEERING M. Doblaré, M. Cerrolaza and H. Rodrigues (Eds.) I3A, España, 3 SYSTEM FOR MEASURING THE TRANSTHORACIC ELECTRICAL IMPEDANCE TO THE ECG SIGNAL Alberto
VITAL SIGNS MONITOR. Members Jake Adams David Knoff Maysarah Shahabuddin. Clients Dr. John Enderle Dr. Gielo-Perczak
 VITAL SIGNS MONITOR Members Jake Adams David Knoff Maysarah Shahabuddin Clients Dr. John Enderle Dr. Gielo-Perczak Vital Signs Cardiac Respiratory Pulse oximetry Respiration rate Body Temperature Existing
Building an Electrocardiogram (ECG) Diagnostic System. Collection Editor: Christine Moran
 Diagnostic System. Collection Editor: Christine Moran") Building an Electrocardiogram (ECG) Diagnostic System Collection Editor: Christine Moran Building an Electrocardiogram (ECG) Diagnostic System Collection Editor: Christine Moran Authors: Yuheng Chen Leslie
Building an Electrocardiogram (ECG) Diagnostic System Collection Editor: Christine Moran Building an Electrocardiogram (ECG) Diagnostic System Collection Editor: Christine Moran Authors: Yuheng Chen Leslie
PERMANENT PACEMAKERS AND IMPLANTABLE DEFIBRILLATORS Considerations for intensivists
 PERMANENT PACEMAKERS AND IMPLANTABLE DEFIBRILLATORS Considerations for intensivists Craig A. McPherson, MD, FACC Associate Professor of Medicine Constantine Manthous, MD, FACP, FCCP Associate Clinical
Heart-rate Variability Christoph Guger,
 Heart-rate Variability Christoph Guger, 10.02.2004 Heart-rate Variability (HRV) 1965 Hon & Lee Fetal distress alterations in interbeat intervals before heart rate (HR) changed 1980 HRV is strong and independent
ECG Beat Recognition using Principal Components Analysis and Artificial Neural Network
 International Journal of Electronics Engineering, 3 (1), 2011, pp. 55 58 ECG Beat Recognition using Principal Components Analysis and Artificial Neural Network Amitabh Sharma 1, and Tanushree Sharma 2
Medical Electronics Dr. Neil Townsend Michaelmas Term 2001 (www.robots.ox.ac.uk/~neil/teaching/lectures/med_elec) The story so far
 The story so far") Medical Electronics Dr. Neil Townsend Michaelmas Term 2001 (www.robots.ox.ac.uk/~neil/teaching/lectures/med_elec) The story so far The heart pumps blood around the body. It has four chambers which contact
Medical Electronics Dr. Neil Townsend Michaelmas Term 2001 (www.robots.ox.ac.uk/~neil/teaching/lectures/med_elec) The story so far The heart pumps blood around the body. It has four chambers which contact
Basic Dysrhythmia Interpretation
 Basic Dysrhythmia Interpretation Objectives 2 To understand the Basic ECG To understand the meaning of Dysrhythmia To describe the normal heart conduction system. To describe the normal impulse pathways.
Study of T-wave morphology parameters based on Principal Components Analysis during acute myocardial ischemia
 Journal of Physics: Conference Series Study of T-wave morphology parameters based on Principal Components Analysis during acute myocardial ischemia To cite this article: Fabricio Hugo Baglivo and Pedro
ECG Signal Based Heart Disease Detection System for Telemedicine Application Using LabVIEW
 ECG Signal Based Heart Disease Detection System for Telemedicine Application Using LabVIEW Dr. Channappa Bhyri 1, Nishat Banu A.M 2 2 Student, Dept. of Electronics and Industrial Instrumentation, PDACE,
physiology 6 Mohammed Jaafer Turquoise team
 15 physiology 6 Mohammed Jaafer 22-3-2016 Turquoise team Cardiac Arrhythmias and Their Electrocardiographic Interpretation Today, we are going to talk about the abnormal excitation. As we said before,
Hemodynamic Analysis System
 Hemodynamic Analysis System Advisor: Professor Mitch Tyler Client: Professor Naomi Chesler Team members: Sarah Czaplewski, Megan Jones, Sara Schmitz, and William Zuleger Overview Pulmonary Hypertension
ECG ABNORMALITIES D R. T AM A R A AL Q U D AH
 ECG ABNORMALITIES D R. T AM A R A AL Q U D AH When we interpret an ECG we compare it instantaneously with the normal ECG and normal variants stored in our memory; these memories are stored visually in
3/26/15 HTEC 91. EKG Sign-in Book. The Cardiac Cycle. Parts of the ECG. Waves. Waves. Review of protocol Review of placement of chest leads (V1, V2)
") EKG Sign-in Book HTEC 91 Review of protocol Review of placement of chest leads (V1, V2) Medical Office Diagnostic Tests Week 2 http://www.cvphysiology.com/arrhythmias/a013c.htm The Cardiac Cycle Represents
EKG Sign-in Book HTEC 91 Review of protocol Review of placement of chest leads (V1, V2) Medical Office Diagnostic Tests Week 2 http://www.cvphysiology.com/arrhythmias/a013c.htm The Cardiac Cycle Represents
ECG Signal Analysis for Abnormality Detection in the Heart beat
 GRD Journals- Global Research and Development Journal for Engineering Volume 1 Issue 10 September 2016 ISSN: 2455-5703 ECG Signal Analysis for Abnormality Detection in the Heart beat Vedprakash Gujiri