Effect of heterogeneous APD restitution on VF organization in a model of the human ventricles
|
|
|
- Emmeline Watkins
- 5 years ago
- Views:
Transcription
1 Page Articles 1 of 34 in PresS. Am J Physiol Heart Circ Physiol (November 30, 2007). doi: /ajpheart Effect of heterogeneous APD restitution on VF organization in a model of the human ventricles R.H. Keldermann *, K.H.W.J. ten Tusscher, M.P. Nash, R. Hren +, P. Taggart ++, A.V. Panfilov Department of Theoretical Biology, Utrecht University, Padualaan 8,Utrecht, 3584 CH, The Netherlands Bioengineering Institute and Department of Engineering Science, The University of Auckland, New Zealand + Institute of Mathematics, Physics, and Mechanics, University of Ljubljana, Slovenia ++ Department of Cardiology and Cardiothoracic Surgery, University College Hospital, London, United Kingdom November 1, 2007 Abstract The onset of ventricular fibrillation (VF) has been associated with steep action potential duration (APD) restitution in both clinical and computational studies. Recently, detailed clinical restitution properties in cardiac patients were reported showing a substantial degree of heterogeneity in restitution slopes at the epicardium of the ventricles. The aim of the present study was to investigate the effect of heterogeneous restitution properties in a 3D model of the ventricles using these clinically measured restitution data. We used a realistic model of the human ventricles, including detailed descriptions of cell electrophysiology, ventricular anatomy, and fiber direction anisotropy. We extended this model by mapping the clinically observed epicardial restitution data to our anatomical representation using a diffusion based algorithm. Restitution properties were then fitted by regionally varying parameters of the electrophysiological model. We studied the effects of restitution heterogeneity on the organization of VF by analyzing filaments and the distributions of excitation periods. We found that the number of filaments and the excitation periods were both dependent on the extent of heterogeneity. An increased level of heterogeneity leads to a greater number of filaments and a broader distribution of excitation periods, thereby increasing the complexity and dynamics of VF. Restitution heterogeneity may play an important role in providing a substrate for cardiac arrhythmias. Introduction Sudden cardiac death is the most common cause of death in the industrialized world and in most cases it is due to ventricular fibrillation (VF) (59). During VF, excitation waves are disturbed and chaotic, causing the contraction of the ventricles to become rapid and uncoordinated. It has been shown in clinical and experimental studies that these turbulent wave patterns are underpinned by re-entrant sources of excitation (12, 15, 19, 28, 51, 54). If VF is not halted by means of defibrillation, this condition can be lethal within minutes. Historically, it has been hypothesized that VF is due to turbulent wave propagation induced by heterogeneity in refractoriness of cardiac tissue (23, 27). The important role of heterogeneity in VF is supported by the strong association of VF with diseases that lead to increased heterogeneity, such as coronary artery disease, cardiomyopathies, and congenital heart disease (11, 59). Due to these pathologies, remodeling of the cellular ionic currents, calcium handling and gap junctional coupling in cardiac tissue results in increased heterogeneity. Furthermore, VF is associated with diseases such as Long QT, Short QT, and Brugada syndrome (11, 59), in which ion channel mutations lead to an increase of action potential duration (APD) dispersion. *Author to whom correspondence should be addressed. R.H.Keldermann@uu.nl Tel: Copyright 2007 by the American Physiological Society.
2 Page 2 of 34 In the last decade, it has been proposed that VF is caused by the occurrence of dynamical instabilities (alternans) induced by steep APD restitution (16, 33, 35, 36, 41, 52), which became known as the restitution hypothesis of VF (41, 52). More recently, intracellular calcium cycling has been shown to cause alternans in APD (40, 53), which may lead to dynamical instabilities and VF. According to the original restitution hypothesis, alternans instability occurs when the slope of the APD restitution curve, which relates the APD to its previous diastolic interval (DI), exceeds one (16, 33). Recent experimental and modeling studies show that although steepness of restitution curve is an important determinant of instability (2, 3, 55), other factors such as electrotonic coupling, cardiac memory, and conduction velocity restitution should also be taken into account (13, 39, 49, 50). The restitution hypothesis and refractoriness hypothesis of VF are related. Alternans instability induces dynamic heterogeneities that can lead to wave break, whereas static anatomically defined heterogeneities can also lead to wave break. Restitution induced VF has been the subject of a variety of computational studies. Because the restitution hypothesis does not require pre-existing heterogeneity for the onset of VF, most of the computational studies regarding the restitution hypothesis have assumed that cardiac tissue is homogeneous. However, recent clinical studies have demonstrated that APD restitution properties on the ventricular epicardium and endocardium have a complex spatially non-uniform distribution (26, 31, 58). These studies showed that: 1) APD restitution properties are spatially heterogeneous containing multiple sites of steep and shallow restitution slopes; 2) Maximum restitution slopes range from almost zero to well over two; 3) Restitution properties differ between patients and are dependent on the underlying pathology. Some studies on the effects of heterogeneous APD restitution in cardiac tissue have shown that spatial dispersion in APD restitution may result in wavebreak and initiation of VF (6, 9, 57). However, the influence of restitution heterogeneity on VF dynamics and organization has not yet been investigated. In this paper, we study the effects of heterogeneous APD restitution data measured in clinical studies (31) on VF organization in the human heart. We use our integrative anatomical model of the human ventricles (48), which was recently developed and verified against available clinical data on human VF. The model describes action potential characteristics of human ventricular myocytes (49, 50), combined with an anatomically detailed geometry of the human ventricles that incorporates fiber direction anisotropy (18). We introduce APD restitution heterogeneity into our model by incorporating clinically measured restitution data from patients who were undergoing surgery for aortic valve replacement as reported in (31). Clinical restitution curves were mapped and interpolated to our 3D ventricular geometry and reproduced by our cell model using appropriate regional variations of the parameters of the electrophysiological model. We used this human ventricular model to study the effects of spatial heterogeneity of APD restitution on the dynamics of VF and found that the organization of VF became more complex with increased heterogeneity. We have quantified these effects in terms of the number of filaments and the local excitation periods. Methods We developed a heterogeneous model of the human ventricles by incorporating clinically measured spatially heterogeneous APD restitution properties (31) into our integrative model of the human ventricles (48, 49, 50). Below we describe in detail the main features of our heterogeneous model.
3 Page 3 of 34 Ventricular model Excitation of the ventricles in a monodomain model can be described using the following partial differential equation (22): Equation 1 where, V m denotes the transmembrane voltage, C m the membrane capacitance, D ij the diffusion tensor, and I ion the sum of the ionic transmembrane currents describing the excitable behavior of the individual ventricular cell. There are different models available to describe action potential characteristics of the cell membrane (1, 4, 13, 24, 25, 50). In this study, we used the human ventricular ionic model published by Ten Tusscher et al. (49, 50) and refer to this as the TNNP model. This model provides a detailed description of voltage, ionic currents and intracellular ion concentrations, and is based on a wide range of human based electrophysiological data. The most recent version of the TNNP model (49) includes a more extensive description of intracellular calcium dynamics. However, the model does not describe calcium alternans nor spontaneous calcium release. The model reproduces experimentally measured APD (29) and conduction velocity restitution curves (14)]. The TNNP model contains the following ionic currents: Equation 2 A complete list of all equations can be found in (49, 50). We used the default parameter settings from (49); all changes from these default settings are detailed in the text below. More information about homogeneous 2D and 3D spiral wave dynamics and spiral wave breakup can be found in (48, 49). Geometric data describing the 3D ventricular anatomy and fiber direction field were derived from a normal healthy human heart (18). From this heart, a voxel description of approximately 13.5 million points with a spatial resolution of 0.25 mm was obtained. We assume that the transverse conductivity is the same in all directions orthogonal to the direction of the muscle fiber axis and that local conductivity tensors D ij can be derived from local muscle fiber directions using: Equation 3 where, D L and D T are the longitudinal and transverse conductivity, respectively and a is the muscle fiber direction. For D L we used 162 cm and for D T we used 40.5 cm, which resulted in conduction velocities of 68 cm/s in the longitudinal direction and 32 cm/s in the transverse direction. Thus the resulting anisotropy ratio was approximately 2:1, which is consistent with clinical measurements (20).
4 Page 4 of 34 Clinical human restitution data A recent clinical study by Nash et al. (31) has provided global epicardial restitution properties in 14 cardiac patients. In this study, activation-recovery intervals (ARI) were recorded over the entire ventricular epicardial surface using an epicardial sock containing 256 unipolar contact electrodes (inter-electrode spacing approximately 10 mm). These ARI values can be compared to action potential durations (APD) measured at approximately 50% repolarization (AP D 50 ) (17). They applied a standard S1-S2 protocol to determine restitution properties. A train of 9 S1 stimuli at a basic cycle length (BCL) of 600 ms were applied, followed by a S2 stimulus at various intervals ranging from 600 ms to 240 ms. For each electrode, up to 24 pairs of values for the diastolic interval (DI) and subsequent AP D 50 were recorded. We fitted the clinical ARI data of Nash et al. (31) using a least-square mono-exponential fit as this was the same approach used by Nash et al. (31): Equation 4 where the steady state APD 50(SS), a and b are parameters of the fit. The maximum restitution slope S max was determined for each electrode using (31): Equation 5 where DI min is the minimum measured non-refractory DI. Note that this method for maximum restitution slope determination differs from the method used in Ten Tusscher et al. (49) who used a piecewise linear approximation to determine the maximum restitution slope. We compared both methods and found that the piecewise calculation systematically underestimated the maximum restitution slope by around compared to the least squares mono-exponential fit method (Nash et al. (31)). Mapping and extrapolating clinical restitution data In the present study, we used datasets of two patients undergoing replacement surgery for aortic valve disease, for which the most complete APD restitution recordings were available, with more than 85% of valid electrode recordings for each dataset. An electrode was defined to be valid if the data contained at least 18 pairs of DI and APD 50 values and the mono-exponential fit had at least a correlation coefficient of 0.6 or higher, with 1 meaning perfect statistical correlation and 0 meaning there is no correlation at all. Maximum restitution slopes (S max ) with a slope smaller than 0.4 or greater than 3 were manually evaluated and corrected if needed. Dataset 1 (i.e., Figure 4 in (31)) had a mean +/- SD S max of /- 1.04, based on n=238 (93%) valid restitution curves. For dataset 2, the mean +/- SD S max was / based on n=227 (89%) valid restitution curves.
5 Page 5 of 34 To map the clinical restitution data to our human ventricles, we first mapped the positions of the 256 sock electrodes to the surface of our ventricular model. Coordinates of both the epicardial sock and the anatomical model were normalized about the center of the apex taking into account the anterior, posterior, left and right sides of the ventricles. Electrode sites were then projected on the epicardial surface of our ventricular model by minimizing the distance to the epicardial surface. For our study, we needed to assign restitution properties of cardiac tissue throughout the entire 3D ventricular mass. However, data on the full 3D organization of APD restitution in the human ventricles are presently not available. Observations have been reported only for surfaces of the heart, and measuring restitution properties on the epi- and endocardium require different clinical methods. To date, either epicardial or endocardial recordings (but not both) have been reported for individual hearts. Nash et al. (31) used an epicardial sock with electrodes to measure restitution data at 256 locations spread across most of the epicardium. Yue et al. (58) used a catheter balloon with electrodes to measure restitution data at 128 locations on the endocardium of the heart. The epi- and endocardial data sets each show regional organization of restitution slopes into 3-5 different areas. Slopes varied between regions and the spatial arrangement of these regions varied considerably from patient to patient. Given these observations regarding restitution slope patterns on the epi- and endocardial surfaces, it is likely that this heterogeneity has a 3D structure. In the absence of experimental 3D data, we extrapolated the 2D surface patterns across the 3D mass. Rather than using different data sets from two different hearts (i.e., one set of data for the epicardial surface and another for the endocardial surface), we used only the epicardial data from Nash et al. (31). In order to extrapolate the data into 3D, we developed a diffusion based algorithm to extend the epicardial profile smoothly across the ventricular walls (described below). We do not claim that our algorithm will reproduce the quantitatively correct 3D restitution profile for a particular patient. However, we believe that this is a reasonable first step until more detailed data on 3D organization of human restitution becomes available. Diffusion domain algorithm Our diffusion algorithm contains the following three steps. Firstly, we extended the measured S max values (maximum 256 electrode points on the epicardium) to all heart points by solving the diffusion equations for the maximum restitution slopes in the domain given by the heart anatomy. We used the clinically measured maximum restitution slopes as constraints, i.e., the variable S max was kept constant at each electrode position during the diffusion process. We used a value for the non-dimensional diffusion coefficient of D = 400, which provided the desired spatial smoothness of interpolation. The diffusion equations were solved until the average square of residual at the non-constraint points decreased below As a result, we obtained a smooth spatial interpolation of S max across all points in the 3D model except for the regions immediately adjacent to the initial electrodes. The second step was to remove these sharp local gradients by applying a moving average window of voxels in the domain given by the heart anatomy. Note that this averaging also changed the values of S max at the reference electrodes (see Figure 1, column 2). As a third step, we scaled back S max values for all points using a linear transformation function, which was found from the data presented in Figure 2. More specifically, we found the best least square linear fit of the original, clinically measured maximum restitution slope values and the S max values found after step 2 of our interpolation procedure. We then scaled back our data using this linear
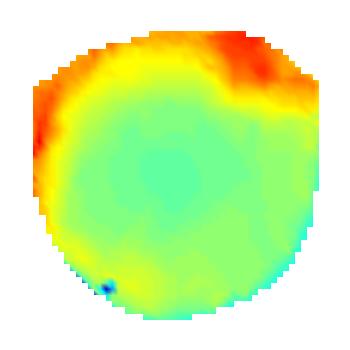
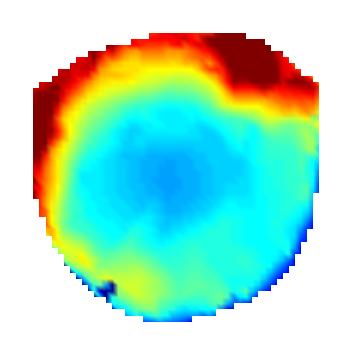
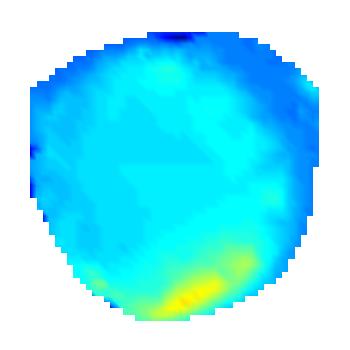
6 Page 6 of 34 transformation. Thus, we obtained a smooth distribution of S max across all heart points in our anatomical model, which corresponded well with the clinical data at the epicardial surface. Figure 1 shows the application of our algorithm for dataset 1 (the upper row) and dataset 2 (the lower row). In the first column, we show a direct linear surface interpolation of the clinical data using Matlab s GRIDDATA function. In the second column, we show how S max values are distributed after the diffusion algorithm and the moving average window were applied. The third column shows the maximum restitution slopes after the linear transformation step. Comparing the raw data set shown in Figure 1 column 1 with the interpolated data shown in column 3, we see that we were able to obtain a profile of heterogeneity in all heart points that corresponded well with the clinical data, but was spatially smooth. We chose to use this smoothed representation as it provided a robust general description of heterogeneity in the heart that helped guard against possible spurious recordings. (Note that the patient 1 dataset we use here is the same as the one used in Figure 4 in (31)). For dataset 1, a large region of the posterior wall of the left ventricle contained steep restitution slopes, with values close to 3. The right ventricle contains more shallow restitution slopes, with values around Between these regions, intermediate values were present. The mean +/- SD restitution slope was / Dataset 2 had a relatively small region on the anterior wall with high slope values, whereas the rest of the bulk tissue was characterized by shallow restitution. The mean +/- SD restitution slope was / Both profiles are illustrated in Figure 3, where red areas correspond to steep restitution slopes (S max = 2.5-3), whilst blue areas correspond to shallow restitution slopes (S max = 0.5-1). Figure 11 illustrates two short-axis slices with maximum restitution slopes that have been interpolated from the epicardium through to the endocardium (for dataset 1). Parameters of the cell model To model cardiac tissue with the desired regional APD restitution properties we fitted parameters of the TNNP model to different maximum restitution slopes. For each computational point of the ventricular geometry, the value of S max was used to individually assign cell model parameters. To generate restitution curves, we paced a single cell model with a series of 10 S1 stimuli at a BCL of 600 ms, followed by a single S2 stimulus delivered at a specified DI after the last S1 action potential. The restitution curve was generated by decreasing the S1-S2 interval (and hence DI), and plotting the AP D 50 of the S2 action potential versus the preceding DI value. We reproduced a variety of slopes between 0.4 and 3 by varying the parameters G Kr, G Ks, G pca, G pk and t f. Figure 4 shows the values of these parameters used to obtain the given maximum restitution slopes. Note, that for slopes S max <0.4 we used S max =0.4, and for slopes S max >3 we used S max =3 (grey lines in Figure 4). Figure 5 shows an example of some APD and APD restitution curves for different parameter settings, together with experimental data to which these restitution curves were fitted. More information about fitting of experimental restitution curves using the TNNP model can be found in Ten Tusscher et al. (49).


7 Page 7 of 34 Linear interpolation +Diffusion +Linear Transformation Dataset 2 Dataset 1 Figure 1: Distribution of epicardial restitution, S max shown on the polar projection, with the epicardial apex at the center of each plot and the ventricular base at the outer circumference. For the polar projections, the anterior, posterior, LV, and RV portions of the ventricular epicardium are shown at the bottom, top, left, and right, respectively. Top row: dataset 1. Bottom row: dataset 2. Column 1: Simple triangle based linear surface interpolation using Matlab s GRIDDATA function. Column 2: After diffusion and application of the moving average window. Column 3: After linear transformation. Figure 2: Correlation plots of clinical S max values versus model S max values after diffusion and moving average window procedures. Left: dataset 1. Right: dataset 2.
.")
8 Page 8 of 34 LV RV Anterior Posterior Dataset 2 Dataset 1 Figure 3: 3D plots of restitution S max. Top row: dataset 1. Bottom row: dataset 2. From left to right: LV, RV, anterior and posterior views. Numerical approach Equations for the gating variables in the TNNP model were integrated using a Rush and Larsen integration scheme (45). To integrate Equation 1, we used a forward Euler scheme with a time step of t=0.02 ms and a space step of x=0.25 mm, and the following Laplacian was evaluated at each point in the human ventricular geometry: Equation 6 which can be discretized into the following equation: Equation 7 where L is an index running over the 18 neighbors of the point (i, j, k) and the point itself, and w l are the weights defined for each neighbor point containing information about the voltage contributed to the Laplacian at each point (i, j, k). Weights are calculated at each point using the local conductivity tensors calculated by Equation 3. To ensure a zero axial current flow from heart points to non-heart points, no flux boundary conditions were imposed by setting weights to zero if a neighbor lay outside the heart geometry.
9 Page 9 of 34 To initiate 3D scroll waves, we used an S1-S2 protocol, in which the S2 stimulus was activated in the refractory tail of the S1 stimulus, thereby creating a scroll wave. Stimulus currents were applied at twice the diastolic threshold value. For each restitution slope profile, we performed simulations of VT/VF by initiating a scroll wave in the free wall of the left ventricle. Simulations lasted for 8 seconds or were terminated if there was no activity present. Assuming that the medium is an infinite volume conductor, electrograms can be calculated using the dipole source density of the membrane potential in all voxel points using (37): Equation 8 where, V is the domain of integration (i.e., the ventricular volume), and r is the vector from each point to the recording electrode, which was placed 10 cm from the center of the ventricles in the anterior direction of the transverse plane. Scroll wave filaments were detected using an algorithm proposed by Fenton and Karma (13). If there is a spiral wave in 2D (a scroll wave in 3D) present, the core (filament) can be defined as the point(s) for which the excitation wavefront and waveback meet. This can be calculated as the intersection points of the -60 mv isopotential line and the dv/dt=0 iso-line. Voxel data corresponding to these intersection points were then stored. Individual filaments were detected by iteratively joining neighboring voxels that were designated as filament points. All voxels that belonged to the same filament were assigned a unique identifier. Filaments were determined at 10 ms intervals. Of these filaments, we tracked: the time of birth, time of death, time of bifurcation, time of amalgamation, lifespan, filament from which a filament bifurcated, filament into which a filament amalgamated, and ultimate filament to which a filament can be traced back through the bifurcations events. All simulations were coded in C++ and MPI and were run on 16 processors of a Beowulf cluster consisting of 16 Dell 650 Precision Workstations (dual Intel Xeon 2.66 GHz). Simulating 1 second of wave propagation in the ventricles took approximately 6.5 hours of wall-clock computation time. Ventricular geometry, wave patterns and scroll wave filaments were visualized using the marching cubes algorithms for isosurface detection in voxel data, and OpenGL for isosurface rendering.
10 Page 10 of 34 Figure 4: Model parameters determining the maximum slope of the APD restitution curve. The y-axes are G Kr, G Ks, G pca, G pk (in nspf -1 ) and k f, respectively. The parameter k f is the multiplication factor of t f. The x-axis shows the maximum slope of the restitution curve S max. Grey lines represent cutoff values (see text for further explanation). Figure 5: Example of restitution curves and corresponding action potentials (using a basic cycle length of 600 ms with a S1-S2 protocol) for different parameter settings of the model. Maximum restitution slopes are 2.70, 1.00 and 0.42, respectively. For comparison, experimental data points to which the model restitution curves were fitted are shown, using triangles (slope 2.70), squares (slope 1.00) and circles (slope 0.42).
11 Page 11 of 34 Results Wavefronts and ECG signal In the first series of simulations we initiated a spiral in the free wall of the left ventricle using a S1-S2 protocol. In Figure 6, we show snapshots of consecutive wavefronts and the ECG pattern for both patient datasets (dataset 1 in the top row, and dataset 2 in the bottom row). For dataset 1, we observed that the initial spiral broke down into a chaotic fibrillatory pattern, and that the ECG signal was irregular and complex (dominant frequency of 4.6 Hz). For dataset 2, the initial spiral remained stable in the LV. Note that the spiral was not anchored, and did not (hyper)meander nor drift during the entire simulation. The ECG signal was periodic (dominant frequency of 4.5 Hz), which resembles ECG signals during ventricular tachycardia (VT). The frequency spectra of both ECG signals are shown in Figure 7. Although the simulations had similar dominant frequencies, the frequency spectrum of dataset 1 was broader in comparison to that of dataset 2, which had a single dominant peak. These observations are characteristic of the differences between VF and VT, respectively, and the frequencies are similar to those reported in clinical (8, 30, 32, 56) and numerical studies (48). Number of filaments A convenient way to quantify the complexity of excitation patterns in the thick walled ventricles of the heart is by determining the number of scroll wave filaments of the excitation sources (7, 10, 21, 34, 42, 44, 48, 51). A scroll wave filament is a line around which a 3D spiral wave rotates. When such a filament intersects with the surface of the heart, a phase singularity (PS) manifests on the heart surface. For dataset 2, we observed just one reentrant source, represented by a single filament. In Figure 8, we show a snapshot of the filaments present for dataset 1 after 5 seconds of simulation time. Here the excitation pattern was organized by approximately 15 filaments. Most of these filaments extended from the epicardium to the endocardium, with only 5 filaments located entirely within the myocardial walls. We observed that the majority of filaments were located near the base of the heart, whereas very few filaments were present near the apex. Furthermore, most filaments were present in the left ventricular wall, i.e., the region with high restitution slope values. The filament numbers and shapes fluctuated during the course of the simulation. In Figure 8, we show the time dynamics of the number of filaments during 8 seconds of simulation. After an initial phase of growth, the number of filaments fluctuated around The average number of filaments was 14.9, which is within the range reported by Ten Tusscher et al. (48). We also show the number of PS visible on the epicardium. The average number of PS was 10.7, thus the ratio of the number of filaments to PS was approximately 1.4, consistent with (48).

12 Page 12 of 34 Figure 6: Wavefronts (in red on the left) and ECG signals (right). Top: dataset 1. Bottom: dataset 2. The first snapshot shows the spiral after initiation on the left ventricular free wall and the second snapshot shows wavefronts after 5 seconds of simulation time. Figure 7: Frequency spectra of ECG signals. Black: dataset 1. Red: dataset 2.

13 Page 13 of 34 We analyzed how filaments were created and destroyed over time through death, birth, bifurcation and amalgamation events. This is shown in Figure 9 for dataset 1. Horizontal lines indicate individual filaments and their lifespan. The start of a line is determined by the birth of a filament or the bifurcation from another filament. The end of the line occurs when the filaments disappear, i.e., the death or the amalgamation of a filament with another filament. Short horizontal lines in Figure 9 correspond to short living filaments, and long lines correspond to long living filaments. During the simulation we detected 1463 filaments and 379 births, 547 deaths, 1085 bifurcations and 917 amalgamation events. In figure 9 we can see that most of the filaments exist only for a short periods of time, although there are small number of long lived filaments. Figure 8: Filaments of dataset 1. Left: snapshot after 5 seconds of simulation time. Right: Number of PSs (red) and filaments (black) over time. Role of tissue heterogeneity To determine the effect of tissue heterogeneity on wave patterns during VF we performed a series of simulations in which we varied the degree of APD restitution heterogeneity in the heart. We did this by using the following linear transformation: Equation 9 where, S new is the new value of the maximum restitution slope at each given point, the average maximum slope taken over all points of dataset 1 is S avg =1.78, is a variable that scales the degree of heterogeneity and S max is the original value of the maximum restitution slope at each given point for dataset 1. Clearly, =1 corresponds to the fully heterogeneous simulation of dataset 1 (presented above), =0 corresponds to a spatially homogeneous restitution model with a slope of 1.78, and intermediate values of scale the degree of heterogeneity: larger values of correspond to more heterogeneous properties.
14 Page 14 of 34 Figure 9: Filament history for simulated VF. Horizontal lines correspond to individual filaments and start at the time a filament appears (through birth or bifurcation) and stop at the time a filament disappears (through death or amalgamation). Filaments get assigned unique identity numbers that are not reused once a filament has died. Different colors are used to indicate clusters of filaments that can be traced back through bifurcation events to the same initial filament, which is the first filament of that color. We use different colors for filaments with the same ancestor only if the filament cluster has a size of 5 or more filaments. All other filaments that either have arisen through birth rather than bifurcation, or belong to a small cluster are colored black.
15 Page 15 of 34 We performed a series of computations similar to that shown in Figure 6. The spiral was initiated in the LV wall using a S1-S2 protocol. We used values of 0, 0.25, 0.5, 0.75 and 1. The duration of all simulations was 8 seconds. We investigated the maximum number of filaments, average number of filaments, maximum number of epicardial PS and average number of epicardial PS for each simulation. The results are shown in Figure 10 and we see that for =0 (homogeneous setting) full blown breakup did not occur for the given slope (1.78). We found that to induce breakup for our heart model, we needed to increase the restitution slope to above 1.8 (results not shown). This is consistent with the slope value reported by Ten Tusscher et al. (49), given the difference in the methods used for slope determination (see methods section). We see that the maximum number of filaments and the average number of filaments increased for increasing heterogeneity. Similar results were found for the epicardial PS. Figure 10: Number of filaments and epicardial phase singularities (PS) for different degrees of APD restitution heterogeneity ( =0, homogeneous; =1, heterogeneous). To understand the mechanism of increased filament numbers with increasing heterogeneity, we investigated filament locations in the heart. Figure 11 shows all the locations of filament voxels across two slices of the heart together with the maximum restitution slopes (for the 8 second run with =1). The majority of the filaments were located in regions containing steep restitution slopes, and they were evenly distributed across these steep slope regions. Indeed, the mean +/- SD restitution slope taken across all voxels traversed by the filaments was significantly steeper (2.17 +/- 0.55) than that for the voxels spanning the remainder of the model (1.76 +/- 0.65, p < 0.005, 2-tailed Student t-test). In our model, the slope of the restitution curve is related to APD (see Figure 5) and thus gradients in restitution slopes are associated with gradients in APD. Such APD heterogeneities could potentially induce new wave breaks by themselves (even without steep restitution) and this would be expected to occur in areas of abrupt APD variation. However, we did not observe this in our simulations. We observed comparatively fewer numbers of filaments in regions containing restitution slope gradients. Thus the increase in complexity of VF is more likely to be directly due to the increase in size of regions with a steep enough restitution slope (> 1.80), rather
16 Page 16 of 34 than an increased occurrence of new breaks at larger gradients of heterogeneities in APD. An additional fact in favor of this hypothesis is that the electrical turbulence induced by steep restitution would be expected to be homogeneously distributed across entire regions of steep restitution, and this is what we have observed (Figure 11). We finally investigated the spatial-temporal distribution of excitation periods for all voxels in the 3D ventricular anatomy for different extents of heterogeneity (). For this, we determined excitation periods in every voxel after 2 seconds of transient processes using a 2 second window. Figure 12 shows the distribution of excitation periods on the epicardium, averaged in a time interval between 2-4 seconds for =1. We see that there are several distinct regions with different excitation frequencies. We followed this distribution until the end of the simulation and found that these regions with different periods are not anatomically predefined and that their location changes in the course of time (not shown). We compared the spatial distribution of excitation periods in the interval 2-4 seconds for all values of. For the homogeneous simulation (=0), we found that the average period values were distributed homogeneously and did not change over time. For values between 0 and 1, we found that the number of regions with different periods increased as the heterogeneity () in APD slopes increased. To quantify this increased heterogeneity in excitation period regions, we determined the average period value (dots) and the 95% confidence interval period values (bars) for different values of (see Figure 13). We did this both for excitation periods distributions across the entire ventricular mass (grey) and for distributions across the ventricular epicardium (red). Comparing the grey and red bars, we see that the period distributions on the epicardial surface were similar to those measured over the entire ventricular mass. We see that the average periods (grey and red dots, respectively) remained approximately equal for all values of, but that the width of the period distributions increased with increased (grey and red bars, respectively). Given the observed temporal variations in excitation period domains and our results on filament locations, we conclude that the increase in complexity of excitation period patterns is primarily caused by the increased number of filaments under increased heterogeneity rather than the increased heterogeneity in anatomically defined APD restitution regions itself.

.")


17 Page 17 of 34 Figure 11: Location of filament voxels (black) for the entire 8 seconds run. Illustrated are short-axis slices mid-way between base-to-apex (left) and one-third of the distance from the base-to-apex (right). Maximum restitution slopes are represented using a pseudo-color spectrum. Figure 12: Average excitation periods for =1 in a time interval between 2-4 seconds of simulation time. LV (left) and RV (right) views are shown. Figure 13: 95% confidence interval period values. Grey bars: minimum and maximum periods found in 95% confidence interval period values for all voxels in the entire ventricular anatomy. Red bars: minimum and maximum period found in 95% confidence interval period values only for the 256 electrode positions on the epicardial surface.
18 Page 18 of 34 Discussion We have used a detailed human ventricular model to study wave organization during VF in the presence of APD restitution heterogeneity. The model contains a detailed description of human ventricular anatomy, fiber direction anisotropy, and the electrophysiological behavior of human ventricular cells. Recent clinical studies by Nash et al. (31) provided APD restitution properties at 256 locations spanning the entire ventricular epicardium for different patients. This study showed that APD restitution slopes are organized into different regions with slopes ranging from 0 to well over 3. We incorporated the clinical data of Nash et al. (31) into our anatomically realistic model of the human ventricles by mapping from the 256 electrode locations to our ventricular geometry and interpolating the projected data using a diffusion based algorithm. Restitution slopes were then fitted by tuning selected parameters of the TNNP model, which were individually specified at each voxel based on the interpolated restitution slopes. For this study, we used datasets of 2 patients: dataset 1 contained regions of shallow and steep restitution slopes, while dataset 2 contained mostly shallow restitution slopes. Thus, the heterogeneity profiles of both datasets were different. Heterogeneities are not necessary to induce VF in the human heart. As reported by Ten Tusscher et al. (48) VF can occur in a homogeneous heart if the slope of the restitution curve is higher than 1.5. In our model, a slope value of 1.8 or higher is necessary to induce VF. This difference in slope value is due to the difference in slope determination method used between Ten Tusscher et al. (48) and this paper (see methods). Note, that the minimum slope value necessary to induce VF in a homogeneous heart is substantially higher than the value of 1, predicted from the original restitution hypothesis. As shown by Cherry and Fenton (5) in a Fenton- Karma model (13) and by Ten Tusscher et al. (49) in the TNNP model, this higher slope value can be explained by electrotonic interactions and CV restitution properties influencing APD alternans. We analyzed the dynamics of filaments during VF, the formation via birth and bifurcations and the disappearance via death and amalgamation, and the duration of their lifespan. We found that most rotors were short lived, whereas only a small number of long lived rotors were present during VF. This is in agreement with the findings of (48) and experimental observations on epicardially manifested rotors in animal hearts (21, 43, 43). We found that APD restitution heterogeneity is not only important for the initiation of wavebreak and re-entry (6, 9), but also affects the number of filaments during VF. We found that an increased level of APD restitution slope heterogeneity leads to more filaments and a broader and more dynamical distribution of excitation periods. We conclude that there is an interplay between the dynamical organization and complexity of VF, and the underlying APD restitution heterogeneity. Furthermore, our results are consistent with the notion that the increase in wavebreaks caused by increasing heterogeneity () is predominantly due to the presence of larger areas with steep restitution slope, rather than increased gradients in restitution slope or APD. However, we do not exclude that other factors such as geometric effects, anisotropy or more pronounced APD gradients potentially play a role in wave break formation. Finally, we found that the number of epicardial PSs correlated well with the total
19 Page 19 of 34 number of filaments, and that distribution of epicardial excitation periods, provides a good estimate of the period distribution within the entire ventricular mass. Limitations Clinical data were only available for the epicardial surface of the ventricles. There was no information on restitution properties in the mid-myocardium nor endocardium. To overcome this, the epicardial restitution slope data was extrapolated across the entire ventricular walls using a diffusion based algorithm. Note that a variety of interpolation schemes could have been used to achieve a similar degree of variation. The use of different parameters in our diffusion algorithm may lead to different gradients in slope values for the same set of clinical data. It remains to be investigated how these different heterogeneity profiles with different slope gradients affect the results presented in this study. Other heterogeneities such as epi-, endocardial and M-cells, Purkinje fibers, laminar sheets and disease conditions (such as fibrosis and gap junction remodeling) were not taken into account in our model and may also contribute to the complexity of excitation patterns during VF. It should be noted that the mapping of the TNNP model parameters to the restitution slope values that we used is not unique, and that the same slopes may likely be obtained using other combinations of parameter settings. However, we believe that this non-uniqueness should not qualitatively affect the results of our study, as it is the slope of the restitution curve that is the main determinant of the instabilities in our model. Another limitation is that TNNP model used in our study does not reproduce calcium driven alternans (38, 46, 47), which is an additional source of instability that can lead to VF. Acknowledgments The authors would like to thank Dr. R. Clayton for his valuable comments. This research was funded by the Netherlands Organization for Scientific Research (NWO grant number ). M.P.N. is supported by the Marsden Fund Council from New Zealand government funding, administered by the Royal Society of New Zealand. References 1. R.R. Aliev and A.V. Panfilov. A simple two-variable model of cardiac excitation. Chaos, Solitons and Fractals, 7: , I. Banville, N. Chattipakorn, and R.A. Gray. Restitution dynamics during pacing and arrhythmias in isolated pig hearts. J. Cardiovasc. Electrophysiol., 15: , I. Banville and R.A. Gray. Effect of action potential duration and conduction velocity restitution and their spatial dispersion on alternans and the stability of arrhythmias. J. Cardiovasc. Electrophysiol., 13: , G.W. Beeler and H.J. Reuter. Reconstruction of the action potential of ventricular myocardial fibers. J. Physiol., 268: , E. M. Cherry and F. Fenton. Suppression of alternans and conduction blocks despite steep APD restitution: electrotonic, memory, and conduction velocity restitution effects. Am. J. Physiol., 286:H2332 H2341, R.H. Clayton and Holden A.V. Dispersion of cardiac action potential duration and the initiation of re-entry: A computational study. Biomed. Eng. Online, 4(11):1 15, R.H. Clayton and A.V. Holden. A method to quantify the dynamics and complexity of re-entry in
20 Page 20 of 34 computational models of ventricular fibrillation. Phys. Med. Biol., 47: , R.H. Clayton, A. Murray and R.W. Campbell. Objective features of the surface electrocardiogram during ventricular tachyarrhythmias. Eur. Heart J., 16: , R.H. Clayton and P. Taggart. Regional differences in APD restitution can initiate wavebreak and re-entry in cardiac tissue: A computational study. Biomed. Eng. Online, 4(54):1 14, R.H. Clayton, E.A. Zhuchkova and A.V. Panfilov. Phase singularities and filaments: Simplifying complexity in computational models of ventricular fibrillation. Prog Biophys Mol Biol., 90: , S.Compton. Ventricular tachycardia [online], emedicine, J.M. Davidenko, A.M. Pertsov, R. Salomonsz, W. Baxter and J. Jalife. Stationary and drifting spiral waves of excitation in isolated cardiac muscle. Nature, 355: , F. Fenton and A. Karma. Vortex dynamics in three-dimensional continuous myocardium with fiber rotation: filament instability and fibrillation. Chaos, 8:20 47, S.D. Girouard, J.M. Pastore, K.R. Laurita, K.W. Gregory and D.S. Rosenbaum. Optical mapping in a new guinea pig model of ventricular tachycardia reveals mechanisms for multiple wavelengths in a single reentrant circuit. Circulation, 93: , R.A. Gray, A.M. Pertsov and J. Jalife. Spatial and temporal organization during cardiac fibrillation. Nature, 392:75 78, M.R. Guevara, A. Ward, A. Shrier and L. Glass. Electrical alternans and period doubling bifurcations. IEEE Comp. Cardiol., 562: , C.W. Haws and R.L Lux. Correlation between in vivo transmembrane action potential durations and activation-recovery intervals from electrograms. Effects of interventions that alter repolarization time. Circulation, 81(1):281 88, R. Hren. A realistic model of the human ventricular myocardium: Application of the study of ectopic activation. PhD thesis, Dalhouse University, Halifax, J. Huang, J.M. Rogers, C.R. Killingsworth, K.P. Sting, W.M. Smith and R. Ideker. Evolution of activation patterns during long-duration ventricular fibrillation in dogs. Am J Physiol. Heart Circ. Physiol., 101:H , H.J. Jongsma and R. Wilders. Gap junctions in cardiovascular disease. Circ. Res., 86: , M.W. Kay, G.P. Walcott, J.D. Gladden, S.B. Melnick, and J.M. Rogers. Lifetimes of epicardial rotors in panoramic optical maps of fibrillating swine ventricles. Am. J. Physiol., 291(4):H , J. Keener and J. Sneyd. Mathematical physiology. Springer-Verlag, New York, Heidelberg, Berlin, V.I. Krinsky. Spread of excitation in an inhomogeneous medium (state similar to cardiac fibrillation). Biophysics, 11: , C.H. Luo and Y. Rudy. A model of the ventricular cardiac action potential. Depolarization, repolarization, and their interaction. Circ. Res., 68: , C.H. Luo and Y. Rudy. A dynamic model of the cardiac ventricular action potential. I. Simulations of ionic currents and concentration changes. Circ. Res., 74: , S. Masse, E. Downar, V.S. Chauhan, E. Sevaptsidis and K. Nanthakumar. Ventricular fibrillation in myopathic human hearts: Mechanistic insights from in-vivo global endocardial and epicardial mapping. Am. J. Physiol., 292(6):H , G. K. Moe, W. C. Rheinbolt and J. A. Abildskov. A computer model of atrial fibrillation. Am. Heart J., 67: , J. Moreno, A.V., Zaitsev, M. Warren, O. Berenfeld, J. Kalifa, E. Lucca, S. Mironov, Guha. P. and J. Jalife. Effect of remodelling, stretch and ischaemia on ventricular fibrillation frequency and dynamics in a heart failure model. J. Cardiovas. Res., 65: , J.M. Morgan, D. Cunningham, and E. Rowland. Dispersion of monophasic action potential duration: demonstrable in humans after premature ventricular extrasimulation but not in steady state. J. Am. Coll. Cardiol., 19: , K. Nanthakumar, G.P. Walcott, S. Melnick, J.M. Rogers, M.W. Kay, W.M. Smith, R.E. Ideker, and W. Holman. Epicardial organization of human ventricular fibrillation. Heart Rhythm, 1:14 23, M.P. Nash, C.P. Bradley, P.M. Sutton, R.H. Clayton, P. Kallis, M.P. Hayward, D.J. Paterson, and P. Taggart. Whole heart action potential duration restitution properties in cardiac patients: a combined clinical and modelling study. Exp. Physiol., 91(2):339 54, M.P. Nash, A. Mourad, R.H. Clayton, P.M. Sutton, C.P. Bradley, M. Hayward, D.J. Paterson and P. Taggart. Evidence for multiple mechanisms in human ventricular fibrillation. Circulation, 114(6):536 42, 2006.
21 Page 21 of J.B. Nolasco and R.W. Dahlen. A graphic method for the study of alternation in cardiac action potentials. J. Appl. Physiol., 25: , A.V. Panfilov. Three-dimensional organization of electrical turbulence in the heart. Phys. Rev. E, 59:R6251 R6254, A.V. Panfilov and A.V. Holden. Self-generation of turbulent vortices in a two-dimensional model of cardiac tissue. Phys. Lett. A, 147: , A.V. Panfilov and A. M. Pertsov. Ventricular fibrillation: evolution of the multiple wavelet hypothesis. Phil. Trans. R. Soc. Lond. A., 359: , R. Plonsey and R.C. Barr. Bioelectricity. Plenum Publishing Corporation, NY, R.P. Pruvot, E.J. Katra, D.S. Rosenbaum and K.R. Kaurita. Role of calcium cycling versus restitution in the mechanism of repolarization alternans. Circ. Res., 94: , Z. Qu, A. Garfinkel, P.S. Chen, and J.N. Weiss. Mechanisms of discordant alternans and induction of reentry in simulated cardiac tissue. Circulation, 102(14): , Z. Qu and J.N. Weiss. The chicken or the egg? Voltage and calcium dynamics in the heart. Am. J. Physiol., page Epub ahead of print, Z. Qu, J.N. Weiss, and A. Garfinkel. Cardiac electrical restitution properties and stability of reentrant spiral waves: a simulation study. Am. J. Physiol., 276:H269 H283, J. Rogers. Combined phase singularity and wavefront analysis for optical maps of ventricular fibrillation. IEEE Trans. Biomed. Eng., 92:56 65, J. Rogers, J. Huang, S.B. Melnick, and R.E. Ideker. Sustained reentry in the left ventricle of fibrillating pig hearts. Circ. Res., 92: , J. Rogers, J. Huang, W.M. Smith and R.E. Ideker. Incidence, evolution and spatial distribution of functional reentry during ventricular fibrillation in pigs. Circ. Res., 84: , S. Rush and H. Larsen. A practical algorithm for solving dynamic membrane equations. IEEE Trans. Biomed. Eng., 25: , Y. Shiferaw, M.A. Watanabe, A. Garfinkel, J.N. Weiss, and A. Karma. Model of intracellular calcium cycling in ventricular myocytes. Biophys. J., 85: , W. Shimizu and C. Antzelevitch. Cellular and ionic basis for t-wave alternans under long-qt condi tions. Circulation, 99: , K.H. Ten Tusscher, R. Hren and A.V. Panfilov. Organization of ventricular fibrillation in the human heart. Circ. Res., 100(12):e87 101, K.H. Ten Tusscher and A.V. Panfilov. Alternans and spiral breakup in a human ventricular tissue model. Am. J. Physiol. Heart Circ. Physiol., 291(3):H , K.H.W.J. Ten Tusscher, D. Noble, P.J. Noble and A.V. Panfilov. A model for human ventricular tissue. Am. J. Physiol. Heart Circ. Physiol., 286:H1573 H1589, M. Valderrabano, P. Chen, and S.F. Lin. Spatial distribution of phase singularities in ventricular fibrillation. Circulation, 108: , J.N. Weiss, A. Garfinkel, H.S. Karagueuzian, Z. Qu and P.S. Chen. Chaos and the transition to ventricular fibrillation: a new approach to antiarrhythmic drug evaluation. Circulation, 99(21): , J.N. Weiss, A. Karma, Y. Shiferaw, P.S. Chen, A. Garfinkel and Z. Qu. From pulsus to pulseless: the saga of cardiac alternans. Circ. Res., 98(10): , F.X. Witkowski, L.J. Leon, P.A. Penkoske, W.R. Giles, M.L. Spano, E.L. Ditto, and A.T. Winfree. Spatiotemporal evolution of ventricular fibrillation. Nature, 392:78 82, T. Wu, S. Lin, J.N. Weiss, C. Ting, and P. Chen. Two types of ventricular fibrillation in isolated rabbit hearts. Circulation, 106: , T.J. Wu, J.J.C. Ong, C. Hwang, J.J. Lee, M.C. Fishbein, L. Czer, A. Tento, C. Blanche, R.M. Kass, W.J. Mandel, H.S. Karagueuzuan and P. Chen. Characteristics of wave fronts during ventricular fibrillation in human hearts with dilated cardiomyopathy: Role of increased fibrosis on the generation of reentry. J. Am. Coll. Cardiol., 32: , F. Xie, Z. Qu, A. Garfinkel and J.N. Weiss. Electrophysiological heterogeneity and stability of reentry in simulated cardiac tissue. Am. J. Physiol., 280:H535 H545, A.M. Yue, M.R. Franz, P.R. Roberts, and J.M. Morgan. Global endocardial electrical restitution in human right and left ventricles determined by noncontact mapping. J. Am. Coll. Cardiol., 46(6): , M.E.Zevitz. Ventricular fibrillation [online], emedicine,


22 Dataset 2 Dataset 1 Linear interpolation +Diffusion +Linear Transformation Page 22 of 34
23 Page 23 of 34


24 Dataset 1 LV RV Anterior Posterior Page 24 of 34 Dataset 2
25 Page 25 of 34
26 Page 26 of 34
27 Page 27 of 34
28 Page 28 of 34

29 Page 29 of 34
Organization of ventricular fibrillation in the human heart: experiments and models
 Exp Physiol 94.5 pp 553 562 553 Experimental Physiology Research Paper Organization of ventricular fibrillation in the human heart: experiments and models K. H. W. J. ten Tusscher 1,A.Mourad 2,M.P.Nash
Systems Biology Across Scales: A Personal View XXVII. Waves in Biology: Cardiac Arrhythmia. Sitabhra Sinha IMSc Chennai
 Systems Biology Across Scales: A Personal View XXVII. Waves in Biology: Cardiac Arrhythmia Sitabhra Sinha IMSc Chennai The functional importance of biological waves Spiral Waves Cardiac Arrhythmias Arrhythmias:
This is a repository copy of Filament behavior in a computational model of ventricular fibrillation in the canine heart.
 This is a repository copy of Filament behavior in a computational model of ventricular fibrillation in the canine heart. White Rose Research Online URL for this paper: http://eprints.whiterose.ac.uk/8741/
Alternans and spiral breakup in a human ventricular tissue model
 Alternans and spiral breakup in a human ventricular tissue model K. H. W. J. ten Tusscher and A. V. Panfilov Am J Physiol Heart Circ Physiol 291:H1088-H1100, 2006. First published 24 March 2006; doi: 10.1152/ajpheart.00109.2006
Short-Term Memory and Restitution During Ventricular Fibrillation in Human Hearts An In Vivo Study
 Short-Term Memory and Restitution During Ventricular Fibrillation in Human Hearts An In Vivo Study Satish C. Toal, MD; Talha A. Farid, MD; Raja Selvaraj, MD; Vijay S. Chauhan, MD; Stephane Masse, MASc;
Shock-induced termination of cardiac arrhythmias
 Shock-induced termination of cardiac arrhythmias Group members: Baltazar Chavez-Diaz, Chen Jiang, Sarah Schwenck, Weide Wang, and Jinglei Zhang Cardiac arrhythmias, also known as irregular heartbeat, occur
Effect of Global Cardiac Ischemia on Human Ventricular Fibrillation: Insights from a Multi-scale Mechanistic Model of the Human Heart
 Effect of Global Cardiac Ischemia on Human Ventricular Fibrillation: Insights from a Multi-scale Mechanistic Model of the Human Heart Ivan V. Kazbanov 1, Richard H. Clayton 2,3, Martyn P. Nash 4,5, Chris
Shock-induced termination of cardiac arrhythmias
 Shock-induced termination of cardiac arrhythmias Group members: Baltazar Chavez-Diaz, Chen Jiang, Sarah Schwenck, Weide Wang, and Jinglei Zhang Abstract: Cardiac arrhythmias occur when blood flow to the
A tale of two dogs: analyzing two models of canine ventricular electrophysiology
 Am J Physiol Heart Circ Physiol 292: H43 H55, 2007. First published September 22, 2006; doi:10.1152/ajpheart.00955.2006. CALL FOR PAPERS Computational Analyses in Ion Channelopathies A tale of two dogs:
A Dynamic model of Pulmonary Vein Electrophysiology. Harry Green 2 nd year Ph.D. student University of Exeter
 A Dynamic model of Pulmonary Vein Electrophysiology Harry Green 2 nd year Ph.D. student University of Exeter Background to the Project Cardiac disease is the leading cause of death in most developed countries
Death, dynamics and disorder: Terminating reentry in excitable media by dynamically-induced inhomogeneities
 PRAMANA c Indian Academy of Sciences Vol. 64, No. 4 journal of April 2005 physics pp. 553 562 Death, dynamics and disorder: Terminating reentry in excitable media by dynamically-induced inhomogeneities
A simulation study of the effects of cardiac anatomy in ventricular fibrillation
 Research article Related Commentary, page 662 A simulation study of the effects of cardiac anatomy in ventricular fibrillation Fagen Xie, Zhilin Qu, Junzhong Yang, Ali Baher, James N. Weiss, and Alan Garfinkel
The Journal of Physiology
 J Physiol 590.18 (2012) pp 4515 4535 4515 The role of fine-scale anatomical structure in the dynamics of reentry in computational models of the rabbit ventricles Martin J. Bishop 1 and Gernot Plank 2,3
Wavelets, Wavebreaks and Ventricular Fibrillation
 Wavelets, Wavebreaks and Ventricular Fibrillation Guy Salama University of Pittsburgh Supported by NIH RO1 HL70722, HL57929 and HL69097 and the Middle Atlantic American Heart Association Mechanisms Underlying
A Mechanism of Transition From Ventricular Fibrillation to Tachycardia. Effect of Calcium Channel Blockade on the Dynamics of Rotating Waves
 A Mechanism of Transition From Ventricular Fibrillation to Tachycardia Effect of Calcium Channel Blockade on the Dynamics of Rotating Waves Faramarz H. Samie,* Ravi Mandapati,* Richard A. Gray, Yoshio
The Effect of Ischaemic Region Shape on ST Potentials using a Half-Ellipsoid Model of the Left Ventricle
 The Effect of Ischaemic Region Shape on ST Potentials using a Half-Ellipsoid Model of the Left Ventricle Author Barnes, Josef, Johnston, Peter Published 2012 Conference Title Computing in Cardiology (CinC)
Simulation of T-Wave Alternans and its Relation to the Duration of Ventricular Action Potentials Disturbance
 The Open Pacing, Electrophysiology & Therapy Journal, 2010, 3, 21-27 21 Open Access Simulation of T-Wave Alternans and its Relation to the Duration of Ventricular Action Potentials Disturbance Dariusz
A MODEL OF GAP JUNCTION CONDUCTANCE AND VENTRICULAR TACHYARRHYTHMIA
 A MODEL OF GAP JUNCTION CONDUCTANCE AND VENTRICULAR TACHYARRHYTHMIA X. D. Wu, Y. L. Shen, J. L. Bao, C. M. Cao, W. H. Xu, Q. Xia Department of Physiology, Zhejiang University School of Medicine, Hangzhou,
Recent work has suggested that ventricular fibrillation
 Integrative Physiology Sustained Reentry in the Left Ventricle of Fibrillating Pig Hearts Jack M. Rogers, Jian Huang, Sharon B. Melnick, Raymond E. Ideker Abstract It has been proposed that ventricular
An activation-repolarization time metric to predict localized regions of high susceptibility to reentry
 An activation-repolarization time metric to predict localized regions of high susceptibility to reentry Nicholas Child, Martin J. Bishop, Ben Hanson, Ruben Coronel, Tobias Opthof, Bastiaan J. Boukens,
Michiyasu Yamaki. Yamagata Journal of Health Sciences, Vol. 16, 2013
 Yamagata Journal of Health Sciences, Vol. 16, 2013 Michiyasu Yamaki Abstract The mechanism of arrhythmogenicity in heart failure remains poorly understood. We examined the relationship between electrical
Modeling of Anatomy, Electrophysiology and Tension Development in the Human Heart
 European Functional Cardiac Modeling Meeting Modeling of Anatomy, Electrophysiology and Tension Development in the Human Heart Dr.-Ing. Gunnar Seemann Overview Electrophysiology Tension development Anatomy
Arrhythmias By Dimension or Heart Attacks can give you Mathematics
 Arrhythmias By Dimension or Heart Attacks can give you Mathematics J. P. Keener Mathematics Department Arrhythmias By DimensionorHeart Attacks can give you Mathematics p.1/26 The Medical Problem Sudden
Phase 2 Early Afterdepolarization as a Trigger of Polymorphic Ventricular Tachycardia in Acquired Long-QT Syndrome
 Phase 2 Early Afterdepolarization as a Trigger of Polymorphic Ventricular Tachycardia in Acquired Long-QT Syndrome Direct Evidence From Intracellular Recordings in the Intact Left Ventricular Wall Gan-Xin
Enhanced Cellular Automation Model For Detecting Heart Fibrillation
 Enhanced Cellular Automation Model For Detecting Heart Fibrillation R. Touqan, A. Nasser & N. Hamdy Arab Academy for Science and Technology (AAST), email< rtouqan@hotmail.com Abstract: A new technique
Two forms of spiral-wave reentry in an ionic model of ischemic ventricular myocardium
 CHAOS VOLUME 8, NUMBER 1 MARCH 1998 Two forms of spiral-wave reentry in an ionic model of ischemic ventricular myocardium Aoxiang Xu and Michael R. Guevara Department of Physiology and Centre for Nonlinear
The Interaction of Activation-Repolarisation Coupling and Restitution
 CIRCULATIONAHA/2008/785352 1 The Interaction of Activation-Repolarisation Coupling and Restitution Properties in Humans Ben Hanson 1, PhD, Peter Sutton 2, PhD, Nasser Elameri 3, Marcus Gray 4, PhD, Hugo
PART I. Disorders of the Heart Rhythm: Basic Principles
 PART I Disorders of the Heart Rhythm: Basic Principles FET01.indd 1 1/11/06 9:53:05 AM FET01.indd 2 1/11/06 9:53:06 AM CHAPTER 1 The Cardiac Electrical System The heart spontaneously generates electrical
Ventricular fibrillation (VF) is the most common cause
 is the most common cause") Basic Science for Clinicians The Dynamics of Cardiac Fibrillation James N. Weiss, MD; Zhilin Qu, PhD; Peng-Sheng Chen, MD; Shien-Fong Lin, PhD; Hrayr S. Karagueuzian, PhD; Hideki Hayashi, MD, PhD; Alan
Basic Science for Clinicians The Dynamics of Cardiac Fibrillation James N. Weiss, MD; Zhilin Qu, PhD; Peng-Sheng Chen, MD; Shien-Fong Lin, PhD; Hrayr S. Karagueuzian, PhD; Hideki Hayashi, MD, PhD; Alan
Ventricular fibrillation (VF) had been traditionally
 had been traditionally") UltraRapid Communication The Distribution of Refractory Periods Influences the Dynamics of Ventricular Fibrillation Bum-Rak Choi, Tong Liu, Guy Salama Abstract The spatial and dynamic properties of ventricular
UltraRapid Communication The Distribution of Refractory Periods Influences the Dynamics of Ventricular Fibrillation Bum-Rak Choi, Tong Liu, Guy Salama Abstract The spatial and dynamic properties of ventricular
Altered Dynamics of Action Potential Restitution and Alternans in Humans With Structural Heart Disease
 Altered Dynamics of Action Potential Restitution and Alternans in Humans With Structural Heart Disease Marcus L. Koller, MD; Sebastian K.G. Maier, MD; Anna R. Gelzer, DVM; Wolfgang R. Bauer, MD, PhD; M.
Despite impressive recent advances in antiarrhythmic
 Current Perspective Chaos and the Transition to Ventricular Fibrillation A New Approach to Antiarrhythmic Drug Evaluation James N. Weiss, MD; Alan Garfinkel, PhD; Hrayr S. Karagueuzian, PhD; Zhilin Qu,
University of Bristol - Explore Bristol Research. Publisher's PDF, also known as Version of record
 Adeniran, I., McPate, M. J. W., Witchel, H. J., Hancox, J. C., & Zhang, H. (2011). Increased vulnerability of human ventricle to re-entrant excitation in herg-linked variant 1 short QT syndrome. PLoS Computational
Substantial evidence links enhanced sympathetic activity
 Effect of Adrenergic Stimulation on Action Potential Duration Restitution in Humans Peter Taggart, MD, DSc, FRCP; Peter Sutton, PhD; Zaid Chalabi, PhD; Mark R. Boyett, PhD; Ron Simon, BSc, MBBS, MRCP;
Cardiac Arrhythmia Mapping!
 Cardiac Arrhythmia Mapping! Challenges and Opportunities" Derek J. Dosdall, Ph.D. 22 October, 2010 OUTLINE!! Historical perspective! Current mapping techniques!optical mapping!electrical mapping (Purkinje
ECGSIM; AN INTERACTIVE TOOL FOR STUDYING THE GENESIS OF QRST WAVEFORMS
 ECGSIM; AN INTERACTIVE TOOL FOR STUDYING THE GENESIS OF QRST WAVEFORMS A. van Oosterom, PhD. Professor of Medical Physics Department of Medical Physics; University of Nijmegen; The Netherlands T.F. Oostendorp,
ARTICLE IN PRESS. Journal of Theoretical Biology
 Journal of Theoretical Biology ] (]]]]) ]]] ]]] Contents lists available at ScienceDirect Journal of Theoretical Biology journal homepage: www.elsevier.com/locate/yjtbi Minimal model for human ventricular
798 Biophysical Journal Volume 96 February
 798 iophysical Journal Volume 96 February 2009 798 817 Mechanisms of Transition from Normal to Reentrant Electrical ctivity in a Model of Rabbit trial Tissue Interaction of Tissue Heterogeneity and nisotropy
Dispersion of myocardial repolarization results in regional
 Imaging Dispersion of Myocardial Repolarization, II Noninvasive Reconstruction of Epicardial Measures Raja N. Ghanem, MS; John E. Burnes, PhD; Albert L. Waldo, MD; Yoram Rudy, PhD Background Dispersion
Clinical and Electrocardiographic Characteristics of Patients with Brugada Syndrome: Report of Five Cases of Documented Ventricular Fibrillation
 J Arrhythmia Vol 25 No 1 2009 Original Article Clinical and Electrocardiographic Characteristics of Patients with Brugada Syndrome: Report of Five Cases of Documented Ventricular Fibrillation Seiji Takashio
CASE 10. What would the ST segment of this ECG look like? On which leads would you see this ST segment change? What does the T wave represent?
 CASE 10 A 57-year-old man presents to the emergency center with complaints of chest pain with radiation to the left arm and jaw. He reports feeling anxious, diaphoretic, and short of breath. His past history
Review. Three-Dimensional Impulse Propagation in Myocardium: Arrhythmogenic Mechanisms at the Tissue Level [Circ Res. 2013;112:
 Review This article is part of a new thematic series on Computational Approaches to Cardiac Arrhythmias: Translation Into Diagnostics and Therapy, which includes the following articles: Introduction to
Microstructural Basis of Conduction II Introduction to Experimental Studies
 Bioeng 6460 Electrophysiology and Bioelectricity Microstructural Basis of Conduction II Introduction to Experimental Studies Frank B. Sachse fs@cvrti.utah.edu Overview Microstructural Basis of Conduction
Vulnerable windows define susceptibility to alternans and spatial discordance
 Am J Physiol Heart Circ Physiol 298: H1727 H1737, 2010. First published April 2, 2010; doi:10.1152/ajpheart.01036.2009. Vulnerable windows define susceptibility to alternans and spatial discordance Seth
Modelling of the ventricular conduction system
 Progress in Biophysics and Molecular Biology 96 (2008) 152 170 www.elsevier.com/locate/pbiomolbio Review Modelling of the ventricular conduction system K.H.W.J. Ten Tusscher, A.V. Panfilov Department of
A Cellular Automata Model For Dynamics and Control of Cardiac Arrhythmias DANNY GALLENBERGER (CARROLL UNIVERSITY) XIAOPENG ZHAO (UTK) KWAI WONG (UTK)
 XIAOPENG ZHAO (UTK) KWAI WONG (UTK)") A Cellular Automata Model For Dynamics and Control of Cardiac Arrhythmias DANNY GALLENBERGER (CARROLL UNIVERSITY) XIAOPENG ZHAO (UTK) KWAI WONG (UTK) Introduction Sudden cardiac arrest is responsible for
A Cellular Automata Model For Dynamics and Control of Cardiac Arrhythmias DANNY GALLENBERGER (CARROLL UNIVERSITY) XIAOPENG ZHAO (UTK) KWAI WONG (UTK) Introduction Sudden cardiac arrest is responsible for
Mathematical modeling of ischemia and infarction
 Mathematical modeling of ischemia and infarction Mostly based on Cimponeriu, Starmer and Bezerianos: A theoretical analysis of acute ischemia and infarction using ECG reconstruction on a 2-D model of myocardium
Dynamic Origin of Spatially Discordant Alternans in Cardiac Tissue
 448 Biophysical Journal Volume 92 January 2007 448 460 Dynamic Origin of Spatially Discordant Alternans in Cardiac Tissue Hideki Hayashi,* Yohannes Shiferaw, y Daisuke Sato, z Motoki Nihei,* Shien-Fong
Chapter 12: Cardiovascular Physiology System Overview
 Chapter 12: Cardiovascular Physiology System Overview Components of the cardiovascular system: Heart Vascular system Blood Figure 12-1 Plasma includes water, ions, proteins, nutrients, hormones, wastes,
Review Article Electrophysiological Mechanisms of Ventricular Fibrillation Induction
 www.ipej.org 43 Review Article Electrophysiological Mechanisms of Ventricular Fibrillation Induction Nipon Chattipakorn, MD, PhD, Kirkwit Shinlapawittayatorn, MD, Siriporn Chattipakorn, PhD. Cardiac Electrophysiology
Modelovanie elektrickej aktivity srdca v prostredí COMSOL Multiphysics
 Modelovanie elektrickej aktivity srdca v prostredí COMSOL Multiphysics (Modeling of the electrical activity of the heart in COMSOL Multiphysics environment) Elena Cocherová PRESENTATION OUTLINE Electrical
Polymorphic ventricular tachycardia (VT) has been reported
 has been reported") Polymorphic Reentrant Ventricular Tachycardia in the Isolated Rabbit Heart Studied by High-Density Mapping Lucas Boersma, MD, PhD; Zoltan Zetelaki, MSc; Josep Brugada, MD, PhD; Maurits Allessie, MD, PhD
Polymorphic Reentrant Ventricular Tachycardia in the Isolated Rabbit Heart Studied by High-Density Mapping Lucas Boersma, MD, PhD; Zoltan Zetelaki, MSc; Josep Brugada, MD, PhD; Maurits Allessie, MD, PhD
Chapter 16: Arrhythmias and Conduction Disturbances
 Complete the following. Chapter 16: Arrhythmias and Conduction Disturbances 1. Cardiac arrhythmias result from abnormal impulse, abnormal impulse, or both mechanisms together. 2. is the ability of certain
Altered regional restitution properties cause ventricular arrhythmia
 International Journal of Bioelectromagnetism Vol. 6, No. 1, pp. xx - xx, 2004 www/ijbem.org Altered regional restitution properties cause ventricular arrhythmia Michiyasu Yamaki a, Tetsu Watanabe b, Koichi
Nonlinear Dynamics of Paced Cardiac Cells
 Nonlinear Dynamics of Paced Cardiac Cells YOHANNES SHIFERAW, a ZHILIN QU, a ALAN GARFINKEL, a ALAIN KARMA, b AND JAMES N. WEISS a,c a Department of Medicine (Cardiology), David Geffen School of Medicine
Global Bi-ventricular endocardial distribution of activation rate during long duration ventricular fibrillation in normal and heart failure canines
 Luo et al. BMC Cardiovascular Disorders (2017) 17:99 DOI 10.1186/s12872-017-0530-5 RESEARCH ARTICLE Open Access Global Bi-ventricular endocardial distribution of activation rate during long duration ventricular
T-Wave Alternans, Restitution of Human Action Potential Duration, and Outcome
 Journal of the American College of Cardiology Vol. 50, No. 25, 2007 2007 by the American College of Cardiology Foundation ISSN 0735-1097/07/$32.00 Published by Elsevier Inc. doi:10.1016/j.jacc.2007.10.011
ENTRAINMENT OF ELECTRICAL ACTIVATION BY SPATIO-TEMPORAL DISTRIBUTED PACING DURING VENTRICULAR FIBRILLATION
 University of Kentucky UKnowledge University of Kentucky Master's Theses Graduate School 2003 ENTRAINMENT OF ELECTRICAL ACTIVATION BY SPATIO-TEMPORAL DISTRIBUTED PACING DURING VENTRICULAR FIBRILLATION
Computer Model of Mechanisms Underlying Dynamic Electrocardiographic T-wave Changes. Ashish Nikhil Doshi
 Computer Model of Mechanisms Underlying Dynamic Electrocardiographic T-wave Changes by Ashish Nikhil Doshi Department of Biomedical Engineering Duke University Date: Approved: Salim F. Idriss, Supervisor
ECG. Prepared by: Dr.Fatima Daoud Reference: Guyton and Hall Textbook of Medical Physiology,12 th edition Chapters: 11,12,13
 ECG Prepared by: Dr.Fatima Daoud Reference: Guyton and Hall Textbook of Medical Physiology,12 th edition Chapters: 11,12,13 The Concept When the cardiac impulse passes through the heart, electrical current
CLINICAL INVESTIGATIONS. Methods
 CLINICAL INVESTIGATIONS Jpn Circ J 2001; 65: 702 706 Correlation Between the Effective Refractory Period and Activation-Recovery Interval Calculated From the Intracardiac Unipolar Electrogram of Humans
Chapter 5 Computer Modeling and Experiments of Electrical Dynamics in Atrial. Fibrillation
 Chapter 5 Computer Modeling and Experiments of Electrical Dynamics in Atrial Fibrillation Atrial Fibrillation (AF) is a common cardiac arrhythmia that affects more than 5 million Americans. The impact
Elizabeth M. Cherry Curriculum Vitae
 Elizabeth M. Cherry Curriculum Vitae Department of Biomedical Sciences Phone: 607-253-3075 T7 012C Veterinary Research Tower Fax: 607-253-3851 College of Veterinary Medicine Email: elizabeth.m.cherry@cornell.edu
Stretching Cardiac Myocytes: A Finite Element Model of Cardiac Tissue
 Megan McCain ES240 FEM Final Project December 19, 2006 Stretching Cardiac Myocytes: A Finite Element Model of Cardiac Tissue Cardiac myocytes are the cells that constitute the working muscle of the heart.
Modeling Chaos in the Heart
 Modeling Chaos in the Heart S. M. Haider Aejaz haider_aejaz@yahoo.com PIMCS, Lahore, Pakistan Abstract: Chaos theory describes the dynamics of a deterministic system whose dynamics show extreme dependence
Epicardio Simulation. Introductory Guide
 Epicardio Simulation Introductory Guide Introduction Epicardio Simulation is a fully validated advanced cloud-based 3D interactive real-time simulation of the heart that shortens the Cardiology learning
Effects of Pericardial Effusates of Various Conductivities on Body-Surface Potentials in Dogs
 788 Effects of Pericardial Effusates of Various Conductivities on Body-Surface Potentials in Dogs Documentation of the Eccentric Spheres Model Daniel A. Kramer, Robert L. Hamlin, and Herman R. Weed From
Computational Modeling of the Cardiovascular System
 ibiomep - International Doctoral Programme in Biomedical Engineering and Medical Physics Computational Modeling of the Cardiovascular System Microstructural Basis of Conduction Introduction to Functional
PCA Enhanced Kalman Filter for ECG Denoising
 IOSR Journal of Electronics & Communication Engineering (IOSR-JECE) ISSN(e) : 2278-1684 ISSN(p) : 2320-334X, PP 06-13 www.iosrjournals.org PCA Enhanced Kalman Filter for ECG Denoising Febina Ikbal 1, Prof.M.Mathurakani
Delayed Success in Termination of Three-Dimensional Reentry: Role of Surface Polarization
 S257 Delayed Success in Termination of Three-Dimensional Reentry: Role of Surface Polarization CHRISTIAN ZEMLIN, PH.D., SERGEY MIRONOV, PH.D., and ARKADY PERTSOV, PH.D. From the Department of Pharmacology,
SPATIO-TEMPORAL VARIATION IN ACTIVATION INTERVALS DURING VENTRICULAR FIBRILLATION
 University of Kentucky UKnowledge University of Kentucky Doctoral Dissertations Graduate School 2002 SPATIO-TEMPORAL VARIATION IN ACTIVATION INTERVALS DURING VENTRICULAR FIBRILLATION Sachin Anil Moghe
MULTILEAD SIGNAL PREPROCESSING BY LINEAR TRANSFORMATION
 MULTILEAD SIGNAL PREPROCESSING BY LINEAR TRANSFORMATION TO DERIVE AN ECG LEAD WHERE THE ATYPICAL BEATS ARE ENHANCED Chavdar Lev Levkov Signa Cor Laboratory, Sofia, Bulgaria, info@signacor.com ECG signal
Effect of an increase in coronary perfusion on transmural. ventricular repolarization
 Effect of an increase in coronary perfusion on transmural ventricular repolarization Yan-Zhou Zhang 1, MD, PhD, Ben He 1, MD, Le-Xin Wang 2, MD, PhD. From: 1 Department of Cardiology, Renji Hospital, Medical
Στροφείς (rotors) και πραγματικότητα. Χάρης Κοσσυβάκης Επιμελητής A Καρδιολογικό Τμήμα Γ.Ν.Α. «Γ. ΓΕΝΝΗΜΑΤΑΣ»
 και πραγματικότητα. Χάρης Κοσσυβάκης Επιμελητής A Καρδιολογικό Τμήμα Γ.Ν.Α. «Γ. ΓΕΝΝΗΜΑΤΑΣ»") Στροφείς (rotors) και πραγματικότητα. Χάρης Κοσσυβάκης Επιμελητής A Καρδιολογικό Τμήμα Γ.Ν.Α. «Γ. ΓΕΝΝΗΜΑΤΑΣ» Mechanisms that sustain Atrial Fibrillation multiwavelet hypothesis, since 1964 a critical
Στροφείς (rotors) και πραγματικότητα. Χάρης Κοσσυβάκης Επιμελητής A Καρδιολογικό Τμήμα Γ.Ν.Α. «Γ. ΓΕΝΝΗΜΑΤΑΣ» Mechanisms that sustain Atrial Fibrillation multiwavelet hypothesis, since 1964 a critical
This is a repository copy of Self-terminating re-entrant cardiac arrhythmias: quantitative characterization.
 This is a repository copy of Self-terminating re-entrant cardiac arrhythmias: quantitative characterization. White Rose Research Online URL for this paper: http://eprints.whiterose.ac.uk/90285/ Version:
ECG and Cardiac Electrophysiology
 ECG and Cardiac Electrophysiology Simon Some very basic electrophysiology Intracellular fluid: 10 mm Na, 140 mm K, etc. K Na-K ATPase Extracellular fluid: 140mM Na, 4mM K, etc. Na Ion gradient plus selective
Effect of an Increase in Coronary Perfusion on Transmural Ventricular Repolarization
 Physiol. Res. 56: 285-290, 2007 Effect of an Increase in Coronary Perfusion on Transmural Ventricular Repolarization Y.-Z. ZHANG 1, B. HE 1, L.-X. WANG 2 1 Department of Cardiology, Renji Hospital, Medical
Spatio-temporal Evolution and Prediction of Action Potential Duration and Calcium Alternans in the Heart
 Spatio-temporal Evolution and Prediction of Action Potential Duration and Calcium Alternans in the Heart Elena G. Tolkacheva Department of Biomedical Engineering University of Minnesota, USA Ramjay Visweswaran
Journal of Chemical and Pharmaceutical Sciences Print ISSN: Abnormal Calcium Channels: Role on Generation of ST Segment Depression, T-wave
 Abnormal Calcium Channels: Role on Generation of ST Segment Depression, T-wave Alternant and T- wave Inversion A Computational Study Gulothungan G*, Malathi R Department of Electronics and Instrumentation
V. TACHYCARDIAS Rapid rhythm abnormalities
 V. TACHYCARDIAS Rapid rhythm abnormalities Tachyarrhythmias currently account for up to 350,000 deaths annually in the US. In addition to these clearly dangerous rhythm disturbances, other forms of more
The Visible Man Dataset in Medical Education: Electrophysiology of the Human Heart
 The Visible Man Dataset in Medical Education: Electrophysiology of the Human Heart C. D. Werner, F. B. Sachse, C. Baltes, O. Dössel cw@ibt.etec.uni-karlsruhe.de Institut für Biomedizinische Technik, Universität
Cardiac physiology. b. myocardium -- cardiac muscle and fibrous skeleton of heart
 I. Heart anatomy -- general gross. A. Size/orientation - base/apex B. Coverings D. Chambers 1. parietal pericardium 2. visceral pericardium 3. Layers of heart wall a. epicardium Cardiac physiology b. myocardium
Sudden cardiac death: Primary and secondary prevention
 Sudden cardiac death: Primary and secondary prevention By Kai Chi Chan Penultimate Year Medical Student St George s University of London at UNic Sheba Medical Centre Definition Sudden cardiac arrest (SCA)
Mechanisms of destabilization and early termination of spiral wave reentry in the ventricle by a class III antiarrhythmic agent, nifekalant
 Am J Physiol Heart Circ Physiol 292: H539 H548, 2007. First published August 25, 2006; doi:10.1152/ajpheart.00640.2006. Mechanisms of destabilization and early termination of spiral wave reentry in the
This presentation will deal with the basics of ECG description as well as the physiological basics of
 Snímka 1 Electrocardiography basics This presentation will deal with the basics of ECG description as well as the physiological basics of Snímka 2 Lecture overview 1. Cardiac conduction system functional
for Heart-Health Scanning
 Magnetocardiography for Heart-Health Scanning CardioMag Imaging, Inc. 1 Basic Principles of Magnetocardiography (MCG) The cardiac electric activity that produces a voltage difference on the body surface
Title. CitationJournal of Electrocardiology, 43(5): Issue Date Doc URL. Type. File Information.
: Issue Date Doc URL. Type. File Information.") Title Pleomorphic ventricular tachycardia originating from Author(s)Yokoshiki, Hisashi; Mitsuyama, Hirofumi; Watanabe, M CitationJournal of Electrocardiology, 43(5): 452-458 Issue Date 2010-09 Doc URL
Title Pleomorphic ventricular tachycardia originating from Author(s)Yokoshiki, Hisashi; Mitsuyama, Hirofumi; Watanabe, M CitationJournal of Electrocardiology, 43(5): 452-458 Issue Date 2010-09 Doc URL
Step by step approach to EKG rhythm interpretation:
 Sinus Rhythms Normal sinus arrhythmia Small, slow variation of the R-R interval i.e. variation of the normal sinus heart rate with respiration, etc. Sinus Tachycardia Defined as sinus rhythm with a rate
Spiral wave dynamics and ventricular arrhythmias
 Spiral wave dynamics and ventricular arrhythmias Dit proefschrift kan ook worden bekeken op internet: http://www-binf.bio.uu.nl/khwjtuss/phdthesis Op dit webadres staat niet alleen de tekst van het proefschrift,
Simulating the Effect of Global Cardiac Ischaemia on the Dynamics of Ventricular Arrhythmias in the Human Heart
 Simulating the Effect of Global Cardiac Ischaemia on the Dynamics of Ventricular Arrhythmias in the Human Heart Mitra Abbasi Department of Computer Science September 2016 A thesis submitted in partial
Principles and Applications of Electrical Circuits and Signal Theories in EP
 Principles and Applications of Electrical Circuits and Signal Theories in EP Graydon Beatty, VP Therapy Development Atrial Fibrillation Division, St. Jude Medical, Inc. CardioRhythm 2009 Background Biophysics
Sheet 5 physiology Electrocardiography-
 *questions asked by some students Sheet 5 physiology Electrocardiography- -why the ventricles lacking parasympathetic supply? if you cut both sympathetic and parasympathetic supply of the heart the heart
Defibrillation by high-energy electric shocks is the only
 Tunnel Propagation of Postshock Activations as a Hypothesis for Fibrillation Induction and Isoelectric Window Takashi Ashihara, Jason Constantino, Natalia A. Trayanova Abstract Comprehensive understanding
ACTION POTENTIAL TRANSFER AT THE PURKINJE - VENTRICULAR JUNCTION: ROLE OF TRANSITIONAL CELLS
 1 of 4 ACTION POTENTIAL TRANSFER AT THE PURKINJE - VENTRICULAR JUNCTION: ROLE OF TRANSITIONAL CELLS Arie O. Verkerk 1, Marieke W. Veldkamp 2, Antoni C.G. van Ginneken 1,2, Ronald Wilders 1,3 1 Department
J Wave Syndromes. Osama Diab Lecturer of Cardiology Ain Shams University
 J Wave Syndromes Osama Diab Lecturer of Cardiology Ain Shams University J Wave Syndromes Group of electric disorders characterized by > 1 mm elevation of the J point or prominent J wave with or without
The goal of defibrillation shocks is to resynchronize
 Virtual Electrode Induced Reexcitation A Mechanism of Defibrillation Yuanna Cheng, Kent A. Mowrey, David R. Van Wagoner, Patrick J. Tchou, Igor R. Efimov Abstract Mechanisms of defibrillation remain poorly
Introduction. Circulation
 Introduction Circulation 1- Systemic (general) circulation 2- Pulmonary circulation carries oxygenated blood to all parts of the body carries deoxygenated blood to the lungs From Lt. ventricle aorta From
Effects of I Kr and I Ks Heterogeneity on Action Potential Duration and Its Rate Dependence
 Effects of I Kr and I Ks Heterogeneity on Action Potential Duration and Its Rate Dependence A Simulation Study Prakash C. Viswanathan, BE; Robin M. Shaw, PhD; Yoram Rudy, PhD Background A growing body
Dispersion of myocardial repolarization contributes to arrhythmia
 Imaging Dispersion of Myocardial Repolarization, I Comparison of Body-Surface and Epicardial Measures John E. Burnes, PhD; Raja N. Ghanem, MS; Albert L. Waldo, MD; Yoram Rudy, PhD Background Body-surface