Supplemental Data. Majeran et al. Plant Cell. (2010) /tpc
|
|
|
- Charles Barrett
- 5 years ago
- Views:
Transcription


 Ligule leaf 2 Sink zone.")


 Representative seedling, with")


1 A B Leaf 3 Leaf 3 Tip of leaf 3 labeled with 14 CO C-labeled sugar in major veins is being transported basipetally A small amount of 14 C has moved from the phloem to the xylem and is being carried to the tip of the leaf in major veins. 1 Ligule leaf 2 Ligule leaf 3 (hidden behind coleoptile) Ligule leaf 2 Sink zone. 14 C is beginning to unload from veins into the bundle sheath and mesophyll. The remainder is exported to other sinks. Sink zone. 14 C from leaf 2, an older exporting leaf, has been imported by leaf 3 and is unloading. Ligule leaf 3 Suppl. Figure 1 (A) Representative seedling, with numbered leaf, (B) 14C labeling of maize leaves to show sink source-transition in the 3rd leaf selected for proteome and image analysis. The leaf on the left hand side was labeled from its tip, whereas the leaf of the right hand side was labeled through the older leaf 2. 1


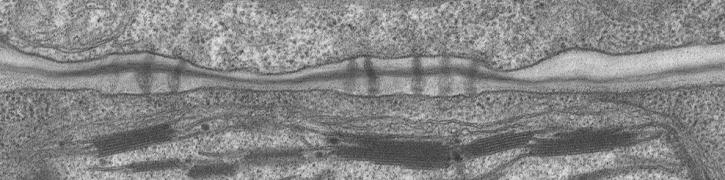

2 A -1 cm; base 6-7 cm SE B BSC VP VP SE VP 7-8 cm 2-3 cm BSC VP Peroxisomes or plastids 4-5 cm xylem 8-9 cm BSC MC See B 8-9 cm E (tip-1) 5-6 cm BSC F Grana area/ MC c chloroplast ( ) C D # thylakoid / BSC C chloroplast (o) See C 5-6 cm Suppl. Fig Distance from base (cm) 2
3 Supplemental Figure 2. Structural analysis of the maize leaf along the developmental gradient (A) TEM images with transverse section of 8 leaf zones along the developmental leaf axis. In the section -1 cm, the oval indicates where plasmodesmata are visible (visible as black spots), whereas arrows indicate starch particles. A close-up of the boxed area in section 4-5 cm is shown in panel B. (B) TEM of a vascular bundle with annotation at 4-5 cm from the leaf base. This is a close-up of a section of the image shown in panel A and Figure 1F. VP = vascular parenchyma cell, CC companion cell; SE sieve element. The organelles with the crystalline structure are either peroxisomes with catalase crystals or non-photosynthetic plastids with crystalline structure of unknown content. (C) Close-up of plasmodesmata at 4-5 cm section (D) Close-up of vesicles (marked by the oval) along the chloroplast inner envelope. (E) Close-up of plastoglobules in BSC chloroplasts (indicated by an arrow) (F) Quantification of the average number of thylakoid membranes per BSC chloroplast (open symbols) and average cross-section of grana per MC chloroplast (closed symbols) along the leaf developmental axis. The errors bars (s.e.) are indicated. 3
 1D gel analysis of soluble (B) BS strand proteomes.")
 and are indicated. (B) Expression of vascular marker proteins in the BS strands along the leaf gradient.")
4 A 1. PPDK 2. SUSY 3. Meth. Synth. 4. TKL 5. ME 6. RBCL 7. RBCS BS-S strand cm Mass in kda B N NAdjSPC nicotianamine synthase lectin SUT1 Xylem serine protease Distance from base (cm) Supplemental Figure 3. BS strand analysis and subclusters (A) 1D gel analysis of soluble (B) BS strand proteomes. Equal amounts of proteins from each selected section separated by 1D Tricine gels and stained to visualize the protein patterns. A number of abundant proteins could be recognized (after MS analysis) and are indicated. (B) Expression of vascular marker proteins in the BS strands along the leaf gradient. SUT1 was also observed in the total leaf sections (a solid line connecting the open circles). 4
5 A clustered Tim17/Tim22 I-1 B.4 anion-atpase II NS SAF * OEP24-II II-3b.4.2 SAMT1 I-2b.4.3 PAA1 II Distance from base (cm) Distance from base (cm) Supplemental Figure 4. Plastid envelope transporters involved in transport of copper (PAA1), S-adenosylmethionine (SAMT1) or unknown substrates (Tim17/22, anion-atpase, OEP24-II) passing the minimum threshold for clustering. (A) Relative molar abundance in the leaf calculated from the normalized spectral abundance factor, NSAF. Proteins in grey are in cluster I and protein in black in cluster II. (B) Expression of proteins along the developmental gradient in leaves (closed squares) and BS strands (open squares). The cluster number is indicated. 5
6 12 A B ACC1 porin2 DTC2.12 I-1 I-1 I All clustered NSAF * PHT3 I DTC1 NRT.4 I-1 I PIP1 I-1 K-channel.4 I porin1 I-1.6 porin3 I Distance from base (cm) Distance from base (cm) Supplemental Figure 5. Mitochondrial transporters passing the minimum threshold for clustering. (A) Relative molar abundance in the leaf calculated from the normalized spectral abundance factor, NSAF. (B) Expression of proteins along the developmental gradient in leaves (closed squares) and BS strands (open squares). The cluster number is indicated. 6
7 .8.7 ) NAdjSPC (X II-3c.2.1 II-1b Distance from base (cm) Supplemental Figure 6. Accumulation patterns of unusual LHC proteins, LIL3 (GRMZM2G477236_P1; filled square), ELIP1/2 (GRMZM2G355752_P1; open square), SEP4 (GRMZM2G162451_P1; filled circle) and OHP2- like (GRMZM2G143469_P1; open circle), along the leaf developmental gradient. Each of these proteins passed the threshold for cluster analysis. LIL3 and ELIP followed the same developmental expression pattern, peaking in the sink region before the 4 cm point, and decreasing gradually towards the tip and with consistent higher levels in the BS strands (cluster II-1b). In contrast, SEP4 and OHPs-like proteins had very similar expression patterns and were part of cluster II-3c, similar to PSII proteins and other MC chloroplast markers. 7
8 Supplemental Figure 7. The expression patterns of enzymes involved in N- assimilation. This diagram illustrates the incorporation of inorganic nitrogen into amino acids. The abbreviation and EC number are given for each catalytic step as well as transporters. The abbreviations are also included in Supplemental Data set 1C. The expression profiles along the leaf gradient are shown in line plots. The color of the enzyme name indicates the localization. Green, plastids. Blue, mitochondria. Red, cytosol. Black, unknown. the color of the lines in the plots indicates the total adjspc. Black, >2adjSPC. Gray, 5-2adjSPC. light gray, <5adjSPC. NR, nitrate reductase. NiR, nitrite reductase. GS, glutamine synthase. GOGAT, glutamate synthase. AspT, aspartate aminotransferase. NADP-MDH, NADP-malate dehydrogenase. NAD-MDH, NAD-malate dehydrogenase. GDH, glycine dehydrogenase. NAGS, N- acetylglutamate synthase. NAGK, N- acetylglutamate kinase. NAGPR, N-acetyl- gamma-glutamyl-phosphate reductase. NAOAT, N2-acetylornithine aminotransferase. NAOGAcT, N2-acetylornithine:glutamate acetyltransferase. CPS, carbamoyl phosphate synthetase. OTC, ornithine transcarbamylase. ASS, argininosuccinate synthase. AL, argininosuccinate lyase. NIRT, nitrate transporter. DiT1, 2-oxoglutarate/malate translocator 1. DiT2, 2-oxoglutarate/malate translocator 2. DTC, dicarboxylate-tricarboxylate carrier. Cit cytosol ASS N metabolism OTC ASS AL NT OTC CPS NAOGAcT NAOAT CP Orn NAO NAGSA NAGPR* NAGK NAGS DiT1 T DiT1 BS OMT1 T OMT1 BS DTC 1 T DTC 1 BS DTC 2 T DTC 2 BS NAG 5P NAG Glu AS plastid NAGPR NAGK Gln 2 OG DiT1 2 OG AL Arg Fd GOGAT NADH GOGAT NH 4 + GS GS2 DTC GDH OG GOGAT Malate Malate NiR GDH NO 3 _ NO 2 _ NIRT NO 2 _ Glu Glu NR NiR purine Asp AspT DiT2 Glu DTC Glu mitochondria NADP MDH NAD MDH AspAT mit AspAT cyt AtAAT T AtAAT BS ASP5 T ASP5 BS DiT2 OAA GS AA Gln NO 3 _ NH 4 + 8
9 Supplemental Figure 8. The expression patterns of enzymes involved in S-assimilation and the SAM cycle.this diagram illustrates the flow of sulfur from sulfate to cysteine and methionine. Biosynthesis of serine and glutathione, the SAM cycle and SMM cycle are also included. The color scheme is the same as in Supplemental Fig.7. ATPS, ATP sulfurylase. APR, APS reductase. SiR, sulfite reductase. OASTL, cysteine synthase/o-acetylserine (thiol)lyase. CGS, cystathionine gamma-synthase. CBL, cystathionine beta-lyase. MetS, methionine synthase. -ECS/GSH1, gamma-glutamylcysteine synthetase. GSHS, glutathione synthetase. GR, glutathione reductase. GPX, glutathione peroxidase. 3-PGDH, 3-PGA dehydrogenase. PSAT, 3-phosphoserine aminotransferase. PSP, 3- phosphoserine phosphatase. SAT, serine acetyltransferase. MAT, methionine adenosyltransferase. AdoHcyase, adenosylhomocysteinase. MMT, methionine S-methyltransferase. OASTL II 1 T OASTL II 1 BS OASTL II 3 T OASTL II 3 BS OASTL T OASTL BS SiR SO 3 2 S 2 SiR APR-3 APR OAS OASTL SO 4 2 SULTR SO 4 2 APS ATPS ATPS2 T ATPS2 BS ATPS3 BS SAT plastid PSP Ser PSP SO 4 2 SAM cycle methylated methyl acceptor AdoHcy H 2 O AdoHcyase AdoHcyase HOG11 adenosine HCys MS methyltetrahyd ropteroyltri L glutamate Cystathionine MTO1 T MTO1 BS CBL T CBL BS MS2 T MS2 BS CIMS T CIMS BS HCys CBL MS CGS Cys EC Glu ECS(GSH1) GSHS GSH1 Gly GR PSAT PGDH PSer 3 PHPyr 3 PGA GR NADP + NADPH + H + PSAT 3 PGDH T 3 PGDH BS EDA9 1 T EDA9 1 BS EDA9 2 T EDA9 2 BS calvin cycle glycolysis methyl acceptor AdoMet Pi + PPi MAT SAM1 1 T SAM1 1 BS SAM1 1 T SAM1 2 BS SAM2 T SAM2 BS H 2 O + ATP Met tetrahydropter oyltri L glutamate Met GSH H 2 O 2 GPX GPX2 2H 2 O GSSG MMT AdoMet MMT EC GSH cytosol HCys SMM AdoHcy SMM cycle 9
10 Nucleotide-sugar interconversion Plasma- membrane Cell Wa all UDP-L-Ara UXE UDP-D-Xyl UXS UDP-D-GlcAD GAE UDP-D-GalA UDP-D-Apiose INO Myo-inositol D-GlcA AXS GAK UDP-D-Xyl UXS UDP-D-GlcA UGD D-GlcA-1-P UDP-L-Rha 2NADH RHM/ UER UGD 2NAD+ NADP+ NADPH UGE UDP-D-Glc UGP PGM D-Glc-1-P Cytosol UDP-D-Gal 1,4- -D-glucan PPi UTP SUS CEL1 CESA lose Cellul Cellulose (Primary Wall) Cellulose (Secondary Wall) Endomembrane system Hemi cellulose Pectin Glycoprotein Glycosylation site Ascorbate NADP+ NADPH GDP-L-Fuc GER GMD GDP-L-Gal GDH GDP-D-Man GME PMM PGI D-Frc-6-P Sucrose PMI Photosynthesis s Glycolysis Plasma- membrane Ce ell Wall Supplemental Figure 9. The expression patterns of quantified enzymes in cellulose biosynthesis and nucleotide-sugar conversions. PGI, Phosphoglucose isomerase. PGM, Phosphoglucomutase. UGP, UDP-D-glucoseD pyrophosphorylase. RHM, UDP-L-rhamnose synthase. UER, dtdp-4-dehydrorhamnose reductase. UGE, UDP-glucose 4-epimerase. CEL1, endo-1,4-beta-glucanase. CESA, cellulose synthase. SUS, sucrose synthase. UGD, UDP-glucose 6-dehydrogenase. PMI, phosphomannose isomerase. PMM, Phosphomannomutase. GMD, GDP-mannose 4,6 dehydratase 2. GER, GDP-L-fucose synthase 1. GME, GDP-L-mannose epimerase. GDH, L-galactose dehydrogenase. UXS, UDP-glucuronic acid decarboxylase 1. AXS, UDP-D-APIOSE/UDP-D-XYLOSE SYNTHASE 2. GAK, D-glucuronokinase. INO, inositol oxygenase. UXE, UDP-Dxylose- 4 epimerase. GAE, UDP-D-glucoronic acid 4-epimerase. 1
11 Salicylic acid Flavonoid Suberin Cinnamic acid PAL Phe Chorismate Shikimate pathway C4H p-coumaric acid p-coumaroyl shikimic acid C3H HCT 4CL p-coumaraldehyde CCR p-coumaroyl -CoA CAD HCT CCoAOMT CCR CAD Caffeoyl shikimic acid Caffeoyl-CoA Feruloyl-CoA Coniferaldehyde Monolignol biosynthesis F5H 5-hydroxyconiferaldehyde COMT Sinapaldehyde CAD p-coumaryl alcohol Coniferyl alcohol Sinapyl alcohol Cytosol Syringyl lig gnin Guaiacyl lig gnin p-hydroxyp phenyl lignin Cell Wall Supplemental Figure 1. The expression patters of enzymes involved in lignin biosynthesis. PAL, phenylalanine ammonia-lyse. C4H, cinnamate 4-hydroxylase. 4CL, 4-coumarate-CoA ligase 1. HCT, p-hydroxycinnamoyl-coa. C3H, p-coumarate 3-hydroxylase. CCoAOMT, caffeoyl-coa O-methyltransferase. CCR, cinnamoyl-coa reductase. F5H, Ferulate-5-hydroxylase COMT, caffeic acid O-methyltransferase. CAD, cinnamyl alcohol dehydrogenase. 11
12 Supplemental Results N, S and amino acid metabolism shows distinct developmental and differentiation patterns Assimilation of nitrogen starts with uptake of nitrate (NO - 3 ) through the vascular system, followed by a 2-step reduction into ammonium (NH + 4 ) by cytosolic nitrate reductase (NR) leading to nitrite, and further reduction in the chloroplast by nitrite reductase (NiR) to ammonium (NH + 4 ). NH + 4 is also produced in the mitochondria by glycine dehydrogenase (GDH) during conversion of Glu to 2-oxoglutarate (Supplemental Figure 7) and during photorespiration through conversion of Gly to Ser by Gly decarboxylase (GDC). The NH + 4 is primarily used in the synthesis of Gln in the glutamine synthase 2/glutamate synthase (GS2/GOGAT) cycle and in the synthesis of Arg (Supplemental Figure 7) in plastids. A second GS (GS1) is non-plastidic and belonged to cluster II-1. Glu is used to generate Asp, catalyzed by the aspartate aminotransferase (AAT), represented by enzymes in different subcellular compartments, with the most abundant AAT in the plastid. NiR and Fd-GOGAT belonged to cluster II-3c, whereas GS2 and AAT belonged to cluster II-3d, indicative of increase in expression from base to tip, following the same expression pattern as the build-up of the photosynthetic light reaction. NiR and Fd- GOGAT were preferentially expressed in MSC indicative of the tight link to linear electron transport, whereas AAT clustered with MSC-enriched Calvin cycle enzymes and C4 malate shuttle enzymes PPDK and PEPC (II-3d). The expression levels of the Dit1 and Dit2 transporters were relatively low, but were most abundant in the tip. GDH was only observed in the BS strands and showed the same induction kinetics as the photorespiratory markers, GOX and 2PGP discussed above (Figure 1). In contrast, the two mitochondrial 2-oxoglutarate/malate transporters (DTC1,2) showed expression highest at the base (in cluster I-1) (Supplemental Figure 5B). However, the additional BS strand enrichment of DTC2 in the leaf tip, suggests a key function of DTC2 in the photorespiratory pathway late in leaf development (Supplemental -1 Figures 5,7). NRT1, a putative transporter of NO 3 (GRMZM2G86496_P1) in cluster I-1 showing pronounced peak expression ~2.5 cm from the base (Supplemental Figure 5). Upon uptake of sulfur as sulfate (SO 2-4 ) through the vascular system, SO 2-4 is imported into the chloroplast and first activated by ATP sulfurylase (ATPS) to adenosine 5 -phoshosulfate (APS) and then reduced in 2 steps by APS reductase (APR) and sulfite reductase (SiR) leading to sulfide (S 2- ) (Supplemental Figure 8). The envelope sulfate transporter (SULTR) (GRMZM2G395114_P1) with 1 predicted transmembrane domains was exclusively identified in the BS strands near the leaf tip. ATPS was part of cluster II-3e, showing near exclusive 12
13 Supplemental Results expression in the BS strand and clustering with the majority of the Calvin cycle enzymes and photosynthetic cyclic electron flow. Consistently, APR and SiR in the BS strand followed the same expression pattern as ATPS. Surprisingly, SiR showed also a high expression in the very base of the leaf, suggesting an additional role of SiR in the base of the leaf; possibly for sulfite reduction using OPPP as electron source. Sulfide is converted into cysteine, which is used for protein synthesis, to generate Met or the abundant redox regulator glutathione (see previous section Redox regulation and ROS defense ). Synthesis of Cys, Met and glutathione were distributed across multiple subcellular localizations. We identified three homologues of plastid localized cysteine synthase (OASTL); the two most abundant clustered to II-1a,b. Methionine is used in the SAM cycle to provide methyl groups (C1 metabolism) for various metabolic pathways, with a particular high demand for synthesis of nucleic acids and abundant structural components of the cell wall (eg lignin, choline, pectin) and chlorophyll. We quantified all enzymes of the SAM cycle (Supplemental Figure 8), as well as the inner envelope membrane transporter SAMT1 (Supplemental Figure 4B) which transports SAM from the cytosol into the plastid. Impaired function of SAMT1 led to decreased accumulation of prenyllipids and mainly affected the chlorophyll pathway in tobacco {Bouvier, 26 #12783}. SAM cycle proteins were members of cluster I-1 or I-2a,b, gradually decreasing along the developmental axis. Methionine synthase 1 was by far the most abundant protein. The high expression in the sink zone is consistent with high rates of synthesis of structural components such as cell walls and chlorophyll. Gly and Ser are synthesized by the plastid-localized phosphorylated pathway or by the mitochondrial glycolate pathway as part of photorespiration {Ho, 21 #12966}Bourgulgnon et al., 1999). The phosphorylated pathway utilizes 3-PGA (from glycolysis or Calvin cycle) to make Ser, which is then converted to Gly by the enzyme serine hydroxymethyltransferase (SHMT). We identified all three enzymes in the phosphorylated pathway for Ser biosynthesis, 3- PGA dehydrogenase (3-PGDH), 3-phosphoserine aminotransferase (PSAT) and 3-phosphoserine phosphatase (PSP) (Supplemental Figure 8). The two most abundant isoforms of 3-PGDH and PSAT fell in cluster I-1, I-2a and I-2b, respectively. Both 3-PGDH and PSAT show decreased protein level towards the leaf tip, implying they may be more crucial for Ser biosynthesis in the sink tissue. Interestingly, the third enzyme PSP was only found in BS strands, with increased accumulation towards the tip, opposite to the trends of 3-PGDH and PSAT. The reason is unclear 13
14 Supplemental Results but it is consistent with transcript profiling for these three genes in Arabidopsis {Ho, 1999 #2497}. In photosynthetic tissues, Ser and Gly are predominantly metabolized in the peroxisomes and mitochondria as part of photorespiration. Three enzymes, GGAT, GDC and SHM1,4 (three isoforms) are responsible for Ser and Gly metabolism. GGAT level increased from sink to source tissue, as expected for enzymes involved in photorespiration. The level of the most abundant GDC isozyme increased from base to tip in BS strands, but the levels in total leaf and of other isozymes peaked at the transition zone. Similarly, SHMT level is highest in transition zone except for one of the isoforms (GRMZM2G135283_P2), which increased from base to tip in the BS strand. Since SHMT participate in both Ser biosynthesis pathways, it is not surprising that the expression profile of SHMT does not follow that of the other photorespiratory enzymes. We identified 28 enzymes in the plastid-localized biosynthesis of aromatic amino acids (Phe, Tyr, Trp) which included six out of seven enzymatic steps (1 proteins) in chorismate synthesis. Biosynthesis starts with the condensation of erythrose 4-phosphate (from OPPP/Calvin) and PEP, followed by the conversion of shikamate into chorismate, the branch point of Trp synthesis from Tyr and Phe synthesis. DHAP synthase, the first step was by far the most abundant step in chorismate synthesis and belonged to cluster I-1 (high expression in the base). Subsequent steps in chorismate synthesis were enriched in BS strands and increased from base to tip, probably because shikimate and chorismate are respectively important precursors for phenylpropapoid biosynthesis (for lignin) and vitamin K1 (phylloquinone) in PSI. Synthesis of the aromatic biosynthetic enzymes after chorismate decreased from base to tip. We identified four enzymes of the linear His pathway, albeit at relatively low levels, with expression levels decreasing from base to tip. Ala is synthesized from pyruvate and Glu outside the plastid by Ala aminotransferase and several isoforms belonged to clusters I-2b and II-1a, peaking quite broadly around the sink-source transition zone, with modest enrichment in the BS strands. We identified all enzymes involved in branched amino (Val, Leu and Ile) biosynthesis except one (dihydroxyacid dehydratase). Most of them belonged to cluster I, some to cluster II-1 and II-2, with highest expression level at the base or towards the transition zone. This is consistent with previous findings that this pathway is most active in young developing tissues (Keeler et al., 1993; Hofgen et al., 1995; Singh and Shaner, 1995). 14
0.5. Normalized 95% gray value interval h
 Normalized 95% gray value interval.5.4.3.2.1 h Supplemental Figure 1: Symptom score of root samples used in the proteomics study. For each time point, the normalized 95% gray value interval is an averaged
Midterm 2. Low: 14 Mean: 61.3 High: 98. Standard Deviation: 17.7
 Midterm 2 Low: 14 Mean: 61.3 High: 98 Standard Deviation: 17.7 Lecture 17 Amino Acid Metabolism Review of Urea Cycle N and S assimilation Last cofactors: THF and SAM Synthesis of few amino acids Dietary
Midterm 2 Results. Standard Deviation:
 Midterm 2 Results High: Low: Mean: Standard Deviation: 97.5% 16% 58% 16.3 Lecture 17 Amino Acid Metabolism Urea Cycle N and S assimilation Last cofactors: THF and SAM Dietary (Exogenous) Proteins Hydrolyzed
Metabolism of amino acids. Vladimíra Kvasnicová
 Metabolism of amino acids Vladimíra Kvasnicová Classification of proteinogenic AAs -metabolic point of view 1) biosynthesis in a human body nonessential (are synthesized) essential (must be present in
Lignin and the General Phenylpropanoid Pathway. Introduction and Importance:
 Lignin and the General Phenylpropanoid Pathway 13. Phenolics and Lignin p. 1 Introduction and Importance: Phenolic: a compound consisting of an aromatic ring plus at least one hydroxyl [= phenyl group],
Welcome to Class 14! Class 14: Outline and Objectives. Overview of amino acid catabolism! Introductory Biochemistry!
 Welcome to Class 14 Introductory Biochemistry Class 14: Outline and Objectives Amino Acid Catabolism Fates of amino groups transamination urea cycle Fates of carbon skeletons important cofactors metabolic
Plant Biochemistry Lecture 10: AMINO ACIDS I
 http://smtom.lecture.ub.ac.id/ Password: https://syukur16tom.wordpress.com/ Password: Plant Biochemistry Lecture 10: AMINO ACIDS I LEARNING OUTCOMES Students, after mastering materials of the present lecture,
AMINO ACID METABOLISM
 AMINO ACID METABOLISM Synthesis of Urea in Liver The series of reactions that form urea is known as the Urea Cycle or the Krebs-Henseleit Cycle. The urea cycle operates only to eliminate excess nitrogen.
AP Bio Photosynthesis & Respiration
 AP Bio Photosynthesis & Respiration Multiple Choice Identify the letter of the choice that best completes the statement or answers the question. 1. What is the term used for the metabolic pathway in which
Amino acid metabolism
 Amino acid metabolism The important reaction commonly employed in the breakdown of an amino acid is always the removal of its -amino group. The product ammonia is excreted after conversion to urea or other
Lecture: Amino Acid catabolism: Nitrogen-The Urea cycle
 BIOC 423: Introductory Biochemistry Biochemistry Education Department of Biochemistry & Molecular Biology University of New Mexico Lecture: Amino Acid catabolism: Nitrogen-The Urea cycle OBJECTIVES Describe
AMINO ACID METABOLISM. Sri Widia A Jusman Dept. of Biochemistry & Molecular Biology FMUI
 AMINO ACID METABOLISM Sri Widia A Jusman Dept. of Biochemistry & Molecular Biology FMUI Amino acids derived from dietary protein absorbed from intestine through blood taken up by tissues used for biosynthesis
Nitrogen Metabolism. Overview
 Nitrogen Metabolism Pratt and Cornely Chapter 18 Overview Nitrogen assimilation Amino acid biosynthesis Nonessential aa Essential aa Nucleotide biosynthesis Amino Acid Catabolism Urea Cycle Juicy Steak
Biochemistry 2 Recita0on Amino Acid Metabolism
 Biochemistry 2 Recita0on Amino Acid Metabolism 04-20- 2015 Glutamine and Glutamate as key entry points for NH 4 + Amino acid catabolism Glutamine synthetase enables toxic NH 4 + to combine with glutamate
CH395G FINAL (3 rd ) EXAM Kitto/Hackert - Fall 2003
 EXAM Kitto/Hackert - Fall 2003") CH395G FINAL (3 rd ) EXAM Kitto/Hackert - Fall 2003 1. A cell in an active, catabolic state has a. a high (ATP/ADP) and a high (NADH/NAD + ) ratio b. a high (ATP/ADP) and a low (NADH/NAD + ) ratio c. a
CH395G FINAL (3 rd ) EXAM Kitto/Hackert - Fall 2003 1. A cell in an active, catabolic state has a. a high (ATP/ADP) and a high (NADH/NAD + ) ratio b. a high (ATP/ADP) and a low (NADH/NAD + ) ratio c. a
Part III => METABOLISM and ENERGY. 3.5 Protein Catabolism 3.5a Protein Degradation 3.5b Amino Acid Breakdown 3.5c Urea Cycle
 Part III => METABOLISM and ENERGY 3.5 Protein Catabolism 3.5a Protein Degradation 3.5b Amino Acid Breakdown 3.5c Urea Cycle Section 3.5a: Protein Degradation Synopsis 3.5a - Dietary proteins are degraded
Catabolism of Carbon skeletons of Amino acids. Amino acid metabolism
 Catabolism of Carbon skeletons of Amino acids Amino acid metabolism Carbon skeleton Carbon Skeleton a carbon skeleton is the internal structure of organic molecules. Carbon Arrangements The arrangement
Nitrogen Metabolism. Pratt and Cornely Chapter 18
 Nitrogen Metabolism Pratt and Cornely Chapter 18 Overview Nitrogen assimilation Amino acid biosynthesis Nonessential aa Essential aa Nucleotide biosynthesis Amino Acid Catabolism Urea Cycle Juicy Steak
Integrative Metabolism: Significance
 Integrative Metabolism: Significance Energy Containing Nutrients Carbohydrates Fats Proteins Catabolism Energy Depleted End Products H 2 O NH 3 ADP + Pi NAD + NADP + FAD + Pi NADH+H + NADPH+H + FADH2 Cell
Amino acid Catabolism
 Enzymatic digestion of dietary proteins in gastrointestinal-tract. Amino acid Catabolism Amino acids: 1. There are 20 different amino acid, they are monomeric constituents of proteins 2. They act as precursors
Lecture 11 - Biosynthesis of Amino Acids
 Lecture 11 - Biosynthesis of Amino Acids Chem 454: Regulatory Mechanisms in Biochemistry University of Wisconsin-Eau Claire 1 Introduction Biosynthetic pathways for amino acids, nucleotides and lipids
number Done by Corrected by Doctor Dr.Diala
 number 32 Done by Mousa Salah Corrected by Bahaa Najjar Doctor Dr.Diala 1 P a g e In the last lecture we talked about the common processes between all amino acids which are: transamination, deamination,
Biochemistry - I SPRING Mondays and Wednesdays 9:30-10:45 AM (MR-1307) Lecture 16. Based on Profs. Kevin Gardner & Reza Khayat
 Lecture 16. Based on Profs. Kevin Gardner & Reza Khayat") Biochemistry - I Mondays and Wednesdays 9:30-10:45 AM (MR-1307) SPRING 2017 Lecture 16 Based on Profs. Kevin Gardner & Reza Khayat 1 Catabolism of Di- and Polysaccharides Catabolism (digestion) begins
Biochemistry - I Mondays and Wednesdays 9:30-10:45 AM (MR-1307) SPRING 2017 Lecture 16 Based on Profs. Kevin Gardner & Reza Khayat 1 Catabolism of Di- and Polysaccharides Catabolism (digestion) begins
Metabolism III. Aim: understand gluconeogenesis, pentose phosphate pathway, photosynthesis and amino acid synthesis
 Metabolism III Aim: understand gluconeogenesis, pentose phosphate pathway, photosynthesis and amino acid synthesis Anabolism From a carbon source and inorganic molecules, microbes synthesize new organelles
BIOCHEMISTRY - CLUTCH REVIEW 6.
 !! www.clutchprep.com CONCEPT: AMINO ACID OXIDATION Urea cycle occurs in liver, removes amino groups from amino acids so they may enter the citric acid cycle 2 nitrogen enter the cycle to ultimately leave
Nitrogen Metabolism. Overview
 Nitrogen Metabolism Pratt and Cornely Chapter 18 Overview Nitrogen assimilation Amino acid biosynthesis Nonessential aa Essential aa Nucleotide biosynthesis Amino Acid Catabolism Urea Cycle Juicy Steak
Scantron Instructions
 BIOLOGY 1A MIDTERM # 1 February 17 th, 2012 NAME SECTION # DISCUSSION GSI 1. Sit every other seat and sit by section number. Place all books and paper on the floor. Turn off all phones, pagers, etc. and
Krebs cycle Energy Petr Tůma Eva Samcová
 Krebs cycle Energy - 215 Petr Tůma Eva Samcová Overview of Citric Acid Cycle Key Concepts The citric acid cycle (Krebs cycle) is a multistep catalytic process that converts acetyl groups derived from carbohydrates,
Chapter 26. Outline. Nitrogen. Nitrogen and Amino Acid Metabolism. BCH 4054 Spring 2001 Chapter 26 Lecture Notes. Slide 1. Slide 2
 BCH 4054 Spring 2001 Chapter 26 Lecture Notes 1 Chapter 26 Nitrogen and Amino Acid Metabolism 2 utline No time to cover entire chapter, therefore concentrate on a few focal points Assimilation of inorganic
True or False: 1. Reactions are called endergonic if they occur spontaneously and release free energy.
 True or False: 1. Reactions are called endergonic if they occur spontaneously and release free energy. 2. Enzymes catalyze chemical reactions by lowering the activation energy 3. Biochemical pathways are
Bio 366: Biological Chemistry II Test #2, 100 points total
 Bio 366: Biological Chemistry II Test #2, 100 points total Please neatly PRINT YOUR NAME on EACH PAGE. PRINT the l ast four digits of your SOCIAL SECURITY NUMBER on the BACK SIDE OF PAGE 11 of this test.
Cells. Variation and Function of Cells
 Cells Variation and Function of Cells Plasma Membrane= the skin of a cell, it protects and nourishes the cell while communicating with other cells at the same time. Lipid means fat and they are hydrophobic
Lecture 16. Finish lipid metabolism (Triglycerides, Isoprenoids/Steroids, Glyoxylate cycle) Amino acid metabolism (Urea cycle) Google Man III
 Amino acid metabolism (Urea cycle) Google Man III") Lecture 16 Finish lipid metabolism (Triglycerides, Isoprenoids/Steroids, Glyoxylate cycle) Amino acid metabolism (Urea cycle) Google Man III The Powertrain of Human Metabolism (verview) CARBHYDRATES PRTEINS
Lecture 16 Finish lipid metabolism (Triglycerides, Isoprenoids/Steroids, Glyoxylate cycle) Amino acid metabolism (Urea cycle) Google Man III The Powertrain of Human Metabolism (verview) CARBHYDRATES PRTEINS
Cellular Respiration. 3. In the figure, which step of the citric acid cycle requires both NAD+ and ADP as reactants? a. Step 1. c. Step 3 b.
 Cellular Respiration 1. Enzymes are organic catalysts. How do they increase the rate of chemical reactions? a. By decreasing the free-energy change of the reaction b. By increasing the free-energy change
Biochemistry: A Short Course
 Tymoczko Berg Stryer Biochemistry: A Short Course Second Edition CHAPTER 30 Amino Acid Degradation and the Urea Cycle 2013 W. H. Freeman and Company Chapter 30 Outline Amino acids are obtained from the
Nitrogen Assimilation
 Nitrogen Assimilation 1. Introduction and Overview Importance of nitrogen to plant metabolism: often the limiting nutrient in plants (& agriculture) nitrogen can regulates growth processes, due to integration
BIOINFORMATICS. Cambridge, MA USA, 3 Department of Plant Biology, University of Florence, Via La Pira, Florence, Italy,
 BIOINFORMATICS Vol. no. Pages Robust and Pareto-Efficient Enzyme Partitions for the Optimisation of CO Uptake and Nitrogen Consumption in C Photosynthetic Carbon Metabolism Supplementary information G.
Biology 638 Biochemistry II Exam-3. (Note that you are not allowed to use any calculator)
") Biology 638 Biochemistry II Exam-3 (Note that you are not allowed to use any calculator) 1. In the non-cyclic pathway, electron pathway is. Select the most accurate one. a. PSII PC Cyt b 6 f PC PSI Fd-NADP
Biology 638 Biochemistry II Exam-3 (Note that you are not allowed to use any calculator) 1. In the non-cyclic pathway, electron pathway is. Select the most accurate one. a. PSII PC Cyt b 6 f PC PSI Fd-NADP
18 Amino Acid Oxidation and Production of Urea W. H. Freeman and Company
 18 Amino Acid Oxidation and Production of Urea 2013 W. H. Freeman and Company 1 Last Class of Biomolecules For Energy 1. Production of acetyl-coa. Glucose. To pyruvate via glycolysis. To acetyl-coa by
Supplemental Data. Takahashi et al. Plant Cell (2014) /tpc
 /tpc") Supplemental Data. Takahashi et al. Plant Cell (4).5/tpc.4.363 Fructose Glucose Sucrose Gentiobiose Gentianose Fructose STDs +GLU +INV Gentianose Supplemental Figure. TLC analysis of sugars hydrolyzed
Supplemental Data. Takahashi et al. Plant Cell (4).5/tpc.4.363 Fructose Glucose Sucrose Gentiobiose Gentianose Fructose STDs +GLU +INV Gentianose Supplemental Figure. TLC analysis of sugars hydrolyzed
If you ate a clown, would it taste funny? Oh, wait, that s cannibalism . Anabolism
 If you ate a clown, would it taste funny? Oh, wait, that s cannibalism. Anabolism is about putting things together. Anabolism: The Use of Energy in Biosynthesis Anabolism energy from catabolism is used
BOT 6516 Plant Metabolism
 BOT 6516 Plant Metabolism Lecture 19 Nitrate & Sulfur Assimilation Slide sets available at: http://hort.ifas.ufl.edu/teach/guyweb/bot6516/index.html Overview of Nitrate Assimilation 16.34 What does Δψ
Supplemental Data. Pick and Bräutgam et al. Plant Cell. (2011) /tpc Mean Adjustment FOM values (± SD) vs. Number of Clusters
 /tpc Mean Adjustment FOM values (± SD) vs. Number of Clusters") Mean Adjustment FOM values (± SD) vs. Number of Clusters Mean Adjustment FOM Number of Clusters Supplemental Figure 1. Figure of merit analysis of metabolite clustering. The algorithm tries 20 times to
Mean Adjustment FOM values (± SD) vs. Number of Clusters Mean Adjustment FOM Number of Clusters Supplemental Figure 1. Figure of merit analysis of metabolite clustering. The algorithm tries 20 times to
Chapter 10 Lecture Notes: Microbial Metabolism The Use of Energy in Biosynthesis
 Chapter 10 Lecture Notes: Microbial Metabolism The Use of Energy in Biosynthesis I. Principles governing biosynthesis A. Construct larger macromolecules from smaller subunits to conserve genetic storage
Biochemistry 423 Final Examination NAME:
 Biochemistry 423 Final Examination NAME: 1 Circle the single BEST answer (3 points each) 1. At equilibrium the free energy of a reaction G A. depends only on the temperature B. is positive C. is 0 D. is
Oxidative Phosphorylation
 Electron Transport Chain (overview) The NADH and FADH 2, formed during glycolysis, β- oxidation and the TCA cycle, give up their electrons to reduce molecular O 2 to H 2 O. Electron transfer occurs through
E.coli Core Model: Metabolic Core
 1 E.coli Core Model: Metabolic Core 2 LEARNING OBJECTIVES Each student should be able to: Describe the glycolysis pathway in the core model. Describe the TCA cycle in the core model. Explain gluconeogenesis.
Structural and Metabolic Transitions of C 4 Leaf Development and Differentiation Defined by Microscopy and Quantitative Proteomics in Maize W
 The Plant Cell, Vol. 22: 3509 3542, November 2010, www.plantcell.org ã 2010 American Society of Plant Biologists RESEARCH ARTICLES Structural and Metabolic Transitions of C 4 Leaf Development and Differentiation
Amino Acid Oxidation and the Urea Cycle
 Amino Acid Oxidation and the Urea Cycle Amino Acids: Final class of biomolecules whose oxidation contributes significantly to the generation of energy Undergo oxidation in three metabolic circumstances
BRIEF CONTENTS COPYRIGHTED MATERIAL III METABOLIC AND DEVELOPMENTAL INTEGRATION COMPARTMENTS CELL REPRODUCTION PLANT ENVIRONMENT AND AGRICULTURE
 BRIEF CONTENTS I COMPARTMENTS 1 Membrane Structure and Membranous Organelles 2 2 The Cell Wall 45 3 Membrane Transport 111 4 Protein Sorting and Vesicle Traffic 151 5 The Cytoskeleton 191 II CELL REPRODUCTION
Human nutrition requirement
 N assimilation Organic N Proteins 20 amino acids DNA RNA nucleic acids Chlorophylls Secondary products More hormones N in the environment NH, 4 NH 3 (oxid st 3) NO 3 (oxid st 5) N 2 (oxid st 0) Next to
Regulation. 1. Short term control 8-1
 Regulation Several aspects of regulation have been alluded to or described in detail as we have progressed through the various sections of the course. These include: (a) compartmentation: This was not
Discussion of Prism modules and predicted interactions (Fig. 4)
") SUPPLEMENTARY NOTES Discussion of Prism modules and predicted interactions (Fig. 4) a. Interactions of the TCA-cycle, respiratory chain, and ATP synthetase with the amino acid biosynthesis modules. Given
SUPPLEMENTARY NOTES Discussion of Prism modules and predicted interactions (Fig. 4) a. Interactions of the TCA-cycle, respiratory chain, and ATP synthetase with the amino acid biosynthesis modules. Given
Amino acid oxidation and the production of urea
 Seminar 10 Urea cycle Amino acid oxidation and the production of urea Oxidation Waste or Reuse Ammonia has to be eliminated ammonia originates in the catabolism of amino acids that are primarily produced
Respiration. Respiration. Respiration. How Cells Harvest Energy. Chapter 7
 How Cells Harvest Energy Chapter 7 Organisms can be classified based on how they obtain energy: autotrophs: are able to produce their own organic molecules through photosynthesis heterotrophs: live on
MULTIPLE CHOICE. Choose the one alternative that best completes the statement or answers the question.
 2004 BCOR 11 Exam 2 Name: Section: Please note that the chapters covered in this exam 2 (2004) are not the same chapters we are covering this year (2005). That means that you won't be getting more questions
Proteins are sometimes only produced in one cell type or cell compartment (brain has 15,000 expressed proteins, gut has 2,000).
.") Lecture 2: Principles of Protein Structure: Amino Acids Why study proteins? Proteins underpin every aspect of biological activity and therefore are targets for drug design and medicinal therapy, and in
Lecture 2: Principles of Protein Structure: Amino Acids Why study proteins? Proteins underpin every aspect of biological activity and therefore are targets for drug design and medicinal therapy, and in
Metabolism of amino acids I. Josef Fontana
 Metabolism of amino acids I Josef Fontana EC Overview of the lecture Introduction to protein and amino acids metabolism Metabolic pathways of amino acids Transamination Conversion glutamate - glutamine
Metabolism. Chapter 8 Microbial Metabolism. Metabolic balancing act. Catabolism Anabolism Enzymes. Topics. Metabolism Energy Pathways Biosynthesis
 Chapter 8 Microbial Metabolism Topics Metabolism Energy Pathways Biosynthesis Catabolism Anabolism Enzymes Metabolism 1 2 Metabolic balancing act Catabolism and anabolism simple model Catabolism Enzymes
Chapter 5. Microbial Metabolism
 Chapter 5 Microbial Metabolism Metabolism Collection of controlled biochemical reactions that take place within a microbe Ultimate function of metabolism is to reproduce the organism Metabolic Processes
NITROGEN METABOLISM An Overview
 1 University of Papua New Guinea School of Medicine and Health Sciences Division of Basic Medical Sciences Discipline of Biochemistry and Molecular Biology PBL Seminar & Health Sciences NITROGEN METABOLISM
Enzymes what are they?
 Topic 11 (ch8) Microbial Metabolism Topics Metabolism Energy Pathways Biosynthesis 1 Catabolism Anabolism Enzymes Metabolism 2 Metabolic balancing act Catabolism Enzymes involved in breakdown of complex
(de novo synthesis of glucose)
") Gluconeogenesis (de novo synthesis of glucose) Gluconeogenesis Gluconeogenesis is the biosynthesis of new glucose. The main purpose of gluconeogenesis is to maintain the constant blood Glc concentration.
Gluconeogenesis (de novo synthesis of glucose) Gluconeogenesis Gluconeogenesis is the biosynthesis of new glucose. The main purpose of gluconeogenesis is to maintain the constant blood Glc concentration.
Jana Novotná, Bruno Sopko. Department of the Medical Chemistry and Clinical Biochemistry The 2nd Faculty of Medicine, Charles Univ.
 Amino acid metabolism II. Urea cycle Jana Novotná, Bruno Sopko Department of the Medical Chemistry and Clinical Biochemistry The 2nd Faculty of Medicine, Charles Univ. Nitrogen balance Tissue proteins
NAME KEY ID # EXAM 3a BIOC 460. Wednesday April 10, Please include your name and ID# on each page. Limit your answers to the space provided!
 EXAM 3a BIOC 460 Wednesday April 10, 2002 Please include your name and ID# on each page. Limit your answers to the space provided! 1 1. (5 pts.) Define the term energy charge: Energy charge refers to the
Lecture 16. Finish lipid metabolism (Triglycerides, Isoprenoids/Steroids, Glyoxylate cycle) Amino acid metabolism (Urea cycle) Google Man III
 Amino acid metabolism (Urea cycle) Google Man III") Lecture 16 Finish lipid metabolism (Triglycerides, Isoprenoids/Steroids, Glyoxylate cycle) Amino acid metabolism (Urea cycle) Google Man III The Powertrain of Human Metabolism (verview) CARBHYDRATES PRTEINS
Lecture 16 Finish lipid metabolism (Triglycerides, Isoprenoids/Steroids, Glyoxylate cycle) Amino acid metabolism (Urea cycle) Google Man III The Powertrain of Human Metabolism (verview) CARBHYDRATES PRTEINS
Amino acid metabolism II
 Amino acid metabolism II Fates of amino acid carbon skeleton degradation to common intermediates pyruvate, intermediates of citric acid cycle, acetyl-coa Glucogenic AA precursors of glucose - degradation
7/5/2014. Microbial. Metabolism. Basic Chemical Reactions Underlying. Metabolism. Metabolism: Overview
 PowerPoint Lecture Presentations prepared by Mindy Miller-Kittrell, North Carolina State University Basic Chemical Reactions Underlying Metabolism Metabolism C H A P T E R 5 Microbial Metabolism Collection
Amino Acid Metabolism
 Amino Acid Metabolism Last Week Most of the Animal Kingdom = Lazy - Most higher organisms in the animal kindom don t bother to make all of the amino acids. - Instead, we eat things that make the essential
Lecture 29: Membrane Transport and metabolism
 Chem*3560 Lecture 29: Membrane Transport and metabolism Insulin controls glucose uptake Adipose tissue and muscles contain a passive glucose transporter GluT4 which takes up glucose from blood. (This is
AMINOACID METABOLISM FATE OF AMINOACIDS & UREA CYCLE
 AMINOACID METABOLISM FATE OF AMINOACIDS & UREA CYCLE SOURCE & FATE OF AA The aminoacids obtained from DIETARY SOURCE or BODY PROTEIN TURNOVER are utilized for protein biosynthesis and the production of
Amino Acid Catabolism
 Amino Acid atabolism 3-1 Lec #8 To date we have considered the catabolism of carbohydrates and lipids with the object of generating energy in the form of ATP. Both give rise to AcoA which is fed through
How Cells Harvest Energy. Chapter 7. Respiration
 How Cells Harvest Energy Chapter 7 Respiration Organisms classified on how they obtain energy: autotrophs: produce their own organic molecules through photosynthesis heterotrophs: live on organic compounds
Electron transport chain, oxidative phosphorylation, mitochondrial transport systems
 Electron transport chain, oxidative phosphorylation, mitochondrial transport systems JAN ILLNER Respiratory chain & oxidative phosphorylation INTERMEMBRANE SPACE ubiquinone cytochrome c ATPase Production
INTRODUCTORY BIOCHEMISTRY. BI 28 Second Midterm Examination April 3, 2007
 INTRODUCTORY BIOCHEMISTRY BI 28 Second Midterm Examination April 3, 2007 Name SIS # Make sure that your name or SIS # is on every page. This is the only way we have of matching you with your exam after
Short polymer. Dehydration removes a water molecule, forming a new bond. Longer polymer (a) Dehydration reaction in the synthesis of a polymer
 Dehydration reaction in the synthesis of a polymer") HO 1 2 3 H HO H Short polymer Dehydration removes a water molecule, forming a new bond Unlinked monomer H 2 O HO 1 2 3 4 H Longer polymer (a) Dehydration reaction in the synthesis of a polymer HO 1 2 3
HO 1 2 3 H HO H Short polymer Dehydration removes a water molecule, forming a new bond Unlinked monomer H 2 O HO 1 2 3 4 H Longer polymer (a) Dehydration reaction in the synthesis of a polymer HO 1 2 3
Chapter Five. Indirect Assay of Phosphorylation and Dephosphorylation. of PEP Carboxylase In Vitro
 Chapter Five Indirect Assay of Phosphorylation and Dephosphorylation of PEP Carboxylase In Vitro 86 Introduction The reversible phosphorylation of enzymes plays an important and ubiquitous role in the
THIOL REDOX SYSTEMS SOPHIA CEDER, LUU THANH THUY, STEPHENIE BAILEY, TIMOTHY NICODEMUS & ELLIN-KRISTINA HILLERT
 THIOL REDOX SYSTEMS SOPHIA CEDER, LUU THANH THUY, STEPHENIE BAILEY, TIMOTHY NICODEMUS & ELLIN-KRISTINA HILLERT THIOL REDOX SYSTEMS Thioredoxin system Glutaredoxin system Redundant, but not identical THIOREDOXIN
Metabolomics, a Useful Technique for Functional Genomics
 Metabolomics, a Useful Technique for Functional Genomics Metabolomics Workshop, University of Missouri April 16, 2013 Mingjie Chen, Department of Biochemistry, University of Missouri Metabolome is the
Glycobiology 8130, 18/1/2005 Spring 2005
 Glycobiology 8130, 18/1/2005 Spring 2005 Nucleotide-sugar donors. Maor Bar-Peled, CCRC; Plant Biology Peled@ccrc.uga.edu ISTRY 1906 arden and Young- discovered that yeast fermented with sugar accumulate
) one consumes in breathing is converted to:, which of the following would be found in the oxidized state?
 one consumes in breathing is converted to:, which of the following would be found in the oxidized state?") MCB 102: Pantea s Sxn Chapter 19 Problem Set Answer Key 1) Page: 690 Ans: E Almost all of the oxygen (O 2 ) one consumes in breathing is converted to: A) acetyl-coa. B) carbon dioxide (CO 2 ). C) carbon
MCB 102: Pantea s Sxn Chapter 19 Problem Set Answer Key 1) Page: 690 Ans: E Almost all of the oxygen (O 2 ) one consumes in breathing is converted to: A) acetyl-coa. B) carbon dioxide (CO 2 ). C) carbon
1 Digestion and absorption. Lecture #14 Lecturer: PhD Alexander N. Koval
 1 Digestion and absorption Lecture #14 Lecturer: PhD Alexander N. Koval Presentation of Protein 12/22/2016 A. Koval (C), 2016 2 Lectures plan 12/22/2016 A. Koval (C), 2016 3 Overview of Protein Metabolism
AMINO ACID METABOLISM
 AMINO ACID METABOLISM PHL-285 Biochemistry-2 Mahmoud N. Nagi, Ph.D. Professor of Biochemistry Overview of amino acid metabolism. Classification of amino acids. Biosynthesis of nonessential amino acids.
Biosynthesis of Fatty Acids
 Biosynthesis of Fatty Acids Fatty acid biosynthesis takes place in the cytosol rather than the mitochondria and requires a different activation mechanism and different enzymes and coenzymes than fatty
Algal Biofuels Research: Using basic science to maximize fuel output. Jacob Dums, PhD candidate, Heike Sederoff Lab March 9, 2015
 Algal Biofuels Research: Using basic science to maximize fuel output Jacob Dums, PhD candidate, jtdums@ncsu.edu Heike Sederoff Lab March 9, 2015 Outline Research Approach Dunaliella Increase Oil Content
Syllabus for BASIC METABOLIC PRINCIPLES
 Syllabus for BASIC METABOLIC PRINCIPLES The video lecture covers basic principles you will need to know for the lectures covering enzymes and metabolism in Principles of Metabolism and elsewhere in the
Chapter 8. An Introduction to Microbial Metabolism
 Chapter 8 An Introduction to Microbial Metabolism The metabolism of microbes Metabolism sum of all chemical reactions that help cells function Two types of chemical reactions: Catabolism -degradative;
Urea is the major end product of nitrogen catabolism in humans One nitrogen free NH3 other nitrogen aspartate. carbon oxygen CO2 liver,
 Urea is the major end product of nitrogen catabolism in humans Urea is the major disposal form of amino groups derived from amino acids, and accounts about 90% percent of the nitrogencontaining components
Photosynthesis in chloroplasts CO2 + H2O. Cellular respiration in mitochondria ATP. powers most cellular work. Heat energy
 Figure 9-01 LE 9-2 Light energy ECOSYSTEM Photosynthesis in chloroplasts CO2 + H2O Cellular respiration in mitochondria Organic + O molecules 2 powers most cellular work Heat energy LE 9-UN161a becomes
FREE ENERGY Reactions involving free energy: 1. Exergonic 2. Endergonic
 BIOENERGETICS FREE ENERGY It is the portion of the total energy change in a system that is available for doing work at constant temperature and pressure; it is represented as ΔG. Reactions involving free
Respiration. Respiration. How Cells Harvest Energy. Chapter 7
 How Cells Harvest Energy Chapter 7 Respiration Organisms can be classified based on how they obtain energy: autotrophs: are able to produce their own organic molecules through photosynthesis heterotrophs:
LAB#23: Biochemical Evidence of Evolution Name: Period Date :
 LAB#23: Biochemical Evidence of Name: Period Date : Laboratory Experience #23 Bridge Worth 80 Lab Minutes If two organisms have similar portions of DNA (genes), these organisms will probably make similar
Biochemistry: A Short Course
 Tymoczko Berg Stryer Biochemistry: A Short Course Second Edition CHAPTER 31 Amino Acid Synthesis 2013 W. H. Freeman and Company Chapter 31 Outline Although the atmosphere is approximately 80% nitrogen,
1. Describe the relationship of dietary protein and the health of major body systems.
 Food Explorations Lab I: The Building Blocks STUDENT LAB INVESTIGATIONS Name: Lab Overview In this investigation, you will be constructing animal and plant proteins using beads to represent the amino acids.
SIMPLE BASIC METABOLISM
 SIMPLE BASIC METABOLISM When we eat food such as a tuna fish sandwich, the polysaccharides, lipids, and proteins are digested to smaller molecules that are absorbed into the cells of our body. As these
Chapter 9. Cellular Respiration and Fermentation
 Chapter 9 Cellular Respiration and Fermentation Energy flows into an ecosystem as sunlight and leaves as heat Photosynthesis generates O 2 and organic molecules, which are used in cellular respiration
respiration mitochondria mitochondria metabolic pathways reproduction can fuse or split DRP1 interacts with ER tubules chapter DRP1 ER tubule
 mitochondria respiration chapter 3-4 shape highly variable can fuse or split structure outer membrane inner membrane cristae intermembrane space mitochondrial matrix free ribosomes respiratory enzymes
Integration of Metabolism
 Integration of Metabolism Metabolism is a continuous process. Thousands of reactions occur simultaneously in order to maintain homeostasis. It ensures a supply of fuel, to tissues at all times, in fed
R = Ribose / pentose (sugar). [3] (b) (i) Supplies energy; all reactions; in all cells; [Max 2] (not: produces)
![R = Ribose / pentose (sugar). [3] (b) (i) Supplies energy; all reactions; in all cells; [Max 2] (not: produces)](/thumbs/93/114252105.jpg "R = Ribose / pentose (sugar). [3] (b) (i) Supplies energy; all reactions; in all cells; [Max 2] (not: produces)") . (a) P = phosphate (not: phosphoric acid) Q = nitrogenous base / organic base / adenine; R = Ribose / pentose (sugar). [3] (b) (i) Supplies energy; all reactions; in all cells; [Max ] (not: produces)
. (a) P = phosphate (not: phosphoric acid) Q = nitrogenous base / organic base / adenine; R = Ribose / pentose (sugar). [3] (b) (i) Supplies energy; all reactions; in all cells; [Max ] (not: produces)
Cellular Respiration and Fermentation
 CAMPBELL BIOLOGY IN FOCUS URRY CAIN WASSERMAN MINORSKY REECE 7 Cellular Respiration and Fermentation Lecture Presentations by Kathleen Fitzpatrick and Nicole Tunbridge, Simon Fraser University SECOND EDITION