Vitamin K Intake in Patients with Diabetes and Chronic Kidney Disease. Ping Li
|
|
|
- Kelly Carson
- 6 years ago
- Views:
Transcription
1 Vitamin K Intake in Patients with Diabetes and Chronic Kidney Disease by Ping Li A thesis submitted in partial fulfillment of the requirements for the degree of Master of Science in Nutrition and Metabolism Department of Agricultural, Food and Nutritional Science University of Alberta Ping Li, 2015
2 Abstract Background: Diabetes and chronic kidney disease are two leading public health concerns. Patients with both diabetes and chronic kidney disease may be at elevated risk for suboptimal nutrient status due to diet restrictions, electrolyte and fluid imbalance, and altered metabolism. Objectives: The study objectives were to investigate dietary vitamin K intake in participants with diabetes and chronic kidney disease (CKD) and to identify their major food sources of vitamin K. Methods: Sixty-two adult participants were enrolled. The anthropometric/demographic data collected included: weight, height, Body Mass Index (BMI), age, and stage of CKD as reflected by the Glomerular Filtration Rate (GFR). The vitamin K intake was assessed by using two validated tools: a semi-quantitative Food Frequency Questionnaire (FFQ) and food records (FR). The FFQ was analyzed by using a systematic approach based on the United States Department of Agriculture (USDA) nutrient database (SR16-1), followed by a subset analysis of vegetables according to a validated classification, while the FR were analyzed by following a standard methodology using the USDA database (SR 27). Both estimates were compared to the Adequate Intake (AI). The reported energy intake was analyzed by using the Food Processor software. Results: The median age of the cohort was 65 years, and 36 (59%) participants had a GFR below 60mL/min/1.73 m 2. Fifty-five (89%) and 37 (60%) participants had a BMI ii
3 above 25kg/m 2 (overweight) and 30kg/m 2 (obese), respectively. The FFQ indicated that 37 (63%) participants (median=117mcg/d) met the AI for vitamin K, while the FR suggested only 12 (20%) participants (median=68mcg/d) met the AI by diet alone. The discrepancy existed partially because the FFQ was able to capture the episodically consumed vitamin K-rich foods. The major contributors to vitamin K were leafy vegetables (61%). Twenty-seven (44%) participants were likely to under-report, and 15 (56%) of them were obese. Conclusions: Adults with diabetes and CKD are at risk for suboptimal vitamin K intake by diet alone. The FFQ in general estimated a higher intake of vitamin K compared with the FR. More robust tools (e.g., recovery biomarkers as the reference instrument) may help detect under- or over-reporting and correct systematic bias and/or random errors associated with dietary intake assessment tools. iii
4 Preface This thesis is an original work by Ping Li. The research project received research ethics approval from the University of Alberta Research Ethics Board, Project Name Dietary intake and bone health in adults with diabetes and kidney disease, No. Pro (original date of approval: August 31, 2012; current date of expiration: August 28, 2015). This thesis is a subset analysis within overall project. No part of this thesis has been previously published. iv
5 Acknowledgements First, I would like to express my sincere appreciation to all of my study participants and their families. Their devotion to my research and kind encouragement were my main motivation for completing this thesis and exploring diabetes research. I would like to thank my supervisor Dr. Mager for her help with my studies and for providing prompt feedback. I would like to thank my co-supervisor Dr. Senior for his insightful guidance and for always responding promptly and patiently to my questions regarding the abnormal bloodwork of the participants and my thesis. I am very grateful to Dr. Jacobs for encouraging and supporting me to complete my master s marathon and participating as the committee chair in my final examination. I would like to thank Dr. Farmer for agreeing to participate as the external examiner in my thesis defense. I would like to thank Dr. Ferland and Dr. Presse for granting us permission to use the vitamin K-focused food frequency questionnaire and providing this thesis with the final total amount of vitamin K intake. I would like to thank my lovely volunteers, Rani, Brenda, Linda, Mary, and Sabrina, for their kind friendship and help with data entry. I would like to thank everyone in my lab group, Stephanie, Michelle, Lin, Ingrid, Abeer, Najala, Krista, Maha, Paige, and Simone, for their help. Many thanks to Michelle for participating in the study visits, nutrient and statistical analysis, and to Abeer and Simone for their assistance with data analysis and auditing. v
6 I would like to thank all of the clinical staff at the Diabetic Nephropathy Prevention Clinics and Renal Insufficiency Clinics, especially LeAnn (RN), Hayley (RD), Colleen (RN), Keri (RD), Janice (RN), Kristin (RN), for their help with the study participant recruitment and bloodwork follow-ups. I would like to thank our DXA technician Michelle for her help and for maximizing the flexibility with my participants schedules. I would like to thank my colleagues and fellow graduate students in the Li Ka Shing Center for always providing encouragement and offering help. Many thanks to Bonnie, Kristi, Tracy, Dr. Prado, Jingjie, Leticia, Bella, Arlene, Stephanie(s), and everyone else in the research unit; I will always remember their kindness. I would like to thank the graduate student program administer Jody for answering my questions so patiently and providing helpful guidance. I would like to thank my advisors, Nara and Lubna, at the International Centre for helping me sort out the issues related to my student visa. Last but not least, I would like to thank my family and friends for their unconditional love, solid support, and unbelievable faith in me. Special thanks go to my lifelong friends, Liang Yu, Michi, Yuzhu, and Tiange, for helping me through difficult times and sharing the sad and happy times together. And many thanks to Arlene, James, Julius, Kevan, and Kala for being so kind and supportive to me and for always being able to find a way to make me feel as if I were returning home whenever I visited them. Thank-you all from the bottom of my heart. It is a true blessing to have you as my family and friends. vi
7 Table of Contents Abstract... ii Preface... iv Acknowledgements... v Table of Contents... vii List of Tables... x List of Figures... xi List of Abbreviations... xii Chapter 1: Literature Review Background Nomenclature, chemical structure, and food sources of vitamin K Phylloquinone Menaquinones Menadione Vitamin K metabolism Absorption of phylloquinone and menaquinone Biosynthesis of menaquinones in the gut Conversion of phylloquinone to menaquinone Vitamin K Cycle Vitamin K-dependent proteins and their key roles Dietary recommendations of vitamin K Food frequency questionnaire (FFQ) Food records (FR) hour recall Limitations with dietary intake assessment methods Vitamin K intake in healthy and clinical populations National Health and Nutrition Examination Survey III Vitamin K intake and risk of developing diabetes Vitamin K intake and blood glucose metabolism Vitamin K intake and dietary eating patterns Vitamin K supplementation trials and blood glucose metabolism Conclusion vii
8 Chapter 2: Hypothesis, Aim, and Objectives Chapter 3: Subjects & Methods Study design and subject recruitment Study procedures Data collection - anthropometric, demographic, and relevant biochemical data Data collection - vitamin k-related dietary data Dietary data review Analysis of the food records Analysis of the vitamin K food frequency questionnaire Statistical analysis Chapter 4: Results Anthropometric and demographic information Dietary information assessed by food records One-day versus. Two-day versus. Three-day food records Under/Over-reporting of food records Effects of season, day of reporting, and intra-subject variability Food sources of vitamin K assessed by food group analysis of FFQ Vitamin K intakes based on food frequency questionnaire (FFQ) and food records (FR) Correlation and agreement between vitamin K intakes assessed by the FFQ and FR Adequacy of vitamin K intake assessed by the FFQ and FR Chapter 5: Discussion Main study findings Comparison between FFQ and FR Comparison of vitamin K intake with the literature Limitations of current study Next steps Implications/ Take-home messages Appendix A: Scanned study forms and questionnaires A1. Scanned study information letter A2. Scanned three-day food records Appendix B: Portion size tool kit B1. Portion size tool kit developed by Alberta Health and Wellness B2. Portion size tools continued viii
9 Appendix C: Development of Vitamin K Database and the Excel Calculator Appendix D: Supplementary tables and figures References ix
10 List of Tables Table 1. 1 Nomenclature and chemical structures of vitamin K....6 Table 1. 2 Phylloquinone concentration of common foods....8 Table 1. 3 Phylloquinone and menaquinone content of selected foods....9 Table 1. 4 Common bacterial species in food fermentation Table 1. 5 The Dietary Reference Intakes for vitamin K in adults Table 1. 6 Advantages and disadvantages of the commonly used dietary assessment tools Table 3. 1 Study outcome variables included in the study procedures Table 3. 2 Food records days included in data analysis Table 3. 3 Dietary sources of vitamin K based on the FFQ Table 4. 1 Demographic characteristics of the study participants Table 4. 2 Energy, macronutrient, and vitamin K intake based on participants with 1-day, 2-day, and 3-day food records Table 4. 3 Macronutrient intake of the participants with diabetes and chronic kidney disease based on food records Table 4. 4 Demographic and dietary information of under-reporters and non-under-reporters based on food records Table 4. 5 Vitamin K intake of the study participants based on the subgroup analysis of vegetables listed in the FFQ Table 4. 6 Daily dietary intakes of vitamin K (mcg/d) assessed by using the vitamin K-specific FFQ and food records Table 4. 7 Daily dietary intakes of vitamin K (mcg/d) assessed by using the vitamin K-specific FFQ and food records, separated by gender and compared with the Adequate Intake Table 4. 8 Distribution of participants who met and did not meet adequate intake Table 4. 9 Distribution of participants who met and did not meet 25% of adequate intake Table Distribution of participants according to ranking of quartiles Table C. 1 Vitamin K content database Table C. 2 Conversion factor for the frequency of consumption Table C. 3 Conversion factors for the serving size of food items in the FFQ x
11 List of Figures Figure 1. 1 Biosynthesis of menaquinone Figure 1. 2 The vitamin K cycle Figure 1. 3 Outline of the US Department of Agriculture (USDA) 5-step multiple-pass method for dietary recall Figure 3. 1 Participant recruitment diagram Figure 4. 1 Bivariate correlation analysis between age and duration of diabetes in the study participants with type 2 diabetes Figure 4. 2 Vitamin K intake based on subgroup analysis of the validated vitamin K-specific FFQ Figure 4.3. A Correlation of vitamin K intake measured by using the FR and FFQ in 59 participants who completed both FFQ and FR Figure 4.3. B Bland-Altman Plot: Agreement between dietary vitamin K intakes assessed by using the FR and FFQ in 59 participants who completed both FFQ and FR Figure 4.4. A Correlation of vitamin K intake measured by using the FR and FFQ in underreporters Figure 4.4. B Bland-Altman Plot: Agreement between dietary vitamin K intakes assessed by using the FR and FFQ in 25 under-reporters who completed both FFQ and FR Figure 4.5. A Correlation of vitamin K intake measured by using the FR and FFQ in non-underreporters Figure 4.5. B Bland-Altman Plot: Agreement between dietary vitamin K intakes assessed by using the FR and FFQ in 34 non-under-reporters who completed both FFQ and FR Figure 4.6. A Changes in quartiles of vitamin K intake assessed by using the FFQ and FR Figure D. 1 Bivariate correlation analysis between age and number of comorbidities Figure D.2. A Food group distribution of the study participants based on food records Figure D.2. B Percentage of the study participants not meeting recommended intake from each food group xi
12 List of Abbreviations ACLS = Aerobic Center Longitudinal Study AI = Adequate Intake AMDR = Acceptable Macronutrient Distribution Range ANCOVA = Analysis of Covariance ANOVA = Analysis of Variance BMI = Body Mass Index BMR = Basal Metabolic Rate CHD = Coronary Heart Disease CKD = Chronic Kidney Disease CRP = C-reactive protein CSFII = Continuing Survey of Food Intake by Individuals CVD = Cardiovascular disease d = Day DNPC = Diabetic Nephropathy Prevention Clinic DRI = Dietary Reference Intakes DXA = Dual-energy X-ray Absorptiometry FFQ = Food Frequency Questionnaire FR = Food Records g = Gram xii
13 Gas6 = Growth arrest-specific gene 6 Gla = Gamma-carboxyglutamic acid Glu = Glutamic acid residues Hr = Hour 24-hr recall = 24-hour recall HDL = High-density lipoproteins HR = Hazard Ratio HREB = Human Research Ethics Board IL-6 = Interleukin-6 IPAQ = International Physical Activity Questionnaire IUNS = International Union of Nutritional Science IUPAC-IUB = International Union of Pure and Applied Chemistry - International Union of Biochemistry KH2 = Vitamin K Hydroquinone Log = Logarithm MetS = Metabolic Syndrome Mcg = Microgram MK= Menaquinones N/A = Not Applicable NACTRC = Northern Alberta Clinical Trials and Research Centre NARP = Northern Alberta Renal Program xiii
14 NHANES = National Health and Nutrition Examination Survey Pt = Participant PT = Prothrombin Time KO = Vitamin K eposide LDL = Low-density lipoproteins MD = Menadione MGP = Matrix Gla Protein Non-UR = Non-Under-Reporters PIVKA-II = Prothrombin Induced by Vitamin K Absence-II PUFA = Polyunsaturated Fatty Acid Q1 = First quartile (0-25 percentile) Q2 = Second quartile (25-50 percentile) Q3 = Third quartile (50-75 percentile) Q4 = Fourth quartile ( percentile) RCT = Randomized Controlled Trial RIC = Renal Insufficiency Clinic RDA = Recommended Dietary Allowance rei:bmr = reported Energy Intake: Basal Metabolic Rate SAS = Statistical Analysis Software SES = Social-economic status TRL = Triacylglycerol-rich lipoprotein xiv
15 UBIAD1 = UbiA prenyltransferase containing 1 %ucoc = Percentage of undercarboxylated osteocalcin UR = Under-reporters USDA = United States Department of Agriculture VKDP = Vitamin K-dependent proteins VKOR = Vitamin K epoxide reductase xv
16 Chapter 1: Literature Review 1.1 Background In 1929, the Dutch biochemist Henrik Dam discovered a new type of fat-soluble vitamin due to its anti-hemorrhagic properties and named this new compound vitamin K because K stands for Koagulation in German and the Scandinavian languages; between 1939 and 1940, the American biochemist Edward Doisy and his colleagues successfully confirmed the chemical structures of vitamin K. As a result, both Dam and Doisy received the Nobel Prize in Physiology or Medicine 1943 for the discovery of vitamin K" and discovery of the chemical nature of vitamin K" [1]. The nomenclature of vitamin K had been modified multiple times since its discovery and the most current version was developed in 1973 by the International Union of Pure and Applied Chemistry - International Union of Biochemistry (IUPAC-IUB) subcommittee on nomenclature of quinones with side-chains [2]. Specifically, the two biologically active dietary forms of vitamin K are phylloquinone derived from green leafy vegetables and menaquinones from fermented foods such as cheese and natto beans. The chemical structures, detailed nomenclatures, dietary sources, functions and metabolism of vitamin K are presented in the following sections. Vitamin K is of interest to diabetes for several reasons. First, diabetic kidney disease is a common chronic complication of diabetes and a major contributor to endstage renal disease [3-5], and inadequate intake and subclinical status in patients with 1
17 stage 3-5 chronic kidney disease (CKD) were both reported to be prevalent in the literature [6,7]. Vitamin K is also indispensable for Gla-containing proteins metabolism such as growth arrest-specific gene 6 (Gas 6) and protein S, which were found to be elevated in patients with chronic kidney disease, potentially through an inflammationmediated pathway [8]. Second, both diabetes and chronic kidney disease are underlying causes of bone disease, which is associated with increased rate of fracture, mortality, and morbidity in the aging populations [9-12], and several key proteins in bone structure and metabolism have been shown to require vitamin K for their metabolism. For example, Vitamin K- dependent proteins (VKDP) such as osteocalcin and matrix Gla protein (MGP), required for bone synthesis and accrual, have been identified over the past decades and play an essential role in the bone and whole-organism metabolism [13,14]. Third, cardiovascular disease, another common risk factor accompanying diabetes, remains a leading cause of death in both developed and developing countries [15]. Many research studies have investigated the role of menaquinones (one form of vitamin K) intake and supplementation in reducing the risk of CVD, and found that the vitamin K-dependent protein MGP was closely associated with vascular calcification and thus may alter the underlying cardiovascular metabolism [13,16-18]. Fourth, vitamin K s physiological role in diabetes management, including glucose homeostasis and insulin sensitivity, is becoming an emerging area of research. The vitamin K-dependent protein osteocalcin, primarily found in the bone tissue and 2
18 perhaps working collaboratively with insulin [19], was found to be negatively associated with fasting blood glucose, HbA1C, and HOMA-IR in both healthy populations and patients with diabetes [20], and a few vitamin K supplementation trials found that vitamin K supplement at a pharmaceutical dosage was associated with improved acute insulin sensitivity in healthy male adults [21,22]. The population-based studies found that vitamin K intake may be inversely associated with diabetes risk later in life, as the participants with the highest quartile of phylloquinone intake had the lowest risk of developing type 2 diabetes during the follow-up [23], and for every 100 mcg/d increment of phylloquinone intake, the risk of incident diabetes reduced by 17% [24]. Finally, the underlying mechanism of vitamin K-dependent proteins in chronic kidney disease development, bone metabolism, heart health, and diabetes management is still awaiting elucidation from further in-depth research; from a nutrition perspective, the contribution of dietary vitamin K intake to the overall vitamin K metabolism and status, and to its potential role in managing chronic disease such as diabetes and chronic kidney disease, must be identified. 1.2 Nomenclature, chemical structure, and food sources of vitamin K Vitamin K consists of a number of chemical compounds that all share a common 2-methyl-1,4-naphtoquinone ring structure, but vary from each other at the 3-position [2] (Table 1.1). Each form of vitamin K and its corresponding chemical structures and dietary sources are discussed in the following paragraphs. 3
19 1.2.1 Phylloquinone Phylloquinone, formerly known as vitamin K1, is a single compound that has a phytyl group at the 3-position (Table 1.1). Phylloquinone is the major dietary source of vitamin K and can be obtained from green leafy green vegetables like Brassica (e.g., kale, cabbage, Brussels sprout, broccoli, and cauliflower) and spinach, some fruits like avocado and kiwi, and some plant oils like soybean and canola (Table 1.2) [16,25]. The United States Pharmacopeia used the nomenclature phytonadione instead of phylloquinone, and this synonym may be seen in the literature. Also, it is worthwhile to point out that the International Union of Nutritional Science nomenclature (details in Table 1.1), e.g., phytylmenaquinone as phylloquinone, was rarely used but may also appear in the literature [16] Menaquinones Menaquinones (MK), formerly named as vitamin K2, is a group name of a number of vitamin K derivatives with a poly-isoprenoid side chain at the 3-position of the 2-methyl-1,4-naphtoquinone ring. According to the IUPAC nomenclature (Table 1.1), menaquinones can be abbreviated as MK-n, in which n represents the number of isoprene residues [2]. Long chain menaquinones are predominantly produced in modest amount by the bacteria in a limited number of fermented foods such as cheeses and natto (Table 1.3) [16]. All menaquinones were grouped under the umbrella name of vitamin K2, and each MK form has its distinct origin, function, and distribution in the food supply [26]. For example, MK-4 is not produced by bacteria, and it is the only 4
20 menaquinone that can be converted from phylloquinone, menadione, or other menaquinones in specific tissues in mammals [27,28]. In addition, it is notable that MK-7 is especially rich in natto, the fermented soybeans commonly consumed in east Japan, with mcg of MK-7 in every 100g of natto [29]. Common bacterial species used in food industry for fermentation purposes include Lactobacillus and Bacillus (Table 1.4) [26] Menadione Menadione, traditionally known as vitamin K3, does not have a side chain at the 3-position but shares the parental structure with the other vitamin K derivatives. Menadione is not bioactive itself, but can be converted to MK-4 via alkylation [28,30]. In United States, menadione is used in poultry feed and thus its conversion to MK-4 increased total vitamin K content in poultry products; however, the organs with the highest concentration of MK-4 such as kidneys are not generally consumed so their contributions to the total vitamin K intake are insignificant, while other animal products such as milk, butter, and cheese made regular contributions to the overall vitamin K intake [30]. 5
21 Table 1. 1 Nomenclature and chemical structures of vitamin K. Chemical name Traditional IUPAC-IUB system a / IUNS system b Source 2-Methyl-1,4- K3 Menadione / Synthetic form naphthoquinone Menaquinone Chemical structure 2-Methyl-3-phytyl-1,4- naphthoquinone K1 Phylloquinone (K) / Phytylmenaquin one (PMQ) Green vegetables/ Plant-based oils 2-Methyl-3-multiprenyl- 1,4-naphthoquinone (class) K2(n) Menaquinone-n (MK-n) / Prenylmenaquin one-n (MQ-n) Bacteria/ Fermentation 2-Methyl-3- farnesylgeranyl-geranyl- 1,4-naphthoquinone K2(35) Menaquinone-7 (MK-7) / Prenylmenaquin one-7 (MQ-7) Bacteria/ Fermentation 2-Methyl-3-geranyl- geranyl-1,4- naphthoquinone K2(20) Menaquinone-4 (MK-4) / Prenylmenaquin one-4 (MQ-4) Bacteria/ Fermentation Adapted from IUPAC-IUB Subcommittee on nomenclature of quinones with side-chains, 1973 [2]. 6
22 a. IUPAC = International Union of Pure and Applied Chemistry. IUB = International Union of Biochemistry (now the International Union of Biochemistry and Molecular Biology (IUBMB)). The nomenclature is in general use at present time. b. IUNS = International Union of Nutritional Science. The nomenclature is seldom seen in the literature. 7
23 Table 1. 2 Phylloquinone concentration of common foods. Food Item a Vitamin K (mcg/ 100g) Food Item a Vitamin K (mcg/ 100g) Vegetables Protein Sources Collards 440 Dry soybeans 47 Spinach 380 Dry lentils 22 Salad greens 315 Liver 5 Broccoli 180 Eggs 2 Brussels sprouts 177 Fresh meats <1 Cabbage 145 Fresh fish <1 Bib lettuce 122 Whole milk <1 Asparagus 60 Tuna in oil 24 Okra 40 Iceberg lettuce 35 Prepared Foods b Green beans 33 Salad dressings 100 Green peas 24 Coleslaw 80 Cucumbers 20 Mayonnaise 41 Cauliflower 20 Beef chow mein 31 Carrots 10 Muffins 25 Tomatoes 6 Doughnuts 10 Potatoes 1 Potato chips 15 Apple pie 11 Fat and Oils French fries 5 Soybean oil 193 Macaroni/ cheese 5 Canola oil 127 Lasagna 5 Cottonseed oil 60 Pizza 4 Olive oil 55 Hamburger/ bun 4 Margarine 42 Hog dog/ bun 3 Butter 7 Baked beans 3 Corn oil 3 Bread 3 Reproduced (for improved resolution of chart) from Food and Nutrition Board, Institute of Medicine: Dietary Reference Intakes for Vitamin A, Vitamin K, Arsenic, Boron, Chromium, Copper, Iodine, Iron, Manganese, Molybdenum, Nickel, Silicon, Vanadium, and Zinc [25]. a. Median value obtained from Booth et al. (1993, 1995), Koivu et al. (1997), Piironen et al. (1997), and Shearer et al. (1996). Both cooked and raw food values were used. b. Phylloquinone content may vary widely depending on the source of oil used in preparation. Abbreviation: g = gram; mcg = microgram. 8
24 Table 1. 3 Phylloquinone and menaquinone content of selected foods. Food a Phylloquinone MK-4 MK-7 Other MK b Butter c <1 <1 Hard cheese c Soft cheese c Chicken meat d <1 30 <1 <1 Beef roast e 1 3 <1 <1 Egg yolk f 2 37 <1 1 Beef liver d Natto c 35 < Reproduced (for improved resolution of chart) from Suttie, 2009 [16]. Values are presented as microgram per 100 gram of food. a. Values are means of three to seven samples. b. Sum of MK-5, MK-6, MK-8, MK-9, and MK-10. c. Values from Schurgers and Vermeer (2000). d. Value from MK-4 is a mean of values from Schurgers and Vermeer (2000), Elder et al. (2006), Koivu et al. (1998), and Kamao et al. (2008). e. Value from Koivu-Tikkanen et al. (1998). f. Value for MK-4 is a mean of values from Schurgers and Vermeer (2000), Elder et al. (2006), and Kamao et al. (2008). 9
25 Table 1. 4 Common bacterial species in food fermentation. Species/ Subspecies Food Use Arthrobacter nicotinae Cheese Bacillus subtilis natto Brevibacterium linens Brochontrix thermosphacta Hafnia alvei Lactococcus lactis subsp. cremoris Lactococcus lactis subsp. Lactis Leuconostoc lactis Proionibacterium shermanii Staphylococcus equorum Natto Cheese Meat Cheese Cheese, buttermilk, sour cream, cottage cheese, cream cheese, kefir Cheese, buttermilk, sour cream, cottage cheese, cream cheese, kefir Cheese Cheese Dairy, meat Staphylococcus xylosus Dairy, sausage Adapted from Walther et al., 2013 [26]. 10
26 1.3 Vitamin K metabolism The following subsections will describe the absorption and transport of phylloquinone and menaquinone, summarize the biosynthesis of menaquinone in the gut, elaborate the newly defined conversion of phylloquinone into menaquinone-4 in the tissue, and briefly review the vitamin K epoxide cycle Absorption of phylloquinone and menaquinone On the one hand, the major form of dietary vitamin K, phylloquinone, is absorbed from the mucosa of the small intestine into the lymphatic system via incorporation into the chylomicrons [31,32]. Phylloquinone is transported primarily in triacylglycerol-rich lipoprotein (TRL) post-prandially, accumulated in the liver, and then being transported to extra-hepatic tissues such as bone. On the other hand, the gastrointestinal absorption and transportation of menaquinones have not been studied as extensively as phylloquinone at a cellular level at present. Schurgers and colleagues examined the lipoprotein transport pathways for MK-4, MK-7, and MK-9 in 2002 and 2007 [32,33], and found that both MK-4 and MK-9 were present in triglyceride-rich and low-density lipoproteins (LDL) post-prandially, and MK-4 was even detected in high-density lipoprotein (HDL). Additionally, the long-chain menaquinones (both MK-7 and MK-9) had relatively longer half-life than MK-4 and phylloquinone, and this may be related to their associations with LDL and was linked to a more stable serum level than phylloquinone or MK-4. Furthermore, a recent review by Walther and colleagues pointed out that up to 90% of the vitamin K storage in the liver 11
27 was consisted of long chain and highly lipophilic MKs, while other extra-hepatic tissues had much lower concentrations of long chain MKs [26]. It was important to note that MK-4, however, was widespread in the brain, kidneys, and pancreas, which may reflect the tissue-specific conversion of phylloquinone into MK-4 discussed in the following subsections [26] Biosynthesis of menaquinones in the gut It has been established for decades that the bacterial population in the large intestine play an important role in synthesizing long chain menaquinones [26,34,35]. The genera Bacteroides and Bifidobacteria are the most populous anaerobic microflora in the colon, and various Bacteroides species are capable of producing MK-10 and MK- 11, as well as a small amount of MK-7, MK-8, MK-9, and MK-12 [34]. It is beyond the scope of this thesis to justify the importance of microbiome in meeting vitamin K requirement; however, based on several extensive reviews [26,36,37], it was once estimated that the contribution from endogenous menaquinone production to the total vitamin K requirement accounted to up to 50%. Beulens and Walthers independently pointed out that the bioavailability of endogenously synthesised menaquinones by the gut bacteria remain unknown due to the following two reasons [26,37]. First, the absorption of all forms of vitamin K in the small intestine requires bile salt, but the concentration of bile salt is known relatively low in colon, so this may suggest a low absorption of menaquinones from the colon. It is possible that the menaquinones absorption takes place in a bile salt-independent route, but the mechanisms need 12
28 further investigation [26]. Second, the menaquinones endogenously produced by the bacteria remain bounded to the bacterial membrane, and consequently are not readily for absorption by human [26,37]. It was suggested that the endogenously produced menaquinones may be necessary in supporting basic coagulation functions in severely ill patients, but the currently available data are not sufficient or conclusive [37]. Therefore, understanding dietary sources of vitamin K are extremely important, in addition to elucidating the biosynthesis of vitamin K Conversion of phylloquinone to menaquinone-4 In 2010, the prenylation enzyme UbiA prenyltransferase containing 1 (UBIAD1) was first identified as a novel enzyme for the conversion of phylloquinone to menaquinone-4 (MK-4) in human [38]. The location of side chain cleavage and subsequent conversion from menadione to MK-4 remained unknown at that time. In 2013, new research by Hirota and colleagues identified the potential conversion pathway in rats, suggesting that phylloquinone first undergo side chain cleavage in the intestine and this produces an intermediate product menadione (MD) in quinone form. Then the MD-quinone is transported to the target tissue via mesenteric lymphatic system and blood circulation, and transformed to MD-hydroquinone form by the redox enzyme(s) (undetermined at present). Finally, the UBIAD1 enzyme assists the final conversion from MD-hydroquinone to MK-4 [39] (Figure 1.1). Further understanding of this conversion pathway in human is extremely important in assessing vitamin K requirement and metabolism. 13
29 1.3.4 Vitamin K Cycle Although vitamin K was discovered for its anti-hemorrhagic properties, the underlying mechanism was not fully understood until 40 years later [40] (Figure 1.2). All forms of vitamin K function as an enzyme cofactor and take part in the carboxylation of vitamin K-dependent proteins [26]. The hydroquinone form of vitamin K (KH2) is essential for the gamma-carboxylation of glutamic residues (Glu) to its active form gamma-carboxyglutamic acid (Gla). In this carboxylation reaction, KH2 is converted to vitamin K eposide (KO), which can be reduced to the quinone form by vitamin K epoxide reductase (VKOR). The quinone form of vitamin K can be further reduced to hydroquinone (KH2) by two enzymes: VKOR or NAD(P)H-dependent quinone reductase. Because VKOR activity can be inhibited by Coumadin-type drugs such as warfarin, the vitamin K cannot be recycled effectively in patients on anti-coagulant therapy. Therefore, it becomes apparent that sudden changes in vitamin K intake may negatively impact Coumadin s anti-coagulant effects and this may lead to severe medical consequences. Maintaining a constant intake of vitamin K, with as minimum variation as possible, is key in patients on anti-coagulant therapy [41]. 14
30 Figure 1. 1 Biosynthesis of menaquinone-4. Working hypothesis: The side chain of PK is cleaved to release MD during intestinal absorption followed by delivery of MD through a mesenteric lymphatic system and blood circulation to local tissues. After MD is reduced to the hydroquinone form by redox enzyme(s), it is converted to MK-4 by UBIAD1 (working hypothesis). Cited from Hirota et al., 2013 [39]. 15
31 Figure 1. 2 The vitamin K cycle. Vitamin K epoxide (KO) formed in the carboxylation reaction is reduced to the quinone form of vitamin by vitamin K epoxide reductase (VKOR). The quinone form of vitamin K can be reduced to the hydroquinone form (KH2), by VKOR or hepatic NAD(P)Hdependent quinone reductases. VKOR is warfarin-sensitive (i.e., VKOR activity can be inhibited by warfarin), and NAD(P)H-dependent quinone reductases is less warfarinsensitive. Adapted from Ferland, 2012 [13]. 16
32 1.4 Vitamin K-dependent proteins and their key roles Following the discovery of the amino acid gamma-carboxyglutamic acid (Gla; details in the vitamin K cycle), many other vitamin K-dependent proteins (VKDP) were detected and studied. Besides the well-established essential function in blood coagulation, vitamin K s vital roles in bone metabolism, vascular calcification, insulin sensitivity, brain health, and inflammation [28] are being linked to a number of vitamin K-dependent proteins. The most common blood coagulation proteins include four procoagulants, prothrombin (factor II), factor VII, IX, and X which participate in the process of forming a fibrin clot; in contrast, protein C, S, and Z all inhibit of the procoagulant s activity [16]. Osteocalcin is a key vitamin K-dependent protein produced by osteoblasts and odontoblasts, and it may take part in mechanisms beyond bone metabolism. It contains three Gla proteins and serves as a multi-functional hormone which affects bone mineralization, regulates insulin sensitivity, modulates energy metabolism, and impacts testosterone production [14]. Lee and Karsenty [42] found that osteocalcin knockout mice were hyperglycemic, had lower insulin level and sensitivity, and decreased energy expenditure, and several cross-sectional studies in human had similar findings [43-47]. It appeared that osteocalcin and/ or percentage of undercarboxylated osteocalcin (%ucoc) contributed to the whole-organism physiology by providing potential interactions between bone metabolism, glucose homeostasis, and insulin sensitivity [20,48]. 17
33 Furthermore, matrix Gla protein (MGP), another vitamin K-dependent protein detected in both mineralized tissues and many soft tissues, contains five Gla proteins and accumulates in calcified tissues and inhibits calcification. Compromised capability of MGP to prevent vascular calcification may alter the underlying cardiovascular risk factors [13,16]. In addition, another two vitamin K-dependent proteins which may have an impact on kidney disease management and have attracted many research interests recently are protein S and growth arrest-specific gene 6 (Gas6), which share a high degree (up to 40%) of homology [49]. Protein S is expressed in a number of body tissues including osteoblasts, hepatocytes, and endothelial cells; Gas6 is also expressed in a variety of tissues such bone marrow, endothelial cells, and vascular smooth muscle cells [49]. Both protein S and Gas6 are involved with mediation of inflammation, through activation of TAM receptors (Tyro3, Axl, and Mer) [50]. Lee and colleagues observed that both Gas6 and protein S are higher in patients with chronic kidney disease than the normal controls, and the elevation of Gas6 reached statistical significance [8]. This group of researchers also found that elevated Gas6 was associated with lower kidney function, higher IV iron administration as well as low albumin, and this abnormal regulation of Gas6 may indicate a new inflammatory pathway in patients with CKD. Additionally, Arai and colleagues independently found that streptozotocin-induced Gas6-knockout mice developed diabetic nephropathy [51]. Finally, Gas6 also exhibits growth-factor 18
34 properties, playing a role in cell differentiation, proliferation, apoptosis protection, and cell growth regulation [52]. 1.5 Dietary recommendations of vitamin K The most recent Dietary Reference Intakes (DRI) developed for vitamin K was dated back to 2001 [25], and at that time the Adequate Intake for vitamin K was established as 90mcg/day for females and 120mcg/d for males over 19 years of age. The above AI range is based on the median intakes of vitamin K from the NHANES III data [25]. The Recommended Dietary Allowance (RDA) could not be established due to insufficient quantity and quality of research data from dose-response studies, inadequate evidence for the full spectrum of vitamin K s physiological roles in the body, and a lack of clear-defined biomarkers or endpoints which can be used as the basis for recommendation [16,25]. Globally, the lack of consistency in the selection of endpoint of vitamin K adequacy, for example, carboxylation for extra-hepatic VKDPs requires higher vitamin K intake than just supporting the carboxylation for hepatic coagulation proteins, can also be reflected by the relatively wide DRI ranges listed in Table 1.5. In addition, no Upper Limit (UL) was established for vitamin K according to the most current DRI guidelines [25]. 19
35 Table 1. 5 The Dietary Reference Intakes for vitamin K in adults. Country Female Male Belgium Croatia Germany/ Switzerland/ Austria years > 50 years Japan years years New Zealand/ Australia UK 1mcg/kg/d 1mcg/kg/d USA/ Canada/ Montenegro/ Albania WHO/ Bosnia/ Herzegovina/ Poland Unit: microgram daily, unless otherwise indicated. Adapted from Shearer, 2012 [31]. Abbreviation: d = day; kg = kilogram; mcg = microgram. 20
36 1.6. Tools for assessment of dietary intake Accurate dietary intake assessment is crucial for nutrition studies, and wellestablished comprehensive tools for assessing nutrient intakes include food frequency questionnaire (FFQ), food records (FR), and 24-hour recall [53]. The advantages and disadvantages of all three tools are elaborated in Table Food frequency questionnaire (FFQ) Food frequency questionnaire (FFQ), as the name indicates, is a written set of questions that assesses nutrient intakes based on how often and how much a certain food item is consumed. Typically FFQs are focused on specific nutrients (e.g., vitamin D, calcium, vitamin K) or a group of nutrients, and therefore, are designed to examine frequency or magnitude of intake of specific food items that are known to be high in the nutrients of interests. Also, FFQ has a unique characteristic, in that it is sensitive to seasonal variation as the questionnaire is designed to assess intakes over a specific period of time, rather than several days. Furthermore, FFQ can be self- or intervieweradministered, and provides relatively reliable data for the purpose of ranking nutrient intakes in the target population. It is especially practical and cost-effective in research with large sample size, such as population-based studies. On the other hand, a FFQ cannot possibly cover all foods and beverages containing a specific nutrient, or capture the nutrient differences in all food items listed in the same food group. In other words, a FFQ is more prone to under- or over-reporting, and consequently is more useful in 21
37 ranking participants according to their intake, rather than assessing the intake adequacy of a specific nutrient [53]. Known factors that could impact the FFQ results include the mode of administration, specificity (country, age, etc.), and use of portion-size aide [54,55]. For example, Cade and colleagues found that interviewer-administered FFQs provided higher correlation coefficients with the reference method (food records or diet recalls) than those self-administered, as the inconsistency may be caused by the betweenindividual variance and/ or incompleteness of the answers [54]. Moreover, Pritchard and colleagues emphasized that a valid FFQ should be age-, country-, and nutrientspecific to detect the inter-individual variances of the study population [54,55]. An example would be kimchi cabbage, which is a rich source of vitamin K in the typical Korean diet and usually included in the Korean national survey, but may not be necessarily included in a FFQ designed for use in European countries or North America. Some FFQs targeted a number of nutrients, and the lengths may range from 79 to more than 126 items [56-58], but their use may impose a limitation in assessing a specific nutrient, such as vitamin K, of which the dietary source is not as widespread as the sources of other nutrients and thus the FFQ may not be able to capture all vitamin K-rich sources [59]. Finally, the use of a portion-size aide, such as a picture booklet, may help participants estimate serving size and eliminate between-individual variability [55]. 22
38 1.6.2 Food records (FR) The food records is a prospective method that may be used to assess nutrient intakes by keeping a log of foods and beverages consumed over a specific period of time (e.g., 3-7 days). The distinctive characteristic of the FR is that it allows for real time recording and detects day-to-day variation in intake, and this may be advantageous in terms of capturing the food items consumed episodically, such as vitamin K-rich foods. Presse and colleagues found that a minimum of 6 days of diet recording is required to reflect the usual intake of vitamin K in the elderly [60]. Additionally, the food records are often used to validate other dietary assessment tools such as FFQ [53]. One important drawback of the food records is the burden it adds to the participant, as it requires them to have skills in portion size estimation, time investment to write the log, and literacy to accurately document the actual intake [53,61]. The second potential shortcoming of the food records is that the act of recording itself may cause changes in dietary behaviours. The recorder may become more aware of the type and quantity of food items consumed and the food records may not represent the habitual intake [61]. The third potential challenge is related to the data coding and associated personnel costs to the research project. Training of both the food recorders and the data coders are important strategies to maintain high quality food records [61] hour recall The 24-hour (hr) food recall is a retrospective method in which a trained health professional interviews and helps the participant to recall what and how much of each 23
39 food item was consumed in the previous 24 hours. One of the major advantages of conducting a 24-hr recall is that it does not require the client to be literate, compared with a self-administered FFQ or the food records. Nevertheless, a single 24-hour food recall serves only as a snapshot of the participant s intake and does not reflect the dayto-day intra-individual variance or seasonal variations, although this limitation could be addressed by conducting multiple 24-hour recalls [53,62]. Furthermore, the 24-hour food recall is highly dependent upon the participant s memory and cooperation, and requires the interviewer to be knowledgeable about foods and to use a systematic approach to obtain complete and accurate food recalls [61]. A multi-pass method is a valuable approach to improve recall completeness and reduce respondent burden while conducing 24-hr diet recall. The detailed USDA Automated Multiple Pass [62] is listed in Figure 1.3. In the first pass, the interviewer collects a quick list of all food items and beverages consumed by the participant in the previous 24 hours; in the second pass, the interviewer clarifies with the participant regarding any potential forgotten items; in the third pass, the interviewer confirms the time and occasion of each meal; in the fourth pass, the interviewer asks details of each item, including portion size, preparation method, brand name, etc.; and in the final pass, the interviewer re-checks with the participant to ensure completeness of the diet recall. Household measurement tools, food models, and/or food photographs can be used to assist portion size estimation. 24
40 1.6.4 Limitations with dietary intake assessment methods Besides the inherent disadvantages associated with FFQ, FR, and 24-hour recall discussed in the above sections, systematic missing data and under-reporting pose two main limitations in the dietary intake assessments. Missing food items or missing portion sizes on the questionnaire, which may be due to respondent fatigue or an oversight [61], may lead to a statistical analysis challenge. One way to correct the biased report is to use a systematic approach to calculate a correction factor for the large population-based studies. Welten [63] and colleagues examined the three-day food records collected for the Aerobic Center Longitudinal Study (ACLS) and investigated the effects of substituting the standard portion size for the missing portion sizes. As expected, the absolute intake was affected by the substitution; however, the study results also demonstrated that the substitution still provided a good ranking (i.e. similar trend) of the nutrient intake among the study participants. Subsequently, the authors used a systematic approach to establish a correction factor which was genderspecific (male=1.615; female=1.368); after adjustment, an increased agreement between the nutrient intake based on corrected standard portion size and the absolute intake was observed. This agreement was further confirmed in the Continuing Survey of Food Intake by Individuals (CSFII). Consequently, the use of an adjusted standard portion size may be able to substitute the missing portion sizes and improve agreement with the absolute intake. 25
41 Another way to help reduce omissions or missing data is to provide comprehensive instructions to the participants prior to entry of study. Kwan and colleagues pointed out that the most common four types of missing data included: omissions of serving size amount, description of food items, preparation method, and recipe or mixed food ingredients, which were present in % of participants who received basic instruction on filling out food records [64]. However, for the group who received more comprehensive instructions on how to complete food records, the error rate decreased considerably to %. The researchers suggested that with proper instruction, the food records could even be used for large epidemiological studies. In addition, under-reporting in study participants is not uncommon. A thorough review done by Black and Cole suggested that under-reporting was characteristic of study participants over time and when assessed by different dietary assessment tools [65]. In other words, repeated measurements or prolonged period of assessments did not necessarily correct the biased reports. Fortunately, either under- or over-reporting could be potentially identified by techniques such as Goldberg cut-off [66] where reported energy intake (rei) was compared with the measured or calculated Basal Metabolic Rate (BMR). The specific cut-offs used in the literature for under-reporting varied and the ratio of rei:bmr ranged from 1.10 to 1.35 [67,68]. Moreover, if applicable, measurement of physical activity will be an asset in estimating energy expenditure in the study participants [65]. 26
42 Figure 1. 3 Outline of the US Department of Agriculture (USDA) 5-step multiple-pass method for dietary recall. Adapted from Conway et al., 2003 [62]. 27
43 Table 1. 6 Advantages and disadvantages of the commonly used dietary assessment tools. Dietary tool Advantages Disadvantages Food frequency questionnaire (FFQ) - sensitive to seasonal variation (temporal range: month to year) - convenient to administer (can be self- or interviewer-based) - reliable for the purpose of ranking nutrient intake - cost-effective and practical in research with large sample size - impossible to cover all foods or beverages - difficult to capture the nutrient differences in all food items listed under the same category - unsuitable for assessment of intake adequacy - likely to under- or over- estimate Food records (FR) - suitable for real time recording - sensitive to day-to-day variation of intake - useful to validate other dietary assessment tools - literate and motivated participants, willing to invest time and skilled in portion estimation - Act of recording may alter dietary behaviors (weakness when the aim is to measure typical dietary behaviors) - Burden associated with data coding and potential high personnel cost 24-hour recall (24-hr recall) - less burden on the client s part - convenient to administer (in person or by phone) - relatively quick to conduct interviews Adapted from Bross et al., 2013 [53] and Thompson et al [61]. - difficult to capture day-to-day variation of intake (unless conduct multiple diet recalls) - memory-dependent on the client s part - reliant on interviewer s skill set - reliant on client s cooperation 28
44 1.7 Vitamin K intake in healthy and clinical populations The following subsections summarize several important studies examining vitamin K intake in both healthy populations and participants with diabetes National Health and Nutrition Examination Survey III According to the Institute of Medicine (US), the National Health and Nutrition Examination Survey (NHANES) III data collected between demonstrated that the median total intake of vitamin K for male adults older than 19 years ranged from 89.0 to 117.0mcg/d (n=7623) and for female adults ranged from 79.0 to 88.0mcg/d (n=8273; excluding pregnancy or lactation). The above ranges formed the basis of Adequate Intake for vitamin K established in 2001 [25]. Cheung and colleagues [6] followed up with a subset of the NHANES III participants that had chronic kidney disease (GFR<60 ml/min/1.73m 2 or albumin-creatinine ratio 30mg/g) at time of participation and examined their vitamin K intake and mortality. It is important to point out that out of a total of 3401 subjects (mean age=61.9yr, two thirds female) met the inclusion criteria, as high as 72% of them had vitamin K intakes below the recommended adequate intake (mean intake = 97.5mcg/d) based on one 24-hr recall. Additionally, 1815 subjects deceased due to all-cause mortality and out of which 876 were due to cardiovascular disease (CVD). According to the categorical model, the subjects with adequate vitamin K intake exhibited 15% lower call-cause mortality and 22% lower CVD mortality. 29
45 1.7.2 Vitamin K intake and risk of developing diabetes A population-based study [23] examined the potential associations between intakes of phylloquinone and menaquinone and the risk of developing type 2 diabetes in Dutch men and women aged years. Beulens and colleagues found that vegetables contributed to a total of 78% phylloquinone intake, while cheese contributed to a total of 53% menaquinones intake. Furthermore, during a median follow-up of 10.3yr, 918 cases of type 2 diabetes were confirmed out of the entire cohort. After adjustment for dietary and diabetes risk factors, the highest quartile of phylloquinone intake was found inversely associated with diabetes risk (p=0.08; HR=0.81 [ ]). Moreover, in the multivariate model, for every 10 mcg increment of menaquinones intake, the risk of type 2 diabetes was decreased accordingly (p=0.038; HR=0.93 [ ]). In 2012, based on a unique and comprehensive study design which accommodated both cross-sectional and longitudinal analysis, Ibarrola-Jurado and colleagues [24] investigated the effects of phylloquinone intake on the development of type 2 diabetes in the elderly with high cardiovascular risk. The cross-sectional analysis compared the baseline phylloquinone intake in those developed type 2 diabetes during study follow-ups with those who did not develop diabetes, and as expected, significantly lower intake of phylloquinone at baseline was detected in subjects with development of type 2 diabetes; notably, with a hazard ratio of 0.83, for every 100mcg/d increment of phylloquinone intake, the risk of incident diabetes reduced by 17%. According to the 30
46 longitudinal analysis, for subjects who increased phylloquinone intake during the study follow-up period, a 51% decrease in risk for incident diabetes was reached, compared to those who decreased or did not change phylloquinone intake (after adjustment: p=0.001; HR=0.49 [ ]). Both studies reinforced the importance of vitamin K intake in the reduction of type 2 diabetes risk Vitamin K intake and blood glucose metabolism Although many new physiological roles of vitamin K have been established since the 1970s, the research in vitamin K s role in glucose homeostasis and insulin sensitivity was not well recognized until the past two decades. In 1999, Sakamoto and co-workers [69] investigated the effects of vitamin K intake on pancreas function in rats and found that a low vitamin K diet impacted the rat s glucose tolerance by inducing a tendency for a delayed insulin response post an oral glucose load. Subsequently, the same research group confirmed the above findings in human. In the same year, Sakamoto and coworkers [44] examined the effects of vitamin K intake (self-reported; based on a food checklist) on insulin response and found that those subjects with lower vitamin K intake had a significantly lower insulinogenic index (0.4 versus 0.9) post an oral glucose loading, compared to their counterparts who reported higher vitamin K intake; they suggested that vitamin K intake may modify acute insulin response following an oral glucose ingestion. Since then, many studies have investigated the role of vitamin K in glucose metabolism and insulin response. A recent extensive review [20] summarized the key papers that studied vitamin K s contribution to glucose metabolism and concluded that 31
47 osteocalcin appeared to be negatively associated with fasting blood glucose, HbA1C, and HOMA-IR in both healthy population and patients with diabetes, metabolic syndrome, or at high risk for cardiovascular disease. However, whether total osteocalcin or undercarboxylated osteocalcin played a more significant role is still open to debate Vitamin K intake and dietary eating patterns The NHANES III participants with CKD demonstrated that inadequate intake of vitamin K was associated with lower intake of dietary fiber and total energy, lower education, and less physical activity; furthermore, the adequacy state of vitamin K intake (not exact amount of intake) was inversely and significantly associated with allcause and CVD mortality [6]. Similarly, Erkkila and colleagues found that participants with adequate phylloquinone intake tended to have healthier eating patterns and healthier lifestyles, as reflected by lower intake of fat, higher intake of protein from either animal or plant source, higher intake of fiber and whole grain products, higher level of physical activity, and lower rate of smoking, in both the Nurse s Health Study [58] and Health Professionals Follow-up Study [57]. Moreover, the Rotterdam Study [56] found that phylloquinone was positively associated with intakes of dietary fiber, calcium, vitamin antioxidants, flavonols, although menaquinone was positively associated with intakes of fat and saturated fat. In addition, the fifth Framingham Offspring Cohort study [70] concluded that phylloquinone intake could be indicative of a heart-healthy diet approach. It is important to point out that the link between vitamin K and healthier lifestyles may be a confounding factor for the detected lower mortality in participants 32
48 with adequate intake; in other words, the combination of all healthier lifestyle factors, instead of vitamin K intake per se, may have contributed to the observed health benefits (lower mortality or lower coronary heart disease risk). The health benefits of vitamin K that are independent of a healthier lifestyle have not been elucidated by current literature. Finally, several studies [24,56-58] based on the above cohorts had independently identified the predominant dietary sources of phylloquinone, include but not limited to Brassica (kale, cabbage, Brussels sprout, broccoli, and cauliflower), lettuce (iceberg, romaine, etc.), spinach, endive chard, escarole, and plant-based oils. 1.8 Vitamin K supplementation trials and blood glucose metabolism A few supplementation trials had investigated the effects of vitamin K supplementation on glucose metabolism and insulin sensitivity in the healthy elderly and young population in the past two decades and had reached mixed findings, ranging from lack of effects observed in female s glucose metabolism [71,72] to increased insulin sensitivity in healthy young [21,22] and elderly [71] male. Both small-scale studies [21,22] that used MK-4 as the supplement form in healthy young male volunteers independently concluded that 1-4 weeks of MK-4 supplementation at a pharmacological dose (30mg three times daily or 90mg/d) was associated with improved insulin response, although the underlying mechanisms were awaiting elucidation. Choi and Yu [22] speculated that the improved insulin sensitivity was more likely to be related to the significant increase in carboxylated osteocalcin (9.6 to 16 ng/ml, p=0.01), rather than the modulation through inflammation because neither C- 33
49 reactive protein (CRP) nor interleukin-6 (IL-6) changed considerably post 4 weeks of 90mg/d MK-4 supplementation. In contrast, the other two long-term (12 to 36 months) interventions [71,72] that used phylloquinone as the supplement form in elderly women did not detect any significant changes in glucose metabolism outcomes (HOMA-IR), although one of the studies detected almost 200% reduction in uncarboxylated osteocalcin post 12 months of phylloquinone supplementation. It is notable that none of the above trials assessed the dietary vitamin K of the subject and this remains as a limitation of these interventions. 1.9 Conclusion Mounting evidence has demonstrated that vitamin K s physiological role goes well beyond blood coagulation, bone metabolism, and cardiovascular health; vitamin K s contribution to diabetes, glucose homeostasis, and insulin sensitivity is becoming an emerging and interesting area of research. Both animal and human studies have demonstrated that vitamin K intake plays a vital role in glucose metabolism and insulin response. Phylloquinone was well recognized as an indicator of a healthier diet, and thus its role in chronic disease management should be independent of the confounding factors associated with a healthy eating pattern. Menquinone-4 supplementation at a pharmaceutical dose to the healthy male volunteers showed promising improvements in insulin sensitivity, potentially through the action of osteocalcin and/ or inflammation modulation. Several large cohorts and population-based studies had independently shown the importance of increased vitamin K intake in the reduction of type 2 diabetes 34
50 risk. Therefore, from a nutrition perspective, it is crucial to assess the vitamin K intake in patients with diabetes and chronic kidney disease and elucidate the role of each form of vitamin K and its contribution to vitamin K status and metabolism. 35
51 Chapter 2: Hypothesis, Aim, and Objectives According to the International Diabetes Federation, diabetes was present in 382 million people worldwide and led to 5.1 million deaths during 2013 [15]. Up to half of the patients with diabetes develop chronic kidney disease during their lifetimes, and patients with diabetes have 2 to 4 times higher risk of developing vascular disease than those who do not have diabetes [73]. Additionally, both diabetes and chronic kidney disease contribute to suboptimal bone health and increased morbidity [9,10]. Vitamin K, one of the fat-soluble vitamins well known for blood coagulation, is of interest for the management of diabetes and diabetes-related risk factors. As a cofactor in the carboxylation of glutamic acid residues (Glu) to gammacarboxyglutamic acid (Gla), vitamin K is indispensable to the vitamin K-dependent proteins (VKDP). These VKDPs play key roles in regulating blood coagulation (e.g., factor II, VII), bone health, and insulin sensitivity (e.g., osteocalcin); inhibiting vascular calcification (e.g., matrix Gla protein); and modulating inflammation (e.g., growth arrestspecific gene 6) [13,28,74]. Furthermore, both animal and human studies found that osteocalcin and/ or percentage of undercarboxylated osteocalcin (%ucoc) played a multifactorial role in the interactions among bone metabolism, glucose homeostasis, and insulin sensitivity [20,48]. Studies of animal models showed that osteocalcin knockout mice were hyperglycemic, had lower insulin level and sensitivity than their counterparts, and decreased energy expenditure [42]; several cross-sectional studies of 36
52 humans also had similar results [43-47,75]. Although the vitamin K supplementation trials in glucose metabolism had mixed findings, ranging from the lack of effects observed in females glucose metabolism [71,72] to increased insulin sensitivity in healthy young [21,22] and elderly [71] males, vitamin K appeared to be closely intertwined with glucose metabolism and insulin regulation through the action of osteocalcin. Additionally, in the literature [6,7], vitamin K intake and status were found to be suboptimal in patients with stage 3-5 chronic kidney disease and vitamin K intake may be used as an indicator of healthier diet [70]. Therefore, from a nutrition point of view, it is important to accurately estimate the dietary intake of vitamin K and identify each form of vitamin K s contribution to the overall vitamin K metabolism in patients with chronic kidney disease. A number of studies investigated vitamin K intake and its association with chronic illness such as coronary heart disease (CHD) [56-58,70], chronic kidney disease (CKD) [6,7], and diabetes mellitus [23,24,74]. The observed range of mean vitamin K intake was highly variable, from under 80mcg/d to over 320mcg/d. Part of the variation occurred because the food sources of vitamin K are not ubiquitous, and consequently, the vitamin K-rich foods may be consumed only episodically, and the food records or 24- hour recall may not provide sufficient days to accurately reflect usual vitamin K intake [60]. Moreover, different dietary assessment tools (e.g., the food frequency questionnaire versus. the food intake diary, the generic versus. the vitamin K-focused food frequency questionnaire) used in research with different study designs may also 37
53 cause discrepancies in the amount of reported vitamin K intake. To the best of our knowledge, no published research is currently available on the dietary intake of vitamin K, using more than one validated dietary assessment method, in patients with both diabetes and chronic kidney disease. Hence, we set out to examine the dietary intake of vitamin K in study participants with both diabetes and chronic kidney disease by using standard dietary assessment tools. Hypothesis: People with diabetes and chronic kidney disease will have a suboptimal intake of vitamin K, which may be difficult to ascertain by using generic assessment tools. Aim: To describe vitamin K intake by using 2 tools, the food frequency questionnaire and food records, in participants with diabetes and chronic kidney disease. Objectives: (1) To estimate the vitamin K intake in adult patients with diabetes and stage 1-4 chronic kidney disease by using a validated semi-quantitative food frequency questionnaire (FFQ) and food intake records; (2) To identify the main food sources of vitamin K within the diet of the study population by using the vitamin K-focused FFQ; and (3) To compare the correlation and agreement between food records and the vitamin K- specific FFQ. 38
54 Chapter 3: Subjects & Methods 3.1 Study design and subject recruitment This cross-sectional intake study was under the umbrella of a larger vitamin D project which contained a vitamin D supplement randomized control trial [76] (Figure 3.1). The study participants were enrolled from the Northern Alberta Renal Program (NARP) clinics, namely, Diabetic Nephropathy Prevention Clinics (DNPC) and Renal Insufficiency Clinics (RIC), between December 2012 and December 2013 [77]. The NARP clinics provide clinical care to patients with diabetes and chronic kidney disease (CKD) and include a multidisciplinary team of nephrologists, endocrinologists, Registered Nurses, Registered Dietitians, and other allied healthcare providers. The DNPC (located at the Northeast Community Health Centre and St. Marguerite Health Services Centre) assesses patients with earlier stages of CKD and all attending patients had diagnosed diabetes, while RIC (located at the University of Alberta Hospital, Grey Nuns Community Hospital, and Royal Alexandra hospital) offers care to patients with later stages of CKD, either with or without diabetes. Ethics Approval was obtained from the Human Research Ethics Board (HREB) at the University of Alberta. Operational approval was obtained from Northern Alberta Renal Program (NARP), Northeast Community Health Centre at Alberta Health Services, and the administrative approval was obtained from the Northern Alberta Clinical Trials and Research Centre (NACTRC). 39
55 Subject eligibility for the current study was assessed in two processes: (1) the research team conducted the initial screening by reviewing the NARP active patient lists and filtering out the ineligible patients according to diagnosis and age (adult patients who did not have diabetes and who were older than 80 years of age were excluded); (2) the clinic staff asked if the potential patients might be interested in a research study, and if the patient agreed, the research team conducted further screening to ensure the all inclusion criteria were met and then followed up with phone calls providing details about the study and addressing potential questions from the patients. For the subjects who had completed the vitamin D supplement randomized controlled trial (RCT) and expressed interest in future relevant studies, a telephone screening was conducted to ensure they were eligible to enroll in this cross-sectional survey. In total, 62 participants were enrolled in this cross-sectional study: 41 completed the abovementioned vitamin D supplement trial, 19 were recruited independently from the clinics, and 2 were recruited from the community who were not attending either DNPC or RIC at the time of study enrollment. Detailed inclusion and exclusion criteria of the main study were described elsewhere [76]. Once verbal consent to book a study visit was obtained on the phone, all relevant study documents (information letter, blank consent form to be signed at study visit, questionnaires, a sample food records day, and campus map) were ed/ mailed out to the study participants immediately. A phone/ confirmation was made 3-5 business days prior to the scheduled study visit to verify attendance. 40

56 Figure 3. 1 Participant recruitment diagram. Out of the 62 participants, 41 completed a previous vitamin D supplement study and were followed-up by the current study, 19 participants were recruited independently from the Diabetic Nephropathy Prevention Clinics and the Renal Insufficiency Clinics, and the other 2 participants were recruited from the community but who were not attending either DNPC or RIC at the time of enrollment. 41
57 3.2 Study procedures The study visit was conducted in the Clinical Research Unit of the University of Alberta. Informed consent to the study was obtained from each research subject, prior to the initiation of the following study procedures (Table 3.1). It is important to point out that only the dietary information related to dietary vitamin K intakes and the relevant demographic and anthropometric data were included in the write-up of this thesis, and the complete procedures were included in this section for reference purposes only: (i) anthropometric measurement (height, weight, body mass index); (ii) demographic data collection (details in the Results chapter); (iii) biochemical assessment (HbA1C, GFR, creatinine, etc.); (iv) body composition and bone mineral density measurements by the Dual-energy X-ray Absorptiometry (DXA; General Electric LUNAR Prodigy, Model 8743, Madison, Wisconsin, USA); (v) clinical management review including medical history, medication type, and supplement use; (vi) overall dietary evaluation by the three-day food records [78]; (vii) vitamin K intake assessment by a validated Food Frequency Questionnaire [59]; (viii) calcium & vitamin D intake assessment by a modified Food Frequency Questionnaire [55]; (ix) physical activity evaluation by the International Physical Activity Questionnaire (IPAQ) [79]; and (x) quality of life review by the SF-36 survey [80]. The relevant study forms and questionnaires used in the current prospective study are included in Appendix A. 42
58 Table 3. 1 Study outcome variables included in the study procedures. Assessment Measurement Demographic information - Age, gender, diabetes type and duration, comorbidity count, medication count a Anthropometric data - Height, weight, BMI a Dietary assessments - Three-day food records (2 weekdays and 1 weekend day) a - Vitamin K intake assessed by a validated Food Frequency Questionnaire a - Calcium & vitamin D intake assessed by a modified Food Frequency Questionnaire Biochemical measurements Body composition and bone mineral density - GFR, creatinine, blood urine nitrogen (BUN), parathyroid hormone (PTH) - HbA1C, Random blood glucose (or Fasting blood glucose if applicable) - Calcium (Ca), phosphorus (Phos), magnesium (Mg), alkaline phosphatase (ALP) - 25-hydroxy vitamin D, 1, 25-dihydroxy vitamin D - Bone turnover markers (serum BAP, osteocalcin, Ntx) and plasma FGF-23 - Assessed by Dual-energy X-ray Absorptiometry (DXA) Physical activity - Assessed by International Physical Activity Questionnaire Long Version Quality of Life - Assessed by SF-36 a. Study variables in bold and italicized face were included in this thesis. Abbreviation: BMI = Body Mass Index. 43
59 3.3 Data collection - anthropometric, demographic, and relevant biochemical data Height was measured with a stadiometer to the closest 0.1 centimeter, and weight with a digital scale t the closest 0.1 kilogram, following the standard measurement procedures in the clinical research unit (Health o meter Professional model 597KL, Pelstar LLC, Alsip, Illinois, USA). Body Mass Index (BMI) was calculated by dividing the weight in kilograms by the height in meters squared. The medication prescribed included and not limited to anti-hyperglycemic agent, anti-hypertensive drug, lipid-lowering agent, thyroid replacement hormone, sedatives, and pain relievers, and were reviewed with the participants during the visit. The kidney function reflected by GFR was also calculated by using the Modification of Diet in Renal Disease (MDRD) equation based on age, gender, creatinine, and ethnicity, according to the National Kidney Foundation s online calculator for health professionals [81]. 3.4 Data collection - vitamin k-related dietary data Vitamin K FFQ was interviewer-administered, rather than self-administered, during the study visit. A total of seven trained interviewers conducted the study visits, with three of them completed 82% (51 out of 62) of the study visits. The validated vitamin K FFQs developed for the elderly contained 62 items that were grouped in 50 lines [59]. According to the developers of the FFQ, only food items that contained higher than 1 mcg of phylloquinone per 100g of weight were included. The frequency of consumption ranges from never or rare to two times or more per day ; the serving size was grouped into smaller than, similar to, or larger than a recommended 44
60 portion according to Canada s Food Guide to Healthy Eating. The portion size kit developed by the Alberta Health and Wellness Government of Alberta [82] and a measuring spoon set provided by the Canadian Sugar Institute were used for portion size estimation (Appendix B). The calculation of vitamin K content from this FFQ was discussed in more detail in the following sections. The three-day food records (two weekdays and 1 weekend day) were requested to be completed by the participants prior to the study visit, and were reviewed with the interviewer during the study visit. A sample food records was provided in advance for guidance when the study package was mailed/ ed out. The participants were reminded to fill out the food records during the reminder phone call, and encouraged to provide details of food such as brand names, cooking methods, and written recipes if possible. When the food records were not completed by the participant, an in-person 24-hour recall was collected during the study visit, and a follow-up phone call was used to obtain a second 24-hour recall. In total, six patients were not reached by phone after the study visit and had only one day of 24-hour recall day, six patients provided two food recall days, and the other 50 patients provided three-day food records. Additionally, 23 participants provided food records from both weekdays and weekend, while 37 participants provided intake only from weekdays, 1 participant provided intake only from weekend days, and 1 participant did not recall the days of recording. A multi-pass approach, adapted from the USDA Automated Multiple Pass [62], was used while collecting the 24-hour recall and was adapted to review the food records. 45
61 In the first pass, the interviewer collected a quick list of all food items and beverages consumed by the participant in the previous 24 hours; in the second pass, the interviewer clarified with the participant regarding the details of each item, including portion size, preparation method, brand name, etc.; in the third pass, the interviewer reviewed the record with the participant to avoid forgotten items and missing data. While reviewing the food records, a similar approach was followed to identify the missing information: the recorded items were clarified for portion sizes and preparation methods, and details were added as applicable. For both 24 hour diet recall and food records review, the food models and food photographs included in the Alberta Nutrition Guidelines Portion Size Kit [82] and the measuring spoons were used to assist the interviewers with portion size estimation. 3.5 Dietary data review A total of 50 participants provided 3-day food records (FR), 6 participants provided 2-day FR, and 6 participants provided 1-day FR (Table 3.2). Out of the 50 participants who provided 3-day food records, six days from five participants (1 X 2-day, 4 X 1-day) were excluded from all nutrient analysis, due to incomplete information or insufficient review related to serving size amount, description of food items, preparation method, and recipe or mixed food ingredients [64,83]. According to Kwan and colleagues, omissions of serving size amount, description of food items, preparation method, and recipe or mixed food ingredients were presented in 30.0%, 31.7%, 62.1%, and 25.9% of their study participants who received basic instruction on filling out food 46
62 records. For the current study, standardized procedures were used for reviewing portion size estimation and for food intake analysis in Food Processor for the food records, and food records days with more than 50% dietary data that were illegible, with inadequate description of food items, and omission of serving sizes were removed from analysis. As a result, a total of 45 participants with 3-d FR, 10 participants with 2-d FR, and 7 participants with 1-d FR were included for nutrient analysis. Under-reporting and over-reporting of dietary intake were classified by using a cut-off technique proposed by Goldberg and colleagues [66], where reported energy intake was compared with the calculated Basal Metabolic Rate (BMR). Basal metabolic rate was calculated by using height and body weight by using the Harris-Benedict Equation; for the participants with normal body weight, the actual body weight was used for calculation, for the participants who were overweight and obese, the ideal body weight based on a BMI of 25.0 was used for the Harris-Benedict equation. For this current study, a ratio of less than or equal to 1.06 calculated by dividing the reported energy intake (rei) by the BMR was considered to be under-report [67,68,84]. Some studies used a cut-off between 1.10 and 1.35 to define under-reporting [67,68], and thus the ratio of 1.06 was a conservative measure to capture the study participants who were most likely to under-report. 47
63 Table 3. 2 Food records days included in data analysis. Final FR included in analysis Reported FR Pt Count 3-day 2-day 1-day 3-day 50 a day day Total a. Out of the 50 participants who provided 3-day FRs, six days from five participants (1 X 2-day, 4 X 1-day) were excluded from all nutrient analysis. Abbreviation: FR = Food Records; Pt = Participant. 3.6 Analysis of the food records Macronutrient analysis was performed by using the Food Processor software version 10.8 (ESHA Research, Salem, Oregon, USA). Each participant s percentage of carbohydrate, protein, and fat intake was calculated by dividing the energy contribution from each macronutrient by the total kilocalories of energy intake, and then the mean percentage of the study cohort was compared to the Acceptable Macronutrient Distribution Range (AMDR). The food energy conversion factor used for mass-to-energy calculation is 4kcal/gram for carbohydrate, 4kcal/gram for protein, and 9kcal/gram for fat [85]. As for the vitamin K, the most current USDA nutrient database SR 27 [86] was used to obtain a food item s vitamin K content from the food records, and the result was compared to the value calculated from the aforementioned vitamin K FFQ. It is important to note that starting 2010 (SR 23), in addition to phylloquinone, dihydrophylloquinone and menaquinone-4 were also included in the vitamin K report. 48
64 Because nutrient data were clearly skewed, the median (25-75 percentile) was presented throughout this thesis. 3.7 Analysis of the vitamin K food frequency questionnaire To determine the major food sources of vitamin K in the diet of study participants from the FFQ data, all food items listed in the vitamin K FFQ were classified into food groups based on the 2007 version of Eating Well with Canada s Food Guide according to Health Canada [87]. In addition, a further subset analysis was performed on vegetables using a validated classification [88] to rank sources of vitamin K in these groups from the highest to lowest. Determination of vitamin K content was based on data from the USDA database version SR 16-1 [89] and an excel calculator that was developed based on data from this database. This approach was taken based on the work of Ferland and colleagues [59] who developed the original FFQ. The details of the calculations (with simulated examples) are provided in Appendix C. The first step in the analysis of the vitamin K food frequency questionnaire was to perform a food group classification of the FFQ items. All 50 lines of food items listed in the vitamin K FFQ were classified according to the 2007 version of Eating Well with Canada s Food Guide [87], which included vegetables and fruit, grain products, meat and alternatives, fat and oils, and other. It was notable that milk and alternatives were not included in the validated FFQ used in this study because their phylloquinone contents were below 1 microgram per 100 g of weight which did not meet the inclusion criteria of the FFQ design [59,89]. In addition, all vegetables were further subdivided 49
65 depending on which part of the plant was edible by humans, according the classification systems proposed by Pennington and colleagues [88]. For instance, lettuce and other green leafy vegetables were categorized under vegetable-leaves, whereas green peas were categorized under vegetable-seeds or pods [88]. The food items classified under each food group was outlined in Table 3.3. The second step in the analysis of the vitamin K food frequency questionnaire was to develop a vitamin K database based on the USDA nutrient database version 16-1 [89], which was the designated version used for the original vitamin K FFQ development [59]. Specifically, the vitamin K content of each individual food item was determined by its absolute weight; in the case where only the volume of a food item was listed, a volume-to-weight conversion was applied to keep consistency with the USDA SR 16-1 nutrient database [89] (Table C.1). For instance, 1 cup of raw spinach leaves was equal to 30 grams of weight and 1 each nectarine was equivalent to 142 grams [89]. A detailed example of calculation was provided in Appendix C procedure #1. The third step in the analysis of the FFQ was to develop an excel calculator based on the above vitamin K database. First, the frequency of consumption was converted to a daily basis and coded with a corresponding conversion factor listed in Appendix C procedure #2 (Table C.2). For example, a consumption of 1-3 times per month would be equivalent to 2 times per 30 days, which indicated a conversion factor of 2/30 or 1/15 (Table C.2). Second, the serving size was coded as 0.5, 1.0, or 1.5 for an intake that was smaller, similar, or larger than the listed portion size, respectively, as per the validated 50
66 FFQ developed by Ferland and colleagues [59] (Table C.3). Third, the excel calculator was able to apply the formula function and the vitamin K intake of each individual food item was automatically calculated by multiplying the vitamin K content of a food item (Table C.1) and the frequency of consumption (Table C.2) and the serving size (Table C.3). Two detailed examples were presented in Appendix C procedure #3. Finally, the total daily vitamin K intakes of all 50 lines of food items listed in an individual s FFQ were automatically summed up by using the formula function of the excel calculator (Appendix C procedure #4). The final step in the analysis of the validated FFQ was to perform a ranking of individual food items within the FFQ and to determine the major food sources of vitamin K in the diet of study participants. After calculating the absolute intake of vitamin K from each individual food item (procedure # 3), the total amount of vitamin K intake from each of the aforementioned food groups were calculated. The mean intake of the study participants from each of the food groups were ranked from the highest to the lowest and presented in the results section. Last, it was important to point to that the total amount of vitamin K intake calculated by the methodology used in this thesis did not perfectly match the total vitamin K intake estimation provided by Dr. Ferland s research group who originally developed the vitamin K FFQ [59], with a percentage of variation between -1.7% and 22.9%. The discrepancy was expected and was most likely due to the fact that this newly developed vitamin K database used USDA SR 16-1 as the sole source of vitamin K nutrient profile, whereas the original FFQ designers may have 51
67 incorporated nutrient information obtained from manufactures and separate laboratory analyses. 52
68 Table 3. 3 Dietary sources of vitamin K based on the FFQ. Food group Food items Vegetables a and fruit Veg leaves Spinach (Boiled and Raw); Lettuce (Boston/ romaine); Lettuce (Loose leaf/ Radicchio/ Escarole); Lettuce (Iceberg); Parsley (fresh); Kale; Collards; Green cabbage; Coleslaw; Brussel sprouts; Dandelion greens; Chicory greens; Watercress; Swiss chard; Beet or turnip greens; Chinese cabbage Veg - stem/ stalk/ flower Veg - seeds/ pods Veg - root/ tuber Veg - fruit part Fruit Grain products Milk and alternatives Meat and alternatives Fat and oils Broccoli (Boiled and Raw); Celery; Rhubarb (Boiled and Raw); Asparagus Green peas; Edible podded peas Carrot (Boiled and Raw) Green pepper; Tomato; Vegetable cocktail or tomato juice Avocado; Kiwifruit; Grape (red or green); Apple; Cantaloupe; Nectarine White bread; Whole wheat bread Not a significant source of phylloquinone b Fish canned in oil (ex. Tuna) Olive oil; Canola oil; Margarine (Regular and Light); Butter; Mayonnaise (Regular and Light); Salad dressing (Regular and Light) Other Dried fine herbs; Dill or sweet pickles a. The vegetables listed in the FFQ [59] are subdivided depending on which part of the plant is edible, according to the validated classification systems proposed by Pennington and colleagues [88]. b. Milk and alternatives are not a significant source of vitamin K1 (phylloquinone), which is targeted by the FFQ [59]. The food groups were categorized according to the Eating Well with Canada s Food Guide [87]. Abbreviation: FFQ = Food Frequency Questionnaire. 53
69 3.8 Statistical analysis Microsoft Excel 2010 and Statistical Analysis Software (SAS, version 9.4, Cary, North Carolina, USA) were used to perform data analysis for this study. A p-value of less than 0.05 was considered statistically significant. Data were presented as mean± standard deviation, if normally distributed, otherwise presented as median (25-75 percentile). The Pearson correlation was used to find the correlation between age and duration of diabetes, age and number of comorbidities, age and vitamin K intake, as well as BMI and vitamin K intake. The Kruskal-Wallis test, which is the non-parametric test analogue to the one-way Analysis of Variance (ANOVA), was used to detect if differences existed among participants with 1-day versus 2-day versus 3-day food records. Wilcoxon-Mann-Whitney test, which is the non-parametric test analogue to the independent t-test, was performed to compare if significant differences in nutrient intakes and demographic information existed between under-reporters and non-ur. Bland-Altman plot [22] was applied to compare the agreement of vitamin K intakes assessed by FR and FFQ. Additionally, in view of the non-gaussian distribution of vitamin K intakes based on both FR and FFQ followed the, the data were logarithm transformed and then then back-transformed to normalize the skewness, following the similar procedures used by Ferland and colleagues [4]. Finally, the Kruskal-Wallis test was used to indicate if there was a significant difference in the vitamin K contribution from the top five vegetable subgroups. 54
70 Chapter 4: Results 4.1 Anthropometric and demographic information The participants demographic information is summarized in Table 4.1. The values in this table are described as mean ± standard deviation if normally distributed, as median (25th 75th Percentile) if skewed, or as number (percentage). The median age of the study participants was 65.3 years (N = 62) and 35 (56%) of the cohort was male. Ninety percent (N = 56) of the study cohort was diagnosed with type 2 diabetes, and this prevalence is consistent with the current epidemiological studies [15]. The subjects had a long duration of diabetes, and, as expected, the duration of type 2 diabetes also increased significantly as the study population s age advanced (Pearson r = , p = ; Figure 4.1). For diabetes management, 68% (N = 42) of the study participants received oral hypoglycemic agents, while 56% (N = 35) received insulin therapy with a median dosage of 0.65 ( ) unit/kg. Moreover, more than half of the study participants presented with five or more comorbidities [90]; on average, the study participants received 10 ± 8 prescribed medications. The number of comorbidities, number of prescribed medications, and BMI tended to increase with age, and the correlation between the number of comorbidities and age reached statistical significance (R-squared = 0.14, p = ; Figure D.1). In addition, the mean Body Mass Index (BMI) was 32.0 ± 5.8 and 33.8 ± 6.9 kg/m 2 for male and female participants, respectively, and both values fell into the category of class I obesity defined by the World Health Organization (WHO) [91]. Furthermore, only 11 patients took a 55
71 multivitamin supplement that contained vitamin K, ranging from 20 to 100mcg/day. Finally, no significant differences in age, duration of diabetes, number of comorbidities and prescribed medications, and BMI were observed between the male and female participants. 4.2 Dietary information assessed by food records The following section reviews the dietary data collected from the food records, as well as the issue of under-/over-reporting presented in the study population One-day versus. Two-day versus. Three-day food records A total of 45 participants with 3-d FR, 10 participants with 2-d FR, and 7 participants with 1-d FR were included for nutrient analysis. The energy, macronutrient, and vitamin K intake of each group are summarized in Table 4.1. The median energy intake was 1530 kcal ( ), the absolute vitamin K intake was 68 mcg (50 96) for the entire group, and no statistically significant difference in either kcal or vitamin K was detected among participants with 1-day, 2-day or 3-day FR by the Kruskal-Wallis test. Similarly, protein, carbohydrate, and fat intakes did not significantly differ among the participants with 3-day, 2-day, or 1-day food records, so the data were pooled for subsequent analyses. The macronutrient intakes of the entire cohort were compared to the Acceptable Macronutrient Distribution Range (AMDR) developed by the Institute of Medicine [85]. The percentages of carbohydrate, protein, and fat intake were 47.6%, 56
72 17.8%, and 34.6%, which fell within the corresponding AMDR of 45-65%, 10-35%, and 20-35%, respectively (Table 4.3). Additionally, although the reported nutrient data from the study participants with 1-day, 2-day, or 3-day FR did not differ, it was an interesting finding that as age increased, the likelihood of completing the 3-day FR significantly improved (p=0.04) Under/Over-reporting of food records Under-reporting and over-reporting were classified by using the Goldberg technique [66-68,84]. For this current study, participants with an rei:bmr ratio of less than or equal to 1.06 were considered to be under-reporters (UR) and a total of 27 out of 62 participants met the UR criteria (43.5%). Because only one patient had an rei:bmr ratio higher than 2.39, which was a commonly defined cut-off for over-reporters in the literature, the data for this one over-reporter and the plausible reporters were pooled for subsequent analysis and classified as non-under-reporters (non-ur). As expected, the absolute dietary intake of energy, carbohydrate, fiber, protein, fat, vitamin K based on the FR were all significantly lower in the participants who were categorized as under-reporters (p<0.0001; Table 4.4). However, no significant differences in age, BMI, duration of diabetes, severity of kidney disease, number of comorbidities, or number of prescribed medications were detected between the underreporters and non-ur. It is also noticeable that although vitamin K-FR was significantly lower in the under-reporters than in the non-ur, the differences in vitamin K-FFQ intake between these two groups did not reach statistical significance. 57
73 4.2.3 Effects of season, day of reporting, and intra-subject variability Logarithm transformed vitamin K intake for food records was significantly associated with the season of the year (p=0.0031), when season was divided into three groups as November to February, March to June, and July to October. In addition, only a subset of the participants (n = 23) included both weekdays and weekends in their food records, and no major differences in vitamin K intake compared with those participants who had food records for only on weekdays or only on weekends appeared to occur (p > 0.05). Furthermore, the mean of the intra-individual variability in vitamin K intake based on food records was 43%, calculated by averaging the standard deviation of each participant s absolute vitamin K intakes estimated from their food records. Intraindividual variability was positively associated with servings of fruit and vegetables (p = ). Also, intra-individual variability was associated with the season of the year when the food records were collected (p = ), with highest variability observed from November to February. The analysis of covariance (ANCOVA) was performed by using servings of fruit and vegetables as the independent variable, intra-individual variability as the dependent variable, and adjusted for the season of the food records collection. The p-value for the covariance model was (joint effect/interaction). The R-squared value was 17.58% for the covariance model and only 7.94% for servings of fruit and vegetables alone. These results indicated that the joint effects of season and fruit and vegetable intake contributed to 17.58% of the observed variability, while fruit and vegetables intake 58
74 alone contributed 7.94% of the variability, and consequently both seasonal influence and total consumption of fruits and vegetables played a role in the observed variability in vitamin K intake as assessed by food records. 59
75 Table 4. 1 Demographic characteristics of the study participants. Value Age (years) 65.3 ( ) Gender (M:F) 35:27 Diabetes type Type 1 6 (10) Type 2 56 (90) Diabetes duration (years) Type 1 Type 2 Diabetes therapy Oral hypoglycemic agent (OHA) Insulin therapy Both OHA and OHA Insulin dose (unit/kg/day) 31.5 ( ) 12 (7.5 17) 42 (68) 35 (56) 19 (31) 0.65 ( ) GFR (ml/min/1.73 m 2 ) 52.5 ( ) Stage of CKD Stage 1 Stage 2 Stage 3 Stage 4 Stage 5 12 (20) 13 (21) 19 (31) 17 (28) 0 (0) Number of comorbid conditions 5 (3 7) Number of prescribed medications 10 ± 3 Values are presented as mean ± standard deviation if data are normally distributed, as median (25 th 75 th percentile) if data are skewed, or as number (percentage). The median age of the study participant was 65.3 years, and 56% of the cohort was male (N = 35). Ninety percent of the study cohort (N = 56) was diagnosed with type 2 diabetes. Sixty-eight percent (N = 42) of the study participants received oral hypoglycemic agents, while 56% (N = 35) received insulin therapy with a median dosage of 0.65 ( ) unit/kg. Forty-one percent of the study participants had earlier stage of CKD (1-2/mild), and the other fifty-nine percent of the participants had later stage of CKD (3-4/moderate to severe). More than half of the study participants presented with five or more comorbidities [90]. On average, the study participants received 10 ± 8 prescribed medications Abbreviation: BMI = Body Mass Index; CKD = Chronic Kidney Disease; F = Female; GFR = Glomerular Filtration Rate; M = Male; OHA = Oral hypoglycemic agent. 60
76 Figure 4. 1 Bivariate correlation analysis between age and duration of diabetes in the study participants with type 2 diabetes. There were 56 participants diagnosed with type 2 diabetes. Pearson r = 0.39, R-squared = 0.15, p<0.01*. *p<0.05 indicates a statistical significance. 61
77 Table 4. 2 Energy, macronutrient, and vitamin K intake based on participants with 1-day, 2-day, and 3-day food records. Overall 3-day FR 2-day FR 1-day FR P-value Pt count 62 (100) 45 (73) 10 (16) 7 (11) N/A Age (year) 65 (59 70) 67 (61 71) 62 (53 64) 64 (45 67) 0.04* Energy (kcal) 1530 ( ) 1725 ( ) 1484 ( ) 1534 ( ) 0.95 Carbohydrate (g) 184 ( ) 187 ( ) 174 ( ) 190 ( ) 0.70 Protein (g) 71 (54 91) 71 (51 92) 67 (54 89) 75 (67 89) 0.92 Fat (g) 57 (44 89) 56 (45 93) 57 (40 82) 65 (46 79) 0.83 Vitamin K a FR (mcg) 68 (50 96) 68 (52 97) 69 (49 85) 65 (41 96) 0.76 Values are presented as median (25 th 75 th Percentile) in view of the obvious skewness of the dietary data, or as number (percentage) if applicable. * Kruskal-Wallis test significant at P<0.05. a. Energy and macronutrient intake was analyzed by using the Food Processor software version 10.8; vitamin K intake was measured by using the USDA nutrient database version SR 27 [86]. Abbreviation: FR = Food Records; g = gram; mcg = microgram; N/A = Not Applicable; Pt = Participant. Table 4. 3 Macronutrient intake of the participants with diabetes and chronic kidney disease based on food records. Macronutrient Participant s macronutrient Acceptable Macronutrient distribution range Distribution Range a Protein (g) 17.8% 10-35% Carbohydrate (g) 47.6% 45-65% Fat (g) 34.6% 20-35% a. Acceptable Macronutrient Distribution Range (AMDR) is defined as the range of intake for a particular energy source that is associated with reduced risk of chronic disease while providing intakes of essential nutrients according to the Institute of Medicine [85]. Each participant s percentage of macronutrient intake was calculated by dividing the energy contribution from each macronutrient by the total kilocalories of energy intake, and then the mean percentage of the study cohort was compared to the AMDR (food energy conversion factor: carbohydrate= 4kcal/gram, protein= 4kcal/gram, fat= 9kcal/gram [85]. 62
78 Table 4. 4 Demographic and dietary information of under-reporters and non-under-reporters based on food records. UR b Non-UR b P-value Participant count 27 (44) 35 (56) N/A Demographic Age (year) 67 (51 70) 64 (59 70) 0.83 BMI (kg/m 2 ) 32.9 ± ± Duration of diabetes 12 (7 22) 13 (8 19) 0.78 GFR (ml/min/1.73 m 2 ) 48 (29 70) 56 (27 83) 0.76 Number of comorbidities 5 (4 8) 4 (3 7) 0.42 Number of prescribed medications 9 (7 12) 10 (7 11) 0.86 Dietary a Energy (kcal) 1124 ( ) 2021 ( ) ** Carbohydrate (g) 149 ( ) 220 ( ) ** Fibre (g) 12 (9 15) 19 (15 30) ** Protein (g) 51 (41 64) 89 (76 106) ** Fat (g) 44 (31 48) 88 (67 102) ** Vitamin K - FR (mcg) 53 (32 71) 81 (65 111) 0.002* Vitamin K - FFQ (mcg) 116 (84 203) 131 (77 248) 0.32 Values are presented as mean ± standard deviation if data are normally distributed, as median (25 th 75 th percentile) if data are skewed, or as number (percentage). * Wilcoxon-Mann-Whitney test significant at P<0.05. ** Wilcoxon-Mann-Whitney test significant at p< a. Energy and macronutrient intake was analyzed by using the Food Processor software version 10.8; vitamin K intake was measured by using the USDA nutrient database version SR 27 [86]. b. Under-reporters were identified based on the ratio of reported energy intake: basal metabolic rate (rei:bmr) 1.06, and non-under-reporters were identified based on a rei:bmr >1.06. Abbreviation: BMI = Body Mass Index; FFQ = Food frequency questionnaire; FR = Food records; GFR = Glomerular Filtration Rate; Non-UR = Non-under-reporters; rei:bmr = reported Energy Intake: Basal Metabolic Rate; UR = Under-reporters. 63
79 4.3 Food sources of vitamin K assessed by food group analysis of FFQ In order to determine the major food sources of dietary vitamin K, food group analysis based on the Food Frequency Questionnaire (FFQ) was performed according to the Eating Well with Canada s Food Guide, 2007, developed by Health Canada [87]. The four main food groups are (1) vegetables and fruit, (2) grain products, (3) milk and alternatives, and (4) meat and alternatives; additionally, to keep the list of vitamin K sources fully inclusive, another two food groups named fat and oils and other were incorporated. The complete list of food items under each category is summarized in this thesis s Methods chapter (Table 3.3). The major four food group analysis, instead of the detailed vitamin K analysis, was also performed for the food records and is presented in Appendix D Figure D.2. Because vegetables are a significant contributor to the dietary intake of vitamin K, a subgroup analysis of vegetables was performed according to which part of the plant is edible for humans, by using the validated classification systems proposed by Pennington and colleagues [88]. Specifically, the vegetables appearing in the FFQ were subdivided into (1) veg-leaves (e.g., lettuce), (2) stem, stalk, and/or flower (e.g., celery, asparagus, broccoli), (3) veg-fruit part (e.g., tomatoes), (4) veg-seeds or pods (e.g., green peas), and (5) veg-root or tuber (e.g., carrot) for statistical analysis [88]. In view of the obvious skewness of the vitamin K contributions from each subgroup, the median (25 th 75 th percentile) instead of mean ± standard deviation is presented in Table 4.5. The Kruskal-Wallis test indicated a significant difference in the vitamin K contribution from 64

80 the above five vegetable subgroups (p<0.0001). Veg-leaves contributed the most substantial amounts of vitamin K intake, approximately 60.5% (Figure 4.2). Figure 4. 2 Vitamin K intake based on subgroup analysis of the validated vitamin K- specific FFQ. The FFQ was developed by Ferland and colleagues [59]. The vegetables listed in the FFQ [59] are subdivided depending on which part of the plant is edible, according to the validated classification systems proposed by Pennington and colleagues [88]. The rest of the items, such as bread, fish, oil and salad dressings, and dried herbs are categorized under the grain, meat, fat and oils, and other category, respectively. Abbreviation: FFQ = Food Frequency Questionnaire. 65
81 Table 4. 5 Vitamin K intake of the study participants based on the subgroup analysis of vegetables listed in the FFQ. Subgroup of vegetables Intake (mcg/day) Leaves 61 (30 133) Stem, stalk, or flower 19 (10 38) Seeds or pods 2.7 ( ) Root or tuber 2.6 ( ) Fruit part 2.6 ( ) a. The vegetables listed in the FFQ [59] are subdivided depending on which part of the plant is edible, according to the validated classification systems proposed by Pennington and colleagues [88]. Abbreviation: d = day; FFQ = Food Frequency Questionnaire; mcg = microgram. 66
82 4.4 Vitamin K intakes based on food frequency questionnaire (FFQ) and food records (FR) Vitamin K intake was measured by using two dietary assessment tools, a validated semi-quantitative FFQ [59] and the food records (Table 4.6). Because the intakes obtained from using both tools were clearly skewed, the data were logarithm transformed and then back-transformed to normalize the skewness, following the similar procedures used by Ferland and colleagues [59]. Quantitatively, the overall median intake of vitamin K based on the FR was lower than that based on the FFQ, 68 versus 117 mcg/d; both were lower than the arithmetic (untransformed) mean intake of 80 and 172 mcg/d. In other words, based on the arithmetic means, the vitamin K-FFQ estimated approximately 2.15 times higher vitamin K intake than the vitamin K-FR. Moreover, a paired t-test based on the logarithm-transformed data indicated that the mean of Log10 (FR) was still lower than Log10 (FFQ), 69 versus 131 mcg/d, and the difference remained statistically significant (p<0.0001) post log transformation. The Adequate Intake of vitamin K is gender-specific [92], so the results for the female and male participants are presented separately (Table 4.7). On the one hand, based on the food records, the median intake of vitamin K-FR for the women was lower than that for the men, 65 versus 71mcg/d, and both were much lower than the recommended AI of 90 and 120mcg/d. On the other hand, based on the FFQ, the women s median vitamin K-FFQ intake was 119mcg/d, well above the recommended 90mcg/d, while the men s median vitamin K-FFQ intake was 117mcg/d, still slightly below the recommended 120mcg/d. 67
83 Table 4. 6 Daily dietary intakes of vitamin K (mcg/d) assessed by using the vitamin K- specific FFQ and food records. FFQ a FR Median (25 th 75 th Percentile) 117 (81 221) 68 (50 96) Arithmetic mean b (SD) 172 (139) 80 (50) Geometric mean c (95%CI) 131 ( ) d 69 (60 79) a. Vitamin K FFQ was a semi-quantitative questionnaire validated by the Ferland group [59]. b. Arithmetic mean is the untransformed or true mean based on the dataset. c. Geometric mean is back transformed from the logarithm-transformed data. d. Logarithm transformed means of FFQ and food records were significantly different (p<0.0001), as reflected by the paired t-test. Abbreviation: CI = Confidence Interval; d = day; FFQ = Food Frequency Questionnaire; FR = Food Records; mcg = microgram; SD = Standard Deviation. Table 4. 7 Daily dietary intakes of vitamin K (mcg/d) assessed by using the vitamin K- specific FFQ and food records, separated by gender and compared with the Adequate Intake. Count FFQ a FR AI b Female 27 (44) 119 ( ) 65 (51 97) 90 Male 35 (56) 117 (75 212) 71 (49 96) 120 Values are presented as median (25 th 75 th percentile) if data are skewed, or as number (percentage). a. Vitamin K FFQ was a semi-quantitative questionnaire validated by the Ferland lab [59]. b. Adequate Intake (AI) was developed by the Institute of Medicine and is believed to meet the nutrient requirement of healthy individuals for the corresponding age and gender group, when there is inadequate scientific evidence to support the development of the Recommended Dietary Allowance (RDA). Abbreviation: AI = Adequate Intake; d = day; FFQ = Food Frequency Questionnaire; FR = Food Records; mcg = microgram; SD = Standard Deviation. 68
84 4.5 Correlation and agreement between vitamin K intakes assessed by the FFQ and FR The vitamin K intakes as assessed by the two dietary assessment tools FFQ and FR were compared in the logarithm-transformed scale and are presented in Figure 4.3.A. There was a weak but statistically significant correlation between the vitamin K intakes as estimated by FFQ and FR (R-squared = 0.11, p<0.01). To assess whether the two assessment methods were in agreement, we plotted the difference between the two vitamin K assessments against the mean of the two assessments for each individual as described by Bland and Altman [93], as shown in Figure 4.3.B. The Bland-Altman plot showed a mean difference of 0.29 with the limits of agreement (95% confidence interval) ranging from to Good agreement would be indicated by a mean difference of zero, all subjects falling within narrow limits of agreement, and no relationship between the mean estimate and the difference between estimates. Three subjects fell outside the limits of agreement, which were rather wide, with greater differences being observed with higher reported intakes (shown by the correlation between the difference between assessments and the mean of the assessments in Figure 4.3.B) indicating a lack of agreement in the absolute vitamin K intake as assessed by the FFQ and FR. To explore whether the detected lack of agreement may be explained by dietary under-reporting, we performed the same analyses with the subjects divided into two groups: under-reporters and non-ur separately (Figure 4.4 and Figure 4.5). The same relationships were found in the UR and non-ur analysed separately as were found for 69
85 the whole group. Similar weak correlations occurred between vitamin K intakes as assessed by the two methods for both groups (Figure 4.4A and Figure 4.5A), and the Bland-Altman plot for both sub-groups again suggested a lack of agreement between the tests (Figure 4.4B and Figure 4.5B). 70
86 Figure 4.3. A Correlation of vitamin K intake measured by using the FR and FFQ in 59 participants who completed both FFQ and FR. Pearson r = 0.34, indicating a weak uphill linear relationship. R-squared = 0.11, p <0.01*. * p<0.05 indicates a statistical significance. Abbreviation: FFQ = Food Frequency Questionnaire; FR = Food Records. 71
87 Figure 4.3. B Bland-Altman Plot: Agreement between dietary vitamin K intakes assessed by using the FR and FFQ in 59 participants who completed both FFQ and FR. The limits of agreement ranged from to 0.95, shown by the dotted line. The mean difference was 0.29, indicated by the solid line. Pearson r = 0.34, p <0.01. Abbreviation: FFQ = Food Frequency Questionnaire; FR = Food Records. 72
88 Figure 4.4. A Correlation of vitamin K intake measured by using the FR and FFQ in under-reporters. There were 25 participants identified as under-reporters who completed both FFQ and FR. Pearson r = 0.37, indicating a weak uphill linear relationship. R-squared = 0.13, p=0.07. * p<0.05 indicates a statistical significance. Abbreviation: FFQ = Food Frequency Questionnaire; FR = Food Records. 73
89 Figure 4.4. B Bland-Altman Plot: Agreement between dietary vitamin K intakes assessed by using the FR and FFQ in 25 under-reporters who completed both FFQ and FR. The limits of agreement ranged from to 1.00, shown by the dotted line. The mean difference was 0.33, indicated by the solid line. Pearson r = 0.45, p = Abbreviation: FFQ = Food Frequency Questionnaire; FR = Food Records. 74
90 Figure 4.5. A Correlation of vitamin K intake measured by using the FR and FFQ in nonunder-reporters. There were 34 participants identified as non-ur who completed both FFQ and FR. Pearson r = 0.22, R-squared = 0.05, p=0.21. * p<0.05 indicates a statistical significance. Abbreviation: FFQ = Food Frequency Questionnaire; FR = Food Records; non-ur = nonunder-reporters. 75
91 Figure 4.5. B Bland-Altman Plot: Agreement between dietary vitamin K intakes assessed by using the FR and FFQ in 34 non-under-reporters who completed both FFQ and FR. The limits of agreement ranged from to 0.92, shown by the dotted line. The mean difference was 0.24, indicated by the solid line. Pearson r = 0.38, p = Abbreviation: FFQ = Food Frequency Questionnaire; FR = Food Records. 76
92 4.6 Adequacy of vitamin K intake assessed by the FFQ and FR Since it was clear that the absolute estimates of vitamin K intake differed by the two methods, with estimates from FFQ being higher than from the FR, we examined whether there was a qualitative or clinically significant difference between the two methods. When the vitamin K intakes as assessed by using the FFQ and FR were compared with the Adequate Intake (AI), the FFQ indicated that a total of 37 participants (63%) met the AI but the FR suggested only 12 (20%) participants met the AI by diet alone (Table 4.8). In terms of agreement between the assessments, of the 12 subjects meeting the AI by the FR, 9 (75%) also met the AI by the FFQ, but 3 (25%) participants were judged not to have met AI by FFQ. Most important perhaps is that 19 (32%) participants did not reach the AI according to either the FFQ or FR. Specifically, the FFQ estimated that 3 (5%) participants did not meet 25% of the AI while the FR assessed that 4 (7%) participants had vitamin K intake below 25% of the AI (Table 4.9). To explore how consistent the rankings of vitamin K estimates were between the FFQ and FR, all participants vitamin K intakes were divided into quartiles for both questionnaires and then were summarized in Table Only 16 (27%) participants had consistent rankings of vitamin K intake between the FFQ and FR; i.e., a participant who was placed into the first quartile by the FFQ was also ranked in the first quartile by the FR, as indicated by the green cells. Twenty-four (41%) participants had a FFQ ranking higher than the FR ranking (the blue cells in Table 4.10), while 19 (32%) participants had 77
93 a FR ranking higher than the FFQ (red cells). The number of subjects who were ranked in the same or different quartiles by the two methods is also presented in Figure 4.6.A. A total of 16 participants did not change quartiles of vitamin K intake assessed by the FFQ and FR. Although 45 (76%) participants remained in the same or the adjacent quartile, it is of concern that 14 subjects were ranked in very different quartiles (± 2 or 3 quartiles) by the two methods. 78
94 Table 4. 8 Distribution of participants who met and did not meet adequate intake. FR-Not meeting AI FR-Meeting AI FFQ-Not meeting AI 19 (32) 3 (5) FFQ-Meeting AI 28 (47) 9 (15) Out of the 59 participants who completed both the FFQ and FR, a total of 37 participants met the AI by the FFQ and 12 participants met the AI by the FR. The percentage of participant distribution is indicated in the parentheses. The green cells indicate the consistency between the FFQ and FR estimates, i.e., both or neither meeting the AI. The blue cells represent the participants meeting the AI by the FFQ but not by the FR (this result was most common in this study cohort; N=28). The red cells represent the participants meeting the AI by the FR but not by the FFQ (this result was relatively rare in this cohort; N=3). Abbreviation: AI = Adequate Intake (Female = 90mcg/d; Male = 120 mcg/d); FFQ = Food Frequency Questionnaire; FR = Food Records; mcg/d = microgram per day. Table 4. 9 Distribution of participants who met and did not meet 25% of adequate intake. FR-Not meeting 25% AI FR-Meeting 25% AI FFQ-Not meeting 25% AI 1 (2) 2 (3) FFQ-Meeting 25% AI 3 (5) 53 (90) Out of the 59 participants who completed both the FFQ and FR, a total of 4 (7%) participants had vitamin K intake below the 25% AI as per the FFQ, while a total of 3 (5%) participants had vitamin K intake below the 25% AI according to the FR. The percentage of participant distribution is indicated in the parentheses. The green cells indicate the consistency between the FFQ and FR estimates, i.e., both or neither meeting 25% AI. The blue cells represent the participants meeting 25% AI by the FFQ but not by the FR, while the red cells represent the participants meeting 25% AI by the FR but not by the FFQ. Abbreviation: AI = Adequate Intake (Female = 90mcg/d; Male = 120 mcg/d); FFQ = Food Frequency Questionnaire; FR = Food Records; mcg/d = microgram per day. 79
95 Table Distribution of participants according to ranking of quartiles. FR-Q1 FR-Q2 FR-Q3 FR-Q4 FFQ-Q FFQ-Q FFQ-Q FFQ-Q (1) For the 59 participants who completed both the FFQ and the FR, their estimated vitamin K intakes by both FFQ and FR were ranked into quartiles. (2) Depending on where the participants stood in both questionnaires, they were listed in one of the above 16 categories. The participant count is shown in the table. (3) The green cells indicate the consistency between the FFQ and FR estimates, i.e., the participant who was ranked in the first (lowest) quartile by the FFQ was also listed in the first quartile by the FR. A total of 16 participants met the green criterion. (4) The blue cells represent the participants who had a higher FFQ quartile ranking than the FR quartile ranking. The darker the shade, the higher was the discrepancy detected between questionnaires. A total of 24 participants met the blue criterion. (5) The red cells represent the participants who had a higher FR quartile ranking than the FFQ quartile ranking. The darker the shade, the higher was the discrepancy detected between questionnaires. A total of 19 participants met the red criterion. Abbreviation: FFQ = Food Frequency Questionnaire; FR = Food Records; Q1 = First quartile (0-25 percentile); Q2 = Second quartile (25-50 percentile); Q3 = Third quartile (50-75 percentile); Q4 = Fourth quartile ( percentile). 80
96 Figure 4.6. A Changes in quartiles of vitamin K intake assessed by using the FFQ and FR. (1)The green column indicate the consistency between the FFQ and FR estimates; i.e., a participant who was ranked in the first (lowest) quartile by the FFQ was also listed in the first quartile by the FR, so the change in quartiles was zero. A total of 16 participants met the green criterion. (2) The blue columns represent the participants who had a higher FFQ quartile ranking than the FR quartile ranking. For example, a participant who was ranked as in the second quartile by the FFQ and in the first quartile by the FR would receive a change of quartile by 1. The darker the shade, the higher was the discrepancy detected between the FFQ and FR rankings. A total of 24 participants met the blue criterion. (3) The red columns represent the participants who had a lower FFQ quartile ranking than the FR quartile ranking. For example, a participant who was ranked as in the first quartile by the FFQ and in the third quartile by the FR would receive a change of quartile by -2. The darker the shade, the higher was the discrepancy detected between the FFQ and FR rankings. A total of 19 participants met the red criterion. Altogether, 45 participants (76.3% of participants) either changed 1 quartile between methods or did not change quartiles. Abbreviation: FFQ = Food Frequency Questionnaire; FR = Food Records. 81
97 Chapter 5: Discussion 5.1 Main study findings The study objectives were to estimate vitamin K intake in patients with diabetes and chronic kidney disease by using the food frequency questionnaire (FFQ) and food records (FR), to compare the correlation and agreement between the above two tools, and to identify the main food sources of vitamin K in the diet of the study participants. The most striking finding was the lack of agreement between the vitamin K intake assessed by the FFQ and FR: in the study participants with diabetes and chronic kidney disease, there was a wide limits of agreement observed between the FFQ and FR estimates, with greater differences being observed with higher reported intakes. After the nutrient data were corrected for skewness by performing logarithm-transformation, the same trend continued, and the difference between log10(fr) and log10(ffq) remained significant. In addition, FR estimated a higher percentage of participants not meeting the adequate intake (AI) than the FFQ estimated (80% versus 37%), and nearly one third of the participants (32%) were assessed by both questionnaires to be not reaching the AI. Consistent with the literature and as expected, the highest source of vitamin K was found to be from vegetables, especially the leafy vegetables, such as lettuce, kale, spinach, cabbage, and Brussel sprouts [57,58]. Additionally, as expected, the plantbased oils contributed a relatively high percentage of phylloquinone [25]. It is 82
98 interesting to point out that cabbage kimchi was not a high source of vitamin K in our study participants and was not listed in many FFQs used in North American and European studies, whereas cabbage kimchi was identified as a top vitamin K source in the Korean National Health and Nutrition Examination Survey (NHANES) as it was quite culture-specific [94]. The above studies also identified food sources of vitamin K according to their origin, e.g., the Brassica family, which consisted of broccoli, Brussels sprouts, cabbage, cauliflower, and kale [88], although the current study did not distinguish plant-based foods based on their family of origin. 5.2 Comparison between FFQ and FR Part of the differences in vitamin K intake assessed by the FFQ and FR could have been contributed to the distinct design of FFQ and FR, the non-ubiquitous presence of vitamin K in the food supply, and the high day-to-day variation of dietary vitamin K intake. Because vitamin K is not present in a large amount in many food items, the food records may not be able to capture the high-vitamin K foods consumed episodically [59,95]. In other words, the FFQ s higher estimate of vitamin K may be inflated by the high number of listed green vegetables choices (30 lines) and fat choices (9 lines) as shown in Table 3.3, particularly since the subjects had a relatively high fat intake. Although the estimated vitamin K intake was below the adequate intake in 37% to 80% participants according to FFQ and FR, we do not think these people are at risk for vitamin K deficiency-related bleeding or other adverse clinical outcomes. According to a research study that examined dietary induced subclinical vitamin K deficiency in healthy 83
99 subjects by Ferland and colleagues [96], even if the dietary intake was restricted to as low as 10mcg/d for 13 days, there was no significant diet-induced changes in prothrombin time (PT) in adults. In the 1960s, two independent studies [97,98] implemented extreme study interventions (parenteral nutrition with antibiotics for 1 month; severe dietary restriction with only polished rice, black coffee, sugar, and multivitamin for 3 weeks) and induced prolongation of prothrombin time in study participants, but it is important to point out that the vitamin K deficiency may be related to overall severe malnutrition [36], and these interventions are unlikely to be repeated due to ethical concerns. In addition, the requirement of vitamin K for optimal heart health, bone health, and diabetes management are currently unknown, as the currently established adequate intake recommendations were solely based on the median intake from adults in the NHANES III. The discrepancy in vitamin K intake assessed by using the FFQ and FR could also be related to the different versions of the vitamin K database used for the FFQ and FR. The validated, semi-quantitative FFQ was developed based on the USDA nutrient database version SR 16-1 released in 2009 [89] by Ferland and colleagues, and only phylloquinone, instead of the total vitamin K, was available in version In contrast, the FR were analyzed by using the most current USDA nutrient database version SR 27 released in 2014 [86], which included not only phylloquinone, but also the other two forms of vitamin K: dihydrophylloquinone and menaquinone-4. Nevertheless, the estimate of vitamin K intake from the FFQ was higher than that from the FR, regardless 84
100 of the fact that VitK-FFQ covered only the phylloquinone form while VitK-FR included more than one form of vitamin K. Under-reporting was present in 43.5% of the participants, and as expected, the absolute intake of vitamin K in food records was significantly lower in the underreporters (Table 4.5). However, when the under-reporters and non-ur were analyzed separately for correlation and agreement, similar results were reached for both groups and consequently were consistent with the results for entire study group (Figure 4.3 to 4.5). This phenomenon could be explained by the relatively small sample size which did not have sufficient power to test the significance in differences. Also, it appeared that no significant difference in nutrient intakes was found among participants with 1-day, 2- day, and 3-day food records, and this finding could be potentially explained by Black and Cole in a detailed review article [65], suggesting that under-reporting is characteristics of some participants, and thus, one may not be able to correct the bias by simply increasing the number of FR days. We have not yet analyzed the vitamin K status at this time, so we have no recovery biomarker, such as serum phylloquinone, prothrombin induced by vitamin K absence-ii (PIVKA-II), or the percentage of uncarboxylated osteocalcin, to verify the reported intake. There is a possibility that both tools might systematically or randomly under/over-report vitamin K intake at an individual level, but we lacked an objective biochemical measurement for validating the dietary intake. 85
101 5.3 Comparison of vitamin K intake with the literature A wide range of reported mean/median vitamin K intake occurs in the literature, from under 80mcg/d to over 320mcg/d [24,94,99]. The discrepancy may be due to the following three factors. First, a different dietary assessment method was chosen for each study, such as 24 hour recall [6,60,94,99], FFQ [7,23,24,56-59,70,71,100], FR [59], and a vitamin K-focused checklist named K-card [41], and these different types of dietary assessment tools led to a varied range of results. Second, different versions of the FFQ were used for the published studies, and the different questionnaire designs would cause discrepancy in the vitamin K intake assessment. For example, some studies used long versions containing as many as 126 food items [7,24,56-58,70,100] and others contained as few as 79 items [23], while our study used a questionnaire containing only 50 lines of food items [59]. Moreover, while one FFQ was vitamin K-specific [59], the majority of the rest were designed for general dietary assessment purposes [7,23,24,56-58,70,71,100]. Although listing more food items in the questionnaire may not necessarily increase or decrease the vitamin K intake estimate, it is not unexpected that the distinct design of each FFQ could lead to different estimations among questionnaires. Third, the aforementioned studies were completed all over the world and the country-specific database may be related to the expected variances. For example, the geographic growth condition might play an important role in the vitamin K content detected in vegetables: the leaf lettuce grown in Montreal was found to contain twice as 86
102 much phylloquinone than the lettuce grown in Boston [16]. Additionally, some culturespecific foods, such as the cabbage kimchi commonly consumed in Korea which was mentioned in an earlier section, were considered as a major vitamin K source in the Korean NHANES [94], whereas its consumption was expected to be lower in other countries. Fourth, the dietary intake might be different in people with chronic disease than in the healthy population [101], as patients with diabetes and chronic kidney disease are more likely to follow a restricted diet due to carbohydrate, sodium, phosphorous, and potassium monitoring. In the study which used the same version of the FFQ as that used by this thesis, Presse and colleagues [59] found that the mean vitamin K intake was 222mcg/d among their participants, which was higher than the 172 mcg/d found in our study participants. After correction for skewness, the back-transformed mean intakes were brought closer: 154mcg/d versus 131mcg/d. Both the untransformed and backtransformed values of the intake were higher than the recommended adequate intake. It was not unexpected for our study participants with diabetes and chronic kidney disease to have a lower reported dietary vitamin K intake than that of the healthy elderly population: Our study participants were primarily recruited from the regional renal program where they received dietitian consultation and follow-ups and thus their healthcare teams might instruct them to follow a more rigid diet plan with restrictions on potassium, sodium, phosphorus to preserve kidney functions. For example, some of the medium to high potassium foods, such as spinach, broccoli, kale, Brussel sprouts, 87
103 are also rich sources of vitamin K [89], so the participants following a low potassium diet might consciously avoid the high-potassium foods, and thereby, reduce their vitamin K intake although we did not have rigorous data to validate this assumption. In order to maximize vitamin K intake while minimizing potassium intake, it may be beneficial for renal dietitians to focus on restricting other potassium-rich foods while not discouraging healthy green leafy vegetables. A few studies found that phylloquinone intake tended to increase with age [70,94], while our study did not detect such a significant relationship. This difference may be related to the fact that our study participants were generally older, with a mean age of 62 years (median = 65 years) compared to the mean of 54 years and 40 years in the previous studies, and that our study had a small sample size compared to the above two population-based cohorts. While the other studies found either a positive [56] or negative [70] association between phylloquinone intake and BMI, our study did not detect such a trend by using either the FFQ or the FR. This difference could be explained by the fact that majority of our study participants were already obese, with a mean BMI of 32 and 34 kg/m 2 in the male and female participants, respectively. In other words, our study did not have enough participants in the normal and underweight categories to identify such a trend, if it existed. Although some studies found no significant seasonal variation in vitamin K intake [102,103], Presse and her colleagues [60] found that season (May-Oct) was positively 88
104 associated with vitamin K intake which was consistent with our study findings. In the current study, a higher intake of vitamin K was found during the summer months in the food records, and this study finding was probably related to the higher availability and lower cost of seasonal vegetables and fruit [60]. Presse and her colleagues [60] also reported a significant positive association between day of the week (weekdays) and vitamin K intake in the elderly in Canada; however, this analysis was not performed in the current thesis as only a small subset of participants provided food records from both weekdays and weekends. The high intra-subject variability observed in this study is similar to previous reports. Booth and colleagues pointed out that high intra-subject variability is common to nutrients that are concentrated in a few foods [103], and an increased number of food recording days can help reducing the variance and estimating an intake that is more representative of true usual intake. The same conclusion was reached by Presse and colleagues, the day-to-day variability was reported high for vitamin K intake (with an intra- to inter- individual variance ratio of 3.2), and a minimum of six days were needed to assess the usual intake of vitamin K [60]. 5.4 Limitations of current study The first limitation of the study was the cross-sectional design, which provided only a snapshot of the study population s vitamin K intake, instead of capturing the dietary patterns and changes over time. Also, the sample size (N = 62) was relatively small compared with the large-scale population-based intake studies consisting of 89
105 thousands of subjects and being more suitable for sophisticated statistical analysis [6,23,94]. Second, it may be of caution to generalize the study results to all patients with diabetes and chronic kidney disease as a selection/ survivor bias might have existed in the study participants. The subjects were all community dwellers rather than frail institutionalized elderly people; moreover, the subjects who agreed to participate in the research were generally more motivated and might have paid more attention to their health and diet compared to their counterparts, who might have had a different dietary pattern, and consequently, results from this current study may be generalized to broader populations only with extreme caution. The third limitation of the study was related to the lack of recovery biomarkers [104], such as serum phylloquinone, PIVKA II, percentage of uncarboxylated osteocalcin, measured at this time to verify the relevance of dietary intake. Objective measurements could potentially help identify the trend of over/under-reporting related to each dietary assessment tool and help increase the accuracy of the estimates. The fourth limitation of the study was related to the challenges associated with obtaining complete, accurate, and representative food records from the study participants. The subject fatigue may pose a possibility for having incomplete food records related to portion size, food item description, preparation methods, which contributed to the intra-subject variability. Also, when more than one interviewer 90
106 participated in the study visits, the between-interviewer variances may further attenuate the observed variability in vitamin K intake. The fifth limitation of the study involved the different versions of database used to assess the FFQ and FR. The vitamin K in the FR was assessed by using the USDA nutrient database SR 27, which included phylloquinone, dihydrophylloquinone, and menaquinones, while the USDA SR 16-1, which covered only the phylloquinone, was used to evaluate the FFQ. The inconsistency in the databases predisposed a discrepancy in the dietary vitamin K assessment. Another limitation of the current study was that the impacts of social-economic status (SES), such as income, education, and occupation, on vitamin K intake in the study participants were not assessed. Norvacovic and colleagues systematically reviewed 18 publications and found that SES determinants were positively associated with micronutrient intake and/or status, especially vitamin C and vitamin D, in Western Europe, although vitamin K status was not included in the review [105]. In addition, Drewnowski indicated that rates of obesity and type 2 diabetes followed a socioeconomic gradient as the higher rates thereof were observed in the population with lower income, lower level of education, and poverty [106]; this finding was not surprising as Drewnowski and colleagues pointed out that higher fat and sweet intake was associated with lower diet cost, while high-nutrient density diet with vegetables and fruit was associated with higher diet cost [107]. Moreover, Gucciardi and colleagues found that food insecurity was more prevalent in households with individuals diagnosed 91
107 with diabetes based on cycle 3.1 of the Canadian Community Health Survey [108,109], and food insecurity may compromise the individual s access to adequate and healthy diet that is high in vegetables and fruit and consequently reduced the vitamin K intake. The current study did not collect data regarding the SES indicators and thus could not establish a relationship between vitamin K intake, diabetes risk, food security, and SES determinants. 5.5 Next steps Recovery biomarkers will serve as a valuable reference tool for dietary assessments, so objective measurements are recommended to evaluate and improve the existing dietary assessment tools. Also, systematic tools for preventing over/underreporting from the study participants are important for encouraging complete and accurate dietary intake. It may be valuable to assess the usual vitamin K intake using multiple food records across the year [60] while using FFQ as a cross-reference tool, and also to compare the estimated intake to the more objective biomarkers. Furthermore, due to the various forms of vitamin K in the food supply, the dietary contribution from each form of vitamin K and their relevance to general health and disease prevention need be elucidated. Finally, it is essential for researchers to continue to explore the emerging research area regarding the biosynthesis of menaquinones-4 in specific tissues by enzymes such as the recently identified UBIAD1 and their significance to health, in addition to the previously known bacterial synthesis of long-chain menaquinones in the gut. 92
108 5.6 Implications/ Take-home messages Using the existing assessment tools to ascertain the dietary intake of vitamin K is challenging. According to the food frequency questionnaire and food records, between 37% and 80% participants do not meet the recommended Adequate Intake. The lack of agreement observed between the food frequency questionnaire and food records also indicates that obtaining representative or usual intake of vitamin K from the study participants is difficult. Furthermore, various forms of menaquinones, in addition to the phylloquinone, exist in the food supply, and the current database does not provide sufficient data for each form of vitamin K, or the differences inherent in geography, climate, growth condition, and other environmental factors. Finally, the contribution of the biosynthesis of vitamin K in the gut by bacteria and in specific tissues by enzymes such as the newly identified UBIAD1 to the overall vitamin K metabolism and general health is unknown at this time. Given vitamin K s established and emerging roles in bone metabolism, chronic kidney disease management, cardiovascular health, insulin sensitivity and glucose homeostasis, dietary vitamin K intake need be assessed accurately by using validated and reliable dietary assessment tools to identify the key role of each form of vitamin K in the overall vitamin K metabolism and to ascertain how intake affects biosynthesis in the body, and how the different forms interact in general health and disease prevention from a nutritional standpoint. 93
109 Appendix A: Scanned study forms and questionnaires 94
110 A1. Scanned study information letter 95
111 96
112 97
113 98
114 99
115 A2. Scanned three-day food records 100
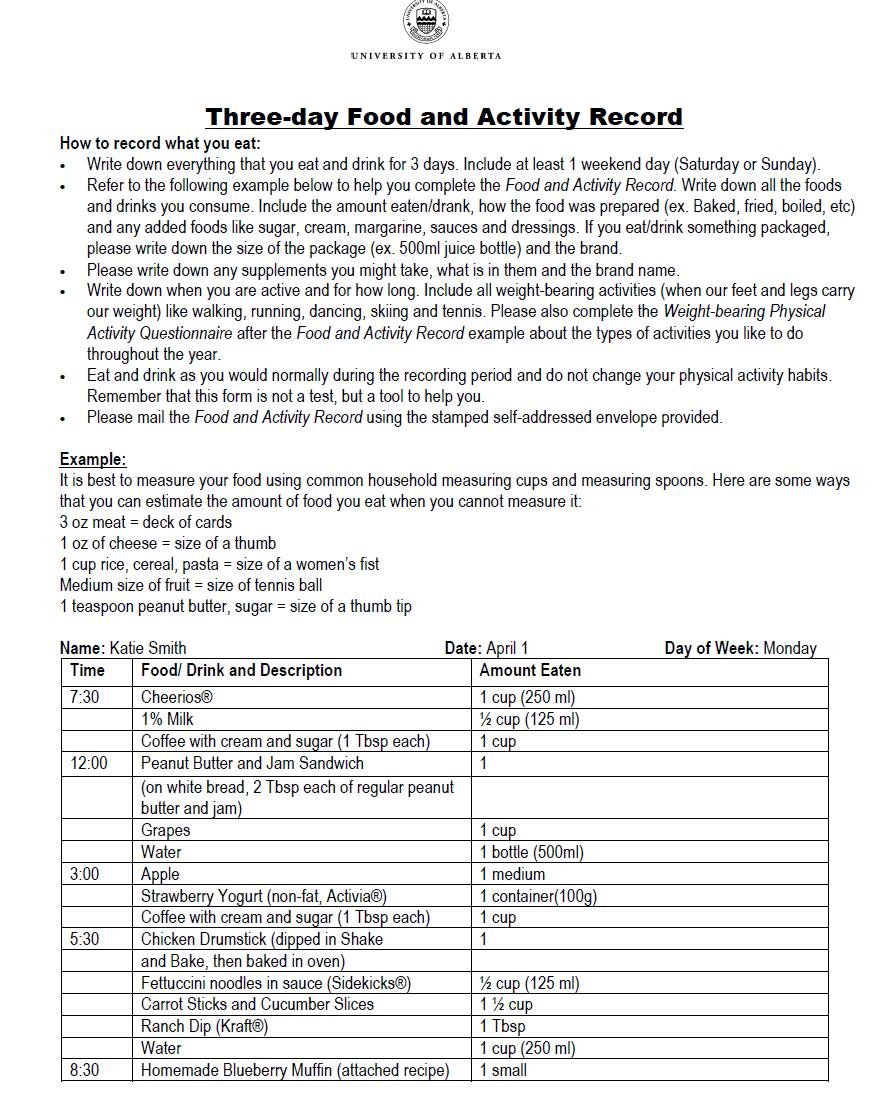
116 101
117 102
118 103
119 104
120 The vitamin K-focused Food Frequency Questionnaire [59] is not attached in this appendix. 105

 Hot cereal Yogurt Beans, lentils or tofu Tennis ball 125 ml (1/2")
 Fish, shellfish, poultry, lean")
121 Appendix B: Portion size tool kit B1. Portion size tool kit developed by Alberta Health and Wellness Serving size item Quantity represented Food represented 250 ml (1 cup) Salad Cold cereal Milk Baseball 175 ml (3/4 cup) Hot cereal Yogurt Beans, lentils or tofu Tennis ball 125 ml (1/2 cup) Fresh, frozen or canned vegetables and fruit 125 ml (1/2 cup) Rice, pasta, bulgur, quinoa, couscous, ½ large bagel 75g (2 ½ oz) Fish, shellfish, poultry, lean meat Hockey puck 50 g (1 ½ oz) Cheese White eraser X 2 106

122 Serving size item Quantity Food represented represented 30 ml (2 tbsp) Peanut or nut butter Golf ball 60 ml (1/4 cup) Dried fruit, Nuts and seeds Golf ball X 2 Adapted with Permission from Alberta Health: Alberta Nutrition Guidelines Portion Size Kit, 2009, Alberta Health and Wellness - Government of Alberta. [82]. 107


123 B2. Portion size tools continued Serving size item Quantity represented 15 ml 1 Tablespoon 5 ml 1 Teaspoon 2.5 ml ½ Teaspoon 1.25 ml ¼ Teaspoon Adapted from the Canadian Sugar Institute. 108
124 Appendix C: Development of Vitamin K Database and the Excel Calculator 1. Determine the vitamin K content of each food item in the FFQ by its absolute weight, as per USDA SR 16-1 [89]. a. A volume-to-weight conversion was applied when necessary. Example: Calculate the vitamin K content in 1 cup of raw spinach leaves: One cup of raw spinach leaves is equivalent to 30 g, and per 100 g of raw spinach leaves contain mcg of vitamin K (code=11457) [89] Vitamin K content in 1 cup of spinach leaves = (482.9 mcg/ 100 g) X 30 g = mcg (Table C.1) b. When more than one food item was categorized under the same group, the average amount of vitamin K was used for the database Example: Calculate the vitamin K content in 1 cup of Boston/ Romaine lettuce (combined under the same category as per FFQ): 1 cup Boston lettuce = 55 g in weight (code=11250) [89] = 56.3 mcg vitamin K 1 cup Romaine lettuce = 56g in weight (code=11251) [89] = 57.4 mcg vitamin K 1 cup of Boston/Romaine lettuce = ( )/2 = 56.9 mcg vitamin K 2. Use the conversion factor to code frequency of consumption and the serving size. a. Frequency of consumption: The frequency of consumption was converted to a daily basis; for instance, 1-3 times per month would be equivalent to 2 times per 30 days, which indicated a conversion factor of 2/30 or 1/15. A detailed list of conversion factors for frequency of consumption was provided in Table C.2. b. Serving size: The serving size was coded as 0.5, 1.0, or 1.5 for an intake that was smaller, similar, or larger than the listed portion size, respectively, as per the validated FFQ developed by Ferland and 109
125 colleagues [59]. A detailed list of conversion factors for serving size was presented in Table C Calculate the total daily vitamin K intake (mcg/day) of each food item listed in the FFQ. a. Formula: Daily vitamin K intake (mcg/d) = vitamin K content (mcg/serving) X frequency (times/day) X serving size (servings/time) b. Example 1: One participant consumes 1 cup of raw spinach leaves twice every day; calculate the vitamin K consumption from raw spinach for this participant: Step 1: Determine vitamin K content: 1 cup of raw spinach leaves = 30 g = mcg (see example in procedure # 1a) Step 2: Determine conversion factors for frequency and serving size: Frequency = 2 times per day = 2 (Table C.2) Serving size = 1 cup standard serving = 1 (Table C.3) Step 3: Calculate total daily vitamin K intake from raw spinach leaves: Daily vitamin K intake (mcg/d) from raw spinach = vitamin K content (mcg/serving) X frequency (times/day) X serving size (serving/time) = mcg X 2 (frequency equivalent) X 1 (serving equivalent) = mcg c. Example 2: One participant consumes apple 1 to 2 times per week, and the serving size of apple is large every time. Calculate the vitamin K consumption from apples for this participant: Step 1: Determine vitamin K content of one apple based on USDA SR 16.1 [89]: 1 regular apple = 182 g = 4.0 mcg vitamin K Step 2: Determine conversion factors for frequency and serving size: Frequency = 1 to 2 times per week = 3/14 (Table C.2) Serving size = large = 1.5 (Table C.3) Step 3: Calculate the total daily vitamin K intake from consumption of apples: Daily vitamin K intake (mcg/d) from apples = vitamin K content (mcg/serving) X frequency (times/day) X serving size (serving/time) 110
126 = 4.0 mcg X 3/14 (frequency equivalent) X 1.5 (serving equivalent) = 1.29 mcg 4. Calculate the total daily vitamin K intake by summing up the vitamin K intake from each line of food items. a. The vitamin K intake from each line of food items was calculated by following the above procedure #3. b. The daily total vitamin K consumption of an individual was calculated by summing up the amount of vitamin K intake from all 50 line items listed in the FFQ. 5. Group the food items based on the subgroup analysis listed in Table 3.3. a. The fruits and vegetables listed in the FFQ were grouped depending on which part of the plant was edible by humans according to one of the classification systems proposed by Pennington and colleagues [88]. For example, lettuce and other green leafy vegetables were categorized under vegetable-leaves, whereas edible podded peas were categorized under vegetable-seeds or pods. b. The rest of the items, such as bread, fish, oil and salad dressings, and dried herbs were categorized under the grain, meat, fat and oils, and other category, respectively. It is notable that milk and alternatives are not included in the FFQ as they are not rich sources of phylloquinone. c. A complete list of the FFQ items under each category is included in Appendix Table 4, and the rank of vitamin K intake from all categories is presented in Figure 4.2 in the results section. 111
127 Table C. 1 Vitamin K content database. Food Item Description Gram (g) Equivalent a Vitamin K a (mcg) Avocado, raw, all varieties 100mL puree (or 0.5 fruit) Kiwifruit, raw 1 medium kiwi Grape, red or green, raw 0.5 cup (or about 16 units) Apple, raw, with peel 1 medium apple Cantaloupe, raw 0.5 cup cubed (or 1 quarter) Nectarine, raw 1 nectarine White bread, commercial, sliced 2 slices Whole wheat bread, commercial, sliced 2 slices Spinach, boiled, drained 0.5 cup (125 ml) Spinach, raw 1 cup, leaves Broccoli, boiled, drained 0.5 cup chopped (or flowerets) Broccoli, raw 3-4 flowerets (entered as cup chopped or diced/44g) Lettuce, Boston or romaine 1 cup shredded Lettuce, looseleaf, radicchio, escarole 1 cup shredded Lettuce, iceberg 1 cup shredded Celery, raw 1 medium stalk (or 10 strips) Green Pepper 0.5 medium (or 0.5 cup cubed) Green Peas, boiled, drained (fresh or 0.5 cup (125mL), drained canned) Carrot, boiled, drained 0.5 cup sliced Carrot, raw 1medium carrot (or baby-cut) Tomato, raw 0.5 medium tomato (or slices (20g/slice)) Vegetable cocktail or tomato juice 0.5 cup (125mL) Parsley, fresh, chopped 0.5 cup chopped Dried fine herbs (chose "parsley, 2 full tsp (or 10mL) dried") Olive oil 2 full tsp (or 10mL) Canola oil 2 full tsp (or 10mL) Margarine, regular (chose 80% fat) 2 full tsp (or 10mL) Margarine, light (chose 20% fat) 2 full tsp (or 10mL) Butter 2 full tsp (or 10mL) Mayonnaise, regular 2 full tsp (or 10mL) Mayonnaise, light 2 full tsp (or 10mL) Salad dressing, regular (chose Ranch) 2 full tsp (or 10mL)
128 Food Item Description Gram (g) Equivalent a Vitamin K a (mcg) Salad dressing, light, reduced fat (chose 2 full tsp (or 10mL) Ranch) Kale, boiled, drained 0.5 cup chopped Collards, boiled, drained 0.5 cup chopped Green cabbage, boiled, drained 0.5 cup chopped Brussel sprouts, boiled drained 0.5 cup (or 4 units) Dandelion greens, raw 0.5 cup chopped Chicory greens, raw 0.5 cup chopped Watercress, raw 0.5 cup chopped Edible-podded peas, boiled, drained 0.5 cup (125mL) Dill or sweet pickles 0.5 large (or 4-5 smalls) Rhubarb, boiled drained, with or 0.5 cup (125mL) without sugar added Rhubarb, raw 0.5 cup diced (or 1 stalk) Swiss chard, boiled, drained 0.5 cup chopped Beet or turnip greens, boiled, drained 0.5 cup chopped Asparagus, boiled, drained 4 spears Chinese cabbage, boiled drained (pakchoi) 0.5 cup shredded Coleslaw (with salad dressing) 0.5 cup (125mL) Fish, canned in oil, drained (ex. Tuna) 1 can, drained a. Vitamin K content and weight equivalent are both based on USDA SR 16-1 (Homepage: [89]. Detailed examples of volume-to-weight conversion are listed in the above procedure #1. 113
129 Table C. 2 Conversion factor for the frequency of consumption. Frequency Equivalent a Conversion factor Never or rarely Never or rarely consumed 0 1 to 3 times per month 2 times per month = 2 times/ 30 days 2/30 (= 1/15) 1 to 2 times per week 1.5 times per week = 1.5 times/ 7 days 1.5/7 (= 3/14) 3 to 5 times per week 4 times per week = 4 times/ 7 days 4/7 Once per day 1 time per day = 1/ day 1 2 times or + per day 2 times per day = 2/ day 2 a. The frequency of consumption is converted to a daily basis; for instance, 1-3 times per month would be equivalent to 2 times per 30 days, which indicates a conversion factor of 2/30 or 1/15. Similarly, 1-2 times per week would be equivalent to 1.5 times per 7 days, which indicates a conversion factor of 1.5/7 or 3/
130 Table C. 3 Conversion factors for the serving size of food items in the FFQ. Serving size Equivalent Conversion factor Smaller 0.5 serving or less 0.5 Similar 0.5 to 1.5 serving 1.0 Larger 1.5 serving or more 1.5 Conversion factors and their equivalents were obtained from the publication on the validated vitamin K food frequency questionnaire, 2009 [59]. 115
131 Appendix D: Supplementary tables and figures Figure D. 1 Bivariate correlation analysis between age and number of comorbidities. Pearson r = 0.38, R-squared = 0.14, p<0.001*. *p<0.05 indicates a statistical significance. 116

132 Figure D.2. A Food group distribution of the study participants based on food records. Food group classification is based on Eating Well with Canada s Food Guide, 2007, developed by Health Canada [87]. Green, yellow, blue, and red bar represents vegetables and fruit, grain products, milk and alternatives, and meat and alternatives, respectively. The position of the horizontal line (above or cross each bar) represents the recommended serving of each food group for its corresponding age and gender group. Overall all participants had lower than recommended vegetables and fruit and milk and alternatives, and had higher than recommended meat and alternatives. For male above 51 years of age, the mean intake of grain products met the recommended servings (7 servings), but for male years of age and all female participants, their intakes of grain products were below the recommended servings. 117
NEW MK-7 SELECT INTRODUCTION
 NEW MK-7 SELECT INTRODUCTION As we have all known for several years now, the presence of optimal amounts of vitamin D is essential for maintaining optimal bone health and bone calcification, as noted by
Vitamin K. Amina Ziyad Elaf Sohaib
 Vitamin K Amina Ziyad Elaf Sohaib What is Vitamin K? Fat soluble compound Necessary for the synthesis of several proteins required for blood clotting 1) Vit K 1 (Phylloquinone) - natural form - found in
Vitamin K. Emily Rohan Sarah Steinmetz
 Vitamin K Emily Rohan Sarah Steinmetz How much do we need? Adequate Intake (AI) Life Stage Group Adequate Intake Level 0-6 months 2.0 ug/day 7-12 months 2.5 ug/day 1-3 years 30 ug/day 4-8 years 55 ug/day
Vitamin K. Emily Rohan Sarah Steinmetz
 Vitamin K Emily Rohan Sarah Steinmetz How much do we need? Adequate Intake (AI) Institute of Medicine. Dietary reference intakes for vitamin A, vitamin K, arsenic, boron, chromium, copper, iodine, iron,
Vitamin K in Cystic Fibrosis
 Vitamin K in Cystic Fibrosis Martin J. Shearer PhD, MRCPath Consultant Clinical Scientist Honorary Senior Lecturer Centre for Haemostasis and Thrombosis, Guy s and St. Thomas Foundation Trust London, UK
Vitamins and Minerals
 Eating Right Vitamins and Minerals Many claims about vitamins and minerals may be misleading and confusing. The following lists tell what vitamins and minerals do, where they are found and the current
Biochemistry of Vitamin K
 Lecture 4 Biochemistry of Vitamin K The Objectives Types and chemistry of vitamin K Sources and daily requirements Functions Synthesis of γ-carboxyglutamate in: Prothrombin and blood clotting factors Osteocalcin
ABLE TO READ THE LABEL?
 ARE ABLE TO READ THE LABEL? A Consumer s Guide to Navigating Food Labels Food and Drug Safety Program Consumer and Environmental Health Services Phone: 609-826-4935 Fax: 609-826-4990 http://nj.gov/health/eoh/foodweb/
4 Nutrient Intakes and Dietary Sources: Micronutrients
 Nutrient Intakes and Dietary Sources: Micronutrients New Zealanders obtain the energy and nutrients they require from a wide variety of foods and beverages, and in some cases from dietary supplements as
2002 Learning Zone Express
 1 Nutrients The food you eat is a source of nutrients. Nutrients are defined as the substances found in food that keep your body functioning. Your body needs nutrients to 2 Fuel your energy. Help you grow.
Nutrients. The food you eat is a source of nutrients. Nutrients are defined as the substances found in food that keep your body functioning.
 Nutrients The food you eat is a source of nutrients. Nutrients are defined as the substances found in food that keep your body functioning. Your body needs nutrients to Provide energy. Build and repair
Canada s Food Supply: A Preliminary Examination of Changes,
 Canada s Food Supply: A Preliminary Examination of Changes, 1992-2002 Canada's Food Guide to Healthy Eating, released in 1992, is a key nutrition education tool for Canadians aged four years and over.
Sultan Qaboos University. College of Agricultural & Marine Sciences. Vitamin K. Lecture Summary
 Sultan Qaboos University College of Agricultural & Marine Sciences Vitamin K Lecture Summary Name: Mohsin Mohammed Taqi Mohsin Al-Saleh ID #: M020944-99 0 Introduction: Vitamin K is a group of structurally
ENERGY NUTRIENTS: THE BIG PICTURE WHY WE EAT FUNCTIONS FATS FAT, CARBS, PROTEIN
 ENERGY NUTRIENTS: FAT, CARBS, PROTEIN Angeline B. David, DRPH, MHS NAD Health Summit March 14, 2013 The science of cooking is not a small matter.... This art should be regarded as the most valuable of
Name Unit # Period Score 159 points possible Dietary Guidelines, Food Pyramid and Nutrients Test
 Name Unit # Period Score 159 points possible Dietary Guidelines, Food Pyramid and Nutrients Test 1. List the ten dietary guidelines recommended for Americans. (10) a. b. c. d. e. f. g. h. i. j. Multiple
MyPlate for Health and Nutritional Adequacy
 MyPlate for Health and Nutritional Adequacy By Joan Thompson, MS, PhD, RDN, CD Professor of Nutrition Department of Health Promotion and Human Performance Weber State University Why diet is the second
eat well, live well: EATING WELL FOR YOUR HEALTH
 eat well, live well: EATING WELL FOR YOUR HEALTH It may seem like information on diet changes daily, BUT THERE IS ACTUALLY A LOT WE KNOW ABOUT HOW TO EAT WELL. Eating well can help you improve your overall
PERFORMANCE FUELING GUIDELINES
 PERFORMANCE FUELING GUIDELINES Although good eating habits cannot substitute for physical training and genetic endowment, proper daily diet, training and game diet, plus appropriate supplemental choices
Chapter 05: Fats Grodner and Escott-Stump: Nutritional Foundations and Clinical Application: A Nursing Approach, 6th Edition
 Instant download and all chapters Test Bank Nutritional Foundations and Clinical Applications A Nursing Approach 6th Edition Michele Grodner https://testbanklab.com/download/test-bank-nutritional-foundations-clinical-applicationsnursing-approach-6th-edition-michele-grodner/
25* or higher Underweight. 240 mg/dl and above High (More than twice the risk as desirable level.) OK, but higher is better
 OK, but higher is better") Biometrics Screening Biometric Health Indicators The charts below provide a summary of the ranges for each of the biometric screening tests. Be sure to check with your doctor if your results are outside
Biometrics Screening Biometric Health Indicators The charts below provide a summary of the ranges for each of the biometric screening tests. Be sure to check with your doctor if your results are outside
My Diabetic Meal Plan during Pregnancy
 My Diabetic Meal Plan during Pregnancy When you have diabetes and are pregnant, you need to eat small meals and s throughout the day to help control your blood sugar. This also helps you get in enough
Eat and Enjoy a Variety of Fruits and Vegetables on MyPlate
 Joanne Slavin, PhD., RD Professor University of Minnesota Eat and Enjoy a Variety of Fruits and Vegetables on MyPlate Academy of Nutrition & Dietetics DPG School Nutrition Services Webinar February 15,
MyPlate. Lesson. By Carone Fitness. MyPlate
 Lesson By Carone Fitness Nutrition is the study of how the health of your body is influenced by the foods you eat. The foods that you consume provide your body with energy, build and maintain organs and
Dietary Fat Guidance from The Role of Lean Beef in Achieving Current Dietary Recommendations
 Dietary Fat Guidance from 1980-2006 The Role of Lean Beef in Achieving Current Dietary Recommendations Penny Kris-Etherton, Ph.D., R.D. Department of Nutritional Sciences Pennsylvania State University
Coach on Call. Please give me a call if you have more questions about this or other topics.
 Coach on Call It was great to talk with you. Thank you for your interest in learning about the fats you eat. I hope you find this tip sheet helpful. Please give me a call if you have more questions about
Following Dietary Guidelines
 LESSON 26 Following Dietary Guidelines Before You Read List some things you know and would like to know about recommended diet choices. What You ll Learn the different food groups in MyPyramid the Dietary
The Top 25 Food Choices in the Performance Diet
 The Top 25 Food Choices in the Performance Diet # Name Information Picture 1 Water The single most essential component that represents 80% of your body and 65% of your weight 2 Beans Top ranked carbohydrates
Vitamin K The Forgotten Vitamin
 Vitamin K The Forgotten Vitamin Ask anybody what vitamins they know about, and you re likely to hear Vitamin C, Vitamin D, Vitamin E, and many people will even know that there are multiple vitamins called
Chapter. The Micronutrients: Vitamins and Minerals. Images shutterstock.com
 Chapter 13 The Micronutrients: Vitamins and Minerals Images shutterstock.com Objectives Differentiate between fat-soluble vitamins and water-soluble vitamins. List functions and sources of major minerals
You Bet Your Weight. Karah Mechlowitz
 You Bet Your Weight Karah Mechlowitz What to Expect for Today n Introduction to macronutrients n Breakdown of each macronutrient n Ways to track macronutrients n Wrap up What are the macronutrients? Carbohydrates
Functions of Food. To provide us with energy and keep us active. For growth and repair of the. body. To stop us from feeling hungry.
 Functions of Food To provide us with energy and keep us active. For growth and repair of the body. To stop us from feeling hungry. To keep us healthy and fight diseases. Nutrients Macro/Micro Nutrient
Nutrients. Macronutrients. Micronutrients. Others. Carbohydrates Proteins Fats. Vitamins Minerals. Fiber, water
 Nutrition Human Nutrition - The science of food, the nutrients and other substances contained therein, their action, interaction, and balance in relation to health and disease Normal Nutrition - caloric
Chewing the fat about fat!
 Chewing the fat about fat! When we talk about fat, most people think of fatty foods, like fries and fatty meats. But fat is an essential nutrient. It plays an important role in the many functions that
FINAL EXAM. Review Food Guide Material and Compose/Complete Nutrition Assignment. Orange Green Red Yellow Blue Purple
 NUTRITION ASSIGNMENT-11 th Grade Physical Education FINAL EXAM Review Food Guide Material and Compose/Complete Nutrition Assignment Dietary Guidelines (The Food Guide Pyramid) Orange Green Red Yellow Blue
Fecal Fat Test Diet Preparation
 Fecal Fat Test Diet Preparation Purpose Malabsorption is a medical condition that means fat in the diet (and also proteins, carbohydrates, minerals, and vitamins) may not be absorbed properly. Absorption
Dietary Guidelines for Americans 2005
 Dietary Guidelines for Americans 00 APPENDIX A. EATING PATTERNS Appendix A-1: The DASH Eating Plan at 1,600-,,000-,,600-, and,100-calorie Levels a The DASH eating plan is based on 1,600,,000,,600 and,100
Youth4Health Project. Student Food Knowledge Survey
 Youth4Health Project Student Food Knowledge Survey Student ID Date Instructions: Please mark your response. 1. Are you a boy or girl? Boy Girl 2. What is your race? Caucasian (White) African American Hispanic
Vitamin K2: Are You Consuming Enough? March 22, 2017 by Chris Kresser Abridged by Dr. Michael Schwarz
 Vitamin K2: Are You Consuming Enough? March 22, 2017 by Chris Kresser Abridged by Dr. Michael Schwarz Did you know that vitamin K1 and vitamin K2 are different types of vitamin K? Before 2006, the USDA
Nutrition - What Should We Eat?
 Nutrition - What Should We Eat? Adapted from the 2010 USDA Dietary Guidelines for Americans www.choosemyplate.gov Nutrition - What Should We Eat? Adapted from the 2010 USDA Dietary Guidelines for Americans
F. To provide energy, to spare body protein, to prevent ketosis. G. Food sources include breads, vegetables, fruit, and milk.
 Nutrition: Nutrients for the Body Nutrients are chemical substances supplied by food that the body needs for growth, maintenance, and repair. The six nutrients are: 1. Carbohydrates. 2. Proteins. 3. Fats.
Nutritional Guidelines for Roux-en-Y and Duodenal Switch Gastric Restrictive Procedures. Phase III Regular Consistency
 Nutritional Guidelines for Roux-en-Y and Duodenal Switch Gastric Restrictive Procedures Phase III Regular Consistency The University of Chicago Hospitals Center for the Surgical Treatment of Obesity (March
Tools for Healthy Eating
 Chapter 2 Tools for Healthy Eating Multiple Choice 1. Which of the following is not a key principle of healthy eating? A. availability B. balance C. variety D. moderation REF: 38 2. A diet consisting of
VIRGINIA COOPERATIVE EXTENSION SERVICE
 VIRGINIA COOPERATIVE EXTENSION SERVICE VIRGINDl 'IECH VIRGINDl S'Dtt.E Blacksburg, Virginia 24061 Publication 348-337 August 1984 Lesson 3 Diet, Exercise, and Behavior Modification (Weight Control by Mail)
LABORATORY REPORT SAMPLE. Summary of Deficient Test Results. Vitamin B12 Pantothenate Biotin Spectrox Immunidex
 LABORATORY REPORT Account Number: Name: Jon Doe Gender: Male DOB: 12/28/1984 Requisition Number: Summary of Deficient Test Results Testing determined the following functional deficiencies: Oleic Acid Borderline
Date of Interview/Examination/Bioassay (MM/DD/YYYY):
:") PhenX Measure: Dietary Intake (#231200) PhenX Protocol: Dietary Intake (#231201) Date of Interview/Examination/Bioassay (MM/DD/YYYY): SP = Survey Participant 1. These questions are about the different
PhenX Measure: Dietary Intake (#231200) PhenX Protocol: Dietary Intake (#231201) Date of Interview/Examination/Bioassay (MM/DD/YYYY): SP = Survey Participant 1. These questions are about the different
TRACKS Extension Lesson
 Energy Balance Hidden Fat Grades 9-12 TRACKS Extension Lesson I. Nutrition Education Objectives: Goal 1: Students will comprehend concepts consistent with USDA guidance related to eating and physical activity
Lifelong Nutrition. Jemma O Hanlon BHlthSc(Nutr & Diet) APD AN Accredited Practising Dietitian Accredited Nutritionist
 APD AN Accredited Practising Dietitian Accredited Nutritionist") Lifelong Nutrition Jemma O Hanlon BHlthSc(Nutr & Diet) APD AN Accredited Practising Dietitian Accredited Nutritionist Outline a Macronutrients a Micronutrients a Glycaemic Index a NHPAs The Australian
Lifelong Nutrition Jemma O Hanlon BHlthSc(Nutr & Diet) APD AN Accredited Practising Dietitian Accredited Nutritionist Outline a Macronutrients a Micronutrients a Glycaemic Index a NHPAs The Australian
By the end of the lesson students will be able to: Healthy Living Unit #1 Healthy Eating. Canada s Food Guide. Healthier Food Choices Are...
 Healthy Living Unit #1 Healthy Eating Lesson #1 Making Healthier Food Choices Healthier Food Choices Are... follow Eating Well with, By the end of the lesson students will be able to: Apply health knowledge
1 What Are the Different Food Groups?
 1 What Are the Different Food Groups? 1. Match the food items below to where they are found in the supermarket. The first one has been done for you. Food item Section Oil Meat Fruits and vegetables Grains
Personal Touch Food Service will ensure all consumers have access to varied and nutritious foods consistent with promoting health and wellness.
 Nutrition Guidelines It is well accepted that consumer eating habits are greatly influenced by the types and quantities of foods made available to them. Personal Touch Food Service is committed to supporting
Macros and Micros. of a Healthy Diet. Macronutrients. Proteins
 Macros and Micros of a Healthy Diet Macronutrients Nutrients needed in large amounts in the body that provide energy Includes protein, carbohydrates, and fats Proteins Roles in the body: Develops, maintains,
Nutrition And You. An Orange a Day
 Nutrition And You Anatomy of The Healthy Eating Pyramid Healthy Eating Pyramid s 9 Food Groups An Orange a Day Anatomy of the Healthy Eating Pyramid. Activity is represented as the foundation of this pyramid.
'Eat Smart' - Nutrition for a Healthy Heart
 Definitions - Fats & Cholesterol Found in Blood LDL HDL 'low density lipoprotein' also known as 'bad cholesterol' major cholesterol-carrying molecule in blood delivers cholesterol to the arterial walls
Nutrition Tips to Manage Your Diabetes
 PATIENT EDUCATION patienteducation.osumc.edu As part of your diabetes treatment plan, it is important to eat healthy, stay active and maintain a healthy body weight. This can help keep your blood sugar
Unit 5L.4: Food. Know that humans require food as an energy source. Know that a balanced diet must contain proteins, fats,
 Unit 5L.4: as an energy source Balanced diet Requirements for different lifestyles Science skills: Observing Classifying By the end of this unit you should: Know that humans require food as an energy source.
NUTRITION CONCEPTS MACRONUTRIENTS FAT SOLUBLE VITAMINS
 NUTRITION CONCEPTS MACRONUTRIENTS Carbohydrates Found in breads, cereals, fruits, vegetables, sugar and potatoes. good source of energy fiber in fruits and vegetables aid in eliminating wastes from the
Laura Kim, MGH Dietetic Intern March 17, 2015
 Laura Kim, MGH Dietetic Intern March 17, 2015 Introduction Carbohydrates Fats Proteins Understand basic functions of each nutrient Identify food sources of carbohydrates, fats, proteins Create balanced
ALIGNING MENUS: 2010 DIETARY GUIDELINES FOR AMERICANS
 ALIGNING MENUS: FOR AMERICANS Child and Adult Care Food Program Illinois State Board of Education Nutrition and Wellness Programs August 2013 ALIGNING MENUS WITH Institute of Medicine Recommendations:
Lecture 3. Nutrition
 Lecture 3 Nutrition, Part 1 1 Nutrition 1.Macronutrients a. Water b. Carbohydrates c. Proteins d. Fats 2.Micronutrients a. Minerals b. Vitamins 2 1 Why is Nutrition Important? Your food choices each day
Knowing How Much to Eat
 MINTO PREVENTION & REHABILITATION CENTRE CENTRE DE PREVENTION ET DE READAPTATION MINTO Knowing How Much to Eat About This Kit In previous kits you learned about what to eat. Choose a variety of grains,
Research Article A Study to Assess Relationship Between Nutrition Knowledge and Food Choices Among Young Females
 Cronicon OPEN ACCESS EC NUTRITION Research Article A Study to Assess Relationship Between Nutrition Knowledge and Food Choices Among Young Females Maidah Nawaz 1 *, Samia Khalid 1 and Sania Ahmed 2 1 Department
Nutrition for the heart. Geoffrey Axiak Nutritionist
 Nutrition for the heart Geoffrey Axiak Nutritionist The Food Pyramid Dairy 2-3 servings Vegetables 3-5 servings Breads/Grains 6-11 servings Fats & Oils Use Sparingly Proteins 2-3 servings Fruits 2-4 servings
Databases for Characterizing Foods in the As Eaten Form
 Databases for Characterizing Foods in the As Eaten Form Elizabeth Condon, M.S., R.D. 36th National Nutrient Databank Conference March 27, 2012 Key Issues Most databases designed for assessing dietary intake
Lesson 1 Carbohydrates, Fats & Proteins pages
 Lesson 1 Carbohydrates, Fats & Proteins pages 190-201 What are the 3 classes of nutrients that supply your body with energy and how does the body obtain the energy from foods? Describe the roles that carbohydrates,
3/9/2011. I. Main nutritional requirements. WARM-UP (GRAB A SHEET ON YOUR WAY IN) TERMS STUDENT LEARNING OBJECTIVES OBJECTIVE 1
 TERMS STUDENT LEARNING OBJECTIVES OBJECTIVE 1") (GRAB A SHEET ON YOUR WAY IN) What 7 things make up your favorite salad? (if you don t like salad pick 7 things anyway) What food group do each of them fall under? (the food groups are Grains, Vegetables,
(GRAB A SHEET ON YOUR WAY IN) What 7 things make up your favorite salad? (if you don t like salad pick 7 things anyway) What food group do each of them fall under? (the food groups are Grains, Vegetables,
New Concepts in Nutrition
 New Concepts in Nutrition Linda M. Gourash, MD Developmental Pediatrician Pittsburgh, Pennsylvania ITTSBURGH ARTNERSHIP PWS Without careful energy balance weight gain is relentless. Energy IN Energy OUT
Principles of the DASH Diet
 DASH Diet Lower your blood pressure by changing your eating habits. The DASH diet is based on findings from the "Dietary Approaches to Stop Hypertension" clinical study that found that high blood pressure
Nutrition for Health. Nutrients. Before You Read
 CHAPTER 10 LESSON 2 Nutrition for Health Nutrients BIG Idea Each nutrient in your diet plays a unique and essential role in keeping you healthy. Before You Read Sometimes figuring out what to eat can be
TO BE RESCINDED 2
 ACTION: Final DATE: 08/22/2016 9:11 AM TO BE RESCINDED 173-4-05.1 Methods for determining nutritional adequacy. The provider shall offer a menu to consumers that is nutritionally adequate as determined
EXSC- STANDARD 14. Nutrients
 SPORTS NUTRITION EXSC- STANDARD 14 Nutrients Standard 14 Gather relevant information from multiple authoritative print and digital sources related to the importance of a balanced diet in the achievement
BCH 445 Biochemistry of nutrition Dr. Mohamed Saad Daoud
 BCH 445 Biochemistry of nutrition Dr. Mohamed Saad Daoud 1 Energy Needs & Requirements Food is the only source of body which undergoes Metabolism and liberate / Generates Energy required for vital activities
HYPERLIPIDAEMIA AND HARDENING OF ARTERIES
 HYPERLIPIDAEMIA AND HARDENING OF ARTERIES What is Hyperlipidaemia? Hyperlipidaemia means that there are too many fatty substances in your blood. Commonest of these are: 1. Cholesterol Of animal origin,
Copyright is owned by the Author of the thesis. Permission is given for a copy to be downloaded by an individual for the purpose of research and
 Copyright is owned by the Author of the thesis. Permission is given for a copy to be downloaded by an individual for the purpose of research and private study only. The thesis may not be reproduced elsewhere
The Food Guide Pyramid
 The Food Guide Pyramid In this lesson, you will Learn About n What influences a person s food choices. n How to use the Food Guide Pyramid to make healthful food choices. The Foods You Choose The foods
Nutrition and Energy 1
 Nutrition and Energy 1 Food Energy The ingestion of food serves two primary functions: 1. it provides a source of energy 2. it provides raw materials the animal is unable to manufacture for itself. 2 Basal
4. Which of the following is not likely to contain cholesterol? (a) eggs (b) vegetable shortening (c) fish (d) veal
 eggs (b) vegetable shortening (c) fish (d) veal") Sample Test Questions Chapter 6: Nutrition Multiple Choice 1. The calorie is a measure of (a) the fat content of foods. (b) the starch content of foods. (c) the energy value of foods. (d) the ratio of
Sample Test Questions Chapter 6: Nutrition Multiple Choice 1. The calorie is a measure of (a) the fat content of foods. (b) the starch content of foods. (c) the energy value of foods. (d) the ratio of
Lipids Types, Food Sources, Functions
 Lipids Types, Food Sources, Functions What Are Lipids? Lipids Diverse group of molecules that are insoluble in water Fats The lipid content of diets and foods 1 Lipids in Body Cells and Tissues Types of
L III: DIETARY APPROACH
 L III: DIETARY APPROACH FOR CARDIOVASCULAR DISEASE PREVENTION General Guidelines For Dietary Interventions 1. Obtain a healthy body weight 2. Obtain a desirable blood cholesterol and lipoprotein profile
Eating Healthier: Six Simple Steps
 Eating Healthier: Six Simple Steps Most of us are interested in learning how to eat a healthier diet. As a coach, you can support your client by making simple suggestions as well as giving her resources
Term Year 7 HPE (B, E, F, G, J, M) Nutrition
 Nutrition") Term 1 2019 Year 7 HPE (B, E, F, G, J, M) Nutrition Personal, social and community health Food for life Year 7 Unit 1 Assessment task Food for life Name: PCG: Teacher: Genre: In class project Assignment
Term 1 2019 Year 7 HPE (B, E, F, G, J, M) Nutrition Personal, social and community health Food for life Year 7 Unit 1 Assessment task Food for life Name: PCG: Teacher: Genre: In class project Assignment
WHY DO WE NEED FOOD? FOOD AND DIET
 WHY DO WE NEED FOOD? FOOD AND DIET Food gives us the energy required for chemical reaction to keep us alive Energy also required for many activities and to maintain body temperature Food also gives us
Low Fat Diet. For a regular healthy diet, it is recommended that of the total calories eaten, no more than 30% should come from fat.
 Low Fat Diet For a regular healthy diet, it is recommended that of the total calories eaten, no more than 30% should come from fat. Some dietary fat is needed for good health. Fats supply energy and essential
Interpreting the Diet Summary Report. Marilyn Townsend
 Interpreting the Diet Summary Report Marilyn Townsend WebNEERS How does it compare to other diet analysis programs? We have a gold mine. Excellent source of info. A tremendous asset for EFNEP. Cost for
EASY WAYS TO EAT MORE FRUITS AND VEGETABLES AS PART OF A HEALTHY DIET.
 This is a text-only 508 accessible version for the visually impaired. For a full-color brochure, see: www.fruitsandveggiesmatter.gov/downloads/aa_womens_brochure.pdf Page 1- Left column (back cover) EASY
Chapter 02 Tools of a Healthy Diet
 Chapter 02 Tools of a Healthy Diet Multiple Choice Questions 1. Which is true about the Dietary Reference Intakes (DRIs)? A. They apply to people in Canada and the U.S. B. They differ by age group. C.
Eastern Michigan University. Bonnie Farmer. Master's Theses, and Doctoral Dissertations, and Graduate Capstone Projects
 Eastern Michigan University DigitalCommons@EMU Master's Theses and Doctoral Dissertations Master's Theses, and Doctoral Dissertations, and Graduate Capstone Projects 2009 Comparison of nutrient intakes
Introduction to the Lifestyle Survey
 Introduction to the Lifestyle Survey This program is designed to help lower your chances of getting heart disease. To get started, we need to know about your current eating and physical activity habits.
Know Your Numbers Handouts
 Calculating Your Body Mass Index (BMI) 1. Write down your weight in pounds (example: 190) 2. Multiply that number by 703 (190 x 703 = 133,570) 3. Multiply your height in inches by itself ( 70 x 70 = 4,900)
A Closer Look at The Components Of a Balanced Diet
 A Closer Look at The Components Of a Balanced Diet The essential nutrients are carbohydrates, fats, proteins, vitamins, minerals, dietary fibre and water. These nutrients will ensure that the systems and
How to Fight Diabetes and Win. Meal. Planning NUTURNA. Advance Diabetic Support
 How to Fight Diabetes and Win Meal Planning NUTURNA TM Advance Diabetic Support Meal Planning Well-balanced and portion-controlled meals are vital to the control of blood sugar levels and management of
The Six Essential Nutrient Groups:
 The Six Essential Nutrient Groups: Water: Water transports other nutrients to cells, carries wastes away, aids digestion and more. It makes up more than half your weight. SOURCES: water; juices and
1 Learning ZoneXpress
 1 Food portion sizes have changed over the past 20 years. Slides marked by are adapted from Portion Distortion by the National Heart, Lung and Blood Institute at http://hin.nhlbi.nih.gov/portion 2 Typical
TO BE RESCINDED 2
 ACTION: Final DATE: 08/22/2016 9:11 AM TO BE RESCINDED 173-4-05.2 Therapeutic and modified meals. Before a provider may offer a therapeutic or modified meal, the provider shall determine the need, feasibility,
Chapter 2 Carbohydrates
 216 Answer, K/A, page(s) Chapter 2 Carbohydrates K = knowledge question; A = application question True/False T K 34 1. Whenever carbohydrate is available to the body, the human brain depends exclusively
Meal Menu Approximate Amount Eaten
 Meal Menu Approximate Amount Eaten Myself 16 Year Old Active Male Teen 3 Year Old Female Child ¼ cup 1 slice 70 Year Old Female Breakfast Special K Cereal(red berries) 1 cup 1 Banana (slices) ¼ cup ¾ cup
Lipids. PBHL 211 Darine Hachem, MS, LD
 Lipids PBHL 211 Darine Hachem, MS, LD Outline Functions of lipids in our body Types of lipids Sources of lipids Recommendation of fat intake Fat association with heart diseases Provide energy (9Kcal/g
Chapter 4: Nutrition. ACE Personal Trainer Manual Third Edition
 Chapter 4: Nutrition ACE Personal Trainer Manual Third Edition Introduction SCAN group of dieticians who practice in sports and cardiovascular nutrition [SCAN]; locate local SCAN dieticians by contacting
Supplemental Table 1: List of food groups
 Supplemental Table 1: List of food groups Food groups names Food groups description Serving size definitions - Examples Fruits and vegetables Vegetables Fruits Whole vegetables All vegetables but soups,
Student Book. Grains: 5 10 ounces a day (at least half whole grains) Self-Check
 Self-Check") ETR Associates Middle School I read and followed directions. My work is neat and complete. This is my best work. HealthSmart Actions Lesson at a Glance Student Book The HealthSmart Actions student book
ETR Associates Middle School I read and followed directions. My work is neat and complete. This is my best work. HealthSmart Actions Lesson at a Glance Student Book The HealthSmart Actions student book
Six Nutrients. Nutrients: substances in food that your body needs to stay healthy. Carbohydrates Protein Fat Minerals Vitamins Water
 Nutrients Six Nutrients Nutrients: substances in food that your body needs to stay healthy Carbohydrates Protein Fat Minerals Vitamins Water Water Function: most essential nutrient Helps digest and absorb