The metabolism of plant glucosinolates by gut bacteria. Fatma Cebeci
|
|
|
- Christine Lang
- 5 years ago
- Views:
Transcription
1 The metabolism of plant glucosinolates by gut bacteria Fatma Cebeci A thesis submitted for the degree of Doctor of Philosophy to the University of East Anglia Institute of Food Research April, 2017 This copy of the thesis has been supplied on condition that anyone who consults it is understood to recognise that its copyright rests with the author and that use of any information derived there from must be in accordance with current UK Copyright Law. In addition, any quotation or extract must include full attribution.
2 PhD Thesis 2017 Fatma Cebeci Metabolism of Plant Glucosinolates by Gut Bacteria ABSTRACT Glucosinolates found in cruciferous vegetables are degraded by plant myrosinases into bioactive isothiocyanates (ITCs) which have been recognised as potent anticancer compounds. During cooking, plant myrosinases are heat inactivated so ITC production is dependent on the myrosinase-like enzymes produced by the gut bacteria. This study is focused on investigating glucosinolate metabolism by the human gut bacteria and identifying the enzymes that play a crucial role. Human gut bacteria that were previously reported to metabolise glucosinolates were investigated in this study. In addition, 98 more human gut strains were isolated using a glucoraphanin enrichment method. It was hypothesised that bacterial myrosinases are β- glucosidases with specificity for glucosinolates. To identify the first bacterial myrosinase from the human gut, four putative β-glucosidases from Enterococcus casseliflavus CP1 and Escherichia coli FI10944 were cloned and heterologously expressed in E. coli. An alternative approach using a combination of ion exchange chromatography and gel filtration was also carried out to identify the bacterial myrosinase of E. coli FI It has been reported that some gut bacteria require a reduction step to metabolise methylsulfinylalkyl glucosinolates (such as glucoraphanin) that converts them into methylthioalkyl glucosinolates (such as glucoerucin) to produce ITCs. To identify the responsible reductase, candidate reductase genes were cloned and expressed in E. coli. Methionine sulfoxide reductase B (MsrB) from Escherichia coli VL8 and Lactobacillus agilis R16 was found to reduce glucoraphanin to glucoerucin under the conditions tested. A bacterial myrosinase of Citrobacter WYE1 of soil origin was previously identified and myrosinase activity of this enzyme was characterised using cell-free extracts. In this study the myrosinase gene was heterologously expressed in E. coli to allow purification and characterisation. The recombinant enzyme showed activity against several glucosinolate substrates and protein was produced for crystallographic studies. ii
3 TABLE OF CONTENTS ABSTRACT... ii TABLE OF CONTENTS... iii LIST OF FIGURES... viii LIST OF TABLES... xii OUTPUTS FROM THIS PROJECT... xiv ABBREVIATIONS... xv ACKNOWLEDGEMENTS... xviii 1 GENERAL INTRODUCTION GLUCOSINOLATES General Structure and Biological Importance of Glucosinolates Glucosinolate Biosynthesis GLUCOSINOLATE HYDROLYSIS AND DEGRADATION PRODUCTS ITC Formation Nitrile and Epithionitrile Formation Thiocyanate Formation Other Products THE IMPORTANCE OF GLUCOSINOLATES AND THEIR DEGRADATION PRODUCTS Chemopreventative effects of Glucosinolates and ITCs Protective Effects of Glucosinolates and ITCs against Diseases Toxicity of Glucosinolates and Their Degradation Products BIOAVAILABILITY OF GLUCOSINOLATES AND THEIR DEGRADATION PRODUCTS MYROSINASES METHIONINE SULPHOXIDE REDUCTASES GUT MICROBIOTA THE ROLE OF GUT MICROBIOTA IN BIOTRANSFORMATION OF DIETARY COMPOUNDS iii
4 1.9 GLUCOSINOLATE METABOLISM BY GUT BACTERIA SCOPE OF THE THESIS GENERAL MATERIALS AND METHODS MICROBIOLOGY METHODS Culture Media Preparation of Antibiotic Stock Solutions Isolation of Glucosinolate Degrading Bacteria by Glucoraphanin Enrichment Bacterial Strains and Culture Conditions Bacterial Growth Analysis Scanning Electron Microscopy (SEM) MOLECULAR BIOLOGY Polymerase Chain Reaction (PCR) Gel Electrophoresis Plasmid Preparation Enzyme Restrictions Dephosphorylation of Digested Plasmids Primer Design PCR Product Purification DNA Ligation Preparation of Chemically Competent Cells Transformation of E. coli Selection of the Positive Transformants S rdna Sequencing Genomic DNA Extraction, Sequencing, Assembly and Annotation Preparation of Phylogenetic Tree PROTEIN BIOCHEMISTRY Induction of Protein Expression and Cell-Free Extract Preparation Protein Quantification Sodium Dodecyl Sulfate Polyacrylamide Gel Electrophoresis (SDS-PAGE) Western Blotting Ni-NTA Purification iv
5 2.3.6 Measurement of Myrosinase Activity by God-Perid Assay CHROMATOGRAPHY METHODS High Performance Liquid Chromatography (HPLC) Preparation of sulfatase Desulfation of glucosinolates HPLC analytical conditions MYROSINASES FROM HUMAN GUT BACTERIA INVOLVED IN GLUCOSINOLATE METABOLISM INTRODUCTION HYPOTHESIS MATERIALS AND METHODS Bacterial Strains Genome Assembly of Glucosinolate Degrading Bacteria Screening Glucosinolate Metabolism by Human Gut Bacteria Identification of β-glucosidases to Clone and Express Cloning, Expression of β-glucosidases and Purification of Proteins Dialysis of the Recombinant Proteins Measurement of Myrosinase Activity β-glucosidase Assay Using 4-nitrophenyl β-d-glucopyranoside as Substrate Purification of the Bacterial Myrosinase using Fast Protein Liquid Chromatography (FPLC) Identification of the Protein Sequences Obtained from FPLC by LCMS/MS RESULTS Myrosinase Activity of Human Gut Bacteria Cloning and Expression of β-glucosidases Selection of β-glucosidases to Clone and Express Cloning of Putative β-glucosidases of E. casseliflavus CP1 and E. coli FI Protein Expression and Purification of Putative β-glucosidases of E. casseliflavus CP1 and E. coli FI Purification of the Bacterial Myrosinase of E. coli FI v
6 3.5 DISCUSSION BACTERIAL REDUCTASES FROM HUMAN GUT BACTERIA INVOLVED IN GLUCOSINOLATE METABOLISM INTRODUCTION HYPOTHESIS METHODS Testing Reductase Activity of Human Gut Bacteria Identification of Reductase Genes to Clone and Express Cloning and Expression of Reductases Protein Extraction by Bugbuster Purification of Recombinant Proteins Testing Reductase Activity of Proteins RESULTS Reductase Activity of Human Gut Bacteria Identification of Putative Sulphoxide Reductases Cloning of Methionine Sulphoxide Reductases from L. agilis R16, E. coli VL8 and E. coli FC Protein Expression and Purification of Methione Sulphoxide Reductases from L. agilis R16, E. coli VL8 and E. coli FC Reductase Activity of Recombinant Methionine Sulphoxide Reductases DISCUSSION CHARACTERISATION OF A BACTERIAL MYROSINASE OF SOIL ORIGIN INTRODUCTION HYPOTHESIS MATERIALS AND METHODS Strain Identification and Preparation of Phylogenetic Tree Comparison of C. WYE1 Myrosinase with Other Myrosinases Cloning and Expression of Myrosinase Gene Purification of Myrosinase and Measurement of Enzyme Activity Dialysis and Filtration of Purified Protein for Crystallography vi
7 5.3.6 Intact Mass Analysis Characterisation of Myrosinase RESULTS Strain Identification and Preparation of Phylogenetic Tree The Relevance of C. WYE1 Myrosinase to Other Myrosinases Cloning and Expression of Myrosinase Gene Western Blotting and Purification of Myrosinase Myrosinase Activity of Recombinant cmyr Enzyme Activity and Kinetics Substrate Specificity of Recombinant cmyr Stability of Myrosinase Activity of Recombinant cmyr DISCUSSION CONCLUSIONS AND FUTURE WORK CONCLUSIONS AND FUTURE WORK LIST OF REFERENCES REFERENCES APPENDICES APPENDIX 1 : Maps of the Cloning Vectors APPENDIX 2 : The Nucleotide Sequences of the Cloned Genes APPENDIX 3 : RDP Database Results APPENDIX 4 : Mascot results for FPLC vii
8 LIST OF FIGURES Figure 1.1 General structure of a glucosinolate... 3 Figure 1.2 Amino acid chain elongation cycle for glucosinolate biosynthesis... 9 Figure 1.3 Biosynthesis of glucosinolate core structure Figure 1.4 Hydrolysis of glucosinolates by myrosinase Figure 1.5 Expected metabolic fate of glucosinolates in the human body Figure 1.6 The overall structure of S. alba myrosinase Figure 1.7 Structures of methionine and its oxidation products Figure 1.8 The action mechanism of Msrs Figure 1.9 The structure of methionine sulfoxide reductase from E. coli Figure 1.10 Proposed action mechanism of Msr enzymes on methylsulfinyl glucosinolates Figure 1.11 Illustration of the effect of human gut microbiota on human health and disease 30 Figure 2.1 Illustration of a PCR with forward and reverse primers Figure 2.2 A reference calibration curve of Bradford assay Figure 2.3 See Blue Plus2 protein marker (Invitrogen) on a 4-12% Bis-Tris gel with different buffers Figure 2.4 Western blot module set up order Figure 2.5 The principle of the God-Perid assay Figure 2.6 A reference calibration curve for God-Perid assay Figure 3.1 A reference calibration curve for β-glucosidase assay Figure 3.2 SEM images of E. casseliflavus CP1 (up left), E. coli FI10944 (up right) and L. agilis R16 (below) Figure 3.3 HPLC chromatograms of hydrolysis of glucoraphanin by E. casseliflavus CP1, E. coli FI10944 and L. agilis R Figure 3.4 Growth curves of E. coli FI10944 in M9 minimal media at different growing conditions viii
9 Figure 3.5 Growth curves of C. freundii FC50 in M9 minimal media at different growing conditions Figure 3.6 The structure of the aphid myrosinase Figure 3.7 Alignments of putative β-glucosidases; ecg1, ecg43, ecg44 with aphid (B. brassicae) myrosinase and pea aphid (A. pisum) myrosinase Figure 3.8 Alignment of the putative β-glucosidases with C. WYE1 myrosinase Figure 3.9 Agarose gel electrophoresis of bacterial gdna Figure 3.10 Agarose gel electrophoresis of PCR products Figure 3.11 Agarose gel electrophoresis for colony PCR experiments Figure 3.12 SDS-PAGE and Western blot of the CFEs from E. coli BL21 (DE3) expressing pet15b-ecg Figure 3.13 SDS-PAGE of the Ni-NTA purified ecg44 proteins from E. coli BL21 (DE3) expressing pet15b-ecg Figure 3.14 SDS-PAGE and Western Blot of the CFEs from E. coli BL21 (DE3) expressing pet28b-ecg4, pet28b-ecg39 and pet28b-ecolg Figure 3.15 SDS-PAGE of the Ni-NTA purified ecg4 (a), ecg39 (b) and ecolg3 (c) proteins from E. coli BL21 (DE3) expressing pet28b-ecg4, pet28b-ecg39 and pet28b-ecolg3 respectively.. 99 Figure 3.16 Chromatogram showing IEX fractions from ammonium sulphate precipitated proteins of E. coli FI Figure 3.17 SDS-PAGE showing protein extracts of E. coli FI10944 and fractions from IEX chromatography Figure 3.18 Protein yields of CFEs of E. coli FI10944 in various buffers Figure 3.19 Specific enzyme activity of CFEs of E. coli FI10944 in various buffers Figure 4.1 Structures of methionine and its oxidation product methionine sulphoxide Figure 4.2 HPLC chromatogram showing reduction of glucoraphanin to glucoerucin by E. coli FC Figure 4.3 Multiple alignments of Recombinant MsrA proteins with other MsrAs from different organisms ix
10 Figure 4.4 Multiple alignments of MsrB proteins from different organisms Figure 4.5 Multiple alignments of recombinant frmsr proteins with frmsrs from different organisms Figure 4.6 Agarose gel electrophoresis from colony PCR experiments Figure 4.7 SDS-PAGE and Western Blot of the CFEs obtained from E. coli BL21 (DE3) cells expressing pet15b-lbag_msra1, pet15b-lbag_msra2 and pet15b-lbag_msra Figure 4.8 SDS-PAGE of CFEs of E. coli BL21 (DE3) expressing pet15b-lbag_msra Figure 4.9 SDS-PAGE of the Ni-NTA purified MsrA proteins from E. coli BL21 (DE3) expressing pet15b-lbag_msra1, pet15b-lbag_msra2 and pet15b-lbag_msra Figure 4.10 SDS-PAGE and Western Blot of the soluble CFEs from E. coli BL21 (DE3) expressing recombinant pet15b plasmids expressing msr genes Figure 4.11 SDS-PAGE of Ni-NTA purified MsrB proteins from E. coli BL21 (DE3) expressing pet15b-lbag_msrb and pet15b-vl8_msrb Figure 4.12 Reduction of glucoraphanin to glucoerucin by MsrA1 and MsrA Figure 4.13 Reduction of glucoraphanin to glucoerucin by CFEs of E. coli BL21(DE3) expressing msr genes Figure 4.14 HPLC chromatograms showing reduction of glucoraphanin to glucoerucin by CFEs of E. coli BL21(DE3) cells expressing pet15b-lbag_msrb (a) and pet15b-vl8_msrb (b) Figure 4.15 Reduction of glucoraphanin by Ni-NTA purified LBAG_MsrB and VL8_MsrB Figure 5.1 Phylogenetic tree of C. WYE1 compared with other Citrobacter species Figure 5.2 The multiple alignment of cmyr with some of the identified myrosinases Figure 5.3 Agarose gel electrophoresis of cmyr insert and double digested pet28b vector Figure 5.4 Agarose gel electrophoresis for colony PCR experiments Figure 5.5 SDS-PAGE of the CFEs from E. coli BL21 (DE3) expressing pet28b-cmyr Figure 5.6 SDS-PAGE of soluble and insoluble extracts from E. coli BL21(DE3) expressing pet28b-cmyr Figure 5.7 SDS-PAGE of the Ni-NTA purified Cmyr protein from E. coli BL21 (DE3) expressing pet28b-cmyr x
11 Figure 5.8 The MS spectrum for cmyr Figure 5.9 ph optimum range of recombinant cmyr myrosinase activity in 20 mm citrate phosphate buffer Figure 5.10 Temperature stability of C. WYE1 myrosinase in 20 mm citrate phosphate buffer ph Figure 5.11 Kinetic analysis of cmyr using sinigrin as substrate Figure 5.12 The myrosinase activity of cmyr towards different glucosinolates Figure 5.13 Stability of myrosinase activity of cmyr in 20 mm citrate phosphate buffer ph 6.0 at 4 C over time Figure 6.1 Proposed metabolism of desulfo-glucosinolates by human gut bacteria Figure 6.2 Proposed glucosinolate metabolism pathway of methylsulfinylalkyl glucosinolates by human gut bacteria xi
12 LIST OF TABLES Table 1.1 Some of the glucosinolates found in Brassica vegetables... 4 Table 1.2 Some glucosinolate hydrolysis products catalyzed by plant myrosinase Table 1.3 Bioaccessibility and bioactivity steps Table 1.4 Studies reporting bacteria which have glucosinolate metabolising ability Table 2.1 Antibiotic stock solutions used in this study Table 2.2 Bacterial strains used in the study Table 2.3 Components of one PCR for amplification of the gene of interest Table 2.4 PCR conditions for amplification of the gene of interest Table 2.5 Components of one DNA ligation reaction Table 2.6 Components of buffers used in competent cell preparation Table 2.7 Components in one colony PCR (a) and thermal cycling conditions (b) Table 2.8 Components in one PCR reaction (a) and thermal cycling conditions (b) Table 2.9 Components in NuPAGE Transfer Buffer (20X) buffer Table 2.10 Response factors for desulfo-glucosinolates at 229 nm relative to desulfo-sinigrin Table 3.1 Bacterial strains used in the study Table 3.2 Primers used in the PCR experiments to amplify the candidate β-glucosidase genes Table 3.3 Conditions used in the PCR to amplify the candidate β-glucosidase genes Table 3.4 Plasmids used and generated in this study Table 3.5 Identities of 10 human gut isolates at genus level Table 3.6 Specific myrosinase activity of extracts of E. coli FI Table 3.7 Glucoraphanin and sinigrin degradation rates of L. agilis R16 pre-cultured at different conditions Table 3.8 The genes cloned and expressed in this part of the study xii
13 Table 3.9 The details and results of chromatography methods used in purification of bacterial myrosinase Table 4.1 Primers used in the PCR experiments to amplify the candidate msr genes Table 4.2 Conditions used in the PCR experiments to amplify the candidate msr genes Table 4.3 Plasmids used and generated in this study Table 4.4 The reduction of glucoraphanin to glucoerucin by glucoraphanin-induced and uninduced CFEs of E. coli VL8 and E. coli FC Table 4.5 Cloned msr genes of L. agilis R16, E. coli V8 and E. coli FC Table 4.6 Properties of putative methionine sulphoxide reductases Table 4.7 Optimum conditions of E. coli BL21 (DE3) expressing msr genes Table 4.8 The reduction rate of glucoraphanin to glucoerucin by Ni-NTA purified LBAG_MsrB and VL8_MsrB using NADPH or DTT as reducing agent Table 5.1 Primers used in the PCR experiments to amplify the cmyr Table 5.2 Conditions used in the PCR experiments to amplify the cmyr gene Table 6.1The list of bacterial strains studied in this research xiii
14 OUTPUTS FROM THIS PROJECT Publications Albaser A., Kazana E., Bennett M. H., Cebeci F., Luang-In V., Spanu P.D., Rossiter J.T. Discovery of a Bacterial Glycoside Hydrolase Family 3 (GH3) β-glucosidase with Myrosinase Activity from a Citrobacter Strain Isolated from Soil. Journal of Agricultural and Food Chemistry. 2016, 64 (7), p: Luang-In, V., Narbad, A., Cebeci, F., Bennett, M., Rossiter, JT. Identification of Proteins Possibly Involved in Glucosinolate Metabolism in L. agilis R16 and E. coli VL8. Protein J Apr; 34(2): p Presentations Cebeci F., Mayer M., Rossiter J. T., Mithen R., Narbad A. Biotransformation of glucosinolates by human gut bacteria to Bioactive Isothiocyanates. Food bioactives & Health, September 2016, Norwich, UK (Oral Presentation). Cebeci F., Mayer M., Rossiter J. T., Mithen R., Narbad A. Bacterial enzymes involved in glucosinolate metabolism. IFR Science Symposium, 2015, Norwich, UK (Oral presentation). Cebeci, F., Mayer, M., Rossiter J. T., Mithen, R. and Narbad, A. (2014). Glucosinolate Metabolism by bacterial enzymes. Glucosinolates and Beyond October, Wageningen, Netherlands (Poster Presentation). Cebeci, F., Pigram A., Mayer, M., Rossiter J. T., Mithen, R. and Narbad, A. (2014). Glucosinolate Metabolism by bacterial myrosinase-like enzymes., Rowett-INRA Gut Microbiology: From Sequence to function, June 2014, Aberdeen, Scotland, UK (Poster Presentation). xiv
15 ABBREVIATIONS 6XHis-tag Hexa-histidine tag ABTS 2-2 -azino-bis (3-ethylbenzthiazoline-6-sulphonic acid) AITC Allyl ITC BCAT4 Branched-chain aminotransferase4 BHI Brain heart infusion BITC Benzyl ITC bp Base pair BSA Bovine serum albumin CE Competitive exclusion CFE Cell-free extract C-terminal Carboxy-terminal DEAE Diethylaminoethyl DGGE Denaturing gradient gel electrophoresis DNA Deoxyribonucleic acid DTT Dithiothreitol EDTA Ethylenediaminetetraacetic acid EGFR1 Epidermal growth factor receptor 1 ESP Epithiospecifier protein FISH Fluorescence in situ hybridisation FPLC Fast protein liquid chromatography GC-MS Gas chromatography-mass spectrometry gdna Genomic DNA GF Gel filtration GH1 Glycosyl hydrolase 1 GH3 Glycosyl hydrolase 3 GRP Glucoraphanin GSH Glutathione GST Glutathione-S-transferase HER1 Human epidermal growth factor receptor 2 HPLC High performance liquid chromatography IAA Indole-3-acetic acid IARC International Agency for Research on Cancer IEX Ion Exchange IPMI Isopropyl isomerase IPM-DH Isopropylmalate dehydrogenase IPTG Isopropyl β-d-1-thiogalactopyranoside ITC Isothiocyanate K m Michaelis-Menten constant L Luria LCMS Liquid chromatography-mass spectrometry LCMS/MS Liquid chromatography mass spectrometry-mass spectrometry LDL-C Low density lipoprotein cholesterol MAM Methylthioalkylmalate MetSO Methionine sulphoxide MetSO 2 Methionine sulphone MOPS 3 [N-Morpholino]propanesulfonic acid xv
16 MQ MRS Msr NAC NADPH NB NFκB Ni-NTA NMR Nrf2-ARE NSP N-terminal OD PCR PDP pi pka p-np p-npg PP PTS PVDF Q-PCR QR-1 QTL RDP RNA ROS rrna SCFA SDS-PAGE SEM S-GT SNG SNP SOC ST TFP TGGE T m T-RFLP UV V max Milli-Q de Man, Rogosa and Sharpe Methionine sulphoxide reductase N-acetyl cysteine Nicotinamide adenine dinucleotide phosphate Nutrient broth Nuclear factor kappa B Nickel nitrolotriacetic acid Nuclear magnetic resonance Nuclear factor (erythroid-derived 2)-like 2-Antioxidant Response Element Nitrile specifier protein Amino-terminal Optical density Polymerase Chain Reaction Precipitated dialysed protein Isoelectric point Ionisability constant p-nitrophenol 4-nitrophenyl β-d-glucopyranoside Precipitated protein Phoshotransferase system Polyvinylidene difluoride Quantitative PCR Quinone reductase-1 Quantitative trait loci Ribosomal Database Project Ribonucleic acid Reactive oxygen species Ribosomal ribonucleic acid Short chain fatty acid Sodium dodecyl sulfate polyacrylamide gel electrophoresis Scanning Electron Microscopy S-glucosyltransferase Sinigrin Single-nucleotide polymorphism Super Optimal broth with catabolite repression Sulfotransferase Thiocyanate forming protein Temperature gradient gel electrophoresis Melting temperature Terminal restriction fragment length polymorphism Ultraviolet Maximum velocity xvi
17 Abbreviation Amino acid Symbol Ala Alanine A Arg Arginine R Asn Asparagine N Asp Aspartic acid D Cys Cysteine C Gln Glutamine Q Glu Glutamic acid E His Histidine H Ile Isoleucine I Leu Leucine L Lys Lysine K Met Methionine M Phe Phenylalanine F Thr Threonine T Trp Tryptophan W Tyr Tyrosine Y Val Valine V Ser Serine S Pro Proline P Gly Glycine G xvii
18 ACKNOWLEDGEMENTS First of all, I would like to thank to my supervisors Prof. Arjan Narbad, Dr. Melinda Mayer, Prof. Richard Mithen and Dr. John T. Rossiter for their support, training and guidance throughout my PhD. I was lucky to benefit from broad expertise of my supervisory team. My sincere thanks go to Prof. Arjan Narbad and Dr. MeIinda Mayer for their patience during my writing up process and especially to Dr. Melinda Mayer for being there when I needed someone to talk to. I owe a big thank-you to Dr. Shikha Saha and Dr. Neil Rigby for their help about HPLC and FPLC and to Dr. Vijitra Luang-In for providing the bacterial strains. I would like to acknowledge Dr. Arnoud Van Vliet, Dr. Fran Mulholland and Rachael Stanley for their contributions to this study. I would like to thank to Turkish Ministry of Education for funding my PhD education. In addition, my special thanks go to my colleagues and friends in IFR and Norwich who turned this PhD journey into a great experience to me. I am very grateful to my family for their love and invaluable encouragement. This was a long adventure away from home but I learnt not only about science but also about myself and the whole world. I am planning to continue my career as an academic and to contribute science as much I can for the rest of my life. As our great leader Mustafa Kemal Atatürk said that Our true mentor in life is science. xviii
19 CHAPTER ONE 1 GENERAL INTRODUCTION 1
20 1.1 GLUCOSINOLATES Glucosinolates are found in cruciferous vegetables such as broccoli and are known to confer health promoting effects when consumed; notably, reduction in prostate, pancreatic and bladder cancer has been reported. This was attributed to chemopreventation effect of them and their degradation products. Plant myrosinases are responsible for transforming glucosinolates into the bioactive isothiocyanates (ITCs) that are known to have chemopreventative effects. During cooking, plant myrosinases are heat inactivated so ITC production is dependent on the myrosinase-like enzymes produced by the gut bacteria. This study is focused on glucosinolate metabolism by the human gut bacteria and identifying the bacterial enzymes and mechanisms that play a crucial role General Structure and Biological Importance of Glucosinolates Glucosinolates are sulphur containing glycosides found in cruciferous vegetables mainly belonging to the Brassicaceae family. They are mostly present in the Brassicaceae, Capparaceae and Caricaceae families [1]. These include Brassica oleracea var italica (broccoli), Raphanus sativus (radish), Brassica oleracea var capitata (cabbage) or Brassica oleracea var gemmifera (Brussels sprouts), Brassica oleracea var botrytis (cauliflower) and Brassica rapa subsp rapa (turnip). Cabbage, broccoli and Brussels sprouts are the main source of glucosinolates for the human diet and they are frequently consumed vegetables in Western and Eastern countries [2]. The general structure of a glucosinolate is shown in Figure 1.1. Glucosinolates are β- thioglucosides and (Z)-cis-N-hydroximinosulfate esters with a side chain R and sulfur-linked d- glucopyranose moiety [2]. The chemical and biological nature of glucosinolates are defined by the side chain in the structure. So far glucosinolates are known to have little biological activity while their degradation products serve as a defence against herbivores including insects, birds, aphids and mammals [3]. Glucosinolate hydrolysis in plant is avoided by storing glucosinolate and the degradation enzyme in different plant compartments (such as glucosinolates in S-cells and myrosinases in myrosin cells)[4-7] or by separating them at subcellular level [8]. 2
![Figure 1.1 General structure of a glucosinolate. The image was adapted from [8]. R; variable side chain.](/docs-images/80/81600753/images/21-0.jpg "There are more than 120 different glucosinolates identified but only a few have been investigated deeply.")
![They are known as sulphur and glucose contaning compounds and some of the benzyl glucosinolates may have an additional sugar moiety such as rhamnose and arabinose bound to aromatic ring [1].](/docs-images/80/81600753/images/21-1.jpg "Some of the glucosinolates found in the plants are given in Table 1.1. Amino acids are the precursors of glucosinolates.")
21 Figure 1.1 General structure of a glucosinolate. The image was adapted from [8]. R; variable side chain. There are more than 120 different glucosinolates identified but only a few have been investigated deeply. They are known as sulphur and glucose contaning compounds and some of the benzyl glucosinolates may have an additional sugar moiety such as rhamnose and arabinose bound to aromatic ring [1]. Some of the glucosinolates found in the plants are given in Table 1.1. Amino acids are the precursors of glucosinolates. Depending on which amino acid acts as a precursor for glucosinolate formation, they can be divided into three groups. Aliphatic glucosinolates are derived from alanine (Ala), leucine (Leu), isoleucine (Ile), valine (Val), and methionine (Met). Aromatic glucosinolates are derived from phenylalanine (Phe) and tyrosine (Tyr) and indole glucosinolates are derived from tryptophan (Trp) [9]. As an example, methionine is the precursor in glucoraphanin biosynthesis. 3
22 Common Name Structure of the Glucosinolate Aliphatic Glucosinolates Sinigrin Glucoraphanin Glucoraphenin Glucoiberin Glucoiberverin Glucoerucin Progoitrin Glucoalyssin Glucocapparin Glucobrassicanapin Gluconapin 2-Propenyl 4-methylsulfinylbutyl 4-methylsulfinyl-3-butenyl 3-methylsulfinylpropyl 3-methylthiopropyl 4-methylthiobutyl 2-hydroxy-3-butenyl 5-methylsulfinylpentyl Methyl 4-pentenyl 3-Butenyl Aromatic Glucosinolates Glucotropaeolin Glucosinalbin Gluconasturtiin Benzyl p-hydroxybenzyl 2-phenethyl IndoleGlucosinolates Glucobrassicin Neobrassicin 4-Hydroxyglucobrassicin 4-Methoxyglucobrassicin 3-Indolylmethyl 1-methoxy-3-indolylmethyl 4-hydroxy-3-indolylmethyl 4-methoxy-3-indolylmethyl Table 1.1 Some of the glucosinolates found in Brassica vegetables. Adapted from [1] and [2]). 4
23 Glucosinolates are found in almost every part of the plant varying in concentration throughout the plant development. Their content in plant is quite variable but they make up almost 1% of the dry weight in some tissues of Brassica [1]. Normally, up to 4 different glucosinolates dominate the glucosinolate occurance in the plant within a single species [2]. Seeds or young sprouts of broccoli (Brassica oleracea var italica) were reported to contain µmol of total glucosinolates per g fresh weight and it was found that the content was entirely dominated by aliphatic glucosinolates; glucoraphanin, glucoerucin and glucoiberin [10]. The same cultivar was reported to have around 1-4 µmol glucosinolates per g fresh weight at late stages of growth possessing aliphatic and indolic glucosinolates at equal levels [10]. The concentration, variation and distribution of glucosinolates in the Brassica family depends on a number of criteria including the species [11], varieties [12], season [13] environmental conditions such as soil fertility [14], presence of pest infestation [2], plant organ [11, 15], plant age [10, 15] or abiotic stress factors such as salinity or drought [16]. The glucosinolate accumulation of the model plant Arabidopsis thaliana among different organs and developmental stages was studied and it was found that dormant and germinating seeds had highest amount ( % per dry weight) followed by the fruits, leaves and the roots. In the same study, younger leaves were reported to have higher glucosinolate concentrations than the older leaves [15]. Glucosinolates and their degradation products are responsible for the characteristic flavour and odour of Brassica vegetables. When cell-integrity is damaged, ITCs are responsible for the pungent and bitter flavour [17]. ITCs from progoitrin and gluconasturtiin have been found to relate bitterness in cabbage and Brussel sprouts. Glucosinolates and their degradation products have also gained attention as pest control agents. Many studies are focused on their biofumigant properties [18-20]. Even if glucosinolate-myrosinase system is a defence mechanims for plants [21], herbivores are able to avoid from this by biochemical mechanisms or creating their own myrosinase-glucosinolate system against their predators [22, 23]. For instance, the cabbage aphids (Brevicoryne brassicae) can do this by producing their own myrosinases and storing glucosinolates obtained from plants [23]. Aqueous solubility, ionisability (pka) and lipophilicity (octanol-water partition, log P) determine the dissolution of glucosinolates. Especially, log P is an important factor which 5
24 affects membrane permeability and inversely related to solubility. In other words, higher log P values mean enhanced permeability but reduced solubility. Glucosinolates have negative log P values and it is unlikely that they can cross cell membranes so active transport through aqueous pores is needed [24]. Glucosinolates have strongly acidic properties due to their sulfate group. Sulfate group and thioglucose moiety gives them water-solubility [24]. The potential roles of glucosinolates in plants can be listed as follows: 1) Glucosinolates have roles in plant growth regulation. The plant hormone indole-3- acetic acid (IAA) was proposed to arise from indole glucosinolates. Indole glucosinolates are proposed to be hydrolyzed to indole acetonitriles then nitrilase can convert indole acetonitriles to IAAs [25, 26]. Later, indole-3-acetaldoxime was found as a precursor of IAA. Arabidopsis mutants (the genes involved in late steps of biosynthesis of indole glucosinolates were mutated) were found to have high levels of IAA and resulted in dwarf phenotype. These results showed that disruption of the conversion of indole-3-acetaldoxime to indole glucosinolates resulted in increased flux into IAA [27, 28]. 2) Glucosinolates are involved in plant-insect/herbivore interactions. They are known as part of defensive system against their predators. Plant feeding insects can be categorised as generalists and specialists. Glucosinolates may be a general poison for generalists and a feeding attractant for specialists [29]. They show growth inhibition or feeding deterrence against general herbivores such as birds, slugs and generalist insects [29]. 3) Glucosinolates have roles in plant/pathogen interactions. It was reported that glucosinolates and their hydrolysis products have antifungal and antibacterial properties in vitro [30-33]. The hydrolysis products of aromatic glucosinolates (aromatic ITCs) were found to be more toxic than aliphatic ones and aliphatic ITCs showed decreased toxicity due to increasing length of side chain [34, 35]. As an example, 4-methylsulfinylbutyl ITC was identified with a wide range of antimicrobial activity against fungi and bacteria, it caused 50% growth inhibition at concentration of 28 µm for the most sensitive organism tested, Pseudomonas syringae [36]. 6
25 1.1.2 Glucosinolate Biosynthesis Amino acids were suggested to be precursors of the aglycone motiety of glucosinolates then this hypothesis was tested and stages of biosynthesis of glucosinolates were identified using labelled compounds ( 14 C, 15 N, 35 S) [37-39]. The biosynthesis of glucosinolates occurs in three steps. In the first step, chain elongation of aliphatic or aromatic amino acids occurs by inserting methylene groups into their side chains (Figure 1.2). The second step is metabolic modification of the amino acid via an aldoxime intermediate then glucosinolate core structure is formed. The pathway for biosynthesis of glucosinolate core structure is shown in Figure 1.3. Lastly, the initial glucosinolate is modified by many secondary transformations. For instance, the methylthioalkyl glucosinolates are produced directly from the unmodified elongated methionine derivatives [2, 8, 40]. The detailed explanation of biosynthesis steps is given as follows: Initially, the parent amino acid is deaminated branched-chain aminotransferase4 (BCAT4) to form 2-oxo acid. The 2-oxo acid enters a cycle of 3 transformations. First, it condenses with acetyl-coa in a reaction catalysed by methylthioalkylmalate (MAM) and yields a 2-malate derivative (1). The 2-malate derivative isomerased by isopropyl isomerase (IPMI) to form 3- malate derivative (2). This derivative undergoes oxidation-decarboxylation by the action of isopropylmalate dehydrogenase (IPM-DH) to form an elongated 2-oxo acid which has one more methylene group than the starting 2-oxo acid (3). Then elongated 2-oxo acid can undergo deamination to form homomethionine or enter another round of chain elongation [8, 41] (See Figure 1.2). The chain elongated amino acids are converted to aldoximes by cytochromes P450 belonging to the CYP79 family. CYP79F1 can metabolise all chain-elongated methionine derivatives, CYP79F2 only converts long-chained methionine derivates. While CYP79B2 and CYP79B3 can use tryptophan, CYP79A2 metabolises phenylalanine. After aldoxime formation, aldoximes are oxidized to either nitrile oxides or aci-nitro compounds by cytochromes P450 belonging to the CYP83 family. CYP83A1 converts aliphatic aldoximes and CYP83B1 converts both tryptophan and phenylalanine derived acetaldoximes. Then conjugation with a sulfur donor produces S-alkyl-thiohydroximates. This step is proposed to be catalysed by glutathione-stransferases [41] and the sulfur donor was found to be glutathione [42]. The C-S-lyase converts S-alkyl-thiohydroximates to thiohydroximates. Thiohydroximates undergo glycosylation by the action of glucosyltransferases of the UGT74 family and forms 7
26 desulfoglucosinolates then desulfoglucosinolates are sulfated by sulfotransferases to produce the core glucosinolate structure [8, 41] (See Figure 1.3). Secondary modifications of R group including oxidation, desaturation, hydroxylation, removal of a methylsulfinyl group and addition of methoxy group can occur to form final glucosinolate such as glucoiberin, sinigrin or 4-methoxyglucobrassicin [8, 41]. 8
27 Figure 1.2 Amino acid chain elongation cycle for glucosinolate biosynthesis. Adapted from [8]. Three mains steps include condensation with acetyl-coa (1), isomerization (2) and oxidation-decarboxylation (3). 9
28 Figure 1.3 Biosynthesis of glucosinolate core structure (adapted from [8]). CYP79 enzymes are responsible for conversion of elongated amino acids to aldoximes then CYP83 enzymes act on aldoximes to form aci-nitro compounds. Glutathione-S-transferase (GST) was proposed to be the sulfur-donating enzyme. R; variable side chain, S-GT; S-glucosyltransferase, ST; sulfotransferase. There are studies focusing on increasing the glucosinolate content of plant by manipulating the genetic pathways [43, 44]. Increasing the glucosinolate content to maximize the health benefits of glucosinolates is a target for plant breeders [45]. For instance, Brassica villosa wild species were used to develop 3 high-glucoraphanin broccoli hybrids which have times 10
29 the glucoraphanin content of standard hybrids. Two of these high-glucoraphanin hybrids were commercialised as Beneforté broccoli [44]. Different thermal and non-thermal processes also can affect the glucosinolate content [46, 47]. A study investigated the effect of gamma-irradiation on genes involved in glucosinolate biosynthesis pathway and it was found that many genes are up-regulated and sinigrin content was increased by 41% in the irradiated cabbage [46]. Epidemiological evidence has shown that there is an inverse association between the consumption of cruciferous vegetables and the risk of cancer. The intake of cruciferous vegetables has been linked to a reduced risk of certain cancer types such as lung cancer, colorectal cancer, prostate cancer in many epidemiological studies [48-50]. This effect is attributed to the ITCs, the hydrolysis products of glucosinolates. Glucosinolate research started with toxicological aspects of glucosinolates such as progoitrin and methods for removing them from dietary sources and animal feed but nowadays, most of the studies are focused on their potential health-promoting effects [1, 2]. 1.2 GLUCOSINOLATE HYDROLYSIS AND DEGRADATION PRODUCTS The hydrolysis of glucosinolates is mediated by the thioglucosidase enzyme myrosinase (Figure 1.4). Glucosinolate containing vegetables also contain myrosinase in all parts of the plant including leaves, roots, stems, seeds and flowers [51]. Myrosinase is found separately from glucosinolates, in idioblasts or myrosin cells of the parenchymatous tissue. Cutting, chewing or food processing causes tissue damage so the integrity of cells is disrupted and glucosinolates and myrosinase come into contact. When glucosinolate degradation is initiated and enzymatic hydrolysis results in the formation of glucosinolate hydrolysis products such as ITCs, thiocyanates or nitriles [24, 51] (Table 1.2). 11
30 Figure 1.4 Hydrolysis of glucosinolates by myrosinase. First, myrosinase catalysed degradation produces glucose and unstable aglycone. The aglycone rapidly rearranges to ITC (a). In the presence of specifier proteins (ESP, TFP and NSP), other degradation products are formed (b). ESP; epithiospecifier protein, TFP; thiocyanate forming protein, NSP; nitrile specifier protein. The presence of a terminal double bond in the side chain is needed for epithionitrile formation. Thiocyanate formation has only been reported from sinigrin, glucoerucin and glucotropaeolin hydrolysis. The image was adapted from [52]. 12
31 Glucosinolates are converted to an unstable aglycone (thiohydroximate-o-sulfonate) by myrosinase and undergo a Lossen re-arrangement to give an ITC. Thiocyanates, epithionitriles and nitriles formation is dependant on ph, metal ions and specifier proteins [2, 53, 54]. The hydrolysis products of glucosinolates can be unstable. For instance, β-hydroxy-itcs are unstable and undergo rapid cyclisation to give oxazolidine-2-thiones [2]. Some of the ITC and nitrile products of glucosinolates are shown in Table 1.2. Glucosinolate ITC Product Nitrile Product Sinigrin Allyl ITC Allyl nitrile Glucoerucin Erucin Erucin nitrile Glucoiberin Iberin Iberin nitrile Glucoraphanin Sulforaphane Sulforaphane nitrile Glucotropaeolin Benzyl ITC Benzyl nitrile Gluconasturtiin Phenethyl ITC Phenethyl nitrile Table 1.2 Some glucosinolate hydrolysis products catalyzed by plant myrosinase ITC Formation ITCs are important and valued hydrolysis products of glucosinolates owing to their chemopreventative effects. They are known to be produced at ph range of 5 7 and nitriles are known as degradation products in acidic conditions [2, 55]. A recent study showed that ITC and nitrile production can occur in a more broader ph range of during bacterial fermentation [56] but it was not reported how much ITC formed at specific ph. Unlike glucosinolates, ITCs were reported to be unstable and easily degraded in media, buffers and water [57]. 13
32 1.2.2 Nitrile and Epithionitrile Formation Nitrile production was originally thought to be dependent on ferrous ions, ph and enzyme independent. Then epithiospecifier protein (ESP) was identified and partially characterised as the responsiple factor for epithionitrile formation in Crambe abyssinica seeds [58]. Later, ESP was purified independently by two diferent study groups and characterised [59, 60]. Moreover, thiocyanate forming proteins (TFP) were also identified to form nitrile and epithionitriles from aliphatic glucosinolates [61]. A new group of specifier proteins, nitrile-specifier, was identified and reported to produce nitriles [62]. The nitrile specifier proteins (NSP) were reported to require the presence of a myrosinase for its nitrile specifier activity [62]. When bioactivity of sulforaphane and sulforaphane nitrile was studied using mouse and rats hepatoma cells, sulforaphane was found to be more bioactive to induce phase II enzymes than sulforaphane nitrile [63]. In one study, fresh broccoli florets or broccoli sprouts were used to examine the effects of heating on sulforaphane and sulforaphane nitrile formation. It was concluded that heating fresh broccoli florets and broccoli sprouts to 60 C decreased sulforaphane nitrile formation while increasing the sulforaphane formation. It was suggested that this was the effect of different thermal labilities of myrosinase and ESP. While myrosinase is respectively heat stable, ESP is not [64] Thiocyanate Formation Thiocyanates are also degradation products of glucosinolates. After breakdown of β- thioglucosidic bond, thiohydroxymate-o-sulfonate can be transformed into thiocyanates in presence of thiocyanate forming proteins (TFP). Thiocyanates are normally found in extracellular mammalian fluids such as saliva, nasal lining fluid, milk, tears and thought to be originated from diet [65]. For the formation of thiocyanates, two factors are suggested to be important; a myrosinase and TFP. The thiocyanate forming enzyme were identified and well studied [61, 66, 67]. Thiocyanate formation has only been reported from sinigrin, glucoerucin and glucotropaeolin hydrolysis [52]. There is no evidence for bacterial or aphid originated thiocyanate forming enzyme so far. Thiocyanates were suggested to be useful therapeutic agents as possesing antioxidant properties. It was found that they can protect cells against oxidizing agents like hypochlorous 14
33 acid [65]. However, thiocyanates are reported to inhibit the uptake of iodide by the thyroid [68] Other Products β-hydroxy ITCs are reported to be unstable and cyclising to oxazolidine-2-thiones that can cause goiter [8]. Indole glucosinolates produce unstable ITCs and undergo on further hydrolysis to form 3-indolemethanol, 3-indoleacetonitrile or 3,3`-diindolylmethane then give dimers, trimers or tetramers [2, 24]. The unstable ITC, 3-(thiocyanatomethyl)-1H indole, is thought to be the origin of 3-indolemethanol (Indole-3-carbinol) which go through solvolysis with water [53]. 1.3 THE IMPORTANCE OF GLUCOSINOLATES AND THEIR DEGRADATION PRODUCTS Chemopreventative effects of Glucosinolates and ITCs Diets that are rich in fruits and vegetables are reported to be associated with reduced risk of many cancer types in many studies. Cruciferous vegetables are becoming known for their health promoting effects against various cancers [50, 69-72]. Cancer is known as unrestricted division and proliferation of cells. It is a global burden on human health. According to the International Agency for Research on Cancer (IARC), there were 14.1 million new cancer cases and 8.2 million cancer deaths worldwide in By 2030, the cancer incidents worldwide are estimated to rise up to 22 million ( Cancer may be caused by internal conditions such as genetic mutations, hormones, immune conditions or external conditions such as tobacco, infectious organisms and unhealthy diet. The chemopreventation of cancers by bioactive compounds in the diet is one of the ways to combat cancer. Cancer mechanism is very complicated and many theories exist about its cause [73]. According to the mutation theory, it is not raised because of a single mutation. For instance, several hundred human genes were reported to drive the unrestricted cell division and growth process which results in pancreatic cancers [74]. Genetic or epigenetic factors induce cancer by changing pathways that control cell proliferation, apoptosis and differentiation. There are two types of enzymes which are effective on this process, phase I and phase II enzymes. Phase I enzymes primarily consist of cytochrome P450 enzymes and act as bioactivators for chemical carcinogens to induce carcinogenesis. Cytochrome P450 is a large 15
34 family of transferases and located in endoplasmic reticulum and mitochondria of the cells [75]. On the other hand, phase II enzymes such as quinone reductase-1, glutathione-stransferase (GST), thioredoxin reductase, UDP-glucuronosyltransferases and γ- glutamylcysteine synthetases act as protectors for cells/tissues against carcinogens [2, 76-78]. They may perform many reactions including glucuronidation, sulfation, methylation, acetylation, glutathione and amino acid conjugation. Generally, they do create conjugates more hydrophilic than the parental compounds. They can locate in different compartments of the cells for example UDP-glucuronosyltransferases are membrane bound proteins, whereas soluble GSTs are located mainly in cytoplasm but can be found in nucleus, mitochondria and peroxisomes as well [79]. ITCs derived from glucosinolates are able to modulate Phase I and Phase II enzymes, they can directly inhibit or down-regulate Phase I enzymes. They can reduce carcinogen activation by inhibiting P450 monooxygenases and activate nuclear factor (erythroid-derived 2)-like 2- Antioxidant Response Element (Nrf2-ARE) signalling pathway to induce the detoxifying enzymes (Phase II enzymes). Carcinogen detoxifying enzymes in human cells such as quinone reductase-1 (QR-1) are induced at transcriptional level and ARE were suggested to mediate the process [80]. ITCs were reported to activate caspase-3, -8, or -12 to increase apoptosis [80]. ITCs have the ability to induce cell cycle arrest and they are able to inhibit cell-proliferation and invasive metastasis [81]. It was reported that most of the ITCs are absorbed by passive diffusion by the cells [78, 82, 83] and intracellular concentrations can be up to times higher than extracellular concentrations [78]. 16
35 1.3.2 Protective Effects of Glucosinolates and ITCs against Diseases In addition to their chemopreventive effects against cancer, glucosinolates were studied for their protection of cardiovascular and central nervous system. Rat model study fed hypertensive stroke-prone rats with sulforaphane by gavage and concluded that sulforaphane rectified pathological abnormalities in spontenously hypertensive stroke-prone rats and significantly improved blood pressure [84]. Moreover, consumption of high glucoraphanin broccoli was associated with a reduction in plasma low density lipoprotein cholesterol (LDL-C) [85]. Similar to the cardiovascular system, sulforaphane was determined to have positive effects on the central nervous system. Administration of sulforaphane was found to decrease infarct ratio [86], brain edema [87, 88], cortical apoptosis [88]. These effects were mostly attributed to activation of Nrf2 and upregulation of its target genes [89]. ITCs have antioxidant, immunostimulatory, anti-inflammatory, antiviral and antibacterial properties [81]. ITCs have a electrophilic nature and may undergo reactions with N- O- or S- based nucleophiles. The N=C=S group of ITCs can show direct reaction with the cysteine sulfhydryl groups of glutathione [82] and proteins [90]. Different ITCs have been tested for their potential bioactivity so far. For instance, Benzyl ITC was suggested to have anticancer effects by inhibiting initiation, growth and metastasis of human cancers in mouse models. The targets of benzyl ITC in the inhibition of pancreatic tumour growth are overexpressed proteins such as protein kinase B (AKT), signal transducers and activators of transcription 3 and nuclear factor kappa B (NFκB) [78, 91]. Phenethyl ITC has been identified for its anticancer activity and function in cell-cycle arrest and apoptosis induction [78]. Sulforaphane, derived from glucoraphanin, is the best characterised ITC due to its cancer preventive and therapeutic properties [2, 76, 78, 92]. Sulforaphane shows its chemopreventative ability by inhibiting phase I enzymes and inducing phase II enzymes. Sulforaphane targets certain molecules like survivin and NFκB that are essential for cancer cell survival [93]. It was also reported that sulforaphane inhibits important proteins for breast cancer cells like estrogen receptor, epidermal growth factor receptor 1 (EGFR1) and human epidermal growth factor receptor 2 (HER2) [94] and a study showed that sulforaphane has efficacy against tumor growth and metastasis of breast cancer in vivo [95]. 17
36 Allyl ITC (3-isothiocyanato-1-propene or 2-propenyl ITC) was studied for its effects on health and was shown to have an inhibitory effect on bladder cancer development and progression in rats [96]. Erucin, an enzymatic hydrolysis product of glucoerucin, was suggested as a potential therapeutic agent against prostate cancer cells [97]. Erucin was investigated for its inducing capacity on heme oxygenase gene expression in vitro (in cultured cells) and in vivo (in mice). The study reported significant increase in mrna and protein levels of heme oxygenase when HT-29 cells were treated with erucin [98]. In addition to ITCs, glucosinolates were also studied for their health promoting effects. A study reported the potential neuroprotective role of glucoraphanin on Parkinson s disease using a mouse model. Two different sets of experiment were used, an acute (2 injections, 40 mg/kg1-methyl-4-phenyl-1, 2, 3, 6-tetrahydropyridine) and a sub-acute (5 injections, 20 mg/kg 1-methyl-4-phenyl-1, 2, 3, 6-tetrahydropyridine) model of Parkinson disease. The study revealed that glucoraphanin is able to reduce dopamine transporter degradation, tyrosine hydroxylase expression, interleukin-1-beta release, the triggering of neuronal apoptotic death pathway and the production of radical species; results focused on nitrotyrosine, Nrf2 and glial fibrillary acidic protein immunolocalization and concluded that glucoraphanin can protect neurons against neurotoxicity [99] Toxicity of Glucosinolates and Their Degradation Products Historically glucosinolates were studied for their toxicological effects. Many Brassica vegetables are used in animal feed and the main goal of studies was to remove glucosinolates from food and animal feed because of decreased palatability effect of glucosinolates [2]. Sinigrin and progoitrin are associated with the bitter taste. Especially degradation product of progoitrin, goitrin, is known as a very bitter product [100]. Goitrin can easily be nitrosated if it in contact with nitrites and form the mutagenic compound N-nitroso-oxazolidine [101]. Degradation products of glucosinolates were reported to be prone to disrupt iodine bioavailability resulting in goitrogenic effects [100, 102, 103]. Some of the ITCs such as allyl ITC, benzyl ITC and phenethyl ITC were reported to have genotoxic effects. These isothiocyanates have electrophilic reactivity and can form adducts with DNA. This can lead inducing gene mutations and chromosomal aberrations. It was also noted that the doses used in animal studies are several times higher than normal dietary 18
37 exposure doses. If there is a potential health risk about ITCs due to their genotoxicity, it should not be excluded. Therefore, further in vivo studies using the normal dietary exposure doses are needed to confirm and verify the in vitro findings [104]. 1.4 BIOAVAILABILITY OF GLUCOSINOLATES AND THEIR DEGRADATION PRODUCTS The bioavailability term consists of several sequential steps. It includes the availability for absorption, metabolism, tissue distribution, and bioactivity. The bioactivity measures the biologic activity of components on specific organs or tissues. The bioavailability and bioaccessibility terms can often be confused but the bioaccessibility term only refers to the proportion that is being available to be absorbed from intestinal tract. However, the bioavailability term includes transport of components to cells and bioactivity term as well [105] (See Table 1.3). It is not easy to determine the bioactivity so bioavailability term is usually used in a narrow sense. It is referred as the part that enters the blood stream from a consumed dose of a nutrient or the metabolites [105]. For instance, the importance of the mercapturic acid pathway in the metabolism of ITCs was reported and ITC mercapturic acids in urine were used as a biomarker to study ITC bioavailability [106, 107]. BIOAVAILABILITY BIOACCESSIBILTY BIOACTIVITY Events that take place during food Transport and assimilation by the digestion target tissue Absorption/assimilation through Interactions with biomolecules epithelial tissue Pre-systemic metabolism Post-absorptive metabolism or biotransformation Physiological response Table 1.3 Bioaccessibility and bioactivity steps. Adapted from [105]). Following this terminology, the glucosinolate content of the raw or processed cruciferous vegetables is the first step for bioavailability. Food processing has effects on glucosinolate content of the Brassica vegetables [108]. For instance, the effect of boiling, low pressure steaming and microwaving on total glucosinolate content was studied and it was reported 19
38 that low pressure steaming and microwaving was responsible for a lower glucosinolate loss than boiling [109]. Partially or complete inactivaction of enzymes involved in glucosinolate degradation by heating affect the final product formation. Myrosinase and ESP proteins were reported to show different thermal labilities. While mild heating (60-70 C) was enough to inactivate ESP, myrosinase activity can be retained and favour the ITC formation [64]. After food processing, mastication plays a key role in the breakdown of the plant cell wall and enables the myrosinase to come in contact with glucosinolates. It was also reported that differences in chewing might cause interindiviual differences in the bioavailability of ITCs [107]. No additional myrosinase activity was found in the saliva so degradation of glucosinolates depends on the myrosinase in the plant. During digestion, four main processes could happen; acidic hydrolysis of glucosinolates (1), unspecific binding to biomolecules (2) and hydrolysis by plant myrosinase (3) and microbial breakdown by gut bacteria (4) [24]. The glucosinolate content from rapeseed meal and some glucosinolate degradation products were investigated during in vitro incubation with pepsin-hci or with contents of porcine small intestine and caecum [110]. It was found that individual glucosinolates were differently affected from peptic and intestinal conditions. Under peptic conditions, the loss was between 3-23% and it was 7-28% under intestinal conditions [110]. The degradation of glucosinolates by the acidic environment in the stomach may favour nitrile formation over ITC formation. Maskell et al. (1994) failed to identify ITCs or goitrin in their samples. This phenomenon might have occured because of extensive ITC binding [110]. Non-specific binding of glucosinolates to dietary fibres was reported by Michaelson et al. (1994) [111]. The microbial breakdown of glucosinolates will be discussed in later section 1.9. Absorption of the glucosinolates and their hydrolysis products occur after completion of digestion. Intact glucosinolates were suggested to pass through gut epithelium without hydrolysis [112]. As intact glucosinolates are hydrophilic compounds with negative log P values, they are supposed to be absorbed by active transport or paracellular route (through tight junctions) [24]. However, Michaelsen et al. (1994) proposed that glucosinolates can pass cell membranes by forming ion pairs with lipophilic cations in the matrix [111]. Owing to a relatively lipophilic nature and low molecular weight, degradation products of glucosinolates have potential to be absorbed into cell mebranes by passive diffusion [24]. ITCs can rapidly form conjugates with cellular glutathione (GSH) and this conjugation is the diriving force of accumulation of ITC within the cells and passive diffusion [24]. The excretion of ITCs was 20
39 revealed to be closely related with the non-enzymatic ITC-GSH conjugation reaction rate and cellular GSH levels [113]. It was also found that glutathione-s-transferase promoted the conjugation reaction [113]. There is limited data about the absorption of other degradation products [24]. In a study, epithionitrile 1-Cyano-2,3-epithiopropane was rapidly taken up by experimental animals showing the peak values after 1 h [114]. Transport of glucosinolates or degradation products involves the transfer of compounds between the blood and the body tissues. Transport of these compounds might be affected by blood flow, membrane barriers, tissue affinity, ion trapping and plasma protein binding (albumin and glycoproteins) [24]. The same mechanism for intestinal absorption applies to the assimilation by the target tissue in general [24]. Following the absorption into the intestinal epithelium, ITCs were reported to pass into the systemic circulation and metabolised by the mercapturic acid pathway [106]. The liver and kidney are key organs in ITC post-absorptive metabolism where ITCs are conjugated with glutathione in the liver then with N-acetyl cysteine (NAC) in the kidney [115]. The distribution of ITC metabolites in tissues was studied by Briecker et al. (2014) using a mice model. The mice were fed with broccoli sprout powders or pure sulforaphane for a week then ITC metabolite profile in different tissues were determined. ITC metabolites accumulated in specific sites especially bladder followed by the liver and kidney. Lower concentrations were detected in plasma, skin and lung tissues, these concentrations were almost times less compared to their levels in the bladder. In addition, interconversion between sulforaphane and erucin was determined in vivo [115]. A study reported that complete inactivation of myrosinase in broccoli products resulted in 10% and 29% of sulforaphane and iberin recovery in the urine respectively which indicates the role of human gut microbiota in glucosinolate metabolism [116]. The interaction with biomolecules and physicological response were discussed in section 1.3. The metabolic fate of glucosinolates and ITCs in the human body is illustrated in Figure
40 Oral intake Gut Urine Figure 1.5 Expected metabolic fate of glucosinolates in the human body. Oral intake: During mastication, ITC formation can also occur. Gut: Glucosinolates are hydrolysed into ITCs then perform conjugation with glutathione and ITC-glutathione conjugate can pass through cell membrane. Urine: ITC is metabolised by the mercapturic acid pathway and excreted with the urine. Figure was adapted from [106]. 22
41 To maximize the health benefits of ITCs, bioavailability of glucosinolates and ITCs should be fully adressed. In this context, the human gut bacteria involved in glucosinolate metabolism and the enzymes responsiple for this metabolism in the gut have a key role. 1.5 MYROSINASES Myrosinase (β-thioglucoside hydrolase, EC ) is an enzyme responsible for hydrolysis of glucosinolates [117, 118]. Plants that contain glucosinolates have also myrosinase stored separately from their substrate glucosinolates [4-8]. The plant myrosinases belong to Glycosyl Hydrolase 1 (GH1) family. They are well studied and characterised [117, ]. The β-glucosidases (EC ) catalyses the breakdown of the glucosidic bond of a variety of saccharides and glucosides. They are classified into different Glycosyl Hydrolase families such as GH1, GH3, GH9 or GH30 based on amino acid sequence and structural similarity [122]. Mostly, there is a catalytic triad motif located at active sites of glucosidases. Two carboxylic residues act as acid/base and as nucleophile for double displacement at the anomeric center. Generally, O-β-glucosidases have an acid/base catalyst like glutamate at their active sites. However, plant myrosinases do not contain glutamate, instead they have a glutamine at this position. Once the glycosyl-myrosinase intermediate is formed, this glutamine residue enables placement of the water molecule at correct position, without deprotonation. This correct placement of water molecule is essential for hydrolysis of the glycosyl-myrosinase intermediate and production of breakdown products [123, 124]. This myrosinase catalysed step was found to be rate-limiting and ascorbate can work as a cofactor here. It can place the water molecule to the correct position for activation. The glucosinolate degradation in presence of ascorbate by Sinapis alba myrosinase (Figure 1.6) occurs in this way: First, the glucosinolate binds to the active site and forms myrosinase-glucosinolate complex but this complex has a short life. The bound glucosinolate can be cleaved by nucleophile Glu-409. After formation of the glucosyl-myrosinase intermediate, ascorbate binds to the active site and releases a proton from a water molecule then nucleophilic attack at the anomeric center takes place. Eventually, glucose and ascorbate are unbound from the active site [124]. Breakdown products can be D-glucose, hydrogen sulphate, H+, nitriles, thiocyanates, amines, epithionitriles and ITC depending on the substrate or the ph [24]. 23
![Figure 1.6 The overall structure of S. alba myrosinase. It exists as a dimer bound with a zinc atom. This image is taken from pdb database (1E4M) [124].](/docs-images/80/81600753/images/42-0.jpg "Myrosinases can be substrate specific for glucosinolates.")
42 Figure 1.6 The overall structure of S. alba myrosinase. It exists as a dimer bound with a zinc atom. This image is taken from pdb database (1E4M) [124]. Myrosinases can be substrate specific for glucosinolates. For instance, two myrosinase isoenzyme isolated by James and Rossiter (1991) showed different degradation rates on different glucosinolates [125]. The study showed that both enzymes used in the study are more specific for aliphatic glucosinolates rather than indole glucosinolates [125], while another study reported the existence of an myrosinase that was highly specific for epiprogoitrin [126]. The specificity of enzymes is also affected by other factors like epithiospecifier or myrosinase binding proteins [2]. Plant type, organ, stage of development, seasonal factors or climatic conditions are the factors causing variation in the myrosinase activity [2, 123]. Myrosinase activity is affected by food processing conditions. Several studies tested the effect of processing conditions on glucosinolate content, bioavailability and myrosinase activity potential of Brassica vegetables [109, 116, ]. Even if glucosinolates are reported to be heat-stable at mild temperatures [130], glucosinolate content might be affected by leaching to the medium during heating or enzymatic and thermal breakdown. In a study, the effect of boiling, low pressure steaming and microwaving on total glucosinolate content was investigated and it was reported that low pressure steaming and microwaving was responsible for a lower glucosinolate loss than boiling [109]. Oliviero et al. (2014) studied the potential bioavailability of sulforaphane and iberin and their conjugates in the urine after consumption of broccoli products. It was reported that complete inactivation of myrosinase 24
43 resulted in 10% and 29% of sulforaphane and iberin recovery in the urine respectively and this amount was the lowest recovery compared to other broccoli products with higher myrosinase activity. The study emphasises the importance of even a 20% residual myrosinase activity after food processing results in an ITC bioavailability as high as minimally processed broccoli with 100% myrosinase activity [116]. Myrosinases are not only found in plants. There is myrosinase-like activity from different sources like fungus [131], aphids [132] and gut bacteria [56, 112]. While plant and aphid myrosinases are well characterised [118, 124, ], gut bacterial myrosinases are not. The diets of aphids, butterflies, caterpillars and moths can include cruciferous vegetables [20] so they can also possess myrosinases and use myrosinase-glucosinolate system as a defence mechanim [132]. A study revealed that Brevicoryne brassicae (cabbage aphid) and Lipaphis erysimi (turnip aphid) can store glucosinolates separately from myrosinases which compartmentalized into crystalline microbodies [22]. The aphids were examined for myrosinase like activity and a non-plant myrosinase from cabbage aphid, Brevicoryne brassicae, was purified and characterised. It was the first non-plant myrosinase to be purified and not activated by ascorbate unlike the plant myrosinases [132]. Further study revealed that cabbage aphid myrosinase shows significant amino acid sequence identity to plant myrosinases (35% for Sinapis alba myrosinase) and enzymes from glycosyl hydrolase family [133]. Glutamic acid residues (Glu-167 and Glu 374) were reported to act as proton donor and nucleophile while lysine (Lys-173) and arginine (Arg-312) residues were proposed to have significant importance in the breakdown of glucosinolates by these aphids. The study concluded that according to sequence similarity and phylogenetic comparison, aphid myrosinases are more closely related to animal β-o-glucosidases [133]. In a further study with Brevicoryne brassicae myrosinase, the crystal structure of this enzyme was achieved. The general structure of this aphid myrosinase shows similarity to white mustard (Sinapis alba) myrosinase and plant β-o-glucosidases but plant β-o-glucosidases are not able to degrade glucosinolates [134]. Myrosinase activity in human gut bacteria is attributed to the β-glucosidases which have an specificity for glucosinolates [137]. A bacterial myrosinase from human gut has not been characterised in terms of gene identification. A study investigated the induced proteins of L. agilis R16 and E. coli VL8 from human gut in presence of sinigrin using 2D gel electrophoresis. They revealed that induced proteins were mostly part of carbohydrate metabolism, 25
44 oxidoreduction system and sugar transport, some have roles in purine metabolism, hydrolysis and proteolysis [138]. Recently, a bacterial myrosinase from soil was identified and partially characterised. This myrosinase was a periplasmic β-glucosidase with a signal peptide from Citrobacter WYE1 strain. It was found that it was activated by ascorbate like plant myrosinases [118]. 26
45 1.6 METHIONINE SULPHOXIDE REDUCTASES The enzymatic oxidation of methionine occurs in proteins and this oxidation was reported to impair the enzyme activity. [ ] (Figure 1.7). Free amino acids or aminoacid residues in the proteins are being oxidized by reactive oxygen species (ROS) like superoxide, hydrogen peroxide, hydroxyl radical or hypochlorite anion [142]. This oxidation was reported to be oxidized by NADPH-dependent flavin monooxygenase enzymes in rabbits and humans [141]. The enzyme peptide methionine sulphoxide reductases are responsible for the reduction of methionine sulphoxide (MetSO) proteins to methionine (Met) in many organisms including mammals [ ], flies [146], plants [147], yeast [148], bacteria [142, ]. Methionine sulphoxide reductase (Msr) enzymes can repair key proteins that will lead to maintance of the activity of other proteins and they enable the usage of these proteins as ROS quenchers [142]. While the oxidation of Met to MetSO is a reversible reaction, the oxidation of MetSO to methionine sulphone (MetSO 2)is not [152]. The catalytic mechanism for Msr activity consists of sulfenic intermediate formation followed by the release of the reduced methionine and reduction of Msr to its original form which is called recycling step (Figure 1.8)[153]. Various reducing agents can perform the recycling step but thioredoxin/thioredoxin reductase system is the physiological electron donor [154]. Figure 1.7 Structures of methionine and its oxidation products. Adapted from [152]. Msrs are divided in 3 main subclasses. First class, MsrAs are able to reduce free and proteinbased Met(S)SO (S-epimers of MetSO); the second class, MsrBs can reduce Met(R)SO (Repimers of MetSO) and the third class, free methionine sulphoxide reductases (fsmsr or 27
46 frmsr) are responsible for catalysis of the reduction of free Met(S)SO and Met(R)SO [139, 140, 153, 155]. MsrA was knocked out in many organisms to evaluate their roles in oxidative stress and it was found to increase the susceptibilty to oxidative stress in mice [144], yeast [148] and bacteria [140]. The overexpression of MsrA in Arabidopsis [147], Drosophila [156], Saccharomyces and human T cells [145] was performed and it resulted in a better resistance to oxidative stress. Figure 1.8 The action mechanism of Msrs (adapted from [153]). The action of Msrs initiates with the formation of Michaelis complex between Msr and MetSO (Step 1a). It proceeds by the nucleophilic attack of Cys-X on the sulphur atom of the sulphoxide group. This leads the release of reduced Met (Step 1b) and formation of a sulfenic acid intermediate. Then, nucleophilic attack of Cys-Y on the sulphur atom of sulfenic acid takes place resulting in release of a water molecule and formation of a Cys-X/Cys-Y disulphide bond. Later, reduction of Msr to its original form is performed by reduced thioredoxin. For E. coli MsrA, Cys-X is Cys 51 and Cys-Y is Cys 198. Thioredoxin and thioredoxin reductase were reported to have role in reduction of methionine sulphoxide by transferring electrons from NADPH to Msr [141]. MsrA was discovered first in E. coli in 1980s [157] and there are many examples of crystallised structures from E. coli [158] (Figure 1.9), Mycobacterium tuberculosis [159], Populus trichocarpa (poplar) [160] and of bovine MsrA in the literature [161]. Later, MsrB of Neisseria gnorroae was cyrstallised in 2002 [151]. The free methionine sulphoxide reductases (fmsr) are reported to be missing in multicellular organisms like plants, mammals [155]. A different version of the Msr was identified in Neiseria gnorrhoeae. This enzyme is a fused form of MsrA and MsrB and called as MsrA/MsrB [151]. In addition to these Msr classes, the presence of membrane associated Msr for R and S epimers of MetSO was also reported [162]. 28
![Figure 1.9 The structure of methionine sulfoxide reductase from E. coli. This image is taken from pdb database (1FF3) [158]. Bacteria might have different copy number of MsrA and MsrB.](/docs-images/80/81600753/images/47-0.jpg "While Staphylococccus has 3 copies of MsrA and one MsrB, Escherichia coli has one copy for each [154].")
47 Figure 1.9 The structure of methionine sulfoxide reductase from E. coli. This image is taken from pdb database (1FF3) [158]. Bacteria might have different copy number of MsrA and MsrB. While Staphylococccus has 3 copies of MsrA and one MsrB, Escherichia coli has one copy for each [154]. Even though Msr is mainly known due to its potential role in repair system of proteins, it has been shown that it can be active towards wide variety of compounds with methyl sulphoxide groups [163]. Sulindac is an anti-inflammatory drug and was reported to be reduced by MsrA. The study also reported that MsrB was not efficient at reducing methyl sulphoxide of sulindac even if its amount was 200 times higher than MsrA [164]. Both MsrA and the membrane associated Msr (mem-r, S-Msr) are able to reduce sulindac [164]. MsrA was suggested to be responsible for reduction of methylsulfinylalkyl glucosinolates such as glucoraphanin into methylthioalkyl glucosinolates such as glucoerucin [55] (Figure 1.10). This reduction is an important step to fully understand the glucosinolate metabolism by gut bacteria. In one study [165], the glucosinolate bioconversion by human gut microbiota in a batch fermentation model using glucosinolates and faecal inoculum from a healthy volunteer was studied and conversion of glucoraphanin to glucoerucin did not occur with heat sterilized samples [165]. This suggested that this reduction might be enzymatically driven. Methionine sulphoxide reductases serve key roles for organisms by reduction of methionine sulphoxide but their role in glucosinolates metabolism is yet to be identified. In addition to reduction of glucosinolates, Msr might have role in reduction of ITCs such as reduction of sulforaphane to erucin. The interconversion between sulforaphane and erucin was reported in vivo previously but the detailed mechanism are not known [115]. 29
. 1.7 GUT MICROBIOTA The human gastrointestinal (GI) tract (Figure 1.")
![11) is a complex ecosystem and hosts a wide variety of microorganims which have important roles and various influences on the GI tract and host health [166, 167] (Figure 1.9).](/docs-images/80/81600753/images/48-1.jpg "Although the microbiota makes up a relatively small amount of the human body composition, it is suggested that human gut microbiota has 100 times more gene capacity than the host")
48 Glucoraphanin MYROSINASE Sulforaphane MSR? MSR? Glucorerucin MYROSINASE Erucin Figure 1.10 Proposed action mechanism of Msr enzymes on methylsulfinyl glucosinolates (adapted from[137]). 1.7 GUT MICROBIOTA The human gastrointestinal (GI) tract (Figure 1.11) is a complex ecosystem and hosts a wide variety of microorganims which have important roles and various influences on the GI tract and host health [166, 167] (Figure 1.9). Although the microbiota makes up a relatively small amount of the human body composition, it is suggested that human gut microbiota has 100 times more gene capacity than the host [168]. Figure 1.11 Illustration of the effect of human gut microbiota on human health and disease (adapted from [166, 167]). 30
49 The microbial content of GI tract can be variable and the microbiota plays an important role for host nutritional, physiological, immunological functions like food digestion, vitamin production, and disease pathogenesis [167]. The human intestinal system was initially thought to harbour different species of bacteria but it has estimated recently to have more than 1200 different bacterial species [169]. This bacterial species refers to nearly 99% of microbes in the human gut, the rest (1%) consists of archaea, viruses and prokaryotes [169]. Only a small portion of this microbiota can be culturable but recent advances in cultureindependent high-throughput sequencing has made it possible to identify more microbes in human gut [168, 170]. In addition, new methods combining sequencing and bacterial culturing approach are being developed and promising to culture and identify the substantial proportion of the gut microbiota [171]. The most dominant microbiota in human gut are from the phylum, Firmicutes and Bacteroidetes, they make up the >98% of all 16S rrna sequences [172]. Proteobacteria, Actinobacteria, Verrucobacteria and Fusobacteria are also other abundant members of human gut microbiota [167, 172]. The diversity of microbiota in the infant gut is initially low and colonisation starts with aerotolerant species but then aerobes are replaced by anaerobes as typical microbiota of the adult gut [170]. By 2.5 years of age, the gut microbiota of an individual are established fully and once it has established, it remains constant until old age [170, 173]. Early colonised bacteria can modulate gene expression of host epithelial cells to provide a suitable habitat for themselves. Therefore the initial colonisation is quite important and influences the final composition of the adult gut microbiota [166]. Generally, microbiota composition remains stable but under certain conditions, it can show fluctuations. For instance, acute diarrhoeal diseases, diet, dysfunction of immune system or antibiotic intake and age can modulate the gut microbiota composition [166, 167]. Changes in diet have significant effect on the composition of gut microbiota [174]. A study about the effect of diet on the gut microbiota using humanized gnotobiotic mouse models showed that when mice diets are switched to a high in fat and sugar and low plant polysaccharide diet from a low in fat and rich in plant polysaccharide diet, there are differences in gut microbiota composition of mice just after 1 day [175]. Li et al. (2009) studied the effect of diet rich in cruciferous vegetables on fecal bacteria composition with a randomized, crossover, controlled feeding study and they concluded that human gut bacteria was altered by the cruciferous vegetables in the diet [176]. It was found that there was a 31
50 significant difference in gut bacterial composition of participants when they consumed a high cruciferous vegetable diet compared to consumption of a low-phytochemical, low-fiber diet. Specific bacteria such as Eubacterium hallii, Phascolarctobacterium faecium, Alistipesputredinis, and Eggerthella spp. were suggested to be linked to cruciferous vegetable intake. It was also reported that the response in the gut to cruciferous vegetables was individual-specific and there was no direct link between the response and amount of cruciferous vegetables taken [176]. One of the main factors that can modulate gut microbiota composition is antibiotic intake [170]. Antibiotic overuse can result in an increase in antibiotic-resistant pathogens. The antibiotic intake reshapes the gut microbiota and the effect of intake can cause long-term decrease in bacterial diversity [170]. The composition of the gut microbiota is quite variable between individuals depending on several factors such as host genetics [177, 178], diet [174, 175, 179] and environmental factors [169, 177]. The host genetics show significant effect on murine gut microbiota [177, 178]. A study investigating the gut microbiota of human infants from birth throughout the first year of their life using a microarray based analysis, found that the composition and temporal patterns of the intestinal microbiota were more similar in a pair of dizygotic twins than 12 unrelated infants [180]. Turnbaugh et al. (2009) investigated the effect of host genotype and adiposity on gut microbial communities of female monozygotic and dizygotic twins and their mothers. It was concluded that there were specific bacterial lineages for each individual and a comparable degree of co-variation between monozygotic and dizygotic twins [181]. Benson et. al (2010) [177] defined a core measurable microbiota of 64 conserved taxonomic groups found in across most animals in studied population showing variation quantitatively. The core measurable microbiota was tested with 530 fully informative singlenucleotide polymorphism (SNP) markers and 18 host quantitative trait loci (QTL) that have genome-wide linkage with microbial taxa were identified [177]. These QTLs were reported to affect the gut microbiota in different ways. Some loci have the control of individual microbial species or groups of related taxa and some loci are believed to have pleiotropic effects on groups of distantly related organisms [177]. The gut microbiota has a barrier effect against pathogens, and plays a crucial role in host homeostasis, vitamin synthesis and absorption of calcium, magnesium and iron [166]. It keeps homeostasis of the immune system by controlling epithelial cell proliferation and 32
51 differentiation. Ligation of toll-like receptors on intestinal epithelial cells by bacterial products induces epithelial cell proliferation and expression of antimicrobial peptides. The intestinal microbiota provides epithelial cell homeostatis and a repair system in the intestine [182]. The gut epithelium and immune system provide protection of the host against pathogens, but the intestinal microbiota also has a crucial role in the inhibition of the pathogens in the gut environment [166]. This protective effect has been called several names including bacterial antagonism, bacterial interference, barrier effect, colonisation resistance and competitive exclusion (CE) [183]. CE can be achieved through many mechanisms that are mostly bacteriostatic. Firstly, CE can be performed by creating a microecology which is hostile to pathogens, for example by production of volatile fatty acids. Secondly, CE can occur via competition between pathogens and native microbiota for limiting nutrients [184]. The third mechanism of CE is production of antibacterial substances such as bacteriocins and hydrogen peroxide [ ]. Dysbiosis, a microbial imbalance of the gut, can be associated with several severe diseases like autoimmune and allergic diseases, obesity, iflammatory bowel diseases (IBD) or diabetes [167, 170]. Many studies have focused on search for the link between the gut bacteria and obesity [181] and diseases such as Crohn`s disease [187, 188], ulcerative colitis (UC) [188, 189] and colon cancer [190]. Obesity is associated with reduced bacterial diversity [181]. In a mouse model, obesity was observed to cause a decrease in Bacteroidetes and increase in Firmicutes [191]. The decrease in Bacteroidetes in gut was confirmed with a study on human twins but increase in Firmicutes was shifted to increase in Actinobacterium [181]. Dysbiosis is thought to be involved in the pathogenesis of IBD [192], the patients with IBD are reported to have more bacteria, from a varied genera, attached to their epithelial surfaces than healthy people [166]. The genera in gut such as Lactobacillus and Bifidobacteria showed prevention against tumorigenesis whereas Bacteroides and Clostridium can increase the incidence [166]. In a human study, the presence of two Bacteroides species, Bacteriodes vulgatus and Bacteroides stercoris were associated with high risk of colon cancer and Lactobacillus SO6, Eubacterium aerofaciens or total Lactobacillus concentration were associated with low risk of colon cancer [193]. Many techniques are used to study the human gut microbiota. Firstly, taxonomic profiling is used to identify the microbial community and determine the microbial content of that community. Second, metagenomics is used to provide data about abundance of genes and 33
52 gene transcripts. Third, the use of animal models provides us information about the effect of these genes on organisms and their functions [194]. Some of the techniques are listed below. They have both advantages and disadvantages. In the design of a study to assess the gut microbiota, cost and depth are key elements to select the method for taxonomic profiling. Sometimes, combination of a few techniques listed here is another way to study the human gut microbiota. Culture techniques: Based on isolation of bacteria on selective media. It is fairly cheap but labour intensive. It gives a limited information about diversity because only a small portion of the gut microbiota have been cultured so far [195]. However, gut microbiota are not necessarily unculturable, a recent study using a combined metagenomic sequencing and bacterial culturing approach suggested that a substantial proportion of the intestinal bacteria is culturable [195]. Quantitative PCR (qpcr): Based on amplification and quantification of 16S rrna. The techniques is similar to PCR but uses a compound that fluoresces when it binds to PCR product. It is a fast method and provides phylogenetic discrimination. However, PCR bias is possible and it is unable to identify novel species [195]. DNA Fingerprinting Techniques: Denaturing Gradient Gel Electrophoresis (DGGE) and Temperature Gradient Gel Electrophoresis (TGGE) were very popular inititally but they are now replaced by the sequencing methods. The 16S rrna amplicons is separated by denaturant/temperature. The gels used can be excised and used in further analysis. It is a fast, semi-quantitative method but lacks phylogenetic identification. PCR bias may also be problem. These methods were mainly used for comparative analysis such as comparing the healthy state to a disease state [195]. Terminal restriction fragment length polymorphism (T-RFLP): Based on fragmentation of the 16S rdna gene amplicons by restriction endonucleases with band visualization. It is fast, cheap and semi-quantitative but lacks phylogenetic identification. PCR bias may again be a problem. T-RFLP has been microbiota [195]. used to determine microbial community diversity in the gut Fluorescence in situ hybridisation (FISH): Based on hybridisation of fluorescently labelled oligonucleotide probes to target 16S rrna sequences. It is a fast, semi-quantitative method 34
53 and provides phylogenetic identification. However, it lacks identification of unknown species [195]. DNA microarrays: Based on hybridisation of fluorescently labelled oligonucleotide probes to complementary nucleotide sequences. It is a fast, semi-quantitative method and provides phylogenetic identification. However there is a risk for cross-hybridisation (hybridisation of multiple probes to single targets). In addition, the detection of species which is at low levels in the gut microbiota can be missed out. DNA microarrays mainly used for comparison of the microbiota between different populations [195]. Sequencing of cloned 16S rrna gene amplicons: Based on cloning of full-length 16S rrna amplicon using the Sanger sequencing. It is good for quantification and phylogenetic identification of gut microbiota and enables the analysis of uncultured bacteria. It is laborious and expensive [195]. Direct Sequencing of 16S rrna amplicons: Described as massive parallel sequencing of partial 16S rrna gene amplicons. It may use beads (454 Pyrosequencing ), slides (Illumina ) and solid surfaces (SOLiD TM ). It is a quantitative method and provides phylogenetic identification with the chance of identification of unknown bacteria. However, it is labour intensive and expensive [195]. Microbiome Shotgun Sequencing: Based on massive parallel sequencing of the whole community DNA. It is a quantitative method, enables the phylogenetic identification. While other techniques analyse only genetic diversity, microbiome shotgun sequencing is based on both the genetic diversity and functions of the gut microbiota. It is an expensive method and needs an intense computational analysis of the data [195]. Animal models (in vivo): Based on rat, mouse, pig or zebrafish models. For instance, gnotobiotic rats can be used to study the link of one bacterial species or a group to a putative function or diversity of the gut microbiota but these models lack the full microbial community context [196]. In vitro colon models: These models are designed to mimic microbial processes throughout the gastrointestinal tract but they typically lack human cells. They are cheaper and offer an alternative to in vivo models for hypothesis testing [196]. 35
54 1.8 THE ROLE OF GUT MICROBIOTA IN BIOTRANSFORMATION OF DIETARY COMPOUNDS As diet can shape the human gut bacteria composition diversity and abundance [197, 198], the human gut bacteria also affects and directs the biosynthesis and metabolism of many compounds [176]. One of the main metabolic functions of the gut microbiota is fermentation of non-digestable dietary residues (such as non-digestable carbohydrates) and endogenous mucus [166, 199]. The microbial community of the gut provides a broad range of enzymes to the host which are different from its own resources. The main source of energy in the gut is the fermentation of carbohydrates. These carbohydrates include large polysaccharides, resistant starch, cellulose, hemicellulose, pectins and gums [166]. Short-chain fatty acids (SCFA) like acetate, propionate and butyrate are end products of fermentation by some members of the gut microbiota [199]. These fatty acids have crucial role in host physiology. For instance, butyrate is the major energy source of colonocytes [199]. Propionate [200] and acetate [166] are utilised by liver. These two fatty acids act as modulator in glucose metabolism so the intake of propionate and acetate are related with lower glycaemic responses [166]. A study showed that butyrate and propionate provides protection against high-fat diet induced weight gain and glucose intolerance and stimulate gut hormone secretion predominantly [200]. Some studies also suggest that gut bacteria are able to metabolise polyphenolic compounds in gut. This might result in with the formation of more biologically active compounds than the parent compounds [201]. For instance, certain health promoting gut bacterial species belonging to the genera Bifidobacterium and Lactobacillus are involved in phenolic acid metabolism in the gut [202] and five Bifidobacteria species are related with hydrolysis of soymilk isoflavones [203]. A study showed that Eubacteruim limosum, a strict anaerobe from the human intestinal tract, is able to metabolise some isoflavonoids [204]. An anaerobic bacterium strain isolated from mouse intestine was reported to be involved in the conversion of soy isoflavones [205]. Lignan metabolism is also performed by human gut bacteria. Plant lignans were reported to be metabolised by intestinal microbiota and β-glucosidases in the mucosal brush border were suggested to be responsible for this metabolism [206]. It was reported that 7-79% of hop derived isoxanthohumol was degraded to 8-prenylnaringenin after 72 h when fecal samples from female volunteers were used in a colon model [207]. A ten fold difference in 8-prenylnaringenin production was estimated between individuals 36
55 consuming beer moderately. Similarly, inter-individual differences in degradation of naringenin was reported [40]. In addition to other benefits of human gut bacteria, they are also involved in biotransformation of glucosinolates into their bioactive derivatives, ITCs. 1.9 GLUCOSINOLATE METABOLISM BY GUT BACTERIA During cooking, plant myrosinases can be heat inactivated so biotransformation of glucosinolates becomes dependent on human gut bacteria. Many studies have reported bacteria with ability to metabolise glucosinolates. These studies are summarized in Table 1.4. In addition, some of the human gut bacterial strains including Lactobacillus agilis R16, Enterococcus casseliflavus CP1, Escherichia coli VL8 [56, 57] and Bacteroides thetaiotaomicron [112] were reported to show glucosinolate degrading ability. Bacteria/faecal microbiota Study Method Reference Enterobacter cloacae in vitro incubation in media [208] Bacillus, Pseudomonas and Lactobacillus species in vitro incubation in media [209] Lactobacillus agilis R16 in vitro incubation in media [210] Bacteroides thetaiotaomicron Rat model [112] Human feacal microflora in vitro incubation in media [211] Human feacal microflora in vitro large-intestinal model [212] Human feacal microflora Gnotobiotic rat model [213] Bifidobacterium species in vitro incubation in media [214] Rat cecal microbiota Rat model [215] Human feacal microflora in vivo and in vitro incubation in media [216] Lactic acid bacteria and Staphylococcus cornosus UM 123M in vitro incubation in media [217] Table 1.4 Studies reporting bacteria which have glucosinolate metabolising ability. 37
56 Bacteria/faecal microbiota Study Method Reference Escherichia coli O157:H7 Staphylococcus carnosus Staphylococcus auerus Pediococcus pentosaceus Salmonella typhimurium Listeria monocytogenes Enterococcus feacalis Pseudomonas fluorescens in vitro incubation in media [218] Human feacal microflora a batch fermentation model [165] Lactococcus lactis subsp lactis KF147 Lactobacillus plantarum KW30 Escherichia coli Nissle 1917 Enterobacter cloacae ATCC13047 Listeria monocytogenes and Salmonella Enterococcus casseliflavus CP1 Escherichia coli VL8 Table 1.4-Continued in vitro incubation in media [55] in vitro incubation in media [219] in vitro incubation in media [56] A previous study investigated the sinigrin degrading activity of 42 lactobacilli and a strain called Lactobacillus agilis R16 showed the highest sinigrin transformation. The study showed this activity with sinigrin can be induced by the presence of the substrate sinigrin itself in culturing media. When L. agilis R16 was grown in media with sinigrin and glucose, the glucose was used immediately then sinigrin degradation started and resulted in 80% reduction of sinigrin in 4 h and total reduction in 24 h. Analysis of sinigrin degradation products showed the production of allyl ITC (AITC) and lactic acid [210]. The study also showed that cell-free extracts lack sinigrin degrading activity. This indicates that a cell-associated activity is involved. This phenomenon was further supported by another study by Luang-In et al. (2014) [56]. 38
57 Bacteroides thetaiotaomicron, a human gut isolate, was studied for its ability to degrade sinigrin in a gnotobiotic rat model [112]. An oral dose of 50 µmol sinigrin was given to gnotobiotic rats harbouring B. thetaiotaomicron. Sinigrin was metabolised in the large bowel that host high level of B. thetaiotaomicron. By GC-MS analysis, allyl ITC, hydrolysis product of sinigrin, was detected in the digestive contents [112]. NMR spectroscopy was used to study the biotransformation of two dietary glucosinolates, sinigrin and glucotropaeolin by the human digestive microflora in vitro. It was shown that sinigrin and glucotropaeolin were transformed into allylamine and benzylamine, respectively and there was a low ITC formation (10-20% of the initial glucosinolate amount). Whether these amines are produced in vivo from dietary glucosinolates or not remains to be established. The effect of glucose in transformation of glucosinolates was also examined and the study showed that the presence of glucose did not modify the nature of the metabolites or the rate of transformation [211]. The dynamic in vitro large intestinal model was used to study the AITC production from sinigrin by human gut microbiota [212]. Sinigrin and AITC concentrations were determined in the lumen and dialysis fluid of the model using two different concentrations (1 mm and 15 mm) of sinigrin. AITC formation was observed and the percentage conversion of sinigrin to AITC was 1% and 4% in the lumen, respectively. The control experiment with inactivated microflora did not result in AITC formation. The concentration of AITC peaked between 9 and 12 h after addition of sinigrin. The study also suggested that different individual human microbiota result in significantly different conversion rate of sinigrin to AITC ( % of sinigrin) [212]. The role of plant myrosinase and gut bacterial myrosinase on transformation of glucosinolates to ITCs were studied in a gnotobiotic rat model [213]. Glucosinolate biotransformation in gnotobiotic rats with a whole human fecal microbiota (Flora +) was compared to germ-free rats (Flora-). Active (Myro+) or inactive myrosinase (Myro-) were added to rat diet to determine the effect of plant myrosinase. The excretion of ITCs as mercapturic acid derivatives in urine was determined. The results indicated that highest excretion was performed by germ-free rats having active myrosinase in their diet (Flora-, Myro+ treatment) and a lower excretion was seen in rats with human flora when fed with inactive myrosinase (Flora+, Myro- treatment). The study suggested that the human microbiota can reduce the available ITC for intestinal absorption and this can be caused by 39
58 further metabolism of ITCs in the digestive tract. This study concluded that plant myrosinase and human gut microbiota both contributed to the degradion of glucosinolates into ITCs in vivo [213]. Cheng et al. studied B. pseudocatenulatum, B. adolescentis and B. longum for their ability to utilise sinigrin and glucotropaelin in vitro [214]. It was found that bacteria used in the study were hardly able to grow in basal medium without glucose in presence of 2.3% sinigrin but these bacterial strains used sinigrin as a glucose source. The study concluded that Bifidobacterium strains are able to utilize both sinigrin and glucotropaelin. However, GC-MS analysis results showed that the main products were 3-butene-nitrile. Phenylacetonitrile and AITC or benzyl isothicyanate (BITC) were hardly detectable. This result might be caused by rapid degradation of ITCs or transformation into non-volatile derivates [214]. The study examining the ex vivo degradation of glucoraphanin by rat cecal microbiota produced evidence for glucoraphanin hydrolysis to sulforaphane and its absorption across the cecal walls of rats [215]. Glucoraphanin (150 µmol/kg BW) was directly introduced into the cecum and ITC was detected in the mesenteric plasma by 120 min and plasma levels were stably maintained for an hour [215]. A study tested if individual differences in the human gut microbiota can result in different levels of glucosinolate metabolism. Twenty-three healthy individuals were fed with cooked broccoli and ITC levels in urine samples were measured. The highest and lowest 5 ITC excreters were selected for feacal sample collection. T-RFLP analysis of 16S rrna gene revealed that there was no significant differences between high or low excreters' microbiota composition. However, high ITC excreters were able to degrade more glucoraphanin than low excreters. The study could not find a direct link between glucosinolate metabolism and specific bacterial species. It was suggested that this might be caused the complexity and functional redundancy of the gut microbiota [216]. Saha et al. (2012) studied the glucosinolate bioconversion by the human gut microbiota in a batch fermentation model using glucosinolates and fecal inoculum from a healthy volunteer. Glucoraphanin decreased after 4 h of incubation and mostly degraded after 24 h incubation. Glucoerucin was first detected at 8 h and further increased after 24 h. The study concluded that glucoraphanin was transformed into glucoerucin and erucin nitrile by the gut microbiota [165]. 40
59 Luang-In et al. (2014) investigated the metabolism of glucoerucin, glucoiberin and glucoraphanin by gut bacterial strains in vitro. Lactobacillus agilis R16, Enterococcus casseliflavus CP1 and Escherichia coli VL8 were tested for the metabolism of glucosinolates supplied to their media. All three bacteria were able to degrade glucoerucin to erucin and erucin nitrile by 16 h. E. coli VL8 showed degradation of glucoiberin and glucoraphanin. The metabolism of glucoraphanin and glucoiberin by E. coli VL8 also resulted in erucin, erucin nitrile and iberverin, iberverin nitrile production respectively. A potential reductase enzyme has been proposed to be responsible for this bioconversion and the enzyme was reported to require both Mg 2+ and NAD(P)H as cofactors. E. casseliflavus CP1 could consume 41 ± 7% of glucoiberin and 53 ± 8% of glucoraphanin and resulted in the formation of iberin and sulforaphane in low concentrations over a 24 h anaerobic fermentation. However, L. agilis R16 degraded only 11 ± 1% of glucoiberin and 10 ± 2% of glucoraphanin without giving any detectable products [56]. Following this study, desulfoglucosinolates were used to test their degradation by L. agilis R16, E. casseliflavus CP1 and E. coli VL8. All three metabolised desulfo-glucosinolates and gave pure nitriles products excluding L. agilis R16 which failed to produce phenethyl nitrile from gluconasturtiin [57]. Rats were found to be capable of metabolising glucosinolates in rapeseed meal after the myrosinase in the meal was inactivated [220]. This study was followed by more research and axenic rat and chickens were tested for glucosinolate metabolism in their guts. However, these studies did not result in identifying a responsible bacterial strain for this metabolism. In brief, all these studies showed that several different phylogenetic families are involved in glucosinolate metabolism. It has not been possible to attribute glucosinolate degrading ability to only a specific group of bacteria so far SCOPE OF THE THESIS As cancer is a very dreadful disease that is on the increase. It is important to take every single measure to fight with this cancer. The chemopreventation against cancer by bioactive compounds in the diet is one of the ways to combat the cancer. ITCs are very promising compounds for chemopreventation so it is essential to determine the glucosinolate metabolism and the effects of degradation products on human health. A better understanding of glucosinolate metabolism by human gut bacteria and identification of the 41
60 key enzymes in the metabolism are needed. So far, various bacteria from human gut have been reported to have glucosinolate degrading and ITC producing ability and their myrosinase activity was characterised. However, we lack the information about the enzymes responsible for glucosinolates metabolism in the human gut. In order to investigate these enzymes: 1. A glucoraphanin enrichment method will be used to isolate various bacteria possessing glucosinolates degrading ability from the human gut. Genomes of the isolated bacteria will be sequenced, annotated and assembled for interrogation in search for candidate myrosinase enzymes. 2. Selected candidate myrosinase genes from the bacteria will be cloned and expressed in E. coli. Enzyme activity of recombinant proteins will be examined and characterised in detail. 3. In addition to myrosinases, reductases which are proposed to play a key role in glucosinolates metabolism will be investigated. Different putative reductase genes from the genomes of human gut bacteria will be cloned and expressed in E. coli. The reductase activity of the recombinant reductases will be assessed. 4. Finally, a bacterial myrosinase of soil origin will be cloned and expressed in E. coli to achieve enzyme activity characterisation. 42
61 CHAPTER TWO 2 GENERAL MATERIALS AND METHODS 43
62 2.1 MICROBIOLOGY METHODS All chemicals were purchased from Sigma Aldrich (Dorset, UK) unless stated otherwise Culture Media All media used in the study are given below with their compositions. Chemostat Media: 2 g peptone water (Oxoid), 2 g yeast extract (Oxoid), 0.1 g NaCI, 0.04 g K 2HPO 4, 0.04 g KH 2PO 4, 0.01 g MgSO 4.7H 2O, 0.01 g CaCI 2.2H 20, 2 g NaHCO 3, 2 ml Tween 80, 10 µl Vitamin K1, 0.5 g cysteine. HCI, 0.5 g bile salts (Oxoid), 0.02 g Hemin in 1 liter of water adjusted to ph 8.6 with 1 M NaOH. M9 Minimal Media (without glucose): 6 g Na 2HPO 4, 3 g KH 2PO 4, 0.5 g NaCI, 1 g NH 4CI, g CaCI 2, 2.47 g MgSO 4, 1.5 ml of 10 mg/ml threonine stock, 11 ml of 10 mg/ml leucine stock, 0.23 g proline, 0.13 g arginine, 6.5 ml of 10 mg/ml histidine stock, 1.7 ml of 10 mg/ml thiamine stock in 1 liter of water. Rogosa Agar: 10 g tryptone (Oxoid), 5 g yeast extract (Oxoid), 20 g glucose, 1 ml Tween 80, 6.0 g KH 2PO 4, 2.0 g ammonium citrate, 17.0 g anhydrous NaOAc, g MgSO 4, 0.12 g MnSO 4, g FeSO 4, 20 g agar (Oxoid) in 1 liter of water, ph was adjusted to 5.4 with glacial acetic acid. Beerens Agar: 39 g Colombia agar base (Oxoid), 5 g glucose, 0.5 g cysteine. HCI, 5 g agar (Oxoid), 5ml propionic acid in 1 liter of water, ph was adjusted 5 with 1 M NaOH. Wilkins Chalgren Media (without glucose): 10 g tryptone (Oxoid), 10 g peptone (Oxoid), 5 g yeast extract (Oxoid), 5 g NaCI, 10 g agar (Oxoid) 1 g L-Arginine, 1 g sodium pyruvate, g Hemin, g Vitamin K in 1 liter of water (ph 6.5 ± 0.2). Solid media contains 10 g agar (Oxoid). Bacteriodes Agar: 13 g agar, 10 g casein peptone, 1 g glucose, 10 g meat peptone (Oxoid), 5 g NaCI, 2 g yeast extract (BD), 10 ml of 0.5 mg/ml Hemin solution, 3 ml of 25 mg/ml Kanamycin, 7.5 ml of 1 mg/ml Vancomycin, 50 ml laked horse blood (Oxoid) in 1 liter of water (ph: 7.0 ± 0.2) Clostridia Agar: 10 g tryptone (Oxoid), 10 g peptone (Oxoid), 5 g yeast extract (Oxoid), 5 g NaCI, 10 g agar (Oxoid), 1 g L-Arginine, 1 g sodium pyruvate, g Hemin, g Vitamin K, 8 ml of 1 mg/ml Novobiocin solution, 8 ml of 1 mg/ml Colistin solution in 1 liter of water (ph 6.8 ± 0.2). 44
63 BHI Media: 12.5 g brain heart infusion solids (Oxoid), 5.0 g beef heart infusion solids, 10.0 g proteose peptone (Oxoid), 2.0 g glucose, 5.0 g NaCI, 2.5 g Na 2HPO 4 in 1 liter of water (ph 7.4 ± 0.2). MRS Media (without glucose): 8 g Lab Lemco (Oxoid), 10 g peptone (Oxoid), 5 g Difco yeast extract (BD), 5 g NaOAc.3H 2O, 2 g K 2HPO 4, 2 g triammonium citrate, 1 ml Tween 20, 5 ml of 11.5% MgSO 4.7H 20 solution, 5 ml of 2.8% MnSO 4.4H 2O solution in 1 liter of water (ph 6.5 ± 0.2). Solid media contains 20 g agar (Oxoid). Nutrient Broth (without glucose): 5 g peptone (Oxoid), 1.5 g Lab Lemco (Oxoid), 1.5 g yeast extract (Oxoid), 5 g NaCI in 1 liter of water (ph 6.8 ± 0.2). L Broth: 10 g Difco Bacto tryptone (BD), 5 g Difco Bacto yeast extract (BD), 10 g NaCI, 1 g glucose in 1 liter water (ph 7.0 ± 0.2). SOC Broth: 20 g Difco Bacto tryptone (BD), 5 g Difco Bacto yeast extract (BD), 0.5 g NaCI in 1 liter of water Preparation of Antibiotic Stock Solutions The antibiotic stock solutions were prepared according to laboratory cloning manual [221] then sterilised by filtration using 0.22 µm filters. The aliquots were stored at -20 C until usage. The stocks were listed below in Table 2.1. Antibiotic Concentration of the stocks Final concentration Ampicillin 50 mg/ml in H 2O 100 µg/ml Kanamycin 10 mg/ml in H 2O 30 µg/ml Table 2.1 Antibiotic stock solutions used in this study Isolation of Glucosinolate Degrading Bacteria by Glucoraphanin Enrichment A faecal sample from a healthy volunteer (5 g) was homogenized in 45 ml of phosphate buffered saline (PBS) with a stomacher (Stomacher 400 Circulator, Seward) at 230 rpm for 2 min. The homogenate (100 µl) was used to inoculate the chemostat media or M9 minimal media both containing 8 mm glucoraphanin (900 µl) and these cultures were grown in an anaerobic cabinet (Whitley A95 anaerobic work station, Don Whitley Scientific) under an atmosphere of 5% CO 2, 10% H 2 and 85% N 2. Aliquots were diluted (10 fold) in corresponding media containing 8 mm glucoraphanin every two days. At day eleven, cultures were diluted in PBS and plated on 6 different media including Rogosa, Beerens, Wilkins Chalgren, 45
64 Bacteriodes, Clostridia and BHI. Individual colonies from these plates were selected and streaked on BHI agar twice for purity Bacterial Strains and Culture Conditions Escherichia coli VL8, Escherichia coli FI10944 and Enterococcus casseliflavus were isolated from human gut by using sinigrin enrichment by Dr. Vijitra Luang-In at Institute of Food Research and Lactobacillus agilis R16 was provided by Dr. Llanos-Palop (Table 2.2). Bacterial Strain Enrichment Method Growth Condition Media Lactobacillus agilis R16 [56] * 37 C, 200 rpm MRS Broth Escherichia coli VL8 [56] Sinigrin 37 C, 250 rpm L Broth Escherichia coli FI10944 Sinigrin 37 C, 250 rpm L Broth Enterococcus casseliflavus CP1 [56] Sinigrin 37 C, 200 rpm BHI Broth Escherichia coli FC44 Glucoraphanin 37 C, 250 rpm Nutrient Broth Citrobacter freundii FC50 Glucoraphanin 37 C, 250 rpm Nutrient Broth Citrobacter WYE1 [118] Sinigrin 37 C, 250 rpm Nutrient Broth Escherichia coli DH5α a * 37 C, 250 rpm L Broth Escherichia coli BL21(DE3) b * 37 C, 250 rpm L Broth Table 2.2 Bacterial strains used in the study. a Escherichia coli DH5α and b Escherichia coli BL21(DE3) were obtained from ThermoFisher Scientific. *These strains were not isolated by a glucosinolate enrichment method. Bacterial isolates were grown overnight and cultures were used to prepare 1 ml of glycerol stocks (20% v/v) then stocks were frozen on dry ice and stored at -80 C. Optical cell density (OD 600) was measured with a JENWAY 6715 UV/Vis Spectrophotometer (Staffordshire, UK) using bandwidth 1.5 nm wavelength 600 nm Bacterial Growth Analysis Growth of strains was analysed over time using a Bioscreen C machine (Labsystems). Corresponding media for each strain was inoculated with 1% (v/v) concentration of overnight grown culture then inoculated media was transferred to Bioscreen plate wells (Honeycomb, ThermoFisher Scientific), 300 µl of each inoculated media was used per well. Growth was screened for 48 h at an appropriate temperature for each strain. Measurements were 46
65 performed at 600 nm with 10 min measurement intervals with shaking for 10 seconds before each measurement Scanning Electron Microscopy (SEM) L. agilis R16, E. coli FI10944 and E. casseliflavus CP1 were grown overnight from bacterial stocks. These cultures (2 X 1 ml) were centrifuged at 3000 x g for 2 min at room temperature. The supernatants were removed and the pellets were resuspended in 1 ml PBS. To produce a final concentration of 2.5% (v/v) glutaraldehyde (Sigma, UK), 110 µl of 25% (v/v) glutaraldehyde was added to the tubes and left for 1 h to complete the fixation. After fixation, each sample analysed by Rachael Stanley at Institute of Food Research. Scanning electron microscopy was performed using a Zeiss Supra 55 VP FEG SEM (Zeiss, Germany) operated at 3 kv. 2.2 MOLECULAR BIOLOGY Polymerase Chain Reaction (PCR) Bacterial genomic DNA was used as template to amplify the genes of interest using High Fidelity Phusion Polymerase (Finnnzymes) according to supplier`s instructions. Reactions were set up as in Table 2.3 and performed as in Table 2.4. Components Volume (µl) Final Concentration 5X Phusion Buffer 10 1X 100 mm dntps mm each 20 µm Forward Primer µm 20 µm Reverse Primer µm Phusion Polymerase (2 U/µl) 0.4 Template DNA 1 <50 ng/50 µl Sterile MQ water 34.7 Total Volume 50 Table 2.3 Components of one PCR for amplification of the gene of interest. 47
66 The annealing temperatures and conditions were changed depending on primers. In general, the reactions were carried out as shown in Table 2.4 for 5 cycles using T m of 100% sequence match part of primers first and then 20 cycles using the T m of entire primers. Temperature Time Cycle(s) Steps ( C) 1 Initial Denaturation s 1 2 Denaturation s Annealing T 1 30 s 5 Extension s/kb 3 Denaturation s Annealing T 2 30 s 20 Extension s/kb 4 Final Extension 72 5min 1 Table 2.4 PCR conditions for amplification of the gene of interest Gel Electrophoresis To check the sizes of DNA fragments, agarose gels were prepared at 0.6% (to check genomic DNA samples) or 1% (g w/v) µl of DNA samples were loaded to the wells of agarose gel and run in 0.5X Tris Borate EDTA buffer (ThermoFisher Scientific). The gels were stained in 1 mg/ml ethidium bromide for min then rinsed in deionized water. After electrophoresis, the gels were visualised with an Alphaimager (Alpha Innotech) using UV light. The size of products was determined by running a DNA marker for every electrophoresis (HyperLadder, Bioline) Plasmid Preparation For cloning and expression of the genes of interest, either pet15b or pet28b vectors (Novagen) were used. While the pet15b vector has an N-terminal His Tag sequence, the pet- 28b vector also carries an optional C-terminal His Tag sequence (maps of the vectors are given in Appendix 1). The E.Z.N.A Plasmid Mini Kit I (Omega Bio-Tec) was used to purify the plasmids following the supplier`s protocol. 48
 to remove the restriction enzymes. 2.")

67 2.2.4 Enzyme Restrictions Reactions were set up in µl volumes following the supplier`s advice (New England Biolabs, UK). After digestion, enzymes were heat inactivated and the products were purified by SureClean (Bioline) to remove the restriction enzymes Dephosphorylation of Digested Plasmids To prevent the recirculation of digested plasmids, Antarctic Phosphatase (New England Biolabs, UK) was used to remove 5 phosphate groups. The dephosphorylation reactions contained ~ 1 µg of the digested vector, 1X Antarctic Phosphatase Buffer, 1 µl Antarctic Phosphatase and incubated for 15 min at 37 C for 5 extensions or blunt ends or 60 min for 3 extensions. After incubation, enzymes were heat-inactivated by incubating at 65 C for 5 min Primer Design Primers were ordered from Sigma Genosys. For subcloning, primers were designed with restriction sites on forward (shown as blue) and reverse (shown as green) site of the target gene (shown as red) (Figure 2.1). Figure 2.1 Illustration of a PCR with forward and reverse primers. Primers were designed to be between nucleotide long with an annealing temperature between C. It is advised to have a GC clamp at 3 -end of the primers and not to have the more than 4 repeats of the same nucleotide. The restriction enzymes need a certain amount of base pairs at the start of recognition site to cleave efficiently. The numbers of base pairs needed for successful recognition was obtained from the New England Biolabs website ( and these amount of base pairs were added to the primers. The primers also consisted of at least 15 bp of 100% complementary sequence to the gene of interest if introducing a new restriction site. The melting temperature of the entire primers and 100% match part were calculated by using the ThermoFisher Scientific Tm Calculator ( 49
68 biology/molecular-biology-learning-center/molecular-biology-resource-library/thermoscientific-web-tools/tm-calculator.html). Sigma OligoEvaluator tool was also used to assess primer design ( PCR Product Purification The PCR products (5 µl) were analysed on 1% agarose gel and checked to have expected product sizes. The rest of the products were purified using SureClean (Bioline) and quantified using Nanodrop 2000 (ThermoFisher Scientific) DNA Ligation Ligations were performed using Fastlink DNA Ligase (Epicentre) following the supplier`s protocol with the given components in Table 2.5. The reactions were performed in a total volume of 15 µl. The volumes of insert and vector were varied depending on their concentrations but final concentration of vector in all ligations was kept as 10 ng/µl and the molar ratio between vector and insert was 1:3 (vector: insert). The ligations were incubated at room temperature overnight and then heat-inactived at 70 C for 15 min. The heatinactivated ligations were used directly for transformation of E. coli. Components Double Digested Vector Gene Insert 1 µl Volume 10X Fast Link Ligation Buffer 1.5 µl 10 mm ATP 1.5 µl Sterile MQ water 7 µl Fast Link DNA Ligase (2 U/µl) 1 µl Total Volume 15 µl 3 µl (10 ng/ml, in 15 ml reaction) Table 2.5 Components of one DNA ligation reaction. The molar ratio of vector: insert was 1: Preparation of Chemically Competent Cells Transformation buffers were prepared as given in the Table 2.6. Buffer 1 was adjusted to ph 5.8 with 0.2 M acetic acid and Buffer 2 was adjusted to ph 6.4 with KOH then they were both filter sterilised and kept at 4 C. L Broth (5 ml) was inoculated with E. coli DH5α or BL21(DE3) strains from -80 C stocks and grown overnight at 37 C, 200 rpm with shaking. Next day, 50
69 overnight cultures were subcultured (1:100) into 50 ml of fresh L Broth. Cultures were grown at 37 C, 200 rpm shaking until OD 600 reached The cells were spun down for 7 min at 1,500 x g at 4 C then resuspended in 20 ml of Buffer 1 and were left on ice for 5 min. The cells were then spun down for 7 min at 1,500 x g at 4 C and resuspended in 2 ml of Buffer 2. The cell suspension was transferred to prechilled Eppendorf tubes as 110 µl stocks. The stocks were used as soon as possible or frozen immediately on dry ice for long term storage and kept at -80 C. Buffer 1 composition Stock solutions V of stock solution for 50 ml TFbI 30 mm potassium acetate 300 mm 5 ml 100 mm rubidium chloride 500 mm 10 ml 10 mm calcium chloride 100 mm 5 ml 50 mm manganese chloride 200 mm 12.5 ml 15% glycerol (v/v) 100% 7.5 ml Distilled water 10mL Buffer 2 composition Stock 50 ml 10 mm 3[N-Morpholino]Propanesulfonic 100 mm 5 ml Acid (MOPS) 75 mm calcium chloride 100 mm 37.5 ml 10 mm rubidium chloride 500 mm 1 ml 15% glycerol (v/v) 7.5 ml Table 2.6 Components of buffers used in competent cell preparation Transformation of E. coli Freshly prepared or stored E. coli DH5α or BL21 (DE3) chemically competent cells were thawed and incubated on ice for 10 min. The transformation was set up by adding ligation reactions (<100 ng DNA per 50 µl cells) to 50 µl of competent cells and incubated on ice for 30 min. After incubation, cells were exposed to heat shock at 42 C for 45 s and immediately put on ice again for 2 min then 250 µl of SOC broth was added. The cells were incubated at 37 C for at least 1 h shaking, 200 rpm. After incubation, 25 µl and 100 µl of cultures were plated on selective agar. The final antibiotic concentration was 100 µg/ml of ampicillin for pet15b and 30 µg/ml kanamycin for pet28b. 51
70 Selection of the Positive Transformants L Agar plates were prepared with the final antibiotic concentration of 100 µg/ml ampicillin and 30 µg/ml kanamycin for pet15b and pet28 respectively. After transformation, the colonies grown on selective plates were selected randomly and colony PCR was performed to determine if these colonies have the right gene fragment of interest. Colony PCR was set up to screen the colonies for plasmids with right insert. The colonies were picked and resuspended in 10 µl of sterile Milli-Q water (1 µl of this was used as DNA template for PCR). The products were amplified by PCR using the primers T7P2: 5': TGAGCGGATAACAATTCCC, Tm: 62.3 o C and T7_T: 5': GCTAGTTATTGCTCAGCGC, Tm: 60.1 o C (Sigma Genosys) and 1 µl of toothpicked colony suspension as DNA template. Colony suspension was replaced with sterile MQ water or empty vector control (pet15b or pet28b) for negative and positive controls. The reactions were set up as shown in Table 2.7. a Component Quantity b DNA Template 1 µl PCR conditions 5X GoTaq Reaction Buffer 10 µl Temp, time cycles (Promega) dntp 25 mm each (Bioline) 0.4 µl 95 C, 2 min 1 Primer F 20 mm 1 µl 95 C, 30 s Primer R 20 mm 1 µl 55 C, 30 s 25 GoTaq DNA Polymerase (5 U/µl) 0.25 µl 72 C, 1min/kb Water µl 72 C, 5min 1 Total 50 µl Table 2.7 Components in one colony PCR (a) and thermal cycling conditions (b) S rdna Sequencing An overnight culture (150 µl) was centrifuged at x g, the pellet was washed and resuspended in 15 µl sterile Milli-Q water. The pellet was boiled at 95 C for 5 min, cooled on ice and 1 µl of this was used as DNA template in PCR. The gene was amplified using the primers AMP_F: 5'-GAG AGT TTG ATY CTG GCT CAG Tm: 60.5, AMP_R: 5'-AAG GAG GTG ATC 52
71 CAR CCG CA Tm: 68.9 [222] to give a product of approximately 1500 bp. PCR was set up as given in Table 2.8. a Component Quantity b DNA Template 1 µl PCR conditions 5X GoTaq Reaction Buffer 10 µl Temp, time cycles (Promega) dntps 25 mm each (Bioline) 0.4 µl 95 C, 2 min 1 Primer F 20 µm 1 µl 95 C, 30 s Primer R 20 µm 1 µl 55 C, 30 s 20 GoTaq DNA Polymerase (5 U/µl) 0.25 µl 72 C, 1min 30s Water µl 72 C, 5min 1 Total 50 µl Table 2.8 Components in one PCR reaction (a) and thermal cycling conditions (b)in addition, a negative control (without template) was prepared. PCR products (10 µl) were analysed by agarose gel electrophoresis to check the size of the products. PCR products were purified by QIAquick PCR purification kit (QIAGEN) and quantified by a Nanodrop 2000 spectrometer (ThermoFisher Scientific). Products were sequenced with both primers (Eurofinn Genomics). Finch TV was used to check chromatogram quality (sequence quality), the reliable sequences were selected and copied to EditSeq (DNAStar) and saved. Then these sequences were assembled by using Seqman (DNAStar) to create a contig and this contig was searched on RDP database ( Genomic DNA Extraction, Sequencing, Assembly and Annotation Genomic DNA of strains was extracted by using the Genomic DNA extraction kit with Genomic Tip 20/G columns (QIAGEN) as advised by the supplier. To enhance the cell lysis of L. agilis R16, 50 Units of mutanolysin (Sigma) was added. Genomic DNA of E. coli FI10944, E. casseliflavus CP1, L. agilis R16 and C. WYE1 was sequenced by The Genome Analysis Centre (TGAC), Norwich, UK, using the Illumina MiSeq platform. DNA sequencing resulted in small reads of DNA with a read length of 251bp (2x251, paired end). These small reads were analysed using different bioinformatics tools step by step. Sickle [223], Abyss [224] and CAP3 [225] were used to produce quality-trimmed extended contigs from these small reads. 53
72 Genomic DNA of Isolate 44 and E. coli VL8 was sequenced at University of Birmingham, MicrobesNG Unit, Birmingham, UK. The sequencing was performed using NexteraXT library prep on two MiSeq runs and produced 2x250bp paired-end reads. Genomic DNA assembly of E. coli FC44, E. coli VL8 and C. WYE1 was performed by using SPAdes. The reads were analysed and quality-trimmed extended contigs were produced by using the SPAdes program version [226]. Genomic DNA of C. freundii FC50 was sequenced at the Animal and Plant Health Agency, NGS Services Unit, Surrey, UK. The sequencing was performed using the Ilumina MiSeq platform, producing 150bp paired end reads. Genomic DNA assembly was performed using SPAdes program version [226]. Following assembly, contigs were analysed by ARTEMIS [227] and annotated by RAST [228] Preparation of Phylogenetic Tree The 251 bp length of DNA reads from Genomic DNA sequencing were analysed and qualitytrimmed extended contigs were produced by using SPAdes program version [226]. These contigs of Citrobacter were used to construct a phylogenetic tree. Draft genomes of different Citrobacter species were obtained from Genbank whole genome shotgun projects. Core genome SNPs in draft genomes and C. WYE1 were used to prepare the phylogenetic tree using the parsnp program Version 1.2 by Dr. Arnoud Van Vliet [229]. 2.3 PROTEIN BIOCHEMISTRY Induction of Protein Expression and Cell-Free Extract Preparation Isopropyl-β-D-1-thiogalactopyranoside (IPTG) was used to induce protein expression in E. coli BL21(DE3) expressing the gene of interest. The cells were inoculated in L broth with antibiotic (10 ml) from -80 C stocks and grown overnight at 37 C, 250 rpm. Next day, 10 ml L broth with antibiotic medium was inoculated with 200 µl of the overnight culture and grown until midlog (OD 600=0.4) then cells were induced with 0.5 mm IPTG. For each of the expressed protein, the effect of several time points and temperatures on protein expression was tested to determine the optimum protein expression conditions. E. coli BL21 (DE3), transformed with pet15b or pet28b (empty vector control) was also induced as a negative control. After induction, cells were harvested by centrifugation for 15 min at 3200 x g at 4 C, the supernatant was removed and the pellet was frozen at -20 C. Later, the 54
73 cell pellet was resuspended in 500 µl of 20 mm Tris base 50 mm NaCI ph 7.5 (resuspension buffer) unless a different buffer is stated. The cells were extracted by sonication (Soniprep 150, MSE) by sonicating for 15 s and were keeping on ice for 30 s to cool down. This step was repeated 7 times for each sample. After sonication, the suspensions were centrifuged for 25 min, x g at 4 C. The supernatants were transferred into new clean tubes (soluble extracts), 500 µl resuspension buffer was added to the cell pellet (insoluble extracts). The suspensions and extracts were always kept on ice Protein Quantification The protein concentration of samples was determined using the Bradford assay (Bio-Rad, UK). The reactions were set up in 96 well plates (Greiner Bio-One, Austria) in triplicates. Bovine serum albumin (BSA) (New England Biolabs, UK) was used to prepare a calibration curve. BSA was prepared in different concentrations between the range of µg/ml then the samples were diluted to ensure that protein concentration will fall within a µg/ml range. Bradford assay concentrate was diluted 100X and added to samples and BSA solutions. The absorbance was measured at 600 nm using a ThermoMax Plate Reader (GMI, US). A calibration curve of BSA was prepared (Figure 2.2) and protein concentrations of samples were determined. 55
74 Figure 2.2 A reference calibration curve of Bradford assay. Different amounts of BSA were plotted against the absorbance at 600 nm Sodium Dodecyl Sulfate Polyacrylamide Gel Electrophoresis (SDS-PAGE) SDS-PAGE materials were purchased from Invitrogen (ThermoFisher Scientific, UK). The proteins were mixed with LDS sample buffer and reducing agent (under reducing conditions) as advised by the supplier and then heat denaturated by heating at 70 C for 10 min. The proteins (mainly ~10 µg) were loaded on a NuPAGE 4-12% Bis-Tris protein gel in MES buffer and placed in a X-Cell Sure Lock electrophoresis cell. The SeeBlue Plus2 protein marker (Figure 2.3) was used to determine the protein sizes of the samples. For reducing conditions, 500 µl of NuPAGE antioxidant was added to the internal reservoir. The protein gel was run for 35 min at 200 V. Then the gel was removed from cell then either washed three times in MQ water and stained with Simply Blue SafeStain or directly stained by Instablue dye (Expedeon, US) for 1 h. 56

75 Figure 2.3 See Blue Plus2 protein marker (Invitrogen) on a 4-12% Bis-Tris gel with different buffers Western Blotting Western Blot procedure was used to purify the 6XHis- tagged proteins of interest. SDS-PAGE gel was run as described previously (Section 2.3.3) and the proteins were transferred from protein gel to polyvinylidene difluoride (PVDF) membrane using a XCell II Blot module (Novagen, Germany). NuPAGE Transfer Buffer (20X) buffer was prepared as advised by supplier and used in preparation of 1X transfer buffer (See Table 2.9). Components NuPAGE Transfer Buffer (20X) 25 NuPAGE Antioxidant 0.5 Methanol 50 Deionized water Total Table 2.9 Components in NuPAGE Transfer Buffer (20X) buffer. Volume (ml) The blotting pads were soaked in transfer buffer at least 20 min before use. The PVDF membrane was pre-wetted in methanol and rinsed in deionised water and placed in 50 ml of 57
76 NuPAGE Transfer Buffer before use. The filter papers were briefly soaked in NuPAGE Transfer Buffer prior to use. The blot module was set up as shown in the Figure 2.4 within the order from cathode core; two blot pads, filter paper, protein gel, PVDF membrane, filter paper and two more blot pads. All components were set up to contact each other to perform the transfer efficiently and blot module was placed in buffer chamber. The blot module was filled with 1X NuPAGE Transfer Buffer to cover the gel and membranes. Excessive amount of buffer was avoided for a successful transfer. The outer chamber was filled with ~650 ml of MQ water and transfer was performed at 12V for 3 h. Figure 2.4 Western blot module set up order. The transfer membrane was removed from the Blot module and placed in a clean container. The membrane was washed twice for 10 min with 10 mm Tris.CI 150 mm NaCI ph:7.5 (TBS buffer) then incubated in 10 ml of 3% BSA in TBS buffer (blocking buffer) at room temperature by shaking. After blocking, membrane was washed twice with 50 ml of TBS- Tween/Triton buffer then once with TBS buffer and incubated with primary antibody, His-tag monoclonal antibody, (Novagen) for 1 h by shaking gently. The primary antibody was prepared in 5 ml of blocking buffer by adding 2.5 µl of antibody (200 ng/µl). The membrane was washed twice with TBS-Tween/Triton buffer to remove unbound antibody then washed once with TBS buffer for 10 min at each step. The membrane was incubated with the Anti- 58
77 Mouse IgG (Sigma, UK), Alkaline phosphatase produced in goat, as the second antibody for 1 h by shaking gently. The secondary antibody was prepared in 5 ml of blocking buffer by adding 2.5 µl of antibody. The membrane was washed 4X with TBS-Tween/Triton buffer and stained with BCIP/NBT solution (Sigma, UK) until clear visible bands were seen. The reaction was stopped by rinsing the membrane with distilled water. The membrane was dried and imaged. Washing and blocking steps were performed at room temperature Ni-NTA Purification E. coli BL21 (DE3) cells expressing the protein of interest were grown overnight in 10 ml of L broth with antibiotic (final concentration of 100 µg/ml ampicillin for pet15b and 30 µg/ml kanamycin for pet28b). The overnight culture was used to inoculate prewarmed 250 ml of L broth with antibiotic at 37 C with 250 rpm shaking until an OD 600 of 0.6 was reached. The culture was induced with IPTG at a final concentration of 1 mm IPTG. The cells were harvested by centrifugation for 20 min at 3200xg, 4 C. The supernatant was removed and the pellet was frozen overnight. The pellet was thawed on ice for 15 min, resuspended in 10 ml of 50 mm Tris ph mm NaCI 1% Triton X mm Imidazol 1mg/ml Lysozyme 25U/ml Benzonase nuclease (lysis buffer), incubated on ice for 30 min by swirling occasionally. The cell lysate was spun down for 30 min at x g, 4 C. The Ni-NTA column was prepared by adding 1 ml of Ni-NTA agarose resin slurry (QIAGEN, Germany) and letting resin to settle down on frit. The column was washed with 5 ml of 10 mm Tris ph mm NaCI 10 mm Imidazol (wash buffer) without disturbing the resin. The cleared supernatant from centrifugation was removed and loaded on to the resin. All of the flow through was collected. The resin was washed with 5 ml of wash buffer twice and each wash was collected separately. Finally, the 6X His-tagged protein was eluted 3 times with 1 ml of 10 mm Tris ph mm NaCI 200 mm Imidazol (elution buffer). The benzonase nuclease used in lysis buffer was purchased from Sigma-Aldrich Measurement of Myrosinase Activity by God-Perid Assay God-Perid assay (Figure 2.5) was used to measure the glucose release upon glucosinolate or β-glucoside breakdown by myrosinase activity or β-o-glucosidase activity respectively [137]. The God-Perid reagent was prepared in 250 ml of Tris HCI buffer ph 7.2 (1.2 g/ml) consisting of 2-2 -azino-bis (3-ethylbenzthiazoline-6-sulphonic acid) (ABTS) (1 mg/ml), glucosidase 59
78 oxidase (8 U/ml) and peroxidase (0.35 U/ml). This reagent was stored in cold and dark place away from light until use. All chemicals were purchased from Sigma-Aldrich. Figure 2.5 The principle of the God-Perid assay. The glucose (GLC) formed by myrosinase activity becomes the substrate of glucose oxidase and glucose oxidase releases H 2O 2 then H 2O 2 is catalysed by peroxidase forming a green product (ABTS radical cation). The green product gives an absorbance at 420 nm and can be measured by spectrophotometry. The reaction mixture (300 µl), consisted of enzyme and 2 mm sinigrin in 0.1 M citrate phosphate buffer ph 7.0 (Buffer can change depending on enzyme used in the assay), was incubated aerobically for 30 min at 37 C. The mixture was boiled for 5 min to inactivate the enzyme and then 1 ml of God-Perid reagent added to the mixture and incubated for 15 min at 37 C. The mixture was transferred to a spectrophotometer cuvette and the absorbance at 420 nm was measured using 6715 UV/Vis Spectophotometer (JENWAY, UK). A calibration curve (Figure 2.6) was prepared using glucose (0.1 mg/ml-0.7 mg/ml) to quantify the glucose released by the enzyme activity. 60
79 Figure 2.6 A reference calibration curve for God-Perid assay. Absorbance at 420 nm versus various amounts of glucose was plotted (n=3). One unit of myrosinase activity was defined as the amount of enzyme liberating 1 µmol of glucose per min. Total activity and specific activity of enzyme can be determined from the formulae: Total activity = Average of A 420nm x Dilution factor x F M of glucose x 30 min = X µmol glucose/min Specific activity = Total activity Total protein = X µmol glucose/min/mg F; Gradient from calibration curve, M; molecular weight of glucose 2.4 CHROMATOGRAPHY METHODS High Performance Liquid Chromatography (HPLC) HPLC was used to detect the degradation rate of glucosinolates by myrosinases or reductases. The method needs a prior desulfation for glucosinolates Preparation of sulfatase Sulfatase type H-1 from Helix pomatia was purchased from Sigma-Aldrich (UK). 300 mg of sulfatase was dissolved in 12 ml of cold MQ water then 12 ml of cold ethanol was added and stirred. Dissolved sulfatase was centrifuged at 4 C, 3000 x g for 6 min. The precipitate was 61
80 discarded and 1.5 volumes of cold ethanol was added to supernatant and stirred. Then centrifugation was performed as before and the supernant was discarded. The precipitate was dissolved in 8 ml of MQ water and loaded on A25 Sephadex (GE Healthcare) layered reservoir then flow through was loaded on C25 Sephadex (GE Healthcare) layered reservoir and flow through was used in HPLC sample preparation Desulfation of glucosinolates A needle and a frit was placed to a 3 ml capacity reservoir then the reservoir was pre-packed with 1 ml diethylaminoethyl (DEAE) Sephadex suspension and washed with 0.5 ml of MQ water. Each sample (200 µl) was mixed with 4.8 ml of 70% methanol with 50 µl of internal standard (16 mm sinigrin or glucotropaeolin), 3 ml of sample was loaded on pre-packed column and allowed to drip slowly. The column was washed twice with 0.5 ml 20 mm sodium acetate buffer ph 5.0 then twice with MQ water. The HPLC vials were placed under columns and 75 µl of sulfatase was layered on the surface of the columns. The columns were left overnight at room temperature. The next day, elution was performed with 1.25 ml MQ water in 3 steps (0.5 ml, 0.5 ml and 0.25 ml). The vials were sealed, vortexed and analysed on HPLC HPLC analytical conditions Desulfonated glucosinolates were analysed by HPLC using a C18 reversed-phase column, Waters Spherisorb 5µM ODS2 4.6 x 250mm Cartridge. The column was fitted with Spherisorb ODS2 Guard Column, 80Å, 5 µm, 4.6mm X 10 mm (Waters, UK) and connected to an Agilent Technology 1100 pump series and an autosampler Agilent 1100 series. The samples (10 µl) were injected and HPLC runs were carried out using MQ water (solvent A), acetonitrile (Solvent B). A gradient program was used on HPLC: 5% (v/v) acetonitrile for 10 min, 35% (v/v) acetonitrile for 5 min, 40% (v/v) acetonitrile for 1 min, 50% (v/v) acetonitrile for 4 min 30 s, 100% (v/v) acetonitrile for 4 min 30 s and finally 5% (v/v) acetonitrile for 7 min. All runs were performed at 30 C with a flow rate of 1 ml/min. The desulfonated glucosinolates were detected at 229 nm using a Diode Array Detector (Agilent). Glucosinolates were identified using the retention times of known glucosinolate standards and quantified based on the peak areas of samples compared to peak areas of the internal standard. The response factors (Area for standard/area for equimolar amount glucosinolate) [230] were used to determine 62
81 glucosinolate amount in the samples. The glucosinolate content of samples was determined for each glucosinolate (Table 2.10) and calculated as given below. Amount of Glucosinolate (mol) = Area (Glucosinolate/Internal Standard) * RF *Amount Glucosinolate Sinigrin 1 Glucoraphanin 1.07 Glucoerucin 1.04 Glucotropaeolin 0.95 Relative Response Factor Table 2.10 Response factors for desulfo-glucosinolates at 229 nm relative to desulfosinigrin. For further fragmentation of glucosinolates, the same column and analytical conditions of HPLC with 0.1% formic acid in MQ water (solvent A), 0.1% formic acid acetonitrile (Solvent B) were used. The glucosinolates were detected using an Agilent 1100 LC/MSDF model mass detector Autosampler HP 1200 version. 63
82 CHAPTER THREE 3 MYROSINASES FROM HUMAN GUT BACTERIA INVOLVED IN GLUCOSINOLATE METABOLISM 64
83 3.1 INTRODUCTION Consumption of cruciferous vegetables has been reported to provide health promoting effects against various cancers and this effect was attributed to glucosinolates and especially to their degradation products, ITCs [50, 69-72]. Myrosinase is the enzyme responsible for degradation of glucosinolates and formation of valued ITCs. Glucosinolates and myrosinases are kept separately from each other in the plants. Due to tissue damage, integrity of cells is disrupted and glucosinolates and myrosinase come into contact with each other. The hydrolysis of glucosinolates occurs and hydrolysis products such as ITCs, thiocyanates or nitriles are formed [8, 24]. In addition to plant myrosinases, many organisms show myrosinase activity including fungi [131], aphids [132] and gut bacteria [56, 112]. During cooking, plant myrosinases can be heat inactivated then biotransformation of glucosinolates to ITCs is dependent on human gut bacteria. Studies reported that the gut bacteria including Enterococcus casseliflavus CP1, Escherichia coli VL8 and Lactobacillus agilis R16 [56, 57] and Bacteroides thetaiotaomicron [112] can possess glucosinolate metabolism. While the plant [117, ] and aphid myrosinases [132, 133] are well characterised, bacterial myrosinases are not. The first bacterial myrosinase was purified 43 years ago from Enterobacter cloacae but this study could not identify the gene or protein sequence [231]. There were attempts to identify a bacterial myrosinase with its amino acid sequence for years but they had a limited success [137, 232]. Recently, the very first bacterial myrosinase sequence was identified from a soil strain C. WYE1 by Albaser et al. (2016)[118]. This myrosinase was a periplasmic β-glucosidase from Glycosyl Hydrolase 3 (GH3) family with a signal peptide. A preliminary characterisation was performed and this myrosinase was found to be activated by ascorbate like plant myrosinases [118]. However, its crystal structure is yet to be achieved. Luang-In et al. (2014) isolated several strains from the human gut using a sinigrin enrichment method and studied their glucosinolate degrading ability. The strains E. casseliflavus CP1, E. coli FI10944 and L. agilis R16 were found to degrade sinigrin and produce ITCs and nitriles. E. casseliflavus CP1 and L. agilis R16 were further studied and it was found that they degraded 53 ± 8% and 10 ± 2% of the glucoraphanin in the media after 24 h. When cell-free extracts of E. casseliflavus CP1 and L. agilis R16 were tested for myrosinase activity, the extracts did not show myrosinase activity. It was suggested that myrosinase activity of E. casseliflavus CP1 and L. agilis R16 is cell wall-associated [56]. 2D gel electrophoresis was used to identify sinigrin- 65
84 induced bacterial proteins of E. coli VL8 and L. agilis R16 involved in glucosinolate metabolism. It was concluded that induced proteins mostly belong to carbohydrate metabolism, oxidoreduction and sugar transport system [138]. Myrosinase activity in the human gut bacteria is attributed to the β-glucosidases which also have specificity for glucosinolates. A bacterial myrosinase from human gut has yet to be identified in terms of gene identification. In previous studies, candidate genes from E. casseliflavus CP1 [137] and Lactobacillus strains [232] which were proposed to have myrosinase activity were cloned and expressed in E. coli to identify the myrosinase. However, the recombinant proteins of Lactobacillus species from GH1 family ( were found to be insoluble and no myrosinase activity was determined. In addition, the recombinant proteins of E. casseliflavus CP1 (both from GH1 and GH3 family) failed to show myrosinase activity. Some of the recombinant proteins of E. casseliflavus CP1 were found to show β-glucosidase activity against various glucosides. Luang- In et al. (2013) performed their study lacking the annotated genome of E. casseliflavus CP1, the Uniprot database was used to get information on the β-glucosidases of E. casseliflavus CP1. As the genome of E. casseliflavus CP1 was sequenced, assembled and annotated in this study, this revealed that many putative β-glucosidases (40 β-glucosidases) are found in the E. casseliflavus CP1 genome. It was thought that Luang-In et al. (2013) had not cloned the correct β-glucosidase with myrosinase activity [137]. In this context, E. casseliflavus CP1 and E. coli FI10944 were studied in this chapter to identify their myrosinase. Cloning and chromatography approches were used for identification. 3.2 HYPOTHESIS Specific β-glucosidases are responsible for degradation of glucosinolates by human gut bacteria and can be identified using molecular biology or chromatography techniques. 66
85 3.3 MATERIALS AND METHODS Bacterial Strains The bacterial strains that are mentioned in this chapter were given in Table 3.1. Bacterial Strain Source of the strain L. agilis R16 [56] Human gut (provided to us) E. coli FI10944 Human gut (provided to us) E. casseliflavus CP1 [56] Human gut (provided to us) C. freundii FC50 Human gut (isolated in this study) C. WYE1 [118] Soil (provided to us) Table 3.1 Bacterial strains used in the study Genome Assembly of Glucosinolate Degrading Bacteria Bacterial cultures (10 ml) in appropriate culture broth were grown aerobically at 37 C until the culture reached an optical density OD 600=1.0. Genomic DNA extraction was performed according to QIAGEN Genomic DNA Protocol (QIAGEN, 2001) and genomic DNA of strains was sequenced and assembled as described in Chapter 2-section Screening Glucosinolate Metabolism by Human Gut Bacteria E. casseliflavus CP1, E. coli FI10944 and L. agilis R16 were reported to show glucosinolate degradation and ITC formation previously [56]. These strains were checked for their glucosinolate degradation ability in this study to confirm they are still able to degrade glucosinolates. The cultures were grown in the same way as described previously by Luang-In et al. (2014)[56]. Human gut bacteria were cultured in 5 ml of Wilkinson Chalgren (E. casseliflavus CP1), MRS-glucose media (L. agilis R16) and Nutrient Broth (E. coli FI10944) containing 1 mm glucoraphanin at 37 C anaerobically for 24 h. Negative controls consisted of only glucoraphanin incubated in appropriate media for each bacteria. After incubation, cells and negative controls were centrifuged for 15 min at x g at 4 C. The supernatants were removed and transferred into clean tubes. HPLC samples were prepared from these supernatants (200 µl used) and analysed as described before in Chapter 2-section 2.4 to determine glucosinolate degradation. The degradation products were not characterised because the main focus of this part of the study was to confirm that they were still showing the ability to degrade glucosinolates. 67
86 E. coli FI10944 was tested for glucosinolate metabolism under different conditions. Instead of using a rich medium, it was grown in M9 minimal media (recipe in Chapter 2-section 2.1.1) with glucoraphanin or sinigrin as sole carbon source. The growth of E. coli FI10944 was screened over 16 h by Bioscreen C (Labsystems), also testing the effect of different glucosinolate concentrations on growth. The addition of more glucosinolate after 4 th hour was tested to understand the consumption of glucosinolates by cells. It was also examined if the myrosinase activity of E. coli FI10944 cell-free extracts (CFEs) was inducible. E. coli FI10944 was grown in 10 ml of Nutrient Broth with or without 1 mm glucoraphanin anaerobically overnight at 37 C then the cultures were used to prepare CFEs by sonication. Cell pellets were washed twice with 0.1 M citrate phosphate buffer ph 7.0 to remove any traces of glucoraphanin from culture in sonication step. Protein concentrations of CFEs were determined by Bradford assay. The CFEs were incubated in 1 ml reaction volume with 0.25 mm glucoraphanin in 0.1 M citrate phosphate buffer ph 7.0 anaerobically for 16 h at 37 C. After incubation, samples were centrifuged at x g for 15 min at 4 C and supernatants were transferred into clean tubes. The supernatants (200 µl) were used in sample preparation for HPLC to determine glucoraphanin degradation by CFEs. L. agilis R16 was examined to see if pre-culturing in MRS media with sinigrin or glucoraphanin would affect its myrosinase activity and whether this affect would be dependent on glucosinolate type. L. agilis R16 cells were pre-cultured in 5 ml of MRS-glucose, MRS with 1 mm glucose, MRS with 1 mm sinigrin, MRS with 1 mm glucoraphanin media anaerobically at 37 C overnight. These pre-cultures were used to inoculate 1 ml of MRS with 1 mm sinigrin, MRS with 1 mm glucoraphanin media. The rest of the MRS with 1 mm sinigrin and MRS with 1 mm glucoraphanin pre-cultures were centrifuged x g for 15 min at 4 C. Clear supernatants (200 µl) were used in sample preparation for HPLC analysis to determine glucosinolate concentration left after incubation. The cultures inoculated from the precultures were incubated anaerobically for 24 h at 37 C. Controls without inoculum were also set up. Later, cultures were centrifuged at x g for 15 min at 4 C. Clear supernatants were transferred to clean tubes and 200 µl of supernatants used in sample preparation for HPLC analysis to determine glucosinolate degradation. While 16 mm sinigrin was used as internal standard for HPLC to determine glucoraphanin degradation, it was replaced with 16 mm glucotropaeolin for sinigrin degradation. 68
87 In addition to these strains, 98 new strains from human gut were isolated by glucoraphanin enrichment in this study (Chapter 2-section 2.1.3). Fifteen of them degraded 100% of glucoraphanin in the media. They were identified by 16S rdna sequencing then results were analysed on The Ribosomal Database Project (RDP) database [234] (Method is in Chapter 2- section ). One of the isolates was further studied. This strain, C. freundii FC50 was further screened for its growth in M9 minimal media including glucoraphanin or sinigrin. To test the myrosinase activity of CFEs of C. freundii FC50, it was grown in 5 ml Nutrient Broth (NB) with or without 1 mm sinigrin and CFEs were prepared as described before. CFEs were quantified by Bradford assay (Method is in Chapter 2-section 2.3.2) then myrosinase activity of CFEs was examined by God-Perid assay (Chapter 2-section 2.3.6) Identification of β-glucosidases to Clone and Express The genomes of E. casseliflavus CP1 and E. coli FI10944 were sequenced, assembled and annotated as described in Chapter 2-section As bacterial myrosinases are suggested to be β-glucosidases and more closely related to aphid myrosinases than plant myrosinases [133, 137], all β-glucosidases in the genome of E. casseliflavus CP1 and E. coli FI10944 were interrogated for significant similarity to aphid myrosinases and a recently identified bacterial myrosinase, C. WYE1 myrosinase [118]. The candidate genes were selected and checked for conserved domains then best candidates were cloned and expressed in E. coli Cloning, Expression of β-glucosidases and Purification of Proteins The selected genes were cloned using the pet expression system (Novagen). Genomic DNA of E. casseliflavus CP1 and E. coli FI10944 were extracted by using the Genomic DNA extraction kit with Genomic Tip 20/G columns (QIAGEN) as advised by the supplier. The primers introducing new restriction sites were designed to amplify the candidate genes from E. casseliflavus CP1 and E. coli FI10944 genome are listed in Table 3.2. When pet28b vector was used, primers were designed to enable in-frame translation of C-terminal 6XHis-tag by insertion of new nucleotides if this was needed. The nucleotide sequences of the cloned genes are shown in Appendix 2. PCR was set up using 5 ng or 10 ng genomic DNA as template and PCR products were checked on agarose gel (Chapter 2-section and 2.2.2). The annealing temperatures are also given in Table
88 Name Primer Sequence (5-3 ) Restriction Site ECG44-F GAAACATATGGATCATAAACAACTAAA NdeI ECG44-R GTTTCTCGAGGCTAGCACTCTTG XhoI ECG4-F GAATACATATGGAGACCGTAAAACTAAA NdeI ECG4-R GAAAGAATTCAAAATCGTGAGCGTACC EcoRI ECG39-F GGAGATCATATGAAAATTGATGTGAAT NdeI ECG39-R AACCCTCGAGATAAACAGTTATAGTTTCTTT XhoI ECOLG3-F GAGGAAGAAAAATCCATATGAAATG NdeI ECOLG3-R AAAGGAATTCAGCAACTCAAACTCG EcoRI Table 3.2 Primers used in the PCR experiments to amplify the candidate β-glucosidase genes. The restriction sites are underlined. The altered nucleotides to introduce the restriction sites are in bold. The inserted nucleotides are highlighted. Name T A, time, cycles T E, time Product Size ECG44-F ECG44-R ECG4-F ECG4-R ECG39-F ECG39-R ECOLG3-F ECOLG3-R 51 C, 30 s, 5X 63 C, 30 s, 20X 55 C, 30 s, 5X 65 C, 30 s, 20X 50 C, 30 s, 5X 67 C, 30 s, 20X 54 C, 30 s, 5X 66 C, 30 s, 20X 72 C, 40s 72 C, 1 min 72 C, 1 min 72 C, 1 min 1436 bp 2162 bp 2101 bp 2321 bp Table 3.3 Conditions used in the PCR to amplify the candidate β-glucosidase genes. T A; annealing temperature, cycles; cycles used in annealing step of PCR, T E; extension temperature and time used in PCR, Product size; the expected PCR product sizes for β- glucosidase genes. The annealing step was performed using T m of 100% sequence match part of primers first (5X) and then using the Tm of entire primer (20X). The insert was ligated to double digested pet15b or pet28b expression vector and gene constructs were transformed into E. coli Top10 competent cells (Thermo-Fischer Scientific) for ecg44 and E. coli DH5α chemically competent cells (homemade, See Chapter 2-section 2.2.9) 70
89 for ecg4, ecg39 and ecolg3. Transformant colonies were screened by colony PCR using GoTag polymerase and primers T7P2 (5 -TGAGCGGATAACAATTCCC) and T7T (5 - GCTAGTTATTGCTCAGCGG) (See Chapter 2 section for method). The clones that gave positive results for PCR were selected for plasmid purification. These clones were inoculated in L Broth with ampicillin (100 µg/ml final concentration) or L Broth with kanamycin (30 µg/ml final concentration) and grown overnight at 37 C, with shaking at 250 rpm. The recombinant plasmids were purified using EZNA Plasmid Mini Kit II (Omega Bio-Tek) and then sequenced. T7P2 and T7T primers were used to sequence pet15b-ecg44 construct. Due to the larger size of the other recombinant plasmids, internal primers were designed to sequence the whole gene. The internal primers used in sequencing of pet28b-ecg4, pet28b-ecg39 and pet28becolg3 constructs were ECG4_I (5 -GACCTCCTTTAATACGATCCA), ECG39_I (5 - GCTTTGTCATTAGTGATTTCGT) and ECOLG3_I (5 -GATTATATGCCGCCGTACA) respectively. The plasmids used and created in this study are shown in Table 3.4. The sequences were compared with the expected sequences to confirm that there was no mutation in the cloned genes. After that, the plasmid was transformed into E. coli BL21(DE3) cells (One Shot competent cells, Invitrogen). The colonies were picked and checked by colony PCR. The positive colonies were grown overnight in L Broth plus antibiotic then overnight grown cultures were used to prepare bacterial stocks. Bacterial stocks were kept at -80 C and one of the positive clones was further used in protein expression and induction studies. Plasmid Relevant Characteristics Antibiotic Resistance pet15b Expression vector Ampicillin pet28b Expression vector Kanamycin pet15b-ecg44 ecg44 gene insert from E. casseliflavus CP1 ligated to pet15b pet28b-ecg4 ecg4 gene insert from E. casseliflavus CP1 ligated to pet28b pet28b-ecg39 ecg39 gene insert from E. casseliflavus CP1 ligated to pet28b pet28b-ecolg3 ecolg3 gene insert from E. coli FI10944 ligated to pet28b Table 3.4 Plasmids used and generated in this study. Ampicillin Kanamycin Kanamycin Kanamycin 71
90 Protein expression in E. coli BL21(DE3) encoding the cloned genes was induced with IPTG at a final concentration of 0.5 mm for different time intervals. For E. coli BL21(DE3) cells expressing pet15b-ecg44, inductions were performed for 1 h, 2 h, 3 h, or 4 h at 37 C, shaking at 250 rpm. Protein expression in E. coli BL21(DE3) encoding pet28b-ecg4, pet28b-ecg39 and pet28b-ecolg3 were induced at 37 C for 3 h or 25 C for 4 h. Control cultures with E. coli BL21(DE3) pet15b (or pet28b) grown in presence of 0.5 mm IPTG (empty vector controls) and control cultures of E. coli BL21(DE3) expressing the cloned genes grown without 0.5 mm IPTG (uninduced cultures) were always included. After each induction period, the cells were centrifuged at 3220 x g for 15 min at 4 C. The supernatant was removed and cell paste was frozen at -20 C. The CFEs were prepared by sonication as described in Chapter 2-section and run on a SDS-PAGE gel (denaturing, reducing conditions) including negative controls too. The CFEs were checked for the presence of 6XHis-tag by Western Blot (Chapter 2-section 2.3.4) and partially purified by Ni-NTA columns as described in Chapter 2-section Dialysis of the Recombinant Proteins Purified proteins were dialysed overnight to remove excessive amounts of imidazole from Ni- NTA column purification (Method is in Chapter 2-section 2.3.5). Spectra/Por porous membrane tubing with Da cut off (Spectrum Labs) was used for dialysis. The membrane tubing was soaked in MQ water for 30 min in advance and rinsed with MQ water before use. The dialysis was performed in an appropriate amount of buffer (at least 100X bigger than volume of the protein) at 4 C for 18 h. The proteins were removed from the tubing and transferred into new clean tubes. The dialysed proteins were quantified by Bradford assay and tested by God-Perid assay for myrosinase activity. In addition, dialysis was performed in ammonium sulphate precipitation steps to exchange buffer Measurement of Myrosinase Activity God-Perid assay was used to measure the glucose release upon glucosinolate or β-glucoside breakdown by myrosinase activity or β-glucosidase activity respectively [137]. The method was described in Chapter 2-section in detail. The reaction mixture (300 µl), consisted of enzyme and 2 mm sinigrin in 0.1 M citrate phosphate buffer ph 7.0 was incubated aerobically for 30 min at 37 C. The buffer used in the assay can change depending on the enzyme. The mixture was boiled for 5 min to inactivate the enzyme and then 1 ml of God-Perid reagent added to the mixture and incubated for 15 min at 37 C. The mixture was transferred to a 72
91 A405 nm spectrophotometer cuvette and the absorbance at 420 nm was measured. A calibration curve was prepared using glucose to quantify the glucose released by the enzyme activity. The effect of ascorbic acid on myrosinase activity of a recombinant protein, ecg44, was tested using God-Perid assay. The reactions were set up in 300 µl of volume consisting of 2 mm sinigrin, 5 µg of ecg44 and 1 mm ascorbic acid in 0.1 M citrate phosphate buffer ph 7.0. To test the effect of different cofactors and the amount of enzyme, the assays were set up using 10, 50, 200 µg of ecg44 with or without 10 mm MgCI 2 or ZnCI β-glucosidase Assay Using 4-nitrophenyl β-d-glucopyranoside as Substrate This assay measures transformation of 4-nitrophenyl β-d-glucopyranoside (p-npg) into the product p-nitrophenol (p-np) that absorbs light at 405 nm [235]. p-npg (COLOURLESS) d-glucose + p-np (YELLOW) The samples were prepared in 100 µl of sodium phosphate buffer ph 8 containing 4 mm 4- Nitrophenyl β-d-glucopyranoside and incubated for 30 min at 37 C then 100 µl of 1 M Na 2CO 3 was added to stop the enzymatic reaction. To determine the enzyme activity, a standard curve was prepared using 5-50 nmol of p-nitrophenol in 100 µl sodium phosphate buffer ph 8 (Figure 3.1). The enzyme assays were set up in 96 well plates. The absorbance was measured using a ThermoMax Plate Reader (GMI, US) at 405 nm. One activity unit was defined as the amount of activity generating 1 μmol p-nitrophenol per minute y = 0.024x R² = p-nitrophenol (nmol) Figure 3.1 A reference calibration curve for β-glucosidase assay. Absorbance at 405nm versus various amounts of p-nitrophenol was plotted (n=3). 73
92 3.3.9 Purification of the Bacterial Myrosinase using Fast Protein Liquid Chromatography (FPLC) The method was adapted from a previous study [231]. Purification attempt 1: E. coli FI01944 was grown in 500 ml of Nutrient Broth with 1 mm sinigrin at 37 C overnight (OD 600= 1.7) then the protein extract prepared from this overnight grown culture by (NH 4) 2SO 4 precipitation. The overnight grown culture was spun down at x g for 20 min at 4 C. The cell pellet was resuspended in 0.2 M sodium phosphate buffer ph 7.0 (9 ml/ g cell paste) with 1X protease inhibitor cocktail (100X concentrate, Melford). The cells were sonicated for 45 s and kept on ice for 1 min to cool down and this step was repeated 7 times. After sonication, the suspension was centrifuged at x g for 25 min at 4 C. The supernatant was removed as soluble CFE. CFE was saturated with (NH 4) 2SO 4 at 80% (w/v) saturation at 4 C then centrifuged at 3220 x g for 15 min at 4 C. The supernatant was removed and the precipitate was dissolved in 30 ml of 0.2 M sodium phosphate buffer ph 7.0 as a protein extract. The protein extract was dialysed against 10 mm sodium phosphate buffer ph 7.0 for 18 h at 4 C. This protein extract was used in Ion Exchange (IEX) Chromatography to purify the bacterial myrosinase of E. coli FI Anion exchange chromatography was performed using Resource Q 1 ml column (GE Healthcare) attached to an ÄKTA FPLC (GE Healthcare) equipped with a UPC-900 wavelength detector (GE Healthcare) using Unicorn 3.20 software (GE Healthcare). The buffers used in IEX chromatography were 10 mm Na-phosphate buffer ph 7.0 as starting buffer and 10 mm Naphosphate plus 1 M NaCI buffer ph 7.0 as elution buffer. These buffers were prepared freshly and filtered through 0.22 µm Millex-GS filters (Merck Millipore). The column was equilibrated with starting buffer at 4 ml/min flow rate and then samples were run at 4 ml/min flow rate and the fractions (1.25 ml) were collected. The fractions from IEX chromatography were tested for myrosinase activity by God-Perid Assay using sinigrin as the substrate. The fractions showing myrosinase activity were further purified by gel filtration (GF). GF was performed with a Superdex 75 10/300 GL column (GE Healthcare). The column was attached to ÄKTA FPLC (GE Healthcare) equipped with a UPC-900 wavelength detector (GE Healthcare) using Unicorn 3.20 software (GE Healthcare). The buffer used was 10 mm Na-phosphate 150 mm NaCI ph 7.0 and it was filtered using a Millipore 0.22 µm GSTF membrane filter before use. The column was equilibrated with this buffer. Following column equilibration, the proteins were eluted and the fractions (1.25 ml) were collected. Collected fractions were tested for 74
93 myrosinase activity by God-Perid assay and the fractions with myrosinase activity were determined. These fractions from IEX and GF with myrosinase activity were analysed by LCMS/MS to determine the protein sequences. Purification attempt 2: The buffer conditions for myrosinase activity were optimised using different buffers in CFE preparation. CFEs were prepared from overnight grown 10 ml cultures of Nutrient Broth by sonication as reported before. CFEs of E. coli FI10944 in various buffers were prepared including 20 mm Na Citrate Buffer (ph 3.0, 4.0, 5.0 and 6.0), sodium citrate phosphate buffer (ph 5.0, 6.0 and 7.0), Tris-HCI buffer (ph 7.0, 8.0 and 9.0), sodium phosphate buffer (ph 6.0, 7.0 and 8.0). The protein concentrations of CFEs were determined by Bradford Assay and the myrosinase activity was determined by God-Perid assay and optimum buffer was determined for myrosinase activity. E. coli FI01944 was grown in 500 ml of Nutrient Broth without glucosinolates at 37 C overnight (OD 600= 1.9). The overnight grown culture was centrifuged at x g for 20 min at 4 C. The cell pellet was resuspended in 20 mm Na citrate buffer ph 5.0 (9 ml/ g cell paste) with 1X protease inhibitor cocktail (100X concentrate, Melford). CFE was prepared by sonication as described in the first purification attempt. The CFE was saturated with (NH 4) 2SO 4 at 80% (w/v) saturation at 4 C then centrifuged at 3220 x g for 15 min at 4 C. The supernatant was removed and the paste was dissolved in 20 mm Na citrate buffer ph 5.0. This protein extract was dialysed against 20 mm Na citrate buffer ph 5.0 overnight at 4 C to remove (NH 4) 2SO 4. The dialysed protein extract was run on FPLC to perform GF. GF was performed with a Superdex 75 10/300 GL column (GE Healthcare). Sample was run on gel filtration using 20 mm Na-citrate plus 200 mm NaCI buffer ph 5.0. The buffer was prepared freshly and filtered through Millipore 0.22 µm GSTF membrane filter before use. The sample was run with 0.5 ml/min flowrate and fractions (0.5 ml) were collected. The protein eluates were monitored at 280 nm. The fractions showing myrosinase activity were analysed by LCMS/MS to determine the protein sequences Identification of the Protein Sequences Obtained from FPLC by LCMS/MS The fractions showing myrosinase activity obtained from FPLC were run on SDS-PAGE gels under denaturing, reducing conditions as described in Chapter 2-section Gel pieces of interest were excised and washed with 1 ml of 200 mm ammonium bicarbonate (ABC) in 50% (v/v) acetonitrile to equilibrate the gel to ph 8 and remove the stain for 15 min twice. This solution was removed and the gel was washed with 1ml of acetonitrile (Fisher Scientific). After acetonitrile wash, solution was removed and left to air dry to remove any remaining 75
94 acetonitrile. The samples were incubated with 10 mm dithiothreitol in 50 mm ABC for 30 min at 60 C to reduce any cysteine thiol side chains then the solution was removed. The samples were alkylated with 1 ml of 100 mm iodoacetamide in 50 mm ABC in the dark at room temperature for 30 min. The gel pieces were then washed with 1 ml of 200 mm ABC in 50% (v/v) acetonitrile for 15 min twice followed by leaving them in 1 ml of acetonitrile to dehydrate and shrink the gel pieces. The protein sample was digested by adding 100 ng of trypsin (modified porcine trypsin; Promega), in 10 μl of 10 mm ABC before incubation at 37 C for 3 h. After digestion the samples were acidified with 10 μl of 1% (v/v) formic acid for 10 min. The digest solution was transferred to a clean tube and the gel pieces were then washed with 50% acetonitrile and agitated by tapping the tube and incubated for 10 min. Samples were frozen using dry ice and stored until mass spectrometry analysis [236]. Sample preparation and LCMS/MS run were performed by Dr. Fran Mulholland (IFR). The approach of LCMS/MS method and Mascot database ( is to take a sample of the protein of interest and digest it with a proteolytic enzyme, trypsin and then analyse the digest mixture by mass spectrometry. An instrument with MS/MS capability provides information about the structure by recording the fragment ion spectrum of the peptide. The experimental mass values are compared with calculated peptide mass or fragment ion mass values. An appropriate scoring algorithm is used to identify the closest match or matches. If the protein of interest is present in the sequence database, then the database pulls out that precise entry. If the sequence database does not contain the protein, then the database finds out those entries which exhibit the closest homology. 3.4 RESULTS Myrosinase Activity of Human Gut Bacteria In this chapter we mainly focused on E. casseliflavus CP1, E. coli FI10944 and L. agilis R16 which were reported to have myrosinase activity previously by Dr. Vijitra Luang-In [137]. In addition to these strains, 98 bacterial strains with myrosinase activity were isolated by a glucoraphanin enrichment method. Ten of these isolates were identified at genus level by 16S rdna sequencing and 5 isolates (Isolate 23, 32, 35, 50 and 57) were found to belong Enterobacteriaceae family. The results are shown in Table 3.5 and RDP database results of isolates are given in Appendix 3. Because of time limitation, not all of these strains could be 76
95 further studied. One of the isolates, isolate 50, was selected for further investigation of its glucosinolate degrading ability. Its genome was sequenced, assembled and annotated. The results from 16S rdna and genome sequencing revealed that it was a strain of C. freundii and it was designated as C. freundii FC50. Isolates Genus 59, 61, 66, 71 Enterococcus 33, 36, 48, 49, 58, 60 Escherichia/Shigella Table 3.5 Identities of 10 human gut isolates at genus level. The isolates were obtained using a glucoraphanin enrichment method. When E. casseliflavus CP1, E. coli FI10944 and L. agilis R16 (SEM images are shown in Figure 3.2) were cultured from previously frozen stocks, they were still able to degrade glucosinolates in in vitro conditions. The samples prepared from cultures were analysed on HPLC and the glucoraphanin degradation by cells was determined compared to negative controls which include only glucoraphanin incubated in appropriate media. According to the results, E. casseliflavus CP1, L. agilis R16 and E. coli FI10944 used up 7.3 ± 2.0%, 12.4 ± 0.8% and 100% of the glucoraphanin supplied to the media respectively (HPLC chromatograms are shown in Figure 3.3). 77
, E.")
.")

96 Figure 3.2 SEM images of E. casseliflavus CP1 (up left), E. coli FI10944 (up right) and L. agilis R16 (below). Scanning electron microscopy was performed using a Zeiss Supra 55 VP FEG SEM (Zeiss, Germany) operated at 3 kv by Rachael Stanley at Institute of Food Research. 78
, glucoraphanin retention time (4.5-4.7 min). Medium controls consisted of glucoraphanin incubated in appropriate media for each bacterium. The growth of E.")
97 Figure 3.3 HPLC chromatograms of hydrolysis of glucoraphanin by E. casseliflavus CP1, E. coli FI10944 and L. agilis R16. SNG; sinigrin, GRP; glucoraphanin. Sinigrin was used as internal standard. Sinigrin retention time ( min), glucoraphanin retention time ( min). Medium controls consisted of glucoraphanin incubated in appropriate media for each bacterium. The growth of E. coli FI10944 was analysed over time. The results are shown in Figure 3.4. This growth pattern shows that sinigrin is being used as carbon source by E. coli FI10944 (Figure 3.4 a, b, d). General media have lots of different carbon sources but sinigrin or glucoraphanin was the sole carbon source in these experiments. This explains the low growth rate of E. coli FI10944 in M9 minimal media with sinigrin compared to growth rate previously 79
98 achieved in general media. These experiments showed that E. coli FI10944 reached the highest OD 600 in ~4 h (Figure 3.4 a, b). With the same amount of glucose in the media instead of glucosinolate, the culture could only reach an OD 600 of ~0.55 but addition of more glucose at 4 th hour achieved a higher growth rate indicating the carbon source is the growth limiting factor (Figure 3.4 c). This result led the study to try the addition of more sinigrin after 4 th hour (Figure 3.4 d). This effect almost doubled the growth and showed the availability of free glucosinolate (sinigrin) is the growth limiting factor for E. coli FI a OD mm SNG 0 mm SNG 0 mm GRP 10 mm GRP time (h) Figure 3.4 Growth curves of E. coli FI10944 in M9 minimal media at different growing conditions. a) Growth curve at 37 C for 24 h in M9 minimal media with sinigrin (SNG) or glucoraphanin (GRP) as sole carbon source. b) Growth curve at 37 C for 16 h in M9 minimal media with sinigrin (SNG) at different concentrations (0-10 mm). c) Growth curve at 37 C for 16 h in M9 minimal media with 10 mm glucose to test the effect of extra glucose on growth rate. d) Growth curve at 37 C for 16 h in M9 minimal media with 10 mm sinigrin (SNG) to test the effect of extra sinigrin addition at 4th hour. 80
99 b 0.3 OD mm SNG 0.1 mm SNG 0.5 mm SNG 1 mm SNG 2 mm SNG 5 mm SNG 10 mm SNG time (h) c OD time (h) 10 mm glucose 10 mm glucose+ 10mM glucose after 4h Figure 3.4-Continued 81
100 d OD mm SNG + 10 mm SNG 10 mm SNG time (h) Figure 3.4-Continued C. freundii FC50 showed the same growth profile with E. coli FI10944, it was able to grow in M9 minimal media with sinigrin but not in M9 minimal media with glucoraphanin (Figure 3.5 a). It reached highest OD 600 at ~ 5 th hour, this is later than E. coli FI The addition of more sinigrin at 4 th hour resulted in a higher growth rate (Figure 3.5 b). 82
101 a OD mm SNG 10 mm SNG 0 mm GRP 10 mm GRP time (h) b OD mm SNG + 10 mm SNG 10 mm SNG time (h) Figure 3.5 Growth curves of C. freundii FC50 in M9 minimal media at different growing conditions. a) Growth curve at 37 C for 24 h in M9 minimal media with sinigrin (SNG) or glucoraphanin (GRP) as sole carbon source. b) Growth curve at 37 C for 16 h in M9 minimal media with 10 mm sinigrin (SNG) to test the effect of extra sinigrin addition at 4th hour. It is not known why E. coli FI10944 and C. freundii FC50 could not use glucoraphanin in the media as carbon source and did not grow (Figure 3.4 a and 3.5 a). This might be something about the glucoraphanin stock used in the study or a chemical absent from the M9 minimal 83
102 medium because E. coli FI10944 was able to use up glucoraphanin in fermentation studies before when it was grown in Nutrient Broth. In general, this experiment gave us an overview of the effect of sinigrin and glucoraphanin as a sole carbon source on E. coli FI10944 and C. freundii FC50 growth. When CFEs of C. freundii FC50 were tested for myrosinase activity, the myrosinase activity of CFEs obtained from cultures grown in Nutrient Broth and Nutrient Broth with 1 mm sinigrin were 0.12 ± 0.1 µg glucose/min/mg enzyme and 0.15 ± 0.1 µg glucose/min/mg enzyme respectively. CFE obtained from culture grown in Nutrient Broth with 1 mm sinigrin had a significantly higher myrosinase activity compared to CFE obtained from the culture grown in Nutrient Broth one (p=0.018, two sample two tailed t-test). The genomic DNA of C. freundii FC50 was extracted, its genome was sequenced and assembled as described in Chapter 2. However, further characterisation of the glucosinolate metabolism by this strain could not be studied. During the purification of myrosinase of E. coli FI10944, CFEs and protein extracts were prepared to be used in FPLC analysis. God-Perid assay was carried out to determine the myrosinase activity of these protein extracts using sinigrin as substrate. Sinapis alba myrosinase (Sigma) was used as a positive control. The results are shown in Table 3.6. The negative controls did not show any myrosinase activity. Negative control 1 consisted of extracts in buffer without substrate. This was set up to check that myrosinase activity was originated from CFE enzyme activity not from any glucose left in the extracts. The negative control 2 consisted of only sinigrin in buffer. This was set up to confirm that degradation was originated from an enzymatic activity. The results showed that CFE of E. coli FI10944 had myrosinase activity on sinigrin. Samples Specific Activity (µmol glucose/min/mg enzyme) Cell-free extract (CFE) 0.08 ± 0.00 Precipitated extract 0.08 ± 0.00 Dialysed protein extract 0.15 ± 0.00 S. alba myrosinase 0.44 ± 0.05 Table 3.6 Specific myrosinase activity of extracts of E. coli FI The myrosinase activity was assessed by God-Perid assay and sinigrin was used as substrate in the assay. The results are given as means of triplicates + SD. 84
103 As E. coli FI10944 was able to degrade all of the glucoraphanin supplied to Nutrient Broth previously. We wished to examine if the myrosinase activity in CFEs of E. coli FI10944 was inducible. HPLC was used to assess glucoraphanin degradation by CFEs. Glucoraphanininduced CFEs showed a degradation rate of 1.68 ± 0.89 glucoraphanin/µg protein (12.1 ± 4.7% degradation of original glucoraphanin concentration). Uninduced CFEs were able to degrade at a rate of 1.37 ± 0.53 nmol glucoraphanin/µg protein (10.4 ± 5.5% degradation of original glucoraphanin concentration). There was no significant difference for glucoraphanin degradation rate of induced or uninduced CFEs of E. coli FI10944 (p=0.641, two sample two tailed t-test). However, it should be noted that samples had high SD values. L. agilis R16 was examined to see if pre-culturing in MRS media with glucoraphanin, sinigrin, glucose or without glucose would change its myrosinase activity. The glucoraphanin and sinigrin degradation of samples were compared to negative controls which consisted of only glucoraphanin in MRS media and degradation rates were calculated. The glucosinolate contamination from pre-cultures were also taken into account in calculations. Results were summarised in Table 3.7. Pre-culturing in different conditions did not produce a remarkable difference in sinigrin or glucoraphanin degradation of L. agilis R16. It degraded 97-99% of the sinigrin in the MRS media and 9-14% of the glucoraphanin after 24 h incubation. Degradation rate of glucoraphanin was low as observed previously. It concluded that L. agilis R16 was not able to degrade glucoraphanin at as a high rate as sinigrin even if a pre-culturing in presence of glucosinolates was performed. 85
104 Pre-culturing Conditions Glucoraphanin Degradation (%) Sinigrin Degradation (%) Grown with 1 mm sinigrin 9.1± ±2.6 Grown with 1 mm glucoraphanin 14.5± ±1.2 Grown with no glucose 13.0± ±1.2 Grown with 1 mm glucose 12.6 ± ±2.5 Table 3.7 Glucoraphanin and sinigrin degradation rates of L. agilis R16 pre-cultured at different conditions. L. agilis R16 was pre-cultured in MRS with 1 mm sinigrin, glucoraphanin, glucose or without glucose. The results are given as means of triplicates + SD Cloning and Expression of β-glucosidases Selection of β-glucosidases to Clone and Express The search of myrosinase-like genes in human gut bacteria was based on the aphid myrosinase sequence (Glycosyl Hydrolase Family 1 - GH1) but after identification of a bacterial myrosinase from soil belong to GH3, this sequence was also included in the gene search. In the E. casseliflavus CP1 genome, 40 β-glucosidases were found from different Glycosyl Hydrolase (GH) families. These β-glucosidases were aligned with aphid myrosinases (from Brevicoryne brassicae and Acyrthosiphon pisum) and searched for any significant similarity and the presence of conserved amino acid residues that have a key role in myrosinase activity. The 3 best candidate genes were selected, they are β-glucosidases (EC ): named as ecg1, having 30% identity with aphid myrosinase (from Brevicoryne brassicae); ecg43 having 31% sequence identity with aphid myrosinase (from Brevicoryne brassicae); ecg44 having 33% identity with aphid myrosinase (from Brevicoryne brassicae). The multiple sequence alignment of 3 β-glucosidases with aphid myrosinase from Brevicoryne brassicae and Acyrthosiphon pisum is shown below (Figure 3.7). The alignment was performed using Clustal Omega [237]. The proton donor and nucleophile are the key elements of myrosinase activity. In B. brassicae myrosinase, Glu 167 and Glu 374 were reported to be these elements respectively (Figure 3.6) [133]. The 3 β-glucosidases possess these amino acid residues as can be seen on the alignment (highlighted). His 39 was reported as Zinc +2 binding, dimer forming amino acid residue but not conserved in the 3 bacterial β-glucosidases. Tyr 309, Trp 416, Trp 424 and Phe 432 in aphid myrosinase were reported to form a hydrophobic pocket and enable the 86

105 recognition of the glucose ring. Tyr 309, and Trp 416 were conserved in 3 β-glucosidases. Trp 424 was conserved in ecg43 and ecg44 but not in ecg1. Phe 432 residue was not conserved in any of the β-glucosidases but there was another hydrophobic amino acid Tyr in this position. Trp 123 in aphid myrosinase was reported to be involved in recognition of sulphur by van der Waals contact with sulphur of the thioglucosidic bond and this residue was only conserved in ecg44 but ecg1 and ecg43 have a Phe instead. Figure 3.6 The structure of the aphid myrosinase. The β-strands are shown in dark blue, α- helices in light blue and loops in green. The two catalytic glutamic acid residues are shown as in red indicating the position of active sites. The image was obtained from Huseybe et al., 2005 [134]. 87
106 H-39 * 20 * 40 * Brevicoryn : ~~~~~~~~~~~MDYKFPKDFMFGTSTASYQIEGGWNEDGKGENIWDRLVH : 39 Acyrthosip : MTVQPDKHLKCKYKQFPEKFMLGTASSAYQIEGAWNNDGKTESIWDRVAH : 50 ecg43 : ~~~~~~~~~~~MDYQFPAGFWWGSAASGPQTEGVFEGDGKGASIWDYWYQ : 39 ecg1 : ~~~~~~~~~~~MKQTFPTDFLWGASISAHQTEGAYQTDGKGLSVQDTRP- : 38 ecg44 : ~~~~~~~MDHKQLKEFPNDFLWGSASAAYQVEGAWQEDGKGASVWDDFVR : * 80 * 100 Brevicoryn : TSPEVIKDGTNGDIACDSYHKYKEDVAIIKDLNLKFYRFSISWARIAPSG : 89 Acyrthosip : TKQELFADDLDGDIACNSYYKVDEDVKLLKELKVQSYRFSLSWPRILPRG : 100 ecg43 : QEPEKFFNKVGPEKTSQVYTRYQEDIQLMKETGHTTFRTSIQWSRLFPQG : 89 ecg1 : ---RDNHEIADFTVAVDHYHQYKEDIALLAEMGIKIFRFSIAWSRIFPEG : 85 ecg44 : I-PGKTFKATNGDVAVDHYHRFKEDVALMKEQGLKTYRFSIAWTRIFPEG : 92 W-123 * 120 * 140 * Brevicoryn : VMNSLEPKGIAYYNNLINELIKNDIIPLVTMYHWDLPQYLQD-LGGWVNP : 138 Acyrthosip : EDSYINPAGVQYYNRLIDKLIENNITPIVTIYHWDLPQCIQD-LGGWCNK : 149 ecg43 : KG-EVNQKAVDFYNAYIDELIANGIEPFMNLYHFDMPMALQE-KGGWLNR : 137 ecg1 : RG-TVNQKGLDHYSDVIDELLKHGIQPFVTLNHFDLPQALED-EGGWTKR : 133 ecg44 : RG-EVNQAGLDFYLALIDELIKAGIEPMVTLYHWDLPRALQEEYGGWESR : 141 E * 180 * 200 Brevicoryn : IMSDYFKEYARVLFTYFGDRVKWWITFNEPIAVCKGYSIKAYAPNLNLKT : 188 Acyrthosip : QIIEFFTLYVRVVFRTFGDRVKYWITINEPYLVSESYGNEAGAPALNKSG : 199 ecg43 : ETVDAYVAFAQTCFTLFGDRVKKWFTHNEPIVPVEGGYLYQFHYPNEINM : 187 ecg1 : STVEAFAAYAKTLFTAYGDRVTHWLTINEPNIMLLVDQKILGKKIPLSE- : 182 ecg44 : KIIEDFTNYAAVLFEAFRGKVHYWVSLNEQNIFTSLGYLLAAHPPGVTDP : 191 * 220 * 240 * Brevicoryn : TGHYLAGHTQLIAHGKAYRLYEEMFKPTQNGKISISISGVFFMPKNAESD : 238 Acyrthosip : YGDYLAIHHTILAHATAYHIYNREFRPLQNGQIGISLNMEWYYPKNVSSL : 249 ecg43 : KHAVQVGFHETLASAKAIKVYHEMN---LDGEIGIILNLTPSYPRDENDP : 234 ecg1 : --KYQQFHHLMIAEKYAFEACHEIV---PNGKIGPVPNISLVYAAT-SRP : 226 ecg44 : KRMYEVNHIANLANASVINKFHEMK---IPGKIGPSFAYSPNYPIN-SDP : * 280 * 300 Brevicoryn : DDIETAERANQFERGWFGHPVYKGDYPPIMKKWVDQKSKEEGLPWSKLPK : 288 Acyrthosip : EDHYAAHRARMWQFGVFAHPLFFGDYPEDVKQGVMETNQFCGISLKRLHD : 299 ecg43 : EDVKAAQIADAFFNRSFLDPAVKGTFPEELVTIVKELDM VPA : 276 ecg1 : EDNQAALYFNSVRNWAYLDFACFGRYNTVFQDYLNQNGL TID : 268 ecg44 : KNILAAENAEDLMAHYWLDVYLWGEYPIAAMNYLKEQGI APT : 279 Figure 3.7 Alignments of putative β-glucosidases; ecg1, ecg43, ecg44 with aphid (B. brassicae) myrosinase and pea aphid (A. pisum) myrosinase. Brevicoryn; B. brassicae myrosinase, Acyrthosip; A. pisum myrosinase. The acid/base residue Glu 167 (E) and nucleophile of B. brassicae myrosinase are highlighted in yellow. Tyr 309 (Y), Trp 416 (W), Trp 424 (W) and Phe 432 (F) of B. brassicae myrosinase were highlighted in pink. His 39 (H) and Trp 123 (W) of B. brassicae myrosinase are highlighted in blue and green, respectively. 88
107 Y-309 * 320 * 340 * Brevicoryn : FTK-DEIKLLKGTADFYALNHYSSRLVTFG-SDPNP NF : 324 Acyrthosip : FSE-NEKYLIKGTLDFLGINHYFSVHATKLQSTQHQ SL : 336 ecg43 : MEADDLQTIRENTIDLLGINYYQPRRIMKKES PIDEAK : 314 ecg1 : FGPEDEALMKRALPDFVAMNFYTTVTVEQPT----EAGDMKNGISDQQSE : 314 ecg44 : IEPGDMDLLRSAKPDFLGINYYQTATNAYNPLDGVGAGKMNTTGKKGSSE : * 380 * 400 Brevicoryn : NP-DASYVTSVDEAWLKPN-ETPYIIPVPEGLRKLLIWLKNEYGNPQLLI : 372 Acyrthosip : KTRDSNFELSLIE-EIPYS-NPTWIKETPKGMRNLLCWIRDTYGNPKIII : 384 ecg43 : SPMPDDYFDNYDMPNKKMNPYRGW-EIYEKGIYDILTNTRENYGNIKCYI : 363 ecg1 : DIMERGFYKGFTNTFLKKN-AFNW-TIDPLGLKTTLQTLYDRY-HLPIII : 361 ecg44 : ETGTPGMFKKAENPFVERT-NWDW-EIDPQGLRIALRRITSRY-RVPVII : 376 E-374 * 420 * 440 * Brevicoryn : TENGYGDDGQLDDFE KISYLKNYLNATLQAMYEDKCNVIGY : 413 Acyrthosip : TENGVSDKGQNEDED--ALI----KRRYHYGYLSAVLNAIYEDGCNVIGY : 428 ecg43 : SENGMGVEGEERFVNADGVIEDDYRIEFVSDHLKYVHQAI-QEGTNCVGY : 412 ecg1 : TENGLGA---EDHLEADGTVHDPYRIDYLSQHISQCLAAI-NAGVDLIGY : 407 ecg44 : TENGLGE---YDKLTDNHQIHDQYRIDYLAGHVHAIKEAI-SDGAEVLGY : 422 W-416 W-424 F * 480 * 500 Brevicoryn : TVWSLLDNFEWFYGYSIHFGLVKIDFNDPQ---RTRTKRESYTYFKNVVS : 460 Acyrthosip : EVWSFLDSLEWFFGYREKFGMYRVDFNDQN---RSRYPKKSLQFFKQLFQ : 475 ecg43 : HMWTCMDNWSWTNAYKNRYGFISVDLANDA----KRTVKKSGRWFKEVSD : 458 ecg1 : SPWSAIDLISVHEGIRKRYGFIYVDRNDAQEKEQKRVRKDSFYWYQKLIE : 457 ecg44 : CTWSFTDLLSWLNGYQKRYGFVYVDQDETQEGSLARYKKDSFYWYQELIK : Brevicoryn : TGKP~~~~~~~~~~~~~~~~ : 464 Acyrthosip : TRTLPDVLNDLYCENNCDRG : 495 ecg43 : NNGF~~~~~~~~~~~~~~~~ : 462 ecg1 : VGAIPSLEE~~~~~~~~~~~ : 466 ecg44 : TNGQEC~~~~~~~~~~~~~~ : 478 Figure 3.7-Continued The ecg44 was selected for further experiments as it has most of the conserved amino acid residues and showed the highest sequence identity (33%) with aphid myrosinase (B. brassicae). During the study, the first bacterial myrosinase sequence was identified and it is a periplasmic β-glucosidase from GH3, not from GH1 like aphid and plant myrosinases [118]. Based on this sequence, the genomes were reinterrogated and new candidate genes were selected for cloning and expression. Especially, the importance of a conserved amino acid sequence, SDW, 89
108 was reported in enzyme activity of C. WYE1 myrosinase [118]. Whilst the candidate genes were being selected, this sequence was taken into account as well. One candidate gene with the SDW sequence (ecg4) and one without it (ecg39) from E. casseliflavus CP1 were selected. In addition, one periplasmic glucosidase from E. coli FI10944 was selected (ecolg3). The alignment of selected genes with C. WYE1 myrosinase is shown in Figure 3.8 and SDW sequence has been highlighted. The selected genes and their sequence identity with C. WYE1 myrosinase is shown in Table 3.8. Bacterium Gene Enzyme Family Sequence Identity (%) E. casseliflavus CP1 ecg44 GH1 *33 E. casseliflavus CP1 ecg4 GH3 29 E. casseliflavus CP1 ecg39 GH3 24 E. coli FI10944 ecolg3 GH3 24 Table 3.8 The genes cloned and expressed in this part of the study. Sequence identity indicates the sequence identity with C. WYE1 myrosinase, except *, * indicates the sequence identity with aphid (B. brassicaea) myrosinase. As ecg44 is from GH1 family ( it was compared to aphid myrosinase. * 20 * 40 * CMYR : MLTAFKMNTVSLAVLVCLPLSVSASIQSAQQPELGYDTVPLLHLSGLSFK : 50 ECG39 : ~~~~~~~~~~~~~~~~~MKIDVN : 6 ECG4 : ~~~~~~~~~~~~~~~~~~~~~~~~~~~~~~~~~~~~~~~~~~~~~~~~~~ : - ECOLG3 : ~~~~~~~~~~~MKWLCSVGIAVSLAL----QPALAD : * 80 * 100 CMYR : DLNRDGKLNPYEDWRLSPQTRAADLVKRMSVAEKAGVMMHGTAPAEG--- : 97 ECG39 : -MRKN RLQYTEAAEKILKQMTLKEKVHLMSGNMVLAD---- : 42 ECG4 : ~~~~~~~~~~~~~~~~METVKLKELIDQMTVAEKVGQLVQLTPDFFAQGG : 34 ECOLG3 : DLFGNHPL-----TPEARDAFVTELLKKMTVDEKIGQLRLISVGPDNPKE : 66 * 120 * 140 * CMYR : STFGNGSVYDSEATRKMVVDAHVNSLITRLNGEEPA : 133 ECG39 : -VRR-----DMA------NGQHYNE : 55 ECG4 : EITGPMQQWQMSEDQLFTIGSVLGTHTAE : 63 ECOLG3 : AIR------EMI--KDGQVGAIFNTVTRQ : 87 Figure 3.8 Alignment of the putative β-glucosidases with C. WYE1 myrosinase. The SDW motif is highlighted in red. CMYR; C. WYE1 myrosinase. 90
109 160 * 180 * 200 CMYR : RLAEQNNMIQKTAETTRLGIPVTISTDPRNSYQALVGISNPAGKFTQWPE : 183 ECG39 : FPYEAGGNERLNVPSMKFVD------GPRGAVTGRDKTTCFPV : 92 ECG4 : ---QVYAIQTSYLEKSRLKIPLVFMAD------VI------HGYETIFPI : 98 ECOLG3 : ---DIRAMQDQVMELSRLKIPLFFAYD------VL------HGQRTVFPI : 122 * 220 * 240 * CMYR : AIGLGAAGSEALAQEYADHVRREYRAVGITEALSPQADITTEPRWARISG : 233 ECG39 : SMARGASFDTELEKQIGIAIAKEIKDSGGNFFGGVCINLPYNPGWGRSQE : 142 ECG4 : PLALASSFDAQLVEEVAKASAKEAAEAGVHVTFSPMADHVKDARWGRVLE : 148 ECOLG3 : SLGLASSFNLDAVKTVGRVSAYEAADDGLNMTWAPMVDVSRDPRWGRASE : * 280 * 300 CMYR : TFGEDPELAKKLVRGYITGMQKGG-QGLNPQSVAAVVKHWVGYGAAEDGW : 282 ECG39 : VYGEDSFLLGAMGSALSEGVQSE SVVACVKHYAF-NSMENAR : 183 ECG4 : SNGEDPTLSSVLTAAYVRGYQGTASLAENKQRIAACVKHFIGYGAAEGGR : 198 ECOLG3 : GFGEDTYLTSTMGKTMVEAMQGKSP--ADRYSVMTSVKHFAAYGAVEGGK : 220 * 320 * 340 * CMYR : DGHNAYGKHTVLSNESLQKHIIPFRGAFEANVAAVMPTYSVMKGVTWNGR : 332 ECG39 : FKVDVH----ASKRTEREIYLSHFKDVIDSGAASVMTSYNKYFGE----- : 224 ECG4 : DYHTVD----LSDLELYQNYLPAFQAAIEAGAQLVMTSFNTIHGV----- : 239 ECOLG3 : EYNTVD----MSPQRLFNDYMPPYKAGLDAGSGAVMVALNSLNGT----- : 261 SDW 360 * 380 * 400 CMYR : ETEQVAAGFSHFLLTDLLRKQNNFSGVIISDWLITNDCDDECVNGSAPGK : 382 ECG39 : -----HTGNSTYLVRDVLKNEWNFDGFVISDFVNGTR : 256 ECG4 : -----PATANQPLLQEVLRQKLGFDGLIISDWAAVAELMAHRVAADR--- : 281 ECOLG3 : -----PATSDSWLLKDVLRDQWGFKGITVSDHGAIKELIKHGTAADP--- : 303 * 420 * 440 * CMYR : KPVAGGMPWGVESLSKERRFVKAVNAGIDQFGG--VTDSAVLVTAVEKGL : 430 ECG39 : DTVK-AALAGLDIEMHVTNHYGEKLEKAVEDGL : 288 ECG4 : KEAAKKAFTAGVEMDMM-SDCYLNALEQIIHAEP : 314 ECOLG3 : EDAVRVALKSGINMSMS-DEYYSKYLPGLIKSGK : * 480 * 500 CMYR : ITQARLDASVERILQQKFELGLFEQPYVDAKLAEKI-----VGAPDTKKA : 475 ECG39 : VPVETIDDAALRIIRT---LLVFEEARKND-----DSKE-TIDYKKHIRL : 329 ECG4 : EMNEQLNKAVFHVLSLKNKLGLFEDPFRGLVQGNLAPKLAQETRHL---- : 360 ECOLG3 : VTMEELDDAARHVLNVKYDMGLFNDPYSHLGPKESDPVDTNAESRLHRKE : 386 * 520 * 540 * CMYR : ADDAQFRTLVLLQN-KNILPLKPGT-KVWLYGADKSAAEK : 513 ECG39 : ALDAAEQSITLIKNENNCLPLNANIKKVAIFGKLATEEN-TGDRGSSRVY : 378 ECG4 : SREAAKKTTVLLKN-QALLPLQKKQ-KVALIGPKAAS-KDLLGAWSWIGK : 407 ECOLG3 : AREVARESLVLLKNRLETLPLKKSA-TIAVVGPLADSKRDVMGSWSAAGV : 435 Figure 3.8 Continued 91
110 560 * 580 * 600 CMYR : AGL EVVSEPEDADVALMRTSAPFE : 537 ECG39 : PPYVISYLEGLKKYSPH-IQVIYNEGSDIEL : 408 ECG4 : PEAAVSLAEGLSQKEIDLTVLSYPDGEM : 435 ECOLG3 : ADQSVTVLTGIKNAVGENGKVLYAKGANVTSDKGIIDFLNQYEEAVKVDP : 485 * 620 * 640 * CMYR : QPH-----YNYFFGRRHHE : 551 ECG39 : AKTIAREADAAIFVVGYNYDDEGEYTGEAENREVPAGAIFD : 449 ECG4 : -LTSTFIDEACKVAKEAEVVLLALGETSEEAGEA : 468 ECOLG3 : RSPQEMIDEAVQTAKQSDVVVAVVGEAQGMAHEA : * 680 * 700 CMYR : -----GSLEYREDNKDFAVLKRVSKH-TPVIMTMYMERPAVLTNVTDKTS : 595 ECG39 : AKGGDRKESLELHSEDILLINQVGPENNNSVVALVGGNTIMIEEWKNAVS : 499 ECG4 : ----ASLTKLSLSRKQEALIEAVSQVNPRIATILFCGRPLVLTAIEPLCQ : 514 ECOLG3 : ----SSRTDITIPQSQRDLIAALKATGKPLVLVLMNGRPLALVKEDQQAD : 565 * 720 * 740 * CMYR : GFIANFGLS---DEVFFSRLTSDTPYTARLPFALPSSMASVLKQK----- : 637 ECG39 : AILFTYYSGMEGGTALAKILFGEANPSGKLPFVIPYKEKDLPQID----- : 544 ECG4 : AIMIAWFPGSEGGNALADLLMGESEPQGRLAMSFPRAEGQLPMTYAQLST : 564 ECOLG3 : AILETWFAGTEGGNAIADVLFGDYNPSGKLPMSFPRSVGQIPVYYSHLNT : * 780 * 800 CMYR : SDEPDDLDTPLFQRGFGLTR~~~~~~~~~~~~~ : 657 ECG39 : ---WNADQITYEYYHGYAKLEKEGKVPSIPFGYGLSYTNFDISNHDFTID : 591 ECG4 : GRPLTEENSDQKYISRY---MDEKNEPLFSFGSGMGYGRCTITHTQIINP : 611 ECOLG3 : GRPYNADK-PNKYTSRY---FDEANGALYPFGYGLSYTTFTVSDVKLSAP : 661 * 820 * 840 * CMYR : ~~~~~~~~~~~~~~~~~~~~~~~~~~~~~~~~~~~~~~~~~~~~~~~~~~ : - ECG39 : ----KKLLTAKCTVENIGKLPGAEVVQLYVGFSHSQIDRPIKVLRGFKKV : 637 ECG4 : QEK-DAPFEVSCTLKNEGDIPHTTTLQLYSRDDVTEVARPMRELKQWQKI : 660 ECOLG3 : TMKRDGKVTASVQVTNTGKREGATVVQMYLQDVTASMSRPVKQLKGFEKI : * 880 * 900 CMYR : ~~~~~~~~~~~~~~~~~~~~~~~~~~~~~~~~~~~~~~~~~~~~~~~~~~ : - ECG39 : HLLPGEKKNITIKCPIEKLKWYNPDSEQWELEEIPYEVYLGNSSSPTDLI : 687 ECG4 : HLAAAEERQHSFYVTPEDFAYVHSDFS-TKSDPGTISLYLGFAAASAKLI : 709 ECOLG3 : TLKPGETQTVSFPIDIEALKFWNQQMK-YDAEPGKFNVFIGTDSARVKK- : 759 CMYR : ~~~~~~ : - ECG39 : KETITV : 693 ECG4 : GTLTI~ : 714 ECOLG3 : GEFELL : 765 Figure 3.8 Continued 92
 and the rest were from GH3 family (ecg4, ecg39, ecolg3). Genomic DNA (gdna) of E. casseliflavus CP1 and E. coli FI10944 were used to amplify the genes.")
111 Cloning of Putative β-glucosidases of E. casseliflavus CP1 and E. coli FI10944 Four β-glucosidase genes of E. casseliflavus CP1 and E. coli FI10944 were cloned. One of them was from GH1 family (ecg44) and the rest were from GH3 family (ecg4, ecg39, ecolg3). Genomic DNA (gdna) of E. casseliflavus CP1 and E. coli FI10944 were used to amplify the genes. The gel electrophoresis of gdna is shown in Figure 3.9. Figure 3.9 Agarose gel electrophoresis of bacterial gdna. These gdnas were used as template in PCR to amplify the genes. gdna samples were run on 0.8 % agarose gel. l; Hyperladder, 1; gdna of E. coli FI10944, 2; gdna of E. casseliflavus CP1. Specific primers (Table 3.1) were designed to produce PCR products. Some of the products gave a few bands on agarose gel then the PCR was repeated with optimized conditions (Table 3.2) until specific PCR products with expected sizes were obtained. After amplification, the inserts were ligated to double digested pet15b (ecg44) or pet28b (ecg4, ecg39, ecolg3) expression vectors (the maps of the vectors are given in Appendix 1) then the gene constructs were transformed into E. coli DH5α cells. The cells were plated on L agar with ampicillin (100 µg/ml final concentration) or kanamycin (30 µ/ml final concentration) plates. Several colonies were picked and tested by colony PCR to test if they have the plasmid with the correct gene inserts (Figure 3.10). 93
 and the same method as colony PCR.")
112 For the ecg44 gene construct, none of the screened colonies were found to have the correct insert so the ligation PCR was performed to test if the ligation worked. The ligation PCR was performed using the same T7P2, T7T primers (Chapter 2) and the same method as colony PCR. The PCR gave the expected gene product ~1600 bp so it was confirmed that the ligation worked. The transformation of gene constructs into E. coli cells was repeated using E. coli Top10 competent cells (Thermo-Fischer Scientific). The colonies were checked by colony PCR again and this time one positive transformant with correct insert was found. This positive colony was then grown on L agar with ampicillin (100 µg/ml). After extraction of the recombinant plasmid, it was sequenced and confirmed to have no mutation in the gene insert. The recombinant pet15b-ecg44 plasmid was transformed into E. coli BL21 (DE3) cells for protein expression studies. The ecg4, ecg39, ecolg3 were amplified by PCR (Figure 3.9). Then each gene construct was ligated into pet28b vector and transformed into E. coli DH5α cells as described before. Figure 3.10 Agarose gel electrophoresis of PCR products. PCR products were run on 1% agarose gel. l; Hyperladder, c; PCR negative control, 1; ecg4 of E. casseliflavus CP1, 2; ecg39 of E. casseliflavus CP1, 3; ecolg3 of E. coli FI The products showed the expected sizes; ecg4 (2162 bp), ecg39 (2101 bp), ecolg3 (2321 bp). After transformation, several colonies were selected randomly and colony PCR was performed for each gene construct. The colony PCR results showed that there were gene 94
 and the recombinant plasmids (pet28b-ecg4, pet28b-ecg39 and pet28b-ecolg3) were extracted.")
113 inserts with correct sizes in the recombinant plasmids (Figure 3.11). A few of the colonies with the expected PCR products were selected. They were grown on L agar with kanamycin (30 µg/ml) and the recombinant plasmids (pet28b-ecg4, pet28b-ecg39 and pet28b-ecolg3) were extracted. Sequencing confirmed that there was no mutation in the gene inserts. The recombinant pet28b-ecg4, pet28b-ecg39 and pet28b-ecolg3 plasmids were transformed into E. coli BL21 (DE3) cells for protein expression. Figure 3.11 Agarose gel electrophoresis for colony PCR experiments. l; hyperladder, 1-10; selected colonies for E. coli DH5α pet28b-ecg4, 10-20; selected colonies for E. coli DH5α pet28b-ecg39, 20-30; selected colonies for E. coli DH5α pet28b-ecolg3. The products were run on 1% agarose gel. The expected PCR product sizes; 291 bp for pet28b vector with no insert, 2397 bp for recombinant pet28b-ecg4 plasmid, 2301 bp for recombinant pet28becg39 plasmid, 2547 bp for recombinant pet28b-ecolg3 plasmid. 95
 at 37 C.")
114 Protein Expression and Purification of Putative β-glucosidases of E. casseliflavus CP1 and E. coli FI10944 The protein expression of E. coli DH5α expressing pet28b-ecg4 was tested using different time intervals (1, 2, 3, 4 h) at 37 C. The 3 h protein expression induction resulted in the highest recombinant ecg44 protein expression, giving the recombinant protein size within the expected size (~56 kda) with 6XHis-tag. The induction for 2 h and 4 h seemed to produce similar amount of protein when cell-free extracts (CFE) were checked on SDS-PAGE gel. The protein gel image is shown in Figure 3.12a. The CFEs were checked for the presence of 6X-His tag by Western blot as described in Chapter 2 (Figure 3.12b). Figure 3.12 SDS-PAGE and Western blot of the CFEs from E. coli BL21 (DE3) expressing pet15b-ecg44. a) Protein gel where CFEs were run on 10% Bis-Tris gel under denaturing, reducing conditions in MES buffer. b) Western blot (using anti-his tag antibody) of CFEs which was run within the same order of protein gel in a. 10 µg of protein was loaded per lane. M: See Blue Protein Marker, U: CFE obtained from uninduced E. coli BL21 (DE3) expressing pet15b-ecg44 cells, I1-I4: CFEs obtained from 1-4 h induced E. coli BL21 (DE3) expressing pet15b-ecg44 cells, UC: CFE obtained from uninduced E. coli BL21 (DE3) pet15b cells, C1-C4; CFE obtained from 1-4 h induced E. coli BL21 (DE3) pet15b cells (empty vector controls). The expression of the recombinant ecg44 protein was determined by Western Blot using a His-tag antibody (Novagen). Recombinant proteins with expected protein sizes were recognised by the His-tag antibody so the purification of ecg44 was performed using Ni-NTA column. The E. coli BL21 (DE3) cells expressing ecg44 were induced for 3 h at 37 C, with shaking at 250 rpm. The cells were spun down and Ni-NTA purification was performed as described in Chapter 2. All fractions (3.25 µl) from the purification steps were run on a protein gel (Figure 3.13). 96

115 98 kda- M L FT W1 W2 E1 E2 E Figure 3.13 SDS-PAGE of the Ni-NTA purified ecg44 proteins from E. coli BL21 (DE3) expressing pet15b-ecg µl of fractions were loaded per lane. Proteins were run on 10% Bis-Tris Gel under denaturing, reducing conditions in MES buffer. L: Lysate, FT: Flow through, W: Wash, E: Eluate, M; Protein marker. The optimum protein expression conditions of E. coli BL21(DE3) expressing pet28b-ecg4 and pet28b-ecg39 were found to be 25 C for 4 h. However, 3 h protein expression induction at 37 C resulted in a better expression of the recombinant proteins for E. coli BL21(DE3) expressing pet28b-ecolg3. Using these optimum conditions, protein expression was induced and the cells were centrifuged for 15 min at 3220 x g, 4 C. The supernatant was removed and the cell paste was frozen at -20 C. The CFEs were prepared by sonication and run on a protein gel (denaturing, reducing conditions). The protein gel image is shown below (Figure 3.14). The recombinant ecg4 (82.5 kda), ecg39 (80.7 kda) and ecolg3 (87.8 kda) are visible on the gel within expected sizes with 6XHis-tags. The CFEs were checked for the presence of 6X-His tag by Western blot as described in Chapter 2 (Figure 3.14b). 97
 Protein gel where CFEs were run on 10% Bis-Tris gel under denaturing, reducing conditions in MES buffer.")
116 Figure 3.14 SDS-PAGE and Western Blot of the CFEs from E. coli BL21 (DE3) expressing pet28b-ecg4, pet28b-ecg39 and pet28b-ecolg3. a) Protein gel where CFEs were run on 10% Bis-Tris gel under denaturing, reducing conditions in MES buffer. b) Western blot (using anti- His tag antibody) of CFEs which was run within the same order of protein gel in a. 10 µg of protein was loaded per lane. M: See Blue Protein Marker, C (+): ecg44, 6XHis-tagged protein, C1 and C2: CFEs obtained from E. coli BL21 (DE3) expressing pet15b (empty vector control), IS: Insoluble extract, S: Soluble extract, 1: CFE obtained from E. coli BL21 (DE3) expressing pet28b-ecg4, 2: CFE obtained from E. coli BL21 (DE3) expressing pet28b-ecg39, 3: CFE obtained from E. coli BL21 (DE3) expressing pet28b-ecolg3. The ecg4, ecg39 and ecolg3 were purified in the same way as ecg44 by Ni-NTA purification (Figure 3.15). 98
, ecg39 (b) and ecolg3 (c) proteins from E.")

117 a M L FT W1 W2 E1 E2 E3 98 kda b M L FT W1 W2 E1 E2 E3 98 kda Figure 3.15 SDS-PAGE of the Ni-NTA purified ecg4 (a), ecg39 (b) and ecolg3 (c) proteins from E. coli BL21 (DE3) expressing pet28b-ecg4, pet28b-ecg39 and pet28b-ecolg3 respectively µl of fractions were loaded per lane. Proteins were run on 4-12% Bis-Tris Gel under denaturing, reducing conditions in MES buffer. L: Lysate, FT: Flow through, W: Wash, E: Eluate, M; Protein marker. 99
 was carried out using 200 µg of ecg44 (~12 µm) S. alba myrosinase was used to as a positive control.")
118 c M L FT W1 W2 E1 E2 E3 98 kda Figure 3.15-Continued After Ni-NTA purification, ecg44 was dialysed against 25 mm Tris-HCI ph 7.4 buffer. The dialysed ecg44 was quantified by Bradford assay. Myrosinase assay (God-Perid) was carried out using 200 µg of ecg44 (~12 µm) S. alba myrosinase was used to as a positive control. The positive control showed a specific enzyme activity of 0.17 µmol/min/mg enzyme for sinigrin. However, ecg44 did not show any myrosinase activity against sinigrin or glucoraphanin. The effect of ascorbic acid on myrosinase activity of ecg44 was tested using the God-Perid assay. No myrosinase activity was determined when 1 mm ascorbic acid was used. The presence of cofactors (MgCI 2 or ZnCI 2) or different amount of enzyme (10, 50, 200 µg of ecg44) did not make any difference and no myrosinase activity was observed. To test if any factor from CFE was needed for myrosinase activity of ecg44, CFE of E. coli BL21(DE3) expressing ecg44 was added to purified protein. However, this did not make any difference on the enzyme activity. The ecg44 is a β-glucosidase so β-glucosidase activity assay was performed using 4-nitrophenyl β-d-glucopyranoside as substrate but it did not show β- glucosidase activity either. The Ni-NTA purified ecg4, ecg39 and ecolg3 were dialysed against 20 mm citrate phosphate buffer ph 7.0. The myrosinase activity of dialysed and undialysed ecg4, ecg39 and ecolg3 proteins were tested using the God-Perid assay. The results revealed that these proteins do not have any myrosinase activity. To test if myrosinase activity of these recombinant proteins 100
119 is in need of any cofactor from CFE, CFE of E. coli FI10944 showing myrosinase activity was added to the recombinant proteins. This did not change the result and recombinant proteins did not show myrosinase activity. They were also tested for β-glucosidase activity using 4- nitrophenyl β-d-glucopyranoside as substrate. β-glucosidase activity of ecg4 and ecg39 were 2.4 ± 0.1 µmol p-nitrophenol/min/mg enzyme and 0.08 ± 0.02 µmol p-nitrophenol/min/mg enzyme respectively when in undialysed proteins. β-glucosidase activity levels in ecg4 and ecg39 were found to be 1.6 ± 0.2 p-nitrophenol/min/mg enzyme and 0.07 ± 0.01 p- nitrophenol/min/mg enzyme respectively when dialysed proteins were used. In summary, ecg4 and ecg39 proteins were active, they showed β-glucosidase activity. However, they did not show myrosinase activity under the conditions tested Purification of the Bacterial Myrosinase of E. coli FI10944 In the first attempt to purify the putative bacterial myrosinase, overnight grown culture of E. coli FI10944 (OD 600 = 1.7) was used to prepare protein extract and then fractionated by (NH 4) 2SO 4 precipitation. Precipitate was dialysed and then run on IEX chromatography and fractions were collected (Method in section 3.3.8). The fractions A8, A9 and A10 showed myrosinase activity within the 13 fractions tested (Figure 3.16). The enzyme activities of fractions were 0.11 ± 0.00, 0.24 ± 0.01 and 0.01 ± 0.00 µmol glucose/min/mg enzyme respectively. The positive control, a commercial plant myrosinase of S. alba, had an enzyme activity of 0.17 µmol glucose/min/mg enzyme. The negative control, with only sinigrin in buffer, did not show any enzyme activity. Precipitated and dialysed protein extracts and fractions showing myrosinase activity (A8, A9 and A10) were run on a protein gel (Figure 3.17). Bands shown on Figure 3.17 were excised and analysed by LC-MS\MS. As fraction A9 showed the highest activity, this fraction was further purified using gel filtration to identify the protein responsible for myrosinase activity. 101
120 102 Figure 3.16 Chromatogram showing IEX fractions from ammonium sulphate precipitated proteins of E. coli FI The protein eluates were monitored at 280 nm. Fractions were collected.


121 CFE PP PDP M A8 A9 A kDa x x Figure 3.17 SDS-PAGE showing protein extracts of E. coli FI10944 and fractions from IEX chromatography. 10 µg of protein was loaded per lane. CFE; cell-free extract, PP; precipitated protein extract, PDP; precipitated, dialysed protein, M; See blue protein marker, A8-F10; fractions from IEX chromatography, X; Protein bands for excision. Proteins were run on 10% Bis-Tris Gel under denaturing conditions. Mascot analysis showed that the excised A8 protein band and its equivalent in A9 are flagellin, no glucosidase sequence was obtained from this analysis. The fraction A9 was further purified by gel filtration using a Superdex 75 (GE Healthcare) column (Method in Chapter 2) and 33 fractions were obtained. These fractions were also tested for myrosinase activity. The fraction showing the highest myrosinase activity was further analysed by LC- MS/MS. When Mascot results were interrogated with E. coli FI10944 genome or compared to C. WYE1 myrosinase, no glucosidase sequence or conserved domains related to myrosinase activity were found. The results revealed that phosphoglycerate kinases and glycerophosphoryl diester phosphodiesterases dominated the fraction. In the second attempt of purification of bacterial myrosinase by chromatography, the conditions for myrosinase activity were optimised with different buffers. The buffers 20 mm Na Citrate ph 5.0 or 6.0 were found to be better for protein yield under the conditions tested (Figure 3.18). 103
122 Protein Yield (µg/ml) ph 3.0 ph 4.0 ph 5.0 ph 6.0 ph 5.0 ph 6.0 ph 7.0 ph 7.0 ph 8.0 ph 9.0 ph 6.0 ph 7.0 ph 8.0 Na Citrate Na Citrate Phosphate Tris HCI Na Phosphate Figure 3.18 Protein yields of CFEs of E. coli FI10944 in various buffers. All of the buffers were at a concentration of 20 mm. The protein amount was determined by Bradford Assay in triplicates and the results are given as mean of triplicates ± SD. 20 mm Na Citrate buffer ph 5.0 was concluded to be better for myrosinase activity under the conditions tested (Figure 3.19). CFEs in 20 mm Na Citrate buffer ph 5.0 was tested for myrosinase activity by God-Perid assay and they showed a myrosinase activity of 0.13 ± 0.00 µmol glucose/min/mg enzyme. Optimum ph for myrosinase activity was found to be ph
123 specific enzyme activity (µmol glucose/(min.mg)) ph 3.0 ph 4.0 ph 5.0 ph 6.0 ph 5.0 ph 6.0 ph 7.0 ph 7.0 ph 8.0 ph 9.0 ph 6.0 ph 7.0 ph 8.0 Na Citrate Na Citrate Phosphate Tris HCI Na Phosphate Figure 3.19 Specific enzyme activity of CFEs of E. coli FI10944 in various buffers. All of the buffers were used at a concentration of 20 mm. The myrosinase assay was performed to determine activity and the results are given as mean of triplicates ± SD. E. coli FI01944 was grown in 500 ml of Nutrient Broth without glucosinolates at 37 C overnight, OD 600 of overnight grown culture was 1.9. The protein extract was prepared as described before and run on FPLC to perform size exclusion chromatography (Method in Chapter 2). Four of the fractions showed myrosinase activity and one of the fractions was run on 10% Bis-Tris gel under denaturing, reducing conditions for 10 min then a protein band was excised and analysed by LC-MS/MS. When this experiment was run previously, it was found that the fraction showing myrosinase activity was dominated by phosphoglycerate kinases. This time, enzyme activity optimisation was performed in advance to get a better chance to find out the responsible enzyme for myrosinase activity in the fraction. The protein sequences detected in the samples were analysed by Mascot (Results are given in Appendix 4). The results concluded that the enzymes found in the fraction are strongly related with the glycolysis pathway, including phosphoglycerate kinases but glucosidases were also found in the fraction. These glucosidases were a predicted cytoplasmic α-amylase (~57 kda) and a periplasmic trehalase (~64 kda). Notably, cytoplasmic α-amylase showed significant matches. No β-glucosidases were identified in the fraction. The conditions used in chromatography in two attempts were summarized in Table
124 1 st attempt 2 nd attempt Culturing Media NB with 1 mm sinigrin NB Purification Method Fractions with Myrosinase activity Fractions tested by LCMS/MS LCMS/MS Results IEX Chromatography followed by GF A8, A9 and A10 from IEX A12 and B12 from GF A8 from IEX B12 from GF A8; flagellins B12; phosphoglycerate kinases, diester phosphodiesterases, phosphopento mutases, NAD(P)H dehydrogenases, enolases, glucose-6-phosphate isomerases, etc. GF B6, B5, B4, B3 B4 B4; phosphoglycerate kinases, transaldolases, triosephosphate isomerases, glucose-1-phosphatases, cytoplasmic α-amylases, glucose-6-phosphate isomerases, superoxide dismutases, periplasmic trehalase, etc. Table 3.9 The details and results of chromatography methods used in purification of bacterial myrosinase. The fractions obtained and LCMS/MS results of the fractions. NB; nutrient broth, IEX; ion exchange, GF; gel filtration. LCMS/MS results indicate the Mascot results for each fraction. The experimental mass values are compared with calculated peptide mass or fragment ion mass values. An appropriate scoring algorithm was used to identify the closest match or matches. 106
125 3.5 DISCUSSION In this chapter, human gut bacteria were tested for myrosinase activity then chromatography and cloning methods were used to attempt to identify the myrosinases. E. coli FI10944 was not screened for its glucoraphanin degrading ability before this study although it was shown to degrade sinigrin [137]. It degraded all of the glucoraphanin supplied to the media after 24 h. In addition, the glucosinolate degrading ability was observed in CFEs of E. coli FI It was suggested that the glucosinolate degrading ability of bacteria may be in the membrane/debris fraction because no myrosinase activity was seen in CFEs of L. agilis R16 [56, 210], E. coli VL8 [56] and E. casseliflavus CP1 [56] but it was present with intact cells. However, our study showed that cell wall-associated activity is not always the case. CFEs of E. coli FI10944 and C. freundii FC50 showed myrosinase activity. This is in accordance with a study reporting myrosinase activity in CFEs of Bifidobacterium and Lactobacillus strains [232]. When CFEs of E. coli FI10944 were prepared from induced cells (grown in Nutrient Broth) and uninduced cells (grown in Nutrient Broth with 1 mm glucoraphanin), no significant difference was seen between degradation rates of induced or uninduced CFEs of E. coli FI These results suggest that myrosinase activity of E. coli FI10944 may be constitutive. However, there was myrosinase activity in CFEs prepared from uninduced E. coli FI10944 cells. This result suggests that myrosinase activity is not always associated with the presence of glucosinolates as the inducer. A slight induction effect of sinigrin was observed in CFEs of C. freundii FC50 for myrosinase activity. When C. freundii was grown in Nutrient Broth with 1 mm sinigrin instead of Nutrient Broth, CFE obtained had slightly higher myrosinase activity. This suggests that myrosinase activity in CFE of C. freundii FC50 can be further induced. E. casseliflavus CP1 used up 7.3% of the glucoraphanin supplied to the media; this was lower than the degradation rate (53%) reported previously by Luang-In et al. (2014) [56]. The same media, incubation time (24 h) were used under anaerobic conditions. The bacteria were isolated and shortly after used in fermentation studies [56] but we tested the activity after a certain storage time away from gut environment. This might be the reason for the loss of glucoraphanin degrading ability of E. casseliflavus CP1. During the storage, bacteria might have lost a large part of its myrosinase activity. The same effect was seen in our research group for antimicrobial activity of gut strains. The gut strains possessing bactericidal effects lost their activity during storage [238]. 107
126 L. agilis R16 used up 12.3% of the glucoraphanin in the media that is same range to 10.0% reported previously [56]. L. agilis R16 kept its glucoraphanin degrading ability at the same rate after long storage time. When, L. agilis R16 was pre-cultured in MRS with 1 mm sinigrin, glucoraphanin, glucose or without glucose, it still showed a high sinigrin degradation rate (~97-99%) and low glucoraphanin degradation rate (~9-14%). Pre-culturing in media with glucosinolates did not produce a remarkable difference for glucoraphanin and sinigrin degradation compared to pre-culturing in media with or without glucose. Instead of using one step pre-culturing, several pre-culturing steps or using M9 minimal media with glucosinolates as the sole carbon source could be investigated. In fact, the glucosinolate side chain (the size or structure) might be the limiting factor. As glucoraphanin is a methylsulfinylalkylglucosinolate possessing a sulphoxide group with a high polarity, the sulphoxide group in the side chain might be the reason for the lower degradation rate. It was reported that L. agilis was able to degrade all of the glucoerucin (reduced form of glucoraphanin) but only 10% of the glucoiberin which has sulphoxide group in the structure after 24 h when it was cultured in MRS anaerobically [56]. As L. agilis R16 could degrade glucoerucin but not glucoraphanin, it might lack an efficient reductase activity to reduce sulphoxide group. When the growth of E. coli FI10944 and C. freundii FC50 were examined over time in M9 minimal media with glucoraphanin and sinigrin, it was found that both strains could grow in M9 minimal media with sinigrin. However, they did not grow on M9 minimal media with glucoraphanin. When E. coli FI10944 was grown in Nutrient Broth it was able to consume glucoraphanin. The reason for glucoraphanin not being used as sole carbon source by E. coli FI10944 and C. freundii FC50 might be the lack of a chemical absent in the M9 minimal media. In general, our results showed that human gut bacteria have a diverse glucosinolate metabolism capacity and action mechanism to degrade different glucosinolates. A reduction step which is the reduction of sulphoxide group in glucoraphanin structure is likely to be involved in the degradation of glucoraphanin by E. coli FI After reduction of glucosinolate, myrosinase in the bacteria may act on the reduced glucosinolate. The same reduction activity was proposed to be involved in the degradation of glucoiberin and glucoraphanin by Escherichia coli VL8 [56], Escherichia coli Nisssle 1917 and Enterobacter cloacae ATCC13047 [55]. In addition, a reductase, methionine sulphoxide reductase A, was suggested to be responsible for this reduction [55]. These enzymes and reduction mechanism are studied in Chapter
127 To identify the myrosinase of E. coli FI10944, buffer conditions for myrosinase activity were optimised and optimum ph for myrosinase activity against sinigrin was found to be ph 5.0. This is different from the ph optima of C. WYE1 myrosinase (ph 6.0) [118] and Brevicoryne brassicae aphid myrosinase (ph 5.5) [132] for sinigrin degradation. Two attempts were performed to identify myrosinase of E. coli FI10944 by FPLC. When crude protein extract of E. coli FI10944 was prepared and fractionated by chromatography, no β-glucosidases were identified in the fractions. In the second attempt, predicted cytoplasmic α-amylase and periplasmic trehalase were identified in the purified fraction. Cytoplasmic α-amylase and periplasmic trehalase are enzymes to break down α-bonds in polysaccharides. However, glucosinolates are β-thioglycosides so it is unlikely that cytoplasmic α-amylase and periplasmic trehalase might be involved in glucosinolate metabolism. So far, it was not possible to identify the myrosinase by chromatography. Our results suggested that myrosinase activity in CFE of E. coli FI10944 is not inducible. While myrosinase activity in CFE of C. freundii was slightly induced by sinigrin and CFEs of C. freundii showed myrosinase activity. It will be worth trying to grow C. freundii in M9 minimal media with sinigrin as sole carbon source then purify by chromatography as performed for C. WYE1 by Albaser et al. (2016)[118]. Heterologous expression approach was also used to identify the bacterial myrosinase of the human gut bacteria. It was challenging to select the glucosidases to clone. The bacteria studied have many glucosidases and our selection was based on similarity to identified myrosinases. As all identified and characterised myrosinases were from GH1 family so far the selection of genes to clone was based on glucosidases from GH1 family in first place. However, the identification of first bacterial myrosinase, C. WYE1 myrosinase [118], changed the perspective in this study. This myrosinase belongs to GH3 family so made us to look for glucosidases from other families such as GH3. Four genes from E. casseliflavus CP1 and E. coli FI10944 were successfully cloned and expressed and 2 of the proteins (ecg4 and ecg39) expressed were determined to have β-glucosidase activity against p-npg but they showed no myrosinase activity. These proteins might need some cofactors and conditions for myrosinase activity that were not investigated in this study. Two other proteins (ecg44 and ecolg3) did not show any enzyme activity. This might be because of misfolding of proteins or the proteins might need some cofactors. The optimum temperature for protein expression induction in E. coli BL21(DE3) cells encoding pet28b-ecolg3 was found to be 37 C. However, lowering 109
128 induction temperature could be tried to overcome misfolding risk. As ecolg3 from E. coli FI10944 is a periplasmic β-glucosidase, it might also need its natural environment for proper folding [239]. Moreover, there are many β-glucosidases in E. casseliflavus CP1 (3 out of 40 putative β-glucosidases were cloned) and E. coli FI10944 (1 out of 5 putative β-glucosidases were cloned) which have not been studied. Three 6-phospho-β-glucosidases encoded by the genes bgia and ascb (GH1) and chbf (GH4) in E. coli O157:H7 were examined for their effect on myrosinase activity of E. coli O157:H7 by Cordeiro et al. (2015). It was suggested that 6- phospho-β-glucosidase encoded by the ascb gene is associated with sinigrin degradation in E. coli O157:H7 [240]. Despite its low sequence identity with C. WYE1 myrosinase, 6-phospho-βglucosidase encoded by ascb gene in E. coli FI10944 could be cloned and expressed. The glucosinolate metabolism in the human gut is not just covered by myrosinases. The role of methionine sulphoxide reductases will be discussed in the Chapter 4 in detail. In addition, sulfatases that are responsible for transforming glucosinolates into desulfo-glucosinolates are also important. Sulfatase of E. coli VL8 was cloned and expressed in E. coli by Luang-In et al. (2013) and the enzyme was found to be active against glucosinolates [137]. Our study did not focus on sulfatases because they were already characterised. A recent study reported that L. agilis R16, E. casseliflavus CP1 and E. coli VL8 could degrade desulfo-glucosinolates and gave only nitriles not ITCs as products [57]. As two of the recombinant proteins of E. casseliflavus CP1 (ecg4, ecg39) were active and showed β-glucosidase activity against p-npg, these proteins might be checked for their activity against desulfo-glucosinolates. The GC-MS method was set up for detection of nitriles but this was yet to be checked. If this degradation is possible then it will reveal another mechanism for degradation of glucosinolates by gut bacteria. This mechanism may include sulfatase activity followed by β-glucosidase activity to produce nitriles as products of glucosinolate degradation. Many other possible mechanisms including the importance of phosphorylation of 6-OH group of glucosinolates are suggested in the literature [137, 138]. As glucosinolates are β-thioglucosides, it was suggested that phosphorylation of glucosinolates by β-glucoside kinase before the action of myrosinase might be important for recognition of glucosinolate structure [137]. However, this hypothesis has not been tested so far. In summary, our attempt to purify bacterial myrosinase from human gut by cloning and chromatography approaches could not succeed in identification of the myrosinase. However, the data accomplished in this study can be inspiring for future studies. Two β-glucosidases of 110
129 E. casseliflavus CP1 were successfully cloned, expressed and found to have β-glucosidase activity. These two β-glucosidases might have activity against desulfo-glucosinolates. E. coli FI10944 and C. freundii FC50 were identified with myrosinase activity and their myrosinase activity was not cell wall-associated. 111
130 CHAPTER FOUR 4 BACTERIAL REDUCTASES FROM HUMAN GUT BACTERIA INVOLVED IN GLUCOSINOLATE METABOLISM 112
131 4.1 INTRODUCTION Methionine residues in proteins can be oxidised to methionine sulphoxides (MetSO) and this process can damage the biological function of the proteins (Figure 4.1). As methionine is very susceptible to oxidation by reactive oxygen species and nitrogen species, organisms are evolved to deal with this oxidative damage [152]. Oxidation of methionine to MetSO is reversible and MetSO can be reduced back to methionine by separate enzyme systems [155]. Figure 4.1 Structures of methionine and its oxidation product methionine sulphoxide Adapted from [152]. Methionine sulphoxide reductases (Msr) are the enzymes that catalyse the reduction of these sulphoxides and repair the enzyme function in many organisms [241]. These enzymes were also reported to show specificity for a range of S-stereomers of compounds like N-acetylmethionine-S-sulphoxide and S-sulindac [242]. Main Msr enzymes include methionine sulphoxide reductase A (MsrA) and methionine sulphoxide reductase B (MsrB), that are responsible for reduction of S-epimers and R-epimers of MetSO respectively in free or protein bound MetSO. Another class of Msr can only reduce free MetSO not protein bound MetSO, and are called as free methionine sulphoxide reductases (fmsr). If they act on R-epimers of free MetSO then they are called as frmsr. These various Msr enzymes can reduce different stereoisomers of MetSO. In addition, they were suggested to be responsible for the reduction of methylsulfinylalkyl glucosinolates like glucoraphanin and glucoiberin to methylthioalkyl glucosinolates like glucoerucin and glucoiberverin. 113
132 The reduction of methylsulfinylalkyl glucosinolates (such as glucoraphanin) is important in glucosinolate metabolism. This removes sulphoxide group of methylsulfinylalkyl glucosinolates and enables the myrosinase to act on the resulting product. A study reported the conversion of glucoraphanin to its reduced counterpart (glucoerucin) by human gut microbiota in a fermentation batch model using faecal inoculum and this conversion did not occur in heat-sterilised samples. Therefore, it was suggested that reductase activity was enzymatic [165]. This reductase activity was reported to be inducible in cell-free extracts (CFE) of E. coli VL8 by glucoraphanin or gluconasturtiin. It was suggested that the induction was triggered by the glucosinolate core rather than methylsulfinyl structure. The reductase activity in CFEs E. coli VL8 was found to be Mg +2 and NADPH dependent and oxygen independent [56]. In the literature, MsrA was suggested to be responsible for reduction of methylsulfinyl glucosinolates by Escherichia coli Nisssle 1917 and Enterobacter cloacae ATCC However, the effect MsrA on methylsulfinyl glucosinolates is yet to be identified. In addition, the effect of different Msr enzymes on methylsulfinyl glucosinolates needs further investigation. This chapter focused on identifying the enzymes that are responsible for reduction of methylsulfinyl glucosinolates. To achieve this, 8 putative msr genes from L. agilis R16, E. coli FC44 and E. coli VL8 were cloned with a 6X His-tag using a pet15b cloning vector and expressed in E. coli BL21 (DE3). The cloned genes were then induced with IPTG for protein expression and their activity was assessed. 4.2 HYPOTHESIS Methionine sulphoxide reductases are responsible for reduction of methylsulfinyl glucosinolates (such as glucoraphanin) to their reduced counterparts (such as glucoerucin). The role of these enzymes in the reduction of glucosinolates can be identified using molecular biology techniques. 4.3 METHODS Testing Reductase Activity of Human Gut Bacteria E. coli VL8 was obtained using a sinigrin enrichment method from Luang-In et al. (2014) [56] and E. coli FC44 was isolated using a glucoraphanin enrichment (Chapter 2-section 2.1.3) method in this study. E. coli VL8 was tested for its ability to reduce glucoraphanin to 114
133 glucoerucin. E. coli VL8 was grown in Nutrient Broth with 1 mm glucoraphanin anaerobically for 16 h at 37 C. The cultures (n=3) were centrifuged at x g for 15 min at 4 C. Supernatants were removed and filtered through 0.2 µm PVDF HPLC filters (Avonchem). HPLC samples were prepared from these supernatants (200 µl used) and analysed as described in Chapter 2-section to determine the reduction of glucoraphanin to glucoerucin. CFEs of E. coli VL8 and E. coli FC44 were examined to see if reduction of glucosinolates is inducible by glucosinolates. The cells were cultured in 1 ml of Nutrient Broth with 1 mm glucoraphanin (for glucoraphanin induced samples) or without (for uninduced samples). These cultures were incubated at 37 C anaerobically for 24 h then the cultures were centrifuged at 4000 x g for 15 min at 4 C. Supernatants were removed, pellets were washed with 0.1 M citrate phosphate buffer ph 7.0 to remove any traces of glucosinolate, isothiocyanate or nitrile products. The washed pellets were resuspended in 0.1 M citrate phosphate buffer ph 7.0 with 100X protease inhibitor cocktails (Melford). Sonication was used to prepare CFEs of E. coli VL8 and E. coli FC44 (Method is in Chapter 2-section 2.3.1). These CFEs were used in assays to test reduction of glucoraphanin. The activity was tested using similar conditions that were reported previously to be optimum for reductase activity of E. coli VL8 [56]. The reaction mixture (1 ml) contained 300 µl of CFE, 0.25 mm glucoraphanin in 0.1 M citrate phosphate buffer ph 7.0 (n=3). Glucoraphanin controls which contain only 0.25 mm glucoraphanin in 0.1 M citrate phosphate buffer ph 7.0 were also included. These reactions were anaerobically incubated for 16 h at 37 C. After incubation, samples were centrifuged at x g for 15 min at 4 C. Supernatants were removed and filtered through 0.2 µm PVDF HPLC filters. Samples were prepared using 200 µl of the supernatants and subjected to HPLC as described in Chapter 2-section Identification of Reductase Genes to Clone and Express The genomes of L. agilis R16, E. coli FC44 and E. coli VL8 were sequenced, assembled and annotated as described in Chapter 2-section The genomes were interrogated for methionine sulphoxide reductase genes. All of the Msr genes in L. agilis R16, E. coli FC44 and E. coli VL8 were selected to identify the responsible enzyme group of Msr for glucosinolate reduction. 115
134 4.3.3 Cloning and Expression of Reductases The 3 msra genes of L. agilis R16 were cloned in first place. The primers introducing new restriction sites were designed to amplify the candidate genes and are listed in Table 4.1. The nucleotide sequences of the cloned genes are shown in the Appendix 2. PCR was performed using High Fidelity Phusion Polymerase (Finnnzymes) as described in Chapter 2-section Gel electrophoresis (Method is in Chapter 2-section 2.2.2) was used to analyse the PCR gene products (Table 4.2). PCR conditions and expected product sizes are given in Table 4.2. Name Primer Sequence (5-3 ) Restriction Site MSRA1-LBAG-F ATTCATATGACAGAGACTGCAATATT NdeI MSRA1-LBAG-R AATCGGATCCATTTTCAACGCTTAA Bam HI MSRA2-LBAG_F ATTCATATGGAAACAGCAATTTTTG NdeI MSRA2-LBAG-R CAACTCGAGCTTAGTCCACTTTAGGTG XhoI MSRA3-LBAG-F GACCATATGAAAACAAAACCTGAAG NdeI MSRA3-LBAG-R AAGTCTCGAGTTGTGACTGAACCGC XhoI MSRB-LBAG-F GATACATATGGATAAACAGCAAGG NdeI MSRB-LBAG-R ATTCCTCGAGTTTATTAACTCAATTATTTA XhoI frmsr-lbag-f TTTCATATGGCTACCACGGAA NdeI frmsr-lbag-r TGTTCTCGAGCTTACCCACTC XhoI frmsr-fc44-f CATCATATGCTTATTTTAATAGGCTG NdeI frmsr-fc44-r TAAGGATCCTATCAGTAAATGCTACGTT Bam HI MsrA-VL8-F CGACCATATGAGTTTATTTGATAAAAAG NdeI MsrA-VL8-R TTTGGATCCGTAACGCTATGCT Bam HI MsrB-VL8-F TGAGCATATGGCTAATAAACCTTC NdeI MsrB-VL8-R CATGCTCGAGATAATGTCATCAAGATTC XhoI Table 4.1 Primers used in the PCR experiments to amplify the candidate msr genes. The restriction sites are underlined. The altered nucleotides to introduce the restriction sites are in bold. 116
135 Name T A, time, cycles T E, time Product size MSRA1-LBAG-F MSRA1-LBAG-R MSRA2-LBAG-F MSRA2-LBAG-R MSRA3-LBAG-F MSRA3-LBAG-R MSRB-LBAG-F MSRB-LBAG-R frmsr-lbag-f frmsr-lbag-r frmsr-fc44-f frmsr-fc44-r MsrA-VL8-F MsrA-VL8-R MsrB-VL8-F MsrB-VL8-R 54 C, 30 s, 5X 64 C, 30 s, 20X 54 C, 30 s, 5X 67 C, 30 s, 20X 55 C, 30 s, 5X 67 C, 30 s, 20X 49 C, 30 s, 5X 64 C, 30 s, 20X 52 C, 30 s, 5X 67 C, 30 s, 20X 52 C, 30 s, 5X 64 C, 30 s, 20X 58 C, 30 s, 5X 66 C, 30 s, 20X 49 C, 30 s, 5X 65 C, 30 s, 20X 72 C, 15 s 72 C, 15 s 72 C, 30 s 72 C, 15 s 72 C, 15 s 72 C, 20 s 72 C, 20 s 72 C, 20 s 559 bp 547 bp 839 bp 462 bp 538 bp 595 bp 661 bp 492 bp Table 4.2 Conditions used in the PCR experiments to amplify the candidate msr genes. T A; annealing temperature, cycles; number of cycles used in annealing step of PCR. T E; extension temperature and time used in PCR, Product size; the expected PCR product sizes for msr genes. The annealing step was performed using T m of 100% sequence match part of primers first (5X) and then using the T m of entire primer (20X). 117
136 Restricted PCR gene products were ligated to double digested pet15b vectors. The recombinant plasmids (Table 4.3) were transformed into E. coli Top10 competent cells (Thermo-Fischer Scientific) for msra1, msra2, msra3 and into E. coli DH5α chemically competent cells (homemade, See Chapter 2-section 2.2.9) for the rest. Then cells were plated on L agar with ampicillin plates (100 µg /ml final concentration). Colonies were screened by colony PCR using primers T7P2 (5 -TGAGCGGATAACAATTCCC-3 ) and T7T (5 - GCTAGTTATTGCTCAGCGG-3 ) as described in Chapter 2-section The clones that gave positive result for PCR were selected for plasmid purification. The recombinant plasmids were purified using EZNA Plasmid Mini Kit II (Omega Bio-Tek) and sequenced using T7P2 and T7T primers. Depending on the sequencing results, one of the positive transformants without any mutation was selected and transformed into E. coli BL21(DE3) for protein expression studies. Protein expression in E. coli BL21(DE3) encoding msr genes was induced with IPTG at a final concentration of 0.5 mm. For E. coli BL21(DE3) expressing pet15b-lbag_msra1, pet15b- LBAG_msrA2 pet15b-lbag_msra3, inductions were carried out for 4 h at 37 C or 24 h at 25 C, shaking at 250 rpm. For the rest, protein expressions were held at 25 C for 4 h and 37 C for 3 h or 4 h to determine optimum conditions. Control cultures with E. coli BL21(DE3) pet15b grown in presence of 0.5 mm IPTG (empty vector controls) and control cultures of E. coli BL21(DE3) expressing the cloned genes grown without 0.5 mm IPTG (uninduced cultures) were also included. Plasmid Relevant Characteristics pet15b-lbag_msra1 msra1 gene insert from L. agilis R16 ligated to pet15b pet15b-lbag_msra2 msra2 gene insert from L. agilis R16 ligated to pet15b pet15b-lbag_msra3 msra3 gene insert from L. agilis R16 ligated to pet15b pet15b-lbag_msrb msrb gene insert from L. agilis R16 ligated to pet15b pet15b-lbag_frmsr frmsr gene insert from L. agilis R16 ligated to pet15b pet15b-fc44_frmsr frmsr gene insert from E. coli FC44 ligated to pet15b pet15b-vl8_msra msra gene insert from E. coli VL8 ligated to pet15b pet15b-vl8_msrb msrb gene insert from E. coli VL8 ligated to pet15b Table 4.3 Plasmids used and generated in this study. 118
137 4.3.4 Protein Extraction by Bugbuster Bugbuster protein extraction reagent (Novagen) was used to extract proteins according to supplier s advice. To extract the soluble fraction, E. coli cells were harvested from culture by centrifugation using a preweighed tube at 3220 x g for 15 min at 4 C. The supernatant was removed and pellet was allowed to drain, the wet pellet was weighed and frozen at -20 C overnight. Next day, the frozen cell pellet was resuspended at room temperature by pipetting or gentle vortexing (5 ml of Bugbuster per gram of wet cell paste). The suspension was incubated on a shaking platform slowly for 10 min at room temperature. Then the sample was centrifuged at 13,000 x g for 20 min at 4 C. The supernatant was transferred to a fresh tube as soluble extract. To purify inclusion bodies, the pellet was resuspended in the same volume of Bugbuster HT with a final concentration of 200 µg/ml lysozyme. The suspension was vortexed and incubated at room temperature for 5 min then 6 volumes of 1/10 diluted Bugbuster HT in deionized water was added to the suspension and vortexed for 1 min. The suspension was centrifuged at x g for 15 min at 4 C and the supernatant was removed. The inclusion bodies were suspended in ½ of the original culture volume of 1/10 diluted Bugbuster HT, mixed by vortexing and centrifuged at 3220 x g for 5 min at 4 C. This step was repeated for 2 more times. The final pellet was dissolved in 20 mm Tris-HCI 50 mm NaCI buffer ph Purification of Recombinant Proteins After protein expression induction, the cells were centrifuged at 3220 x g for 15 min at 4 C. The cell paste was used to prepare CFE. The CFEs were prepared by sonication as described in Chapter 2-section and run on a SDS-PAGE gel (denaturing, reducing conditions) including negative controls too. The CFEs were checked for the presence of 6XHis-tag by Western Blot (Chapter 2-section 2.3.4) and partially purified by Ni-NTA column as described in Chapter 2-section After Ni-NTA purification, proteins were dialysed overnight to remove excessive amount of imidazole. The proteins were dialysed in Spectra/Por porous membrane tubing with Da cut off (Spectrum Labs). The membrane tubing was soaked in MQ water for 30 min in advance and rinsed with MQ water before use. The dialysis was performed in an appropriate amount of buffer (at least 100X bigger in volume of protein volume) for 18 h at 4 C. The buffer used in dialysis was 25 mm Tris-HCI buffer ph 7.5 for LBAG_MsrA1, LBAG_MsrA2 and LBAG_MsrA3. The dialysis of LBAG-MsrB and VL8_MsrB was carried out using 0.1 M citrate 119
138 phosphate buffer ph 7.0. The proteins were removed from the tubing and transferred into new clean tubes. Quantification of protein amounts was performed by Bradford assay as described in Chapter 2-section Testing Reductase Activity of Proteins To test glucoraphanin reduction by CFEs or Ni-NTA column purified proteins, reactions were set up under different conditions. The optimum conditions reported for reductase activity of E. coli VL8 [56] and the studies about Msr [150, 243] were taken into account and the methods were adapted from these studies. Ni-NTA purified and dialysed (in 25 mm Tris-HCI buffer ph 7.5) eluates of LBAG_MsrA1 and LBAG_MsrA2 were used to determine reductase activity in the presence of NADPH or dithiothreitol (DTT). For DTT, the reactions contained 25 mm Tris-HCI ph 7.5, 20 mm DTT, 1 mm glucoraphanin and 10 µg of eluates with or without 10 mm MgCI 2 and incubated for 30 min at 37 C. In addition, the effect of increasing the protein amount to 50 µg and incubation time to 1, 2 and 3 h were also tested using Ni-NTA purified MsrA1. For NADPH, the reactions were set up in 200 µl consisting 1 mm MgCI 2, 1 mm NADPH, 0.25 mm glucoraphanin in 0.1 M citrate phosphate buffer ph 7.0 and 10 µg of protein was used in the assays. A glucoraphanin control was set up as samples excluding protein. The reactions were incubated for 16 h at 37 C aerobically. CFEs of E. coli BL21 (DE3) expressing pet15b vector (empty vector control), pet15b- LBAG_msrB, pet15b-lbag_frmsr, pet15b-fc44_frmsr, pet15b-vl8_msra and pet15b- VL8_msrB were prepared using 50 mm Na phosphate buffer ph 7.5 by sonication (Chapter 2- section 2.3.1), quantified by Bradford assay (Chapter 2-section 2.3.2) and tested for glucoraphanin reducing ability. Briefly, a 200 µl reaction mixture contained a buffer of 50 mm Na phosphate buffer ph 7.5, 50 mm NaCI, 20 mm DTT, 0.5 mm glucoraphanin and 100 µg of protein. Two controls, control 1 excluding protein and control 2 excluding protein and DTT, were set up as samples. Samples and controls were incubated for 16 h at 37 C aerobically. To test the reductase activity of purified, dialysed (in 0.1 M citrate phosphate buffer ph 7.0) eluates of LBAG_MsrB and VL8_MsrB, the reactions were set up under two different conditions. First, the reactions were set up in 0.1 M citrate phosphate buffer ph 7.0 with 10 mm MgCI 2, 1 mm NADPH and 0.5 mm glucoraphanin. Second, the activity was tested in 50 mm Na phosphate buffer ph 7.5 with 50 mm NaCI, 20 mm DTT, 0.5 mm glucoraphanin. The 120
139 reactions were both set up in a total volume of 200 µl and 10 µg of protein eluates were used. Glucoraphanin controls were set up as samples excluding proteins. The samples and controls were incubated at 37 C for 16 h aerobically. After each incubation period, 400 µl of acetonitrile was added to stop the reaction. Samples and controls were filtered through 0.2 µm PVDF HPLC filters. Finally, all these reactions were used in sample preparation for HPLC and samples were run on HPLC as described in Chapter 2-section to determine reduction of glucoraphanin to glucoerucin. 4.4 RESULTS Reductase Activity of Human Gut Bacteria Previously, E. coli VL8 was found to reduce glucoraphanin to glucoerucin by Luang-In et al. (2013) [56]. In this study, we examined the reductase activity of E. coli VL8 and E. coli FC44 to transform glucoraphanin to its reduced counterpart glucoerucin. E. coli VL8 was able to reduce glucoraphanin in Nutrient media after 16 h incubation and it consumed 40.9 ± 1.5% of the glucoraphanin. However, the glucoerucin formation did not match to the glucoraphanin consumption by cells. The glucoerucin amount was only 1.1 ± 0.2% of the original glucoraphanin amount added to the media. As reduction would produce one glucoerucin molecule for one glucoraphanin molecule, the depletion of glucoerucin might be explained by further metabolism of glucoerucin by myrosinase of E. coli VL8 during 16 h incubation period. Identification of these degradation products was not performed in this study. E. coli FC44 is a gut bacterium isolated during this study using a glucoraphanin enrichment method as described in Chapter 2-section During this screening, E. coli FC44 was found to produce glucoerucin so it was also included in reductase activity assays (Figure 4.2). CFEs of E. coli VL8 and E. coli FC44 were prepared by sonication. Cultures with glucoraphanin (induced) and without glucoraphanin (uninduced) were used for CFE preparation to test if there is an inducible reductase activity in these strains. The reduction rates were based on glucoerucin formation and the results are given in Table 4.4. Induced and uninduced CFEs of E. coli VL8 showed glucoraphanin reduction at a rate of 1.15 ± 0.20 nmol glucoerucin/µg protein and 0.89 ± 0.05 nmol glucoerucin/µg protein respectively. There was no significant difference for reduction rate of induced or uninduced CFEs of E. coli VL8 (p=0.10, two sample two tailed t-test). Glucoraphanin reduction rates were 1.75 ± 0.32 nmol glucoerucin/µg 121
, suggesting that reductase activity is constitutive. Figure 4.")
140 protein for induced and 2.01 ± 0.09 nmol glucoerucin/µg protein for uninduced CFEs of E. coli FC44 respectively. CFEs of E. coli FC44 were found to be more efficient in reducing glucoraphanin to glucoerucin. No significant difference was found between induced or uninduced CFEs of E. coli FC44 (p=0.26, two sample two tailed t-test), suggesting that reductase activity is constitutive. Figure 4.2 HPLC chromatogram showing reduction of glucoraphanin to glucoerucin by E. coli FC44. 1; glucoraphanin, 2; sinigrin (internal standard), 3; glucoerucin. CFEs Reduction rate (nmol glucoerucin formed/µg protein) Induced CFE of E. coli VL ± 0.20 Uninduced CFE of E. coli VL ± 0.05 Induced CFE of E. coli FC ± 0.32 Uninduced CFE of E. coli FC ± 0.09 Table 4.4 The reduction of glucoraphanin to glucoerucin by glucoraphanin-induced and uninduced CFEs of E. coli VL8 and E. coli FC44. The results are given as mean of triplicates ± SD Identification of Putative Sulphoxide Reductases The study started with cloning and expression of putative msra genes of L. agilis R16. Three putative methionine sulphoxide reductase A (msra), one methionine sulphoxide reductase B 122
141 (msrb) and one free methionine-r-sulphoxide reductase (frmsr) were identified in the genome of L. agilis R16. However, E. coli FC44 and E. coli VL8 only have single copies of each msr genes. E. coli FC44 and E. coli VL8 share the same msra nucleotide sequence. There are a few nucleotide differences between msrb nucleotide sequences of E. coli FC44 and E. coli VL8 but they share the same amino acid sequence for MsrB. E. coli FC44 and E. coli VL8 frmsr also share same amino acid sequence except two amino acid residues, so only frmsr in E. coli FC44 was selected for cloning. Amino acid sequences of MsrA, MsrB and frmsr from the Uniprot database were aligned with MsrA (Figure 4.3), MsrB (Figure 4.4) and frmsr (Figure 4.5) of L. agilis R16, E. coli FC44 and E. coli VL8 using Clustal Omega [237]. Moskovitz et. al. (2000) reported the presence of a shared amino acid sequence among MsrAs (GCFWG). Site-directed substitution of each amino acid residue in this conserved sequence was found to destroy enzyme activity. However, mutation of Gly residues was reported to result in a partial enzyme activity loss [243]. E. coli VL8 and E. coli FC44 have this conserved sequence (GCFWG) in their MsrA but L. agilis R16 only shares the GCFW part (Shown in Figure 4.3). Hydrogen bond interactions between Glu 94, Tyr 82 and Tyr 134 in MsrA of E. coli to stabilise the oxygen of the sulphoxide was reported by Antonie et al. (2006) [149] and Glu 94 was proposed to be an acid/base catalyst [244]. These residues were conserved in MsrA of E. coli VL8 and E. coli FC44 at positions 95, 83 and 135 respectively (Figure 4.3). In addition the role of Cys 51 as the nucleophile was reported [244] and this residue is conserved at position 52 (GCFWG sequence) in E. coli FC44 and E. coli VL8 (Figure 4.3). Some bacteria, like Neisseria gonorrhoeae, have a fused form of MsrA with MsrB, named as MsrAB [151]. MsrAB was not found in the bacteria we studied but MsrAB of Neisseria gonorrhoeae was also included in the multiple alignments to see the difference among different types of MsrA. In summary, MsrA of E. coli VL8 and 3 MsrAs of L. agilis R16 were selected for cloning. 123
142 * 20 * 40 * MSRA_MYCTU : ~~~~~~~~~~~~~~~~~~~~~~~~~~~~~~~~~~~~~~~~~~~~~~~~~~ : - MSRA3_LBAG : ~~~~~~~~~~~~~~~~~~~~~~~~~~~~~~~~~~~~~~~~~~~~~~~~~~ : - MSRA1_LBAG : ~~~~~~~~~~~~~~~~~~~~~~~~~~~~~~~~~~~~~~~~~~~~~~~~~~ : - MSRA2_LBAG : ~~~~~~~~~~~~~~~~~~~~~~~~~~~~~~~~~~~~~~~~~~~~~~~~~~ : - MSRAB_NEIG : MKHRTFFSLCAKFGCLLALGACSPKIVDAGTATVPHTLSTLKTADNRPAS : 50 MSRA2_ARAT : ~~~~~~~~~~~~~~~~~~~~~~~~~~~~~~~~~~~~~~~~~~~~~~~~~~ : - MSRA_ECO12 : ~~~~~~~~~~~~~~~~~~~~~~~~~~~~~~~~~~~~~~~~~~~~~~~~~~ : - MSRA_FC44 : ~~~~~~~~~~~~~~~~~~~~~~~~~~~~~~~~~~~~~~~~~~~~~~~~~~ : - MSRA_VL8 : ~~~~~~~~~~~~~~~~~~~~~~~~~~~~~~~~~~~~~~~~~~~~~~~~~~ : - MSRA_MOUSE : ~~~~~~~~~~~~~~~~~~~~~~~~~~~~~~~~~~~~~~~~~~~~~~~~~~ : - MSRA_HUMAN : ~~~~~~~~~~~~~~~~~~~~~~~~~~~~~~~~~~~~~~~~~~~~~~~~~~ : - MSRA_BOVIN : ~~~~~~~~~~~~~~~~~~~~~~~~~~~~~~~~~~~~~~~~~~~~~~~~~~ : - 60 * 80 * 100 MSRA_MYCTU : ~~~~~~~~~~~~~~~~~~~~~~~~~~~~~~~~~~~~~~~~~~~~~~~~~~ : - MSRA3_LBAG : ~~~~~~~~~~~~~~~~~~~~~~~~~~~~~~~~~~~~~~~~~~~~~~~~~~ : - MSRA1_LBAG : ~~~~~~~~~~~~~~~~~~~~~~~~~~~~~~~~~~~~~~~~~~~~~~~~~~ : - MSRA2_LBAG : ~~~~~~~~~~~~~~~~~~~~~~~~~~~~~~~~~~~~~~~~~~~~~~~~~~ : - MSRAB_NEIG : VYLKKDKPTLIKFWASWCPLCLSELGQAEKWAQDAKFSSANLITVASPGF : 100 MSRA2_ARAT : ~~~~~~~~~~~~~~~~~~~~~~~~~~~~~~~~~~~~~~~~~~~~~~~~~~ : - MSRA_ECO12 : ~~~~~~~~~~~~~~~~~~~~~~~~~~~~~~~~~~~~~~~~~~~~~~~~~~ : - MSRA_FC44 : ~~~~~~~~~~~~~~~~~~~~~~~~~~~~~~~~~~~~~~~~~~~~~~~~~~ : - MSRA_VL8 : ~~~~~~~~~~~~~~~~~~~~~~~~~~~~~~~~~~~~~~~~~~~~~~~~~~ : - MSRA_MOUSE : ~~~~~~~~~~~~~~~~~~~~~~~~~~~~~~~~~~~~~~~~~~~~~~~~~~ : - MSRA_HUMAN : ~~~~~~~~~~~~~~~~~~~~~~~~~~~~~~~~~~~~~~~~~~~~~~~~~~ : - MSRA_BOVIN : ~~~~~~~~~~~~~~~~~~~~~~~~~~~~~~~~~~~~~~~~~~~~~~~~~~ : - * 120 * 140 * MSRA_MYCTU : ~~~~~~~~~~~~~~~~~~~~~~~~~~~~~~~~~~~~~~~~~~~~~~~~~~ : - MSRA3_LBAG : MKTKPEALMRDLYNLIINP------A-TRDWERHLLVQAKNNRQQLSPTG : 43 MSRA1_LBAG : ~~~~~~~~~~~~~~~~~~~~~~~~~~~~~~~~~~~~~~~~~~~~~~~~~~ : - MSRA2_LBAG : ~~~~~~~~~~~~~~~~~~~~~~~~~~~~~~~~~~~~~~~~~~~~~~~~~~ : - MSRAB_NEIG : LHEKKDGEFQKWYAGLNYPKLPVVTDNGGTIAQNLNISVYPSWALIGKDG : 150 MSRA2_ARAT : ~~~~~~~~~~~~~~~~~~~~~~MDS SL : 5 MSRA_ECO12 : ~~~~~~~~~~~~~~~~~~~~~~~~~~~~~~~~~~~~MS L : 3 MSRA_FC44 : ~~~~~~~~~~~~~~~~~~~~~~~~~~~~~~~~~~~~MS L : 3 MSRA_VL8 : ~~~~~~~~~~~~~~~~~~~~~~~~~~~~~~~~~~~~MS L : 3 MSRA_MOUSE : ~~~~~~~~~~~~~~~~~~~~~~MLSASRRAL--QLLSSANPVR----RMG : 22 MSRA_HUMAN : ~~~~~~~~~~~~~~~~~~~~~~MLSATRRACQLLLLHSLFPVP----RMG : 24 MSRA_BOVIN : ~~~~~~~~~~~~~~~~~~~~~~MLSATRRAL--QLFHSLFPIP----RMG : 22 Figure 4.3 Multiple alignments of Recombinant MsrA proteins with other MsrAs from different organisms. The abbreviations used for MsrA from: MYCTU (P9WJM5); Mycobacterium tuberculosis, LBAG; L. agilis R16, NEIG (P14930); Neisseria gonorrhoeae, ARAT (Q9LY15); Arabidopsis thaliana, ECO12 (P0A744); E. coli strain K12, FC44; E. coli FC44, VL8; E. coli VL8, MOUSE (Q9D6Y7); Mus musculus, HUMAN (Q9UJ68); Homo sapiens, BOVIN (P54149); Bos taurus. The default settings were used for Clustal Omega. Amino acid sequences were obtained from Uniprot database and the entry numbers of sequences are given in brackets. The GCFWG sequence is shown and highlighted in red. Glu 95 (E) and Cys 52 (C) residues in E. coli VL8 and E. coli FC44 are highlighted in yellow. Tyr 83 (Y) and Tyr 135 (Y) residues in E. coli VL8 and E. coli FC44 are highlighted in pink. 124
143 160 * 180 * 200 MSRA_MYCTU : ~~~~~~~~~~~~~~~~~~~~~~~~~~~~~~~~~~~~~~~~~~~~~~~~~~ : - MSRA3_LBAG : QL----KQIEADLRPLAMRNNLTPDVM----DFYLAITGNAPMPTKNNVS : 85 MSRA1_LBAG : ~~~~~~~~~~~~~~~~~~~~~~~~~~~~~~~~~~~~~~~~~~~~~~~~~~ : - MSRA2_LBAG : ~~~~~~~~~~~~~~~~~~~~~~~~~~~~~~~~~~~~~~~~~~~~~~~~~~ : - MSRAB_NEIG : DVQRIVKGSINEAQALALIRNPNADLGSLKHSFYKPDTQK : 190 MSRA2_ARAT : KTQE---PQVVETSPSPVAQEP-PQVADKPAIVPSPIAQEP : 42 MSRA_ECO12 : FDKK---HLVSPADALPGRNTP-MPVATLHA-----VNGHS : 35 MSRA_FC44 : FDKK---HLVSPADALPGRNTP-MPVATLHA-----VNGHS : 35 MSRA_VL8 : FDKK---HLVSPADALPGRNTP-MPVATLHA-----VNGHS : 35 MSRA_MOUSE : DSAS---KVISAEEALPGRTEP-IPVTAKHH-----VSGNR : 54 MSRA_HUMAN : NSAS---NIVSPQEALPGRKEQ-TPVAAKHH-----VNGNR : 56 MSRA_BOVIN : DSAA---KIVSPQEALPGRKEP-LVVAAKHH-----VNGNR : 54 GCFWG Y-83 * 220 * 240 * MSRA_MYCTU : ~~~~~~MTSNQKAILAGGCFWGLQDLIRNQPGVVSTRVGYSGGNIPNATY : 44 MSRA3_LBAG : AYPTLSSPYEERAVFAGGCFWCMVEPFDQRPGINNVISGYTGGSWAQPTY : 135 MSRA1_LBAG : ~~~~~~~~MTETAIFAGGCFWCMVKPFDQQPGIKSVISGYTGGTVANPTY : 42 MSRA2_LBAG : ~~~~~~~~~METAIFAGGCFWCMVQPFDSQPGIDSVVSGYTGGHTKNPTY : 41 MSRAB_NEIG : --KDSAIMNTRTIYLAGGCFWGLEAYFQRIDGVVDAVSGYANGNTENPSY : 238 MSRA2_ARAT : -DNDVPAPGNEFAEFAAGCFWGVELAFQRIPGVTVTEVGYTHGISHNPSY : 91 MSRA_ECO12 : --MTNVPDGMEIAIFAMGCFWGVERLFWQLPGVYSTAAGYTGGYTPNPTY : 83 MSRA_FC44 : --MTNVPDGMEIAIFAMGCFWGVERLFWQLPGVYSTAAGYTGGYTPNPTY : 83 MSRA_VL8 : --MTNVPDGMEIAIFAMGCFWGVERLFWQLPGVYSTAAGYTGGYTPNPTY : 83 MSRA_MOUSE : -TVEPFPEGTQMAVFGMGCFWGAERKFWVLKGVYSTQVGFAGGHTRNPTY : 103 MSRA_HUMAN : -TVEPFPEGTQMAVFGMGCFWGAERKFWVLKGVYSTQVGFAGGYTSNPTY : 105 MSRA_BOVIN : -TVEPFPEGTQMAVFGMGCFWGAERKFWTLKGVYSTQVGFAGGYTPNPTY : 103 E * 280 * 300 MSRA_MYCTU : RNHG----THAEAVEIIFDPTVTDYRTLLEFFFQIHDPTTKDRQGNDRGT : 90 MSRA3_LBAG : EQVSGQYTGHVEAVEIRYDSRKISYQNLVDIYWQLIDPTDRFGQINDRGS : 185 MSRA1_LBAG : EQVASHTTGHTEAVKITFDPDVISYADLVEIYWRQTDPTDASGQFQDRGD : 92 MSRA2_LBAG : EDVKAHTTGHTEAVKITFDPDIISYTELINIYWHQTDPTDAMGQFQDRGD : 91 MSRAB_NEIG : EDVSYRHTGHAETVKVTYDADKLSLDDILQYYFRVVDPTSLNKQGNDTGT : 288 MSRA2_ARAT : EDVCTNTTNHAEVVRVQYDPKECTYETLLDLFWSRHNPTTLNRQGELLGA : 141 MSRA_ECO12 : REVCSGDTGHAEAVRIVYDPSVISYEQLLQVFWENHDPAQGMRQGNDHGT : 133 MSRA_FC44 : REVCSGDTGHAEAVRIVYDPSVISYEQLLQVFWENHDPAQGMRQGNDHGT : 133 MSRA_VL8 : REVCSGDTGHAEAVRIVYDPSVISYEQLLQVFWENHDPAQGMRQGNDHGT : 133 MSRA_MOUSE : KEVCSEKTGHAEVVRVVYRPEHISFEELLKVFWENHDPTQGMRQGNDFGT : 153 MSRA_HUMAN : KEVCSEKTGHAEVVRVVYQPEHMSFEELLKVFWENHDPTQGMRQGNDHGT : 155 MSRA_BOVIN : KEVCSGKTGHAEVVRVVFQPEHISFEELLKVFWENHDPTQGMRQGNDHGS : 153 Y-135 * 320 * 340 * MSRA_MYCTU : SYRSAIFYFDEQQKRIALDTIADVE---ASGLWPGKVVTEVSPAGDFWEA : 137 MSRA3_LBAG : QYRPVIFYANQHQLTIAQASKQALV---DSQRYQKPIVVAIEPLQQFWPA : 232 MSRA1_LBAG : SYRPVIFVNSEAQRRTATASRDALA---ASGKFAEPIVTTIEDAKPFYPA : 139 MSRA2_LBAG : NYRPVIFVNGPEQRRIAEASKRALQ---VSERFSKPIVTAIEDAKPFYPA : 138 MSRAB_NEIG : QYRSGVYYTDPAEKAVIAAALKREQQKY-----QLPLVVENEPLKNFYDA : 333 MSRA2_ARAT : QYRSGIYFYTPEQEKLARESLEKEQKKL-----EDKIVTEILPAKKFYKA : 186 MSRA_ECO12 : QYRSAIYPLTPEQDAAARASLERFQAAMLAADDDRHITTEIANATPFYYA : 183 MSRA_FC44 : QYRSAIYPLTPEQDAAARASLERFQAAMLAADDDRHITTEIANATPFYYA : 183 MSRA_VL8 : QYRSAIYPLTPEQDAAARASLERFQAAMLAADDDRHITTEIANATPFYYA : 183 MSRA_MOUSE : QYRSAVYPTSAVQMEAALRSKEEYQKV-LSKHNFGPITTDIREGQVFYYA : 202 MSRA_HUMAN : QYRSAIYPTSAKQMEAALSSKENYQKV-LSEHGFGPITTDIREGQTFYYA : 204 MSRA_BOVIN : QYRSAIYPTSAEHVGAALKSKEDYQKV-LSEHGFGLITTDIREGQTFYYA : 202 Figure 4.3-Continued 125
144 360 * 380 * 400 MSRA_MYCTU : EPEHQDYLQRYPNGYTC HFVRP-GWRL PRRTAE : 169 MSRA3_LBAG : ENYHQDFYRKQPRRYRQLKKAHDHYL----NWLK FKNKF~ : 267 MSRA1_LBAG : EAEHQDFYRRNPFRYQIEEMGGREAFIKQ-HWQ~~~~~~~~~~~~~~~~~ : 171 MSRA2_LBAG : EARHQRFYKNNPVVFAEQEAGGRADFIAE-QWAD APKVD~ : 176 MSRAB_NEIG : EEYHQDYLIKNPNGYCHIDIRKADEPLPGKTKAAPQGKGFDAATYKKPSD : 383 MSRA2_ARAT : EEYHQQYLVKGGMHGNAQ-SPAKSCKDPIRCYG~~~~~~~~~~~~~~~~~ : 218 MSRA_ECO12 : EDDHQQYLHKNPYGYCGIGGIGVCLPPEA~~~~~~~~~~~~~~~~~~~~~ : 212 MSRA_FC44 : EDDHQQYLHKNPYGYCGIGGIGVCLPPEA~~~~~~~~~~~~~~~~~~~~~ : 212 MSRA_VL8 : EDDHQQYLHKNPYGYCGIGGIGVCLPPEA~~~~~~~~~~~~~~~~~~~~~ : 212 MSRA_MOUSE : EDYHQQYLSKNPDGYCGLGGTGVSCPMAIKK~~~~~~~~~~~~~~~~~~~ : 233 MSRA_HUMAN : EDYHQQYLSKNPNGYCGLGGTGVSCPVGIKK~~~~~~~~~~~~~~~~~~~ : 235 MSRA_BOVIN : EDYHQQYLSKDPDGYCGLGGTGVSCPLGIKK~~~~~~~~~~~~~~~~~~~ : 233 * 420 * 440 * MSRA_MYCTU : SALRASLSPELGT~~~~~~~~~~~~~~~~~~~~~~~~~~~~~~~~~~~~~ : 182 MSRA3_LBAG : ~~~~~~~~~~~~~~~~~~~~~~~~~~~~~~~~~~~~~~~~~~~~~~~~~~ : - MSRA1_LBAG : ~~~~~~~~~~~~~~~~~~~~~~~~~~~~~~~~~~~~~~~~~~~~~~~~~~ : - MSRA2_LBAG : ~~~~~~~~~~~~~~~~~~~~~~~~~~~~~~~~~~~~~~~~~~~~~~~~~~ : - MSRAB_NEIG : AELKRTLTEEQYQVTQNSATEYAFSHEYDHLFKPGIYVDVVSGEPLFSSA : 433 MSRA2_ARAT : ~~~~~~~~~~~~~~~~~~~~~~~~~~~~~~~~~~~~~~~~~~~~~~~~~~ : - MSRA_ECO12 : ~~~~~~~~~~~~~~~~~~~~~~~~~~~~~~~~~~~~~~~~~~~~~~~~~~ : - MSRA_FC44 : ~~~~~~~~~~~~~~~~~~~~~~~~~~~~~~~~~~~~~~~~~~~~~~~~~~ : - MSRA_VL8 : ~~~~~~~~~~~~~~~~~~~~~~~~~~~~~~~~~~~~~~~~~~~~~~~~~~ : - MSRA_MOUSE : ~~~~~~~~~~~~~~~~~~~~~~~~~~~~~~~~~~~~~~~~~~~~~~~~~~ : - MSRA_HUMAN : ~~~~~~~~~~~~~~~~~~~~~~~~~~~~~~~~~~~~~~~~~~~~~~~~~~ : - MSRA_BOVIN : ~~~~~~~~~~~~~~~~~~~~~~~~~~~~~~~~~~~~~~~~~~~~~~~~~~ : * 480 * 500 MSRA_MYCTU : ~~~~~~~~~~~~~~~~~~~~~~~~~~~~~~~~~~~~~~~~~~~~~~~~~~ : - MSRA3_LBAG : ~~~~~~~~~~~~~~~~~~~~~~~~~~~~~~~~~~~~~~~~~~~~~~~~~~ : - MSRA1_LBAG : ~~~~~~~~~~~~~~~~~~~~~~~~~~~~~~~~~~~~~~~~~~~~~~~~~~ : - MSRA2_LBAG : ~~~~~~~~~~~~~~~~~~~~~~~~~~~~~~~~~~~~~~~~~~~~~~~~~~ : - MSRAB_NEIG : DKYDSGCGWPSFTRPIDAKSVTEHDDFSFNMRRTEVRSRAADSHLGHVFP : 483 MSRA2_ARAT : ~~~~~~~~~~~~~~~~~~~~~~~~~~~~~~~~~~~~~~~~~~~~~~~~~~ : - MSRA_ECO12 : ~~~~~~~~~~~~~~~~~~~~~~~~~~~~~~~~~~~~~~~~~~~~~~~~~~ : - MSRA_FC44 : ~~~~~~~~~~~~~~~~~~~~~~~~~~~~~~~~~~~~~~~~~~~~~~~~~~ : - MSRA_VL8 : ~~~~~~~~~~~~~~~~~~~~~~~~~~~~~~~~~~~~~~~~~~~~~~~~~~ : - MSRA_MOUSE : ~~~~~~~~~~~~~~~~~~~~~~~~~~~~~~~~~~~~~~~~~~~~~~~~~~ : - MSRA_HUMAN : ~~~~~~~~~~~~~~~~~~~~~~~~~~~~~~~~~~~~~~~~~~~~~~~~~~ : - MSRA_BOVIN : ~~~~~~~~~~~~~~~~~~~~~~~~~~~~~~~~~~~~~~~~~~~~~~~~~~ : - * 520 * MSRA_MYCTU : ~~~~~~~~~~~~~~~~~~~~~~~~~~~~~~~~~~~~~~~ : - MSRA3_LBAG : ~~~~~~~~~~~~~~~~~~~~~~~~~~~~~~~~~~~~~~~ : - MSRA1_LBAG : ~~~~~~~~~~~~~~~~~~~~~~~~~~~~~~~~~~~~~~~ : - MSRA2_LBAG : ~~~~~~~~~~~~~~~~~~~~~~~~~~~~~~~~~~~~~~~ : - MSRAB_NEIG : DGPRDKGGLRYCINGASLKFIPLEQMDAAGYGALKGEVK : 522 MSRA2_ARAT : ~~~~~~~~~~~~~~~~~~~~~~~~~~~~~~~~~~~~~~~ : - MSRA_ECO12 : ~~~~~~~~~~~~~~~~~~~~~~~~~~~~~~~~~~~~~~~ : - MSRA_FC44 : ~~~~~~~~~~~~~~~~~~~~~~~~~~~~~~~~~~~~~~~ : - MSRA_VL8 : ~~~~~~~~~~~~~~~~~~~~~~~~~~~~~~~~~~~~~~~ : - MSRA_MOUSE : ~~~~~~~~~~~~~~~~~~~~~~~~~~~~~~~~~~~~~~~ : - MSRA_HUMAN : ~~~~~~~~~~~~~~~~~~~~~~~~~~~~~~~~~~~~~~~ : - MSRA_BOVIN : ~~~~~~~~~~~~~~~~~~~~~~~~~~~~~~~~~~~~~~~ : - Figure 4.3-Continued 126
145 Many MsrB from various organisms were aligned with recombinant MsrB proteins (Figure 4.4). His 103, His 100, Asn 119 and Thr 26 amino acid residues in MsrB of E. coli were reported to form hydrogen bonds to stabilise the oxygen of the sulphoxide. These residues were conserved in MsrB of E. coli FC44 and E. coli VL8 at positions 104, 101, 120 and 27 respectively (Figure 4.4). In addition, His 103 amino acid residue was suggested to be the acid/base catalyst [244] and conserved at His 104 in MsrB of E. coli VL8 and E. coli FC44. MsrB of E. coli VL8 and L. agilis R16 were selected for cloning. * 20 * 40 * MSRB1_MOUS : ~~~~~~~~~~~~~~~~~~~~~~~~~~~~~~~~~~~~~~~~~~~~~~~~~~ : - MSRB1_BOVI : ~~~~~~~~~~~~~~~~~~~~~~~~~~~~~~~~~~~~~~~~~~~~~~~~~~ : - MSRB1_ARAT : MASSTRLTIIQSSFVSARTRLNYVSKTNHSGFACRSLSKPRNLSLSVY-- : 48 MSRB_LBAG : ~~~~~~~~~~~~~~~~~~~~~~~~~~~~~~~~~~~~~~~~~~~~~~~~~~ : - MSRB3_HUMA : ~~~~~~~~~~~~~~~~~~~~~~~~~~~~~~MSPRRTLPRPLSLCLSLCLC : 20 MSRB_ECOLI : ~~~~~~~~~~~~~~~~~~~~~~~~~~~~~~~~~~~~~~~~~~~~~~~~~~ : - MSRB_VL8 : ~~~~~~~~~~~~~~~~~~~~~~~~~~~~~~~~~~~~~~~~~~~~~~~~~~ : - MSRB_FC44 : ~~~~~~~~~~~~~~~~~~~~~~~~~~~~~~~~~~~~~~~~~~~~~~~~~~ : - 60 * 80 * 100 MSRB1_MOUS : ~~~~~~~~~~~~~~~~~~~~~~~~~~~~~~~~~~~~~~~~~~~~~~~~~M : 1 MSRB1_BOVI : ~~~~~~~~~~~~~~~~~~~~~~~~~~~~~~~~~~~~~~~~~~~~~~~~~M : 1 MSRB1_ARAT : -----SMGSSSSSPKPDNVQEAEKNEFASLSENEWKKRLTPEQYYITRQK : 93 MSRB_LBAG : ~~~~~~~~~~~~~~~~~~~~~~~~~~~MDKQQGELRQRLTPEQYAVTQEA : 23 MSRB3_HUMA : LCLAAALGSAQS-----GSCRDKKNCKVVFSQQELRKRLTPLQYHVTQEK : 65 MSRB_ECOLI : ~~~~~~~~~~~~~~~~~~~~~~~~~MANKPSAEELKKNLSEMQFYVTQNH : 25 MSRB_VL8 : ~~~~~~~~~~~~~~~~~~~~~~~~~MANKPSAEELKKNLSEMQFYVTQNH : 25 MSRB_FC44 : ~~~~~~~~~~~~~~~~~~~~~~~~~MANKPSAEELKKNLSEMQFYVTQNH : 25 T-27 * 120 * 140 * MSRB1_MOUS : SFCSFFGGEVFQNHFEPGVYVCAKCSYELFSSHSKYAHSSPWPAFTETIH : 51 MSRB1_BOVI : SFCSFFGGEIFQNHFEPGIYVCAKCGYELFSSRSKYAHSSPWPAFTETIH : 51 MSRB1_ARAT : GTERAFTGE-YWNSKTPGVYNCVCCDTPLFDSSTKFDSGTGWPSYYQPIG : 142 MSRB_LBAG : ATERPFSGE-YDNFYQEGIYVDVVSGQALFSSRDKYDAGCGWPSFTKPID : 72 MSRB3_HUMA : GTESAFEGE-YTHHKDPGIYKCVVCGTPLFKSETKFDSGSGWPSFHDVIN : 114 MSRB_ECOLI : GTEPPFTGR-LLHNKRDGVYHCLICDAPLFHSQTKYDSGCGWPSFYEPVS : 74 MSRB_VL8 : GTEPPFTGR-LLHNKRDGVYHCLICDAPLFHSQTKYDSGCGWPSFYEPVS : 74 MSRB_FC44 : GTEPPFTGR-LLHNKRDGVYHCLICDAPLFHSQTKYDSGCGWPSFYEPVS : 74 Figure 4.4 Multiple alignments of MsrB proteins from different organisms. The abbreviations used for MsrB from: MOUS (Q9JLC3); Mus musculus, BOVI (Q3MHL9); Bos taurus, ARAT (Q9C8M2); Arabidopsis thaliana, LBAG; L. agilis R16, HUMAN (Q81XL7); Homo sapiens, ECOLI (P0A746); E. coli strain K12, VL8; E. coli VL8, FC44; E. coli FC44. The default settings were used for Clustal Omega. Amino acid sequences were obtained from Uniprot database and the entry numbers of sequences are given in brackets. His 104 (H) residue in E. coli VL8 and E. coli FC44 is highlighted in yellow. Thr 27 (T), His 101 (H) and Asn 120 (N) residues in E. coli VL8 and E. coli FC44 are highlighted in pink. 127
146 H H-104 N * 180 * 200 MSRB1_MOUS : PDSVTKCPEK-NRPEALKVSCGKCGNGLGHEFLNDGPKRGQSRFUIFSSS : 100 MSRB1_BOVI : ADSVAKRPEH-NRPGAIKVSCGRCGNGLGHEFLNDGPKRGQSRFUIFSSS : 100 MSRB1_ARAT : NNVKTKLDLSIIFMPRQEVVCAVCNAHLGHVFDDGPRPT-GKRYCLNSAA : 191 MSRB_LBAG : QTNLNEHRDESFGMHRTEVTSTQANSHLGHVFPDGPRDCGGLRYCINSAA : 122 MSRB3_HUMA : SEAITFTDDFSYGMHRVETSCSQCGAHLGHIFDDGPRPT-GKRYCINSAA : 163 MSRB_ECOLI : EESIRYIKDLSHGMQRIEIRCGNCDAHLGHVFPDGPQPT-GERYCVNSAS : 123 MSRB_VL8 : EESIRYIKDLSHGMQRIEIRCGNCDAHLGHVFPDGPQPT-GERYCVNSAS : 123 MSRB_FC44 : EESIRYIKDLSHGMQRIEIRCGNCDAHLGHVFPDGPQPT-GERYCVNSAS : 123 * 220 MSRB1_MOUS : LKFVPKGKEAAASQGH~~~~~~~~~~~~~ : 116 MSRB1_BOVI : LKFIPKAEETSASQGQ~~~~~~~~~~~~~ : 116 MSRB1_ARAT : LKLNALEKTRD~~~~~~~~~~~~~~~~~~ : 202 MSRB_LBAG : LKFIPVADLEKAGYGQYQSLFK~~~~~~~ : 144 MSRB3_HUMA : LSFTPADSSGTAEGGSGVASPAQADKAEL : 192 MSRB_ECOLI : LRFTDGENGEEING~~~~~~~~~~~~~~~ : 137 MSRB_VL8 : LRFTDGENGEEING~~~~~~~~~~~~~~~ : 137 MSRB_FC44 : LRFTDGENGEEING~~~~~~~~~~~~~~~ : 137 Figure 4.4-Continued Many frmsr from various organisms were aligned with frmsr proteins in L. agilis R16, E. coli FC44 and E. coli VL8 (Figure 4.5). Cys 94 residue was proposed to be a nucleophile in frmsr of E. coli [245] which was conserved as Cys 76 in E. coli FC44 and E. coli VL8. This residue was not conserved in frmsr of L. agilis R16. In addition, the acid/base catalyst in frmsr of E. coli was proposed to be Asp 143 by Boschi-Muller et al. (2014) and was conserved at Asp 124 in L. agilis R16 and at Asp 125 in E. coli FC44 and E. coli VL8. frmsr of E. coli FC44 and L. agilis R16 were selected for cloning. The initiation of the protein synthesis of frmsr in E. coli strain in the studies [244, 245] starts with a different Met residue and this results in an 18 amino acid shift. 128
147 * 20 * 40 * frmsr_yeas : MGSSTGFHHADHVNYSSNLNKEEILEQLLLSYEGLSDGQVNWVCNLSNAS : 50 frmsr_lbag : ~~~~~~~~~~~~~~~~~~~MATTETSLMNQQLDALLFQETNLVANLANAS : 31 frmsr_staa : ~~~~~~~~~~~~~~~~MTTINPTNYTLLKKQAASLIEDEHHMIAILSNMS : 34 frmsr_baci : ~~~~~MF-H---VEK-QSGDKEKDYQLLLKQLEAMTEDETDQIANYANAS : 40 frmsr_ecol : ~~~~~~~~~~~~~~~~~~MNKTEFYADLNRDFNALMAGETSFLATLANTS : 32 frmsr_fc44 : ~~~~~~~~~~~~~~~~~~MNKTEFYADLNRDFNALMAGETSFLATLANTS : 32 frmsr_vl8 : ~~~~~~~~~~~~~~~~~~MNKAEFYADLNRDFNALMAGETSFLATLANTS : * 80 * 100 frmsr_yeas : SLIWHAYKSLAVDINWAGFYVTQASEENTLILGPFQGKVACQMIQFGKGV : 100 frmsr_lbag : ALLNSTYD----NLNWAGFYLFNE-QTGELDLGPFQGKVACMHIKVGAGV : 76 frmsr_staa : ALLNDNLD----QINWVGFYLLE---QNELILGPFQGHPACVHIPIGKGV : 77 frmsr_baci : ALLYHSLP----EVNWAGFYFAKE-EDGQLVLGPFQGLPACVRIPFGRGV : 85 frmsr_ecol : ALLYERLT----DINWAGFYLLE---DDTLVLGPFQGKIACVRIPVGRGV : 75 frmsr_fc44 : ALLYERLT----DINWAGFYLLE---DDTLVLGPFQGKIACVRIPVGRGV : 75 frmsr_vl8 : ALLYERLT----DVNWAGFYLLE---DDTLVLGPFQGKIACVRIPVGRGV : 75 C-76 * 120 * 140 * frmsr_yeas : CGTAASTKETQIVPDVNKYPGHIACDGETKSEIVVPIISNDGKTLGVIDI : 150 frmsr_lbag : VGTAFETQTNQRVADVHQFPGHIACDSASNSEIVVPIT-KDGHQIGVLDV : 125 frmsr_staa : CGTAVSERRTQIVADVHQFEGHIACDANSKSEIVVPIF-KDDKIIGVLDI : 126 frmsr_baci : CGTAYANGKVERVEDVNAFPGHIACDAASQSEIVLPIH-VGGKVVGVLDI : 134 frmsr_ecol : CGTAVARNQVQRIEDVHVFDGHIACDAASNSEIVLPLV-VKNQIIGVLDI : 124 frmsr_fc44 : CGTAVARNQVQRIEDVHVFDGHIACDAASNSEIVLPLV-VKNQIIGVLDI : 124 frmsr_vl8 : CGTAVARNQVQRIEDVHAFDGHIACDAASNSEIVLPLV-VKNQIIGVLDI : 124 D * 180 * frmsr_yeas : DCLDYEGFDHVDKEFLEKLAKLINKSCVFK~~~~~~~~~~~ : 180 frmsr_lbag : DSPSLDRFNADNEAELTEFVAILTSHID~~~~~~~~~~~~~ : 153 frmsr_staa : DAPITDRFDDNDKEHLEAIVKIIEKQLA~~~~~~~~~~~~~ : 154 frmsr_baci : DSPVKNRFDEIDEKYLSQFAETLEKALAQ~~~~~~~~~~~~ : 163 frmsr_ecol : DSTVFGRFTDEDEQGLRQLVAQLEKVLATTDYKKFFASVAG : 165 frmsr_fc44 : DSTVFGRFTDEDEQGLRQLVAQLEKVLATTDYKKFFASVAG : 165 frmsr_vl8 : DSTVFGRFTDEDEQGLRQLVAQLEKVLATTDYKKFFASVAG : 165 Figure 4.5 Multiple alignments of recombinant frmsr proteins with frmsrs from different organisms. The abbreviations used for frmsr from: YEAST (P36088); Saccharomyces cerevisiae, LBAG; L. agilis R16, STAA (A0A0D6HHM2); Staphylococcus aureus, BACI (A0A0K6L851); Bacillus subtilis, ECOL (P76270); E. coli strain K12, FC44; E. coli FC44, VL8; E. coli VL8. The default settings were used for Clustal Omega. Amino acid sequences were obtained from Uniprot database and the entry numbers of sequences are given in brackets. Cys 76 (C) and Asp 125 (D) amino acid residues in E. coli VL8 and E. coli FC44 are highlighted in yellow. 129
148 4.4.3 Cloning of Methionine Sulphoxide Reductases from L. agilis R16, E. coli VL8 and E. coli FC44 The cloned msr genes can be listed as: 3 msra, 1 msrb and 1 frmsr of L. agilis R16; 1 msra and 1 msrb of E. coli VL8; 1 frmsr of E. coli FC44 (Table 4.5). Bacteria Cloned msr genes Abbreviation L. agilis R16 3 msra 1 msrb 1 frmsr LBAG_ msra LBAG_ msrb LBAG_ frmsr E. coli VL8 1 msra 1 msrb VL8_ msra VL8_ msrb E. coli FC44 1 frmsr FC44_frmsr Table 4.5 Cloned msr genes of L. agilis R16, E. coli V8 and E. coli FC44. After transformation of recombinant vectors into E. coli DH5α cells, many transformants were checked by colony PCR to test if they have correct gene inserts. The expected sizes of PCR products with correct gene inserts from all transformants were observed (Figure 4.6). One of the positive transformants was used for recombinant plasmid preparation and sequenced. Positive recombinant plasmids were transformed into E. coli BL21(DE3) for protein expression and the protein expression induction was performed. 130
1-5; selected colonies for E. coli DH5α pet15b-lbag_msrb, 6-10; selected colonies for E.")
149 Figure 4.6 Agarose gel electrophoresis from colony PCR experiments. a) 1-8; selected colonies for E. coli DH5α pet15b-lbag_msra1, 8-16; selected colonies for E. coli DH5α pet15b-lbag_msra2, 17-24; selected colonies for E. coli DH5α pet15b-lbag_msra3. b)1-5; selected colonies for E. coli DH5α pet15b-lbag_msrb, 6-10; selected colonies for E. coli DH5α pet15b-lbag_frmsr, 11-15; selected colonies for E. coli DH5α pet15b-fc44_frmsr, 16-20; selected colonies for E. coli DH5α pet15b-vl8_msra, 21-24; selected colonies for E. coli DH5α pet15b-vl8_msrb. c)1-7; selected colonies for E. coli DH5α pet15b-lbag_frmsr, 8-14; selected colonies for E. coli DH5α pet15b-fc44_frmsr, 15-24; selected colonies for E. coli DH5α pet15b-vl8_msrb. l; hyperladder, c1; negative control for PCR (PCR was set up without any genomic DNA), c2; positive control for PCR (PCR was set up with pet15b vector). The expected PCR product sizes; 198 bp for pet15b vector with no insert, 709 bp for pet15b- LBAG_msrA1 plasmid, 727 bp for pet15b-lbag_msra2 plasmid, 1018 bp for pet15b- LBAG_msrA3 plasmid, 643 bp for pet15b-lbag_msrb, 717 bp for pet15b-lbag_frmsr plasmid, 770 bp for pet15b-fc44_frmsr plasmid, 835 bp for recombinant pet15b-vl8_msra plasmid, 670 bp for pet15b-vl8_msrb plasmid. 131
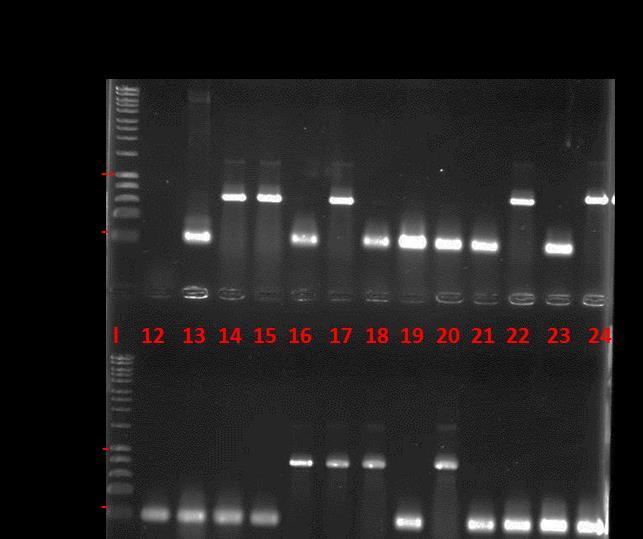
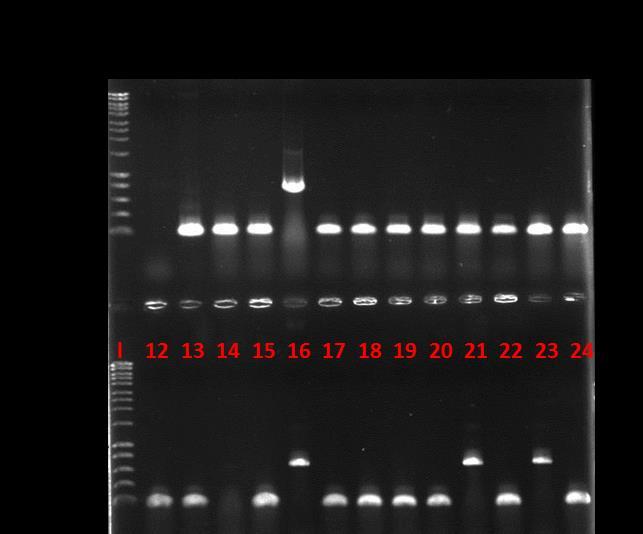
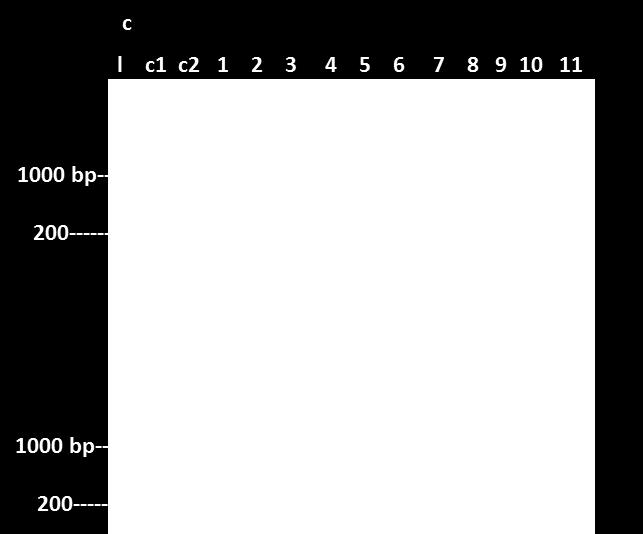
150 Figure 4.6-Continued 132
151 4.4.4 Protein Expression and Purification of Methione Sulphoxide Reductases from L. agilis R16, E. coli VL8 and E. coli FC44 The protein expression inductions in E. coli BL21(DE3) expressing pet15b-lbag_msra1, pet15b-lbag_msra2 and pet15b-lbag_msra3 were carried out for 4 h at 37 C or 24 h at 25 C, shaking at 250 rpm. Protein expression induction of MsrA proteins of L. agilis R16 at 37 C did not produce sufficient recombinant proteins in the soluble fraction. Recombinant proteins were seen in insoluble fractions (Lane 11, 13, 14, Figure 4.7) so different induction and extraction conditions were tested (Figure 4.8) for MsrA1 protein expression. 133
 Protein gel where CFEs were run on 12% Bis-Tris gel under denaturing, reducing conditions in MES buffer. b) Western blot (using anti-his tag antibody) within the same order of protein gel in a.")
 cells expressing: 1-2; pet15b (empty vector control), 3-4; pet15b-ecg44 (positive control for western-6xhis-tagged protein), 5-6; pet15b-lbag_msra1, 7-8 pet15b-lbag_msra2, 9-10;")
152 Figure 4.7 SDS-PAGE and Western Blot of the CFEs obtained from E. coli BL21 (DE3) cells expressing pet15b-lbag_msra1, pet15b-lbag_msra2 and pet15b-lbag_msra3. a) Protein gel where CFEs were run on 12% Bis-Tris gel under denaturing, reducing conditions in MES buffer. b) Western blot (using anti-his tag antibody) within the same order of protein gel in a. 10 µg of protein was loaded per lane. M; See Blue protein marker. Soluble CFEs of uninduced and 4 h induced E. coli BL21 (DE3) cells expressing: 1-2; pet15b (empty vector control), 3-4; pet15b-ecg44 (positive control for western-6xhis-tagged protein), 5-6; pet15b-lbag_msra1, 7-8 pet15b-lbag_msra2, 9-10; pet15b-lbag_msra3, Insoluble CFEs of 4 h induced E. coli BL21 (DE3) cells expressing: 11; pet15b-lbag_msra3, 12; pet15b-ecg44, 13; pet15b- LBAG_msrA1, 14; pet15b-lbag_msra2. Protein expressions were induced at 37 C with 0.5 mm IPTG. 134
153 Protein expression induction at 25 C for 24 h resulted in higher level of expression of MsrA1 (Lane 5, 6 Figure 4.8). The same profile was seen for MsrA2. After optimisation of induction conditions, MsrA1 and MsrA2 proteins were successfully extracted and confirmed to have predicted sizes (Table 4.6). These proteins were checked by Western blot for presence of 6XHis-tag (Figure 4.7) and purified by Ni-NTA column. The purification of MsrA3 was more challenging, the targeted protein was not expressed well by the E. coli cells and the Ni-NTA purification of MsrA3 failed (Figure 4.9). Many different protein expression conditions were tested to optimise the conditions. MsrA3 is mostly found in the insoluble fraction. Reducing the IPTG concentration to 0.1 mm and extraction by Bugbuster protein extraction reagent (Novagen) improved the extraction of MsrA3 in the soluble fraction (Figure 4.9 BB Lanes, circled) but MsrA3 was not used in further enzyme assays. Bacterium Protein Predicted Size with 6XHis-tag (kda) pi L. agilis R16 MsrA L. agilis R16 MsrA L. agilis R16 MsrA L. agilis R16 MsrB L. agilis R16 frmsr E. coli FC44 frmsr E. coli VL8 MsrA E. coli VL8 MsrB Table 4.6 Properties of putative methionine sulphoxide reductases. pi; isolelectric point. Predicted sizes and pi of proteins were obtained using the amino acid sequences of the proteins by Editseq-sequence editing software (DNAstar). 135


154 Figure 4.8 SDS-PAGE of CFEs of E. coli BL21 (DE3) expressing pet15b-lbag_msra1. 10 µg of protein was loaded per lane. M: See Blue Protein Marker. Soluble CFEs obtained from induced cells for: 1-2; 3 h at 37 C, 3-4; 4 h at 37 C extracted by Bugbuster, 5-6: 24 h at 25 C. Insoluble CFEs obtained from induced cells for: 7-8; 3 h at 37 C, 9-10: 4 h at 37 C extracted by Bugbuster, 11-12: 24 h at 25 C. Proteins were run on 12% Bis-Tris Gel under denaturing, reducing conditions in MES buffer. Figure 4.9 SDS-PAGE of the Ni-NTA purified MsrA proteins from E. coli BL21 (DE3) expressing pet15b-lbag_msra1, pet15b-lbag_msra2 and pet15b-lbag_msra µl of fractions were loaded per lane. FT: Flow through, W: Wash, E: Eluate, M; Protein marker, S: Soluble, IS: Insoluble. BB: MsrA3 purified by Bugbuster (Novagen). Proteins were run on 10% Bis-Tris Gels under denaturing, reducing conditions in MES buffer. 136
155 To optimise the protein expression for the rest of the Msr proteins, various conditions were examined. The protein expressions were carried out at 25 C for 4 h and 37 C for 3 h or 4 h. The proteins were induced and CFEs were loaded on a SDS-PAGE gel and checked for their expected sizes (See Table 4.6). The optimum protein expression conditions for all of the proteins are shown in Table 4.7. Induction at 37 C for 4 h was found to be optimum under the conditions tested for LBAG_MsrB and VL8_MsrB. For VL8_MsrA expression, 3 h induction at 37 C was found to provide higher levels of protein. These proteins showed a different expression profile compared to MrsA1 and MsrA2 proteins of L. agilis R16. Protein expression induction at 25 C resulted in better expression of MrsA1 and MsrA2 proteins of L. agilis R16. The protein expression of LBAG_fRMsr and FC44_fRMsr under conditions tested did not produce sufficient proteins in the soluble fraction and proteins were mostly seen in the insoluble fraction. Bacterium Protein Abbreviation Optimum Protein Expression Condition L. agilis R16 MsrA1 LBAG_MsrA1 25 C for 24 h L. agilis R16 MsrA2 LBAG_MsrA2 25 C for 24 h L. agilis R16 MsrA3 LBAG_MsrA3 37 C for 3 h* L. agilis R16 MsrB LBAG_MsrB 37 C for 4 h L. agilis R16 frmsr LBAG_fRMsr ND E. coli FC44 frmsr FC44_fRMsr ND E. coli VL8 MsrA VL8_MsrA 37 C for 3 h E. coli VL8 MsrB VL8_MsrB 37 C for 4 h Table 4.7 Optimum conditions of E. coli BL21 (DE3) expressing msr genes. The abbreviations of the proteins are shown and these will be used subsequently for naming the proteins. * Protein extraction was performed by Bugbuster Reagent (Novagen). ND; Not determined, expression of LBAG_fRMsr and FC44_fRMsr under conditions tested resulted in expression of the proteins mostly in insoluble fractions. 137

156 CFEs were prepared using optimum protein expression conditions and tested for the presence of 6XHis-tag by Western Blot (See Figure 4.10). Protein expression induction was performed at 37 C for 4 h for LBAG_fRMsr and FC44_fRMsr. Figure 4.10 SDS-PAGE and Western Blot of the soluble CFEs from E. coli BL21 (DE3) expressing recombinant pet15b plasmids expressing msr genes. a) Protein gel where CFEs were run on 12% Bis-Tris gel under denaturing, reducing conditions in MES buffer. b) Western blot (using anti-his tag antibody) within the same order of protein gel in a. 10 µg of protein was loaded per lane. M: See Blue Protein Marker. CFEs of E. coli BL21 (DE3) cells expressing: 1; pet15b (empty vector control) induced at 37 C for 4 h, 2; pet15b-lbag_msrb induced at 37 C for 4 h, 3; pet15b-lbag_frmsr induced at 37 C for 4 h, 4; pet15b-fc44_frmsr induced at 37 C for 4 h, 5; pet15b-vl8_msra induced at 37 C for 3 h, 6; pet15b-vl8_msrb induced at 37 C for 4 h. Proteins were seen to be bound to the anti-his tag except the FC44_fRMsr (Lane 4, Figure 4.10) with the expected sizes (Table 4.6). No binding to the anti-his tag was observed for FC44_fRMsr. LBAG_MsrB and VL8_MsrB were purified by Ni-NTA columns. Ni-NTA purification was performed successfully; eluates were obtained with expected protein sizes (Figure 4.11). 138

157 Figure 4.11 SDS-PAGE of Ni-NTA purified MsrB proteins from E. coli BL21 (DE3) expressing pet15b-lbag_msrb and pet15b-vl8_msrb µl of fractions were loaded per lane. M: See Blue Protein Marker, FT: Flow through, W: Wash, E: Eluate, M; Protein marker, Proteins were run on 10% Bis-Tris Gels under denaturing, reducing conditions in MES buffer. The predicted sizes of LBAG_MsrB and VL8_MsrB are 18 kda and 17.2 kda, respectively Reductase Activity of Recombinant Methionine Sulphoxide Reductases Ni-NTA purified, dialysed eluates of MsrA1 and MsrA2 were used to determine glucoraphanin reduction in the presence of dithiothreitol (DTT). Samples were analysed by HPLC to check glucoraphanin degradation and formation of glucoerucin after 30 min incubation. MsrA1 was more effective for glucoerucin formation than MsrA2 (Figure 4.12). MsrA1 and MsrA2 showed glucoerucin formation at a rate of 0.57 ± 0.04 nmol glucoerucin/µg protein and 0.13 ± 0.00 nmol glucoerucin/µg protein respectively. MsrA1 was also tested for reductase activity with longer incubation times (1, 2 and 3 h) and higher protein amount (50 µg). None of these changes in the enzyme assays increased the rate of glucoerucin formation for MsrA1 (data not shown). This reduction did not occur in the control samples without eluates. This suggests that the reduction is an enzymatic reaction. When 1 mm of NADPH was used as reducing agent instead of 20 mm DTT with 1 mm MgCI 2 in the assays, no glucoerucin formation was obtained. This study was continued to focus on other bacteria such as E. coli VL8 and E. coli FC44. In addition, the role of other types of Msr enzymes was investigated. 139
158 concentration of glucosinolate (mm) Glucoraphanin Glucoerucin Control MsrA1 MsrA2 Figure 4.12 Reduction of glucoraphanin to glucoerucin by MsrA1 and MsrA2. Glucoraphanin amount left and glucoerucin amount formed after 30 min incubation are shown. Samples and controls contained 1 mm glucoraphanin originally. Control indicates the glucoraphanin control without any protein that was incubated for 30 min. Assays were set up using same amount of protein (10 µg). Error bars = standard deviation (n=3). CFEs were tested for reductase activity against 0.5 mm glucoraphanin to examine if they can reduce glucoraphanin to glucoerucin. CFEs of E. coli BL21 (DE3) expressing pet15b- LBAG_msrB, pet15b-lbag_frmsr, pet15b-fc44_frmsr, pet15b-vl8_msra and pet15b- VL8_msrB were tested for reductase activity using 20 mm DTT as reducing agent. The results are shown in Figure In the presence of DTT without CFE (control 1), glucoraphanin was converted to glucoerucin with a rate of 0.08 ± 0.03 nmol glucoerucin/µg protein. In absence of DTT and any CFE (control 2), there was no glucoerucin formation but glucoraphanin degradation occurred. In addition, control including CFE of E. coli BL21(DE3) pet15b (empty vector control) showed glucoraphanin degradation but there was no glucoerucin formation in these controls. LBAG_fRMsr, IS44_ frmsr and VL8_MsrA samples showed glucoerucin formation at a similar rate (~0.06 ± 0.01 nmol glucoerucin/µg protein) which was also similar to control 1. LBAG_MsrB and VL8_MsrB reduced glucoraphanin at a rate of 0.31 ± 0.02 nmol glucoerucin/µg protein and 0.68 ± 0.02 nmol glucoerucin/µg protein, respectively. 140
159 concentration of glucosinolate (mm) samples Glucoraphanin Glucoerucin Figure 4.13 Reduction of glucoraphanin to glucoerucin by CFEs of E. coli BL21(DE3) expressing msr genes. Control 1 indicates the glucoraphanin control without any CFE, Control 2 indicates the control without CFE and DTT addition. Vector Control is the sample that includes CFE of E. coli BL21(DE3) with empty pet15b vector. Samples and controls contained 0.5 mm glucoraphanin originally. Assays were set up using same amount of protein (100 µg). Error bars = standard deviation (n=3). MsrB proteins are likely to be responsible for the reductase activity of E. coli VL8 and L. agilis R16. LBAG_MsrB and VL8_MsrB showed higher reduction rates compared to control 1 (See chromatograms, Figure 4.14). Notably, the reductase activity of VL8_MsrB was remarkable because it was able to reduce almost all of the glucoraphanin to glucoerucin. 141

 cells expressing pet15b-lbag_msrb (a) and")
160 b Figure 4.14 HPLC chromatograms showing reduction of glucoraphanin to glucoerucin by CFEs of E. coli BL21(DE3) cells expressing pet15b-lbag_msrb (a) and pet15b-vl8_msrb (b). 1; glucoraphanin, 2; sinigrin (internal standard), 3; glucoerucin. 142
161 Ni-NTA purified, dialysed eluates of LBAG_MsrB and VL8_MsrB were used to determine enzyme activity in the presence of DTT or NADPH as reducing agent. These reactions were used in the sample preparation for HPLC and analysed on HPLC to check the formation of glucoerucin. The reduction rates were based on glucoerucin formation and are given in Table 4.8. In addition, the concentrations of glucoraphanin left and glucoerucin formed is shown in Figure Controls including NADPH or DTT showed a reduction rate of 0.13 ± 0.01 nmol glucoerucin/µg protein and 0.51 nmol ± 0.02 nmol/glucoerucin/µg protein respectively. Reduction rate of LBAG_MsrB was 0.14 ± 0.01 nmol glucoerucin/µg protein and 1.03 ± 0.11 nmol glucoerucin/µg protein using NADPH and DTT as reducing agent respectively. VL8_MsrB showed a reduction rate of 0.15 ± 0.01 nmol glucoerucin/µg protein when NADPH was used as reducing agent. However, it reduced glucoraphanin to glucoerucin with a rate of 5.42 ± 0.18 nmol glucoerucin/µg protein when DTT was used instead of NADPH. Samples Reduction rate (nmol glucoerucin/µg protein) NADPH DTT Control 0.13 ± ± 0.01 LBAG_MsrB 0.14 ± ± 0.11 VL8_MsrB 0.15 ± ± 0.18 Table 4.8 The reduction rate of glucoraphanin to glucoerucin by Ni-NTA purified LBAG_MsrB and VL8_MsrB using NADPH or DTT as reducing agent. The reactions were set up with 1 mm NADPH or 20 mm DTT as reducing agent. Assays were set up using same amount of protein (10 µg). Results were given as mean of triplicates ± standard deviation. VL8_MsrB could reduce glucoraphanin to glucoerucin with a high rate in presence of DTT as reducing agent. The reduction by VL8_MsrB was very low when NADPH used as a reducing agent (Figure 4.15). 143
162 concentration of glucosinolate (mm) Glucoraphanin samples Glucoerucin Figure 4.15 Reduction of glucoraphanin by Ni-NTA purified LBAG_MsrB and VL8_MsrB. Control indicates the glucoraphanin control without any eluate. The reactions were set up with 1 mm NADPH or 20 mm DTT as reducing agent. Samples and controls contained 0.5 mm glucoraphanin originally. Assays were set up using same amount of protein (10 µg). Error bars = standard deviation (n=3). 4.5 DISCUSSION Significant inter-individual variations have been observed in the degradation of glucosinolates to ITCs by human gut bacteria [246]. The myrosinase activity of gut bacteria against different glucosinolates may vary and gut bacteria may use alternative pathways to degrade glucosinolates. For instance, some gut isolates were able to degrade methylsulfinylalkyl glucosinolates (such as glucoraphanin) directly to its corresponding isothiocyanate (sulforaphane for glucoraphanin) while others require a reduction step that converts methylsulfinylalkyl glucosinolates into methylthioalkyl glucosinolates followed by hydrolysis to isothiocyanates [55, 56]. Therefore this reduction step is essential in understanding the diverse routes of glucosinolate metabolism to maximize the health promoting effects of ITCs. 144
163 E. coli VL8 and E. coli FC44 converted the glucoraphanin in the media to its reduced counterpart, glucoerucin so these strains were further studied for their reductase activity. CFEs of E. coli VL8 and E. coli FC44 prepared from cells grown overnight with or without glucosinolate supplementation were able to reduce glucoraphanin to glucoerucin. Luang-In et al. (2014) reported that reductase activity in CFE of E. coli VL8 was inducible by glucoraphanin and CFE of E. coli VL8 was unable to reduce glucoraphanin without a glucosinolate supplementation to the media used in CFE preparation [56]. However, no induction effect was found for reductase activity in CFEs of E. coli VL8 and E. coli FC44. The same culture (nutrient broth) to grow cells and same buffer (0.1 M citrate phosphate buffer ph 7.0) to prepare CFE were used in our study. The differences were the method to prepare CFEs and the source of the substrate (glucoraphanin). Instead of using a cell-disrupter, sonication was used in our study. Glucoraphanin used in our study was either supplied to us from a human intervention study in IFR (purchased from Intertek) or purchased from a company (Cambridge Biosciences). However, Luang-In et al. (2014) have prepared their own glucoraphanin by oxidation of glucoerucin with hydrogen peroxide [56]. There was no comment about ITC or other degradation products in their study. If glucoraphanin was reduced to glucoerucin in uninduced CFEs, glucoerucin might have been degraded by myrosinase activity rapidly and not detected in their samples. Another possibility is that the glucoraphanin used in our study might be more amenable to reductase activity. Our results suggested that reductase activity in CFEs of E. coli VL8 and E. coli FC44 may be constitutive. Methionine sulphoxide reductase A (MsrA) was suggested to be responsible for reducing methylsulfinylalkyl glucosinolates (such as glucoraphanin) into methylthioalkyl glucosinolates (such as glucoerucin) [55]. To test this hypothesis, partially purified MsrAs were tested for reductase activity against glucoraphanin (Intertek) in the presence of different reducing agents but the degradation rate of glucoraphanin to glucoerucin was low. Increasing incubation time and protein amount was also tested but these effects did not improve the reductase activity of MsrAs. This low glucoraphanin reduction rate was in accordance with the low glucoraphanin degradation rate by L. agilis R16 reported previously because L. agilis R16 degraded only 10 ± 2% of the glucoraphanin in the media after 24 h [56]. It was also thought that different types of Msr enzymes can have a role in reduction of glucosinolates because they can reduce different epimers of methionine sulphoxide. For instance, MsrAs can only reduce free and protein-based S-epimers of methionine sulphoxide. 145
164 In the literature, glucoraphanin extracted from B. oleracea var italica (broccoli) and A. thaliana was reported to be a pure epimer of R configuration at the sulphoxide group [247]. No information was provided to us by suppliers about configuration of the methyl sulphoxide of glucoraphanin, they might be a pure epimer (R or S) or a mix of these two epimers. Therefore, different Msr enzymes were investigated in our study including MsrA, MsrB and frmsr of L. agilis R16, E. coli VL8 and E. coli FC44. FC44_fRMsr failed to bind the anti-his tag during Western Blot. This might be a problem about protein production or may suggest that there had been protein degradation. Lin et al. (2007) studied the frmsr of E. coli sharing the same amino acid with frmsr of E. coli FC44. They reported the initiation of the protein synthesis 18 amino acids upstream from the first methionine and presence of larger version of frmsr. Moreover, it was reported that the purified protein was a mix of both versions of the frmsr showing the same Msr activity [245]. There was no indication of signal peptide. Maybe, the full length of protein has better stability or solubility so it was needed to clone the larger version of the protein for a successful protein expression with 6XHis-Tag. When CFEs of E. coli BL21(DE3) expressing msr genes were tested for reductase activity, it was found that the sum of the glucoraphanin amount left and glucoerucin amount formed did not match with the original glucoraphanin concentration. This effect was seen in controls without any reducing agent and protein. The reason might be the purity of glucoraphanin stock used in the study. It should be noted that glucoraphanin stock (from Cambridge Biosciences) used in this part of the study was different from the one used for testing reductase activity of LBAG_MsrA1 and LBAG_MsrA2 (from Intertek). Notably, vector control which included CFE of E. coli BL21(DE3) cells expressing empty pet15b vector had a low glucoraphanin amount left compared to controls without any glucoerucin formation. It is not known if this effect might be caused by the metabolism of glucoraphanin by CFE. Another issue is the formation of glucoerucin in controls including only DTT without any protein extract. This might suggest a non enzymatic reduction and the longer incubation time might be the reason for this effect. When purified LBAG_MsrA1 and LBAG_MsrA2 were tested for reductase activity, samples and controls were incubated for 30 min and there was no glucoerucin formation in controls. To overcome this, the effect of shorter incubation times could be tested. 146
165 As expression of FC44_ frmsr with 6XHis-tag failed, it is not possible to comment on its role in reductase activity of E. coli FC44. However, it is unlikely that LBAG_fRMsr and VL8_MsrA are responsible for reduction of glucoerucin because CFEs consisting these proteins showed similar reduction rates compared to control. However, shortening the incubation time might eliminate the reduction of glucoraphanin by control and give a better idea about the roles of these proteins in reductase activity. Our results indicate that MsrB may be responsible for reduction glucoraphanin to glucoerucin because CFEs consisting LBAG_MsrB and VL8_MsrB showed remarkable reduction of glucoraphanin to glucoerucin compared to control. Luang-In et al. (2014) reported that reductase activity in CFEs of E. coli VL8 was oxygen-independent, NADPH and Mg +2 dependent [56]. When Ni-NTA purified LBAG_MsrB and VL8_MsrB were tested for reductase activity in presence of 1 mm NADPH with 1 mm MgCI 2, reduction rates were low and similar to control. Using 20 mm DTT as a reducing agent resulted in higher reduction rates and showed that DTT can be used as a reducing agent to test reductase activity in vitro. The reduced thioredoxin was reported to be the reducing agent in vivo in reduction of methionine sulphoxides and DTT was shown to substitute it in vitro [141, 163]. It also suggested that MsrB may be the responsible enzyme for reduction of glucoraphanin to glucoerucin in L. agilis R16 and E. coli VL8. The role of MsrB in reductase activity suggested that the glucoraphanin stock used was mainly included R-epimer of sulphoxide group as has been suggested to occur in plants [247]. It should be taken into account that MsrA has specificity for the S-epimer, MsrB and frmsr have specificities for R-epimer of methionine sulphoxide and it is important to use a substrate that mimics the substrate found in the plant to determine which enzyme is responsible for activity. When reductase activity of purified MsrA1 and MsrA2 of L. agilis R16 was tested, a different glucoraphanin stock was used. If this previous glucoraphanin stock contained small amount of S-epimer of sulphoxide group, this might be the reason for the low levels of MsrA activity. It is not known why LBAG_fRMsr could not reduce glucoraphanin as frmsr has specificity for free form of R epimer of methyl sulphoxide but this could be related to low levels of protein production in the soluble CFE. When reductase activity of LBAG_MsrB and VL8_MsrB were compared to each other, it explained the difference in glucoraphanin degradation rates of L. agilis R16 and E. coli VL8. As reported previously, L. agilis R16 was degraded 10 ± 2% of glucoraphanin in the media but E. coli VL8 was able to degrade 91 ± 7% of the glucoraphanin in the media after 24 h incubation 147
166 [56]. This showed that E. coli VL8 has more efficient reductase activity compared to L. agilis R16, resulting in higher glucoraphanin degradation rates. Unfortunately, we could not determine the optimum conditions for reductase activity of LBAG_MsrB and VL8_MsrB. The effect of temperature, buffer, ph, other reducing agents, etc. should be investigated. As reductase activity in CFEs of E. coli VL8 was reported to be oxygenindependent, all assays were performed under aerobic conditions. However, the effect of oxygen can be still tested for confirmation. Sulforaphane was a substrate for reductase activity of E. coli VL8 CFE [137], it was expected that MsrB can also reduce sulforaphane and further examination of the substrate range will be interesting. In summary, it was found that MsrB is likely to be the responsible enzyme in reduction of glucoraphanin possessing R-epimer of sulphoxide in its structure. This study was the first to confirm the role of Msr enzymes in reduction of glucosinolates with a sulphoxide group in their side chain. This finding provides us a better understanding about the diverse routes of glucosinolate metabolism by gut bacteria. 148
167 CHAPTER FIVE 5 CHARACTERISATION OF A BACTERIAL MYROSINASE OF SOIL ORIGIN 149
168 5.1 INTRODUCTION The first bacterial myrosinase was purified in 1974 from Enterobacter cloacae but it was not extended to further identification of the gene or amino acid sequence [231]. Since then a limited number of studies have investigated the metabolism of glucosinolates by different bacteria. These studies attempted to identify and characterise the enzyme but with limited success [137, 232] Some studies reported the glucosinolate metabolism by human gut bacteria in vitro [56], in rat models [112, 213] or using in vitro fermentation models [165, 212]. These studies contributed to our understanding of the glucosinolate metabolism by human gut bacteria. However, identification of the responsible enzyme or enzyme groups and their characterisation could not be achieved. To maximize the health promoting effects of glucosinolate degradation products, isothiocyanates, we need a better understanding of bacterial myrosinases. In this context, identification and characterisation of bacterial myrosinases is crucial. Recently, a C. WYE1 strain was isolated from soil and this strain was reported to have glucosinolate degrading ability. An enrichment method using the sinigrin as sole carbon source was used to isolate this bacterium. The enzyme responsible for myrosinase activity was purified by a chromatography approach that combined ion exchange chromatography and gel filtration. Later, N-terminal and internal amino acid sequence of the myrosinase was determined and enzyme activity partially characterised using cell-free extracts. It was found to be a periplasmic β-glucosidase from GH3 family with a signal peptide [118]. So far, identified myrosinases in plants [119], aphids [132] or beetles [248] were reported to belong to the GH1 family so this myrosinase was the first of its own kind. It was found be activated by ascorbate like plant myrosinases [118]. The identification of this myrosinase changed our perspective in this study and we then focused on β-glucosidases from GH3 too to identify a bacterial myrosinase from the human gut. Rossiter Group at Imperial College attempted to clone and express this myrosinase gene in E. coli (unpublished data). Unfortunately, their attempt to clone the myrosinase gene was not successful and they did not pursue this further. This chapter focuses on cloning and expression of C. WYE1 myrosinase (cmyr) and characterisation of this enzyme. 150
169 5.2 HYPOTHESIS C. WYE1 showed myrosinase activity. The reported myrosinase activity of C. WYE1 is the product of the expression of a periplasmic β-glucosidase from GH3 family. 5.3 MATERIALS AND METHODS Strain Identification and Preparation of Phylogenetic Tree The strain C. WYE1 was kindly provided to by John Rossiter from Imperial College London. The genome of C. WYE1 was sequenced, assembled and annotated as described in Chapter 2- section S rdna sequencing was performed to assign the strain to a specific species, method was performed as described in Chapter 2- section To determine the phylogeny of C. WYE1, a phylogenetic tree was constructed as described in Chapter 2-section Comparison of C. WYE1 Myrosinase with Other Myrosinases Amino acid sequences of different myrosinases from different origins were selected using the Uniprot database. These myrosinases were aligned with cmyr using Clustal Omega [237] Cloning and Expression of Myrosinase Gene As cmyr was reported to have a signal peptide, a cloning vector which has 6XHis-tag site in both N-terminal and C-terminal site (pet28b) was used. Primers were designed to introduce new restriction sites by changing nucleotides and to enable in-frame translation of C-terminal 6XHis-tag by insertion of a new nucleotide to the reverse primer. This allowed the expression of the protein with two 6XHis-tags at N-terminal and C-terminal sites. Then it was possible to purify protein by Ni-NTA column even if the N-terminal tag is being cleaved off. The primers were designed to amplify the cmyr are given in Table 5.1, the restriction sites are underlined. The nucleotide sequence of the cloned gene is shown in the Appendix 2. PCR insert was amplified (PCR conditions are given in Table 5.2) and double restricted by NdeI/XhoI and ligated to NdeI/XhoI double restricted pet28b vector (Novagen) then this gene construct was transformed into E. coli DH5α cells as described in Chapter 2-section and the cells were plated on L agar with kanamycin (30 µg/ml, final concentration). 151
170 Name Primer Sequence (5``-3`) Restriction Site CMYR-F GGAACATATGCTCACTGCTTTTAAGA NdeI CMYR-R CAGACTCGAGACGTGTCAGTCCGAAT XhoI Table 5.1 Primers used in the PCR experiments to amplify the cmyr. The restriction sites are underlined. The altered nucleotides to introduce the restriction sites are in bold. The inserted nucleotide is highlighted. Name T A, time, cycles T E, time Product size CMYR-F CMYR-R 54 C, 30 s, 5X 68 C, 30 s, 20X 72 C, 1 min 1998 bp Table 5.2 Conditions used in the PCR experiments to amplify the cmyr gene. T A; annealing temperature, cycles; cycles used in annealing step of PCR, T E; extension temperature and time used in PCR, Product size; the expected PCR product sizes for β-glucosidase genes. The annealing step was performed using T m of 100% sequence match part of primers first (5X) and then using the T m of entire primer (20X). Colonies were screened by colony PCR using primers T7P2 (5 -TGAGCGGATAACAATTCCC) and T7T (5 -GCTAGTTATTGCTCAGCGG) to select the positive transformants. The clones that gave positive result for PCR were selected and inoculated in L Broth with kanamycin (30 µg/ml final concentration) to grow overnight at 37 C, with shaking at 250 rpm. The recombinant plasmids were extracted using EZNA Plasmid Mini Kit II (Omega Bio-Tek) and sequenced using T7P2 (5-3 : TGAGCGGATAACAATTCCC), T7T (5-3 : GCTAGTTATTGCTCAGCGC) and an internal primer (5-3 : GACCCTGAGCTGGCTAAA). After confirmation that there were no mutations on cloned insert, the recombinant plasmid was transformed into E. coli BL21 (DE3) for protein expression (Method is in Chapter 2-section ). E. coli BL21 (DE3) expressing pet28b-cmyr was induced with 0.5 mm IPTG. Protein expression induction was carried out in two ways either at 25 C for 24 h or at 37 C for 3 h. After protein induction, CFEs were prepared by sonication as described in Chapter 2-section Soluble and insoluble fractions were run on SDS-PAGE gel as described in Chapter 2-section Purification of Myrosinase and Measurement of Enzyme Activity The CFEs were checked for the presence of the expressed protein by Western blot using antibodies raised against 6X-His tag (Chapter 2-section 2.3.4) and then cmyr was purified by affinity purification using Ni-NTA column (Chapter 2-section 2.3.5). Partially purified cmyr was 152
171 dialysed to remove excessive amount of imidazole from Ni-NTA column purification. Spectra/Por porous membrane tubing with Da cut off (Spectrum Labs) was used for dialysis. The protein was dialysed against 20 mm citrate phosphate buffer ph 6.0 for 18 h at 4 C. The protein concentration of the dialysed fractions was quantified by Bradford assay and God-Perid assay was used to determine the enzyme activity of protein. These methods were explained in detail in Chapter 2 sections and respectively Dialysis and Filtration of Purified Protein for Crystallography Ni-NTA purified cmyr was dialysed against 50 mm Tris-HCI 20 mm NaCI ph 7.0 buffer for 18 h at 4 C. Later, cmyr was filtered and concentrated for crystallography studies. Amicon Ultra 4-50k filters (Millipore) were used according to supplier s advice. The sample was loaded on to the filter unit and spun down at 4000 x g for 20 min at 4 C then concentrated samples were removed from filter device. The concentration of cmyr was adjusted to 10 mg/ml and sent to Imperial College London for crystallography studies Intact Mass Analysis Dialysed protein sample was concentrated to 50 µm, this protein sample was analysed by LCMS to determine the intact mass of the protein. Protein intact mass was analysed on a Synapt G2-Si mass spectrometer coupled to an Acquity UPLC system (Waters, UK). An aliquot of ~300 pmoles of protein was injected onto an Aeris Widepore 3.6u C4 Column 50 x 2.1 mm (Phenomenex). Elution was performed by a gradient of 5-90% acetonitrile in 5 min with a flow rate of 0.4 ml/min. Masslynx 4.1 software (Waters) was used to control the spectrometer and it was operated in positive MS-TOF and resolution mode with a capillary voltage of 2.5 kv and a cone voltage of 40 V. Leu-enkephalin peptide (1 ng/ml, Waters) was infused at 3 µl/min as a lock mass and measured every 20 s. The spectra were produced by combining a number of scans, and deconvoluted using the MaxEnt1 tool in Masslynx. LCMS run was performed by Dr. Gerhard Saalbach (JIC, Norwich) Characterisation of Myrosinase The myrosinase activity of C. WYE1 was assayed using cell-free extracts previously by Albaser et al. (2016)[118]. In this study, the protein with 6XHis-tag was partially purified and further characterisation was performed. The optimum ph, temperature and buffer for myrosinase activity were studied and enzyme kinetics experiments were performed to determine K m and V max for sinigrin. 153
172 The optimum ph was tested in 20 mm citrate phosphate buffer (ph range of ). Dialysed cmyr was added to the 300 µl mixture of sinigrin (2 mm, final), protein (24 ng) in 20 mm citrate phosphate buffer at a ph range of The assay mixture was incubated at 37 C for 1 h and reaction was stopped by boiling the tubes for 5 min to inactivate the myrosinase. God-Perid assay was used to determine the glucose released. The optimum temperature was tested over a range of temperatures (5-70 C). The reaction mixtures were set up in 300 µl of volume consisting sinigrin (2 mm), protein (25 ng) in citrate phosphate buffer ph 6.0, incubated for 30 min and glucose release was measured by God-Perid assay. To assess the the Michaelis-Menten constant (K m) and maximum velocity (V max) for sinigrin, mm range of sinigrin was incubated with cmyr (24 ng) in 300 µl of citrate phosphate buffer ph 6.0 at 25 C for 10 min then activity was determined by God-Perid assay. The Lineweaver-Burk plot method was used to determine K m and V max. The myrosinase activity of cmyr was tested using 2 mm of different glucosinolates (sinigrin, glucoiberin, progoitrin, glucoerucin, gluroraphanin, glucotrapaeolin, gluconasturtiin and glucobrassicin) by God-Perid assay (Chapter 2-section 2.3.6). The assay was undertaken at optimum temperature and buffer conditions for myrosinase activity. In addition, the stability of myrosinase activity of cmyr was tested in 20 mm citrate phosphate buffer ph 6.0 over 5 weeks at 4 C. 5.4 RESULTS Strain Identification and Preparation of Phylogenetic Tree Rossiter Group at Imperial College isolated a strain with myrosinase activity from soil. We found that this soil isolate belongs to the family Enterobacteriaceae and the genus Citrobacter. 16s rdna sequencing results matched with 20 known Citrobacter species. It was isolated from soil nearby Wye (Kent, UK) so named as C. WYE1 to show the origin of the isolate by Dr. John Rossiter before. 16s rdna could not assign the strain to a specific species so a phylogenetic tree was constructed (Figure 5.1). The results suggested that C. WYE1 is likely to be a new species. 154
173 Figure 5.1 Phylogenetic tree of C. WYE1 compared with other Citrobacter species. Draft genomes of different Citrobacter species were obtained from Genbank whole genome shotgun projects. Core genome SNPs in draft genomes and C. WYE1 were used to prepare the phylogenetic tree using the parsnp program Version 1.2 by Dr. Arnoud Van Vliet (IFR). 155
174 5.4.2 The Relevance of C. WYE1 Myrosinase to Other Myrosinases The protein sequence of cmyr was aligned with other myrosinases identified so far (Figure 5.2). There is a high homology among plant myrosinases from A. thaliana, Eutrema japonicum, S. alba, B. napus and B. oleracea var. alboglabra. The proton donor and nucleophile were reported to be Gln 207 and Glu 426 residues respectively in S. alba myrosinase obtained from Uniprot database and conserved among plant myrosinases aligned below (Figure 5.2). In B. brassicae myrosinase (aphid myrosinase), Glu 374 was reported to be the nucleophile and Glu 167 was reported as the proton donor [133]. These two key amino acid residues were not conserved in cmyr and it was found to be quite distinct from aphid and plant myrosinases. The importance of the conserved motif SDW in cmyr possessing aspartic acid (D) as the nucleophile was suggested by Albaser et al. (2016) [118]. 156
175 * 20 * 40 * CMYR : MLTAFKMNTVSLAVLVCLPLSVSASIQSAQQPELGYDTVPLLHLSGLSFK : 50 BREBR_Myro : ~~~~~~~~~~~~~~~~~~~~~~~~~~~~~~~~~~~~~~~~~~~~~~~~~~ : - ARATH_Myro : ~~~~~~~~~~~~~~~~~~~~~~~~~~~~~~~~~~~~~~~~~MKLLMLAFV : 9 EUTJA_Myro : ~~~~~~~~~~~~~~~~~~~~~~~~~~~~~~~~~~~~~~~~~MKLHGLALV : 9 SINAL_Myro : ~~~~~~~~~~~~~~~~~~~~~~~~~~~~~~~~~~~~~~~~MKLLHGLALV : 10 BRANA_Myro : ~~~~~~~~~~~~~~~~~~~~~~~~~~~~~~~~~~~~~~~~MKLLHGLALV : 10 BRAOA_Myro : ~~~~~~~~~~~~~~~~~~~~~~~~~~~~~~~~~~~~~~~~MKLLHGLALV : * 80 * 100 CMYR : DLNRDGKLNPYEDWRLSPQTRAADLVKRMSVAEKAGVMMHGTAPAEGSTF : 100 BREBR_Myro : ~~~~~~~~~~~~~~~~~~~~~~~~~~~~~~~~~~~~~~~~~~~~~MDYKF : 5 ARATH_Myro : FLLALATCKGD-E FVCEENEPFTCNQTKLFNSGNF : 43 EUTJA_Myro : FLLAVATCKAVED ITCQEKEPFTCSNTDSLNSKSF : 44 SINAL_Myro : FLLAAASCKADEE ITCEENEPFTCSNTDILSSKNF : 45 BRANA_Myro : FLLAAASCKADEE ITCEENNPFTCSNTDILSSKNF : 45 BRAOA_Myro : FLLAAASCKADEE ITCEENNPFTCSNTDILSSKNF : 45 * 120 * 140 * CMYR : GNGSVYDSEATRKMVVDAHVNSLITRLNGEEPARLAEQNNMIQKTAETTR : 150 BREBR_Myro : PKDFMFG : 12 ARATH_Myro : EKGFIFG : 50 EUTJA_Myro : GKDFIFG : 51 SINAL_Myro : GKDFIFG : 52 BRANA_Myro : GKDFIFG : 52 BRAOA_Myro : GKDFIFG : * 180 * 200 CMYR : LGIPVTISTDPRNSYQALVGISNPAG KFTQWPEAIGLGAAGSE : 193 BREBR_Myro : TSTASYQIEGGWNEDGKGENIWDRLVHTSPEVI-KDGTNGD : 52 ARATH_Myro : VASSAYQVEGG---RGRGLNVWDSFTHRFPEKGGADLGNGD : 88 EUTJA_Myro : VASSAYQIEGG---RGRGPNTWDAFTHRYPEKGGPDLANGD : 89 SINAL_Myro : VASSAYQIEGG---RGRGVNVWDGFSHRYPEKSGSDLKNGD : 90 BRANA_Myro : VASSAYQIEGG---RGRGVNVWDGFSHRYPEKAGSDLKNGD : 90 BRAOA_Myro : VASSAYQIEGG---RGRGVNVWDGFSHRYPEKSGSDLKNGD : 90 * 220 * 240 * CMYR : ALAQEYADHVRREYRAVGITEALSPQADITTEPRWARISGTFGEDPELAK : 243 BREBR_Myro : IACDSYHKYK----EDVAIIKDLNL-KFYRFSISWARIAPSG : 89 ARATH_Myro : TTCDSYTLWQ----KDIDVMDELNS-TGYRFSIAWSRLLPKG : 125 EUTJA_Myro : TTCESYTNWQ----KDIDIMDELNA-TGYRFSFAWSRIIPKG : 126 SINAL_Myro : TSCESYTRWK----KDVEIMGELNA-TGYRFSFAWSRIVPKG : 127 BRANA_Myro : TTCESYTRWQ----KDVDVMGELNA-TGYRFSFAWSRIIPKG : 127 BRAOA_Myro : TTCESYTRWQ----KDVDVMGELNA-TGYRFSFAWSRIIPKG : 127 Figure 5.2 The multiple alignment of cmyr with some of the identified myrosinases. The abbreviations were used for myrosinase from: CMYR; C. WYE1, BREBR (Q95X01); B. brassicae (aphid), ARAT (P37702); A. thaliana, EUTJA (Q4AE75); E. japonicum, SINAL (P29092); S. alba, BRANA (Q00326); B. napus, BRAO (A6XG32); B. oleracea var. alboglabra. The default settings were used for Clustal Omega. The entry numbers of sequences at Uniprot database are given in brackets. SDW motif was highlighted in red. The proton donor and nucleophile in S. alba myrosinase are in Gln 207 (Q) and Glu 426 (E) positions, respectively and they are highlighted in yellow. 157
176 260 * 280 * 300 CMYR : KLVRGYITGMQKGGQGLNPQSVAAVVKHWVGYGAAEDGWDGHNAYGKHTV : 293 BREBR_Myro : VM-NSLEPKGIA YYNN : 104 ARATH_Myro : KRSRGVNPGAIK YYNG : 141 EUTJA_Myro : KVSRGVNQGGLD YYHQ : 142 SINAL_Myro : KVSRGVDQAGLD YYHN : 143 BRANA_Myro : KVSRGVNQGGLD YYHK : 143 BRAOA_Myro : KVSRGVNQGGLD YYHK : 143 * 320 * 340 * CMYR : LSNESLQKHIIPFRGAFEANVAAVMPTYSVMKGVTWNGRE : 333 BREBR_Myro : LINELIKNDIIPLVTMYHWDLPQYLQD-----LGGWVNPIMSDYFKEYAR : 149 ARATH_Myro : LIDGLVAKNMTPFVTLFHWDLPQTLQD----EYNGFLNKTIVDDFKDYAD : 187 EUTJA_Myro : LIDGLIAKKITPFVTLYHWDLPQTLQD----EYEGFLNRTIIDDFRDYAD : 188 SINAL_Myro : LIDALLEKNITPFVTLFHWDLPQTLQD----EYEGFLDRQIIQDFKDYAD : 189 BRANA_Myro : LIDALLEKNITPFVTLFHWDLPQTLQD----EYEGFLDRQIIQDFKDYAD : 189 BRAOA_Myro : LIDALLEKNITPFVTLFHWDLPQTLQD----EYEGFLDRQIIQDFKDYAD : 189 Q 360 * 380 * 400 CMYR : : - BREBR_Myro : VLFTYFGDRVKWWITFNEPIAV-CKGYSIKAYAPNLN : 185 ARATH_Myro : LCFELFGDRVKNWITINQLYTVPTRGYALGTDAPGRCSPKID--VRCPGG : 235 EUTJA_Myro : LCFKEFGGKVKHWITINQLYTVPTRGYGIATDAPGRCSPAID--KRCYGG : 236 SINAL_Myro : LCFKEFGGKVKNWITINQLYTVPTRGYALGTDAPGRCSPKVDTKQRCYGG : 239 BRANA_Myro : LCFKEFGGKVKHWITINQLYTVPTRGYAIGTDAPGRCSPMVDTKHRCYGG : 239 BRAOA_Myro : LCFKEFGGKVKHWITINQLYTVPTRGYAIGTDAPGRCSPMVDTKHRCYGG : 239 SDW * 420 * 440 * CMYR : ---TEQVAAG----FSHFLLTDLLR------KQNNFSGVIISDWLITNDC : 370 BREBR_Myro : LKTTGHYLAGHTQLIAHGKAYRLYEEMFKPTQNGKISISISGVFFMPKNA : 235 ARATH_Myro : NSSTEPYIVAHNQLLAHAAAVDVYRTKYKDDQKGMIGPVMITRWFLPFDH : 285 EUTJA_Myro : NSSTEPYIVAHNQLLAHAAVVNLYRTKYKF-QGGKIGTVMITRWFLPFDE : 285 SINAL_Myro : NSSTEPYIVAHNQLLAHAAIVDLYRTNYAF-QNGKIGPVMITRWFLPYDE : 288 BRANA_Myro : NSSTEPYIVAHNQLLAHATVVDLYRTKYKF-QKGKIGPVMITRWFLPFDE : 288 BRAOA_Myro : NSSTEPYIVAHNQLLAHATVVDLYRTKYKF-QKGKIGPVMITRWFLPFDE : * 480 * 500 CMYR : DD-ECVNGSAPGKKPVAGGMPWGVESLSKERRFVKAVNAGIDQFGGVTDS : 419 BREBR_Myro : ESDDDIETAERA : 247 ARATH_Myro : SQ-ESKDATERA : 296 EUTJA_Myro : NDKDCIDATERM : 297 SINAL_Myro : SDPACIEAAERM : 300 BRANA_Myro : SDPASIEAAERM : 300 BRAOA_Myro : SDPASIEAAERM : 300 * 520 * 540 * CMYR : AVLVTAVEKGLITQARLDASVERILQQKFELGLFEQPYVDAKLAE---KI : 466 BREBR_Myro : NQFERGWFGHPVYKGDYPPIMKKW : 271 ARATH_Myro : KIFFHGWFMGPLTEGKYPDIMREY : 320 EUTJA_Myro : KEFFFGWFMEPLTKGRYPDIMRKI : 321 SINAL_Myro : NQFFHGWYMEPLTKGRYPDIMRQI : 324 BRANA_Myro : NQFFHGWYMEPLTKGRYPDIMRQI : 324 BRAOA_Myro : NQFFHGWYMEPLTKGRYPDIMRQI :
177 Figure 5.2-Continued 560 * 580 * 600 CMYR : VGAPDTKK AADDAQFRTLV------LLQNKNIL : 493 BREBR_Myro : VDQKSKEEGLPWSKLPKFTKDEIKLLKGTADFYALNHYSSRLVTFGSDPN : 321 ARATH_Myro : VG DRLPEFSETEAALVKGSYDFLGLNYYVTQYAQNNQTIV : 360 EUTJA_Myro : VG SKLPNFTEAEARQVAGSYDFLGLNYYVTQYAQPTKTIV : 361 SINAL_Myro : VG SRLPNFTEAEAELVAGSYDFLGLNYYVTQYAKPKPNPY : 364 BRANA_Myro : VG SRLPNFTEEEAELVAGSYDFLGLNYYVTQYAQPKPNPY : 364 BRAOA_Myro : VG SRLPNFTEEEAELVAGSYDFLGLNYYVTQYAQPKPNPY : 364 * 620 * 640 * CMYR : PLKPGTKVWLYGADKSA----AEKAGLEV VSEPEDADV : 527 BREBR_Myro : PNFNPDASYVTSVDEAW LKPNETPYIIPVPEGLRK : 356 ARATH_Myro : PSDVHTALMDSRTTLTSKNATGHAPGPPF------NAAS--YYYPKGIYY : 402 EUTJA_Myro : PPENHTAMMDANVTLTYVNSRGELIGPLFAKDDDPKKNS--YYYPKGIYF : 409 SINAL_Myro : PSETHTALMDAGVDLTFNNSRGEYPGPVFAED----ANS--YYYPKGIYY : 408 BRANA_Myro : PSETHTAMMDAGVKLTYDNSRGEFLGPLFVEDK-VNGNS--YYYPKGIYY : 411 BRAOA_Myro : PSETHTAMMDAGVKLTYDNSRGEFLGPLFVEDK-VNGNS--YYYPKGIYY : 411 E 660 * 680 * 700 CMYR : ALMRTSAPFEQPHYNYFFGRRHHEGSLEYREDNKDFAVLKRVSKHTPVIM : 577 BREBR_Myro : LLIWLKNEYGNPQLLITENGYGDDGQ------LDDFEKISYLKNYLNATL : 400 ARATH_Myro : VMDYFKTTYGDPLIYVTENGFSTPGDEDFEKATADYKRIDYLCSHLCFLS : 452 EUTJA_Myro : VMDHFRTRYFNPLIYVTENGISSPGTEPREVAIADSKRIDYLCSHLCFLR : 459 SINAL_Myro : VMDYFKTKYNNPLIYITENGISTPGSESRCEAIADYKRINYLCSHLCFLR : 458 BRANA_Myro : VMDYFKTKYGDPLIYVTENGFSTPSSENREQAIADYKRIDYLCSHLCFLR : 461 BRAOA_Myro : VMDYFKTKYGDPLIYVTENGFSTPSSENREQAIADYKRIDYLCSHLCFLR : 461 * 720 * 740 * CMYR : TMYMERPA VLTNVTDKTSGFIANFGLSDEVFFSRLTSDTPYT : 619 BREBR_Myro : QAMYEDKCNVIGYTVWSLLDNFEWFYGYSIHFGLVKIDFND-PQRTRTKR : 449 ARATH_Myro : KVIKEKNVNVKGYFAWSLGDNYEFCNGFTVRFGLSYVDFAN-ITGDRDLK : 501 EUTJA_Myro : KVIKETGVNVKGYFAWSLGDNYEFCKGFTVRFGLSYVNWTD-VT-DRNLK : 507 SINAL_Myro : KVIREKGVNIRGYFAWALGDNYEFCKGFTVRFGLSYVNWDD-LD-DRNLK : 506 BRANA_Myro : KVIKEKGVNVRGYFAWALGDNYEFCKGFTVRFGLSYVNWED-LD-DRNLK : 509 BRAOA_Myro : KVIKEEGVNVRGYFAWALGDNYEFCKGFTVRFGLSYVNWED-LD-DRNLK : * 780 * 800 CMYR : ARL PFALPSSMASVLKQKSDEPDDLDTPLFQRG : 652 BREBR_Myro : ESYTYFKNVVSTGKP~~~~~~~~~~~~~~~~~~~~~~~~~~~~~~~~~~~ : 464 ARATH_Myro : ASGKWFQKFINVTDED-STNQDLLRSSVSSKNRDR----KSLADA~~~~~ : 541 EUTJA_Myro : DSGKWYQRFINVTTNNPPAKQDFLRSSLSFHNKNL ADA~~~~~ : 545 SINAL_Myro : ESGKWYQRFINGTAKN-PVKQDFLRSSLSSQSQKK----R-LAC~~~~~~ : 544 BRANA_Myro : ESGKWYQRFINGTVKN-AVKQDFLRSSLSSQSQKK----R-FADA~~~~~ : 548 BRAOA_Myro : ESGKWYQRFINGTVKN-SAKQDFLRSSLSSQSQKK----R-LADA~~~~~ : 548 CMYR : FGLTR : 657 BREBR_Myro : ~~~~~ : - ARATH_Myro : ~~~~~ : - EUTJA_Myro : ~~~~~ : - SINAL_Myro : ~~~~~ : - BRANA_Myro : ~~~~~ : - BRAOA_Myro : ~~~~~ : - Figure 5.2 Continued 159
. After transformation of recombinant vector into E.")
178 5.4.3 Cloning and Expression of Myrosinase Gene The gene insert was amplified by PCR. The predicted size of the insert was 1998 bp as shown by gel electrophoresis (See Figure 5.3). In addition, double digested pet28b vector was run on DNA gel (Figure 5.3). After transformation of recombinant vector into E. coli DH5α cells, transformants on plates (10 clonies were picked) were checked by colony PCR, results are given in Figure 5.4. Figure 5.3 Agarose gel electrophoresis of cmyr insert and double digested pet28b vector. Samples were run on 1% agarose gel. l; hyperladder, c (-); negative control for PCR (PCR was set up without any genomic DNA), ins; cmyr insert, vec; Nde/XhoI digested pet28b. The expected size of colony PCR products with correct gene insert was 2190 bp and expected sizes of the product bands from all transformants were observed (Figure 5.4). One of the positive transformants was used for the recombinant plasmid preparation. This recombinant plasmid was sequenced and confirmed to have no mutation in the gene insert. This recombinant plasmid was transformed into E. coli BL21(DE3) and the induction of protein expression was performed by addition of IPTG. 160
, c2; positive control for PCR (PCR was set up with pet28b vector), 1-10; PCR products of selected colonies.")
179 Figure 5.4 Agarose gel electrophoresis for colony PCR experiments. PCR products were run on 1% agarose gel. l; hyperladder, c1; negative control for PCR (PCR was set up without any genomic DNA), c2; positive control for PCR (PCR was set up with pet28b vector), 1-10; PCR products of selected colonies. Soluble and insoluble extracts from protein expression were run on SDS-PAGE gel (Figure 5.5). Protein expression at 25 C for 24 h resulted in yield of expressed cmyr in the soluble fraction (Figure 5.5- the protein band is shown) compared to protein expression at 37 C for 3 h. Protein expression at 37 C for 3 h results in cmyr to be in the insoluble fraction (Figure 5.5- Lane 8). 161

180 Figure 5.5 SDS-PAGE of the CFEs from E. coli BL21 (DE3) expressing pet28b-cmyr. 10 µg of protein was loaded per lane. M: See Blue Protein Marker, 1-2: soluble and insoluble CFEs obtained from uninduced E. coli BL21 (DE3) expressing pet28b-cmyr grown at 25 C for 24 h respectively, 3-4: soluble and insoluble CFEs obtained from induced (at 25 C for 24 h) E. coli BL21 (DE3) expressing pet28b-cmyr respectively, 5-6: soluble and insoluble CFEs obtained from uninduced E. coli BL21 (DE3) expressing pet28b-cmyr grown at 37 C for 3 h respectively. 7-8: soluble and insoluble CFEs obtained from induced (at 37 C for 3 h) E. coli BL21 (DE3) expressing pet28b-cmyr respectively. Protein gel was run on 4-12% Bis-Tris gel under denaturing, reducing conditions in MES buffer. Insoluble CFEs were difficult to load on gel so the protein bands are not as clear as soluble ones Western Blotting and Purification of Myrosinase The CFEs were prepared and checked for the presence of 6X-His tag by Western blot (Figure 5.6) using a His-tag antibody (Novagen). When protein expression was performed at 25 C for 4 h instead of 24 h and it also produced a better yield of cmyr protein. The expected protein size of cmyr with N- and C-terminal 6X-His tags was 75 kda. Recombinant proteins with expected protein sizes were found to be recognised by the His-tag antibody so purification of cmyr using Ni-NTA column was performed. 162
 Protein gel where CFEs were run on 4-12% Bis-Tris gel under denaturing, reducing conditions in MES buffer. b) Western blot (using anti-his tag antibody) within the same order of protein gel in a.")
181 Figure 5.6 SDS-PAGE of soluble and insoluble extracts from E. coli BL21(DE3) expressing pet28b-cmyr. a) Protein gel where CFEs were run on 4-12% Bis-Tris gel under denaturing, reducing conditions in MES buffer. b) Western blot (using anti-his tag antibody) within the same order of protein gel in a. 10 µg of protein was loaded per lane. 1; E. coli BL21(DE3) pet28b soluble CFE, 2; A protein with 6XHis-tag (positive control for Western blotting), 3-4; Soluble and insoluble CFEs of uninduced cells grown at 25 C for 4 h, 5-6; Soluble and insoluble CFEs of induced (25 C, 4 h) cells, 7-8; Soluble and insoluble CFEs of uninduced cells grown at 37 C for 3 h, 9-10; Soluble and insoluble CFEs of induced (37 C, 3 h) cells. The cmyr was purified by Ni-NTA column (Figure 5.7) and the protein levels were quantified by the Bradford assay. 163
182 M L FT W1 W2 E1 E2 E3 98 kda Figure 5.7 SDS-PAGE of the Ni-NTA purified Cmyr protein from E. coli BL21 (DE3) expressing pet28b-cmyr µl of fractions were loaded per lane. Proteins were run on 4-12% Bis-Tris Gel under denaturing, reducing conditions in MES buffer. L: Lysate, FT: Flow through, W: Wash, E: Eluate, M; Protein marker. The expected protein size of cmyr with N- and C-terminal 6X-His tags was 75 kda. The presence of two strong bands in the Western Blot (Figure 5.6 b- Lane 10) was observed. It was hypothesized that these bands might present the whole protein and the protein with signal peptide cleaved off. This was further investigated by intact mass analysis after purification of cmyr. When cmyr has two 6XHis-tags at N and C terminal site, the predicted size of the protein is ~75 kda. However if the signal peptide was cleaved off then the predicted size is ~70 kda. Intact mass analysis showed that cmyr has a measured mass of 70,332 Da so, it was suggesting that the signal peptide was cleaved off correctly (See Figure 5.8 for MS chromatogram) as predicted size of recombinant cmyr without signal peptide is ~70 kda. Purified, dialysed and filtered cmyr was adjusted to a concentration of 10 mg/ml and the sample was sent to Imperial College London for crystallography. This part of the study is still ongoing. 164

183 Figure 5.8 The MS spectrum for cmyr. Appropriate fragments of cmyr were determined in positive MS-TOF Myrosinase Activity of Recombinant cmyr The myrosinase activity of dialysed and undialysed proteins were tested by God-Perid assay. The results showed that recombinant cmyr was active against sinigrin. Dialysis had a positive effect on myrosinase activity of proteins. When the eluate was used in the assay without dialysis, it showed an activity of 25.4 ± 0.74 µmol glucose/min/mg enzyme. Dialysed eluate of Cmyr had a specific enzyme activity of 57.2 ± 9.4 µmol glucose/min/mg enzyme. Dialysed protein showed more than two fold higher enzyme activity compared to the enzyme activity of undialysed protein. S. alba myrosinase (Sigma Aldrich) was used as a positive control and gave a positive result for myrosinase activity (0.33 ± 0.05 µmol glucose/min/mg enzyme). Negative control (without protein) did not show any myrosinase activity. When myrosinase activity of cmyr was tested in 20 mm citrate phosphate buffer within a ph range of , ph 6.0 was found to be optimum for myrosinase activity (Figure 5.9). The myrosinase activity was found to be gradually reduced above ph
Proteins are sometimes only produced in one cell type or cell compartment (brain has 15,000 expressed proteins, gut has 2,000).
.") Lecture 2: Principles of Protein Structure: Amino Acids Why study proteins? Proteins underpin every aspect of biological activity and therefore are targets for drug design and medicinal therapy, and in
Lecture 2: Principles of Protein Structure: Amino Acids Why study proteins? Proteins underpin every aspect of biological activity and therefore are targets for drug design and medicinal therapy, and in
Chemical Nature of the Amino Acids. Table of a-amino Acids Found in Proteins
 Chemical Nature of the Amino Acids All peptides and polypeptides are polymers of alpha-amino acids. There are 20 a- amino acids that are relevant to the make-up of mammalian proteins (see below). Several
Biomolecules: amino acids
 Biomolecules: amino acids Amino acids Amino acids are the building blocks of proteins They are also part of hormones, neurotransmitters and metabolic intermediates There are 20 different amino acids in
Objective: You will be able to explain how the subcomponents of
 Objective: You will be able to explain how the subcomponents of nucleic acids determine the properties of that polymer. Do Now: Read the first two paragraphs from enduring understanding 4.A Essential knowledge:
Reactions and amino acids structure & properties
 Lecture 2: Reactions and amino acids structure & properties Dr. Sameh Sarray Hlaoui Common Functional Groups Common Biochemical Reactions AH + B A + BH Oxidation-Reduction A-H + B-OH + energy ª A-B + H
Moorpark College Chemistry 11 Fall Instructor: Professor Gopal. Examination # 5: Section Five May 7, Name: (print)
") Moorpark College Chemistry 11 Fall 2013 Instructor: Professor Gopal Examination # 5: Section Five May 7, 2013 Name: (print) Directions: Make sure your examination contains TEN total pages (including this
Moorpark College Chemistry 11 Fall 2013 Instructor: Professor Gopal Examination # 5: Section Five May 7, 2013 Name: (print) Directions: Make sure your examination contains TEN total pages (including this
Biological systems interact, and these systems and their interactions possess complex properties. STOP at enduring understanding 4A
 Biological systems interact, and these systems and their interactions possess complex properties. STOP at enduring understanding 4A Homework Watch the Bozeman video called, Biological Molecules Objective:
Amino acids-incorporated nanoflowers with an
 Amino acids-incorporated nanoflowers with an intrinsic peroxidase-like activity Zhuo-Fu Wu 1,2,+, Zhi Wang 1,+, Ye Zhang 3, Ya-Li Ma 3, Cheng-Yan He 4, Heng Li 1, Lei Chen 1, Qi-Sheng Huo 3, Lei Wang 1,*
Page 8/6: The cell. Where to start: Proteins (control a cell) (start/end products)
 (start/end products)") Page 8/6: The cell Where to start: Proteins (control a cell) (start/end products) Page 11/10: Structural hierarchy Proteins Phenotype of organism 3 Dimensional structure Function by interaction THE PROTEIN
Page 8/6: The cell Where to start: Proteins (control a cell) (start/end products) Page 11/10: Structural hierarchy Proteins Phenotype of organism 3 Dimensional structure Function by interaction THE PROTEIN
Amino Acids. Amino Acids. Fundamentals. While their name implies that amino acids are compounds that contain an NH. 3 and CO NH 3
 Fundamentals While their name implies that amino acids are compounds that contain an 2 group and a 2 group, these groups are actually present as 3 and 2 respectively. They are classified as α, β, γ, etc..
LAB#23: Biochemical Evidence of Evolution Name: Period Date :
 LAB#23: Biochemical Evidence of Name: Period Date : Laboratory Experience #23 Bridge Worth 80 Lab Minutes If two organisms have similar portions of DNA (genes), these organisms will probably make similar
Cells N5 Homework book
 1 Cells N5 Homework book 2 Homework 1 3 4 5 Homework2 Cell Ultrastructure and Membrane 1. Name and give the function of the numbered organelles in the cell below: A E B D C 2. Name 3 structures you might
Midterm 1 Last, First
 Midterm 1 BIS 105 Prof. T. Murphy April 23, 2014 There should be 6 pages in this exam. Exam instructions (1) Please write your name on the top of every page of the exam (2) Show all work for full credit
1. Describe the relationship of dietary protein and the health of major body systems.
 Food Explorations Lab I: The Building Blocks STUDENT LAB INVESTIGATIONS Name: Lab Overview In this investigation, you will be constructing animal and plant proteins using beads to represent the amino acids.
1-To know what is protein 2-To identify Types of protein 3- To Know amino acids 4- To be differentiate between essential and nonessential amino acids
 Amino acids 1-To know what is protein 2-To identify Types of protein 3- To Know amino acids 4- To be differentiate between essential and nonessential amino acids 5-To understand amino acids synthesis Amino
9/6/2011. Amino Acids. C α. Nonpolar, aliphatic R groups
 Amino Acids Side chains (R groups) vary in: size shape charge hydrogen-bonding capacity hydrophobic character chemical reactivity C α Nonpolar, aliphatic R groups Glycine (Gly, G) Alanine (Ala, A) Valine
Molecular Biology. general transfer: occurs normally in cells. special transfer: occurs only in the laboratory in specific conditions.
 Chapter 9: Proteins Molecular Biology replication general transfer: occurs normally in cells transcription special transfer: occurs only in the laboratory in specific conditions translation unknown transfer:
Short polymer. Dehydration removes a water molecule, forming a new bond. Longer polymer (a) Dehydration reaction in the synthesis of a polymer
 Dehydration reaction in the synthesis of a polymer") HO 1 2 3 H HO H Short polymer Dehydration removes a water molecule, forming a new bond Unlinked monomer H 2 O HO 1 2 3 4 H Longer polymer (a) Dehydration reaction in the synthesis of a polymer HO 1 2 3
HO 1 2 3 H HO H Short polymer Dehydration removes a water molecule, forming a new bond Unlinked monomer H 2 O HO 1 2 3 4 H Longer polymer (a) Dehydration reaction in the synthesis of a polymer HO 1 2 3
Four Classes of Biological Macromolecules. Biological Macromolecules. Lipids
 Biological Macromolecules Much larger than other par4cles found in cells Made up of smaller subunits Found in all cells Great diversity of func4ons Four Classes of Biological Macromolecules Lipids Polysaccharides
(30 pts.) 16. (24 pts.) 17. (20 pts.) 18. (16 pts.) 19. (5 pts.) 20. (5 pts.) TOTAL (100 points)
 16. (24 pts.) 17. (20 pts.) 18. (16 pts.) 19. (5 pts.) 20. (5 pts.) TOTAL (100 points)") Moorpark College Chemistry 11 Spring 2009 Instructor: Professor Torres Examination # 5: Section Five April 30, 2009 ame: (print) ame: (sign) Directions: Make sure your examination contains TWELVE total
Moorpark College Chemistry 11 Spring 2009 Instructor: Professor Torres Examination # 5: Section Five April 30, 2009 ame: (print) ame: (sign) Directions: Make sure your examination contains TWELVE total
Biomolecules Amino Acids & Protein Chemistry
 Biochemistry Department Date: 17/9/ 2017 Biomolecules Amino Acids & Protein Chemistry Prof.Dr./ FAYDA Elazazy Professor of Biochemistry and Molecular Biology Intended Learning Outcomes ILOs By the end
CS612 - Algorithms in Bioinformatics
 Spring 2016 Protein Structure February 7, 2016 Introduction to Protein Structure A protein is a linear chain of organic molecular building blocks called amino acids. Introduction to Protein Structure Amine
For questions 1-4, match the carbohydrate with its size/functional group name:
 Chemistry 11 Fall 2013 Examination #5 PRACTICE 1 For the first portion of this exam, select the best answer choice for the questions below and mark the answers on your scantron. Then answer the free response
Lipids: diverse group of hydrophobic molecules
 Lipids: diverse group of hydrophobic molecules Lipids only macromolecules that do not form polymers li3le or no affinity for water hydrophobic consist mostly of hydrocarbons nonpolar covalent bonds fats
Key Words: Brassica oleraceae, glucosinolate, liquid chromatography mass spectrometry, FNH-I-003
 IDENTIFICATION OF MAJOR GLUCOSINOLATES IN BROCCOLI (Brassica oleracea var. italica) BY LIQUID CHROMATOGRAPHY MASS SPECTROMETRY (LC-MS) AND DETERMINATION OF ANTICANCER PROPERTIES OF BROCCOLI EXTRACTS Carlos
For questions 1-4, match the carbohydrate with its size/functional group name:
 Chemistry 11 Fall 2013 Examination #5 PRACTICE 1 ANSWERS For the first portion of this exam, select the best answer choice for the questions below and mark the answers on your scantron. Then answer the
Biochemistry 2 Recita0on Amino Acid Metabolism
 Biochemistry 2 Recita0on Amino Acid Metabolism 04-20- 2015 Glutamine and Glutamate as key entry points for NH 4 + Amino acid catabolism Glutamine synthetase enables toxic NH 4 + to combine with glutamate
Metabolism of amino acids. Vladimíra Kvasnicová
 Metabolism of amino acids Vladimíra Kvasnicová Classification of proteinogenic AAs -metabolic point of view 1) biosynthesis in a human body nonessential (are synthesized) essential (must be present in
PROTEINS. Building blocks, structure and function. Aim: You will have a clear picture of protein construction and their general properties
 PROTEINS Building blocks, structure and function Aim: You will have a clear picture of protein construction and their general properties Reading materials: Compendium in Biochemistry, page 13-49. Microbiology,
Catabolism of Carbon skeletons of Amino acids. Amino acid metabolism
 Catabolism of Carbon skeletons of Amino acids Amino acid metabolism Carbon skeleton Carbon Skeleton a carbon skeleton is the internal structure of organic molecules. Carbon Arrangements The arrangement
(65 pts.) 27. (10 pts.) 28. (15 pts.) 29. (10 pts.) TOTAL (100 points) Moorpark College Chemistry 11 Spring Instructor: Professor Gopal
 27. (10 pts.) 28. (15 pts.) 29. (10 pts.) TOTAL (100 points) Moorpark College Chemistry 11 Spring Instructor: Professor Gopal") Moorpark College Chemistry 11 Spring 2012 Instructor: Professor Gopal Examination # 5: Section Five May 1, 2012 Name: (print) GOOD LUCK! Directions: Make sure your examination contains TWELVE total pages
Moorpark College Chemistry 11 Spring 2012 Instructor: Professor Gopal Examination # 5: Section Five May 1, 2012 Name: (print) GOOD LUCK! Directions: Make sure your examination contains TWELVE total pages
If you like us, please share us on social media. The latest UCD Hyperlibrary newsletter is now complete, check it out.
 Sign In Forgot Password Register username username password password Sign In If you like us, please share us on social media. The latest UCD Hyperlibrary newsletter is now complete, check it out. ChemWiki
PLANT SCIENCE MEETS FOOD SCIENCE: GENETIC EFFECTS OF GLUCOSINOLATE DEGRADATION DURING FOOD PROCESSING IN BRASSICA
 PLANT SCIENCE MEETS FOOD SCIENCE: GENETIC EFFECTS OF GLUCOSINOLATE DEGRADATION DURING FOOD PROCESSING IN BRASSICA Kristin Hennig Thesis committee Thesis supervisor Prof. dr. ir. Martinus A. J. S. van Boekel
Properties of amino acids in proteins
 Properties of amino acids in proteins one of the primary roles of DNA (but far from the only one!!!) is to code for proteins A typical bacterium builds thousands types of proteins, all from ~20 amino acids
The Structure and Function of Large Biological Molecules Part 4: Proteins Chapter 5
 Key Concepts: The Structure and Function of Large Biological Molecules Part 4: Proteins Chapter 5 Proteins include a diversity of structures, resulting in a wide range of functions Proteins Enzymatic s
CHM333 LECTURE 6: 1/25/12 SPRING 2012 Professor Christine Hrycyna AMINO ACIDS II: CLASSIFICATION AND CHEMICAL CHARACTERISTICS OF EACH AMINO ACID:
 AMINO ACIDS II: CLASSIFICATION AND CHEMICAL CHARACTERISTICS OF EACH AMINO ACID: - The R group side chains on amino acids are VERY important. o Determine the properties of the amino acid itself o Determine
Chemistry 121 Winter 17
 Chemistry 121 Winter 17 Introduction to Organic Chemistry and Biochemistry Instructor Dr. Upali Siriwardane (Ph.D. Ohio State) E-mail: upali@latech.edu Office: 311 Carson Taylor Hall ; Phone: 318-257-4941;
Biochemistry: A Short Course
 Tymoczko Berg Stryer Biochemistry: A Short Course Second Edition CHAPTER 30 Amino Acid Degradation and the Urea Cycle 2013 W. H. Freeman and Company Chapter 30 Outline Amino acids are obtained from the
Glucosinolates in Brassica foods: bioavailability in food and significance for human health
 Phytochem Rev (2008) 7:213 229 DOI 10.1007/s11101-007-9072-2 Glucosinolates in Brassica foods: bioavailability in food and significance for human health María Elena Cartea Æ Pablo Velasco Received: 11
Biochemistry - I. Prof. S. Dasgupta Department of Chemistry Indian Institute of Technology, Kharagpur Lecture 1 Amino Acids I
 Biochemistry - I Prof. S. Dasgupta Department of Chemistry Indian Institute of Technology, Kharagpur Lecture 1 Amino Acids I Hello, welcome to the course Biochemistry 1 conducted by me Dr. S Dasgupta,
Cells. Variation and Function of Cells
 Cells Variation and Function of Cells Plasma Membrane= the skin of a cell, it protects and nourishes the cell while communicating with other cells at the same time. Lipid means fat and they are hydrophobic
The Structure and Function of Macromolecules
 The Structure and Function of Macromolecules Macromolecules are polymers Polymer long molecule consisting of many similar building blocks. Monomer the small building block molecules. Carbohydrates, proteins
Nitrogen Metabolism. Overview
 Nitrogen Metabolism Pratt and Cornely Chapter 18 Overview Nitrogen assimilation Amino acid biosynthesis Nonessential aa Essential aa Nucleotide biosynthesis Amino Acid Catabolism Urea Cycle Juicy Steak
Macromolecules of Life -3 Amino Acids & Proteins
 Macromolecules of Life -3 Amino Acids & Proteins Shu-Ping Lin, Ph.D. Institute of Biomedical Engineering E-mail: splin@dragon.nchu.edu.tw Website: http://web.nchu.edu.tw/pweb/users/splin/ Amino Acids Proteins
Copyright 2008 Pearson Education, Inc., publishing as Pearson Benjamin Cummings
 Concept 5.4: Proteins have many structures, resulting in a wide range of functions Proteins account for more than 50% of the dry mass of most cells Protein functions include structural support, storage,
Classification of amino acids: -
 Page 1 of 8 P roteinogenic amino acids, also known as standard, normal or primary amino acids are 20 amino acids that are incorporated in proteins and that are coded in the standard genetic code (subunit
Nitrogen Metabolism. Overview
 Nitrogen Metabolism Pratt and Cornely Chapter 18 Overview Nitrogen assimilation Amino acid biosynthesis Nonessential aa Essential aa Nucleotide biosynthesis Amino Acid Catabolism Urea Cycle Juicy Steak
Nitrogen Metabolism. Pratt and Cornely Chapter 18
 Nitrogen Metabolism Pratt and Cornely Chapter 18 Overview Nitrogen assimilation Amino acid biosynthesis Nonessential aa Essential aa Nucleotide biosynthesis Amino Acid Catabolism Urea Cycle Juicy Steak
2. Which of the following amino acids is most likely to be found on the outer surface of a properly folded protein?
 Name: WHITE Student Number: Answer the following questions on the computer scoring sheet. 1 mark each 1. Which of the following amino acids would have the highest relative mobility R f in normal thin layer
This exam consists of two parts. Part I is multiple choice. Each of these 25 questions is worth 2 points.
 MBB 407/511 Molecular Biology and Biochemistry First Examination - October 1, 2002 Name Social Security Number This exam consists of two parts. Part I is multiple choice. Each of these 25 questions is
Chapter 3: Amino Acids and Peptides
 Chapter 3: Amino Acids and Peptides BINF 6101/8101, Spring 2018 Outline 1. Overall amino acid structure 2. Amino acid stereochemistry 3. Amino acid sidechain structure & classification 4. Non-standard
Biology. Lectures winter term st year of Pharmacy study
 Biology Lectures winter term 2008 1 st year of Pharmacy study 3 rd Lecture Chemical composition of living matter chemical basis of life. Atoms, molecules, organic compounds carbohydrates, lipids, proteins,
Gentilucci, Amino Acids, Peptides, and Proteins. Peptides and proteins are polymers of amino acids linked together by amide bonds CH 3
 Amino Acids Peptides and proteins are polymers of amino acids linked together by amide bonds Aliphatic Side-Chain Amino Acids - - H CH glycine alanine 3 proline valine CH CH 3 - leucine - isoleucine CH
Review Glucosinolates in Brassica vegetables: The influence of the food supply chain on intake, bioavailability and human health
 Mol. Nutr. Food Res. 2009, 53, 000 000 DOI 10.1002/mnfr.200800065 1 Review Glucosinolates in Brassica vegetables: The influence of the food supply chain on intake, bioavailability and human health Ruud
Introduction to Biochemistry Midterm exam )ومن أحياها(
ومن أحياها(") Introduction to Biochemistry Midterm exam 2016-2017 )ومن أحياها( 1. Which of the following amino (in a peptide chain) would probably be found at a beta bend or turn? a. lysine * b. Gly c. arg d. asn 2.
Introduction to Biochemistry Midterm exam 2016-2017 )ومن أحياها( 1. Which of the following amino (in a peptide chain) would probably be found at a beta bend or turn? a. lysine * b. Gly c. arg d. asn 2.
MODULE No.26: Drug Metabolism
 SUBJECT Paper No. and Title Module No. and Title Module Tag PAPER No. 9: Drugs of Abuse MODULE No. 26: Drug Metabolism FSC_P9_M26 TABLE OF CONTENTS 1. Learning Outcomes 2. Introduction 3. Sites of Drug
Amino acid metabolism
 Amino acid metabolism The important reaction commonly employed in the breakdown of an amino acid is always the removal of its -amino group. The product ammonia is excreted after conversion to urea or other
Biochemistry 423 Final Examination NAME:
 Biochemistry 423 Final Examination NAME: 1 Circle the single BEST answer (3 points each) 1. At equilibrium the free energy of a reaction G A. depends only on the temperature B. is positive C. is 0 D. is
THE Glucosinolates & Cyanogenic Glycosides
 THE Glucosinolates & Cyanogenic Glycosides Assimilatory Sulphate Reduction - Animals depend on organo-sulphur - In contrast, plants and other organisms (e.g. fungi, bacteria) can assimilate it - Sulphate
Biology and Biochemistry of Glucosinolates
 Annu. Rev. Plant Biol. 2006. 57:303 33 The Annual Review of Plant Biology is online at plant.annualreviews.org doi: 10.1146/ annurev.arplant.57.032905.105228 Copyright c 2006 by Annual Reviews. All rights
AMINO ACID METABOLISM. Sri Widia A Jusman Dept. of Biochemistry & Molecular Biology FMUI
 AMINO ACID METABOLISM Sri Widia A Jusman Dept. of Biochemistry & Molecular Biology FMUI Amino acids derived from dietary protein absorbed from intestine through blood taken up by tissues used for biosynthesis
number Done by Corrected by Doctor Dr.Diala
 number 32 Done by Mousa Salah Corrected by Bahaa Najjar Doctor Dr.Diala 1 P a g e In the last lecture we talked about the common processes between all amino acids which are: transamination, deamination,
Amino acids. (Foundation Block) Dr. Essa Sabi
 Dr. Essa Sabi") Amino acids (Foundation Block) Dr. Essa Sabi Learning outcomes What are the amino acids? General structure. Classification of amino acids. Optical properties. Amino acid configuration. Non-standard amino
Amino acids (Foundation Block) Dr. Essa Sabi Learning outcomes What are the amino acids? General structure. Classification of amino acids. Optical properties. Amino acid configuration. Non-standard amino
Amino Acids. Review I: Protein Structure. Amino Acids: Structures. Amino Acids (contd.) Rajan Munshi
 Rajan Munshi") Review I: Protein Structure Rajan Munshi BBSI @ Pitt 2005 Department of Computational Biology University of Pittsburgh School of Medicine May 24, 2005 Amino Acids Building blocks of proteins 20 amino acids
Review I: Protein Structure Rajan Munshi BBSI @ Pitt 2005 Department of Computational Biology University of Pittsburgh School of Medicine May 24, 2005 Amino Acids Building blocks of proteins 20 amino acids
1. (38 pts.) 2. (25 pts.) 3. (15 pts.) 4. (12 pts.) 5. (10 pts.) Bonus (12 pts.) TOTAL (100 points)
 2. (25 pts.) 3. (15 pts.) 4. (12 pts.) 5. (10 pts.) Bonus (12 pts.) TOTAL (100 points)") Moorpark College Chemistry 11 Spring 2010 Instructor: Professor Torres Examination #5: Section Five May 4, 2010 ame: (print) ame: (sign) Directions: Make sure your examination contains TWELVE total pages
Moorpark College Chemistry 11 Spring 2010 Instructor: Professor Torres Examination #5: Section Five May 4, 2010 ame: (print) ame: (sign) Directions: Make sure your examination contains TWELVE total pages
Bio 366: Biological Chemistry II Test #1, 100 points (7 pages)
") Bio 366: Biological Chemistry II Test #1, 100 points (7 pages) READ THIS: Take a numbered test and sit in the seat with that number on it. Remove the numbered sticker from the desk, and stick it on the
Bio 366: Biological Chemistry II Test #1, 100 points (7 pages) READ THIS: Take a numbered test and sit in the seat with that number on it. Remove the numbered sticker from the desk, and stick it on the
Macromolecules Structure and Function
 Macromolecules Structure and Function Within cells, small organic molecules (monomers) are joined together to form larger molecules (polymers). Macromolecules are large molecules composed of thousands
Introduction to proteins and protein structure
 Introduction to proteins and protein structure The questions and answers below constitute an introduction to the fundamental principles of protein structure. They are all available at [link]. What are
CHAPTER 21: Amino Acids, Proteins, & Enzymes. General, Organic, & Biological Chemistry Janice Gorzynski Smith
 CHAPTER 21: Amino Acids, Proteins, & Enzymes General, Organic, & Biological Chemistry Janice Gorzynski Smith CHAPTER 21: Amino Acids, Proteins, Enzymes Learning Objectives: q The 20 common, naturally occurring
Proteins consist in whole or large part of amino acids. Simple proteins consist only of amino acids.
 Today we begin our discussion of the structure and properties of proteins. Proteins consist in whole or large part of amino acids. Simple proteins consist only of amino acids. Conjugated proteins contain
Chapter 4: Information and Knowledge in the Protein Insulin
 Chapter 4: Information and Knowledge in the Protein Insulin This chapter will calculate the information and molecular knowledge in a real protein. The techniques discussed in this chapter to calculate
Chapter 5: Structure and Function of Macromolecules AP Biology 2011
 Chapter 5: Structure and Function of Macromolecules AP Biology 2011 1 Macromolecules Fig. 5.1 Carbohydrates Lipids Proteins Nucleic Acids Polymer - large molecule consisting of many similar building blocks
Amino Acids. Lecture 4: Margaret A. Daugherty. Fall Swiss-prot database: How many proteins? From where?
 Lecture 4: Amino Acids Margaret A. Daugherty Fall 2004 Swiss-prot database: How many proteins? From where? 1986 Use http://us.expasy.org to get to swiss-prot database Proteins are the workhorses of the
Amino Acid Metabolism
 Amino Acid Metabolism Last Week Most of the Animal Kingdom = Lazy - Most higher organisms in the animal kindom don t bother to make all of the amino acids. - Instead, we eat things that make the essential
Chapter 4. Drug Biotransformation
 Chapter 4 Drug Biotransformation Drug Biotransformation 1 Why is drug biotransformation necessary 2 The role of biotransformation in drug disposition 3 Where do drug biotransformation occur 4 The enzymes
Multiple-Choice Questions Answer ALL 20 multiple-choice questions on the Scantron Card in PENCIL
 Multiple-Choice Questions Answer ALL 20 multiple-choice questions on the Scantron Card in PENCIL For Questions 1-10 choose ONE INCORRECT answer. 1. Which ONE of the following statements concerning the
Midterm 2. Low: 14 Mean: 61.3 High: 98. Standard Deviation: 17.7
 Midterm 2 Low: 14 Mean: 61.3 High: 98 Standard Deviation: 17.7 Lecture 17 Amino Acid Metabolism Review of Urea Cycle N and S assimilation Last cofactors: THF and SAM Synthesis of few amino acids Dietary
B. Incorrect! Compounds are made more polar, to increase their excretion.
 Pharmacology - Problem Drill 04: Biotransformation Question No. 1 of 10 Instructions: (1) Read the problem and answer choices carefully, (2) Work the problems on paper as 1. What is biotransformation?
Maha AbuAjamieh. Tamara Wahbeh. Mamoon Ahram
 12 Maha AbuAjamieh Tamara Wahbeh Mamoon Ahram - - Go to this sheet s last page for definitions of the words with an asterisk above them (*) - You should memorise the 3-letter abbreviations, of all the
I) Choose the best answer: 1- All of the following amino acids are neutral except: a) glycine. b) threonine. c) lysine. d) proline. e) leucine.
 Choose the best answer: 1- All of the following amino acids are neutral except: a) glycine. b) threonine. c) lysine. d) proline. e) leucine.") 1- All of the following amino acids are neutral except: a) glycine. b) threonine. c) lysine. d) proline. e) leucine. 2- The egg white protein, ovalbumin, is denatured in a hard-boiled egg. Which of the
1- All of the following amino acids are neutral except: a) glycine. b) threonine. c) lysine. d) proline. e) leucine. 2- The egg white protein, ovalbumin, is denatured in a hard-boiled egg. Which of the
Human Biochemistry Option B
 Human Biochemistry Option B A look ahead... Your body has many functions to perform every day: Structural support, genetic information, communication, energy supply, metabolism Right now, thousands of
9/16/15. Properties of Water. Benefits of Water. More properties of water
 Properties of Water Solid/Liquid Density Water is densest at 4⁰C Ice floats Allows life under the ice Hydrogen bond Ice Hydrogen bonds are stable Liquid water Hydrogen bonds break and re-form Benefits
Identification of free amino acids in several crude extracts of two legumes
 1 2 Identification of free amino acids in several crude extracts of two legumes using Thin Layer Chromatography 3 Authors 4 5 6 7 8 9 Taghread Hudaib Key words 10 11 12 13 14 15 16 17 18 19 20 Amino acids;
CH395G FINAL (3 rd ) EXAM Kitto/Hackert - Fall 2003
 EXAM Kitto/Hackert - Fall 2003") CH395G FINAL (3 rd ) EXAM Kitto/Hackert - Fall 2003 1. A cell in an active, catabolic state has a. a high (ATP/ADP) and a high (NADH/NAD + ) ratio b. a high (ATP/ADP) and a low (NADH/NAD + ) ratio c. a
CH395G FINAL (3 rd ) EXAM Kitto/Hackert - Fall 2003 1. A cell in an active, catabolic state has a. a high (ATP/ADP) and a high (NADH/NAD + ) ratio b. a high (ATP/ADP) and a low (NADH/NAD + ) ratio c. a
Glycolysis. Cellular Respiration
 Glucose is the preferred carbohydrate of cells. In solution, it can change from a linear chain to a ring. Energy is stored in the bonds of the carbohydrates. Breaking these bonds releases that energy.
CHM 341 C: Biochemistry I. Test 2: October 24, 2014
 CHM 341 C: Biochemistry I Test 2: ctober 24, 2014 This test consists of 14 questions worth points. Make sure that you read the entire question and answer each question clearly and completely. To receive
Ionization of amino acids
 Amino Acids 20 common amino acids there are others found naturally but much less frequently Common structure for amino acid COOH, -NH 2, H and R functional groups all attached to the a carbon Ionization
Introduction to Protein Structure Collection
 Introduction to Protein Structure Collection Teaching Points This collection is designed to introduce students to the concepts of protein structure and biochemistry. Different activities guide students
Lecture 4. Grouping Amino Acid 7/1/10. Proteins. Amino Acids. Where Are Proteins Located. Nonpolar Amino Acids
 Proteins Lecture 4 Proteins - Composition of Proteins (Amino Acids) Chapter 21 ection 1-6! Proteins are compounds of high molar mass consisting almost entirely of amino acid chain(s)! Molar masses range
E.coli Core Model: Metabolic Core
 1 E.coli Core Model: Metabolic Core 2 LEARNING OBJECTIVES Each student should be able to: Describe the glycolysis pathway in the core model. Describe the TCA cycle in the core model. Explain gluconeogenesis.
Chemical Mechanism of Enzymes
 Chemical Mechanism of Enzymes Enzyme Engineering 5.2 Definition of the mechanism 1. The sequence from substrate(s) to product(s) : Reaction steps 2. The rates at which the complex are interconverted 3.
Extracellular Enzymes Lab
 Biochemistry Extracellular Enzymes Lab All organisms convert small organic compounds, such as glucose, into monomers required for the production of macromolecules; e.g., Building Blocs Monomers Macromolecules
AMINO ACID METABOLISM
 AMINO ACID METABOLISM Synthesis of Urea in Liver The series of reactions that form urea is known as the Urea Cycle or the Krebs-Henseleit Cycle. The urea cycle operates only to eliminate excess nitrogen.
Lecture 11 AMINO ACIDS AND PROTEINS
 Lecture 11 AMINO ACIDS AND PROTEINS The word "Protein" was coined by J.J. Berzelius in 1838 and was derived from the Greek word "Proteios" meaning the first rank. Proteins are macromolecular polymers composed
Alimentación, nutrición y dietética GLUCOSINOLATES AND HUMAN HEALTH.
 GLUCOSINOLATES AND HUMAN HEALTH. Ian.T. Johnson Institute of Food Research. Norwich Research Park Colney, NORWICH. NR4 7UA, UK Tel. +44 (0)1603 255330 ian.johnson@bbsrc.ac.uk Abstract The glucosinolates
Lecture 10 - Protein Turnover and Amino Acid Catabolism
 Lecture 10 - Protein Turnover and Amino Acid Catabolism Chem 454: Regulatory Mechanisms in Biochemistry University of Wisconsin-Eau Claire 1 Introduction 2 Proteins are degraded into amino acids. Protein
2. Ionization Sources 3. Mass Analyzers 4. Tandem Mass Spectrometry
 Dr. Sanjeeva Srivastava 1. Fundamental of Mass Spectrometry Role of MS and basic concepts 2. Ionization Sources 3. Mass Analyzers 4. Tandem Mass Spectrometry 2 1 MS basic concepts Mass spectrometry - technique
Biochemistry: A Short Course
 Tymoczko Berg Stryer Biochemistry: A Short Course Second Edition CHAPTER 28 Fatty Acid Synthesis 2013 W. H. Freeman and Company Chapter 28 Outline 1. The first stage of fatty acid synthesis is transfer
AMINO ACIDS STRUCTURE, CLASSIFICATION, PROPERTIES. PRIMARY STRUCTURE OF PROTEINS
 AMINO ACIDS STRUCTURE, CLASSIFICATION, PROPERTIES. PRIMARY STRUCTURE OF PROTEINS Elena Rivneac PhD, Associate Professor Department of Biochemistry and Clinical Biochemistry State University of Medicine