Cost of the Diet analysis in two districts:
|
|
|
- Nora Stevens
- 5 years ago
- Views:
Transcription

1 Cost of the Diet analysis in two districts: Sesheke District, Western Province and Namwala District, Southern Province, Zambia Livelihood Zones: Sesheke: Cereal, Livestock and Timber Zone Namwala: Maize, Livestock and Fishery Zone Data collected: May 2017 Date of report: June 2017 Lead agency: Concern Worldwide In consortium with: Save the Children International In partnership with: The Government of the Republic of Zambia Funded by: Department for International Development (UK) 1
2 Acknowledgements The Cost of Diet analysis was led by Claire Duffy, consultant to Concern Worldwide. This report was written by Claire Duffy with contributions from Marie Rongeard, Jonnathan Mtonga and Regine Kopplow. The analysis was funded by the Department for International Development (UK). Thanks are due to Concern Worldwide staff in Lusaka and at regional offices in Mongu and Choma, including Felix Masalakufa, Nangana Simwinji and Concilia Muhau for their warm welcome and for making the practical arrangements for the analysis to take place. Thanks are also due to the assessment team driver, Moffat Nkausu. This analysis would not have been possible without the willing help of the market traders of Sesheke and Namwala and of the women who participated in the focus group discussions. Their time, hospitality and insights are greatly appreciated. Special thanks are also due to Amy Lane at Save the Children UK, and software developer, James Seddon, for their advice and support. The author is also grateful to the Disaster Mitigation and Management Unit of the Zambian government for providing contextual information that informs the report. June
3 Table of Contents Acknowledgements... 2 Acronyms... 4 Tables... 4 Figures... 5 Annexes Introduction Introduction to Concern Worldwide in Zambia and the DiRECT initiative Nutrition status Introduction to Western Province and Southern Province Western Province Southern Province Aims of the study Methodology Study location Market Surveys Overview Market data processing Interviews and focus group discussions Overview Focus group data processing Excluded data The diets calculated by the Cost of the Diet software Specification of a typical family Recommended intakes for energy and micronutrients Determining maximum and minimum food frequency constraints Inclusion of free foods Supplementary market data Accounting for seasonality Estimating the affordability of diets Results Availability of food at the market Individual interview findings Focus group findings typical dietary habits Focus groups: observations Cost of the diets Energy-only diet Micronutrient/nutritious (MNUT) diet The food habits nutritious diet Cost comparison between the MNUT and FHAB diets Key Findings Conclusions and Recommendations Annexes References
4 Acronyms CoD DiRECT DMMU EO FAO FHAB HFIAS JCTR MCDSS MDD MNUT RAIN WHO ZMW Cost of the Diet Direct Response Through Emergency Cash Transfers Disaster Mitigation and Management Unit Energy-only diet (a diet that meets average energy requirements) Food and Agriculture Organisation of the United Nations Food habits diet (a culturally appropriate diet that meets average requirements for intake of energy, fat, protein and micronutrients) Household Food Insecurity Access Scale Jesuit Center for Theological Reflection Ministry of Community Development and Social Services Minimum dietary diversity Micronutrient diet (a nutritious diet that meets average requirements for energy, fat, protein and micronutrients) Realigning Agriculture to Improve Nutrition project World Health Organization Zambian Kwacha (unit of currency) Tables Table 1: Food excluded from the Cost of Diet analysis for each district Table 2: A summary of the diets analysed using the Cost of the Diet software Table 3: Number of foods per food group found at markets in Sesheke and Namwala Table 4: Daily, monthly and annual cost of an energy-only diet for a 5-person household in two districts Table 5: Daily, monthly and annual cost of a micronutrient (nutritious) diet for a 5-person household in two districts Table 6: The seasonal cost of a nutritious diet for a 5-person household in two districts Table 7: The daily, monthly and annual cost in Zambian Kwacha of a food habits nutritious diet for a 5-person household in two districts. Table 8: The seasonal cost in Zambian Kwacha (ZMW) of a food habits nutritious diet for a 5- person household in two districts. Table 9: Percentage of micronutrients in the FHAB diet in Sesheke provided by costed and free fruit and vegetables. Table 10: Percentage of micronutrients in the FHAB diet in Namwala provided by costed and free fruit and vegetables. Table 11: Daily, monthly and annual cost of MNUT diet and FHAB diet for each district, with difference in cost between the two diets highlighted. 4
5 Figures Figure 1: Monthly cost of an energy-only diet for households of 5, 6, 7, 8, 9 and 10 persons in Sesheke. Figure 2: Monthly cost of an energy-only diet for households of 5, 6, 7, 8, 9 and 10 persons in Namwala. Figure 3: The percentage of energy and target nutrient intakes met in an energy-only diet for the family, by season in Sesheke. Figure 4: The percentage of energy and target nutrient intakes met in an energy-only diet for the family, by season in Namwala. Figure 5: Monthly cost of an MNUT (nutritious) diet for households of 5, 6, 7, 8, 9 and 10 persons in Sesheke. Figure 6: Monthly cost of an MNUT (nutritious) diet for households of 5, 6, 7, 8, 9 and 10 persons in Namwala. Figure 7: The percentage of energy and target nutrient intakes met in a nutritious diet for the family, by season in Sesheke. Figure 8: The percentage of energy and target nutrient intakes met in a nutritious diet for the family, by season in Namwala. Figure 9: Monthly cost of a food habits nutritious diet for households of 5, 6, 7, 8, 9 and 10 persons in Sesheke. Figure 10: Monthly cost of a food habits nutritious diet for households of 5, 6, 7, 8, 9 and 10 persons in Namwala. Figure 11: The percentage of energy and target nutrient intakes met in a food habits nutritious diet for the family, by season in Sesheke. Figure 12: The percentage of energy and target nutrient intakes met in a food habits nutritious diet for the family, by season in Namwala. Annexes Annex 1: Description of the Cost of the Diet tool Annex 2: Maps of survey area, markets and villages Annex 3: Food lists for each district Annex 4: Markets surveyed in each district Annex 5: Market data form Annex 6: Foods found at the markets and price per 100g 5
6 Annex 7: Villages selected as sites for focus group discussions and breakdown by wealth group of focus group participants Annex 8: Individual interview form Annex 9: Energy requirements for standard, high and low energy households (WHO) Annex 10: Wild fruits commonly eaten, as reported by focus group participants Annex 11: Weight and cost of foods selected for an energy-only (EO) diet for the family in each district for a year, with the percentage contributed by each food in terms of weight, cost, energy, protein and fat, the percentage contribution of each food for eight vitamins and four minerals, and the percentage of the total requirements for each nutrient. Annex 12: Weight and cost of foods selected for nutritious (MNUT) diet for the family in each district for a year, with the percentage contributed by each food in terms of weight, cost, energy, protein and fat, the percentage contribution of each food for eight vitamins and four minerals, and the percentage of the total requirements for each nutrient. Annex 13: Weight and cost of foods selected for a food habits nutritious (FHAB) diet for the family in each district for a year, with the percentage contributed by each food in terms of weight, cost, energy, protein and fat, the percentage contribution of each food for eight vitamins and four minerals, and the percentage of the total requirements for each nutrient. 6
7 1. Introduction 1.1. Introduction to Concern Worldwide in Zambia and the DiRECT initiative Concern Worldwide is an international humanitarian organisation dedicated to ending extreme hunger and transforming the lives of the world s poorest people. Concern has been working in Zambia since 2002; engaging in long term development work, responding to emergency situations and seeking to address the root causes of poverty through advocacy work. DiRECT Direct Response through Emergency Cash Transfers is an emergency intervention to provide a cash transfer to 21,329 food insecure households in five drought-affected areas across Southern and Western Provinces. It also provides support to local retailers, together with information and training, to alleviate the impact of the crisis through consumption support while stimulating local markets. The programme was implemented between September 2016 and June 2017 by a consortium comprised of Concern Worldwide and Save the Children International and in coordination with the Ministry of Community Development and Social Services (MCDSS) and the Disaster Mitigation and Management Unit (DMMU) in the office of the Vice President of the Republic of Zambia. International evidence shows that the size of a social cash transfer has a major impact on nutrition outcomes. To have a positive impact on nutrition the transfer size should take into account the cost of a nutritious (not caloric) diet, while not being so high as to provide disincentives to work. In 2010 the food basket for Zambia cost 96 ZMW for a family of six to meet minimum nutritional requirements. It is likely that the value of the food basket has increased since then and it is also likely to be higher during the peak of the lean season and times of stress. The value of the Government s social cash transfers targeting chronic poverty has recently been raised to 90 ZMW, and the DiRECT Emergency Cash Transfers are of the same amount. It is envisaged that any subsequent emergency responses should be undertaken through a shock responsive social cash transfer system. To be able to better advocate for a shock responsive cash transfer value an assessment on the current cost of a nutritious diet adjusted for times of stress would allow insight to set a more responsive amount. DiRECT is implemented in two districts of Western Province (Limulunga and Sesheke) and in three districts of Southern Province (Sinazongwe, Pemba and Namwala). The Cost of the Diet study will be conducted in one district in each province: Sesheke in Western Province and Namwala in Southern Province Nutrition status In Zambia, chronic food insecurity is prevalent among low income groups such as the urban poor and rural, small-scale farmers, and impedes the country s potential to 7
8 reduce poverty. Chronic malnutrition in children, also known as stunting, is observed when a child s height is below that expected for his or her age. In Zambia, 45 percent of children under five years of age are chronically malnourished, higher than the African average of 42 1 percent. Of these children, 21 percent are severely stunted 2. Stunting is recognised to have irreversible effects on a child s development, such as impaired cognitive development, poorer health outcomes, and limited work productivity as an adult. 3 The prevalence of underweight children nationally is 15 percent. In Zambia, 5 percent of children under five years are wasted (insufficient weight for height), compared to an average of 15 percent of children across the developing world 4. Micronutrient deficiencies, particularly deficiency in iron and vitamin A, are prevalent among infants, young children and pregnant and lactating women and remain a major public health concern Introduction to Western Province and Southern Province Western Province Zambia s Western Province is bordered internally to the north and east by Northwestern, Central and Southern Provinces. It is bordered by Angola to the west and by Namibia to the south. Mongu is the provincial capital of the province, which is subdivided into sixteen districts. Sesheke District is in the far south of the province on the border with Namibia and is comprised of nine wards. The 2010 census puts the population of Western Province at 902,974, an increase of 18 percent on the census undertaken in Sesheke District recorded a population of 99,384 in 2010 (11 percent of the province s population), having experienced population growth of 2.4 percent per annum during the inter-censal period ( ). In 2011 some districts in Western Province, including Sesheke, were split. The current population is therefore uncertain and a reliable estimate will not be available until the 2020 census has been carried out. As part of the DiRECT baseline assessment, the Household Food Insecurity Access Scale (HFIAS) was used to calculate levels of household food insecurity across the target areas. The analysis indicated widespread food insecurity across the assessment zone, with Sesheke emerging as the most food insecure district 5. The report also revealed that 92 percent of women in Sesheke District did not achieve minimum dietary diversity (compared to 87 percent in Limulunga, the second target district in 1 National Food and Nutrition Commission of Zambia (2011) National Food and Nutrition Strategic Plan for Zambia Central Statistics Office, Zambia (2007) Zambia Demographic and Health Survey Concern Worldwide and International Food Policy Institute (2011) Rain Project Brief No. 1 4 National Food and Nutrition Commission of Zambia (2011) National Food and Nutrition Strategic Plan for Zambia Concern Worldwide (2017), Direct Response through Emergency Cash Transfers DiRECT Baseline Report. Lusaka, Zambia. 8
9 Western Province). In a measure of minimum child dietary diversity, it was found that only 12 percent of children in Sesheke achieved minimum dietary diversity. Further, the baseline survey showed that 99 percent of children aged 6-23 months did not attain the minimum acceptable diet, i.e. meal frequency and dietary diversity. The government of Zambia estimates that 36 percent of children under five years in Western Province are stunted owing to chronic malnutrition Southern Province Southern Province is bordered internally by Western Province to the west, by Central Province to the north, and by Lusaka Province to the northeast. It shares much of its southern and eastern border with Zimbabwe, but is also bordered by Botswana and Namibia to the southwest. Choma is the provincial capital of Southern Province, which is comprised of eleven districts. Namwala District is in the northwest of the province and is comprised of fifteen wards. The 2010 census recorded a population of 1,589,926 in Southern Province an annual increase of 2.8 percent since the previous census in 2010, or an increase of 31 percent (from 1,212,124) over ten years. Namwala had a population of 102,886 in 2010 (6.5 percent of the province s population), having experienced population growth of 2.2 percent per annum during the inter-censal period ( ). The HFIAS score also indicates a high level of household food insecurity in target districts in Southern Province. The DiRECT baseline assessment showed that the diet of 74 percent of the participants in Namwala was below the minimum recommended dietary diversity. The survey found that only 16 percent of children achieved minimum dietary diversity, and that up to 99 percent of children aged 6-23 months did not attain the minimum acceptable diet (meal frequency and dietary diversity). The government of Zambia puts the rate of stunting among children under five years in Southern Province at 37 percent Aims of the study This Cost of the Diet (COD) analysis has three main aims: 1. To estimate the amount and combination of local foods in each district that are needed to provide a family of five with a diet that meets their average needs for energy and recommended intakes of protein, fats and micronutrients 2. To calculate the annual and monthly cost in Zambian Kwacha (ZMW) of such a diet for a family of five in each of the selected districts 3. To determine if the value of the current cash transfer provision is sufficient to allow the poorest households in these districts to access a nutritious diet. 6 Central Statistics Office, Zambia ( ) Zambia Demographic and Health Survey 7 Ibid. 9
10 2. Methodology The Cost of the Diet is a method and software that calculates the minimum cost of a diet that provides a household s recommended intakes of energy, protein, fat and micronutrients using locally available foods. For a detailed description of the Cost of the Diet tool, the diets it can analyse, its uses and limitations refer to Annex Study location The Cost of Diet survey was carried out in two districts in which DiRECT is being implemented: Sesheke in Western Province and Namwala in Southern Province. In Western Province, the DiRECT project has been implemented in two districts, Limulunga and Sesheke. As Limulunga has better availability of food and benefits from easier access to the markets in Mongu (the provincial capital), it was felt that Sesheke is representative of more districts in Western Province, and should be prioritised for the survey. Additionally, a relationship had already been established with traders in Sesheke who have benefited from support through the project, including a two-day training on basic business skills in December 2016 and a one-off grant of ZMW 500 in January It was felt that important insights might be gained from speaking to the Sesheke traders. In Southern Province, DiRECT has been implemented in three districts, Sinazongwe, Pemba and Namwala. Some traders in Namwala were also beneficiaries of the emergency project support. Similarly, it was felt that important insights could be gained from speaking to traders with whom a relationship has already been established. Further, Namwala was felt to be more representative of the region as a whole because, in common with the majority of districts in the province, livelihoods are characterised by farming, pastoralism and fishing. Each of the districts was identified as belonging to a distinct livelihood zone - a geographical area within which people share broadly the same patterns of access to food as previously identified by in a livelihood zoning exercise carried out by the World Food Programme. Cost of Diet assessments are often conducted in a livelihood zone because the foods that are available and consumed are homogenous. The livelihood zones are described as follows: 1. Sesheke (Western Province) Cereal, Livestock and Timber Zone 2. Namwala (Southern Province): Maize, Livestock and Fishery Zone These are the dominant means of livelihood, however, many households in both districts also undertake small-scale farming. Additionally, many households in Namwala are engaged in pastoralism and fishing. Although these activities may contribute comparatively little to income generation across the districts, they potentially have a significant impact on nutrition, food consumption and dietary 10
11 diversity. DiRECT supports communities in all nine wards in Sesheke, and six of the fifteen wards in Namwala. A map of the two districts and the villages and markets surveyed is provided in Annex 2. The following section describes how data was collected for the analysis Market Surveys Overview A list of the foods consumed in each region was compiled at the outset of the study. Prior to beginning the fieldwork, the enumerators practised data collection methods at a trial market survey in Sesheke Town. The food list was subsequently updated to include any new foods that had been found during the trial. The final food list for Sesheke comprised 79 foods, while the list for Namwala included 84 foods. The food lists for each district can be seen in Annex 3. Note: the foods that are highlighted were not included in the final analysis as a suitable substitute could not be found in the COD food database, or because the nutritional composition of these foods could not be found. The substitutes selected for foods that were not found in the COD have also been indicated. The markets selected for data collection in each district are listed in Annex 4. These markets were selected to be representative of where poor households in the districts purchase their food. The Sesheke survey, which began on 2 nd May 2017, recorded the price and weight of foods found in 7 markets or shops across the district over the course of 5 days. The survey in Namwala began on 9 th May 2017 and six markets or shops were surveyed over four-day period. It soon became clear that barely any fresh food (namely fruit and vegetables) was available outside of the main towns in both districts. The implications of the non-availability of fresh food for the CoD analysis is discussed further in Section 3.1. The market data collection in Sesheke Town was intended as a trial, however, given the difficulty obtaining price data outside of the town and in view of the fact that the data was of high quality it was included in the analysis. For the purpose of the assessment, retrospective data on prices were collected so that a baseline analysis of the last year could be produced 8. The retrospective reference year selected for data collection was from 16 th August th August The assessment team established that the name and length of each season was as follows: 8 The aim of retrospective data collection, i.e. obtaining food prices for previous seasons, is to establish a baseline, but this only allows for the collection of information on foods available in the season in which the survey is carried out. It cannot account for foods that can be found at other times of the year but not available in the current season. 11
12 Cold season: 15 April August 2017 (active season at time of survey) Rainy season: 1 November April 2017 Dry season: 16 August October 2016 As poor people typically buy food in small amounts (they often cannot afford bulk purchases), market traders were asked the price of the smallest unit of each food item that they sold during each season. Three samples of each food were weighed using electronic scales. The CoD method guidelines recommend collecting weight and price data from four traders at each market to give four prices and 12 weights for each food item. However, this was difficult in practice as most rural markets consisted of only one or two traders with neither selling the same foods, if fresh or staple foods were found at all. Market traders were asked questions about trends in prices, seasonality and changes in the demand and supply of commodities. This qualitative data was noted down by the enumerators and typed up after each market survey. These informal interviews provided important contextual information that was used to inform the results. A sample of the form used to record market data can be seen in Annex Market data processing Upon returning from the field, all market data recorded on the paper forms was entered into the CoD software. To do this, a food list first had to be created within the software to mirror the food list used for the market data collection. Many of the foods on the list were selected directly from the food composition database embedded in the Cost of the Diet software. However, a nutrition profile was added for a small number of foods not listed in the CoD database. Where a food was not listed in the CoD database and nutritional information for the food could not be found from an alternative source (as was the case for many species of fish) a substitute was chosen from the foods already listed in the CoD database. The foods for which substitutes were chosen are indicated on the food list in Annex 3. Where foods are produced in a variety of forms (i.e. wholegrain, milled, degermed, polished, etc.) the form or forms typically consumed in the areas surveyed was chosen. Once the food list was replicated within the CoD software the price and weight data collected at the markets was manually entered into the programme. The software automatically calculates the average price per 100g for each food across every market. A summary of the foods found at the markets and the price per 100g can be seen in Annex 6. The Cost of Diet methodology is designed to calculate the minimum cost of a diet that provides adequate nutrition for a specified family in each defined season, as well as an average cost for the year. During market surveys, traders are asked for the current price, and for the price in previous seasons within the last year. It is accepted that retrospective price information is not always reliable, but several factors in the Sesheke/Namwala context render the retrospective price information highly unreliable. It was found that the price of most food items remains constant 12
13 throughout the year but that the quantity offered varies depending on supply and demand. However, enumerators were unable to obtain a weight estimate for foods sold during other seasons for the stated price. In any case, even during the present data collection large weight variations were noted among samples of the same foods. In grouping or bundling fresh fruit and vegetables, traders are primarily concerned with the appearance of volume (i.e. that each bunch, bundle or pile appears to be of similar quantity). To illustrate how quantities differ between seasons, one trader explained that a bunch of rape in the current season might be comprised of fifteen leaves, but that the bunch would be reduced to ten leaves in the dry season. The cost of the diet that has been calculated for the current season (the cold season) will be the most accurate as it is based on actual weights and prices, but it will also be the cheapest, given that prices are lowest at harvest time when stocks are plentiful. To avoid underestimating the cost of the diet during the dry and rainy season and in the absence of accurate weight data the weight of fresh foods whose price remains constant throughout the year was entered into the software at 60 percent of those recorded in the current season. This figure is based on the feedback from traders that bundles of tomatoes and onions, which are comprised of five units in the cold season, are typically reduced to three units when supply decreases. Where a trader stated there were price variations across the seasons, the weight recorded for the current season was assumed for the dry and rainy seasons. In the case that a trader could state the exact quantity by which a bundle would be reduced in the next season (i.e. 4 to 2), the weight for other seasons was entered at the ratio indicated. Although this method is not ideal, it is a reasonable approximation Interviews and focus group discussions Overview In order to better understand local dietary patterns and how food and dietary constraints should be set, one-to-one interviews were conducted with eight women in each of the sites visited. The women selected were those responsible for preparing food in the home, and represented a range of wealth groups. The villages selected for the interviews and focus group discussions and a breakdown by wealth group for each village can be seen in Annex 7. Interviewees were read out the list of foods that had been compiled by the assessment team at the outset of the project and asked to state if they consume these foods never, rarely, often or usually. The responses were noted into a custom form (see Annex 8) by an enumerator. The wealth ranking of each individual was provided by the community liaison representative at the end of the session and was recorded as poor, middle or better off. The responses were tallied when all the interviews were completed, revealing the foods that are least and most often consumed. The women were brought together for a focus group discussion led by one team member while another took notes. These 13
14 discussions provided an insight into local dietary habits, consumption patterns and food taboos. In particular, information was collected on the foods eaten or not eaten by infants and young children and pregnant and lactating women. Household production of food; key staples; foods bartered, bought and sold; foods commonly preserved; and the consumption of wild foods were also discussed. If the tally revealed anything unusual, the session leader had the opportunity to probe further Focus group data processing Notes taken during the focus group discussions were jointly transcribed by the focus group discussion leader, note taker and practitioner. The information on consumption frequency recorded during the interviews was then entered into the CoD software. The software assigns a numerical score to each food, which, when tallied for all respondents, gives the maximum and minimum food frequency constraints. The responses are scored as follows: never /rarely = 0 points often = 1 point usually = 2 points If a group of 8 women is surveyed, each food item could receive a minimum total score of 0 and maximum of 16. A total score of 0-1 points translates into a maximum constraint of 0, 1-8 points translates to a maximum constraint of 7 (a food eaten once a day) and a total score of 9-16 points translates to a maximum constraint of 14 (a food eaten two times a day). The software calculates these constraints based on the individual interview data that has been inputted. Maximum and minimum constraints are discussed in more detail in Section Excluded data Following the market surveys and focus group discussions, a number of foods were excluded from the Cost of Diet analysis. These foods and the reason for their exclusion are summarised in Table 1 below. 14
15 Table 1: Foods excluded from the CoD analysis for each district. Category Food Reason excluded from analysis SESHEKE Fruit Munzinzila No nutritional information available and no suitable substitute found Fruit Mizauli No nutritional information available and no suitable substitute found Fish Imilonge fresh Not found at the market Fish Liminga dry Not found at the market Fish Liminga fresh Not found at the market Fish Linembele dry No nutritional information available and no suitable substitute found Fish Linembele fresh Not found at the market Fish Lingongi fresh Not found at the market Fish Tiger fish fresh Not found at the market Fish Tunyengele dry No nutritional information available and no suitable substitute found NAMWALA Fruit Munzinzila No nutritional information available and no suitable substitute found Fruit Mizauli No nutritional information available and no suitable substitute found Cereals Ceele No nutritional information available and no suitable substitute found Cereals Chibwantu No nutritional information available and no suitable substitute found Fish Bottle fish dry No nutritional information available and no suitable substitute found Fish Bottle fish fresh No nutritional information available and no suitable substitute found Fish Imilonge fresh No nutritional information available and no suitable substitute found Fish Liminga dry No nutritional information available and no suitable substitute found Fish Liminga fresh No nutritional information available and no suitable substitute found Fish Liminga smoked No nutritional information available and no suitable substitute found Fish Lingongi dry No nutritional information available and no suitable substitute found Fish Mabango fresh No nutritional information available and no suitable substitute found Fish Tiger fish dry Excluded as not found in Namwala markets Fish Tiger fish fresh No nutritional information available and no suitable substitute found 15
16 In Sesheke, munzinzila and mizauli (fruit) were found to be commonly consumed, but were excluded from the analysis because (1) they were not found at the market meaning that price data could not be obtained, and (2) nutrient composition information could not be found. Although dried linembele (fish) was found in Sesheke markets it is not frequently consumed (only 34 percent of respondents reported eating it regularly) and no suitable substitute could be found in the food database. Lingongi fresh and tiger fish fresh are consumed regularly by 53 and 63 percent of respondents respectively, but were excluded from the database as no price information could be obtained. It is not ideal to exclude from the analysis foods that are important to the local diet, but the absence of price data is problematic. The issue is somewhat mitigated by the software s ability to select from other species/varieties of fish for which price data has been obtained. In Namwala, munzinzila and mizuali (fruit) were excluded as they are almost never consumed and were not found on the market. Ceele (a food made with nshima and sour milk) and chibwantu (drink made from maize and milk) are frequently consumed. However, neither was found at the market, and as no suitable substitute could be found in the CoD software they were excluded from the analysis. Most of the fish listed in the table have a low consumption rate among the respondents, and as none of them were found at the market they were excluded The diets calculated by the Cost of the Diet software Using the market and food consumption data the Cost of Diet software can estimate the cost of four theoretical diets (see Table 2 below). Table 2: A summary of the diets analysed using the Cost of the Diet software. Energy Fat at Protein Reflects Diet Micronutrient Definition needs 30 of needs a typical name needs met met energy met diet Energy only (EO) Energy, fat and protein only diet Micronutrient RNI (MNUT) Food Habits (FHAB) A lowest cost diet that only meets the average energy requirements of the members of the household A lowest cost diet that only meets the average energy and the recommended protein and fat requirements of the members of the household X X X X A lowest cost nutritious diet X X X X A lowest cost nutritious diet that reflects cultural consumption patterns X X X X X 16
17 This report focuses on three of four theoretical diets: (1) an energy-only diet; (2) a nutritious diet with all the required micronutrients, and (3) a nutritious diet based on local foods habits. An energy-only diet is one which meets only the average energy requirements of the family. The software calculates the cost of this diet based on the family specification (see Section 2.6), and price data entered for the energy foods found at the market. In creating a model of a nutritious diet, the software selects from foods found at the market and combines them (food type and quantity) in a way that produces the lowest cost diet that meets the average energy requirements and the recommended micronutrient intake of the typical family. The diet does not necessarily reflect people s typical dietary patterns; it simply draws on the foods that are available. The food habits diet is, in theory, a nutritious diet that takes into account the typical dietary habits of households in each of the districts as revealed by the individual interviews and focus group discussions. Typical dietary habits are incorporated through applying minimum and maximum constraints to the number of times a food can be consumed in a day or over the course of week (see Section 2.8). However, some of the most commonly eaten foods in Sesheke and Namwala (as revealed by the focus group discussions and individual interviews) were not found at the markets. As no price data could be found for these foods, they could not be included in the hypothetical diet. This means that the food habits diet presented in this analysis omits some of the foods one would expect to see in a representation of a typical diet in each of the districts. This is discussed further in Section 3.6. For a more detailed description of each of the diets analysed by the CoD software, please refer to Annex 1. When all the market and food consumption data has been entered, the software calculates the average cost of each diet for Sesheke and Namwala, rounded to the nearest Zambian Kwacha (ZMW). At the time of writing (June 2017), 1 Euro equals ZMW Specification of a typical family A 5-person household has been selected as the standard family size for both Sesheke and Namwala districts. In the 2007 Zambian Demographic and Health Survey, the average household size is 4.9 persons, compared with 5.2 persons in the survey 9. The CoD software can only generate a cost based on a specified number of persons, so a 5-person household size has been selected. The standard family is comprised of family members chosen from the WHO database of average energy requirements based on a daily energy requirement of 5 x 2,100 9 Central Statistics Office, Zambia (2007) Zambia Demographic and Health Survey 17
18 kcals, or 10,500 kcal in total (see Annex 9). The typical Cost of the Diet family for a 5- person household consists of: An adult man, aged 30-59y, weighing 50 kg and moderately active (2,750 kcal/d) An adult woman, aged 30-59y, 45 kg, moderately active (2,300 kcal/d) and lactating (418 kcal/d) A child (either sex) aged years (2,250 kcal/d) A child (either sex) aged 9-10 years (1,913 kcal/d) A baby (either sex) aged months (894 kcal/d) The total energy requirement of this family is 10,525 kilocalories per day. The Cost of the Diet is dependent on arbitrary factors such as the numbers, age, sex and degree of physical activity and of the individuals comprising this typical family. To illustrate the possible range in the cost of the diet, a CoD family was specified in the same way for five, seven, eight, nine and ten members. In addition, for each of these household sizes a minimum ( low energy ) family was selected by choosing the youngest, smallest family for each number of individuals between five and ten members, and a maximum ( high-energy ) family was selected by choosing the oldest, largest family between four and ten members. The specification of minimum and maximum energy families of between five and ten members is also shown in Annex 9. These are recommended as standard families for all Cost of the Diet analyses. This ensures that a possible range in energy needs can be covered. Each month the Jesuit Center for Theological Reflection (JCTR) in Zambia produces a basic needs basket document tracking the cost of food and non-food essentials for families in fifteen towns and cities across the country 10. The locations covered include Mongu in Western Province and Choma in Southern Province, and the costs are calculated based on a 5-person household. Although the cost estimates are not specific to rural areas, it is useful to compare the Cost of the Diet for Sesheke and Namwala to the cost of a basic food basket as determined by JCTR in the regional capitals of the respective provinces. The cost of the diet determined by this analysis is compared to the JCTR estimates in Section Recommended intakes for energy and micronutrients The needs of individuals for energy are taken from a database embedded in the Cost of the Diet software that specifies the estimated average requirement recommended by the WHO and FAO 11 for individuals by age, sex and activity level. As this intake is based on the estimated average requirement, the probability that any given individual s requirement is met is 0.5 or 50 percent WHO/FAO (2001) Human Energy Requirements / WHO/FAO (2007) Protein and Amino Acid Requirements in Human Nutrition 18
19 The needs of individuals for protein are taken from a database embedded in the software which specifies the safe individual intake recommended by the WHO and FAO 12 for individuals by age and sex. This intake is defined as the 97.5th percentile of the distribution of individual requirements, so the probability that any given individual s protein requirement is met is or 97.5 percent. The needs of individuals for micronutrients are taken from a database embedded in the software which specifies the recommended nutrient intake proposed by the WHO and FAO 13 for individuals by age and sex. This intake is defined as the 97.5th percentile of the distribution of individual requirements, so the probability that any given individual s requirement is met is or 97.5 percent. The recommended intake of vitamin A is specified as the recommended safe intake, as there are no adequate data to derive mean and standard deviations of intake. The needs of individuals for fat are specified as 30 percent of total energy intake. A diet selected by the Cost of Diet software that meets all of the requirements described above is called a nutritious diet Determining maximum and minimum food frequency constraints The number of times per week a food can be included in a diet is limited by applying minimum and maximum values. For the energy-only diet and the nutritious diet and for all foods the minimum constraint is set to zero (meaning that the software has the option to include or exclude foods from the diet) and the maximum constraint is set to 21 (meaning that a food cannot be included more than 21 times a week, i.e. three times per day). In the case of the food habits nutritious diet, the software applies minimum and maximum constraints that reflect the consumption frequency indicated in the individual interviews. As explained in Section 2.3.2, the software assigns a numerical score to each food, which, when tallied for all respondents, gives the maximum and minimum food frequency constraints. This is intended to enable the software to create a diet that captures typical dietary habits. For example, a food that is typically eaten at every meal will have a maximum constraint of 21 (3 meals per day x 7 days per week). Similarly, a food that is usually eaten twice a day will have a maximum constraint of 14. Manual adjustments can been made to the food habits diet minimum and maximum constraints in light of information on local dietary habits obtained from focus group discussions. Constraints can also be used to reflect seasonal variations in food availability. For example, if a market trader advised that a food is not available in a particular season and no price is entered for that season, the software will automatically set a zero minimum and maximum constraint for that food so that it will not be included in the diet simulated for that season. In the case of free foods, i.e. wild or home produced 12 WHO/FAO (2004) Vitamin and Mineral Requirements for Human Nutrition 13 FAO/WHO (2008) Fats and Fatty Acids in Human Nutrition 19
20 foods (see Section 2.9), constraints can be manually adjusted to reflect seasonal availability Inclusion of free foods In the case that households subsist on their own produce at any point during the year the COD guidelines recommend that the value of home production be added to household income, and that home produce be entered into the software at zero cost for the seasons in which it is available. The focus group discussions in Sesheke and Namwala (see Section 3.3) revealed that many of the most commonly eaten foods are home-produced, and that these foods are only purchased from the market when own produce runs out. Free or home-produced foods are of critical importance to the families in both districts; however, the inclusion of these foods at zero cost can skew the results of the CoD analysis because the software does not have a facility to specify the number of days a family will be able to sustain itself with its own produce before having to purchase from the market. Including home-grown foods at zero cost also means that the costs of production (i.e. inputs) are not taken into consideration. Furthermore, given that maize production has been severely affected by drought over the past two years, it would be inappropriate to include household maize production as income in this instance. Notwithstanding the reasons outlined above for avoiding the inclusion of free maize, the inclusion in this assessment of a small number of fruits and vegetables without price data would result in a more realistic food habits diet, and a more realistic cost for the diet in each season. Vegetables and leafy green vegetables in particular are an important source of vitamins and minerals and are frequently consumed in both districts. However, if the commonly eaten vegetables are not found on sale at the markets and no price data can be recorded, they will not be included in the hypothetical diet generated by the CoD software. As explained above, it is generally preferable not to include home-produced foods at zero cost, but given that price data could only be found for six vegetables in Namwala, the software will struggle to generate a diet that provides adequate nutrition, and the cost will likely be unrealistic as the software may be forced to source certain nutrients from more expensive sources. Taking these factors into account, it was decided that two green leafy vegetables with a high consumption rate okra and sweet potato leaves would be included at zero cost for the rainy season in the Namwala assessment. In order to allow the software to include at least one home-produced (i.e. free ) vegetable in the rainy season in the Sesheke assessment, amaranth leaves were included at zero cost. In each case, this entailed setting a minimum constraint of 0 (to allow the software the option to include the vegetable(s) or not) and a maximum constraint of 14 (to limit their inclusion to two meals per day). A large variety of wild fruit is consumed in both districts, but given the uncertainty around their seasonality and the absence of nutrient composition data, they were excluded from the analysis. Nevertheless, wild fruit is an important source of vitamins and it is important that its consumption is represented in the analysis. For this reason, 20
21 mango and a generic bush fruit have been selected from the CoD food database and entered for the rainy season for both districts, and bush fruit has been included as a free fruit for the cold season. Constraints for each fruit have been set at 0 and Supplementary market data Unprocessed maize grain was found at only one trading post throughout the entire assessment period, but it is uncertain if the weight data obtained is representative of maize prices in rural areas. JCTR quotes a price for mealie meal (25kg) of K91.83 in Choma, Southern Province (April 2017) and K98.78 in Mongu, Western Province (March 2017) 14. However, since mealie meal has a low consumption rate among the communities surveyed, it is preferable to source a price for unprocessed maize grain (roller meal). The WFP estimate the price of maize at K2.30/kg in Sesheke and K2.00/kg in Choma as at February Prices are likely to have fallen in the interim due to an early harvest 16, which provides some assurance that entering the February prices into the software will not underestimate the cost of the diet in May Supplementary market data has been entered for both districts using the WFP price estimates. More than half of the focus group participants (56 percent in Sesheke and 63 percent in Namwala) reported eating chicken regularly. Chicken was not found at the markets, however, since most of the villages in which focus groups were conducted are not within easy reach of a market, and given that background chickens were observed roaming freely in each of the villages, it is likely that chickens are purchased from neighbours. As chicken is an important source of protein in the diet of the communities surveyed in both Sesheke and Namwala it is important to assign a cost so that the software has the option to factor it into a hypothetical diet. The price was estimated by field staff at K40 per 1.8kg in Sesheke and K35 per 1.5kg in Namwala, and these prices were entered into the software as supplementary market data Accounting for seasonality Information on the seasonality of all the foods on the food list was compiled by the country team. A fishing ban is instated in Zambia throughout the rainy season each year, and as result there is a substantial decline in the number of type of fish on offer in local and rural markets (during this time fish is mainly only available in supermarkets). Some traders stated a price for various types of fish during the rainy season, but given the unreliability of retrospective data collection, a decision was taken to not to enter price data for all species of fish (with the exception of kapenta and chisense) into the software for the rainy season
22 2.12. Estimating the affordability of diets The cost of a nutritious diet becomes a more meaningful figure when compared with the income of the poorest members of the community. To assess the affordability of the diet household income and non-food expenditure (NFE) per wealth group must be known. The CoD software uses this information to highlight the proportion of income spent on food and the non-food items needed to achieve a minimum acceptable standard of living. It is understood that data on household income and NFE had been gathered in a HEA survey undertaken by the World Food Programme in each of the districts, but regrettably and for reasons beyond its control the assessment team was unable to obtain this information. 22
23 3. Results 3.1. Availability of food at the market A total of 55 foods were found at the markets in Sesheke District, and 39 foods in Namwala District. In Sesheke, 13 of the 39 most commonly eaten foods 17 were not found at the market, while in Namwala 18 of the 40 most frequently consumed foods 18 were not found at the market. These include Bambara nuts, chicken and various vegetables. Of note in Namwala, fresh and sour milk were not found despite being commonly consumed. Table 3 shows the number of foods per food group found at the markets. Cooking oil, sugar and salt were also commonly found. Soya pieces were found to be widely available and as it is a protein product, it has been included in the legumes category. Table 3: Number of foods per food group found at markets in Sesheke and Namwala. Food Group Sesheke Namwala Cereals/grains 5 5 Tubers 4 3 Legumes/pulses/nuts 9 7 Vegetables 11 6 Fruit 5 7 Fish 13 7 Meat 1 1 Eggs 1 1 Dairy 2 0 Maize is the staple crop throughout the country, and although the respondents unanimously reported daily consumption of roller meal (unrefined ground maize meal), only mealie meal (refined maize meal) was found at the market in Sesheke District. In Namwala, a sack of unprocessed maize grain was found in only one shop. Traders reported that there is less demand for maize during the harvest time as most rural families depend on their own produce at this time of year. Millet and sorghum are widely consumed in Sesheke District but were not found at the markets. This can be attributed to the fact that these grains are grown for home consumption only (i.e. not for trade or barter). Rice and wheat flour were found at markets in both districts, but based on the interviews with focus group participants, they are rarely consumed in the rural communities. Some fresh fruit and vegetables which are understood to be commonly eaten when available were not in season at the time of the survey and therefore were not found at the market. These include amaranths, mushrooms and mangoes. 17 Foods usually or often consumed by 50 percent or more of focus group respondents 18 Foods usually or often consumed by 50 percent or more of focus group respondents 23
24 Cassava leaves and Bambara nuts are typically available year-round but were not found in any markets. Only larger variety of perennially available vegetables were found in Sesheke than in Namwala. Even vegetables that respondents reported as being commonly consumed such as okra, pumpkin leaves, hibiscus leaves and sweet potato leaves were not found at Namwala markets. An array of food (fruit, vegetables, legumes, cereals, fish and meat) was available in Sesheke Town and Namwala Central; however, outside of the towns or roadside villages, fresh produce was not found. Rural trading posts stocked only non-perishable food items, primarily cooking oil, sugar, salt, bicarbonate of soda, confectionary and soft drinks. There are three main reasons for the non-availability of fresh produce at rural trading posts: 1. All rural communities are engaged in gardening and maize production, and as they are sustained by their own produce at harvest time (the current season), there is no demand for fresh produce at local trading posts at present. Further, where there is demand for fresh produce outside of the cold season, supply can be sporadic. One rural roadside trader in rural Sesheke reported that she buys vegetables and tomatoes to re-sell only twice a month. Supplying perishable food items more frequently was regarded as too great a financial risk. 2. Traders in rural areas reported that people are not willing to pay the mark-up for the convenience of purchasing locally. Typically, those living in remote areas will task a family member or friend with buying food on their behalf from the town (despite the often considerable travel distance). It was reported that women seldom go to the town but that men make the journey more often. 3. The strength and prevalence of the barter system in rural areas effectively negates demand for fresh produce from rural cash trading posts. A cash economy exists in both districts each village visited had least one trading post and focus group participants reported engaging in cash trade but it is weak. The focus group discussions held in villages across Sesheke and Namwala revealed that for people in these communities, maize is essentially another form of currency: it is bartered to access a range of goods, including clothes, soap and vegetables, both within and outside the community. This is discussed in more detail in Section 3.3. The extent of the barter system and effective removal of fresh food from the cash economy presents a challenge to the Cost of Diet method, which requires commodity price data in order to determine the minimum cost of a nutritious diet. It also emerged during the data collection that different foods are available at the market at different times of the day. For example, although dried fish was plentiful, very little fresh fish was found at Sesheke Town market during the initial survey (at approximately midday). However, it was observed that an abundance of fresh fish was available in the evening (from 18hr). No fresh produce was found at a rural trading post (Sabelo, Silumbo ward) surveyed two days later, although the trader reported that tomatoes and other vegetables are sometimes available early in the morning 24
25 when traders from the other side of the Zambezi River (where the land is more productive and not prone to flooding) come across to trade. At another trading post a few kilometers further along the road (Salumano, Kalobolelwa ward), the trader explained that she buys fresh fruit and vegetables from Namibia for resale at her trading post once or twice a month. She does not make the trip any more frequently because of financial risk involved in selling fresh produce in a location where demand is limited. In Shivawambwe (Namwala) focus group participants explained that local markets only stock vegetables in July and August. Again, the sporadic nature of the market offering makes it difficult to acquire price data for produce outside of the main district market Individual interview findings The individual interviews revealed that dietary diversity is limited in both districts. In both Sesheke and Namwala, only 39 foods (including salt, sugar and cooking oil) were described as being usually or often eaten. Maize in the form of roller meal (whole grain ground maize) is regularly and universally consumed in the districts surveyed. Half of all respondents in Sesheke reported consuming sorghum and millet often or usually, but the rate was much lower in Namwala with only 13 percent of respondents claiming to regularly consume sorghum, and only 9 percent consuming millet. The consumption frequency of the foods on the food list is broadly similar in both provinces. Most vegetables on the list are often or usually consumed in both districts, with some notable differences. For example, 66 percent of respondents in Sesheke reported eating cassava leaves usually or often, compared with only 22 percent in Namwala. However, 81 percent of respondents in Namwala reported regular consumption of sweet potato leaves, compared with only 25 percent of participants in Sesheke. Half of the respondents in Namwala reported frequent consumption of small eggplants (impwa), compared to only 19 percent in Sesheke. Based on the individual interviews, the consumption of fruit appears to be low in both districts, however, it was revealed during the focus groups that a wide range of wild fruit is consumed. A list of the wild fruits named by focus group participants is provided in Annex 10. The consumption of pulses is generally low, with the exception of cowpeas, which were reported to have a high rate of consumption in both districts despite not being found at any markets in Namwala. Solwezi beans, Lusaka beans and white beans were found on sale at markets in both Sesheke and Namwala, but are reported as being rarely consumed. Half of the respondents in Namwala reported eating kabulangeti beans regularly, compared to only 28 percent of respondents in Sesheke. Although more than half of all respondents reported the frequent consumption of Bambara nuts, these were not found at the markets in either district. Groundnuts are the most 25
26 widely consumed legume in both districts ( usually or often consumed by 84 percent of respondents in Sesheke and by 97 percent of respondents in Namwala), surpassed only by groundnuts in pounded form, with respondents almost unanimously reporting regular consumption. Interestingly, soya pieces commonly found at the markets in both districts have a high rate of consumption: 75 percent in Sesheke and 88 percent in Namwala based the findings of the individual interviews Focus group findings typical dietary habits Food consumption habits are similar in both districts. Meals are eaten up to three times a day during harvest time, but meal frequency reduces to two meals and then one meal per day as the availability of food decreases. For four to six months of the year the communities surveyed do not have enough food and rationing becomes necessary. Respondents also report skipping meals. In Namwala, ceele and chibwantu (drinks made from milk or sour milk and maize) which are popular and frequently consumed during times of plenty are not consumed during the lean season. Infants and young children The foods given to children are uniform across both districts. A child is fed plain porridge at six months, and nshima and water are introduced at one year. Children are given plain maize porridge with milk and bananas. Several groups reported that young children are not given leftover nshima as it is believed to cause a child to grow a large stomach. Some myths persist, and it is common for children not to be given Bambara nuts (thought to delay a child s speech or the growth of their teeth), imilonge (delayed development of a child s teeth) and pumpkin (believed to cause diarrhoea). Some groups expressed a belief that the consumption of eggs leads to delayed hair growth among children, while other groups do not have this superstition and reported giving children eggs for protein and to promote growth. Some participants reported a belief that sour milk causes weak joints in children, and others stated that children are not given okra it is believed to be devoid of nutritional value. Most groups stated that children s nutritional needs are prioritised when food is scarce, although one group reported rationing children s meals in favour of allocating more to the man of the house. Pregnant and lactating women In the communities surveyed, pregnant women eat fish, meat, ground nuts, milk, nshima, beans, vegetables and wild fruits, but avoid eating eggs, chicken, wild animals and leftovers. Some superstitious beliefs were revealed during the focus group discussions, for example, several groups explained that pregnant women are forbidden from eating the meat of a cow that died while pregnant. 26
27 Lactating mothers avoid eating imilonge (fish), okra, pumpkin and pumpkin leaves as it is believed that consumption of these foods by the mother will cause stomach pains for the baby consuming breast milk. Sick people Sick people are given foods that are believed to boost the immune system: vegetables, fruit, fresh milk, fish and eggs. In one village in Sesheke District it was reported that sick people are given caterpillars, although caterpillars are rarely consumed otherwise. Changes in availability of certain foods Respondents in one village in Sesheke reported that the consumption of goat meat has declined and attributed this to the prevalence of diseases in goat herds. Villages in both Sesheke and Namwala reported that certain species of fish that had been commonly eaten are no longer available due to overfishing. Deforestation is believed to have resulted in the declining availability of some wild fruits. In several areas animals including rabbits, duiker, mbaambi, rabbits, hares, buffalo and warthogs are no longer found due to overhunting. The declining population of these animals and of impala, porcupines, wild guinea fowl and gazelles is also believed to be due to the depletion of the forest and increased settlement. In Namwala, the disappearance of a wild tuber known as chipama was also attributed to land being cleared for settlement. Some wild vegetables, including muzaeo and namukulongu, are still available but no longer considered edible, whereas wild vegetables such as hahipa, bunkululu, mukamba, bbuyu and nahwa are reported to be depleted. Wealth status and meal preparation In the focus group discussions in both districts it was commonly agreed that everyone prepares food to the level that their income allows. For example, those who are better off can afford to buy cooking oil and will use onions and tomatoes. Those with less purchasing power are more restricted in their cooking Focus groups: observations The groups in both districts reported similar coping strategies during times of food insecurity: undertaking casual labour in exchange for food, gathering wild foods (predominantly fruit and nuts) for consumption, selling vegetables produced in home gardens, and selling fish. Notably, one group in Sesheke also reported selling home brewed beer in order to buy food. A group in Namwala described a potentially negative coping strategy whereby a bag of maize could be borrowed on the promise that two bags would be repaid at the next harvest. This effectively amounts to a loan with an interest rate of 100 percent. 27
28 The preservation of food is common in all villages surveyed. Maize is typically stored in sacks or granaries and treated with chemicals. One group explained that if they cannot afford chemicals the maize is stored unprocessed so that the weevils feed on the chaff and not on the grain. Groups in two villages reported adding ash to maize, which is said to act as a preservation agent. Another group preserve maize with dried cow dung and tobacco leaves. A variety of vegetables is preserved by sun-drying, though one group reported a reduction in the amount of vegetables dried in the past year owing to excessive rains. Although some groups reported selling dried vegetables for cash, most is reserved for home consumption. Preserved vegetable stocks for home consumption usually last for one to three months. Two groups in Sesheke District reported drying beef, which is stored and consumed when needed. Wild fruits are also commonly preserved across both districts. Fruits such as munzinzila, mubilo, muchingachinga and mundundo are sun-dried and only sold if there is a surplus. One group in Sesheke reported extracting oil from mongongo nuts to sell at the market. The focus groups revealed that barter is prevalent throughout both districts; indeed, maize is considered a form of currency. Focus group participants reported exchanging home-grown vegetables and busala for maize, and bartering maize for fish, salt, clothes, kitchenware and utensils. Vegetables are also reported to be bartered for fish, while groundnuts are bartered for cabbage. Barter happens predominantly within the community, but for certain items barter will take place outside of the community. Maize is the main staple in both districts, is generally eaten at every meal, and is available in a variety of forms: fresh maize, samp, roller meal (ground wholegrain, local process) and mealie meal (degermed, industrial production). Roller meal is most widely consumed, both as nshima and porridge. During harvest time maize is mixed with milk to make a popular drink known as chibwantu. Maize is grown in all communities and is purchased from the market when the home supply runs out. Sorghum and millet are also commonly consumed in communities throughout Seskehe, but are rarely grown or consumed in Namwala. Rice is only consumed on special occasions. The cultivation of ground nuts and Bambara nuts is widespread, and ground nuts may also be purchased from within the community if home stocks deplete. Ground nuts are pounded and added to porridge or relish. Beans are typically eaten twice a week. Local beans and cowpeas are cultivated and kept for home consumption. Pulses such as Kabulangeti beans, Lusaka beans and white beans are bought from the market. Every community is engaged in gardening and produces a range of vegetables including rape, okra, cabbage, tomatoes, Chinese cabbage, hibiscus leaf, amaranths and pumpkin leaves. Vegetables are eaten at every meal primarily between May and September. Vegetables are purchased from the market when own produce declines (usually from September). Though considered a staple in other parts of Zambia, cassava is not commonly cultivated in either Sesheke or Namwala. Sweet potatoes are commonly eaten but 28
29 are often purchased from the market. Busala, a wild tuber, was not found at the markets in Sesheke but is particularly popular in Namwala Cost of the diets Using price and weight data collected at the markets, the cost of an energy-only diet, a nutritious diet, and a nutritious diet based on typical dietary habits was calculated for a family of five in each district. It should be noted that breast milk appears in each diet summary but is specifically intended for the child aged months, who is automatically included in any standard household composition. There is no monetary cost attached to breast milk; it is costed within the average extra energy and nutrients required by the mother each day (418kcal per day) Energy-only diet When estimating an energy only diet, the software calculates a lowest cost diet that meets only the average energy requirements of the family. The analysis is not used to promote an energy-only diet because it is very unlikely to meet all micronutrient requirements, however, it is useful to illustrate: The potential for micronutrient deficiencies in a diet that provides energy The additional cost of meeting all nutrient requirements, including micronutrients, in addition to energy (see Annex 1 for more information) Table 4 shows the analysis of the daily and annual cost of the diet for a standard CoD family of 5 persons. The minimum cost of a diet that meets a household s energy needs has been estimated at 7.18 ZMW per day in Sesheke and between 7.68 ZMW and 7.98 ZMW in Namwala depending on the season. The average monthly cost of the energy-only diet for a 5-person household is estimated to be 218 ZMW in Sesheke and 238 ZMW in Namwala District. The annual cost of the EO diet is 2,620 ZMW in Sesheke District and 2,851 ZMW in Namwala District. Table 4: The daily, monthly and annual cost in Zambian Kwacha of an energy-only diet for a 5-person household in two districts. Energy-only Diet Average Monthly Annual Cost (ZMW) District Daily Cost (ZMW) Cost (ZMW) Sesheke ,620 Namwala ,851 Given that the supplementary price data entered for maize puts the cost at 2.00 ZMW/kg in Namwala and 2.30 ZMW/kg in Sesheke, it might be expected that the energy cost would be lower in Namwala, however, Namwala s price advantage has been offset by the higher cost of mealie meal found at the market. It is also worth noting that although some of the household energy requirement in Sesheke will be met by home-grown sorghum and millet, this is not reflected in the cost of the energy- 29
30 Cost of diet in ZMW Cost of diet in ZMW only diet as no price data for was found for these crops. In any case, maize is the dominant staple depended on by all communities surveyed. Figures 1 and 2 show how the monthly cost of the energy-only diet in Sesheke and Namwala varies according to the number of individuals in the household and for families with minimum, average and maximum energy requirements. (Refer to Section 2.6 and Annex 9 for more information on families of high and low energy requirements.) Figure 1: Monthly cost of an energy-only diet for households of 5, 6, 7, 8, 9 and 10 persons in Sesheke Household size (number of persons) Low energy COD standard High energy Figure 2: Monthly cost of an energy-only diet for households of 5, 6, 7, 8, 9 and 10 persons in Namwala Household size (number of persons) Low energy COD standard High energy The cost of an energy-only diet for a 5-person household in Sesheke ranges between 159 ZMW and 281 ZMW per month. In Namwala the cost for the same sized household ranges between 174 ZMW and 305 ZMW per month. 30
31 Figures 3 and 4 show the percentage of recommended requirements met for the essential macro and micronutrients by an energy only diet, averaged across a 5-person household for both districts. Annex 11 shows the absolute weight and cost of the foods selected for an energy-only diet for the family in each district for a year, with the percentage contributed by each food in terms of weight, cost, energy, protein and fat, the percentage contribution of each food for eight vitamins and four minerals, and the percentage of the total requirements for each nutrient. The software incorporates both unprocessed maize grain and mealie meal into the analysis for both districts (and in the same proportions for each district). Interestingly, roller meal (unprocessed maize grain) accounts for 61 percent of the cost of the EO diet in Sesheke and only 39 percent of the cost in Namwala. This can be attributed to the difference in the cost of maize grain in each district (K2.30/kg in Sesheke and K2.00/kg in Namwala). The analysis highlights the crucial importance of maize in the diet of the target communities. Not only does maize fulfil the bulk of the family s energy requirement, it also meets the family s need for vitamin B1, vitamin B6, magnesium and zinc, as illustrated in Annex 11. The energy-only diet also meets the family s protein requirement, but it is important to note that as maize is not a complete protein additional sources of protein are necessary to provide all the essential amino acids. The importance of maize in the diet in both districts cannot be overstated. 31
32 Figure 3: The percentage of energy and target nutrient intakes met in an energy-only diet for the family, by season in Sesheke. Energy-only Diet Sesheke District / Cereal, Livestock and Timber Zone Season Energy Protein Fat Vitamin A Vitamin C Vitamin B1 Vitamin B2 Niacin Pantothenic Acid Vitamin B6 Folic Acid Vitamin B12 Calcium Iron Magnesium Zinc Cold Rainy Dry
33 Figure 4: The percentage of energy and target nutrient intakes met in an energy-only diet for the family, by season in Namwala. Energy-only Diet Namwala District / Maize, Livestock and Fishery Zone Season Energy Protein Fat Vitamin A Vitamin C Vitamin B1 Vitamin B2 Niacin Pantothenic Acid Vitamin B6 Folic Acid Vitamin B12 Calcium Iron Magnesium Zinc Cold Rainy Dry
34 Micronutrient/nutritious (MNUT) diet When estimating a nutritious diet, the software calculates the lowest cost combination of foods which meets the average energy requirements and the recommended micronutrient intake of the typical family. This diet does not reflect people s typical dietary patterns but it is useful to illustrate: The differences in diet composition and its cost when compared with a diet that takes into account typical dietary patterns. The extra cost of micronutrients when compared with the energy only diet The relatively small number of foods that can provide a nutritious diet but often in unrealistic quantities Table 5 shows the minimum cost of a nutritionally adequate diet that meets the average recommended requirements for energy, protein, fat and micronutrients. It is estimated to cost between ZMW and ZMW per day in Sesheke and between ZMW and ZMW in Namwala. The monthly cost of the MNUT diet for a typical 5-person family is estimated to be in is 615 ZMW in Sesheke and 821 ZMW in Namwala. The annual cost is 7,377 ZMW and 9,857 ZMW in Sesheke and Namwala respectively. Table 5: The daily, monthly and annual cost in Zambian Kwacha of a nutritious diet for a 5-person household in two districts. Nutritious Diet District Daily Cost (ZMW) Monthly Cost (ZMW) Annual Cost (ZMW) Sesheke ,377 Namwala ,857 Table 6 shows the cost of the MNUT diet for a typical 5-person family by season. In both districts the MNUT diet is most expensive during the dry season. The cost of the diet in the rainy and cold season is similar within each district, but overall, the cost of the diet is significantly higher in Namwala than in Sesheke. As the cost of maize is lower in Namwala than in Sesheke (see section ), the higher overall cost of the diet in Namwala can be attributed to the smaller number of nutrient-rich vegetables found at the markets in the district. As indicated in Section 3.1, only 13 of the 39 foods reported to be commonly eaten in Namwala were found at the market. Since the diet can only be costed using price information for food items found at the market, the software may not have the option to choose the cheapest source of each nutrient. This will result in a higher cost for a nutritious diet. Table 6: The seasonal cost in Zambian Kwacha (ZMW) of a nutritious diet for a 5- person household in two districts. Based on a 5-person Average daily cost (Zambian Kwacha) household Cold Rainy Dry Sesheke Namwala
35 Cost of diet in ZMW Cost of diet in ZMW Figures 5 and 6 show how the monthly cost of the MNUT (nutritious) diet in Sesheke and Namwala varies according to the number of individuals in the household and for families with minimum, average and maximum energy requirements. (Refer to Section 2.6 and Annex 9 for more information on families of high and low energy requirements.) Figure 5: Monthly cost of an MNUT (nutritious) diet for households of 5, 6, 7, 8, 9 and 10 persons in Sesheke. 1,400 1,300 1,200 1,100 1, Household size (number of persons) Low energy COD standard High energy Figure 6: Monthly cost of an MNUT (nutritious) diet for households of 5, 6, 7, 8, 9 and 10 persons in Namwala. 2,500 2,250 2,000 1,750 1,500 1,250 1, Household size (number of persons) Low energy COD standard High energy The cost of a nutritious (MNUT) diet for a 5-person household in Sesheke ranges between 462 ZMW and 687 ZMW per month. In Namwala the cost for the same sized household ranges between 688 ZMW and 1,071 ZMW per month. 35
36 Annex 12 shows the absolute yearly weight and cost of the foods selected for a nutritious diet in each district with the percentage contributed by each food in terms of weight, cost, energy, protein and fat, the percentage contribution of each food for eight vitamins and four minerals and the percentage of the total requirements met by each nutrient. In Sesheke, the nutritious diet comprises 17 foods. Wholegrain maize accounts for 20 percent of the cost of the nutritious diet, but satisfies 60 percent of the family s total energy requirement and 52 percent of protein needs. In the context of the hypothesized diet, maize provides essential nutrients in the following proportions: Vitamin B1 78 Vitamin B2 25 Vitamin B3 (niacin) 34 Vitamin B6 55 Folic acid 22 Iron 34 Zinc 65 This breakdown highlights the importance of the staple crop as part of a nutritious diet in the district. As a food group, fish also makes an important contribution to the nutritious diet, with three species included. Overall, fish contributes 40 percent to the cost of the diet and provides 19 percent of the protein intake. In addition, it provides 38 percent and 11 percent of the intake of calcium and iron respectively, and is the only source of vitamin B12 (excluding that contained in breastmilk fed to the child aged months). Two vegetables pumpkin and sweet potato leaves contribute 9 percent to the overall cost of the diet, but along with amaranth leaves (included in the analysis at zero cost) provide almost 73 percent of the family s vitamin A requirement and 29 percent of the yearly recommended intake of vitamin C. The vegetables also provide 54 percent of both vitamin B2 and folic acid. Oil accounts for 17 percent of the overall cost and provides just over half of the fat in the diet. Caterpillars account for almost 16 percent of the iron in the nutritious diet, with a further 26 percent of iron provided by the free amaranth leaves. The fruits that have been included at zero cost in the cold and rainy season (mango and non-specific bush fruit) provide 70 percent of the yearly intake of vitamin C. Together, the three free foods make up 46 percent of vitamin A and 93 percent of the vitamin C intake across the year. 36
37 The nutrients that contribute most to the cost of the diet are those for which the target of 100 percent has only just been reached 19. Vitamin B12 emerges as the most expensive nutrient, in this instance derived only from fish, which accounts for 40 percent of the overall cost of the diet. In Namwala District, the nutritious diet comprises 23 foods. Wholegrain maize provides 54 percent of the energy and 40 percent of protein in the diet, and accounts for 10 percent of the overall cost of the nutritious diet. As in the hypothetical diet generated for Sesheke, maize also provides a high proportion of the recommended intake of vitamin B1 (64 percent), vitamin B2 (23 percent), vitamin B3/niacin (27 percent) and vitamin B6 (47 percent), as well as iron (38 percent) and zinc (49 percent). Other protein sources include beans (providing 16 percent of protein) and fish (providing 19 percent of protein), with each food group accounting for 15 percent and 33 percent of the annual cost of the diet respectively. The greatest cost contributor, fish also provides 25 percent of vitamin B3/niacin, 37 percent of calcium and all of the vitamin B12 (excluding that contained in the breastmilk fed to the child aged months). Beans account for 31 percent of the folic acid in the diet, and also contribute to the intake of calcium (12 percent), zinc (16 percent) and iron (16 percent). The four costed vegetables included in the hypothetical diet account for 19 percent of yearly cost, and when combined with the two free vegetables (sweet potato leaves and okra) provide a significant proportion of the diet s vitamin A (93 percent), vitamin C (48 percent), vitamin B2 (57 percent), vitamin B3/niacin (33 percent), vitamin B6 (34 percent), folic acid (52 percent), calcium (39 percent), iron (31 percent) and zinc (21 percent). Wild fruit represented in the analysis as fruit, bush, nonspecific provides 48 percent of the vitamin C in the diet. Figures 7 and 8 show the percentage of energy and target nutrient intakes for the family by season. The percentage of nutrient intakes met in a nutritious diet are broadly similar in each season, with the exception of vitamin C, with levels spiking during the cold and rainy season in both districts owing to the inclusion of free foods, such as bush fruit, mango, okra, amaranth leaves and sweet potato leaves. Although the software has been able to meet the recommended intakes of each micronutrient using local foods, the micronutrients for which the target of 100 percent has only just been met are revealed as being those most difficult to obtain in a diet that is not constrained by typical dietary patterns. These nutrients drive up the cost of the MNUT diet because the software has to include more expensive foods that provide these nutrients. Interestingly, vitamin B12 is the micronutrient that adds most to the cost of the diet in Sesheke, whereas the most costly micronutrients in the diet created for Namwala are calcium and iron. 19 It can be observed that most nutrients included in the model of a nutritious diet far exceed the target intake of 100. The software is designed to create a diet that achieves a minimum of 100 of the target intake for each nutrient. When a target is reached by 100 and no more it implies that the nutrient is not abundant. The software may therefore have to include foods that are more expensive in order to meet the requirement. 37
38 The analysis indicates that in Namwala the nutritious diet is cheaper in the rainy season than in the cold season. However, the reality is likely to be different: the harvest occurs in the cold season meaning more people are consuming their own food stocks, and with more plentiful food stocks market prices are likely to be lower. The cost determined for the rainy season is cheaper mainly because of the inclusion of wild fruit at zero cost, which means that the software does not have to draw on priced foods to fulfil the requirement for vitamin C. Various foods that are home-produced could have been included at zero cost during the cold season, which would have resulted in a lower cost of the diet in this season. But as explained in Section 2.9, it is not possible to specify the number of days in a season that free foods last, which may cause the cost of the diet to be underestimated. Furthermore, it is important to use market prices as far as possible so that in the case that all food must be sourced from the market the cost of a nutritious diet is known. 38
39 Figure 7: The percentage of energy and target nutrient intakes met in a nutritious diet for the family, by season in Sesheke. Nutritious Diet Sesheke District / Cereal, Livestock and Timber Zone Season Energy Protein Fat Vitamin A Vitamin C Vitamin B1 Vitamin B2 Niacin Pantothenic Acid Vitamin B6 Folic Acid Vitamin B12 Calcium Iron Magnesium Zinc Cold Rainy , Dry
40 Figure 8: The percentage of energy and target nutrient intakes met in a nutritious diet for the family, by season in Namwala. Nutritious Diet Namwala District / Maize, Livestock and Fishery Zone Season Energy Protein Fat Vitamin A Vitamin C Vitamin B1 Vitamin B2 Niacin Pantothenic Acid Vitamin B6 Folic Acid Vitamin B12 Calcium Iron Magnesium Zinc Cold Rainy Dry
41 The food habits nutritious diet As described in Annex 1, the food habits diet is, in theory, a nutritious diet that takes into account the typical dietary habits of households in each of the districts as revealed by the individual interviews and focus group discussions. Typical dietary habits are incorporated through applying minimum and maximum constraints to the number of times a food can be consumed in a day or over the course of week. (See Section 2.8 for a more detailed explanation.) Table 7 shows that the minimum cost of a nutritionally adequate diet based on local dietary habits that meets the average recommended requirements for energy, protein, fat and micronutrients. The FHAB diet is estimated to cost between ZMW and ZMW per day in Sesheke and between ZMW and ZMW in Namwala. The average monthly cost of the FHAB diet for a typical 5-person family is 718 ZMW in Sesheke and 1,103 ZMW in Namwala. The annual cost of the diet is estimated to be 8,617 ZMW in Sesheke and 12,159 in Namwala. Table 7: The daily, monthly and annual cost in Zambian Kwacha of a food habits nutritious diet for a 5-person household in two districts. Food Habits Nutritious Diet Average monthly Annual Cost (ZMW) District Daily Cost (ZMW) cost (ZMW) Sesheke ,617 Namwala ,013 12,159 Table 8 shows the cost of the FHAB diet for a typical 5-person family by season. In both districts the FHAB diet is most expensive during the dry season. In Sesheke, the average daily cost is slightly higher in the rainy season than in the cold season, but in Namwala the cost appears to be higher in the cold season than in the rainy season. The cost in the rainy season has been reduced by the inclusion of mango, bush fruit and two vegetables (sweet potato leaves and okra) at zero cost. In reality, the cost of the diet is likely to be cheapest during the cold season when market supply is high. However, in order to generate the most accurate cost possible across the year it is important to factor into the diet the foods that are most commonly relied upon for sustenance and nutrition, whether they are purchased at the market or not. Table 8: The seasonal cost in Zambian Kwacha (ZMW) of a food habits nutritious diet for a 5-person household in two districts. Based on a 5-person Average daily cost (Zambian Kwacha) household Cold Rainy Dry Sesheke Namwala Figures 9 and 10 show how the monthly cost of the MNUT (nutritious) diet in Sesheke and Namwala varies according to the number of individuals in the 41
42 Cost of diet in ZMW Cost of diet in ZMW household and for families with minimum, average and maximum energy requirements. (Refer to Section 2.6 and Annex 9 for more information on families of high and low energy requirements.) Figure 9: Monthly cost of a food habits nutritious diet for households of 5, 6, 7, 8, 9 and 10 persons in Sesheke. 1,800 1,700 1,600 1,500 1,400 1,300 1,200 1,100 1, Household size (number of persons) Low energy COD standard High energy Figure 10: Monthly cost of a food habits nutritious diet for households of 5, 6, 7, 8, 9 and 10 persons in Namwala. 3,200 3,000 2,800 2,600 2,400 2,200 2,000 1,800 1,600 1,400 1,200 1, Household size (number of persons) Low energy COD standard High energy The cost of a food habits nutritious diet for a 5-person household in Sesheke ranges between 569 ZMW and 895 ZMW per month. In Namwala the cost for the same sized household ranges between 1,005 ZMW and 1,470 ZMW per month. 42
43 Annex 13 shows the absolute yearly weight and cost of the foods selected for a food habits nutritious diet in each district with the percentage contributed by each food in terms of weight, cost, energy, protein and fat, the percentage contribution of each food for eight vitamins and four minerals and the percentage of the total requirements met by each nutrient. In Sesheke, the food habits nutritious diet comprises 23 foods, including three varieties of maize, five varieties of fish, five legumes and four vegetables. Wholegrain maize accounts for 12 percent of the cost of the food habits diet but satisfies 42 percent of the family s total energy requirement and 34 percent of protein needs. The FHAB diet also incorporates fresh maize and mealie meal. Overall, maize products account for 22 percent of the annual cost of the food habits diet and contribute 65 percent of the diet s energy and 50 percent of protein needs. Combined, the three forms of maize provide essential micronutrients in the following proportions: Vitamin B1 74 Vitamin B2 29 Vitamin B3 (niacin) 33 Vitamin B6 52 Folic acid 16 Iron 28 Zinc 57 As with the nutritious (MNUT) diet, the food habits (FHAB) diet is similarly dependent on the contribution of maize to the intake of four B vitamins, folic acid, iron and zinc. Fish accounts for 40 percent of the cost of the food habits diet (in line with the MNUT diet) and provides 23 percent of the diet s protein (compared to 19 percent in the MNUT model). Fish is an important source of several micronutrients in the diet, including calcium (43 percent) and iron (21 percent), and it provides the family s full complement of vitamin B12 (excluding that contained in breastmilk fed to the child aged months). Three costed vegetables (pumpkin, mushrooms and sweet potato leaves), along with one free vegetable (amaranth leaves) and two free fruits (mango and bush fruit ) provide the bulk of the remaining micronutrients. The breakdown of the contribution by costed vegetables and free fruit and vegetables can be seen in Table 9. 43
44 Table 9: Percentage of micronutrients in the FHAB diet in Sesheke provided by costed and free fruit and vegetables. Micronutrient provided by costed veg (pumpkin, provided by free fruit and vegetables micronutrients provided by fee and dried mushrooms, (amaranth leaves, costed fruit and sweet potato leaves) mango, bush fruit ) vegetables Vitamin A Vitamin C Vitamin B Vitamin B3/niacin Vitamin B Folic Acid Calcium Iron Zinc As can be seen from Table 9 above, the free foods are an important source of micronutrients in the diet, contributing as much as 86 percent of family s annual vitamin C intake and 48 percent of calcium. Combined with the costed items in the table, fresh fruit and vegetables provide the family s entire intake of vitamin A and vitamin C (the remaining intake is from breastmilk). The four pulses incorporated into the diet contribute relatively little to the protein intake (3 percent), but they constitute 15 percent of the folic acid in the diet. Oil accounts for 15 percent of the cost of the diet and constitutes 55 percent of the fat intake. As with the MNUT diet, vitamin B12 is the nutrient that contributes most to the cost of the FHAB diet in Sesheke. However, the target of 100 percent is far exceeded for all other micronutrients. In Namwala District, the nutritious diet comprises 27 foods. Wholegrain maize accounts for 6 percent of the cost of the food habits diet but satisfies 42 percent of the family s total energy requirement and 27 percent of protein needs. The FHAB diet also incorporates mealie meal. Combined, maize products account for 9 percent of the annual cost of the food habits diet and contribute 49 percent of the diet s energy and 31 percent of protein needs. Together, the wholegrain maize and mealie meal provide essential micronutrients in the following proportions: Vitamin B1 57 Vitamin B2 22 Vitamin B3 (niacin) 18 Vitamin B6 39 Folic acid 10 Iron 30 Zinc 40 44
45 As with the MNUT diet and the FHAB diet for Sesheke, maize contributes significantly to the micronutrient content of the Namwala FHAB diet. The FHAB diet in Namwala incorporates six varieties of fish, which together provide a further 31 percent of the protein intake. Fish accounts for 40 percent of the cost of the diet, but provides a high quantity of some essential micronutrients, including vitamin B3/niacin (41 percent), calcium (50 percent), iron (17 percent) and zinc (16 percent). Fish is the most important source of vitamin B12 in the diet, contributing 92 percent of the intake (the remainder is sourced from eggs (5 percent) and breastmilk). Four pulses are included in the diet. They account for 14 percent of the overall cost of the diet, 14 percent of the protein intake and also contribute to the intake of folic acid (36 percent), calcium (11 percent), zinc (16 percent) and iron (17 percent). The three costed vegetables (cabbage, rape (substituted by kale), and pumpkin) and one fruit (watermelon) are included in the hypothetical diet and account for 11 percent of yearly cost. When combined, the two free vegetables (sweet potato leaves and okra) and two free fruits (mango and non-specified bush fruit ) provide a significant proportion of the diet s vitamin A (95 percent), vitamin C (94 percent), vitamin B2 (62 percent), vitamin B3/niacin (24 percent), vitamin B6 (34 percent), folic acid (48 percent), calcium (29 percent), iron (31 percent) and zinc (19 percent). The breakdown of the contribution by costed vegetables and free fruit and vegetables can be seen in Table 10. Table 10: Percentage of micronutrients in the FHAB diet in Namwala provided by costed and free fruit and vegetables. Micronutrient provided by costed fruit and veg provided by free fruit and vegetables micronutrients provided by fee and (cabbage, rape, (mango, bush fruit, okra, costed fruit and pumpkin, watermelon) sweet potato leaves) vegetables Vitamin A Vitamin C Vitamin B Vitamin B3/niacin Vitamin B Folic Acid Calcium Iron Zinc As can be seen from Table 10 above, free foods are an important source of micronutrients in the diet, although it is interesting to note that they contribute less vitamin C and calcium to the diet than the free foods in the Sesheke FHAB diet. However, in common with the Sesheke model, the combination of costed and free fruit and vegetables provides almost all of the family s intake of vitamin A and vitamin C. 45
46 Figures 11 and 12 show the percentage of energy and target nutrient intakes for the family by season. Interestingly, the target for vitamin B12 is exceeded in each season, indicating that the additional fish species incorporated into the Namwala FHAB diet help to avoid vitamin B12 deficiency. In two seasons the target for iron is met by exactly 100 percent, indicating that sources of iron are more limited and expensive. There are some variations in the amount by which the target for each micronutrient is met across each season, but for the most part the targets are exceeded by a substantial margin. 46
47 Figure 11: The percentage of energy and target nutrient intakes met in a food habits nutritious diet for the family, by season in Sesheke. Food Habits Nutritious Diet Sesheke District / Cereal, Livestock and Timber Zone Season Energy Protein Fat Vitamin A Vitamin C Vitamin B1 Vitamin B2 Niacin Pantothenic Acid Vitamin B6 Folic Acid Vitamin B12 Calcium Iron Magnesium Zinc Cold Rainy Dry
48 Figure 12: The percentage of energy and target nutrient intakes met in a food habits nutritious diet for the family, by season in Namwala. Food Habits Nutritious Diet Namwala District / Maize, Livestock and Fishery Zone Season Energy Protein Fat Vitamin A Vitamin C Vitamin B1 Vitamin B2 Niacin Pantothenic Acid Vitamin B6 Folic Acid Vitamin B12 Calcium Iron Magnesium Zinc Cold Rainy Dry
49 3.6. Cost comparison between the MNUT and FHAB diets As explained in Section 3.1, the individual interviews and focus group discussions revealed a striking disparity between the foods that are most commonly consumed, and the foods that are available at the market. In Sesheke, 13 of the 39 most commonly eaten foods 20 were not found at the markets, while 29 of the foods found at the market were reported as being rarely or never consumed by 50 percent or more of respondents. In Namwala, 18 of the 40 most frequently consumed foods 21 were not found at the market, while 17 of the 40 foods found at the market were reported as being rarely or never consumed by 50 percent or more of respondents. As shown in Table 11, the cost of the FHAB diet is 17 percent more expensive than the MNUT diet in Sesheke, and 23 percent more expensive in Namwala. However, it is important to remember that the cost of each diet is based on foods for which market data was available (with the exception of the small number of fruit and vegetables that were included at zero cost for reasons explained in Section 2.9). If markets reliably stocked the foods that people routinely consume the cost of the food habits diet would likely be much lower. When the software is limited to selecting from priced foods and so many of the foods favoured by the communities were not available at the markets it has a much narrower scope for generating a food habits diet. The resulting hypothetical diet will inevitably be more expensive. Table 11: Daily, monthly and annual cost of MNUT diet and FHAB diet for each district, with difference in cost between the two diets highlighted. Diet Rainy season Cold season Dry season Monthly Annual cost (166 days) (123 days) (77 days) cost SESHEKE DISTRICT MNUT cost ,377 FHAB cost ,617 DIFFERENCE ,240 difference NAMWALA DISTRICT MNUT cost ,857 FHAB cost ,013 12,159 DIFFERENCE ,302 difference Another point to consider is that the food habits diet which is intended to be a culturally appropriate diet is not necessarily a reflection of local food preferences, but of food availability. As noted above, respondents reported rarely or never consuming a large proportion of the foods found at the market but lack of access to markets (economic and physical) is a key reason for poor dietary diversity. Given that the food habits diet comprises only a small number of the foods that are most frequently consumed, it is recommended that cost of the food habits diet be viewed with caution. 20 Foods usually or often consumed by 50 percent or more of focus group respondents 21 Foods usually or often consumed by 50 percent or more of focus group respondents 49
50 4. Key Findings The key findings of the Cost of the Diet survey are summarized below. The cost of a nutritious diet beyond the means of the poor The average monthly cost of a nutritious diet for a family of five is ZMW 615 in Sesheke and ZMW 821 in Namwala. This is clearly well beyond the means of the poor and shows that the monthly social cash transfer of ZMW 90 is grossly inadequate. Underdeveloped market system The market surveys undertaken as part of the Cost of the Diet study offer a snapshot of the foods on offer at the market during harvest time, typically the time of greatest abundance. A relatively small number of foods was found at the main markets in both districts (55 in Sesheke; 39 in Namwala), and discussions with traders revealed that supply is often erratic, varying by season, day of the week and even time of day. This is at least in part a function of the high level of domestic production in the districts, with many families only purchasing from the market when their own stocks have run out. Dearth of markets in rural areas In the main, the Cost of Diet analysis relied on market data obtained from the main markets in each district, i.e. Sesheke market and Katima market in Sesheke District, and Namwala Central and Moobola market in Namwala District. Most (but not all) of the villages in which the focus group discussions were held had a trading post offering non-perishable items including cooking oil, salt, confectionary and soft drinks, but fresh food was never found. These communities are wholly reliant on their own produce during the cold season, but it is unclear if rural trading posts supply vegetables, pulses and cereals at other times of the year when home stocks are depleted. The ability of rural trading posts to supply fresh food is likely compromised by the well-established barter system evident in these areas. Prevalence of barter system The focus group discussions and conversations with market traders reveal that barter is the dominant form of trade in rural areas. As described in Section 3.4, maize is regarded as a form of currency and is exchanged for food and non-food items (such as kitchenware) both locally and outside the community. This suppresses the development of the cash economy and the market system. 50
51 Impact of poor road infrastructure in rural areas The sites of the main markets in both districts are on the national road network and are therefore accessible to the urban population. However, the state of the unpaved roads into rural areas make transportation of goods extremely difficult. Some traders explained that transporting food supplies to rural areas was not viable because the communities are not willing to pay or are unable to afford the mark-up on the goods necessary to make the venture feasible. The only trading posts in rural areas found to be offering fresh fruit and vegetables) were those along the main roads. Poor road infrastructure is a major impediment to the development of markets in both districts. Disparity between foods sold at the market and main foods consumed in rural areas As noted in the previous chapter (Section 3.6), many of the foods most frequently consumed in rural areas were not found at the markets, and many of the foods found at the markets are not commonly consumed in rural communities. While this compromises the CoD software s ability to calculate a food habits nutritious diet that is realistic in both cost and content, it also shows that access (physical and economic) and distribution (due to underdeveloped infrastructure) are major obstacles to achieving food security and a fully functioning market system. Importance of domestic food production Communities are heavily reliant on home-grown food and use several strategies (food preservation, reduction in number of meals, etc.) to make this supply last as long as possible. Most groups interviewed reported experiencing a food shortage of four to six months each year. Foods can be purchased from the markets when own stocks are depleted, but the expense is so great that households have to reduce portion sizes and the number of meals consumed in a day. This underscores the importance of home produce in the diet of rural communities, and highlights the extreme vulnerability of these communities should the harvest fail. Main sources of protein The main protein-rich foods that are consumed in each district are fish, chicken, soya pieces, pulses and milk. Chicken was not found at markets in either district, but as it is a commonly consumed food supplementary price data was included in the cost of diet analysis (see Section 2.10). Despite this, chicken was not included in either the MNUT diet or the FHAB diet for either district, indicating that a nutritious diet can be achieved using other, more affordable sources of protein, that potentially also contribute important micronutrients to the diet. The interviews revealed that the consumption of pulses is generally low, with the exception of cowpeas, which are regularly consumed in both districts. A variety of pulses, including Solwezi, Lusaka, kabulangeti and white beans, was found at the market, and up to three varieties of bean were included in the nutritious diet generated by the COD software. This indicates that pulses are a low-cost source protein that can make an important contribution to a nutritious diet. 51
52 Limited dietary diversity The individual interviews and focus group discussions revealed that dietary diversity is limited in both districts. The bulk of each household s energy needs is provided by maize, and a small number of vegetables and fish is the main source of micronutrients in the diet. Contribution of food preservation to household food security As reported in Section 3.4 the preservation of food is common in all villages surveyed. The preservation of mushrooms, pumpkin and green vegetables by sun-drying has much potential for improving food security (both in extending the length of time that communities are self-sufficient each year, and for income generation), but the volume of food that can be preserved of often dictated by weather conditions. Importance of wild foods in the diet Wild fruits were reported to be commonly eaten, and, as evidenced by the MNUT and FHAB diet analysis, make a significant contribution to the intake of vitamin A and vitamin C in the local diet. Although the nutrient composition of the wild fruits is not known, fruit typically provides a range of essential micronutrients and its inclusion in the local diet helps to lower the cost of a nutritious diet. Changes in availability of wild foods The focus group discussions revealed that some wild foods are no longer as freely as available as they once were. Certain wild game has been hunted to the point of extinction, while the availability of some wild fruit and vegetables has declined due to deforestation and the clearing of land for farming and settlements. Participants also reported the declining stocks of certain fish species owing to overfishing. Food taboos A number of food-related myths and taboos were discussed during the focus group sessions. Breastfeeding mothers avoid eating okra, pumpkin and pumpkin leaves as they are thought to cause breastfed infants stomach pain. Certain foods such as Bambara nuts, eggs, sour milk, imilonge (fish) are believed to negatively affect a child s growth and/or cognitive development. Young children are not given pumpkin as it is thought to cause diarrhoea. It was also reported that pregnant women avoid eating meat from a cow that died while pregnant or giving birth as it is believed to bring bad luck. 52
53 5. Conclusions and Recommendations This analysis set out estimate the amount and combination of local foods in each district that are needed to provide a family of five with a diet that meets their average needs for energy and recommended intakes of protein, fats and micronutrients. This information has been set out in Annex 12. The second objective of the analysis was to calculate the annual and monthly cost of such a diet for a family of five in each of the selected districts. It was concluded that the annual cost of a nutritious diet for a family of five is 7,377 ZMW in Sesheke and 9,857 ZMW in Namwala. The monthly cost of a nutritious diet for the family is 615 ZMW in Sesheke and 821 ZMW in Namwala. As noted in Section 2.6, JCTR Zambia produces a monthly basic needs basket that tracks the cost of basic food items for a family of five across fifteen towns and cities across the country. The food basket is standardised for each location (in contrast to the CoD method which uses locally available foods) and is comprised of mealie meal, beans, kapenta, bream, beef, green vegetables, tomatoes, onions, cooking oil, bread, sugar, milk, tea, eggs and salt. JCTR puts the cost of a basic food basket at 1, ZMW for a family of five in Mongu 22 (Western Province), and at 1, ZMW in Choma 23 (Southern Province). These cost estimates are for the provincial capitals and are not specific to rural areas, but they provide a useful frame of reference. The final aim of the Cost of the Diet analysis was to determine if the value of the current cash transfer provision is sufficient to allow the poorest households in Sesheke and Namwala districts to access a nutritious diet. While the cost of the basic food baskets estimated by JCTR far exceeds the cost of the diet estimated using the Cost of the Diet tool, the cost estimated by both methods far exceeds the value of the cash transfer, which is set at 90 ZMW per household. By any measure, the amount of the cash transfer is insufficient to the aim of enabling a poor family of five to access a nutritious diet. The monthly cost of purchasing enough maize grain and mealie meal to satisfy the energy requirements of a family of five is estimated at 218 ZMW in Sesheke and 238 ZMW in Namwala (see Section ). This shows that, if sourcing the staple foods from the markets, a cash provision of 90 ZMW is still inadequate. It is recommended that the value of the social cash transfer be increased to a level that at least ensures that households have access to sufficient food energy when their own staple crop production is jeopardised or when their self-sufficiency is otherwise compromised. Although an increase in the value of the social cash transfer could in theory provide target communities with access to a greater range of foods, the lack of markets in rural areas and the inaccessibility of the districts main markets due to distance and
54 poor road infrastructure means it is unlikely that an increased cash provision would automatically translate into a greater diversity of food purchases. However, home - produced vegetables, tubers and beans provide essential nutrition for rural households, and an increase in the value of the cash transfer would enable households to purchase better seed and agricultural inputs. This in turn may result in increased dietary diversity, improved food security and better nutrition outcomes. The lack of dietary diversity and dependence of rural communities on household food production also highlights the importance of initiatives such as the RAIN project (Realigning Agriculture to Improve Nutrition), and it is recommended that resources continue to be directed at education with respect to nutrition and subsistence agriculture. It was observed during the survey that barter trade is prevalent in Sesheke and Namwala. Further research is needed to understand the informal barter networks that operate in these communities and the value placed on various foods within this system. This could help paint a much clearer picture of how and when foods can be accessed, which would in turn inform any potential nutrition interventions. The preservation of fruit and vegetables by sun-drying is common practice in the communities surveyed. The ability to preserve nutrient rich foods is of critical importance to food insecure communities, but they remain vulnerable to changing weather patterns which can undermine efforts to dry foods. In tandem with promoting nutrition and improved farming methods, resources ought to be directed at helping communities to develop efficient and effective methods of preserving food. This is also important to ensure that the micronutrient content of the preserved foods is not compromised in the process. It is recommended that a desk review be undertaken to assess research or investment being undertaken in this area by other organisations. Wild fruits play an important role in the diet of local communities, as evidenced by the information provided in the focus group discussions, and the list of wild fruits named in Annex 10. These foods likely contribute micronutrients such as vitamin A and vitamin C, but uncertainty around consumption frequency and nutrient composition meant that their impact could not be properly captured in the CoD analysis. In order to fully understand the contribution of wild foods to the local diet it is recommended that nutritional analysis be carried out for those wild foods most commonly available and frequently consumed. It is concerning that children do not benefit from the important nutrition provided by certain nutrient-rich foods (i.e. Bambara nuts, eggs, milk curds) due to myths that persist in some rural communities. Breast-feeding mothers are also missing out on important nutrition by avoiding okra, pumpkin and pumpkin leaves (some of the most commonly available foods in rural areas) because of myths that their breastmilk will cause their infants to become ill. It is recommended that any future initiatives aimed at nutrition education/sensitization address these taboos. 54
55 With regard to the Cost of the Diet method, the suitability of the tool should be carefully considered before undertaking a survey in a context which has a high level of reliance on home produced foods and barter trade. The CoD software can only compile a diet chosen from foods for which price data is available, so the inability to obtain price data for many foods in the Sesheke and Namwala surveys means that the food habits diet does not include some of the most commonly eaten foods. Therefore the food habits nutritious diet and its cost must be viewed with caution. Similarly, the inability to obtain price data for certain foods means that the nutritious (MNUT) diet is comprised of foods chosen from a smaller number of foods than is actually available. Therefore the cost of a nutritious diet, as estimated by the CoD software, ought to be viewed as the amount a nutritious diet would cost if food could only be obtained at the market. Notwithstanding these challenges, the CoD method highlights the ways in which the underdeveloped market system makes it difficult for rural communities to access a nutritious and adequately diverse diet. A few general points in relation to the Cost of the Diet software application: (1) The programme is cumbersome and involves time-consuming processes which ought to be more straightforward. Examples are given below. o The software compiles annual diet summary and percentage nutrient requirements reports for each diet (EO, MNUT and FHAB) which can be saved as an MS Excel file or a Rich Text File. However, each document requires extensive reformatting in Microsoft Word before it can be included in the CoD report. This is time consuming and eats into time that should be spent on the analysis. It would be helpful if the software could generate reports in a ready-to-use format. o The process of creating theoretical low and high energy households so that the cost of the three diets can be compared for households of different sizes with minimum and maximum energy requirements is laborious (they must be manually created by the assessment practitioner) and causes the software application to become so slow as to be barely usable. Given that HEA/CoD standard families (families of average energy requirements) comprising 4, 5, 6, 7, 8, 9 and 10 members can be selected from a drop-down list in the edit family of individuals page of the Standard Analysis summary section, it is unclear why low and high energy families cannot be selected in the same way. (2) The CoD food database, which is embedded in the software application, contains many duplicate food profiles. For example, a search for egg will return a range of profiles input during previous CoD studies, but the stated nutrient values may vary between profiles, and it is difficult to know which is the most accurate. The nutritious diet is comprised of locally available foods, but the specific foods included are selected on the basis of their nutrient composition. In order to have confidence that the diet compiled meets the nutritional needs of the household there must be confidence that the nutrient values assigned to the selected foods is correct. 55
56 6. Annexes Annex 1: A detailed description of the Cost of the Diet tool The Cost of the Diet method and software The Cost of the Diet is a method developed by Save the Children UK to calculate the minimum amount of money a typical household would need to purchase their recommended intakes of energy, protein, fat and micronutrients, using locally available foods. The cost of food grown and consumed at home is included in the calculation by applying market prices. Menu driven software developed that applies linear optimisation routines in Microsoft Excel 2010 is used to select locally available foods to meet these nutrient requirements at the lowest possible cost. The Cost of the Diet software selects a mixture of foods that will enable a family to meet their energy and nutrient requirements as recommended by the WHO and the FAO (2004) at the lowest possible cost. As mentioned, this is defined as a nutritious diet. As the software can select amounts of foods that are not realistic in terms of the frequency with which foods are eaten, for example by specifying that a particular food is eaten three times a day every day, the frequency with which each food is consumed can be adjusted to reflect typical dietary patterns. Energy only diet When estimating an energy only diet, the software calculates a lowest cost diet that meets only the average energy requirements of the family. The analysis is not used to promote an energy only diet because it is very unlikely to meet all micronutrient requirements, but it is useful to illustrate: The potential for micronutrient deficiencies in a diet that provides energy The additional cost of meeting all nutrient requirements, including micronutrients, in addition to energy Micronutrient RNI diet Nutritious/micronutrient (MNUT) diet When estimating a micronutrient RNI diet, the software calculates the lowest cost combination of foods which meets the average energy requirements and the recommended micronutrient intake of the typical family. This diet does not reflect people s typical dietary patterns but it is useful to illustrate: The differences in diet composition and its cost when compared with a diet that takes into account typical dietary patterns. The extra cost of micronutrients when compared with the energy only diet The relatively small number of foods that can provide a nutritious diet but often in unrealistic quantities 56
57 Food habits diet When creating a food habits diet, the software calculates the lowest cost combination of foods which meet the average energy requirements and the recommended micronutrient requirements, whilst adhering to the minimum and maximum constraints which set the number of times a week specific food items can be included in the diet. This diet therefore does reflect people s typical dietary patterns and is useful to illustrate the extra cost of meeting average energy and recommended nutrient intakes when typical dietary habits such as the main staple, foods commonly consumed and food taboos are taken into account. Table 2 on page 16 of the report summarises the characteristics of each diet. The Cost of the Diet software can also be used: To estimate the minimum cost of a diet for specified households of multiple individuals; To take into account seasonal variations in food prices when costing the diet; To identify seasonal shortfalls in nutrient intake; To develop models of the impact of potential interventions that might enable households to meet their nutrient requirements. A Cost of the Diet assessment is most useful when chronic malnutrition and micronutrient deficiencies have been identified as a nutritional problem and the availability or affordability of nutritious foods is likely to be among the underlying causes. The limitations of the Cost of the Diet software and method It is useful to understand the limitations of the cost of the diet method before applying any analysis. The software can identify a diet that provides the recommended amounts of energy and micronutrients from a relatively small number of foods, but they would need to be eaten every day at every meal, which is unrealistic. Because the actual requirements for micronutrients of any given individual cannot be known, the RNIs are set at two standard deviations above the average, to minimise the risk of deficiency. This means that when the mixture of foods selected by the Cost of the Diet software meets the RNIs of a family by 100 percent, the nutritional needs of 97 percent of all individuals will be exceeded. The result is that greater quantities of food are selected and at a higher cost than is necessary to meet the actual nutritional requirements of most individuals. The needs for a number of nutrients are not taken into account by the software including iodine, vitamin D, essential amino acids and essential fatty acids. Iodine is not included because the amount in foods depends on the soil on which plants are grown or animals are reared, so no data are provided in food tables. Vitamin D is not included because requirements can be met by making vitamin D in skin exposed to 57
58 ultra-violet light. And most food tables do not provide data on essential amino acids or fatty acids. The cost of the diet method calculates amounts of food for a family based on the sum of recommended nutrient intakes, but food may not be distributed within a household based on nutrient needs. The method does not take into account the additional energy, protein and nutrients needed by someone who is sick or convalescing as there are insufficient data for the calculations. 58

59 Annex 2: Maps of Sesheke District and Namwala District 59
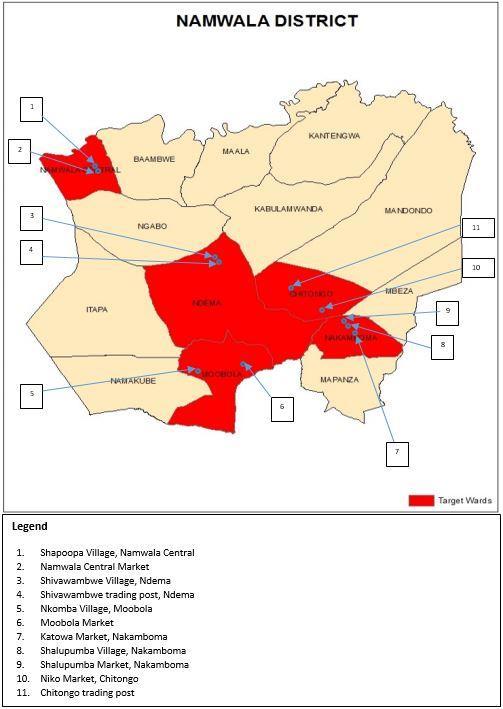
60 60
Cost of the Diet: a Method and New Software
 Cost of the Diet: a Method and New Software Outline of the presentation To understand what the Cost of the Diet method is, what it does, and why it was developed To learn what information is needed to
WFP Ethiopia Drought Emergency Household Food Security Bulletin #1
 WFP Ethiopia Drought Emergency Household Food Security Bulletin # BULLETIN # This bulletin presents the results of the first round of data collection to monitor the 206 food sector response to the ongoing
WFP Ethiopia Drought Emergency Household Food Security Monitoring Bulletin #3
 WFP Ethiopia Drought Emergency Household Food Security Monitoring Bulletin #3 WFP May-June 2016 Community and Household Surveillance (CHS) 27 July 2016 BULLETIN #3 This bulletin presents the results of
WFP Ethiopia Drought Emergency Household Food Security Monitoring Bulletin #2
 WFP Ethiopia Drought Emergency Household Food Security Monitoring Bulletin #2 BULLETIN #2 This bulletin presents the results of the second round of data collection to monitor the 216 Food Sector response
Internally displaced people at Camp Bentiu in South Sudan collect aid, including sorghum, salt, vegetable oil, and baby food. Many South Sudanese
 0 Internally displaced people at Camp Bentiu in South Sudan collect aid, including sorghum, salt, vegetable oil, and baby food. Many South Sudanese have left their villages seeking not only refuge from
Evaluation of the Kajiado Nutrition Programme in Kenya. May By Lee Crawfurd and Serufuse Sekidde
 Evaluation of the Kajiado Nutrition Programme in Kenya May 2012 By Lee Crawfurd and Serufuse Sekidde 1 2 Executive Summary This end-term evaluation assesses the performance of Concern Worldwide s Emergency
Case study Cost of the cheapest adequate diet and households ability to afford it Lindi Rural District / Tanzania. Introduction
 Case study Cost of the cheapest adequate diet and households ability to afford it Lindi Rural District / Tanzania Introduction This paper presents a case study from Tanzania comparing the cost of the cheapest
FOOD AID FLOWS. A: Analysis of the adequacy of the planned theoretical ration 2
 FOOD AID FLOWS An analysis of food security in a food aid dependent population needs to take into account the overall performance of the food distribution system 1, in addition to the household-level questions
WFP and the Nutrition Decade
 WFP and the Nutrition Decade WFP s strategic plan focuses on ending hunger and contributing to a revitalized global partnership, key components to implement and achieve the Sustainable Development Goals
What we can learn from linear optimization: WFP experiences with the Cost of the Diet
 What we can learn from linear optimization: WFP experiences with the Cost of the Diet April 2011 The World Food Programm Nutrition & HIV / AIDS Policy Romeo Frega What do I want to talk about today? What
Food Consumption Pattern and Dietary Diversity
 12Round I survey of CFPR phase II Food Consumption Pattern and Dietary Diversity Chowdhury SB Jalal, Nuzhat Choudhury and Munshi Suliman INTRODUCTION This chapter provides information about the quantities
By the end of the activities described in Section 5, consensus has
 6 Selecting Indicators 81 By the end of the activities described in Section 5, consensus has been reached on the goals and objectives of the project, the information which needs to be collected and analyzed
Fill the Nutrient Gap Pakistan: Rationale, key findings and recommendations. Fill the Nutrient Gap National Consultation Islamabad, 11 April 2017
 Fill the Nutrient Gap Pakistan: Rationale, key findings and recommendations Fill the Nutrient Gap National Consultation Islamabad, 11 April 2017 Meeting nutrient requirements is a prerequisite for preventing
WFP s Nutrition Interventions and Policies in Africa including Ghana. Lauren Landis: Director of the Nutrition Division December 2015
 WFP s Nutrition Interventions and Policies in Africa including Ghana Lauren Landis: Director of the Nutrition Division December 2015 Agenda 1. The Nutrition Solutions 2. WFP Nutrition Programmes in Africa
Guidelines for measuring DIETARY DIVERSITY
 AGN seminar 26.10.2011 Guidelines for measuring DIETARY DIVERSITY A simple tool for developing and evaluating food and nutrition security interventions Maylis Razes & Marie-Claude Dop Nutrition and Consumer
MONITORING AND EVALUATING THE NUTRITION OUTCOMES OF INTERVENTIONS KEY CONCEPTS AND INDICATORS
 MONITORING AND EVALUATING THE NUTRITION OUTCOMES OF INTERVENTIONS KEY CONCEPTS AND INDICATORS WHAT TO MEASURE? Diet quality, food consumption Malnutrition Food Security: access to diverse, nutritious diets
CONTRIBUTION OF FISH TO NUTRITION: A CASE OF NTCHISI - MALAWI. Beatrice Mtimuni, PhD Bunda College of Agriculture
 CONTRIBUTION OF FISH TO NUTRITION: A CASE OF NTCHISI - MALAWI Beatrice Mtimuni, PhD Bunda College of Agriculture Nutrition Situation in Malawi Levels of chronic and acute malnutrition have remained high
Myanmar Food and Nutrition Security Profiles
 Key Indicators Myanmar Food and Nutrition Security Profiles Myanmar has experienced growth in Dietary Energy Supply (DES). Dietary quality remains poor, low on protein and vitamins and with high carbohydrates.
Myanmar - Food and Nutrition Security Profiles
 Key Indicators Myanmar - Food and Nutrition Security Profiles Myanmar has experienced growth in Dietary Energy Supply (DES). Dietary quality remains poor, low on protein and vitamins and with high carbohydrates.
MONITORING AND EVALUATING THE NUTRITION OUTCOMES OF INTERVENTIONS KEY CONCEPTS AND INDICATORS
 MONITORING AND EVALUATING THE NUTRITION OUTCOMES OF INTERVENTIONS KEY CONCEPTS AND INDICATORS Monitoring vs. Evaluation Monitoring Involves routine tracking of program performance (e.g. inputs and outputs)
FNS. State Agencies. Program Operators Participants
 Ending Hunger Improving Nutrition Combating Obesity FNS State Agencies Program Operators Participants About 1 in 4 Americans participates in at least 1 of the U.S. Department of Agriculture s (USDA) domestic
General Food Distribution (GFD) or Food Assistance
 or Food Assistance") General Food Distribution (GFD) or Food Assistance module 11 5-Sep-16 1 Learning objectives Be able to identify reasons to provide food assistance. Be familiar with basic elements of ration planning. Understand
General Food Distribution (GFD) or Food Assistance module 11 5-Sep-16 1 Learning objectives Be able to identify reasons to provide food assistance. Be familiar with basic elements of ration planning. Understand
METHODOLOGICAL GUIDELINES
 MONTENEGRO STATISTICAL OFFICE METHODOLOGICAL GUIDELINES Minimal consumer basket - Revision - 79 METHODOLOGICAL GUIDELINES 79 Podgorica, February 2018 Contents THE LEGAL BASIS... 3 Conclusion of Statistical
Report on the Evaluation of Child Supplementary Feeding Programme Implemented from October 1999 to June 2000 in three districts in Zimbabwe
 Report on the Evaluation of Child Supplementary Feeding Programme Implemented from October 1999 to June 2000 in three districts in Zimbabwe Prepared by Stanley Chitekwe APO, Nutrition UNICEF, Harare Zimbabwe
Chapter 1: Food, Nutrition, and Health Test Bank
 Chapter 1: Food, Nutrition, and Health Test Bank MULTIPLE CHOICE 1. Promoting a health care service that improves diabetes management for the elderly in a community would assist in which of the following?
A new approach to measuring Indian diet diversity: Healthy Eating Index
 A new approach to measuring Indian diet diversity: Healthy Eating Index Mousumi Das Institute of Financial Management & Research (IFMR), Chennai, India World Bank, South Asia Region, India Suresh Babu
THE CONSUMER COMES FIRST MYTH OR REALITY?
 THE CONSUMER COMES FIRST MYTH OR REALITY? PROFILING SOUTH AFRICA Population: 48+ million Almost 50/50 males to females 35% children
The State of Food and Agriculture 2013: Food systems for better nutrition Questions and Answers
 The State of Food and Agriculture 2013: Food systems for better nutrition Questions and Answers What is malnutrition? Malnutrition is an abnormal physiological condition caused by inadequate, unbalanced
Empowered lives. Resilient Nations. MILLENNIUM DEVELOPMENT GOALS (MDGs)
") Empowered lives. Resilient Nations. MILLENNIUM DEVELOPMENT GOALS (MDGs) PROVINCIAL PROFILE / SOUTHERN PROVINCE / 2013 Copyright 2013 By the United Nations Development Programme Alick Nkhata Road P. O Box
Empowered lives. Resilient Nations. MILLENNIUM DEVELOPMENT GOALS (MDGs) PROVINCIAL PROFILE / SOUTHERN PROVINCE / 2013 Copyright 2013 By the United Nations Development Programme Alick Nkhata Road P. O Box
Bioversity International, Save the Children UK and National Museums of Kenya
 Role of wild, neglected and underutilized foods in reducing the cost of a nutritionally adequate diet in the eastern region of Baringo District, Kenya 27 February 2013 Summary Bioversity International,
The Evolving Global Nutrition Situation: Why Forests and Trees Matter
 The Evolving Global Nutrition Situation: Why Forests and Trees Matter Bronwen Powell Pennsylvania State University, USA Areas of Changing Understanding: 1. Forests and Conservation vs. Food Production
Fill the Nutrient Gap Analysis: An introduction. Giulia Baldi, MPH WFP, Nutrition Division
 Fill the Nutrient Gap Analysis: An introduction Giulia Baldi, MPH WFP, Nutrition Division 2 Meeting nutrient requirements is a prerequisite for preventing malnutrition MALNUTRITION Inadequate dietary intake
Global database on the Implementation of Nutrition Action (GINA)
") Global database on the Implementation of Nutrition Action (GINA) National Food and Nutrition Strategic Plan for Zambia 2011-2016 Published by: National Food and Nutrition Commission of Zambia Country(ies):
Global database on the Implementation of Nutrition Action (GINA) National Food and Nutrition Strategic Plan for Zambia 2011-2016 Published by: National Food and Nutrition Commission of Zambia Country(ies):
A Simple Method of Measuring Dietary Diversity at Population Level
 A Simple Method of Measuring Dietary Diversity at Population Level NP Steyn, D Labadarios, JH Nel Social science that makes a difference Date: Introduction Determining dietary diversity in RSA adults has
A COST OF THE DIET ANALYSIS IN THE DRY ZONE, MYANMAR: PAKOKKU, MAHLAING & YESAGYO TOWNSHIPS
 2017 A COST OF THE DIET ANALYSIS IN THE DRY ZONE, MYANMAR: PAKOKKU, MAHLAING & YESAGYO TOWNSHIPS Acknowledgements The Cost of the Diet field assessment was led by Claudia Damu (International Consultant)
Trends in food availability in MALTA the DAFNE V project
 Trends in food availability in MALTA the DAFNE V project Lucienne Pace 1, Etienne Caruana 2 and Nicola Camilleri 2 1 Health Promotion Department, Ministry of Health, Malta 2 National Statistical Office,
Draft of the Rome Declaration on Nutrition
 Draft of the Rome Declaration on Nutrition 1. We, Ministers and Plenipotentiaries of the Members of the World Health Organization and the Food and Agriculture Organization of the United Nations, assembled
Water Use for Food Production, Nutrition and Health WRC Dialogue - 17 October Friede Wenhold
 Water Use for Food Production, Nutrition and Health WRC Dialogue - 17 October 2014 Friede Wenhold Aim of presentation: To o highlight food and nutrition findings, o present a ranking of water use / productivity
Canada s Food Supply: A Preliminary Examination of Changes,
 Canada s Food Supply: A Preliminary Examination of Changes, 1992-2002 Canada's Food Guide to Healthy Eating, released in 1992, is a key nutrition education tool for Canadians aged four years and over.
Purchasing Patterns for Nutritional-Enhanced Foods: The case of Calcium-Enriched Orange Juice
 Purchasing Patterns for Nutritional-Enhanced Foods: The case of Calcium-Enriched Orange Juice By Alla Golub, James J Binkley, and Mark Denbaly Dept of Agricultural Economics, Purdue University; (Golub
A Comparison of Food Consumption Pattern in Rural and Urban Areas of Bangladesh between 2005 and 2010
 A Comparison of Food Consumption Pattern in Rural and Urban Areas of Bangladesh between 2005 and 2010 Sadika S a, b*, Mohd Isa B b, Wan Abdul Manan WM b a Department of Rural Sociology, Bangladesh Agricultural
ARMENIA Cost of the Diet (CotD) WFP/Abeer Etefa
 WFP/Abeer Etefa") ARMENIA Cost of the Diet (CotD) WFP/Abeer Etefa Background Recent studies have found that Armenia has a high prevalence of malnutrition and micronutrient deficiencies. Among children under 5, 21 percent
ARMENIA Cost of the Diet (CotD) WFP/Abeer Etefa Background Recent studies have found that Armenia has a high prevalence of malnutrition and micronutrient deficiencies. Among children under 5, 21 percent
Factors Related to Zimbabwe Women s Educational Needs in Agriculture. Anna E. Mudukuti, Ph.D. Zayed University
 Factors Related to Zimbabwe Women s Educational Needs in Agriculture Anna E. Mudukuti, Ph.D. Zayed University Larry Miller, Professor The Ohio State University Abstract The article describes selected participants,
In the aftermath of disasters, affected communities
 Have you read section A? Gender and food security in emergencies In the aftermath of disasters, affected communities will need help to restart agricultural activities as soon as possible, in order to meet
School Canteen/Food Service Policy What is a Healthy School Food Service? A healthy school food service:
 School Canteen/Food Service Policy What is a Healthy School Food Service? A healthy school food service: Makes it easy for students to choose healthy snacks and meals. Offers a variety of nutritious foods.
Faculty of Health Sciences Food Consumption Patterns among Syrian Refugees
 Faculty of Health Sciences Food Consumption Patterns among Syrian Refugees Vulnerability Assessment and Mapping Unit. WFP Lebanon. Presented by Mazen Makarem Background Increasing influx of Syrian refugees
June 9, U.S. Food and Drug Administration Division of Dockets Management, HFA Fishers Lane, Room 1061 Rockville, MD 20852
 June 9, 2014 U.S. Food and Drug Administration Division of Dockets Management, HFA-305 5630 Fishers Lane, Room 1061 Rockville, MD 20852 Re: Implementation of the Food and Drug Administration Food Safety
Minimum Cost of Nutritious Diet Sri Lanka
 Minimum Cost of Nutritious Diet Sri Lanka October 2013 September 2014 HARTI MESSAGE FROM THE REPRESENTATIVE OF WORLD FOOD PROGRAMME The World Food Programme is determined to fight hunger and improve the
Shop smart. A new way of spending your money on food to balance your diet and your food budget.
 Shop smart. A new way of spending your money on food to balance your diet and your food budget. What is FOODcents? FOODcents uses the 10-Plan to help you balance your diet and a KILOcents Counter to help
Doing double duty for prevention and treatment of acute malnutrition
 Doing double duty for prevention and treatment of acute malnutrition Dr Nancy J Aburto December 2018 WFP Strategic Plan WFP STRATEGIC GOALS 1.SUPPORT COUNTRIES TO ACHIEVE ZERO HUNGER (SDG 2) 2. PARTNER
Monitoring of Food Affordability and Diet Quality. Anna Herforth, Ph.D. UC Davis World Food Center June 3, 2017
 Monitoring of Food Affordability and Diet Quality Anna Herforth, Ph.D. UC Davis World Food Center June 3, 2017 Problems Dietary risks are the number one risk factor within the global burden of disease,
Self-Help Groups as a Platform to Improve Nutritional Status
 Self-Help Groups as a Platform to Improve Nutritional Status INSIGHTS FROM VILLAGE AUREPALLE RACHEL GANSON Personal Background Chicago, Illinois, USA 12 th Standard 212 World Food Prize Borlaug-Ruan International
From malnutrition to nutrition security
 From malnutrition to nutrition security Martin W. Bloem, MD, PhD Senior Nutrition Advisor/WFP Global Coordinator UNAIDS World Food Program Nurturing development: Improving human nutrition with animal-source
Solomon Islands Food and Nutrition Security Profiles
 Key Indicators Solomon Islands Food and Nutrition Security Profiles Solomon Islands has experienced stagnation in percapita GDP and undernourishment in recent years. Dietary Energy Supply (DES) has continued
Test Bank For Williams' Essentials of Nutrition and Diet Therapy 10th edittion by Schlenker and Roth
 Test Bank For Williams' Essentials of Nutrition and Diet Therapy 10th edittion by Schlenker and Roth Chapter 01: Nutrition and Health Test Bank MULTIPLE CHOICE 1. The major focus of nutritional recommendations
Chapter 14. Hunger at Home and Abroad. Karen Schuster Florida Community College of Jacksonville. PowerPoint Lecture Slide Presentation created by
 Chapter 14 Hunger at Home and Abroad PowerPoint Lecture Slide Presentation created by Karen Schuster Florida Community College of Jacksonville Copyright 2008 Pearson Education, Inc., publishing as Pearson
The Strategic Marketing Institute Working Paper
 The Strategic Marketing Institute Working Paper The Market for Organic and Fortified Eggs William A. Knudson 2-0104 January 2004 Introduction Eggs are an important part of the American diet. According
Food Systems for Better Nutrition: opportunities in Latin America and the Caribbean
 Food Systems for Better Nutrition: opportunities in Latin America and the Caribbean A perspective and experiences from FAO Charlotte Dufour Nutrition Division FAO Economic and Social Department 2013 Food
Empowered lives. Resilient Nations. MILLENNIUM DEVELOPMENT GOALS (MDGs)
") Empowered lives. Resilient Nations. MILLENNIUM DEVELOPMENT GOALS (MDGs) PROVINCIAL PROFILE / WESTERN PROVINCE / 2013 Copyright 2013 By the United Nations Development Programme Alick Nkhata Road P. O Box
Empowered lives. Resilient Nations. MILLENNIUM DEVELOPMENT GOALS (MDGs) PROVINCIAL PROFILE / WESTERN PROVINCE / 2013 Copyright 2013 By the United Nations Development Programme Alick Nkhata Road P. O Box
Agriculture and Nutrition Global Learning and Evidence Exchange (AgN-GLEE)
") This presentation is part of the Agriculture and Nutrition Global Learning and Evidence Exchange (AgN-GLEE) held in Bangkok, Thailand from March 19-21, 2013. For additional presentations and related event
This presentation is part of the Agriculture and Nutrition Global Learning and Evidence Exchange (AgN-GLEE) held in Bangkok, Thailand from March 19-21, 2013. For additional presentations and related event
2018 Global Nutrition
 Professor Corinna Hawkes Director, Centre for Food Policy, City, University of London Co-Chair, Independent Expert Group of the Global Nutrition Report 2018 Global Nutrition Report November 2018 About
Nutritional Intake and Consumption Pattern in the States of Himachal Pradesh and Meghalaya
 ISSN. 0972-8406 pp.15-28 Nutritional Intake and Consumption Pattern in the States of Himachal Pradesh and Meghalaya ANIKA M. W. K. SHADAP*& VERONICA PALA** Abstract According to the recent reports of the
THIS STUDY HAS BEEN CONDUCTED FOR THE NUTRITION SURVEILLANCE PROJECT OF FSAU BY: A.MONTANI A. OMWEGA FUNDED BY USAID-OFDA
 FOOD UTILISATION IN SOMALIA FOOD SECURITY ASSESSMENT UNIT THE FOOD AND AGRICULTURE ORGANIZATION OF THE UNITED NATIONS SEPTEMBER 2002 THIS STUDY HAS BEEN CONDUCTED FOR THE NUTRITION SURVEILLANCE PROJECT
Policies Affecting Our Food Environment
 Policies Affecting Our Food Environment Amy L. Yaroch, Ph.D. Gretchen Swanson Center for Nutrition, Omaha, NE About Us Independent research institution providing scientific expertise, partnership and resources
Healthy People, Healthy Communities
 Healthy People, Healthy Communities Public Health Policy Statements on Public Health Issues The provincial government plays an important role in shaping policies that impact both individual and community
Pupil s Book Grade 4
 Zambian Basic Education Course Government of the Republic of Zambia Ministry of Education NUTRITION EDUCATION Supplementary Material Pupil s Book Grade 4 Zambian Basic Education Course NUTRITION EDUCATION
Findings for IANDA / Cost of the Diet in Ghana
 Findings for IANDA / Cost of the Diet in Ghana WFP, 7 The analysis conducted in this document was possible thanks to data collected for/by the IANDA project in collaboration with the Ghana Ministry of
February 27 th, To whom it may concern:
 February 27 th, 2015 To whom it may concern: We, the nutrition project staff at the University of California, Davis are writing to apply for funding for the Whoville community nutrition education program
HIGHLIGHTING NUTRITIONAL SECURITY: A KEY COMPONENT OF FOOD SECURITY. Delia B. Rodriguez-Amaya
 HIGHLIGHTING NUTRITIONAL SECURITY: A KEY COMPONENT OF FOOD SECURITY Delia B. Rodriguez-Amaya Food Security sufficient, safe and nutritious food for all The State of Food Insecurity in the World Food and
Improving the Consumption of Nutritious Safe Food: Why it Matters and How to Achieve It
 Improving the Consumption of Nutritious Safe Food: Why it Matters and How to Achieve It Lawrence Haddad Executive Director Global Alliance for Improved Nutrition (GAIN) 1 in 3 people worldwide are malnourished
Unnayan Onneshan Policy Brief December, Achieving the MDGs Targets in Nutrition: Does Inequality Matter? K. M.
 Unnayan Onneshan Policy Brief December, 211 Achieving the MDGs Targets in Nutrition: Does Inequality Matter? K. M. Mustafizur Rahman Introduction The nutritional status of a population is a key indicator
THE ROME ACCORD ICN2 zero draft political outcome document for 19 November 2014
 THE ROME ACCORD ICN2 zero draft political outcome document for 19 November 2014 We,..., assembled at the Second International Conference on Nutrition, on 19-21 November 2014, to address the multiple threats
Fill the Nutrient Gap El Salvador Summary Report
 Fighting Hunger Worldwide Fill the Nutrient Gap El Salvador Summary Report September 2017 Fill the Nutrient Gap El Salvador Summary Report Fill the Nutrient Gap (FNG), is a situation analysis and decision-making
Implications of a Healthier U.S. Food Stamp Program
 Implications of a Healthier U.S. Food Stamp Program Julian M. Alston Department of Agricultural and Resource Economics University of California, Davis Presented at the International Health Economics Association
Nutrition and Food Security Response Analysis in emergency contexts
 Nutrition and Food Security Response Analysis in emergency contexts Claire Chastre andd Simon Levine 1 What is the problem? Undernutrition remains persistently high, with devastating consequences for individuals
IANDA New Indicators of the Cost of Nutritious Diets
 IANDA New Indicators of the Cost of Nutritious Diets Collaborators: Joyce Kinabo & Fulgence Mishili Sokoine University of Agriculture (Tanzania) Anna Herforth, Columbia University (USA) William A. Masters,
Power Porridge: Empowering Families to Conquer Malnutrition with Local Ingredients
 Power Porridge: Empowering Families to Conquer Malnutrition with Local Ingredients TOPS/FSN Network Regional Knowledge Sharing Meeting - Uganda September 20, 2016 Power Porridge Presentation The Problem
Russian food consumption patterns during economic transition and its effects on the prevalence of chronic diseases
 Russian food consumption patterns during economic transition and its effects on the prevalence of chronic diseases C. Burggraf; T. Glauben; R. Teuber IAMO Forum 2014 25/Jun/2014 Overview 1 Motivation 2
ECE 105 Chapter 19 Planning and Serving Nutritious and Economical Meals Meal Planning A Good Menu Meets Nutritional Needs
 Planning and Serving Nutritious and Economical Meals One of the most basic human needs is nourishing the body. Eating is an activity that most people, including infants and young children, enjoy. Eating
ERNÆRING TIL JORDENS FATTIGSTE
 ERNÆRING TIL JORDENS FATTIGSTE GAIN NORDIC PARTNERSHIP Charlotte Sørensen, Affordable food manager ARLA FOODS INGREDIENTS Process whey (by-stream from cheese production) into nutritious food ingredients
Cost of Diet assessment
 Cost of Diet assessment Daura LGA, Katsina State, Nigeria November 2010 Esther Busquet Nutrition Adviser Save the Children UK Acknowledgments This Cost of Diet assessment would not have been possible without
POLICY BRIEF. Situation Analysis of the Nutrition Sector in Ethiopia EXECUTIVE SUMMARY INTRODUCTION
 POLICY BRIEF EXECUTIVE SUMMARY UNICEF Ethiopia/2014/Sewunet Situation Analysis of the Nutrition Sector in Ethiopia 2000-2015 UNICEF has carried out a situational analysis of Ethiopia s nutrition sector
Executive Board meeting
 Executive Board meeting Nutrition update June, 2018 The state of global malnutrition... remains universal and enormous challenge despite progress 51 million children are wasted 151 million children are
Nutrition-sensitive Social Protection Programs: How Can They Help Accelerate Progress in Improving Maternal and Child Nutrition?
 Nutrition-sensitive Social Protection Programs: How Can They Help Accelerate Progress in Improving Maternal and Child Nutrition? Harold Alderman Dec. 13, 2013 Why Focus on Nutrition Sensitive Programs?
Increasing Access to Healthy Food
 sound research. Bold Solutions.. Policy BrieF. June 29, 2009 Increasing Access to Healthy Food By Stacey Schultz Access to affordable, healthy food including fresh fruits and vegetables is essential for
How to Build Urban Food Systems for Better Diets, Nutrition, and Health in Low and Middle-Income Countries
 How to Build Urban Food Systems for Better Diets, Nutrition, and Health in Low and Middle-Income Countries Jef Leroy, IFPRI November 30, 2018, Bangkok Side event agenda JEF LEROY Senior Research Fellow
Global database on the Implementation of Nutrition Action (GINA)
") Global database on the Implementation of Nutrition Action (GINA) National Nutrition Policy of Sri Lanka Published by: Ministry of Healthcare and Nutrition Is the policy document adopted?: Yes Adopted by:
Global database on the Implementation of Nutrition Action (GINA) National Nutrition Policy of Sri Lanka Published by: Ministry of Healthcare and Nutrition Is the policy document adopted?: Yes Adopted by:
Considerations in calculating flour consumption in a country. Janneke H. Jorgensen, World Bank
 Considerations in calculating flour consumption in a country Janneke H. Jorgensen, World Bank 1 Overview Why calculate flour consumption Factors to be considered Potential sources and quality of data National
OUTCOMES. what difference does trickle up make?
 OUTCOMES what difference does trickle up make? we re TRICKLE UP AND We re on a mission TO CREATE A WORLD FREE OF ULTRAPOVERTY who are the ultrapoor? Women and families living in ultrapoverty those living
Consumers Response to the 2006 Foodborne Illness Outbreak Linked to Spinach
 Consumers Response to the 2006 Foodborne Illness Outbreak Linked to Spinach 34 Carlos Arnade, carnade@ers.usda.gov Linda Calvin, lcalvin@ers.usda.gov Fred Kuchler, fkuchler@ers.usda.gov Consumers responded
Methodology of Poverty Measurement Since 2009
 MEASURING POVERTY IN ARMENIA: METHODOLOGICAL CLARIFICATIONS 169 Methodology of Poverty Measurement Since 2009 A consumption aggregate is used to approximate well-being in Armenia. It is assumed that consumption
Nutrition and Healthy Eating Policy
 Reviewed: June 2016 Next Review: June 2018 Linked Policies: Behaviour Management Reviewed June 2016 Page 1 of 5 Introduction Children are provided with regular drinks and food in adequate quantities for
INFANT FEEDING, NUTRITIONAL PRACTICES, AND NUTRITIONAL STATUS AMONG YOUNG CHILDREN AND WOMEN
 INFANT FEEDING, NUTRITIONAL PRACTICES, AND NUTRITIONAL STATUS AMONG YOUNG CHILDREN AND WOMEN 11 Bornwell Sikateyo, Agnes Mugala Aongola, and Arlinda Zhuzhuni Malnutrition plays an important role in the
Renewable World Global Gender Equality Policy
 Version 1.0 of the policy approved by the Renewable World Board on 20th November 2018. Purpose This policy outlines Renewable World s approach to gender inclusion when designing and delivering our programmes
World Food Programme (WFP)
") UNAIDS 2016 REPORT World Food Programme (WFP) Unified Budget Results and Accountability Framework (UBRAF) 2016-2021 2 Contents Achievements 2 Introduction 2 Innovative testing strategies 2 Access to treatment
UNAIDS 2016 REPORT World Food Programme (WFP) Unified Budget Results and Accountability Framework (UBRAF) 2016-2021 2 Contents Achievements 2 Introduction 2 Innovative testing strategies 2 Access to treatment
AIDS and food insecurity: New variant famine in Malawi?
 AIDS and food insecurity: New variant famine in Malawi? E. Robson 1,2, N. Ansell 3, L. van Blerk 4, L. Chipeta 5, F. Hadju 6 1 Research Fellow, Centre for Social Research, Chancellor College, University
AFGHANISTAN. Nutrition & Mortality SMART survey preliminary report. Nangarhar province, Afghanistan. Date: December 2014
 AFGHANISTAN Nutrition & Mortality SMART survey preliminary report Nangarhar province, Afghanistan Date: December 2014 Authors: Hassan Ali Ahmed, Dr Baidar Bakht Funded by: Action Contre la Faim ACF is
JOINT FAO/WHO FOOD STANDARDS PROGRAMME
 Agenda Item 8 CX/NFSDU 10/32/8 JOINT FAO/WHO FOOD STANDARDS PROGRAMME CODEX COMMITTEE ON NUTRITION AND FOODS FOR SPECIAL DIETARY USES Thirty second Session Crowne Plaza Hotel, Santiago, Chile 1 5 November
Supplementary Infant Feeding in Developing Countries
 Weaning: Why, What, and When?, edited by A. Ballabriga and J. Rey. Nestlf Nutrition, Vevey/Raven Press, New York c 97 Supplementary Infant Feeding in Developing Countries Ashfaq Ahmad Department of Child