Demonstrating Client Improvement to Yourself and Others
|
|
|
- Penelope Baldwin
- 5 years ago
- Views:
Transcription
1 Demonstrating Client Improvement to Yourself and Others Understanding and Using your Outcome Evaluation System (Part 2 of 3) Greg Vinson, Ph.D. Senior Researcher and Evaluation Manager Center for Victims of Torture - NCB February 2009
2 Series Overview 3-Part Sequence 1. Setting Up A System (December 2008) What, When, and How to Collect and Store Data 2. Using and Understanding - Analysis (Today) 3. Audience Directed Topics/Remaining Topics (TBD/April 2009) Currently, a bit more open
3 Different From Other Webinars Webinars are overviews and part of a larger system of resources Online Resource Center Additional Written Resources Additional Tools (e.g., Excel) PTS-Talk List-Serv Updated Resource Center and Client Wiki Establish stronger network for evaluationrelated activities
4 Last Time (December) Identifying Objectives Identifying Outcomes And Measures/Indicators Gathering and Storing Data Tracking Administrations Format for Data Storage Using Excel for Data Entry Available at NCB Resource Center
5 Today s Session 1. Understand analyses related to documenting change for both continuous (e.g., depression symptoms) and categorical (e.g., legal status) client outcomes. 2. Use the provided excel tools to calculate related statistics and create charts and graphs depicting change 3. Sensibly interpret and communicate the results to others
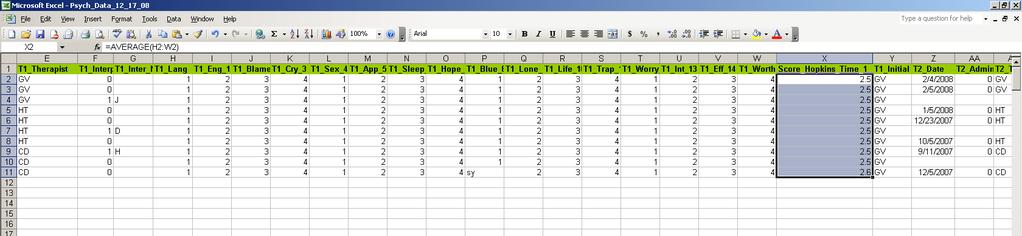
6 Where we left off Dataset With Many Variables Pre and Post-test design Hopkins Items (continuous) Categorical Indicators (e.g., Asylum seeker or not) Scoring the Hopkins Could examine individual items (bad) Or score them (according to measure protocol) =AVERAGE(H2:W2) Highlight column below this cell, hit Cntr+D (fill) Average better than sum, takes better account for missing data.

7 Dataset
8 Two Columns of Continuous Scores Continuous (range of values) Time 1 Score for Hopkins Time 2 Score for Hopkins Fewer than Time 1 Is there a difference between the two times? Do clients get better? Often examined through average change
9


10 Time 1 and Time 2 Data Mean Comparisons Same Mean Difference, But Different Variability Around that Mean Differences in variability makes some mean differences more appreciably different than others
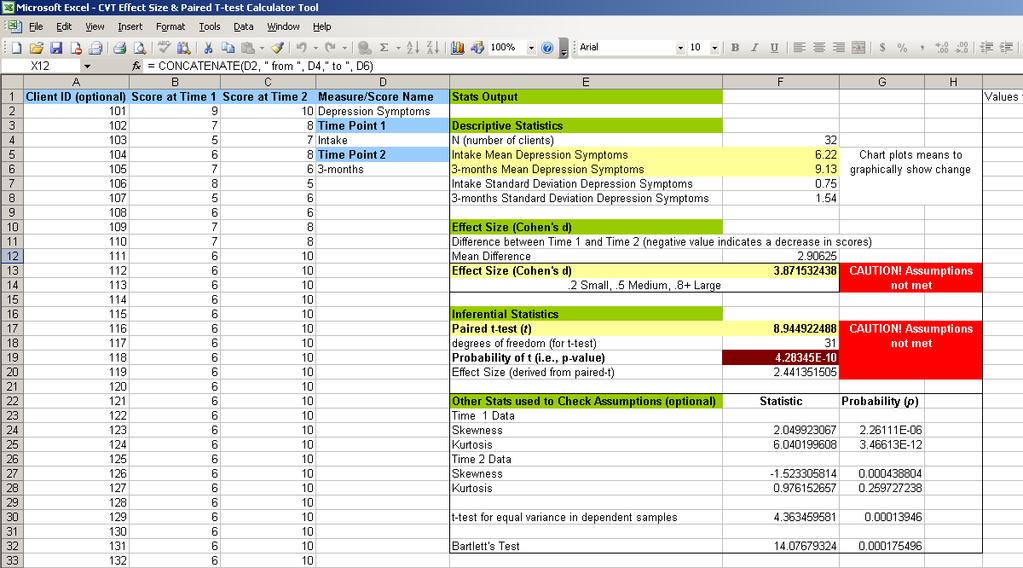
11 Account for the Means and Variability Paired t-test, Effect Size (Cohen s d) Both do the same thing Examine Mean Differences, Accounting for Variability Effect Size (Cohen s d) Magnitude of Difference In Standard Deviation Units t-test Difference is significantly different from 0 (i.e., if there is a difference) If t=0, the two distributions overlap completely If t is larger, get probability for distributions not overlapping The test Resource Effect size:
12 Tool (t-test and effect size) Excel Tool Just need two columns of excel data (T1 and T2) Paste Into Excel Spreadsheet Spreadsheet Calculates paired/dependent t- test and effect size Also makes some charts Pay more attention to the effect size (Cohen s d)
13 T-test/Effect Size Tool
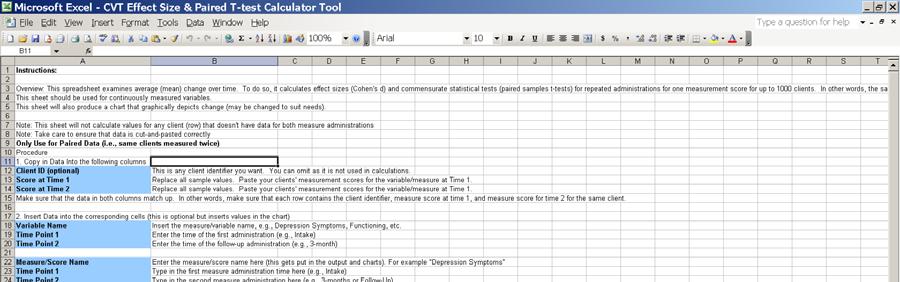
14 Instructions and Sample Chart
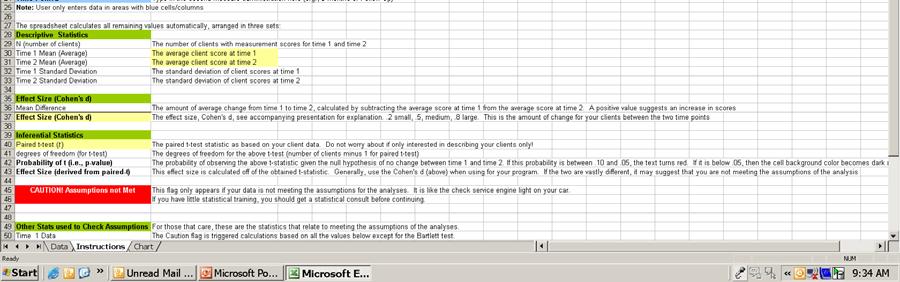
15 Using This Tool Calculates Paired t-tests and Effect Sizes For Repeated Measures Only! Follows from Data Entry Files Has Instructions (second page) Produces A Chart (final page) Checks Assumptions Screens Out Any Missing Cases
16 Interpreting Guidelines Go with effect sizes (Cohen, 1988).2 small.5 medium.8 large Longitudinal will tend to be a bit inflated T-test (paired/dependent) Only if concerned with statistical test Likelihood that you observed change due to chance e.g., p <.05, p<.10, etc. Additional Resource
17 Communicating Traditional t(df) = X.X, p <.05. df = degrees of freedom N (number of clients) 1 d =.XX. APA Style Guide The 36 study participants had a mean age of 27.4 (SD = 12.6) and were significantly older than the university norm of 21.2 years, t(35) = 2.95, p = The 25 participants had an average difference from pre-test to post-test anxiety scores of -4.8 (SD = 5.5), indicating the anxiety treatment resulted in a highly significant decrease in anxiety levels, t(24) = -4.36, p =
18 Reporting, Practically Useful Report, in text, main findings Table the Rest Intake and 3-month Means, Paired Samples T-Test, and Effect Sizes (N 40) Mean at Intake Mean at 3-months t df Sig. (2- tailed) Effect Size Pair 1 Depression T1 - Depression 3-Month Pair 2 Anxiety T1 - Anxiety 3- Month Pair 3 Pair 4 Pair 5 Pair 6 Pair 7 PTSD Total T1 - PTSD Total 3-Month Somatic Total - Total Somatic T QOL Basic - T3 QOL Basic QOL Social - T3 QOL Social QOL Psych - T3 Qol Psych
19 Another Type of Data, Categorical Changes in Categorical Designation For example, asylum seeker to asylee Percentages 80% to 60% Works Pretty Well for Describing Your Sample More familiar metric
20 But, let s suppose Flipping A Coin and Measuring Heads and Tails (100 times) Expect 50% Heads, 50% Tails (50:50) Probably wouldn t get this exactly (e.g., 48:52) How far off (25:75?, 40:60?) before we start thinking something is wrong with the coin? What if 80% of clients becomes 75% of clients?
21 For Us How big of a percentage change where probably not due to chance? For us, percentages at two time points for the same clients Less important than using effect size for continuous data Percentages do a good job depicting your sample
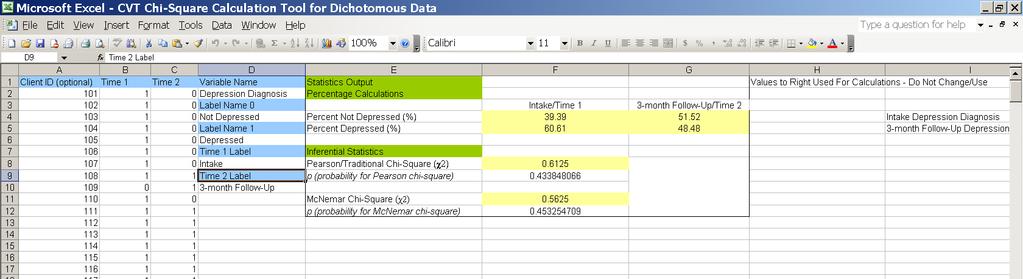
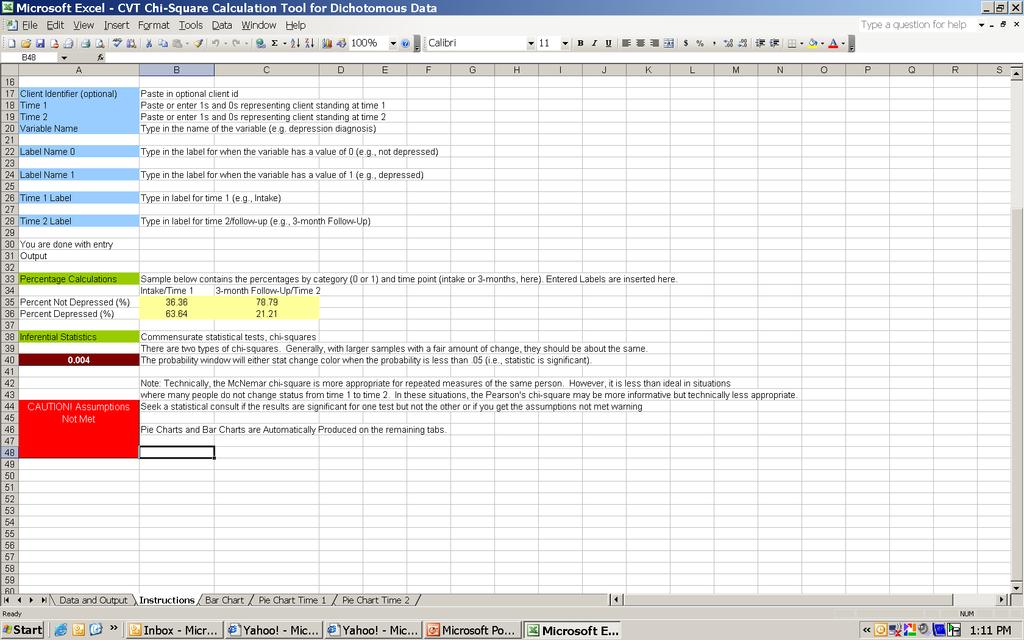
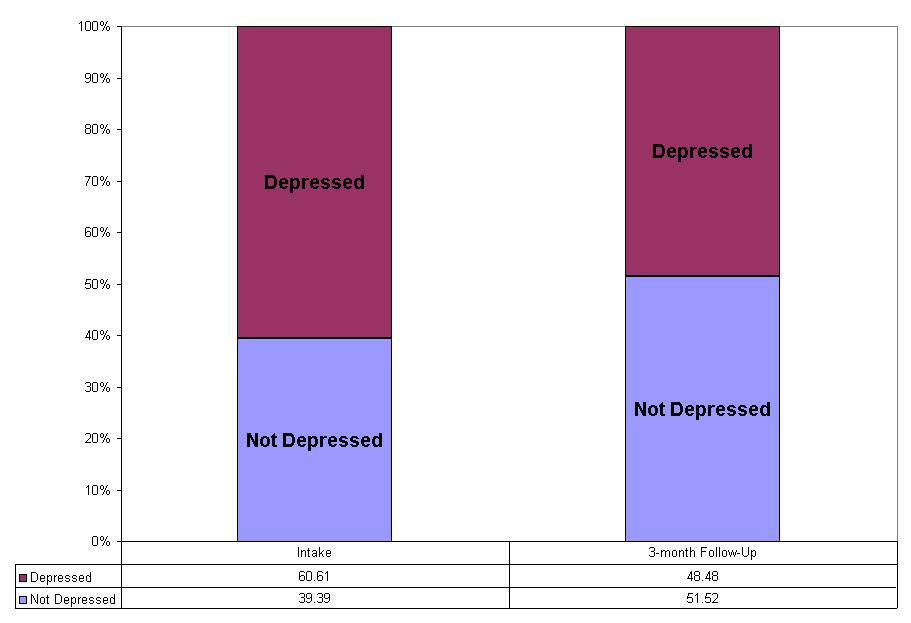
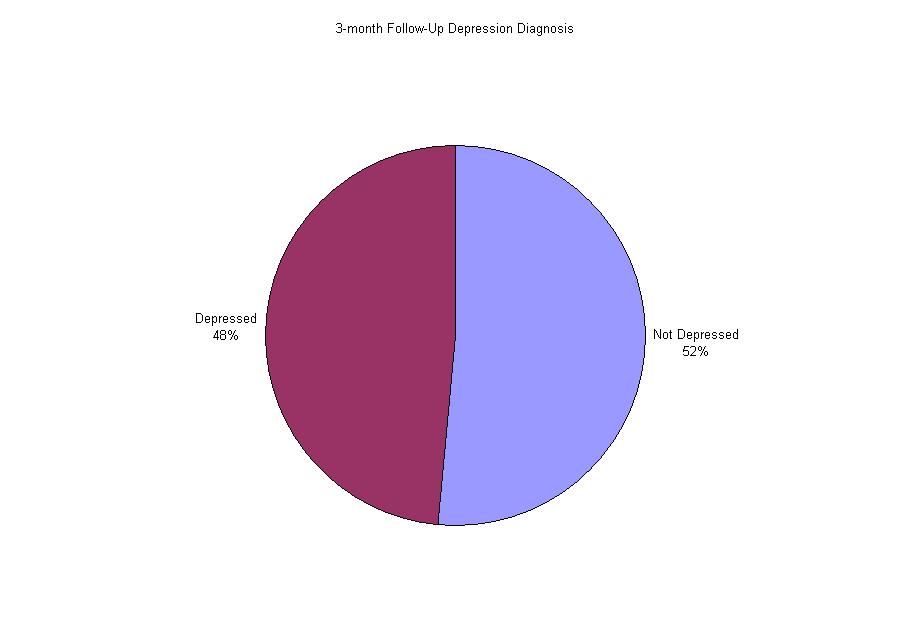
22 Chi-Square (χ 2 ) Where we Left Off Two Columns of Categorical (Yes, No; 0,1) Variables (e.g., Asylum Seeker or Not) Paste into Tool Tool Calculates χ 2 (McNemar) Calculates Percentages Checks Some Assumptions Makes Charts
23
24
25
26 Interpreting and Communication Percentages are Familiar Report Percentages in Text Accompanied by Bar Graphs/Pie Charts For statistical significance, use Chi-Square (McNemar) statistic The sample included 32 clients. Approximately 60% met clinical criteria for depression at intake. Approximately 48% met criteria for depression at the three-month follow-up. The frequencies at the two time points were not significantly different, χ 2 (1, N = 32) =.56, p =.45.
27 Limitations Dichotomous Data (coded 1/0) only If start with text, use Find/Replace Function of Excel Pie/Bar Charts Easy to Make in Excel with Multiple Categories (Use Wizard) Beware of Data Entry Errors See Last Webinar (Dec. 2008) Statistics for Multiple Categories (use stats program) Categories generally less sensitive for detecting change than continuously scored measures
28 One Final Tool Correlation Coefficient (Pearson r) Association Between Two Variables (from same time point!) Tool calculates r, associated p-value, and makes a scatter plot = R-Square = 0.13
29 What if it doesn t work out? 1. Measurement Issues Measurement, Assessment, and Data in a Cross- Cultural Context (Oct. 2007) NCB Resource Center 2. Administration Issues 3. Methodological Issues e.g., attrition people who are getting better are leaving 4. Sample Size Issues 5. Program may not be doing what you think it is doing 6. Change (or lack thereof) may be due to factors outside of your control Evaluation Text (Ch. 10)
30 Other Resources Evaluation Text (Dec.) Rossi, P.H., Lipsey, M.W. & Freeman, H.E. (2003). Evaluation: A systematic approach. Web Resources (free) American Evaluation Association Analysis Text Pallant, J. (2007). SPSS Survival Manual: A Step by Step Guide to Data Analysis Using SPSS for Windows. Introductory Stats Textbook (Reference Only) Library, Cheap, Used Howell (Stats for Behavioral Sciences) grad level Pagano (Understanding Stats in Behavioral Sciences) undergrad level
31 Analysis Considerations Consider analysis packages other than excel More flexible More powerful SPSS, R-Commander (part of R) Can import excel data files Measurement, Assessment, and Data in a Cross-Cultural Context (Oct. 2007) NCB Resource Center Nonetheless, the provided tools will do what was shown for free!
32 In Summary, for Part 2 of 3 1. Followed from previous webinar in series 2. Covered some statistical analyses Just another type of summary 3. Provided Tools to Calculate these Stats Paired t-test, effect sizes Chi-square 4. Questions about these issues are very acceptable on PTS-Talk list-serv!
33 Recap Series So Far Part One (Dec. 2008) Set Up System Collect, Track, and Enter Data Part Two (Feb. 2009) Score Data Analyze, Interpret, and Communicate
34 Next Time (Part 3 of 3) One of Two Tracks Broader Scope of Evaluation Organizational Buy In Staff Buy In Using Data (Not Just for Funders) Other Topics (Let me Know) Lessons Learned in the Field Discussion Format Measurement Issues
35 Thank You Feel free to contact me if you have any questions.
Demonstrating Client Improvement to Yourself and Others
 Demonstrating Client Improvement to Yourself and Others Making Sure Client Numbers Reflect Client Reality (Part 3 of 3) Greg Vinson, Ph.D. Senior Researcher and Evaluation Manager Center for Victims of
Intro to SPSS. Using SPSS through WebFAS
 Intro to SPSS Using SPSS through WebFAS http://www.yorku.ca/computing/students/labs/webfas/ Try it early (make sure it works from your computer) If you need help contact UIT Client Services Voice: 416-736-5800
Chi-Square Goodness-of-Fit Test
 STAT 250 Dr. Kari Lock Morgan Chi-Square Goodness-of-Fit Test SECTION 7.1 Testing the distribution of a single categorical variable : χ 2 goodness of fit (7.1) Multiple Categories So far, we ve learned
One-Way Independent ANOVA
 One-Way Independent ANOVA Analysis of Variance (ANOVA) is a common and robust statistical test that you can use to compare the mean scores collected from different conditions or groups in an experiment.
Using SPSS for Correlation
 Using SPSS for Correlation This tutorial will show you how to use SPSS version 12.0 to perform bivariate correlations. You will use SPSS to calculate Pearson's r. This tutorial assumes that you have: Downloaded
CHAPTER ONE CORRELATION
 CHAPTER ONE CORRELATION 1.0 Introduction The first chapter focuses on the nature of statistical data of correlation. The aim of the series of exercises is to ensure the students are able to use SPSS to
Analysis of Variance (ANOVA) Program Transcript
 Program Transcript") Analysis of Variance (ANOVA) Program Transcript DR. JENNIFER ANN MORROW: Welcome to Analysis of Variance. My name is Dr. Jennifer Ann Morrow. In today's demonstration, I'll review with you the definition
Analysis of Variance (ANOVA) Program Transcript DR. JENNIFER ANN MORROW: Welcome to Analysis of Variance. My name is Dr. Jennifer Ann Morrow. In today's demonstration, I'll review with you the definition
Introduction. Lecture 1. What is Statistics?
 Lecture 1 Introduction What is Statistics? Statistics is the science of collecting, organizing and interpreting data. The goal of statistics is to gain information and understanding from data. A statistic
Section 6: Analysing Relationships Between Variables
 6. 1 Analysing Relationships Between Variables Section 6: Analysing Relationships Between Variables Choosing a Technique The Crosstabs Procedure The Chi Square Test The Means Procedure The Correlations
Measuring the User Experience
 Measuring the User Experience Collecting, Analyzing, and Presenting Usability Metrics Chapter 2 Background Tom Tullis and Bill Albert Morgan Kaufmann, 2008 ISBN 978-0123735584 Introduction Purpose Provide
Homework Exercises for PSYC 3330: Statistics for the Behavioral Sciences
 Homework Exercises for PSYC 3330: Statistics for the Behavioral Sciences compiled and edited by Thomas J. Faulkenberry, Ph.D. Department of Psychological Sciences Tarleton State University Version: July
Two-Way Independent ANOVA
 Two-Way Independent ANOVA Analysis of Variance (ANOVA) a common and robust statistical test that you can use to compare the mean scores collected from different conditions or groups in an experiment. There
15.301/310, Managerial Psychology Prof. Dan Ariely Recitation 8: T test and ANOVA
 15.301/310, Managerial Psychology Prof. Dan Ariely Recitation 8: T test and ANOVA Statistics does all kinds of stuff to describe data Talk about baseball, other useful stuff We can calculate the probability.
Overview. Survey Methods & Design in Psychology. Readings. Significance Testing. Significance Testing. The Logic of Significance Testing
 Survey Methods & Design in Psychology Lecture 11 (2007) Significance Testing, Power, Effect Sizes, Confidence Intervals, Publication Bias, & Scientific Integrity Overview Significance testing Inferential
Something to think about. What happens, however, when we have a sample with less than 30 items?
 One-Sample t-test Remember In the last chapter, we learned to use a statistic from a large sample of data to test a hypothesis about a population parameter. In our case, using a z-test, we tested a hypothesis
Statistical Significance, Effect Size, and Practical Significance Eva Lawrence Guilford College October, 2017
 Statistical Significance, Effect Size, and Practical Significance Eva Lawrence Guilford College October, 2017 Definitions Descriptive statistics: Statistical analyses used to describe characteristics of
Day 11: Measures of Association and ANOVA
 Day 11: Measures of Association and ANOVA Daniel J. Mallinson School of Public Affairs Penn State Harrisburg mallinson@psu.edu PADM-HADM 503 Mallinson Day 11 November 2, 2017 1 / 45 Road map Measures of
Lessons in biostatistics
 Lessons in biostatistics The test of independence Mary L. McHugh Department of Nursing, School of Health and Human Services, National University, Aero Court, San Diego, California, USA Corresponding author:
Business Statistics Probability
 Business Statistics The following was provided by Dr. Suzanne Delaney, and is a comprehensive review of Business Statistics. The workshop instructor will provide relevant examples during the Skills Assessment
Comparing Two Means using SPSS (T-Test)
") Indira Gandhi Institute of Development Research From the SelectedWorks of Durgesh Chandra Pathak Winter January 23, 2009 Comparing Two Means using SPSS (T-Test) Durgesh Chandra Pathak Available at: https://works.bepress.com/durgesh_chandra_pathak/12/
Indira Gandhi Institute of Development Research From the SelectedWorks of Durgesh Chandra Pathak Winter January 23, 2009 Comparing Two Means using SPSS (T-Test) Durgesh Chandra Pathak Available at: https://works.bepress.com/durgesh_chandra_pathak/12/
The t-test: Answers the question: is the difference between the two conditions in my experiment "real" or due to chance?
 The t-test: Answers the question: is the difference between the two conditions in my experiment "real" or due to chance? Two versions: (a) Dependent-means t-test: ( Matched-pairs" or "one-sample" t-test).
Market Research on Caffeinated Products
 Market Research on Caffeinated Products A start up company in Boulder has an idea for a new energy product: caffeinated chocolate. Many details about the exact product concept are yet to be decided, however,
Psy201 Module 3 Study and Assignment Guide. Using Excel to Calculate Descriptive and Inferential Statistics
 Psy201 Module 3 Study and Assignment Guide Using Excel to Calculate Descriptive and Inferential Statistics What is Excel? Excel is a spreadsheet program that allows one to enter numerical values or data
3 CONCEPTUAL FOUNDATIONS OF STATISTICS
 3 CONCEPTUAL FOUNDATIONS OF STATISTICS In this chapter, we examine the conceptual foundations of statistics. The goal is to give you an appreciation and conceptual understanding of some basic statistical
Statistics as a Tool. A set of tools for collecting, organizing, presenting and analyzing numerical facts or observations.
 Statistics as a Tool A set of tools for collecting, organizing, presenting and analyzing numerical facts or observations. Descriptive Statistics Numerical facts or observations that are organized describe
Previously, when making inferences about the population mean,, we were assuming the following simple conditions:
 Chapter 17 Inference about a Population Mean Conditions for inference Previously, when making inferences about the population mean,, we were assuming the following simple conditions: (1) Our data (observations)
SPSS Correlation/Regression
 SPSS Correlation/Regression Experimental Psychology Lab Session Week 6 10/02/13 (or 10/03/13) Due at the Start of Lab: Lab 3 Rationale for Today s Lab Session This tutorial is designed to ensure that you
UNEQUAL CELL SIZES DO MATTER
 1 of 7 1/12/2010 11:26 AM UNEQUAL CELL SIZES DO MATTER David C. Howell Most textbooks dealing with factorial analysis of variance will tell you that unequal cell sizes alter the analysis in some way. I
Clever Hans the horse could do simple math and spell out the answers to simple questions. He wasn t always correct, but he was most of the time.
 Clever Hans the horse could do simple math and spell out the answers to simple questions. He wasn t always correct, but he was most of the time. While a team of scientists, veterinarians, zoologists and
Before we get started:
 Before we get started: http://arievaluation.org/projects-3/ AEA 2018 R-Commander 1 Antonio Olmos Kai Schramm Priyalathta Govindasamy Antonio.Olmos@du.edu AntonioOlmos@aumhc.org AEA 2018 R-Commander 2 Plan
Data and Statistics 101: Key Concepts in the Collection, Analysis, and Application of Child Welfare Data
 TECHNICAL REPORT Data and Statistics 101: Key Concepts in the Collection, Analysis, and Application of Child Welfare Data CONTENTS Executive Summary...1 Introduction...2 Overview of Data Analysis Concepts...2
Kidane Tesfu Habtemariam, MASTAT, Principle of Stat Data Analysis Project work
 1 1. INTRODUCTION Food label tells the extent of calories contained in the food package. The number tells you the amount of energy in the food. People pay attention to calories because if you eat more
Appendix B Statistical Methods
 Appendix B Statistical Methods Figure B. Graphing data. (a) The raw data are tallied into a frequency distribution. (b) The same data are portrayed in a bar graph called a histogram. (c) A frequency polygon
1. Below is the output of a 2 (gender) x 3(music type) completely between subjects factorial ANOVA on stress ratings
 x 3(music type) completely between subjects factorial ANOVA on stress ratings") SPSS 3 Practice Interpretation questions A researcher is interested in the effects of music on stress levels, and how stress levels might be related to anxiety and life satisfaction. 1. Below is the output
SPSS 3 Practice Interpretation questions A researcher is interested in the effects of music on stress levels, and how stress levels might be related to anxiety and life satisfaction. 1. Below is the output
Conditional Distributions and the Bivariate Normal Distribution. James H. Steiger
 Conditional Distributions and the Bivariate Normal Distribution James H. Steiger Overview In this module, we have several goals: Introduce several technical terms Bivariate frequency distribution Marginal
Inferential Statistics
 Inferential Statistics and t - tests ScWk 242 Session 9 Slides Inferential Statistics Ø Inferential statistics are used to test hypotheses about the relationship between the independent and the dependent
Study Guide #2: MULTIPLE REGRESSION in education
 Study Guide #2: MULTIPLE REGRESSION in education What is Multiple Regression? When using Multiple Regression in education, researchers use the term independent variables to identify those variables that
Comparing multiple proportions
 Comparing multiple proportions February 24, 2017 psych10.stanford.edu Announcements / Action Items Practice and assessment problem sets will be posted today, might be after 5 PM Reminder of OH switch today
Describe what is meant by a placebo Contrast the double-blind procedure with the single-blind procedure Review the structure for organizing a memo
 Please note the page numbers listed for the Lind book may vary by a page or two depending on which version of the textbook you have. Readings: Lind 1 11 (with emphasis on chapters 10, 11) Please note chapter
Designing Psychology Experiments: Data Analysis and Presentation
 Data Analysis and Presentation Review of Chapter 4: Designing Experiments Develop Hypothesis (or Hypotheses) from Theory Independent Variable(s) and Dependent Variable(s) Operational Definitions of each
Quantitative Methods in Computing Education Research (A brief overview tips and techniques)
") Quantitative Methods in Computing Education Research (A brief overview tips and techniques) Dr Judy Sheard Senior Lecturer Co-Director, Computing Education Research Group Monash University judy.sheard@monash.edu
Quantitative Methods in Computing Education Research (A brief overview tips and techniques) Dr Judy Sheard Senior Lecturer Co-Director, Computing Education Research Group Monash University judy.sheard@monash.edu
Describe what is meant by a placebo Contrast the double-blind procedure with the single-blind procedure Review the structure for organizing a memo
 Business Statistics The following was provided by Dr. Suzanne Delaney, and is a comprehensive review of Business Statistics. The workshop instructor will provide relevant examples during the Skills Assessment
Unit 7 Comparisons and Relationships
 Unit 7 Comparisons and Relationships Objectives: To understand the distinction between making a comparison and describing a relationship To select appropriate graphical displays for making comparisons
bivariate analysis: The statistical analysis of the relationship between two variables.
 bivariate analysis: The statistical analysis of the relationship between two variables. cell frequency: The number of cases in a cell of a cross-tabulation (contingency table). chi-square (χ 2 ) test for
Chapter 9: Comparing two means
 Chapter 9: Comparing two means Smart Alex s Solutions Task 1 Is arachnophobia (fear of spiders) specific to real spiders or will pictures of spiders evoke similar levels of anxiety? Twelve arachnophobes
New Food Label Pages Diabetes Self-Management Program Leader s Manual
 New Food Label Pages The FDA has released a new food label, so we have adjusted Session 4 and provided a handout of the new label. Participants use the handout instead of looking at the label in the book
Statistical analysis DIANA SAPLACAN 2017 * SLIDES ADAPTED BASED ON LECTURE NOTES BY ALMA LEORA CULEN
 Statistical analysis DIANA SAPLACAN 2017 * SLIDES ADAPTED BASED ON LECTURE NOTES BY ALMA LEORA CULEN Vs. 2 Background 3 There are different types of research methods to study behaviour: Descriptive: observations,
Daniel Boduszek University of Huddersfield
 Daniel Boduszek University of Huddersfield d.boduszek@hud.ac.uk Introduction to Correlation SPSS procedure for Pearson r Interpretation of SPSS output Presenting results Partial Correlation Correlation
Still important ideas
 Readings: OpenStax - Chapters 1 13 & Appendix D & E (online) Plous Chapters 17 & 18 - Chapter 17: Social Influences - Chapter 18: Group Judgments and Decisions Still important ideas Contrast the measurement
Testing Means. Related-Samples t Test With Confidence Intervals. 6. Compute a related-samples t test and interpret the results.
 10 Learning Objectives Testing Means After reading this chapter, you should be able to: Related-Samples t Test With Confidence Intervals 1. Describe two types of research designs used when we select related
Health Consciousness of Siena Students
 Health Consciousness of Siena Students Corey Austin, Siena College Kevin Flood, Siena College Allison O Keefe, Siena College Kim Reuter, Siena College EXECUTIVE SUMMARY We decided to research the health
HARRISON ASSESSMENTS DEBRIEF GUIDE 1. OVERVIEW OF HARRISON ASSESSMENT
 HARRISON ASSESSMENTS HARRISON ASSESSMENTS DEBRIEF GUIDE 1. OVERVIEW OF HARRISON ASSESSMENT Have you put aside an hour and do you have a hard copy of your report? Get a quick take on their initial reactions
An Introduction to Research Statistics
 An Introduction to Research Statistics An Introduction to Research Statistics Cris Burgess Statistics are like a lamppost to a drunken man - more for leaning on than illumination David Brent (alias Ricky
A Spreadsheet for Deriving a Confidence Interval, Mechanistic Inference and Clinical Inference from a P Value
 SPORTSCIENCE Perspectives / Research Resources A Spreadsheet for Deriving a Confidence Interval, Mechanistic Inference and Clinical Inference from a P Value Will G Hopkins sportsci.org Sportscience 11,
Measurement Error 2: Scale Construction (Very Brief Overview) Page 1
 Page 1") Measurement Error 2: Scale Construction (Very Brief Overview) Richard Williams, University of Notre Dame, https://www3.nd.edu/~rwilliam/ Last revised January 22, 2015 This handout draws heavily from Marija
Measurement Error 2: Scale Construction (Very Brief Overview) Richard Williams, University of Notre Dame, https://www3.nd.edu/~rwilliam/ Last revised January 22, 2015 This handout draws heavily from Marija
THE STATSWHISPERER. Introduction to this Issue. Doing Your Data Analysis INSIDE THIS ISSUE
 Spring 20 11, Volume 1, Issue 1 THE STATSWHISPERER The StatsWhisperer Newsletter is published by staff at StatsWhisperer. Visit us at: www.statswhisperer.com Introduction to this Issue The current issue
Psychology Research Process
 Psychology Research Process Logical Processes Induction Observation/Association/Using Correlation Trying to assess, through observation of a large group/sample, what is associated with what? Examples:
Chapter 7: Descriptive Statistics
 Chapter Overview Chapter 7 provides an introduction to basic strategies for describing groups statistically. Statistical concepts around normal distributions are discussed. The statistical procedures of
Getting a DIF Breakdown with Lertap
 Getting a DIF Breakdown with Lertap Larry Nelson Curtin University of Technology Document date: 8 October 2009 website: www.lertap.curtin.edu.au This document shows how Lertap 5 may be used to look for
Analysis of Categorical Data from the Ashe Center Student Wellness Survey
 Lab 6 Analysis of Categorical Data from the Ashe Center Student Wellness Survey Before starting this lab, you should be familiar with: the difference between categorical and quantitative variables, and
Quick start guide for using subscale reports produced by Integrity
 Quick start guide for using subscale reports produced by Integrity http://integrity.castlerockresearch.com Castle Rock Research Corp. November 17, 2005 Integrity refers to groups of items that measure
HS Exam 1 -- March 9, 2006
 Please write your name on the back. Don t forget! Part A: Short answer, multiple choice, and true or false questions. No use of calculators, notes, lab workbooks, cell phones, neighbors, brain implants,
PRINCIPLES OF STATISTICS
 PRINCIPLES OF STATISTICS STA-201-TE This TECEP is an introduction to descriptive and inferential statistics. Topics include: measures of central tendency, variability, correlation, regression, hypothesis
Doing Quantitative Research 26E02900, 6 ECTS Lecture 6: Structural Equations Modeling. Olli-Pekka Kauppila Daria Kautto
 Doing Quantitative Research 26E02900, 6 ECTS Lecture 6: Structural Equations Modeling Olli-Pekka Kauppila Daria Kautto Session VI, September 20 2017 Learning objectives 1. Get familiar with the basic idea
Boston Biometrics International Validation Study
 Boston Biometrics International Validation Study Jordan B. Peterson, Ph.D. June 23, 2010 - 2 - Objective: The purpose of this study is to determine whether Boston Biometrics International ( BBI ) is capable
Introduction to Quantitative Methods (SR8511) Project Report
 Project Report") Introduction to Quantitative Methods (SR8511) Project Report Exploring the variables related to and possibly affecting the consumption of alcohol by adults Student Registration number: 554561 Word counts
Introduction to Quantitative Methods (SR8511) Project Report Exploring the variables related to and possibly affecting the consumption of alcohol by adults Student Registration number: 554561 Word counts
Two-Way Independent Samples ANOVA with SPSS
 Two-Way Independent Samples ANOVA with SPSS Obtain the file ANOVA.SAV from my SPSS Data page. The data are those that appear in Table 17-3 of Howell s Fundamental statistics for the behavioral sciences
Bangor University Laboratory Exercise 1, June 2008
 Laboratory Exercise, June 2008 Classroom Exercise A forest land owner measures the outside bark diameters at.30 m above ground (called diameter at breast height or dbh) and total tree height from ground
MATH 1040 Skittles Data Project
 Laura Boren MATH 1040 Data Project For our project in MATH 1040 everyone in the class was asked to buy a 2.17 individual sized bag of skittles and count the number of each color of candy in the bag. The
Module One: What is Statistics? Online Session
 Module One: What is Statistics? Online Session Introduction The purpose of this online workshop is to aid you in better understanding the materials you have read within the class textbook. The goal of
How to assess the strength of relationships
 Publishing Date: April 1994. 1994. All rights reserved. Copyright rests with the author. No part of this article may be reproduced without written permission from the author. Meta Analysis 3 How to assess
Essential Skills for Evidence-based Practice: Statistics for Therapy Questions
 Essential Skills for Evidence-based Practice: Statistics for Therapy Questions Jeanne Grace Corresponding author: J. Grace E-mail: Jeanne_Grace@urmc.rochester.edu Jeanne Grace RN PhD Emeritus Clinical
One-Way ANOVAs t-test two statistically significant Type I error alpha null hypothesis dependant variable Independent variable three levels;
 1 One-Way ANOVAs We have already discussed the t-test. The t-test is used for comparing the means of two groups to determine if there is a statistically significant difference between them. The t-test
Simple Sensitivity Analyses for Matched Samples Thomas E. Love, Ph.D. ASA Course Atlanta Georgia https://goo.
 Goal of a Formal Sensitivity Analysis To replace a general qualitative statement that applies in all observational studies the association we observe between treatment and outcome does not imply causation
appstats26.notebook April 17, 2015
 Chapter 26 Comparing Counts Objective: Students will interpret chi square as a test of goodness of fit, homogeneity, and independence. Goodness of Fit A test of whether the distribution of counts in one
Benchmark Dose Modeling Cancer Models. Allen Davis, MSPH Jeff Gift, Ph.D. Jay Zhao, Ph.D. National Center for Environmental Assessment, U.S.
 Benchmark Dose Modeling Cancer Models Allen Davis, MSPH Jeff Gift, Ph.D. Jay Zhao, Ph.D. National Center for Environmental Assessment, U.S. EPA Disclaimer The views expressed in this presentation are those
11/18/2013. Correlational Research. Correlational Designs. Why Use a Correlational Design? CORRELATIONAL RESEARCH STUDIES
 Correlational Research Correlational Designs Correlational research is used to describe the relationship between two or more naturally occurring variables. Is age related to political conservativism? Are
Math Section MW 1-2:30pm SR 117. Bekki George 206 PGH
 Math 3339 Section 21155 MW 1-2:30pm SR 117 Bekki George bekki@math.uh.edu 206 PGH Office Hours: M 11-12:30pm & T,TH 10:00 11:00 am and by appointment More than Two Independent Samples: Single Factor Analysis
Computer Science 101 Project 2: Predator Prey Model
 Computer Science 101 Project 2: Predator Prey Model Real-life situations usually are complicated and difficult to model exactly because of the large number of variables present in real systems. Computer
Here are the various choices. All of them are found in the Analyze menu in SPSS, under the sub-menu for Descriptive Statistics :
 Descriptive Statistics in SPSS When first looking at a dataset, it is wise to use descriptive statistics to get some idea of what your data look like. Here is a simple dataset, showing three different
What is Data? Part 2: Patterns & Associations. INFO-1301, Quantitative Reasoning 1 University of Colorado Boulder
 What is Data? Part 2: Patterns & Associations INFO-1301, Quantitative Reasoning 1 University of Colorado Boulder August 29, 2016 Prof. Michael Paul Prof. William Aspray Overview This lecture will look
Business Research Methods. Introduction to Data Analysis
 Business Research Methods Introduction to Data Analysis Data Analysis Process STAGES OF DATA ANALYSIS EDITING CODING DATA ENTRY ERROR CHECKING AND VERIFICATION DATA ANALYSIS Introduction Preparation of
Advanced ANOVA Procedures
 Advanced ANOVA Procedures Session Lecture Outline:. An example. An example. Two-way ANOVA. An example. Two-way Repeated Measures ANOVA. MANOVA. ANalysis of Co-Variance (): an ANOVA procedure whereby the
How Lertap and Iteman Flag Items
 How Lertap and Iteman Flag Items Last updated on 24 June 2012 Larry Nelson, Curtin University This little paper has to do with two widely-used programs for classical item analysis, Iteman and Lertap. I
Still important ideas
 Readings: OpenStax - Chapters 1 11 + 13 & Appendix D & E (online) Plous - Chapters 2, 3, and 4 Chapter 2: Cognitive Dissonance, Chapter 3: Memory and Hindsight Bias, Chapter 4: Context Dependence Still
Georgina Salas. Topics EDCI Intro to Research Dr. A.J. Herrera
 Homework assignment topics 51-63 Georgina Salas Topics 51-63 EDCI Intro to Research 6300.62 Dr. A.J. Herrera Topic 51 1. Which average is usually reported when the standard deviation is reported? The mean
APPENDIX N. Summary Statistics: The "Big 5" Statistical Tools for School Counselors
 APPENDIX N Summary Statistics: The "Big 5" Statistical Tools for School Counselors This appendix describes five basic statistical tools school counselors may use in conducting results based evaluation.
ANOVA in SPSS (Practical)
") ANOVA in SPSS (Practical) Analysis of Variance practical In this practical we will investigate how we model the influence of a categorical predictor on a continuous response. Centre for Multilevel Modelling
ANOVA in SPSS (Practical) Analysis of Variance practical In this practical we will investigate how we model the influence of a categorical predictor on a continuous response. Centre for Multilevel Modelling
AP STATISTICS 2009 SCORING GUIDELINES
 AP STATISTICS 2009 SCORING GUIDELINES Question 1 Intent of Question The primary goals of this question were to assess a student s ability to (1) construct an appropriate graphical display for comparing
5 Listening to the data
 D:\My Documents\dango\text\ch05v15.doc Page 5-1 of 27 5 Listening to the data Truth will ultimately prevail where there is pains taken to bring it to light. George Washington, Maxims 5.1 What are the kinds
Statistics: Interpreting Data and Making Predictions. Interpreting Data 1/50
 Statistics: Interpreting Data and Making Predictions Interpreting Data 1/50 Last Time Last time we discussed central tendency; that is, notions of the middle of data. More specifically we discussed the
Preliminary Report on Simple Statistical Tests (t-tests and bivariate correlations)
") Preliminary Report on Simple Statistical Tests (t-tests and bivariate correlations) After receiving my comments on the preliminary reports of your datasets, the next step for the groups is to complete
Preliminary Report on Simple Statistical Tests (t-tests and bivariate correlations) After receiving my comments on the preliminary reports of your datasets, the next step for the groups is to complete
Daniel Boduszek University of Huddersfield
 Daniel Boduszek University of Huddersfield d.boduszek@hud.ac.uk Introduction to Multinominal Logistic Regression SPSS procedure of MLR Example based on prison data Interpretation of SPSS output Presenting
Midterm project due next Wednesday at 2 PM
 Course Business Midterm project due next Wednesday at 2 PM Please submit on CourseWeb Next week s class: Discuss current use of mixed-effects models in the literature Short lecture on effect size & statistical
Exam 4 Review Exercises
 Math 160: Statistics Spring, 2014 Toews Exam 4 Review Exercises Instructions: Working in groups of 2-4, first review the goals and objectives for this exam (listed below) and then work the following problems.
Introduction to Meta-Analysis
 Introduction to Meta-Analysis Nazım Ço galtay and Engin Karada g Abstract As a means to synthesize the results of multiple studies, the chronological development of the meta-analysis method was in parallel
POLS 5377 Scope & Method of Political Science. Correlation within SPSS. Key Questions: How to compute and interpret the following measures in SPSS
 POLS 5377 Scope & Method of Political Science Week 15 Measure of Association - 2 Correlation within SPSS 2 Key Questions: How to compute and interpret the following measures in SPSS Ordinal Variable Gamma
Problem #1 Neurological signs and symptoms of ciguatera poisoning as the start of treatment and 2.5 hours after treatment with mannitol.
 Ho (null hypothesis) Ha (alternative hypothesis) Problem #1 Neurological signs and symptoms of ciguatera poisoning as the start of treatment and 2.5 hours after treatment with mannitol. Hypothesis: Ho:
Correlated to: ACT College Readiness Standards Science (High School)
") ACT College Readiness Science Score Range - 1-12 Students who score in the 1 12 range are most likely beginning to develop the knowledge and skills assessed in the other score ranges. locate data in simple
ACT College Readiness Science Score Range - 1-12 Students who score in the 1 12 range are most likely beginning to develop the knowledge and skills assessed in the other score ranges. locate data in simple
25. Two-way ANOVA. 25. Two-way ANOVA 371
 25. Two-way ANOVA The Analysis of Variance seeks to identify sources of variability in data with when the data is partitioned into differentiated groups. In the prior section, we considered two sources