Propensity Score Methods for Longitudinal Data Analyses: General background, ra>onale and illustra>ons*
|
|
|
- Marvin Cameron
- 6 years ago
- Views:
Transcription
1 Propensity Score Methods for Longitudinal Data Analyses: General background, ra>onale and illustra>ons* Bob Pruzek, University at Albany SUNY Summary Propensity Score Analysis (PSA) was introduced by Rosenbaum & Rubin (Biometrika, 1983). Since then PSA has become one of the most studied and frequently used new methods in sta>s>cs. Hundreds of papers have appeared covering philosophy, sta>s>cal theory and a wide variety of applica>ons (especially in health science & medicine). I focus on background and logical founda>ons of PSA, then present & discuss graphics that illustrate various PSA methods; lastly, I describe with examples how conven>onal PSA methodology can be extended to accommodate longitudinal data analysis. It is noted that while longitudinal PSA oven oven entails notable complica>ons, special advantages can accrue to LDA- PSA if axen>on is given to certain aspects of observa>onal study design. *Talk for INTEGRATIVE ANALYSIS OF LONGITUDINAL STUDIES OF AGING Conference, Victoria, BC June 2010
2 PSA is based on the same logic that underpins analyses of true experiments. In true experiments, units are randomly allocated to (two) treatment groups at the outset of study, that is, before the treatments begin. Randomiza>on, in the words of R. A. Fisher, provides the reasoned basis for causal inference in experiments. Randomiza>on ensures that units in the two treatment groups do not differ systema>cally on any covariate which is why this opera>on supports causal interpreta5ons: When one group scores notably higher than another on ul>mate response variable(s), this can (with qualifica>ons*) be axributed to treatment differences; random assignment tends to make alterna>ve explana>ons implausible. *Three caveats, at least, are in order: 1. Randomiza5on can go awry in prac5ce, par5cularly when samples are not large; 2. Much depends on details of how experiments are run; & 3. To say that treatments caused differences is not to say that one knows what feature(s) of the treatments had the noted effects. Sta5s5cians generally study effects of causes, not causes of effects.
3 Observa1onal studies entail comparison of groups not formed using randomiza1on; units are said to select their own treatments. This means that observa>onal studies give rise to a greater likelihood for Selec1on Bias (SB). SB refers to systema5c covariate differences between groups differences that can confound apempts to interpret response variable differences. SB is the central problem that propensity score analysis aims to reduce, if not eliminate (usually but not always in the context of observa>onal studies). This tends to be facilitated if one conceptualizes each observa>onal study as having arisen from a (complex) randomized experiment. Three people have wrixen key ar>cles and books that underpin propensity score methods: William Cochran, his student Donald Rubin; and then his student, Paul Rosenbaum. A review of one of Cochran s studies, done 40 years ago is worth brief examina>on.
4 Cochran (1968) compared death rates of smokers and non- smokers. It had been found, using unstra>fied data, that death rates for smokers and non- smokers were nearly iden>cal (evidence that many smokers and manufacturers of tobacco products found greatly to their liking). Cochran decided to reanalyze the data aver stra*fying both smokers & non- smokers by age before compu>ng death rates. AVer age- based stra>fica>on he re- calculated death rates. This led to the finding that death rates among smokers were on average 40-50% higher than for non- smokers! Moreover, this was for very large samples. Results of this kind represent early versions of what now can be seen as propensity score analysis. The advent of modern PSA methods helps inves>gators adjust for mul>ple covariates, not just one as in Cochran s case.
5 When there are many poten>al confounding variables in an observa>onal study then direct stra>fica>on is unwieldy because the number of cells associated with the crossing of covariates is oven huge; also missing values will be found in many cells. Nevertheless numerous covariates can be expected to confound interpreta>ons. For many years analysts found it especially difficult to account for confounding effects. The key breakthrough came when Rosenbaum and Rubin (1983) showed how to produce a single variable, a propensity score, the use of which could greatly simplify treatment comparisons in observa>onal studies. They noted that condi>ons may exist where treatment assignment Z (binary) is independent of poten5al outcomes* Y 0 & Y 1, condi>onal on observed baseline covariates, X. That is, (Y(1), Y(0)) Z X, if 0 < P(Z=1 X) < 1. This condi>on was defined as strong ignorability which essen>ally means that all covariates that affect treatment assignment are included in X. *Reference to poten1al outcomes invokes counterfactual logic.
6 These authors defined the propensity score e(x) (a scalar func1on of X) as the probability of treatment assignment, condi1onal on observed baseline covariates: e(x) = e i = Pr(Z i = 1 X i ). They then demonstrated that the propensity score is a balancing score, meaning that, condi>onal on the propensity score, the distribu>on of measured baseline covariates is similar for the treated & untreated (or treatment and control) subjects. Therefore (Y(1), Y(0)) Z e(x), an analog of the preceding expression. In effect e(x) summarizes the informa>on in X. Rosenbaum and Rubin rely strongly on the assump>on of strong ignorability. In prac>ce, the preceding leads to an interest in es>ma>ng the (scalar) propensity score from the (vector) of (appropriately chosen) covariates, say X, so that comparisons of treatment and control response score distribu>ons can be made condi>onal on an es>mated propensity score. The most common method for es>ma>ng e(x) entails use of logis>c regression (LR).
7 In prac>ce, there are two main Phases of a propensity score analysis. In Phase I, pre- treatment covariates are used to construct a scalar variable, a propensity score, that summarizes key differences among units (or respondents) with respect to the two* treatments being compared. Generally the fixed values produced in logis5c regression are taken as es>mates of propensity scores, the e(x) s. e(x) = 1/(1 + e - {linear func>on of covariates} ). These e(x) s are then used in Phase II in either of two ways: units in the treatment and control groups are either matched or stra>fied (sorted); then the two groups are compared on one or more outcome measures, condi1onal on the matches or strata. For matching, an algorithm or rule is used to match individuals in the T & C groups whose P- scores are reasonably close to one another; numerous methods are available. With stra>fica>on responses of units in the two groups are compared within propensity- based strata. Both methods are illustrated below. *Except for recent work, nearly all PSA s to date have focused on two groups. See my wiki: propensityscoreanalysis.pbworks.com
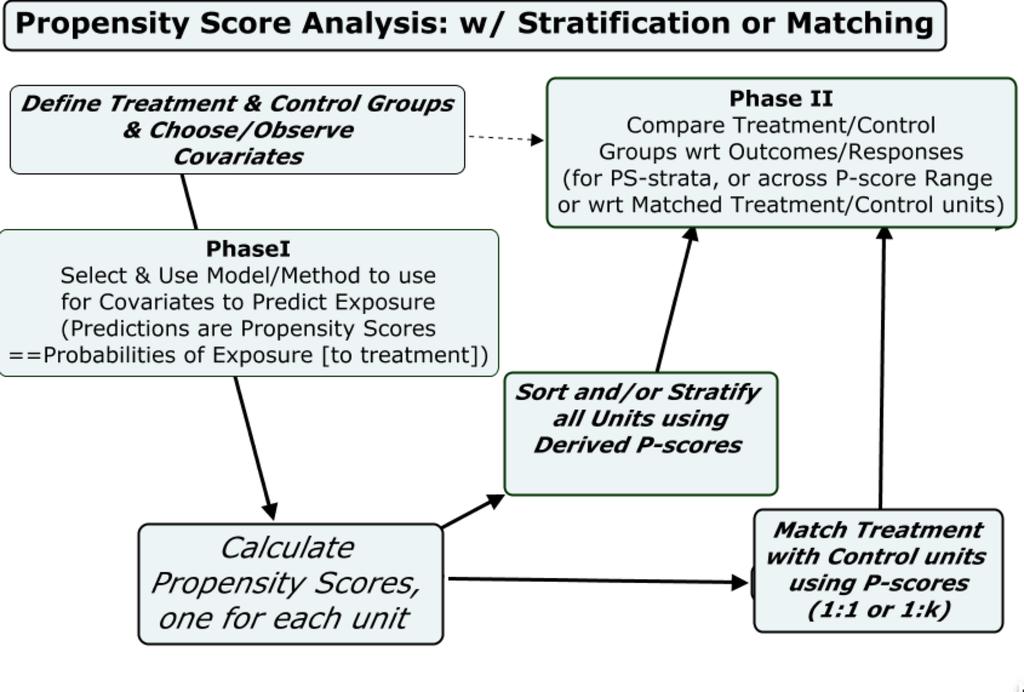
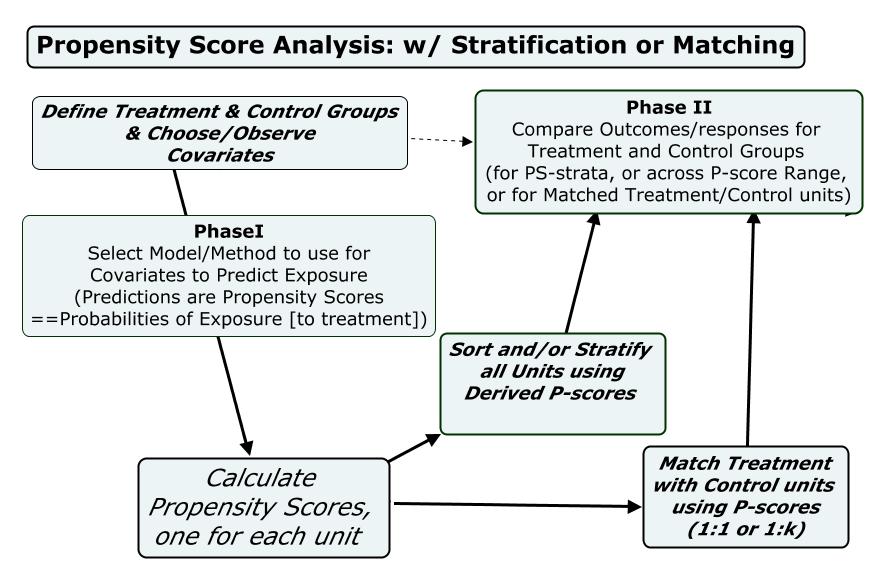
8 The following slide exhibits a flow chart showing how propensity score analysis proceeds when comparing two groups (to be read counterclockwise from the NW corner). Covariate selec>on is central. Once the T & C groups have been defined, the key problem is to decide what covariates should be balanced re: T & C comparison. Theory and prior evidence come into play. Use of all relevant covariates is advised; they should relate to the ul>mate response variable, as well as the T vs. C dis>nc>on Logis>c regression modeling should consider main effects as well as interac5ons (based on substan>ve relevance, and empirics) Once propensity scores have been calculated, it is helpful to demonstrate overlap of P- score distribu5ons for the T & C groups Either or both, matching and stra5fica5on, are generally used for analyses; the es>mands, however, differ in the two cases (ATT, ATE). Outcomes are readily compared across the range of P- scores; see the loess graphic that follows. For matched data either dependent or independent sample sta>s>cal methods and graphics may be used.
9
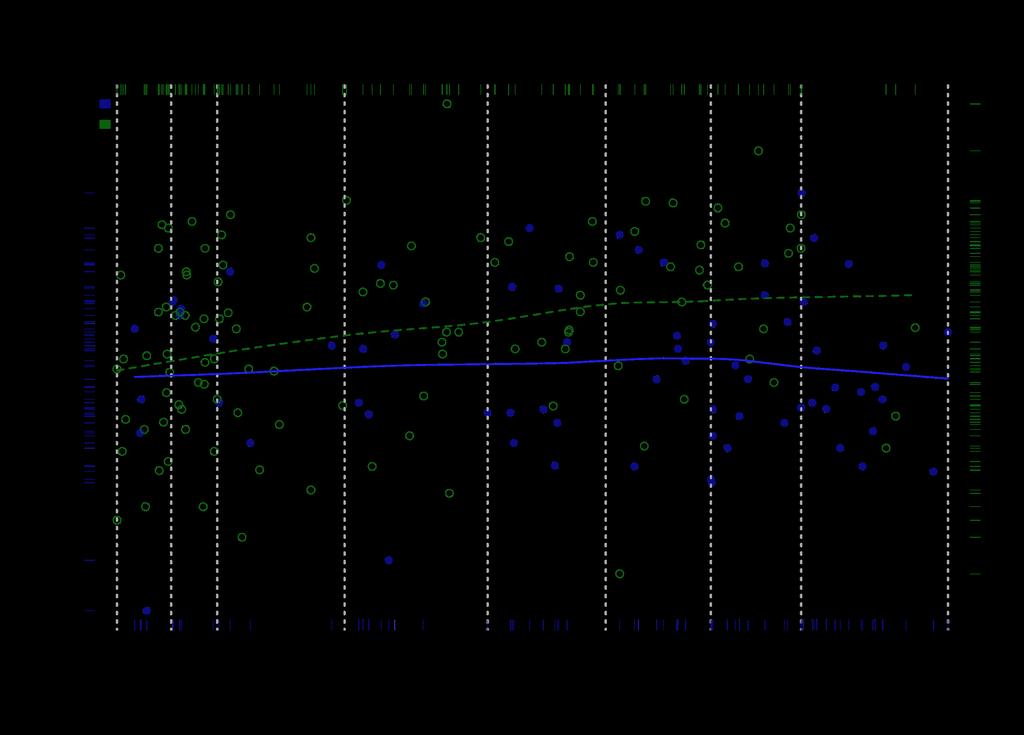
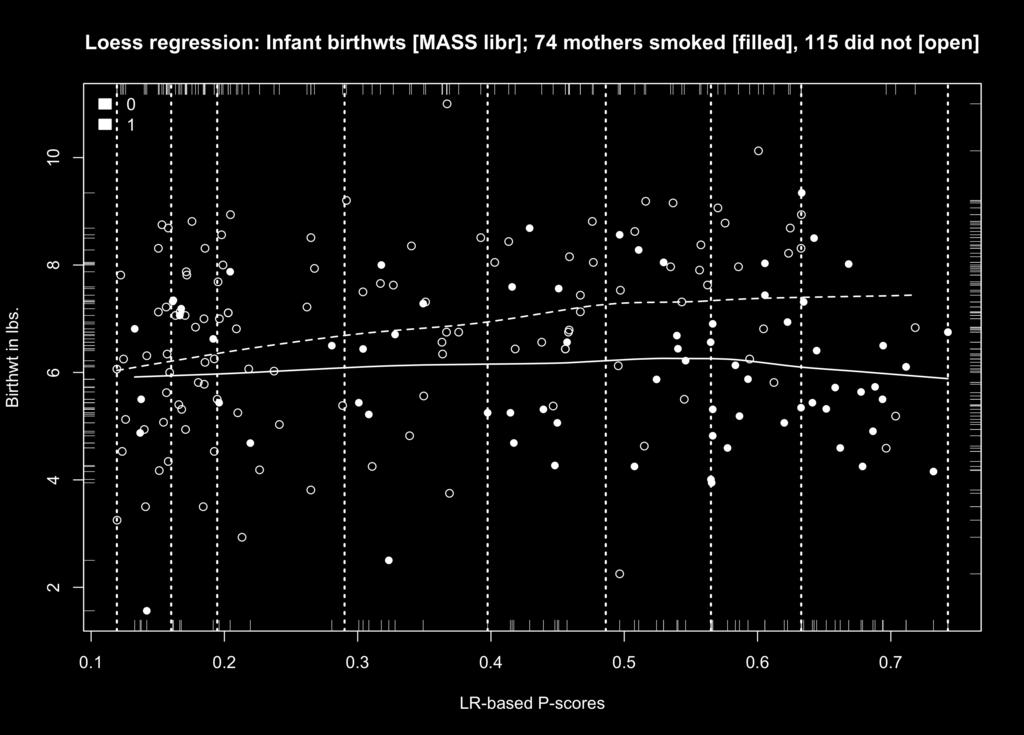
10 The next slide illustrates a Phase II analysis, where loess regression was used to compare infant birth weights of mothers who smoked (treatment group) with mothers who did not. Birth weights (in lbs.) are ploxed (ver>cal) against LR- derived propensity scores (horizontal) for n = 189 infants. Two loess regression lines (dashed and solid) are shown, for infants of smoking (darkened points) and non- smoking (open circles) mothers. Ver>cal dashed lines depict eight quan>le- based strata; effects are assessed within strata (and then averaged). In this case, aver adjus>ng for covariate effects using P- scores, it is seen that birth weights are notably lower for infants (whose mothers smoked) than for controls. (Notably, overlap of the two P- score distribu>ons provided reasonable support for the comparison and all covariates were reasonably balanced across the eight P- score strata.) To complete the illustra>on note that the Average Treatment Effect was.84 lbs., and the 95% CI yields the limits (0.30, 1.38) failing to span zero. (The graphic is based on func>on loess.psa from the PSAgraphics package (R).)
11
12 The next slide illustrates matching* in an observa>onal study by Morten, et. al (1982, Amer. Jour. Epidemiology, p. 549 ff) that entailed an especially simple form of propensity score analysis. Children of parents who had worked in a factory where lead was used in making baxeries were matched by age and neighbor- hood with children whose parents did not work in lead- based industries. Whole blood was assessed for lead content to provide responses. Results shown compare blood of Exposed with that of Control Children in what can be seen as a paired samples design. Conven>onal dependent sample analysis shows that the (95%) C.I. for the popula>on mean difference is far from zero (see line segment, lower lev). The mean difference score is 5.78; results support the conclusion that a parents lead- related occupa>on can cause lead to be found in their children's blood. *Using function granova.ds in package granova (R). The heavy black line on diagonal corresponds to X = Y, so if X > Y its point lies below the identity line. Parallel projections to lower left line segment show the distribution of difference scores corresponding to the pairs; the red dashed line shows the average difference score, and the green line segment shows the 95% C.I.
13 1982
14 A graphic allows one to go beyond a numerical summary. In this case note the wide dispersion of lead measurements for exposed children in comparison with their control counterparts. A follow- up showed that parental hygiene differed largely across the baxery- factory parents, and the varia>on in hygiene accounted in large measure for dispersion of their children s lead measurements (a finding made possible because of Morton s close axen>on to detail in ini>al data collec>on). Although Control & Exposed children may differ in other ways (than age and neighborhood of residence) these data seem persuasive in showing that lead- based baxery factory work puts children at risk for high levels of blood lead - - except when personal hygiene of the worker is effec>ve. Rosenbaum (2002), who discusses this example in detail, uses a sensi1vity analysis to show that the hidden bias would have to be substan>al to explain away a difference this large. Sensi>vity analyses can be essen>al to a wrap- up of a PSA study. In summary, these observa>onal data appear to provide valuable evidence to support causal conclusions re: the hypothesis.
15 The basic ideas of PSA have been simplified in order to focus on key principles and methods central to modern- day propensity score applica>ons. Recent PSA inves>ga>ons have begun to move beyond comparison of two treatments, to compare three or more (however, most authors assume an underlying con>nuum, e.g., dose- response groups). Mul>level methods for PSA have begun to be published, as have methods for studying media>on; the role of stra>fica>on has also begun to see axen>on. A few studies have been aimed at missing data imputa>on methods, including mul>ple imputa>on. Pearl (2010), in par>cular, has formalized basic ideas to help bridge the gap between mainstream PSA methods & structural/graphical modeling. To date, only a handful of authors seem to have addressed the central issue of this conference, viz., analysis of longitudinal data - - in par>cular, P- score methodology to compare treated & control groups for observa>onal data aver adjus>ng for confounding covariates. In what follows, I use a basic illustra>on to show how preceding methodology can be extended to deal with longitudinal data comparisons. The next slide sets the stage for how this might be done.
16 Longitudinal data are shown for four individuals, where slopes & intercepts are readily discerned for 4 individuals for 5 >me waves. For data like these, where T & C groups could start prior to 5me 1, and key covariate data are available for all units, P- scores could be generated to to assess T vs. C effects. Sta5s5cs that describe profiles could be used as responses in PSA. A key is to find sta>s>cs sufficient to characterize trajectories (regardless of the # of data waves). In this way, LDA versions of PSA may be straigh~orwardly generalized, moving from univariate to mul>variate PSA. Panels distinguish 4 persons at 5 time points, w/ a common response for all. Assuming straight line regression for all panels, two sta>s>cs are sufficient regardless of the # of waves; moreover, many fixed (smoothed) curves might entail few (oven no more than 3 or 4) sta>s>cs to characterize >me trends for assessments of treatment effects. In such cases PSA can be generalized to (low dimensional) mul>variate analysis to support observa>onal LD analyses. Smoothing is the key; let us consider this topic next.
17 Given the preceding approaches for extending PSA to longitudinal data for observa>onal studies, consider several further points: 1. A wide variety of so- called growth models are available to characterize longitudinal profiles; much recent work in this field has aimed at developing generaliza>ons that extend the reach of models; 2. Some authors have focused on smoothing profiles - - in two dis>nc>ve ways: a. smoothing individual profiles by taking advantage of dependencies among adjacent or closely related observa>ons in profiles, and b. smoothing by capitalizing on similari>es among profiles for individuals; such smoothing entails borrowing strength from mutually related profiles. Double smoothing may also be employed. 3. Those who model as in 1., are oven advised to smooth ini>ally when individual observa>ons are subject to considerable noise. 4. Model- based predic>ons (or fixed versions) of ini>al profiles, or at least their smoothed counterparts, are likely to be bexer targets for (PSA) studies than would be ini>al (raw- data) profiles. 5. As in the case of simpler forms of PSA, sensi>vity analyses will generally be advisable. (Rosenbaum, in his two books, considers this topic closely.) 6. A great deal of work on PSA remains to be done for longitudinal problems and there are many opportuni>es for analysis in this area.
18 These four panels illus- trate possibili>es. They correspond to subsets of profiles, each for five animals, as clustered (see below). In par>cu- lar, three principal components were derived from ini>ally smoothed profiles that were in turn used to get doubly smoothed profiles computed as linear combina>ons of the PCs. Each profile can be fully described using 4 coefficients: intercept, & three PC regression coefficients. Clusters were based on these coefficients (in R). Given appropriate covariate data for each animal, these might be used for observa>onal study comparison of animals whose diets differed from one another; i.e. using constructed P- scores. (All ini>al responses were measures of protein in milk over five weeks. These data are part of the Milk dataset in the nlme package; they are real.) As seen here, smoothing can work especially well for some data. Exploratory approaches (based on underlying components or latent variables) may oven permit crea>on of smoothed versions of either original or pre- smoothed profiles. LDA versions of PSA may readily follow.
19 Although >me may not permit discussion, it may be useful to make some further observa>ons pertaining to mainstream IALSA interests. Consider an example of an observa5onal comparison of two groups (as suggested by S. Hofer). Does engagement in intellectually challenging tasks, exercise, [or] social networks help to maintain cogni>ve func>oning in later life? There have been a number of analyses of longitudinal observa>onal studies and experimental studies of this topic. There is some evidence to suggest that physical ac>vity enhances cogni>ve performance. Suppose we revisit such a ques>on using a modern PSA approach. Let us limit axen>on to one measure of cogni>ve func>oning and a clearly defined treatment (that could be a combina>on, but might be limited to one behavior, say engagement in exercise). Given a clear dis>nc>on between two groups, one of which will not have exercised (self- report?), and one of which will (at some defined level of rigor and regularity), we might aim to adjust for (all) relevant covariate differences. This is the hardest part, one that might ideally be done using a prospec5ve approach, where one could have the luxury of naming in advance all covariates that seem likely to confound interpreta>ons of T vs. C effects. Archival data might also be used with the proviso that such data rarely contain all variables that ul>mately maxer (think of the cri>cs). If cogni>ve func>oning scores are available for individuals before and a^er commencement of exercise, ini>al covariate scores might be used in the construc>on of P- scores.
20 It is almost inevitable in prac>ce that some covariate and longitudinal data will have gone missing. This is one key reason imputa>on methods have garnered so much interest. (But the underlying theory that supports PSA methods, á la Rubin, is strongly based on counterfactual logic where one of two poten>al outcomes will always be missing). A special advantage for some longitudinal data sets is that missing LD values can be more reliably es>mated than counterparts outside the longitudinal framework. This means that mul>ple LD imputa>ons, and many products of analysis, may vary less than is typical. An addi>onal concern is that responses (such as cogni>ve func>on scores) are likely to have been obtained at different >mes for different individuals; i.e., different spacings and different numbers of >mes as well. Smoothing can oven help with such problems, in which case the ul>mate data used in the PSA can begin from sta>s>cs that characterize smoothed profiles, not original data. (This step may also help ameliorate problems induced by measurement errors.) Naturally, imputa>ons can be done in different ways, perhaps using different imputa>on models; and the same goes for smoothing. When mul>ple analyses of the same data are employed one will want to learn how much results vary across methods. Further value may come from use of mixed models in analysis. Ul>mately, longitudinal PS analysis of such data may lead to fairly strong conclusions about treatment effects, condi>onal on the extent to which covariates are strongly ignorable, and the extent to which results do not depend heavily on the par>cular methods used for analysis. Design is likely to be central.
Propensity Score Analysis: Its rationale & potential for applied social/behavioral research. Bob Pruzek University at Albany
 Propensity Score Analysis: Its rationale & potential for applied social/behavioral research Bob Pruzek University at Albany Aims: First, to introduce key ideas that underpin propensity score (PS) methodology
Propensity Score Analysis to compare effects of radiation and surgery on survival time of lung cancer patients from National Cancer Registry (SEER)
") Propensity Score Analysis to compare effects of radiation and surgery on survival time of lung cancer patients from National Cancer Registry (SEER) Yan Wu Advisor: Robert Pruzek Epidemiology and Biostatistics
Propensity Score Analysis to compare effects of radiation and surgery on survival time of lung cancer patients from National Cancer Registry (SEER) Yan Wu Advisor: Robert Pruzek Epidemiology and Biostatistics
Casual Methods in the Service of Good Epidemiological Practice: A Roadmap
 University of California, Berkeley From the SelectedWorks of Maya Petersen 2013 Casual Methods in the Service of Good Epidemiological Practice: A Roadmap Maya Petersen, University of California, Berkeley
For Objec*ve Causal Inference, Design Trumps Analysis. Donald B. Rubin Department of Sta*s*cs Harvard University 16 March 2012
 For Objec*ve Causal Inference, Design Trumps Analysis Donald B. Rubin Department of Sta*s*cs Harvard University 16 March 2012 1 Prologue to Objec*ve Causal Inference in Observa*onal Studies My Introduc*on
Propensity Score. Overview:
 Propensity Score Overview: What do we use a propensity score for? How do we construct the propensity score? How do we implement propensity score es
Applica(on of Causal Inference Methods to Improve Treatment of HIV in Resource Limited Se?ngs
 Applica(on of Causal Inference Methods to Improve Treatment of HIV in Resource Limited Se?ngs Maya Petersen works.bepress.com/maya_petersen Divisions of Biosta,s,cs and Epidemiology, University of California,
Welcome! Pragmatic Clinical Studies. David Hickam, MD, MPH Program Director Clinical Effectiveness Research. David Hickam, MD, MPH
 Pragmatic Clinical Studies David Hickam, MD, MPH Program Director Clinical Effec2veness Research June 23, 2015 Welcome! David Hickam, MD, MPH Program Director Clinical Effectiveness Research 2 In this
Introduction to Observational Studies. Jane Pinelis
 Introduction to Observational Studies Jane Pinelis 22 March 2018 Outline Motivating example Observational studies vs. randomized experiments Observational studies: basics Some adjustment strategies Matching
Sta$s$cs is Easy. Dennis Shasha From a book co- wri7en with Manda Wilson
 Sta$s$cs is Easy Dennis Shasha From a book co- wri7en with Manda Wilson Is the Coin Fair? You toss a coin 17 $mes and it comes up heads 15 out of 17 $mes. How likely is it that coin is fair? Could look
In this module we will cover Correla4on and Validity.
 In this module we will cover Correla4on and Validity. A correla4on coefficient is a sta4s4c that is o:en used as an es4mate of measurement, such as validity and reliability. You will learn the strength
Classifica4on. CSCI1950 Z Computa4onal Methods for Biology Lecture 18. Ben Raphael April 8, hip://cs.brown.edu/courses/csci1950 z/
 CSCI1950 Z Computa4onal Methods for Biology Lecture 18 Ben Raphael April 8, 2009 hip://cs.brown.edu/courses/csci1950 z/ Binary classifica,on Given a set of examples (x i, y i ), where y i = + 1, from unknown
Process of Science and hypothesis tes2ng in Behavioral Ecology
 Process of Science and hypothesis tes2ng in Behavioral Ecology Goal: understand the way that scien2fic hypotheses and methodologies are used to gain knowledge. What separates science from non- science?
A large database study in the general population in England
 Time-dependent markers of comorbidity severity and change are associated with increased risk of mortality in heart failure: A large database study in the general population in England Claire A. Rushton,
Common Data Elements: Making the Mass of NIH Measures More Useful
 Common Data Elements WG Common Data Elements: Making the Mass of NIH Measures More Useful Jerry Sheehan Assistant Director for Policy Development Na?onal Library of Medicine Gene/c Alliance Webinar Series
Propensity Score Analysis Shenyang Guo, Ph.D.
 Propensity Score Analysis Shenyang Guo, Ph.D. Upcoming Seminar: April 7-8, 2017, Philadelphia, Pennsylvania Propensity Score Analysis 1. Overview 1.1 Observational studies and challenges 1.2 Why and when
Unit 1 Exploring and Understanding Data
 Unit 1 Exploring and Understanding Data Area Principle Bar Chart Boxplot Conditional Distribution Dotplot Empirical Rule Five Number Summary Frequency Distribution Frequency Polygon Histogram Interquartile
Are Job- Training Programs Effec4ve?
 Are Job- Training Programs Effec4ve? Donald B. Rubin Harvard University Presentation based on joint work with Fabrizia Mealli, Paolo Frumento, and Barbara Pacini. 1 The Na4onal Job Corps Study A randomized
Learning Objec1ves. Study Design Considera1ons in Clinical Pharmacy
 9/28/15 Study Design Considera1ons in Clinical Pharmacy Ludmila Bakhireva, MD, PhD, MPH Pree Sarangarm, PharmD, BCPS Learning Objec1ves Describe the features, advantages and disadvantages of the observa1onal
PubH 7405: REGRESSION ANALYSIS. Propensity Score
 PubH 7405: REGRESSION ANALYSIS Propensity Score INTRODUCTION: There is a growing interest in using observational (or nonrandomized) studies to estimate the effects of treatments on outcomes. In observational
BIOSTATISTICAL METHODS
 BIOSTATISTICAL METHODS FOR TRANSLATIONAL & CLINICAL RESEARCH PROPENSITY SCORE Confounding Definition: A situation in which the effect or association between an exposure (a predictor or risk factor) and
3/31/2015. Designing Clinical Research Studies: So You Want to Be an
 Designing Clinical Research Studies: So You Want to Be an Inves@gator Andrea Bonny, MD Ellen Lançon Connor, MD On behalf Of The NASPAG Research CommiPee Objec@ves Learn to design a clinical research project
Propensity Score Methods for Causal Inference with the PSMATCH Procedure
 Paper SAS332-2017 Propensity Score Methods for Causal Inference with the PSMATCH Procedure Yang Yuan, Yiu-Fai Yung, and Maura Stokes, SAS Institute Inc. Abstract In a randomized study, subjects are randomly
Dr. Alessio Signori Longitudinal trajectories of EDSS in primary progressive MS pa:ents A latent class approach
 Dr. Alessio Signori Longitudinal trajectories of EDSS in primary progressive MS pa:ents A latent class approach Department of Health Sciences Section of Biostatistics University of Genoa, Italy Mul%ple
Use and Interpreta,on of LD Score Regression. Brendan Bulik- Sullivan PGC Stat Analysis Call
 Use and Interpreta,on of LD Score Regression Brendan Bulik- Sullivan bulik@broadins,tute.org PGC Stat Analysis Call Outline of Talk Intui,on, Theory, Results LD Score regression intercept: dis,nguishing
Causes of variability in developmental disorders
 Causes of variability in developmental disorders Is the medical risk model appropriate for understanding behavioural deficits? Michael Thomas Birkbeck College Workshop: Developmental disorders: co- morbidity,
Identifying Peer Influence Effects in Observational Social Network Data: An Evaluation of Propensity Score Methods
 Identifying Peer Influence Effects in Observational Social Network Data: An Evaluation of Propensity Score Methods Dean Eckles Department of Communication Stanford University dean@deaneckles.com Abstract
Today. HW6 ques.ons? Next reading presenta.on: Friday (R25) Sta.s.cal methods
 Sta.s.cal methods") Today HW6 ques.ons? Next reading presenta.on: Friday (R25) Sta.s.cal methods Inferen.al sta.s.cs Inferen.al sta.s.cs: Sta.s.cal tests you apply to quan.ta.ve data to determine the likelihood that the results
Today HW6 ques.ons? Next reading presenta.on: Friday (R25) Sta.s.cal methods Inferen.al sta.s.cs Inferen.al sta.s.cs: Sta.s.cal tests you apply to quan.ta.ve data to determine the likelihood that the results
Public Health / Public Works Introduc6on, reitera6on + Lessons 1-2. Pioneer Winter IDH 3034, IDH 4007
 Public Health / Public Works Introduc6on, reitera6on + Lessons 1-2 Pioneer Winter IDH 3034, IDH 4007 What s the purpose of this class? Learning Objec6ves Understand the principles of public health, epidemiology,
Piaget s Studies in Generaliza2on. Robert L. Campbell Department of Psychology Clemson University June 2, 2012
 Piaget s Studies in Generaliza2on Robert L. Campbell Department of Psychology Clemson University June 2, 2012 The triptych Recherches sur l abstrac.on réfléchissante (1971-1972; published 1977) Studies
Learning Objec1ves. Study Design Strategies. Cohort Studies 9/28/15
 9/28/15 Learning Objec1ves Describe the features, advantages and disadvantages of the observa1onal study designs Explain why the overall study design is important when evalua1ng studies & applying their
Pragma&c Clinical Trials
 Pragma&c Clinical Trials Susanne May, PhD Associate Professor Department of Biosta&s&cs, School of Public Health, University of Washington Preliminaries PLEASE ask ques&ons at any &me REALLY good clinical
OHDSI Tutorial: Design and implementation of a comparative cohort study in observational healthcare data
 OHDSI Tutorial: Design and implementation of a comparative cohort study in observational healthcare data Faculty: Martijn Schuemie (Janssen Research and Development) Marc Suchard (UCLA) Patrick Ryan (Janssen
Supplement 2. Use of Directed Acyclic Graphs (DAGs)
") Supplement 2. Use of Directed Acyclic Graphs (DAGs) Abstract This supplement describes how counterfactual theory is used to define causal effects and the conditions in which observed data can be used to
Supplement 2. Use of Directed Acyclic Graphs (DAGs) Abstract This supplement describes how counterfactual theory is used to define causal effects and the conditions in which observed data can be used to
Chapter 7: Descriptive Statistics
 Chapter Overview Chapter 7 provides an introduction to basic strategies for describing groups statistically. Statistical concepts around normal distributions are discussed. The statistical procedures of
Objective: To describe a new approach to neighborhood effects studies based on residential mobility and demonstrate this approach in the context of
 Objective: To describe a new approach to neighborhood effects studies based on residential mobility and demonstrate this approach in the context of neighborhood deprivation and preterm birth. Key Points:
Debate Regarding Oseltamivir Use for Seasonal and Pandemic Influenza
 Debate Regarding Oseltamivir Use for Seasonal and Pandemic Influenza Aeron Hurt WHO Collabora@ng Centre for Reference and Research on Influenza, Melbourne, Australia www.influenzacentre.org NA inhibitor
Confounding by indication developments in matching, and instrumental variable methods. Richard Grieve London School of Hygiene and Tropical Medicine
 Confounding by indication developments in matching, and instrumental variable methods Richard Grieve London School of Hygiene and Tropical Medicine 1 Outline 1. Causal inference and confounding 2. Genetic
Blue Cross Blue Shield of Michigan Building a Statewide PCMH Program: Design, Evalua>on Methods, and Results
 Blue Cross Blue Shield of Michigan Building a Statewide PCMH Program: Design, Evalua>on Methods, and Results Margaret Mason, MHSA Michael Paus6an, PhD, MS Amanda Markovitz, MPH 1 Overview of BCBSM Serving
Ac*vity Level Interpreta*on Of Forensic Evidence. Some defini*ons. NCSTL BJA Atlanta, August 2012
 Ac*vity Level Interpreta*on Of Forensic Evidence NCSTL BJA Atlanta, August 2012 Some defini*ons Offender: the person, who really commined a crime Suspect: a person thought to have commined a crime Trace:
MS&E 226: Small Data
 MS&E 226: Small Data Lecture 10: Introduction to inference (v2) Ramesh Johari ramesh.johari@stanford.edu 1 / 17 What is inference? 2 / 17 Where did our data come from? Recall our sample is: Y, the vector
Clinical Research Project Design and Guidelines: Choosing a Research Ques8on
 Clinical Research Project Design and Guidelines: Choosing a Research Ques8on Odunayo M. Oluwatosin, FMCS (Nig) Department of Plas?c Surgery University College Hospital Ibadan 1 Learning outcome: by the
Categories. Represent/store visual objects in terms of categories. What are categories? Why do we need categories?
 Represen'ng Objects Categories Represent/store visual objects in terms of categories. What are categories? Why do we need categories? Grouping of objects into sets where sets are called categories! Categories
Propensity Score Methods for Estimating Causality in the Absence of Random Assignment: Applications for Child Care Policy Research
 2012 CCPRC Meeting Methodology Presession Workshop October 23, 2012, 2:00-5:00 p.m. Propensity Score Methods for Estimating Causality in the Absence of Random Assignment: Applications for Child Care Policy
Key Statistical Considerations. Dr Delva Shamley
 Key Statistical Considerations Dr Delva Shamley WHAT STATISTICAL INFORMATION DO YOU NEED FOR A RESEARCH PROJECT? 1. Sample Size 2. Details of the type of data you will get from your outcome measures 3.
Understandable Statistics
 Understandable Statistics correlated to the Advanced Placement Program Course Description for Statistics Prepared for Alabama CC2 6/2003 2003 Understandable Statistics 2003 correlated to the Advanced Placement
The Mortality Effects of Re3rement: Evidence from Social Security Eligibility at Age 62
 The Mortality Effects of Re3rement: Evidence from Social Security Eligibility at Age 62 Maria D. Fitzpatrick Cornell University & NBER Timothy J. Moore George Washington University & NBER Funded by grants
Recording ac0vity in intact human brain. Recording ac0vity in intact human brain
 Recording ac0vity in intact human brain Recording ac0vity in intact human brain BIONB 4910 April 8, 2014 BIONB 4910 April 8, 2014 Objec0ves: - - review available recording methods EEG and MEG single unit
The Availability of Homeopathic Medicinal Products (HMPs) in Europe with reference to the Matrix Report
 in Europe with reference to the Matrix Report") The Availability of Homeopathic Medicinal Products (HMPs) in Europe with reference to the Matrix Report A presenta@on to the European Parliament CAM Interest Group 1 July 2015 By Stephen Gordon General
The Availability of Homeopathic Medicinal Products (HMPs) in Europe with reference to the Matrix Report A presenta@on to the European Parliament CAM Interest Group 1 July 2015 By Stephen Gordon General
Diurnal Pattern of Reaction Time: Statistical analysis
 Diurnal Pattern of Reaction Time: Statistical analysis Prepared by: Alison L. Gibbs, PhD, PStat Prepared for: Dr. Principal Investigator of Reaction Time Project January 11, 2015 Summary: This report gives
Development and Behavioral Gene2cs. PSC 113 Jeff Schank
 Development and Behavioral Gene2cs PSC 113 Jeff Schank Outline Unifactorial Methods Vasopressin Deficiency Mul2 factorial Methods (Quan2ta2ve Gene2cs) Heritability The IQ Controversy What are Intelligent
Causal Inference from Complex Observa4onal Data. Samantha Kleinberg
 Causal Inference from Complex Observa4onal Data Samantha Kleinberg samantha.kleinberg@stevens.edu Three key points We need causal knowledge Causes are hard to find It s not hopeless! Most striking, society
THE FRONT- LINE LEADER S INTERPRETATION OF EMOTIONAL INTELLIGENCE SKILLS. Tanya O Neill, Psy.D. April 2016
 THE FRONT- LINE LEADER S INTERPRETATION OF EMOTIONAL INTELLIGENCE SKILLS Tanya O Neill, Psy.D. April 2016 INTRODUCTION Emo
Discordant MIC Analysis: Tes5ng for Superiority within a Non- inferiority Trial
 Discordant MIC Analysis: Tes5ng for Superiority within a Non- inferiority Trial Dean Follmann, Erica BriDain, and John Powers Na5onal Ins5tute of Allergy and Infec5ous Diseases November 19, 2014 1 Current
For more information about how to cite these materials visit
 Author(s): Rajesh Mangrulkar, M.D., 2013 License: Unless otherwise noted, this material is made available under the terms of the Creative Commons Attribution Non-commercial Share Alike 3.0 License: http://creativecommons.org/licenses/by-nc-sa/3.0/
CDC's Tips From Former Smokers (Tips) Campaign and Its Impact on Quitlines
 Campaign and Its Impact on Quitlines") CDC's Tips From Former Smokers (Tips) Campaign and Its Impact on Quitlines Lei Zhang and Ann Malarcher Centers for Disease Control and Preven8on OSH Evalua6on Webinar March 31, 2015 The findings and conclusions
CDC's Tips From Former Smokers (Tips) Campaign and Its Impact on Quitlines Lei Zhang and Ann Malarcher Centers for Disease Control and Preven8on OSH Evalua6on Webinar March 31, 2015 The findings and conclusions
Simple Sensitivity Analyses for Matched Samples Thomas E. Love, Ph.D. ASA Course Atlanta Georgia https://goo.
 Goal of a Formal Sensitivity Analysis To replace a general qualitative statement that applies in all observational studies the association we observe between treatment and outcome does not imply causation
Identifying Engineering, Clinical and Patient's Metrics for Evaluating and Quantifying Performance of Brain- Machine Interface Systems
 Identifying Engineering, Clinical and Patient's Metrics for Evaluating and Quantifying Performance of Brain- Machine Interface Systems Jose Pepe L. Contreras-Vidal, Ph.D. Department of Electrical & Computer
Propensity Score Methods to Adjust for Bias in Observational Data SAS HEALTH USERS GROUP APRIL 6, 2018
 Propensity Score Methods to Adjust for Bias in Observational Data SAS HEALTH USERS GROUP APRIL 6, 2018 Institute Institute for Clinical for Clinical Evaluative Evaluative Sciences Sciences Overview 1.
Regression Discontinuity Analysis
 Regression Discontinuity Analysis A researcher wants to determine whether tutoring underachieving middle school students improves their math grades. Another wonders whether providing financial aid to low-income
Illinois Accountability Technical Advisory Committee (TAC) Academic Growth for Accountability
 Academic Growth for Accountability") Illinois Accountability Technical Advisory Committee (TAC) Academic December 18-19, 2017 Questions for the TAC What model features and characteris@cs are most important? What evidence should be collected
Illinois Accountability Technical Advisory Committee (TAC) Academic December 18-19, 2017 Questions for the TAC What model features and characteris@cs are most important? What evidence should be collected
Econometric Game 2012: infants birthweight?
 Econometric Game 2012: How does maternal smoking during pregnancy affect infants birthweight? Case A April 18, 2012 1 Introduction Low birthweight is associated with adverse health related and economic
A Practical Guide to Getting Started with Propensity Scores
 Paper 689-2017 A Practical Guide to Getting Started with Propensity Scores Thomas Gant, Keith Crowland Data & Information Management Enhancement (DIME) Kaiser Permanente ABSTRACT This paper gives tools
Key questions when starting an econometric project (Angrist & Pischke, 2009):
:") Econometric & other impact assessment approaches to policy analysis Part 1 1 The problem of causality in policy analysis Internal vs. external validity Key questions when starting an econometric project
Econometric & other impact assessment approaches to policy analysis Part 1 1 The problem of causality in policy analysis Internal vs. external validity Key questions when starting an econometric project
Chapter 13 Estimating the Modified Odds Ratio
 Chapter 13 Estimating the Modified Odds Ratio Modified odds ratio vis-à-vis modified mean difference To a large extent, this chapter replicates the content of Chapter 10 (Estimating the modified mean difference),
Lecture Slides. Elementary Statistics Eleventh Edition. by Mario F. Triola. and the Triola Statistics Series 1.1-1
 Lecture Slides Elementary Statistics Eleventh Edition and the Triola Statistics Series by Mario F. Triola 1.1-1 Chapter 1 Introduction to Statistics 1-1 Review and Preview 1-2 Statistical Thinking 1-3
Book review of Herbert I. Weisberg: Bias and Causation, Models and Judgment for Valid Comparisons Reviewed by Judea Pearl
 Book review of Herbert I. Weisberg: Bias and Causation, Models and Judgment for Valid Comparisons Reviewed by Judea Pearl Judea Pearl University of California, Los Angeles Computer Science Department Los
Propensity scores: what, why and why not?
 Propensity scores: what, why and why not? Rhian Daniel, Cardiff University @statnav Joint workshop S3RI & Wessex Institute University of Southampton, 22nd March 2018 Rhian Daniel @statnav/propensity scores:
TRIPLL Webinar: Propensity score methods in chronic pain research
 TRIPLL Webinar: Propensity score methods in chronic pain research Felix Thoemmes, PhD Support provided by IES grant Matching Strategies for Observational Studies with Multilevel Data in Educational Research
Nature Neuroscience: doi: /nn Supplementary Figure 1. Behavioral training.
 Supplementary Figure 1 Behavioral training. a, Mazes used for behavioral training. Asterisks indicate reward location. Only some example mazes are shown (for example, right choice and not left choice maze
Sensitivity Analysis in Observational Research: Introducing the E-value
 Sensitivity Analysis in Observational Research: Introducing the E-value Tyler J. VanderWeele Harvard T.H. Chan School of Public Health Departments of Epidemiology and Biostatistics 1 Plan of Presentation
Propensity Score Analysis to compare effects of radiation and surgery on survival time of lung cancer patients from National Cancer Registry (SEER)
") Propensity core Analysis to compare effects of radiation and surgery on survival time of lung cancer patients from National Cancer egistry (EE) Yan Wu Advisor: obert Pruzek Epidemiology and Biostatistics,
Propensity core Analysis to compare effects of radiation and surgery on survival time of lung cancer patients from National Cancer egistry (EE) Yan Wu Advisor: obert Pruzek Epidemiology and Biostatistics,
6/20/18. Prac+cum #1 Wednesday 6/27. Lecture Ques+on. Quick review. Establishing Causality. Causality
 6//8 Prac+cum # Wednesday 6/7 Agenda I. II. III. Reliability and Validity IV.Introduc6on to SPSS PART A (Paper-and-pencil 8 points) 3 short answer ques6ons (6 points each) mul+ple choice ques6ons (3 points
Propensity Score Matching with Limited Overlap. Abstract
 Propensity Score Matching with Limited Overlap Onur Baser Thomson-Medstat Abstract In this article, we have demostrated the application of two newly proposed estimators which accounts for lack of overlap
Propensity score methods : a simulation and case study involving breast cancer patients.
 University of Louisville ThinkIR: The University of Louisville's Institutional Repository Electronic Theses and Dissertations 5-2016 Propensity score methods : a simulation and case study involving breast
State-of-the-art Strategies for Addressing Selection Bias When Comparing Two or More Treatment Groups. Beth Ann Griffin Daniel McCaffrey
 State-of-the-art Strategies for Addressing Selection Bias When Comparing Two or More Treatment Groups Beth Ann Griffin Daniel McCaffrey 1 Acknowledgements This work has been generously supported by NIDA
Propensity score methods to adjust for confounding in assessing treatment effects: bias and precision
 ISPUB.COM The Internet Journal of Epidemiology Volume 7 Number 2 Propensity score methods to adjust for confounding in assessing treatment effects: bias and precision Z Wang Abstract There is an increasing
Local EBQ Course - PERU Epidemiology, Biostatistics & Qualitative Research Methods
 , Biostatistics & 20 places available Iquitos, Peru Apply now for this 3-week course! Applica7on procedure and criteria for academic eligibility and funding can be found on www.uantwerp.be/ebq-peru Deadline
Overview of Perspectives on Causal Inference: Campbell and Rubin. Stephen G. West Arizona State University Freie Universität Berlin, Germany
 Overview of Perspectives on Causal Inference: Campbell and Rubin Stephen G. West Arizona State University Freie Universität Berlin, Germany 1 Randomized Experiment (RE) Sir Ronald Fisher E(X Treatment
WDHS Curriculum Map Probability and Statistics. What is Statistics and how does it relate to you?
 WDHS Curriculum Map Probability and Statistics Time Interval/ Unit 1: Introduction to Statistics 1.1-1.3 2 weeks S-IC-1: Understand statistics as a process for making inferences about population parameters
MEASURES OF ASSOCIATION AND REGRESSION
 DEPARTMENT OF POLITICAL SCIENCE AND INTERNATIONAL RELATIONS Posc/Uapp 816 MEASURES OF ASSOCIATION AND REGRESSION I. AGENDA: A. Measures of association B. Two variable regression C. Reading: 1. Start Agresti
Module 14: Missing Data Concepts
 Module 14: Missing Data Concepts Jonathan Bartlett & James Carpenter London School of Hygiene & Tropical Medicine Supported by ESRC grant RES 189-25-0103 and MRC grant G0900724 Pre-requisites Module 3
Donna L. Coffman Joint Prevention Methodology Seminar
 Donna L. Coffman Joint Prevention Methodology Seminar The purpose of this talk is to illustrate how to obtain propensity scores in multilevel data and use these to strengthen causal inferences about mediation.
Business Statistics Probability
 Business Statistics The following was provided by Dr. Suzanne Delaney, and is a comprehensive review of Business Statistics. The workshop instructor will provide relevant examples during the Skills Assessment
Causal Inference: predic1on, explana1on, and interven1on
 Causal Inference: predic1on, explana1on, and interven1on Lecture : Mechanisms, Interven1ons, and Randomized Controlled Trials Samantha Kleinberg samantha.kleinberg@stevens.edu Blame Who s at fault for
PATRICK ANSAH PRINCIPAL INVESTIGATOR 22/02/2016
 Evaluation of the Men A specific antibody persistence in Ghanaian children more than five years after immunization with PsA-TT (2.5 μg, 5 μg, or 10 μg polysaccharide concentration) PATRICK ANSAH PRINCIPAL
Methods for Addressing Selection Bias in Observational Studies
 Methods for Addressing Selection Bias in Observational Studies Susan L. Ettner, Ph.D. Professor Division of General Internal Medicine and Health Services Research, UCLA What is Selection Bias? In the regression
STATISTICS AND RESEARCH DESIGN
 Statistics 1 STATISTICS AND RESEARCH DESIGN These are subjects that are frequently confused. Both subjects often evoke student anxiety and avoidance. To further complicate matters, both areas appear have
Mul$ Voxel Pa,ern Analysis (fmri) Mul$ Variate Pa,ern Analysis (more generally) Magic Voxel Pa,ern Analysis (probably not!)
 Mul$ Variate Pa,ern Analysis (more generally) Magic Voxel Pa,ern Analysis (probably not!)") Mul$ Voxel Pa,ern Analysis (fmri) Mul$ Variate Pa,ern Analysis (more generally) Magic Voxel Pa,ern Analysis (probably not!) all MVPA really shows is that there are places where, in most people s brain,
Mul$ Voxel Pa,ern Analysis (fmri) Mul$ Variate Pa,ern Analysis (more generally) Magic Voxel Pa,ern Analysis (probably not!) all MVPA really shows is that there are places where, in most people s brain,
Sheesh, Problem behavior!
 Crea%ng Communica%ve Competence through Func%onal Communica%on Training Jus*n Cooper Ed.D Robert Pennington Ph.D. BCBA- D Sheesh, Problem behavior! Challenging Behavior and Disabili%es Data suggest that
Exploring the Impact of Missing Data in Multiple Regression
 Exploring the Impact of Missing Data in Multiple Regression Michael G Kenward London School of Hygiene and Tropical Medicine 28th May 2015 1. Introduction In this note we are concerned with the conduct
Health Informa.cs. Lecture 9. Samantha Kleinberg
 Health Informa.cs Lecture 9 Samantha Kleinberg samantha.kleinberg@stevens.edu Next week: journal club For all papers: read, and prepare to comment on For your paper: Read the ar.cle (+ other references
NORTH SOUTH UNIVERSITY TUTORIAL 2
 NORTH SOUTH UNIVERSITY TUTORIAL 2 AHMED HOSSAIN,PhD Data Management and Analysis AHMED HOSSAIN,PhD - Data Management and Analysis 1 Correlation Analysis INTRODUCTION In correlation analysis, we estimate
Causal Methods for Observational Data Amanda Stevenson, University of Texas at Austin Population Research Center, Austin, TX
 Causal Methods for Observational Data Amanda Stevenson, University of Texas at Austin Population Research Center, Austin, TX ABSTRACT Comparative effectiveness research often uses non-experimental observational
THE RARE DISEASES CLINICAL RESEARCH NETWORK AS A NESTED CULTURAL COMMONS
 THE RARE DISEASES CLINICAL RESEARCH NETWORK AS A NESTED CULTURAL COMMONS Bre5 Frischmann, Benjamin N. Cardozo School of Law Katherine J. Strandburg, NYU School of Law Can Cui, NYU School of Law Case study
EDS- 544 Week 2: Concepts on theory and theories of instruc<on. Dr. Evrim Baran Middle East Technical University
 EDS- 544 Week 2: Concepts on theory and theories of instruc
Inference of patient-specific pathway activities from multi-dimensional cancer genomics data using PARADIGM. Bioinformatics, 2010
 Inference of patient-specific pathway activities from multi-dimensional cancer genomics data using PARADIGM. Bioinformatics, 2010 C.J.Vaske et al. May 22, 2013 Presented by: Rami Eitan Complex Genomic
Economic outcomes: Method for implementa5on
 Economic outcomes: Method for implementa5on Philippe Beutels Centre for Health Economics Research & Modelling Infec
Complier Average Causal Effect (CACE)
") Complier Average Causal Effect (CACE) Booil Jo Stanford University Methodological Advancement Meeting Innovative Directions in Estimating Impact Office of Planning, Research & Evaluation Administration
Complier Average Causal Effect (CACE) Booil Jo Stanford University Methodological Advancement Meeting Innovative Directions in Estimating Impact Office of Planning, Research & Evaluation Administration
Assessment of locomo,on ability
 Université catholique de Louvain Cliniques universitaires St-Luc Département de Médicine Physique et de Réadapta,on Introduc,on Assessment of locomo,on ability Development of ABILOCO - ABILOCO-Kids Caty
Resolving the PSA testing controversy. Professor Villis Marshall AC Professor Bruce Armstrong AM Professor Mark Frydenberg
 Resolving the PSA testing controversy Professor Villis Marshall AC Professor Bruce Armstrong AM Professor Mark Frydenberg Professor Villis Marshall AC Introduc)on Guidelines aim to inform tes)ng for the