What type of graph should I use?
|
|
|
- Katrina Terry
- 5 years ago
- Views:
Transcription
1 What type of graph should I use? Learning how to best visualize your data is almost as important as your statistical analysis. Science communication is increasingly important you have to learn how to communicate your results to the world. One of the first steps in good science communication is understanding which types of graphs to use based on the type of data you have. This practice exercise includes (1) resources to refresh your memory on types of data and visualization; (2) practice with recognizing the basics; and (3) practice applying your data visualization skills in a real-world context. Resources: Graph-Types-BSC-PST/ (note that there are far more examples here than what you d need to know for this class, but it s useful to see the variety that s out there) (Review: types of variables; ignore ratio) Practice with the Basics: 1. Complete the following chart, assuming you have an interval/continuous DV: Nominal IV, DV Type of Graph Description and Example Plot the mean of the DV for each value of the IV. Example Stata Code Ordinal IV, DV IV, DV Bar Chart If your IV was political party (Republican, Democrat) and your DV was contributions to the Sierra Club ($0, $100, ), you could plot the average contribution amount among Democrats in one bar and the average contribution amount among Republicans in the other bar. graph bar (mean) DVname, over(ivname) scatter DVname IVname 2. In the Colbert Bump reading, Professor Fowler tested whether coming on the Colbert Report caused an increase in campaign contributions. a. What is the Independent Variable? b. What is the Dependent Variable? c. What type of variable is the IV?
2 d. What type of variable is the DV? e. What kind of graph would you use to visualize the IV? f. What kind of graph would you use to visualize the DV? g. What kind of graph would you use to visualize the relationship between the IV and the DV? Practice Application: The following is an excerpt from the New York Times ( But there is one quirk that consistently puzzles America s fans and critics alike. Why, they ask, does it experience so many mass shootings? Perhaps, some speculate, it is because American society is unusually violent. Or its racial divisions have frayed the bonds of society. Or its citizens lack proper mental care under a health care system that draws frequent derision abroad. These explanations share one thing in common: Though seemingly sensible, all have been debunked by research on shootings elsewhere in the world. Instead, an ever-growing body of research consistently reaches the same conclusion. The only variable that can explain the high rate of mass shootings in America is its astronomical number of guns. One way the article proposes to understand this correlation is to gather data on gun ownership and the number of mass shooters. They collect this information for a number of countries using a survey run by the University of Alabama in The survey has data on the number of guns owned per country (for example, the U.S. owns 270 million) and the number of mass shooters per country from (for example, the U.S. has had 90 mass shooters during this period). 1. What is the IV? 2. What is the DV?
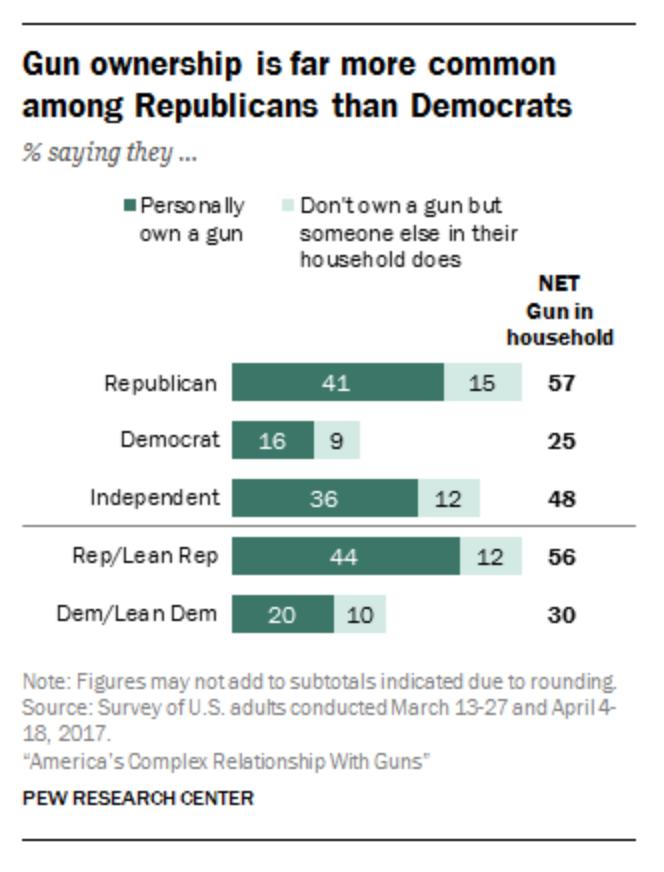
3 3. What type of variable (nominal/ordinal/interval) is the IV? 4. What type of variable (nominal/ordinal/interval) is the DV? While this correlation is interesting, the above article doesn t tell us anything about who chooses to own a gun. Luckily, the Pew Research Center collected this information in 2017 ( One aspect of gun ownership they are interested in is partisanship. They expect that self-identified Democrats will be less likely to own guns, given that the party has historically been a proponent of gun control. They collect information by asking people to identify their partisanship (respondents can choose Democrat, Republicans, and Independent) and whether or not they or someone in their household owns a gun (respondents can respond personally own a gun, don t own a gun but someone in their household owns a gun, or no one in their household owns a gun). They want to show how the percentage of people who own a gun varies by party affiliation. 1. What is the IV? 2. What is the DV? 3. What type of variable (nominal/ordinal/interval) is the IV? 4. What type of variable (nominal/ordinal/interval) is the DV?
4 Answer Key Practice with the Basics: 1. Complete the following chart, assuming you have an interval/continuous DV: Nominal IV, DV Ordinal IV, DV IV, DV Type of Graph Bar Chart Bar Chart Scatterplot Description and Example Plot the mean of the DV for each value of the IV. If your IV was political party (Republican, Democrat) and your DV was contributions to the Sierra Club ($0, $100, ), you could plot the average contribution amount among Democrats in one bar and the average contribution amount among Republicans in the other bar. Plot the mean of the DV for each value of the IV If your IV was ideology (Very liberal, liberal, moderate, conservative, very conservative) and your DV was contributions to the Sierra Club ($0, $100, ), you could plot the mean contribution amount made by those who are very liberal, the mean contribution amount made by those who are liberal, the mean contribution amount made by those who are moderate, etc. Plot the IV on the X-Axis and the DV on the Y-Axis If your IV was age (18 years, 20 years, 50 years, 65 years, etc.) and your DV was contributions to the Sierra Club ($0, $100, $1000, ), you would plot the X-Y coordinates for each observation. For instance, if you had an 18 year old who contributed $50, you d have a point at X=18, Y=50. Example Stata Code graph bar (mean) DVname, over(ivname) graph bar (mean) DVname, over(ivname) scatter DVname IVname 2. In the Colbert Bump reading, Professor Fowler tested whether coming on the Colbert Report caused an increase in campaign contributions. a. What is the Independent Variable? i. Going on the Colbert Report (yes, no) b. What is the Dependent Variable?
5 Practice Application: i. Campaign contributions ($0, $10, $1000, ) c. What type of variable is the IV? d. What type of variable is the DV? e. What kind of graph would you use to visualize the relationship between the IV and the DV? The following is an excerpt from the New York Times ( But there is one quirk that consistently puzzles America s fans and critics alike. Why, they ask, does it experience so many mass shootings? Perhaps, some speculate, it is because American society is unusually violent. Or its racial divisions have frayed the bonds of society. Or its citizens lack proper mental care under a health care system that draws frequent derision abroad. These explanations share one thing in common: Though seemingly sensible, all have been debunked by research on shootings elsewhere in the world. Instead, an ever-growing body of research consistently reaches the same conclusion. The only variable that can explain the high rate of mass shootings in America is its astronomical number of guns. One way the article proposes to understand this correlation is to gather data on gun ownership and the number of mass shooters. They collect this information for a number of countries using a survey run by the University of Alabama in The survey has data on the number of guns owned per country (for example, the U.S. owns 270 million) and the number of mass shooters per country from (for example, the U.S. has had 90 mass shooters during this period). 1. What is the IV? The number of guns owned (per country) 2. What is the DV? The number of mass shootings (per country) 3. What type of variable (nominal/ordinal/interval) is the IV? 4. What type of variable (nominal/ordinal/interval) is the DV? Because both variables are continuous, I can use a scatterplot. I can plot the number of guns owned (my IV) on the X-axis and the number of mass shootings (my DV) on the Y-axis. Scatterplots are helpful for visualizing the relationship between continuous variables because
6 each dot or unit of observation is one country. By looking at each country dot, I can see both the country s number of guns and their number of mass shootings. While this correlation is interesting, the above article doesn t tell us anything about who chooses to own a gun. Luckily, the Pew Research Center collected this information in 2017 ( One aspect of gun ownership they are interested in is partisanship. They expect that self-identified Democrats will be less likely to own guns, given that the party has historically been a proponent of gun control. They collect information by asking people to identify their partisanship (respondents can choose Democrat, Republicans, and Independent) and whether or not they or someone in their household owns a gun (respondents can respond personally own a gun, don t own a gun but someone in their household owns a gun, or no one in their household owns a gun). They want to show how the percentage of people who own a gun varies by party affiliation. 1. What is the IV? Partisanship 2. What is the DV? Whether someone in the household owns a gun 3. What type of variable (nominal/ordinal/interval) is the IV? Nominal 4. What type of variable (nominal/ordinal/interval) is the DV? Nominal Because the independent variable is nominal, I can only display the data by groups. That means I need to calculate a common statistic for each group separately. One way to look at how the groups differ in their gun ownership is to calculate the percentage of gun owners for each category separately. I can calculate the percentage of Republicans who own a gun and compare it the percentage of Democrats who own a gun. The best way to display these percentages side-by-side is a bar graph. In the bar graph, each bar is a category of the IV and the Y-axis is a summary statistic of the DV (in this case percentage, but in other examples it could also be a mean, median, etc.)
7
Unit 7 Comparisons and Relationships
 Unit 7 Comparisons and Relationships Objectives: To understand the distinction between making a comparison and describing a relationship To select appropriate graphical displays for making comparisons
Announcement. Homework #2 due next Friday at 5pm. Midterm is in 2 weeks. It will cover everything through the end of next week (week 5).
.") Announcement Homework #2 due next Friday at 5pm. Midterm is in 2 weeks. It will cover everything through the end of next week (week 5). Political Science 15 Lecture 8: Descriptive Statistics (Part 1) Data
Announcement Homework #2 due next Friday at 5pm. Midterm is in 2 weeks. It will cover everything through the end of next week (week 5). Political Science 15 Lecture 8: Descriptive Statistics (Part 1) Data
CHAPTER 2. MEASURING AND DESCRIBING VARIABLES
 4 Chapter 2 CHAPTER 2. MEASURING AND DESCRIBING VARIABLES 1. A. Age: name/interval; military dictatorship: value/nominal; strongly oppose: value/ ordinal; election year: name/interval; 62 percent: value/interval;
AP Psych - Stat 1 Name Period Date. MULTIPLE CHOICE. Choose the one alternative that best completes the statement or answers the question.
 AP Psych - Stat 1 Name Period Date MULTIPLE CHOICE. Choose the one alternative that best completes the statement or answers the question. 1) In a set of incomes in which most people are in the $15,000
POL 242Y Final Test (Take Home) Name
 Name") POL 242Y Final Test (Take Home) Name_ Due August 6, 2008 The take-home final test should be returned in the classroom (FE 36) by the end of the class on August 6. Students who fail to submit the final
POL 242Y Final Test (Take Home) Name_ Due August 6, 2008 The take-home final test should be returned in the classroom (FE 36) by the end of the class on August 6. Students who fail to submit the final
AP Psych - Stat 2 Name Period Date. MULTIPLE CHOICE. Choose the one alternative that best completes the statement or answers the question.
 AP Psych - Stat 2 Name Period Date MULTIPLE CHOICE. Choose the one alternative that best completes the statement or answers the question. 1) In a set of incomes in which most people are in the $15,000
full file at
 Chapter 01 What Is Statistics? True / False Questions 1. A population is a collection of all individuals, objects, or measurements of interest. True False 2. Statistics are used as a basis for making decisions.
Pre-Test Unit 9: Descriptive Statistics
 Pre-Test Unit 9: Descriptive Statistics You may use a calculator. The following table shows how many text messages different students sent this week. Answer the following questions using the table. 20
Student name: SOCI 420 Advanced Methods of Social Research Fall 2017
 SOCI 420 Advanced Methods of Social Research Fall 2017 EXAM 1 RUBRIC Instructor: Ernesto F. L. Amaral, Assistant Professor, Department of Sociology Date: October 12, 2017 (Thursday) Section 904: 2:20 3:35pm
Statistics Success Stories and Cautionary Tales
 Course Goals STATISTICS 8 Professor Jessica Utts http://www.ics.uci.edu/~jutts/8 Help you understand and appreciate how statistics affects your daily life. Teach you tools for understanding statistics
Distributions and Samples. Clicker Question. Review
 Distributions and Samples Clicker Question The major difference between an observational study and an experiment is that A. An experiment manipulates features of the situation B. An experiment does not
Business Statistics Probability
 Business Statistics The following was provided by Dr. Suzanne Delaney, and is a comprehensive review of Business Statistics. The workshop instructor will provide relevant examples during the Skills Assessment
Chapter 01 What Is Statistics?
 Chapter 01 What Is Statistics? True / False Questions 1. A population is a collection of all individuals, objects, or measurements of interest. 2. Statistics are used as a basis for making decisions. 3.
Homework #2 is due next Friday at 5pm.
 Homework #2 is due next Friday at 5pm. Political Science 15 Lecture 7: Measurement (Part 2) Topics in Measurement Unit of analysis Operational definitions Accuracy (validity and reliability) Precision
Graphic Organizers. Compare/Contrast. 1. Different. 2. Different. Alike
 1 Compare/Contrast When you compare and contrast people, places, objects, or ideas, you are looking for how they are alike and how they are different. One way to organize your information is to use a Venn
Bouncing Ball Lab. Name
 Bouncing Ball Lab Name Scientists use an organized set of steps when they solve problems or perform investigations. This organized set of steps is called the Scientific Method. There are many versions
PubHlth Introductory Biostatistics Fall 2013 Examination 1 - REQURED Due Monday September 30, 2013
 PubHlth 540 Fall 2013 Exam I Page 1 of 10 PubHlth 540 - Introductory Biostatistics Fall 2013 Examination 1 - REQURED Due Monday September 30, 2013 Before you begin: This is a take-home exam. You are welcome
Political Science 15, Winter 2014 Final Review
 Political Science 15, Winter 2014 Final Review The major topics covered in class are listed below. You should also take a look at the readings listed on the class website. Studying Politics Scientifically
UNOBTRUSIVE RESEARCH 23/11/ Content Analysis. Sociological Research Methods
 UNOBTRUSIVE RESEARCH Sociological Research Methods Experiments and surveys Involve intrusions on subjects lives [Obtrusive]: intrude by imposing one s opinions on others Can conduct research without intruding
GCSE PSYCHOLOGY UNIT 2 FURTHER RESEARCH METHODS
 GCSE PSYCHOLOGY UNIT 2 FURTHER RESEARCH METHODS GCSE PSYCHOLOGY UNIT 2 SURVEYS SURVEYS SURVEY = is a method used for collecting information from a large number of people by asking them questions, either
Key findings from a telephone survey of 200 registered voters in New Orleans, Louisiana, with 60 cell phone interviews, conducted December 16-18, 2014
 Key findings from a telephone survey of 200 registered voters in New Orleans, Louisiana, with 60 cell phone interviews, conducted December 16-18, 2014 Project #141630 Public Opinion Strategies is pleased
QPM Lab 9: Contingency Tables and Bivariate Displays in R
 QPM Lab 9: Contingency Tables and Bivariate Displays in R Department of Political Science Washington University, St. Louis November 3-4, 2016 QPM Lab 9: Contingency Tables and Bivariate Displays in R 1
Scatter Plots and Association
 ? LESSON 1.1 ESSENTIAL QUESTION Scatter Plots and Association How can you construct and interpret scatter plots? Measurement and data 8.11.A Construct a scatterplot and describe the observed data to address
Displaying the Order in a Group of Numbers Using Tables and Graphs
 SIXTH EDITION 1 Displaying the Order in a Group of Numbers Using Tables and Graphs Statistics (stats) is a branch of mathematics that focuses on the organization, analysis, and interpretation of a group
Lecture (chapter 1): Introduction
: Introduction") Lecture (chapter 1): Introduction Ernesto F. L. Amaral January 17, 2018 Advanced Methods of Social Research (SOCI 420) Source: Healey, Joseph F. 2015. Statistics: A Tool for Social Research. Stamford:
Lecture (chapter 1): Introduction Ernesto F. L. Amaral January 17, 2018 Advanced Methods of Social Research (SOCI 420) Source: Healey, Joseph F. 2015. Statistics: A Tool for Social Research. Stamford:
Describe what is meant by a placebo Contrast the double-blind procedure with the single-blind procedure Review the structure for organizing a memo
 Please note the page numbers listed for the Lind book may vary by a page or two depending on which version of the textbook you have. Readings: Lind 1 11 (with emphasis on chapters 10, 11) Please note chapter
The Effectiveness of Captopril
 Lab 7 The Effectiveness of Captopril In the United States, pharmaceutical manufacturers go through a very rigorous process in order to get their drugs approved for sale. This process is designed to determine
Readings: Textbook readings: OpenStax - Chapters 1 11 Online readings: Appendix D, E & F Plous Chapters 10, 11, 12 and 14
 Readings: Textbook readings: OpenStax - Chapters 1 11 Online readings: Appendix D, E & F Plous Chapters 10, 11, 12 and 14 Still important ideas Contrast the measurement of observable actions (and/or characteristics)
Day 11: Measures of Association and ANOVA
 Day 11: Measures of Association and ANOVA Daniel J. Mallinson School of Public Affairs Penn State Harrisburg mallinson@psu.edu PADM-HADM 503 Mallinson Day 11 November 2, 2017 1 / 45 Road map Measures of
Chapter 4: More about Relationships between Two-Variables Review Sheet
 Review Sheet 4. Which of the following is true? A) log(ab) = log A log B. D) log(a/b) = log A log B. B) log(a + B) = log A + log B. C) log A B = log A log B. 5. Suppose we measure a response variable Y
How to use: ONLINE TOOLS & How to interpret: RESULTS FROM GRAPHS
 How to use: ONLINE TOOLS & How to interpret: RESULTS FROM GRAPHS 2 V-Dem Online Analysis Tools The tools allow users to analyze more than 300 indicators and indices of democracy in 68 countries from the
Student name: SOCI 420 Advanced Methods of Social Research Fall 2017
 SOCI 420 Advanced Methods of Social Research Fall 2017 EXAM 1 RUBRIC Instructor: Ernesto F. L. Amaral, Assistant Professor, Department of Sociology Date: October 12, 2017 (Thursday) Section 903: 9:35 10:50am
Still important ideas
 Readings: OpenStax - Chapters 1 13 & Appendix D & E (online) Plous Chapters 17 & 18 - Chapter 17: Social Influences - Chapter 18: Group Judgments and Decisions Still important ideas Contrast the measurement
Chapter 7: Descriptive Statistics
 Chapter Overview Chapter 7 provides an introduction to basic strategies for describing groups statistically. Statistical concepts around normal distributions are discussed. The statistical procedures of
Statistics and Epidemiology Practice Questions
 1. Which of the following is not considered a measure of central tendency? a. Median b. Range c. Mode d. Average 2. Given the following set of values, what is the median? 4 5 9 3 8 3 7 1 5 3 a. 3 b. 5
Chapter Eight: Multivariate Analysis
 Chapter Eight: Multivariate Analysis Up until now, we have covered univariate ( one variable ) analysis and bivariate ( two variables ) analysis. We can also measure the simultaneous effects of two or
Planning and Carrying Out an Investigation. Name:
 Planning and Carrying Out an Investigation Name: Part A: Asking Questions (NGSS Practice #1) Topic or Phenomenon: 1. What am I wondering? What questions do I have about the topic/phenomenon? (why, when,
Still important ideas
 Readings: OpenStax - Chapters 1 11 + 13 & Appendix D & E (online) Plous - Chapters 2, 3, and 4 Chapter 2: Cognitive Dissonance, Chapter 3: Memory and Hindsight Bias, Chapter 4: Context Dependence Still
[POLS 4150] R, Randomization and Sampling
![[POLS 4150] R, Randomization and Sampling](/thumbs/86/94871484.jpg "[POLS 4150] R, Randomization and Sampling") Professor Jason Anastasopoulos ljanastas@uga.edu January 12, 2017 Variables and their measurement When we talk about political phenomena and their relationships we are talking about variables. Variables
Professor Jason Anastasopoulos ljanastas@uga.edu January 12, 2017 Variables and their measurement When we talk about political phenomena and their relationships we are talking about variables. Variables
Describe what is meant by a placebo Contrast the double-blind procedure with the single-blind procedure Review the structure for organizing a memo
 Please note the page numbers listed for the Lind book may vary by a page or two depending on which version of the textbook you have. Readings: Lind 1 11 (with emphasis on chapters 5, 6, 7, 8, 9 10 & 11)
Describe what is meant by a placebo Contrast the double-blind procedure with the single-blind procedure Review the structure for organizing a memo
 Business Statistics The following was provided by Dr. Suzanne Delaney, and is a comprehensive review of Business Statistics. The workshop instructor will provide relevant examples during the Skills Assessment
NORTH SOUTH UNIVERSITY TUTORIAL 1
 NORTH SOUTH UNIVERSITY TUTORIAL 1 REVIEW FROM BIOSTATISTICS I AHMED HOSSAIN,PhD Data Management and Analysis AHMED HOSSAIN,PhD - Data Management and Analysis 1 DATA TYPES/ MEASUREMENT SCALES Categorical:
Center for Urban Initiatives and Research Wisconsin Public Health Survey December 2011 N=626. Frequency Tables (Weighted)
") Center for Urban Initiatives and Research Wisconsin Public Health Survey December 2011 N=626 Tables (Weighted) Section 1: Opinions about chronic disease, health care funding, and chronic disease-related
Center for Urban Initiatives and Research Wisconsin Public Health Survey December 2011 N=626 Tables (Weighted) Section 1: Opinions about chronic disease, health care funding, and chronic disease-related
Math for Liberal Arts MAT 110: Chapter 5 Notes
 Math for Liberal Arts MAT 110: Chapter 5 Notes Statistical Reasoning David J. Gisch Fundamentals of Statistics Two Definitions of Statistics Statistics is the science of collecting, organizing, and interpreting
1. What is the difference between positive and negative correlations?
 1. What is the difference between positive and negative correlations? 2. Can correlations make predictions? 3. Can correlations prove causation? 4. What are illusory correlations? We can take data from
Causality and Treatment Effects
 Causality and Treatment Effects Prof. Jacob M. Montgomery Quantitative Political Methodology (L32 363) October 24, 2016 Lecture 13 (QPM 2016) Causality and Treatment Effects October 24, 2016 1 / 32 Causal
How to interpret scientific & statistical graphs
 How to interpret scientific & statistical graphs Theresa A Scott, MS Department of Biostatistics theresa.scott@vanderbilt.edu http://biostat.mc.vanderbilt.edu/theresascott 1 A brief introduction Graphics:
THE DIVERSITY OF SAMPLES FROM THE SAME POPULATION
 CHAPTER 19 THE DIVERSITY OF SAMPLES FROM THE SAME POPULATION Narrative: Bananas Suppose a researcher asks the question: What is the average weight of bananas selected for purchase by customers in grocery
Readings: Textbook readings: OpenStax - Chapters 1 4 Online readings: Appendix D, E & F Online readings: Plous - Chapters 1, 5, 6, 13
 Readings: Textbook readings: OpenStax - Chapters 1 4 Online readings: Appendix D, E & F Online readings: Plous - Chapters 1, 5, 6, 13 Introductory comments Describe how familiarity with statistical methods
Readings: Textbook readings: OpenStax - Chapters 1 13 (emphasis on Chapter 12) Online readings: Appendix D, E & F
 Online readings: Appendix D, E & F") Readings: Textbook readings: OpenStax - Chapters 1 13 (emphasis on Chapter 12) Online readings: Appendix D, E & F Plous Chapters 17 & 18 Chapter 17: Social Influences Chapter 18: Group Judgments and Decisions
Readings: Textbook readings: OpenStax - Chapters 1 13 (emphasis on Chapter 12) Online readings: Appendix D, E & F Plous Chapters 17 & 18 Chapter 17: Social Influences Chapter 18: Group Judgments and Decisions
+/ 4.0%. Strong oppose legalization. Value % 13.7% 6.8% 41.7% 36.3% 12.9% 5.9% 44.9%
 Colorado Cannabis Survey The following questions are from a survey of 6000 Colorado registered voters. The interviews were conductedd via land lines and cell phones on 8 July, 05. The sampling error for
Summary Report: The Effectiveness of Online Ads: A Field Experiment
 Summary Report: The Effectiveness of Online Ads: A Field Experiment Alexander Coppock and David Broockman September 16, 215 This document is a summary of experimental findings only. Additionally, this
Biostatistics. Donna Kritz-Silverstein, Ph.D. Professor Department of Family & Preventive Medicine University of California, San Diego
 Biostatistics Donna Kritz-Silverstein, Ph.D. Professor Department of Family & Preventive Medicine University of California, San Diego (858) 534-1818 dsilverstein@ucsd.edu Introduction Overview of statistical
The knowledge and skills involved in clinical audit
 The knowledge and skills involved in clinical A list of possible knowledge and skills related to clinical is in the box. Knowledge and skills involved in clinical Knowledge Skills The clinical process
Daily Internet Tracking Survey Topline May 2-June and Nov. 22-Dec
 Daily Internet Tracking Survey Topline May 2-June 30 and Nov. 22-Dec. 21 Princeton Survey Research Associates for the Pew Internet in American Life Project Q6 Do you ever go online to access the Internet
DEPARTMENT OF POLITICAL SCIENCE AND INTERNATIONAL RELATIONS Research Methods Posc 302 ANALYSIS OF SURVEY DATA
 DEPARTMENT OF POLITICAL SCIENCE AND INTERNATIONAL RELATIONS Research Methods Posc 302 ANALYSIS OF SURVEY DATA I. TODAY S SESSION: A. Second steps in data analysis and interpretation 1. Examples and explanation
Paper Airplanes & Scientific Methods
 Paper Airplanes & Scientific Methods Scientific Inquiry refers to the many different ways in which scientists investigate the world. Scientific investigations are done to answer questions and solve problems.
Omnibus Poll April 11-12, 2013
 1. Feminist or anti-feminist Do you consider yourself a feminist, an anti-feminist, or neither? Gender Age Party ID Voter Registration Total Male Female 18-29 30-44 45-64 65+ Democrat Independent Republican
Statistics is the science of collecting, organizing, presenting, analyzing, and interpreting data to assist in making effective decisions
 Readings: OpenStax Textbook - Chapters 1 5 (online) Appendix D & E (online) Plous - Chapters 1, 5, 6, 13 (online) Introductory comments Describe how familiarity with statistical methods can - be associated
Preliminary Report on Simple Statistical Tests (t-tests and bivariate correlations)
") Preliminary Report on Simple Statistical Tests (t-tests and bivariate correlations) After receiving my comments on the preliminary reports of your datasets, the next step for the groups is to complete
Preliminary Report on Simple Statistical Tests (t-tests and bivariate correlations) After receiving my comments on the preliminary reports of your datasets, the next step for the groups is to complete
Biostatistics for Med Students. Lecture 1
 Biostatistics for Med Students Lecture 1 John J. Chen, Ph.D. Professor & Director of Biostatistics Core UH JABSOM JABSOM MD7 February 14, 2018 Lecture note: http://biostat.jabsom.hawaii.edu/education/training.html
Modest Rise in Percentage Favoring General Legalization BROAD PUBLIC SUPPORT FOR LEGALIZING MEDICAL MARIJUANA
 NEWS Release 1615 L Street, N.W., Suite 700 Washington, D.C. 20036 Tel (202) 419-4350 Fax (202) 419-4399 FOR IMMEDIATE RELEASE: Thursday April 1, 2010 Modest Rise in Percentage Favoring General Legalization
HOW TO IDENTIFY A RESEARCH QUESTION? How to Extract a Question from a Topic that Interests You?
 Stefan Götze, M.A., M.Sc. LMU HOW TO IDENTIFY A RESEARCH QUESTION? I How to Extract a Question from a Topic that Interests You? I assume you currently have only a vague notion about the content of your
5.3: Associations in Categorical Variables
 5.3: Associations in Categorical Variables Now we will consider how to use probability to determine if two categorical variables are associated. Conditional Probabilities Consider the next example, where
Measuring the User Experience
 Measuring the User Experience Collecting, Analyzing, and Presenting Usability Metrics Chapter 2 Background Tom Tullis and Bill Albert Morgan Kaufmann, 2008 ISBN 978-0123735584 Introduction Purpose Provide
God and Society in North America, 1996 Generosity Questions From
 God and Society in North America, 1996 Generosity Questions From http://www.thearda.com/archive/files/descriptions/queen%27s.asp 79) This next set of questions deals with your civic and political activities.
Chapter 4: More about Relationships between Two-Variables
 1. Which of the following scatterplots corresponds to a monotonic decreasing function f(t)? A) B) C) D) G Chapter 4: More about Relationships between Two-Variables E) 2. Which of the following transformations
Human intuition is remarkably accurate and free from error.
 Human intuition is remarkably accurate and free from error. 3 Most people seem to lack confidence in the accuracy of their beliefs. 4 Case studies are particularly useful because of the similarities we
11/18/2013. Correlational Research. Correlational Designs. Why Use a Correlational Design? CORRELATIONAL RESEARCH STUDIES
 Correlational Research Correlational Designs Correlational research is used to describe the relationship between two or more naturally occurring variables. Is age related to political conservativism? Are
What Science Is and Is Not
 What Is Science? Key Questions What are the goals of science? What procedures are at the core of scientific methodology? Vocabulary science observation inference hypothesis controlled experiment independent
1 PEW RESEARCH CENTER
 1 About the Survey The analysis in this report is based on telephone interviews conducted May 15-18, 2014 among a national sample of 1,000 adults, 18 years of age or older living in the continental United
M 140 Test 1 A Name (1 point) SHOW YOUR WORK FOR FULL CREDIT! Problem Max. Points Your Points Total 75
 SHOW YOUR WORK FOR FULL CREDIT! Problem Max. Points Your Points Total 75") M 140 est 1 A Name (1 point) SHOW YOUR WORK FOR FULL CREDI! Problem Max. Points Your Points 1-10 10 11 10 12 3 13 4 14 18 15 8 16 7 17 14 otal 75 Multiple choice questions (1 point each) For questions
M 140 est 1 A Name (1 point) SHOW YOUR WORK FOR FULL CREDI! Problem Max. Points Your Points 1-10 10 11 10 12 3 13 4 14 18 15 8 16 7 17 14 otal 75 Multiple choice questions (1 point each) For questions
q2_2 MULTIPLE CHOICE. Choose the one alternative that best completes the statement or answers the question.
 q2_2 MULTIPLE CHOICE. Choose the one alternative that best completes the statement or answers the question. A sporting goods retailer conducted a customer survey to determine its customers primary reason
Medical Statistics 1. Basic Concepts Farhad Pishgar. Defining the data. Alive after 6 months?
 Medical Statistics 1 Basic Concepts Farhad Pishgar Defining the data Population and samples Except when a full census is taken, we collect data on a sample from a much larger group called the population.
Section 3.2 Least-Squares Regression
 Section 3.2 Least-Squares Regression Linear relationships between two quantitative variables are pretty common and easy to understand. Correlation measures the direction and strength of these relationships.
Probability and Statistics. Chapter 1
 Probability and Statistics Chapter 1 Individuals and Variables Individuals and Variables Individuals are objects described by data. Individuals and Variables Individuals are objects described by data.
North Carolina Survey Results
 North Carolina Survey Results Q1 Q2 Q3 Q4 Q5 Generally speaking, do you think the use of marijuana should be, or not? Marijuana should be...40% Marijuana should be...47%...13% Do you think doctors should
7. Bivariate Graphing
 1 7. Bivariate Graphing Video Link: https://www.youtube.com/watch?v=shzvkwwyguk&index=7&list=pl2fqhgedk7yyl1w9tgio8w pyftdumgc_j Section 7.1: Converting a Quantitative Explanatory Variable to Categorical
How to Address Firearm Safety with the Rural Suicidal Patient
 How to Address Firearm Safety with the Rural Suicidal Patient Laura Pennavaria, MD FAAFP Susan G. Keys, Ph.D. Forum on Aging in Rural Oregon, 2018 Objectives 1. Increase understanding of the epidemiology
Further Mathematics 2018 CORE: Data analysis Chapter 3 Investigating associations between two variables
 Chapter 3: Investigating associations between two variables Further Mathematics 2018 CORE: Data analysis Chapter 3 Investigating associations between two variables Extract from Study Design Key knowledge
Population. Sample. AP Statistics Notes for Chapter 1 Section 1.0 Making Sense of Data. Statistics: Data Analysis:
 Section 1.0 Making Sense of Data Statistics: Data Analysis: Individuals objects described by a set of data Variable any characteristic of an individual Categorical Variable places an individual into one
Unit 8 Day 1 Correlation Coefficients.notebook January 02, 2018
 [a] Welcome Back! Please pick up a new packet Get a Chrome Book Complete the warm up Choose points on each graph and find the slope of the line. [b] Agenda 05 MIN Warm Up 25 MIN Notes Correlation 15 MIN
Theory. = an explanation using an integrated set of principles that organizes observations and predicts behaviors or events.
 Definition Slides Hindsight Bias = the tendency to believe, after learning an outcome, that one would have foreseen it. Also known as the I knew it all along phenomenon. Critical Thinking = thinking that
Stat Quiz 6 11/30/2012
 Stat 225 - Quiz 6 11/30/2012 Name You have 20 minutes to complete this quiz. Show sufficient work to receive full credit. If a decimal answer is not exact, please round to 4 non-zero decimal places. 1.
Undertaking statistical analysis of
 Descriptive statistics: Simply telling a story Laura Delaney introduces the principles of descriptive statistical analysis and presents an overview of the various ways in which data can be presented by
BIVARIATE DATA ANALYSIS
 BIVARIATE DATA ANALYSIS Sometimes, statistical studies are done where data is collected on two variables instead of one in order to establish whether there is a relationship between the two variables.
SCATTER PLOTS AND TREND LINES
 1 SCATTER PLOTS AND TREND LINES LEARNING MAP INFORMATION STANDARDS 8.SP.1 Construct and interpret scatter s for measurement to investigate patterns of between two quantities. Describe patterns such as
Supporting Online Material for
 www.sciencemag.org/cgi/content/full/315/5812/619/dc1 Supporting Online Material for Dimensions of Mind Perception Heather M. Gray,* Kurt Gray, Daniel M. Wegner *To whom correspondence should be addressed.
Chapter Eight: Multivariate Analysis
 Chapter Eight: Multivariate Analysis Up until now, we have covered univariate ( one variable ) analysis and bivariate ( two variables ) analysis. We can also measure the simultaneous effects of two or
Experimental Design There is no recovery from poorly collected data!
 Experimental Design There is no recovery from poorly collected data! Vocabulary List n Look over the list of words. n Count how many you feel you know. n Place a dot on the number line above that number.
Variable Measurement, Norms & Differences
 Variable Measurement, Norms & Differences 1 Expectations Begins with hypothesis (general concept) or question Create specific, testable prediction Prediction can specify relation or group differences Different
Survey of U.S. Adult Cigarette Smokers
 Survey of U.S. Adult Cigarette Smokers Topline Report 13 October 2016 ADULT CIGARETTE SMOKERS (U.S. NATIONWIDE): n=1,000 online surveys S1. First, which of the following ranges includes your age? 0% Under
Chapter 3: Examining Relationships
 Name Date Per Key Vocabulary: response variable explanatory variable independent variable dependent variable scatterplot positive association negative association linear correlation r-value regression
What Is Science? Lesson Overview. Lesson Overview. 1.1 What Is Science?
 Lesson Overview 1.1 What Science Is and Is Not What are the goals of science? One goal of science is to provide natural explanations for events in the natural world. Science also aims to use those explanations
Tobacco Company Political Action Committee (PAC) Contributions to Federal Candidates by Election Cycle, PAC, and Party,
 Contributions to Federal Candidates by Election Cycle, PAC, and Party,") Tobacco Company Political Action Committee (PAC) Contributions to Federal Candidates by Election Cycle, PAC, and Party, 2005-2016 Tables 1. Tobacco Company Political Action Committee (PAC) Contributions
Tobacco Company Political Action Committee (PAC) Contributions to Federal Candidates by Election Cycle, PAC, and Party, 2005-2016 Tables 1. Tobacco Company Political Action Committee (PAC) Contributions
Pearson Education Limited Edinburgh Gate Harlow Essex CM20 2JE England and Associated Companies throughout the world
 Pearson Education Limited Edinburgh Gate Harlow Essex CM20 2JE England and Associated Companies throughout the world Visit us on the World Wide Web at: www.pearsoned.co.uk Pearson Education Limited 2014
Reasoning about probabilities (cont.); Correlational studies of differences between means
; Correlational studies of differences between means") Reasoning about probabilities (cont.); Correlational studies of differences between means Phil 12: Logic and Decision Making Fall 2010 UC San Diego 10/29/2010 Review You have found a correlation in a sample
Reasoning about probabilities (cont.); Correlational studies of differences between means Phil 12: Logic and Decision Making Fall 2010 UC San Diego 10/29/2010 Review You have found a correlation in a sample
V. Gathering and Exploring Data
 V. Gathering and Exploring Data With the language of probability in our vocabulary, we re now ready to talk about sampling and analyzing data. Data Analysis We can divide statistical methods into roughly
AMS5 - MIDTERM Thursday 30th April, 2009
 Name: Section: (day/time) AMS5 - MIDTERM Thursday 30th April, 2009 A Normal Table is on the last page of this exam. You must explain all answers and/or show working for full credit. 1. Instead of driving