Announcement. Homework #2 due next Friday at 5pm. Midterm is in 2 weeks. It will cover everything through the end of next week (week 5).
|
|
|
- Angela Hodges
- 5 years ago
- Views:
Transcription
1 Announcement Homework #2 due next Friday at 5pm. Midterm is in 2 weeks. It will cover everything through the end of next week (week 5).
2 Political Science 15 Lecture 8: Descriptive Statistics (Part 1)
3 Data Coding Coding is the process of assigning numerical values to the values of your variable. The meaning of these codes will depend on the level of measurement of the variable: Nominal: codes are just indications of the category Ordinal: codes are indications of ordering Interval/Ratio: codes are the actual numerical value
4 Preparing Data for Hypothesis Testing Gather measurements on all of the concepts important for your hypothesis (dependent, independent, and control variables). Enter them into a spreadsheet. We will use SPSS in this class. Each row is an observation (unit), each column is a variable.
5 Example of Data Ready for Hypothesis Testing Interview # Religion Income Ideology We use a codebook to find out what these numbers mean.
6 Descriptive Statistics Descriptive statistics can be used for descriptive inference using data to learn something about the state of the world. These descriptive statistics will also be the building blocks we use for causal inference testing our hypotheses with data to learn something about how the world works. We begin with descriptive statistics for a single variable.
7 Understanding Our Data Before undertaking any data analysis you should examine your data carefully. Watch for unusual distributions of variable values and outliers in the data. An outlier is an extreme value on a variable. Try to determine why you have observed this value. An unusual case? A coding error?

8 Example of an outlier affecting a relationship
9 Exploring Data: Frequency Distributions Divide the variable into a set of exhaustive, mutually exclusive categories. Example: Cumulative Ideology # of people Percent Percent Conservative % 30% Moderate % 80% Liberal % 100% Total % 100%
10 Exploring Data: Graphical Methods For nominal and ordinal level data bar graphs work well:

11 Exploring Data: Graphical Methods For interval level data a histogram is useful (note detection of outlier):
12 Central Tendency: Mode The mode is the category of a variable with the greatest frequency of observations. The mode is most commonly used on variables with a nominal level of measurement. There can be more than one modal value for a variable. Variables with more than one mode are referred to as bimodal or multimodal. Example: In a party ID variable we have 40 Democrats, 60 Republicans, and 20 Independents the mode is Republican.
13 Central Tendency: Median The median is the value of a variable that divides the observations on that variable in half. If we ordered our observations on a variable from lowest to highest, the median observation is the one in the middle. With an even number of observations there is no true median. The median is most commonly used on variables with an ordinal level of measurement, but is sometimes used on interval/ratio data because it is resistant to outliers.
14 Example of Calculating Median We have a 7-point scale on ideology in a survey: Category: # responses: The median observation is observation (N+1)/2 = 182. Count up from the lowest value median is 3.
15 Quartiles If we arrange a variable from lowest to highest value, the median is the observation at the 50% mark. Quartiles are at the 25%, 50% and 75% marks. Quintiles: 20%, 40%, 60%, 80% Deciles: every 10% Percentiles: every 1% We can use these to get a more detailed picture of the distribution of a variable.
16 Central Tendency: Mean The mean is the sum of the values of a variable divided by the number of observations on that variable. This is usually what people mean by average. The formula for the mean is written as: The mean is most commonly used on variables with an interval level of measurement.
17 Example of Calculating Mean We have campaign spending in 7 districts: District: $ spent: ΣX = = N = 7 The mean is 18300/7 = 2614.
18 Central Tendencies in Global Income Distribution
19 Dispersion: Standard Deviation The variance of a variable is the sum of the squared differences between each value of that variable and the mean, divided by N 1. We square the differences so that positive and negative differences don t cancel out. We divide by N 1 to get a (conservative) estimate of the mean dispersion of the variable. The square root of the variance is the standard deviation:
20 Example of Calculating Standard Deviation We have campaign spending in 7 districts: District: $ spent: Mean of variable is s = square root of [1/6 (( ) 2 + ( ) 2 + ))] The standard deviation is 2106.
21 z scores A z score is a measure of how many standard deviations a particular observation is above or below the mean. We subtract the mean from the observation and divide by the standard deviation.
22 Example of Calculating z scores We have campaign spending in 7 districts: District: $ spent: Mean of variable is 2614 Standard deviation of variable is z score for district 1 is ( )/2106 = z score for district 2 is ( )/2106 = 1.13
23 Descriptive Statistics for Relationships Between Variables These are the more interesting descriptive statistics from our perspective, since we are interested in testing causal relationships between variables. Our hypothesis tests later in the class will usually be based on these calculations. As with a single variable, we begin by exploring our data to be sure we understand it.
24 Exploring Data: Bivariate Frequency Distributions Divide the variables into a set of exhaustive, mutually exclusive categories. Example: Favors Gas Tax Opposes Gas Tax Party ID Democrat 50% N=500 10% N=100 Party ID Republican 10% N=100 30% N=300
25 Examples of Relationships in Crosstabs Dem Rep Yes 25% 25% No 25% 25% Dem Rep Yes 40% 10% No 10% 40% Dem Rep Yes 10% 40% No 40% 10% No Yes No Our hypothesis is that Democrats are more supportive of a gas tax. Do our data support this?
26 Exploring Data: Graphical Methods For interval level data scatterplots are a good way to examine relationships between variables :
27 Correlations Correlations measure the relationship between two interval level variables. Correlations always fall between 1 and 1. Positive correlations indicate a positive relationship, negative correlations indicate a negative relationship. No relationship gives a 0 correlation, but 0 correlation does not necessarily mean no relationship. Correlations only capture linear relationships: y = a + b*x
28 Positive Correlations Stronger Weaker
29 Negative Correlations Stronger Weaker
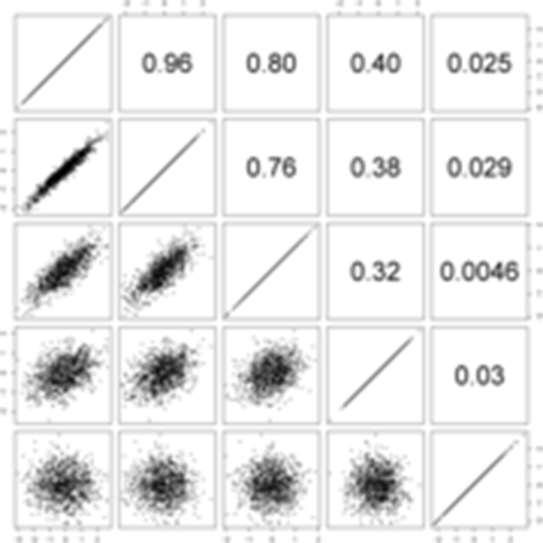
30 Examples of Correlations
Political Science 15, Winter 2014 Final Review
 Political Science 15, Winter 2014 Final Review The major topics covered in class are listed below. You should also take a look at the readings listed on the class website. Studying Politics Scientifically
Business Statistics Probability
 Business Statistics The following was provided by Dr. Suzanne Delaney, and is a comprehensive review of Business Statistics. The workshop instructor will provide relevant examples during the Skills Assessment
Still important ideas
 Readings: OpenStax - Chapters 1 11 + 13 & Appendix D & E (online) Plous - Chapters 2, 3, and 4 Chapter 2: Cognitive Dissonance, Chapter 3: Memory and Hindsight Bias, Chapter 4: Context Dependence Still
Describe what is meant by a placebo Contrast the double-blind procedure with the single-blind procedure Review the structure for organizing a memo
 Business Statistics The following was provided by Dr. Suzanne Delaney, and is a comprehensive review of Business Statistics. The workshop instructor will provide relevant examples during the Skills Assessment
Describe what is meant by a placebo Contrast the double-blind procedure with the single-blind procedure Review the structure for organizing a memo
 Please note the page numbers listed for the Lind book may vary by a page or two depending on which version of the textbook you have. Readings: Lind 1 11 (with emphasis on chapters 10, 11) Please note chapter
Still important ideas
 Readings: OpenStax - Chapters 1 13 & Appendix D & E (online) Plous Chapters 17 & 18 - Chapter 17: Social Influences - Chapter 18: Group Judgments and Decisions Still important ideas Contrast the measurement
Describe what is meant by a placebo Contrast the double-blind procedure with the single-blind procedure Review the structure for organizing a memo
 Please note the page numbers listed for the Lind book may vary by a page or two depending on which version of the textbook you have. Readings: Lind 1 11 (with emphasis on chapters 5, 6, 7, 8, 9 10 & 11)
Statistics is the science of collecting, organizing, presenting, analyzing, and interpreting data to assist in making effective decisions
 Readings: OpenStax Textbook - Chapters 1 5 (online) Appendix D & E (online) Plous - Chapters 1, 5, 6, 13 (online) Introductory comments Describe how familiarity with statistical methods can - be associated
CHAPTER 2. MEASURING AND DESCRIBING VARIABLES
 4 Chapter 2 CHAPTER 2. MEASURING AND DESCRIBING VARIABLES 1. A. Age: name/interval; military dictatorship: value/nominal; strongly oppose: value/ ordinal; election year: name/interval; 62 percent: value/interval;
Readings: Textbook readings: OpenStax - Chapters 1 13 (emphasis on Chapter 12) Online readings: Appendix D, E & F
 Online readings: Appendix D, E & F") Readings: Textbook readings: OpenStax - Chapters 1 13 (emphasis on Chapter 12) Online readings: Appendix D, E & F Plous Chapters 17 & 18 Chapter 17: Social Influences Chapter 18: Group Judgments and Decisions
Readings: Textbook readings: OpenStax - Chapters 1 13 (emphasis on Chapter 12) Online readings: Appendix D, E & F Plous Chapters 17 & 18 Chapter 17: Social Influences Chapter 18: Group Judgments and Decisions
bivariate analysis: The statistical analysis of the relationship between two variables.
 bivariate analysis: The statistical analysis of the relationship between two variables. cell frequency: The number of cases in a cell of a cross-tabulation (contingency table). chi-square (χ 2 ) test for
Homework #2 is due next Friday at 5pm.
 Homework #2 is due next Friday at 5pm. Political Science 15 Lecture 7: Measurement (Part 2) Topics in Measurement Unit of analysis Operational definitions Accuracy (validity and reliability) Precision
SOME NOTES ON STATISTICAL INTERPRETATION
 1 SOME NOTES ON STATISTICAL INTERPRETATION Below I provide some basic notes on statistical interpretation. These are intended to serve as a resource for the Soci 380 data analysis. The information provided
Chapter Eight: Multivariate Analysis
 Chapter Eight: Multivariate Analysis Up until now, we have covered univariate ( one variable ) analysis and bivariate ( two variables ) analysis. We can also measure the simultaneous effects of two or
Readings: Textbook readings: OpenStax - Chapters 1 4 Online readings: Appendix D, E & F Online readings: Plous - Chapters 1, 5, 6, 13
 Readings: Textbook readings: OpenStax - Chapters 1 4 Online readings: Appendix D, E & F Online readings: Plous - Chapters 1, 5, 6, 13 Introductory comments Describe how familiarity with statistical methods
Readings: Textbook readings: OpenStax - Chapters 1 11 Online readings: Appendix D, E & F Plous Chapters 10, 11, 12 and 14
 Readings: Textbook readings: OpenStax - Chapters 1 11 Online readings: Appendix D, E & F Plous Chapters 10, 11, 12 and 14 Still important ideas Contrast the measurement of observable actions (and/or characteristics)
Statistics is the science of collecting, organizing, presenting, analyzing, and interpreting data to assist in making effective decisions
 Readings: OpenStax Textbook - Chapters 1 5 (online) Appendix D & E (online) Plous - Chapters 1, 5, 6, 13 (online) Introductory comments Describe how familiarity with statistical methods can - be associated
Statistics as a Tool. A set of tools for collecting, organizing, presenting and analyzing numerical facts or observations.
 Statistics as a Tool A set of tools for collecting, organizing, presenting and analyzing numerical facts or observations. Descriptive Statistics Numerical facts or observations that are organized describe
Chapter Eight: Multivariate Analysis
 Chapter Eight: Multivariate Analysis Up until now, we have covered univariate ( one variable ) analysis and bivariate ( two variables ) analysis. We can also measure the simultaneous effects of two or
Quantitative Methods in Computing Education Research (A brief overview tips and techniques)
") Quantitative Methods in Computing Education Research (A brief overview tips and techniques) Dr Judy Sheard Senior Lecturer Co-Director, Computing Education Research Group Monash University judy.sheard@monash.edu
Quantitative Methods in Computing Education Research (A brief overview tips and techniques) Dr Judy Sheard Senior Lecturer Co-Director, Computing Education Research Group Monash University judy.sheard@monash.edu
POLS 5377 Scope & Method of Political Science. Correlation within SPSS. Key Questions: How to compute and interpret the following measures in SPSS
 POLS 5377 Scope & Method of Political Science Week 15 Measure of Association - 2 Correlation within SPSS 2 Key Questions: How to compute and interpret the following measures in SPSS Ordinal Variable Gamma
Elementary Statistics:
 1. How many full chapters of reading in the text were assigned for this lecture? 1. 1. 3. 3 4. 4 5. None of the above SOC497 @ CSUN w/ Ellis Godard 1 SOC497 @ CSUN w/ Ellis Godard 5 SOC497/L: SOCIOLOGY
Undertaking statistical analysis of
 Descriptive statistics: Simply telling a story Laura Delaney introduces the principles of descriptive statistical analysis and presents an overview of the various ways in which data can be presented by
Understandable Statistics
 Understandable Statistics correlated to the Advanced Placement Program Course Description for Statistics Prepared for Alabama CC2 6/2003 2003 Understandable Statistics 2003 correlated to the Advanced Placement
Student name: SOCI 420 Advanced Methods of Social Research Fall 2017
 SOCI 420 Advanced Methods of Social Research Fall 2017 EXAM 1 RUBRIC Instructor: Ernesto F. L. Amaral, Assistant Professor, Department of Sociology Date: October 12, 2017 (Thursday) Section 904: 2:20 3:35pm
Lecture (chapter 1): Introduction
: Introduction") Lecture (chapter 1): Introduction Ernesto F. L. Amaral January 17, 2018 Advanced Methods of Social Research (SOCI 420) Source: Healey, Joseph F. 2015. Statistics: A Tool for Social Research. Stamford:
Lecture (chapter 1): Introduction Ernesto F. L. Amaral January 17, 2018 Advanced Methods of Social Research (SOCI 420) Source: Healey, Joseph F. 2015. Statistics: A Tool for Social Research. Stamford:
Distributions and Samples. Clicker Question. Review
 Distributions and Samples Clicker Question The major difference between an observational study and an experiment is that A. An experiment manipulates features of the situation B. An experiment does not
Table of Contents. Plots. Essential Statistics for Nursing Research 1/12/2017
 Essential Statistics for Nursing Research Kristen Carlin, MPH Seattle Nursing Research Workshop January 30, 2017 Table of Contents Plots Descriptive statistics Sample size/power Correlations Hypothesis
Student name: SOCI 420 Advanced Methods of Social Research Fall 2017
 SOCI 420 Advanced Methods of Social Research Fall 2017 EXAM 1 RUBRIC Instructor: Ernesto F. L. Amaral, Assistant Professor, Department of Sociology Date: October 12, 2017 (Thursday) Section 903: 9:35 10:50am
MBA 605 Business Analytics Don Conant, PhD. GETTING TO THE STANDARD NORMAL DISTRIBUTION
 MBA 605 Business Analytics Don Conant, PhD. GETTING TO THE STANDARD NORMAL DISTRIBUTION Variables In the social sciences data are the observed and/or measured characteristics of individuals and groups
Statistical Techniques. Masoud Mansoury and Anas Abulfaraj
 Statistical Techniques Masoud Mansoury and Anas Abulfaraj What is Statistics? https://www.youtube.com/watch?v=lmmzj7599pw The definition of Statistics The practice or science of collecting and analyzing
SPRING GROVE AREA SCHOOL DISTRICT. Course Description. Instructional Strategies, Learning Practices, Activities, and Experiences.
 SPRING GROVE AREA SCHOOL DISTRICT PLANNED COURSE OVERVIEW Course Title: Basic Introductory Statistics Grade Level(s): 11-12 Units of Credit: 1 Classification: Elective Length of Course: 30 cycles Periods
STATISTICS AND RESEARCH DESIGN
 Statistics 1 STATISTICS AND RESEARCH DESIGN These are subjects that are frequently confused. Both subjects often evoke student anxiety and avoidance. To further complicate matters, both areas appear have
AP Psych - Stat 1 Name Period Date. MULTIPLE CHOICE. Choose the one alternative that best completes the statement or answers the question.
 AP Psych - Stat 1 Name Period Date MULTIPLE CHOICE. Choose the one alternative that best completes the statement or answers the question. 1) In a set of incomes in which most people are in the $15,000
Survey research (Lecture 1) Summary & Conclusion. Lecture 10 Survey Research & Design in Psychology James Neill, 2015 Creative Commons Attribution 4.
 Summary & Conclusion. Lecture 10 Survey Research & Design in Psychology James Neill, 2015 Creative Commons Attribution 4.") Summary & Conclusion Lecture 10 Survey Research & Design in Psychology James Neill, 2015 Creative Commons Attribution 4.0 Overview 1. Survey research 2. Survey design 3. Descriptives & graphing 4. Correlation
Summary & Conclusion Lecture 10 Survey Research & Design in Psychology James Neill, 2015 Creative Commons Attribution 4.0 Overview 1. Survey research 2. Survey design 3. Descriptives & graphing 4. Correlation
Survey research (Lecture 1)
") Summary & Conclusion Lecture 10 Survey Research & Design in Psychology James Neill, 2015 Creative Commons Attribution 4.0 Overview 1. Survey research 2. Survey design 3. Descriptives & graphing 4. Correlation
Summary & Conclusion Lecture 10 Survey Research & Design in Psychology James Neill, 2015 Creative Commons Attribution 4.0 Overview 1. Survey research 2. Survey design 3. Descriptives & graphing 4. Correlation
Analysis and Interpretation of Data Part 1
 Analysis and Interpretation of Data Part 1 DATA ANALYSIS: PRELIMINARY STEPS 1. Editing Field Edit Completeness Legibility Comprehensibility Consistency Uniformity Central Office Edit 2. Coding Specifying
Unit 1 Exploring and Understanding Data
 Unit 1 Exploring and Understanding Data Area Principle Bar Chart Boxplot Conditional Distribution Dotplot Empirical Rule Five Number Summary Frequency Distribution Frequency Polygon Histogram Interquartile
POL 242Y Final Test (Take Home) Name
 Name") POL 242Y Final Test (Take Home) Name_ Due August 6, 2008 The take-home final test should be returned in the classroom (FE 36) by the end of the class on August 6. Students who fail to submit the final
POL 242Y Final Test (Take Home) Name_ Due August 6, 2008 The take-home final test should be returned in the classroom (FE 36) by the end of the class on August 6. Students who fail to submit the final
Summary & Conclusion. Lecture 10 Survey Research & Design in Psychology James Neill, 2016 Creative Commons Attribution 4.0
 Summary & Conclusion Lecture 10 Survey Research & Design in Psychology James Neill, 2016 Creative Commons Attribution 4.0 Overview 1. Survey research and design 1. Survey research 2. Survey design 2. Univariate
Descriptive Statistics Lecture
 Definitions: Lecture Psychology 280 Orange Coast College 2/1/2006 Statistics have been defined as a collection of methods for planning experiments, obtaining data, and then analyzing, interpreting and
Unit 7 Comparisons and Relationships
 Unit 7 Comparisons and Relationships Objectives: To understand the distinction between making a comparison and describing a relationship To select appropriate graphical displays for making comparisons
CHAPTER 3 DATA ANALYSIS: DESCRIBING DATA
 Data Analysis: Describing Data CHAPTER 3 DATA ANALYSIS: DESCRIBING DATA In the analysis process, the researcher tries to evaluate the data collected both from written documents and from other sources such
AP Psych - Stat 2 Name Period Date. MULTIPLE CHOICE. Choose the one alternative that best completes the statement or answers the question.
 AP Psych - Stat 2 Name Period Date MULTIPLE CHOICE. Choose the one alternative that best completes the statement or answers the question. 1) In a set of incomes in which most people are in the $15,000
Homework Exercises for PSYC 3330: Statistics for the Behavioral Sciences
 Homework Exercises for PSYC 3330: Statistics for the Behavioral Sciences compiled and edited by Thomas J. Faulkenberry, Ph.D. Department of Psychological Sciences Tarleton State University Version: July
Introduction to Statistical Data Analysis I
 Introduction to Statistical Data Analysis I JULY 2011 Afsaneh Yazdani Preface What is Statistics? Preface What is Statistics? Science of: designing studies or experiments, collecting data Summarizing/modeling/analyzing
Quantitative Data and Measurement. POLI 205 Doing Research in Politics. Fall 2015
 Quantitative Fall 2015 Theory and We need to test our theories with empirical data Inference : Systematic observation and representation of concepts Quantitative: measures are numeric Qualitative: measures
On the purpose of testing:
 Why Evaluation & Assessment is Important Feedback to students Feedback to teachers Information to parents Information for selection and certification Information for accountability Incentives to increase
AP Statistics. Semester One Review Part 1 Chapters 1-5
 AP Statistics Semester One Review Part 1 Chapters 1-5 AP Statistics Topics Describing Data Producing Data Probability Statistical Inference Describing Data Ch 1: Describing Data: Graphically and Numerically
Biostatistics. Donna Kritz-Silverstein, Ph.D. Professor Department of Family & Preventive Medicine University of California, San Diego
 Biostatistics Donna Kritz-Silverstein, Ph.D. Professor Department of Family & Preventive Medicine University of California, San Diego (858) 534-1818 dsilverstein@ucsd.edu Introduction Overview of statistical
QPM Lab 9: Contingency Tables and Bivariate Displays in R
 QPM Lab 9: Contingency Tables and Bivariate Displays in R Department of Political Science Washington University, St. Louis November 3-4, 2016 QPM Lab 9: Contingency Tables and Bivariate Displays in R 1
9 research designs likely for PSYC 2100
 9 research designs likely for PSYC 2100 1) 1 factor, 2 levels, 1 group (one group gets both treatment levels) related samples t-test (compare means of 2 levels only) 2) 1 factor, 2 levels, 2 groups (one
What type of graph should I use?
 What type of graph should I use? Learning how to best visualize your data is almost as important as your statistical analysis. Science communication is increasingly important you have to learn how to communicate
Department of Statistics TEXAS A&M UNIVERSITY STAT 211. Instructor: Keith Hatfield
 Department of Statistics TEXAS A&M UNIVERSITY STAT 211 Instructor: Keith Hatfield 1 Topic 1: Data collection and summarization Populations and samples Frequency distributions Histograms Mean, median, variance
Summarizing Data. (Ch 1.1, 1.3, , 2.4.3, 2.5)
") 1 Summarizing Data (Ch 1.1, 1.3, 1.10-1.13, 2.4.3, 2.5) Populations and Samples An investigation of some characteristic of a population of interest. Example: You want to study the average GPA of juniors
1 Summarizing Data (Ch 1.1, 1.3, 1.10-1.13, 2.4.3, 2.5) Populations and Samples An investigation of some characteristic of a population of interest. Example: You want to study the average GPA of juniors
Population. Sample. AP Statistics Notes for Chapter 1 Section 1.0 Making Sense of Data. Statistics: Data Analysis:
 Section 1.0 Making Sense of Data Statistics: Data Analysis: Individuals objects described by a set of data Variable any characteristic of an individual Categorical Variable places an individual into one
Psychology Research Process
 Psychology Research Process Logical Processes Induction Observation/Association/Using Correlation Trying to assess, through observation of a large group/sample, what is associated with what? Examples:
STAT 503X Case Study 1: Restaurant Tipping
 STAT 503X Case Study 1: Restaurant Tipping 1 Description Food server s tips in restaurants may be influenced by many factors including the nature of the restaurant, size of the party, table locations in
Chapter 1: Exploring Data
 Chapter 1: Exploring Data Key Vocabulary:! individual! variable! frequency table! relative frequency table! distribution! pie chart! bar graph! two-way table! marginal distributions! conditional distributions!
Chapter 2--Norms and Basic Statistics for Testing
 Chapter 2--Norms and Basic Statistics for Testing Student: 1. Statistical procedures that summarize and describe a series of observations are called A. inferential statistics. B. descriptive statistics.
PRINCIPLES OF STATISTICS
 PRINCIPLES OF STATISTICS STA-201-TE This TECEP is an introduction to descriptive and inferential statistics. Topics include: measures of central tendency, variability, correlation, regression, hypothesis
C-1: Variables which are measured on a continuous scale are described in terms of three key characteristics central tendency, variability, and shape.
 MODULE 02: DESCRIBING DT SECTION C: KEY POINTS C-1: Variables which are measured on a continuous scale are described in terms of three key characteristics central tendency, variability, and shape. C-2:
MTH 225: Introductory Statistics
 Marshall University College of Science Mathematics Department MTH 225: Introductory Statistics Course catalog description Basic probability, descriptive statistics, fundamental statistical inference procedures
Results & Statistics: Description and Correlation. I. Scales of Measurement A Review
 Results & Statistics: Description and Correlation The description and presentation of results involves a number of topics. These include scales of measurement, descriptive statistics used to summarize
STATISTICS & PROBABILITY
 STATISTICS & PROBABILITY LAWRENCE HIGH SCHOOL STATISTICS & PROBABILITY CURRICULUM MAP 2015-2016 Quarter 1 Unit 1 Collecting Data and Drawing Conclusions Unit 2 Summarizing Data Quarter 2 Unit 3 Randomness
Variability. After reading this chapter, you should be able to do the following:
 LEARIG OBJECTIVES C H A P T E R 3 Variability After reading this chapter, you should be able to do the following: Explain what the standard deviation measures Compute the variance and the standard deviation
Empirical Knowledge: based on observations. Answer questions why, whom, how, and when.
 INTRO TO RESEARCH METHODS: Empirical Knowledge: based on observations. Answer questions why, whom, how, and when. Experimental research: treatments are given for the purpose of research. Experimental group
Collecting & Making Sense of
 Collecting & Making Sense of Quantitative Data Deborah Eldredge, PhD, RN Director, Quality, Research & Magnet Recognition i Oregon Health & Science University Margo A. Halm, RN, PhD, ACNS-BC, FAHA Director,
Psychology Research Process
 Psychology Research Process Logical Processes Induction Observation/Association/Using Correlation Trying to assess, through observation of a large group/sample, what is associated with what? Examples:
7. Bivariate Graphing
 1 7. Bivariate Graphing Video Link: https://www.youtube.com/watch?v=shzvkwwyguk&index=7&list=pl2fqhgedk7yyl1w9tgio8w pyftdumgc_j Section 7.1: Converting a Quantitative Explanatory Variable to Categorical
Students will understand the definition of mean, median, mode and standard deviation and be able to calculate these functions with given set of
 Students will understand the definition of mean, median, mode and standard deviation and be able to calculate these functions with given set of numbers. Also, students will understand why some measures
CHAPTER ONE CORRELATION
 CHAPTER ONE CORRELATION 1.0 Introduction The first chapter focuses on the nature of statistical data of correlation. The aim of the series of exercises is to ensure the students are able to use SPSS to
Chapter 2 Norms and Basic Statistics for Testing MULTIPLE CHOICE
 Chapter 2 Norms and Basic Statistics for Testing MULTIPLE CHOICE 1. When you assert that it is improbable that the mean intelligence test score of a particular group is 100, you are using. a. descriptive
1. Introduction a. Meaning and Role of Statistics b. Descriptive and inferential Statistics c. Variable and Measurement Scales
 N. Setyaningsih 1. Introduction a. Meaning and Role of Statistics b. Descriptive and inferential Statistics c. Variable and Measurement Scales 2. Organizing Data for Meaningful Representations a. Frequency
STT315 Chapter 2: Methods for Describing Sets of Data - Part 2
 Chapter 2.5 Interpreting Standard Deviation Chebyshev Theorem Empirical Rule Chebyshev Theorem says that for ANY shape of data distribution at least 3/4 of all data fall no farther from the mean than 2
Descriptive Research a systematic, objective observation of people.
 What is going on in this picture? We cannot say exactly, but we can describe what we see. Thus we have.. Descriptive Research a systematic, objective observation of people. Any research that observes and
CHAPTER 3 Describing Relationships
 CHAPTER 3 Describing Relationships 3.1 Scatterplots and Correlation The Practice of Statistics, 5th Edition Starnes, Tabor, Yates, Moore Bedford Freeman Worth Publishers Reading Quiz 3.1 True/False 1.
Measuring the User Experience
 Measuring the User Experience Collecting, Analyzing, and Presenting Usability Metrics Chapter 2 Background Tom Tullis and Bill Albert Morgan Kaufmann, 2008 ISBN 978-0123735584 Introduction Purpose Provide
Biostatistics for Med Students. Lecture 1
 Biostatistics for Med Students Lecture 1 John J. Chen, Ph.D. Professor & Director of Biostatistics Core UH JABSOM JABSOM MD7 February 14, 2018 Lecture note: http://biostat.jabsom.hawaii.edu/education/training.html
Human-Computer Interaction IS4300. I6 Swing Layout Managers due now
 Human-Computer Interaction IS4300 1 I6 Swing Layout Managers due now You have two choices for requirements: 1) try to duplicate the functionality of an existing applet; or, 2) create your own (ideally
Medical Statistics 1. Basic Concepts Farhad Pishgar. Defining the data. Alive after 6 months?
 Medical Statistics 1 Basic Concepts Farhad Pishgar Defining the data Population and samples Except when a full census is taken, we collect data on a sample from a much larger group called the population.
Chapter 2: The Organization and Graphic Presentation of Data Test Bank
 Essentials of Social Statistics for a Diverse Society 3rd Edition Leon Guerrero Test Bank Full Download: https://testbanklive.com/download/essentials-of-social-statistics-for-a-diverse-society-3rd-edition-leon-guerrero-tes
Standard Deviation and Standard Error Tutorial. This is significantly important. Get your AP Equations and Formulas sheet
 Standard Deviation and Standard Error Tutorial This is significantly important. Get your AP Equations and Formulas sheet The Basics Let s start with a review of the basics of statistics. Mean: What most
Business Statistics (ECOE 1302) Spring Semester 2011 Chapter 3 - Numerical Descriptive Measures Solutions
 Spring Semester 2011 Chapter 3 - Numerical Descriptive Measures Solutions") The Islamic University of Gaza Faculty of Commerce Department of Economics and Political Sciences Business Statistics (ECOE 1302) Spring Semester 2011 Chapter 3 - Numerical Descriptive Measures Solutions
The Islamic University of Gaza Faculty of Commerce Department of Economics and Political Sciences Business Statistics (ECOE 1302) Spring Semester 2011 Chapter 3 - Numerical Descriptive Measures Solutions
Here are the various choices. All of them are found in the Analyze menu in SPSS, under the sub-menu for Descriptive Statistics :
 Descriptive Statistics in SPSS When first looking at a dataset, it is wise to use descriptive statistics to get some idea of what your data look like. Here is a simple dataset, showing three different
Quizzes (and relevant lab exercises): 20% Midterm exams (2): 25% each Final exam: 30%
: 20% Midterm exams (2): 25% each Final exam: 30%") 1 Intro to statistics Continued 2 Grading policy Quizzes (and relevant lab exercises): 20% Midterm exams (2): 25% each Final exam: 30% Cutoffs based on final avgs (A, B, C): 91-100, 82-90, 73-81 3 Numerical
1 Intro to statistics Continued 2 Grading policy Quizzes (and relevant lab exercises): 20% Midterm exams (2): 25% each Final exam: 30% Cutoffs based on final avgs (A, B, C): 91-100, 82-90, 73-81 3 Numerical
Key findings from a telephone survey of 200 registered voters in New Orleans, Louisiana, with 60 cell phone interviews, conducted December 16-18, 2014
 Key findings from a telephone survey of 200 registered voters in New Orleans, Louisiana, with 60 cell phone interviews, conducted December 16-18, 2014 Project #141630 Public Opinion Strategies is pleased
M 140 Test 1 A Name (1 point) SHOW YOUR WORK FOR FULL CREDIT! Problem Max. Points Your Points Total 75
 SHOW YOUR WORK FOR FULL CREDIT! Problem Max. Points Your Points Total 75") M 140 est 1 A Name (1 point) SHOW YOUR WORK FOR FULL CREDI! Problem Max. Points Your Points 1-10 10 11 10 12 3 13 4 14 18 15 8 16 7 17 14 otal 75 Multiple choice questions (1 point each) For questions
M 140 est 1 A Name (1 point) SHOW YOUR WORK FOR FULL CREDI! Problem Max. Points Your Points 1-10 10 11 10 12 3 13 4 14 18 15 8 16 7 17 14 otal 75 Multiple choice questions (1 point each) For questions
Basic Statistics 01. Describing Data. Special Program: Pre-training 1
 Basic Statistics 01 Describing Data Special Program: Pre-training 1 Describing Data 1. Numerical Measures Measures of Location Measures of Dispersion Correlation Analysis 2. Frequency Distributions (Relative)
Statistics Guide. Prepared by: Amanda J. Rockinson- Szapkiw, Ed.D.
 This guide contains a summary of the statistical terms and procedures. This guide can be used as a reference for course work and the dissertation process. However, it is recommended that you refer to statistical
MM207 Mid-Term Project
 Name: Eddie S. Jackson. In the following situation identify the implied population. A recent report on the weekly news presented the findings of a study on the effectiveness of Onglyza, along with diet
Averages and Variation
 Chapter 3 Averages and Variation Name Section 3.1 Measures of Central Tendency: Mode, Median, and Mean Objective: In this lesson you learned how to compute, interpret, and explain mean, median, and mode.
Statistical Methods Exam I Review
 Statistical Methods Exam I Review Professor: Dr. Kathleen Suchora SI Leader: Camila M. DISCLAIMER: I have created this review sheet to supplement your studies for your first exam. I am a student here at
Lesson 9 Presentation and Display of Quantitative Data
 Lesson 9 Presentation and Display of Quantitative Data Learning Objectives All students will identify and present data using appropriate graphs, charts and tables. All students should be able to justify
Research Methods in Forest Sciences: Learning Diary. Yoko Lu December Research process
 Research Methods in Forest Sciences: Learning Diary Yoko Lu 285122 9 December 2016 1. Research process It is important to pursue and apply knowledge and understand the world under both natural and social
What you should know before you collect data. BAE 815 (Fall 2017) Dr. Zifei Liu
 Dr. Zifei Liu") What you should know before you collect data BAE 815 (Fall 2017) Dr. Zifei Liu Zifeiliu@ksu.edu Types and levels of study Descriptive statistics Inferential statistics How to choose a statistical test
What you should know before you collect data BAE 815 (Fall 2017) Dr. Zifei Liu Zifeiliu@ksu.edu Types and levels of study Descriptive statistics Inferential statistics How to choose a statistical test
11/18/2013. Correlational Research. Correlational Designs. Why Use a Correlational Design? CORRELATIONAL RESEARCH STUDIES
 Correlational Research Correlational Designs Correlational research is used to describe the relationship between two or more naturally occurring variables. Is age related to political conservativism? Are
Introduction to statistics Dr Alvin Vista, ACER Bangkok, 14-18, Sept. 2015
 Analysing and Understanding Learning Assessment for Evidence-based Policy Making Introduction to statistics Dr Alvin Vista, ACER Bangkok, 14-18, Sept. 2015 Australian Council for Educational Research Structure
Intro to SPSS. Using SPSS through WebFAS
 Intro to SPSS Using SPSS through WebFAS http://www.yorku.ca/computing/students/labs/webfas/ Try it early (make sure it works from your computer) If you need help contact UIT Client Services Voice: 416-736-5800
Statistics. Nur Hidayanto PSP English Education Dept. SStatistics/Nur Hidayanto PSP/PBI
 Statistics Nur Hidayanto PSP English Education Dept. RESEARCH STATISTICS WHAT S THE RELATIONSHIP? RESEARCH RESEARCH positivistic Prepositivistic Postpositivistic Data Initial Observation (research Question)