Data Analysis Using SPSS. By: Akmal Aini Othman
|
|
|
- Kristin Doyle
- 5 years ago
- Views:
Transcription
1 Data Analysis Using SPSS By: Akmal Aini Othman

2 The key to GOOD descriptive research is knowing exactly what you want to measure and selecting a survey method in which every respondent is willing to cooperate and capable of giving you complete and accurate information efficiently Joe Ottaviani-

3 Uncertainty Influences The Type Of Research CAUSAL OR DESCRIPTIVE COMPLETELY CERTAIN ABSOLUTE AMBIGUITY EXPLORATORY Source: Zikmund, 2009
4 Problem Discovery and Definition Problem discovery Sampling Selection of research technique Selection of exploratory research technique Probability Nonprobability Secondary (historical) data Experience survey Pilot study Case study Data Gathering Collection of data (fieldwork) Problem definition (statement of research objectives) Data Processing and Analysis Editing and coding data Research Design Experiment Selection of basic research method Survey Laboratory Field Interview Questionnaire Observation Secondary Data Study Conclusions and Report Data processing Interpretation of findings Report Source: Zikmund, 2009
5 Thesis Contents Chap 1 - Introduction Chap 2 - Literature Review Chap 3 Methodology Chap 4 Findings & Discussion Chap 5 Conclusion and Recommendation
6 Thesis Contents Introduction why & what this research Literature Review who have done this research & how, what results, what shortcomings Research Framework & Data Collection why this framework, hypotheses; measurements, sample, how data can be collected Data Collection & Analysis what methods most appropriate, findings Conclusion have u achieved what you set out to do?
7 Thesis Contents Chap 1 Introduction Background of the study Problem Statement Research Question Research Objective Hypothesis Significance of the study Limitation
8 Thesis Contents Chap 4 Findings and Discussion Descriptive Analysis Test of Goodness of Data e.g Normality & Multicollinearity Factor Analysis Reliability and Validity Test Inferential Analysis / Hypothesis Testing
9 Data Preparation Process Prepare Preliminary Plan of Data Analysis Check Questionnaire Edit Code Transcribe Clean Data Statistically Adjust the Data Source: Malhotra, 2012 Select Data Analysis Strategy
10 Questionnaire Checking A questionnaire returned from the field may be unacceptable for several reasons. Parts of the questionnaire may be incomplete. The pattern of responses may indicate that the respondent did not understand or follow the instructions. One or more pages are missing. The questionnaire is received after the preestablished cutoff date. The questionnaire is answered by someone who does not qualify for participation.
11 Editing Treatment of Unsatisfactory Results Returning to the Field The questionnaires with unsatisfactory responses may be returned to the field, where the interviewers recontact the respondents. Assigning Missing Values If returning the questionnaires to the field is not feasible, the editor may assign missing values to unsatisfactory responses. Discarding Unsatisfactory Respondents In this approach, the respondents with unsatisfactory responses are simply discarded.
12 Coding Data coding Coding the variables Coding the response/items for each variable Eg. Variable for gender = sex Coding item 1=male, 2=female The numerical scale can be coded by using the actual number circled by the respondents (question 6 to 21) Random checks should be conducted to ensure data are coded correctly
13 Table 12.1 Coding of Serakan Co. Questionnaires 1. Age (years) 2. Education 3. Job level 4. Sex [1] Under 25 [1] High school [1] Manager [1] M [2] [2] Some college [2] Supervisor [2] F [3] [3] Bachelor s degree [3] Clerk 5. Work shift [4] [4] Master s degree [4] Secretary [1] First [5] Over 55 [5] Doctoral degree [5] Technician [2] Second [6] Other (specify) [6] Other (specify) [3] Third 5a. Employment Status [1] Part time [2] Full time Here are some questions that ask you to tell us how you experience your work life in general. Please circle the appropriate number on the scales below. To what extent would you agree with the following statements, on a scale of 1 to 7, 1 denoting very low agreement and 7 denoting very high agreement? 6. The major happiness of my life comes from my job Time at work flies by quickly I live, eat and breathe my job My work is fascinating My work gives me a sense of accomplishment My supervisor praises good work The opportunities for advancement are very good here My coworkers are very stimulating People can live comfortably with their pay in this organization I get a lot of cooperation at the workplace My supervisor is not very capable Most things in life are more important than work Working here is a drag The promotion policies here are very unfair My pay is barely adequate to take care of my expenses My work is not the most important part of my life
14 Data Transcription Fig Raw Data CATI/ CAPI Keypunching via CRT Terminal Optical Recognition Digital Tech. Bar Code & Other Technologies Verification: Correct Keypunching Errors Computer Memory Disks Other Storage Transcribed Data
15 Data Cleaning Consistency Checks Consistency checks identify data that are out of range, logically inconsistent, or have extreme values. Computer packages like SPSS, SAS, EXCEL and MINITAB can be programmed to identify out-of-range values for each variable and print out the respondent code, variable code, variable name, record number, column number, and out-of-range value. Extreme values should be closely examined.
16 Data Cleaning Treatment of Missing Responses Substitute a Neutral Value A neutral value, typically the mean response to the variable, is substituted for the missing responses. Substitute an Imputed Response The respondents' pattern of responses to other questions are used to impute or calculate a suitable response to the missing questions. In casewise deletion, cases, or respondents, with any missing responses are discarded from the analysis. In pairwise deletion, instead of discarding all cases with any missing values, the researcher uses only the cases or respondents with complete responses for each calculation.
17 Basic Terms Levels of Measurement Nominal Ordinal Interval Ratio Key Terms Variable Dimension Item Definition Dictionary Operational Variables Independent Dependent Moderating Mediating
18 Research Framework 5 items Management (Independent) 5 items 3 items Advancement (Independent) Job Satisfaction (Mediating) Productivity (Dependent) 4 items Salary (Independent) Gender (Moderating) 4 items Workload (Independent)
19 Scale Nominal Numbers Assigned to Runners Finish Ordinal Rank Order of Winners Finish Interval Performance Rating on a 0 to 10 Scale Third place Second place First place Ratio Time to Finish, in Seconds Source: Malhotra, 2007
20 What is Statistics process of making sense of data Descriptive Stat describe the basic features of data using tables, graphs, summary stats Inferential Stat generalising from samples to populations performing estimations, hypothesis tests, determining relationships and making predictions
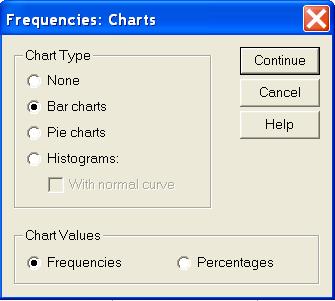
21 Descriptive Statistics Norminal data frequencies, %, cross tabulation, mode, pie chart, bar chart Ordinal data - frequencies, %, cross tabulation, mode, median, pie chart, bar chart Interval & Ratio data mean, variance, std deviation, skewness, kurtosis, index number, histogram, box plot, stem and leaf plot
22 Inferential Statistics Statistical Techniques: Exploring differences between groups Exploring relationship Parametric Data must be interval and the distribution must be normal Nonparametric Data is categorical (norminal/ordinal) or interval but distribution is not normal
23 Data analysis Basic objectives: Getting a feel for the data Testing the goodness of data Testing the hypotheses Feel for the data Checking for the central tendency and the dispersion If there is less variability, the questions could be not properly worded Check for similar response for every questions Remember, if there is no variability in the data, then no variance can be explained
24 Data analysis It is always prudent to obtain: Frequency distributions for the demographic variables The mean, standard deviation, range and variance on the other dependent and independent variables An inter-correlation matrix of the variables, regardless whether hypotheses are related to the these analyses. If the correlation between two variables is high, say over.75, we should wonder whether they are really two different concepts or we are measuring the same concepts.
25 Data analysis Testing goodness of data Reliability Cronbach s alpha. The closer Cronbach s alpha is to 1, the higher the internal consistency reliability Split-half reliability coefficient Stability measures include: Parallel from reliability Test-retest reliability Validity Criterion-related validity Convergent validity Discriminant validity
26 Choosing the Test Depends on: Data Norminal or Interval/Ratio Data Samples one/two/k-samples Purpose Describing, Comparing two statistics or Looking at relationship
27 A Classification of Univariate Techniques Univariate Techniques Metric Data Non-numeric Data One Sample * t test * Z test Independent * Two- Group test * Z test * One-Way ANOVA Two or More Samples Related * Paired t test One Sample * Frequency * Chi-Square * K-S * Runs * Binomial Independent * Chi-Square * Mann-Whitney * Median * K-S * K-W ANOVA Two or More Samples Related * Sign * Wilcoxon * McNemar * Chi-Square Source: Malhotra, 2012
28 Univariate Analysis Univariate analysis is the simplest form of analyzing data. Uni means one, so in other words your data has only one variable. It doesn't deal with causes or relationships (unlike regression) and it's major purpose is to describe; it takes data, summarizes that data and finds patterns in the data. It explores each variable in a data set, separately. It looks at the range of values, as well as the central tendency of the values. It describes the pattern of response to the variable. It describes each variable on its own.
29 A Classification of Multivariate Techniques Multivariate Techniques Dependence Technique Interdependence Technique One Dependent Variable More Than One Dependent Variable Variable Interdependence Interobject Similarity * Cross-Tabulation * Analysis of Variance and Covariance * Multiple Regression * 2-Group Discriminant/Logit * Conjoint Analysis * Multivariate Analysis of Variance * Canonical Correlation * Multiple Discriminant Analysis * Structural Equation Modeling and Path Analysis * Factor Analysis * Confirmatory Factor Analysis * Cluster Analysis * Multidimensional Scaling Source: Malhotra, 2012
30 Multivariate Analysis Multivariate Data Analysis refers to any statistical technique used to analyze data that arises from more than one variable. This essentially models reality where each situation, product, or decision involves more than a single variable.
31 Steps Involved in Hypothesis Testing Formulate H 0 and H 1 Select Appropriate Test Choose Level of Significance Collect Data and Calculate Test Statistic Determine Probability Associated with Test Statistic (p value) Compare with Level of Significance, Determine Critical Value of Test Statistic TS CR Determine if TS CAL falls into (Non) Rejection Region Reject or Do not Reject H 0 Draw Research Conclusion
32 Hypothesis Testing Hnull & Halternative A null hypothesis is a statement of the status quo, one of no difference or no effect. If the null hypothesis is not rejected, no changes will be made. An alternative hypothesis is one in which some difference or effect is expected. Accepting the alternative hypothesis will lead to changes in opinions or actions. The null hypothesis refers to a specified value of the population parameter (e.g., m, s, p ), not a sample statistic (e.g., ). X
33 H 1 : p > Hypothesis Testing Hnull & Halternative A null hypothesis may be rejected, but it can never be accepted based on a single test. In classical hypothesis testing, there is no way to determine whether the null hypothesis is true. The null hypothesis is formulated in such a way that its rejection leads to the acceptance of the desired conclusion. The alternative hypothesis represents the conclusion for which evidence is sought. H 0 : p
34 Hypothesis Testing Hnull & Halternative The test of the null hypothesis is a one-tailed test, because the alternative hypothesis is expressed directionally. If that is not the case, then a two-tailed test would be required, and the hypotheses would be expressed as: H 0 : p = H 1 : p
35 One-Tailed & Two-Tailed Test
36 One-Tailed & Two-Tailed Test
37 Test Statistic The test statistic measures how close the sample has come to the null hypothesis. The test statistic often follows a well-known distribution, such as the normal, t, or chisquare distribution. In our example, the z statistic,which follows the standard normal distribution, would be appropriate. z = p - p s p where s p = p ( 1 - p ) n
38 Type I and Type II error Type I Error Type I error occurs when the sample results lead to the rejection of the null hypothesis when it is in fact true. Type II Error Type II error occurs when, based on the sample results, the null hypothesis is not rejected when it is in fact false.
39 Descriptive Analysis

40 Frequencies - Command
41 Frequencies Question: 1. Is our sample representative? 2. Data entry error Valid Male Female Total Gender Cumulativ e Frequency Percent Valid Percent Percent Current Position Valid Technician Engineer Sr Engineer Manager Abov e manager Total Cumulativ e Frequency Percent Valid Percent Percent
42 Table in Report Gender Male Female Position Technician Engineer Sr Engineer Manager Above manager Frequency Percentage
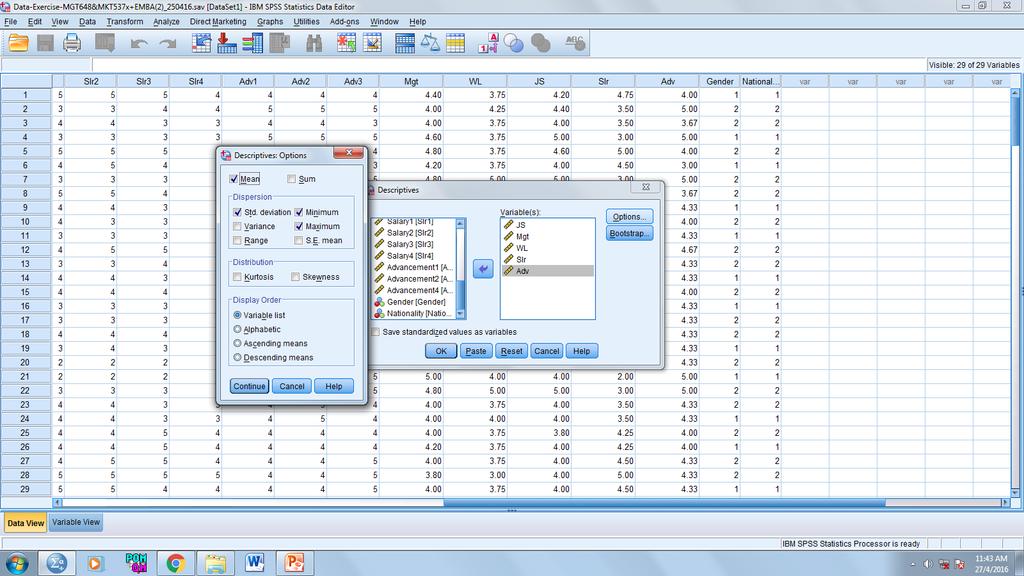
43 Descriptives - Command
44 Descriptives Descriptive Statistics N Minimum Maximum Mean Std. Deviation Skewness Kurtosis Statistic Statistic Statistic Statistic Statistic Statistic Std. Error Statistic Std. Error JS Mgt WL Slr Adv Valid N (listwise) Question: 1. Is there variation in our data? 2. What is the level of the phenomenon we are measuring?
45 Table in Report Mean Std. Deviation Job Satisfaction Management Work Load Salary Advancement
46 Research Framework 5 items Management (Independent) H1 5 items 3 items Advancement (Independent) H2 Job Satisfaction (Dependent) 4 items Salary (Independent) H3 H4 4 items Workload (Independent)


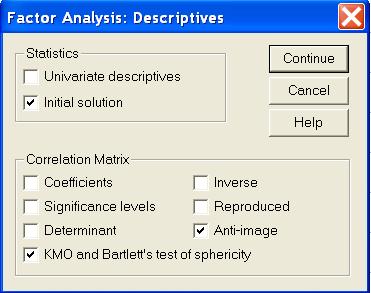
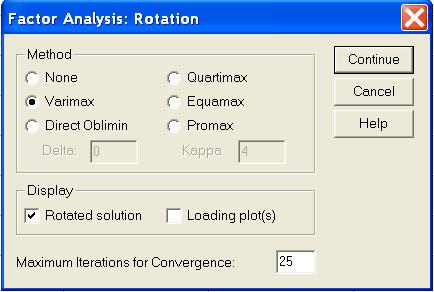
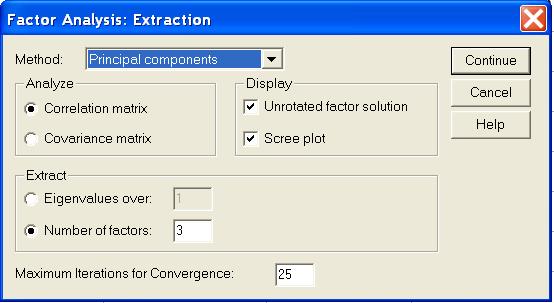
47 Factor Analysis (FA)- Command
48 Assumptions in FA Question: How valid is our instrument? KMO and Bartlett's Test Kaiser-Meyer-Olkin Measure of Sampling Adequacy..890 Approx. Chi-Square Bartlett's Test of Sphericity df 120 Sig..000 KMO should be > 0.5 Bartlett s Test should be significant ie; p < 0.05
49 Measure of Sampling Adequacy MSA Comment 0.80 and above Meritorious Middling Mediocre Miserable Below 0.50 Unacceptable
50 Assigning Questions Communalities Initial Extraction Rotated Component Matrix a Component Management Management Management Management Management WorkLoad WorkLoad WorkLoad Workload Salary Salary Salary Salary Advancement Advancement Advancement Extraction Method: Principal Component Analysis. Rotation Method: Varimax with Kaiser Normalization. a. Rotation converged in 6 iterations. Management Management Management Management Management WorkLoad WorkLoad WorkLoad Workload Salary Salary Salary Salary Advancement Advancement Advancement Extraction Method: Principal Component Analysis. Amount of shared, or common variance, among the variables General guidelines all communnalities should be above 0.5
51 Significant Loadings Factor Loading Sample Size Needed
52 How many Factors? Total Variance Explained Component Initial Eigenvalues Extraction Sums of Squared Loadings Rotation Sums of Squared Loadings Total % of Cumulative Total % of Cumulative Total % of Cumulative Variance % Variance % Variance % Extraction Method: Principal Component Analysis.

53 How many Factors? - Scree Plot
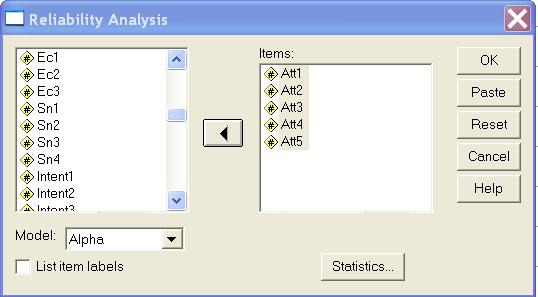
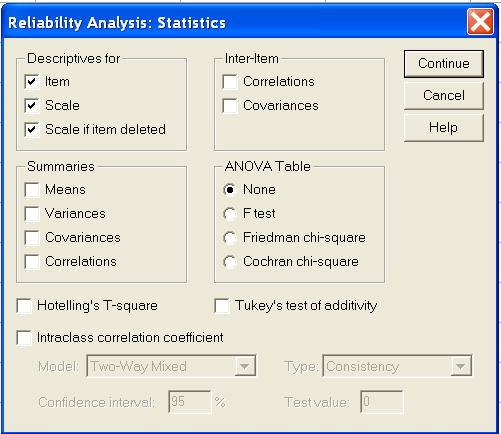
54 Reliability - Command
55 Question: How reliable are our instruments? Reliability Statistics Cronbach's N of Items Alpha Should be preferably > 0.3 Item-Total Statistics Scale Mean if Scale Variance Corrected Item- Cronbach's Item Deleted if Item Deleted Total Alpha if Item Correlation Deleted Management Management Management Management Management
56 Table in Report Variable N of Item Item Alpha Deleted Attitude SN Pbcontrol Intention Actual


57 Computing New Variable - Command
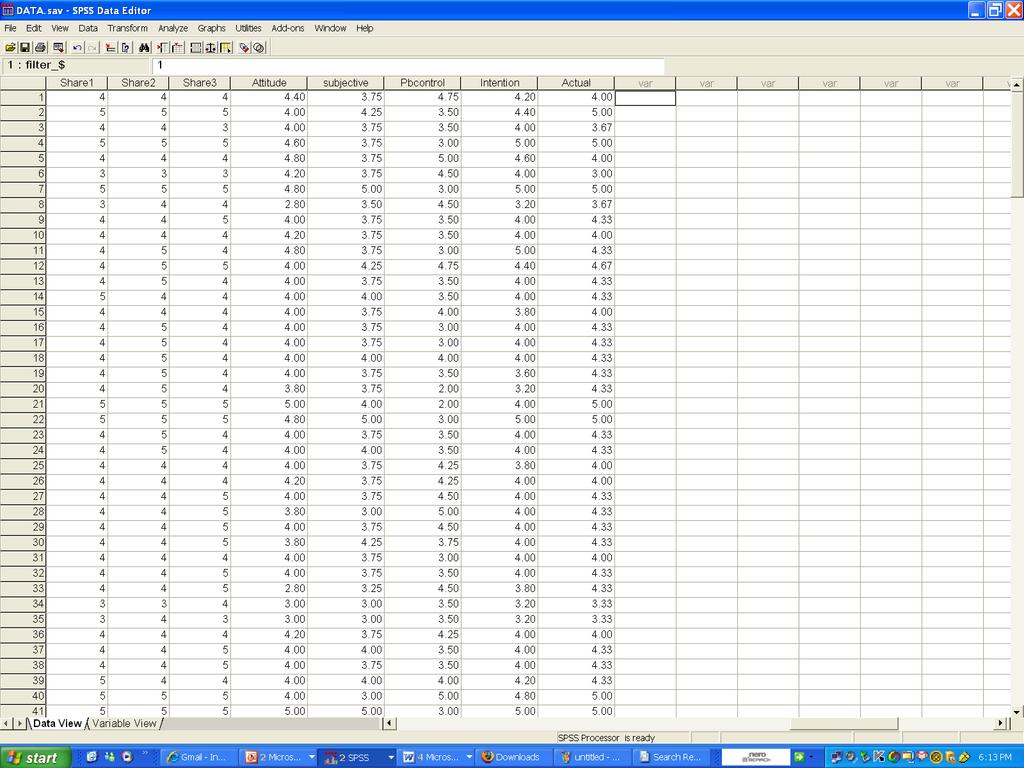
58 Data after Transformation
59 Inferential Analysis


60 Chi Square Test - Command
61 Question: Crosstabulation Is level of sharing dependent on gender? Gender * Inten tion Level Cr osstabu lation Gender Total Male Female Count % wit hin Gender % within Intention Lev el % of Total Count % wit hin Gender % within Intention Lev el % of Total Count % wit hin Gender % within Intention Lev el % of Total Intention Lev el Low High Total % 23.6% 100.0% 70.5% 94.4% 75.0% 57.3% 17.7% 75.0% % 4.2% 100.0% 29.5% 5.6% 25.0% 24.0% 1.0% 25.0% % 18.8% 100.0% 100.0% 100.0% 100.0% 81.3% 18.8% 100.0% Pearson Chi-Square Continuity Correction a Likelihood Ratio Fisher's Exact Test Linear-by-Linear Association N of Valid Cases Chi-Square Tests Asy mp. Sig. Value df (2-sided) b a. Computed only f or a 2x2 table b. Exact Sig. (2-sided) Exact Sig. (1-sided) cells (.0%) hav e expected count less than 5. The minimum expected count is

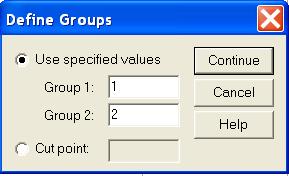
62 T-test - Command
63 Question: t-test (2 Independent) Does intention to share vary by gender? Group Statistics Intention Gender Male Female N Std. Std. Error Mean Dev iation Mean Independent Samples Test Intention Equal variances assumed Equal variances not assumed Levene's Test f or Equality of Variances F Sig. t-test for Equality of Means Mean Std. Error 95% Confidence Interv al of the Dif f erence t df Sig. (2-tailed) Dif f erence Dif f erence Lower Upper

64 Paired t-test - Command
65 Question: t-test (2 Dependent) Are there differences between intention to share and actual sharing behavior? Paired Samples Statistics Pair 1 Intention Actual Std. Std. Error Mean N Dev iation Mean Paired Samples Correl ations Pair 1 Intention & Actual N Correlation Sig Paired Samples Test Pair 1 Intention - Actual Paired Diff erences 95% Confidence Interv al of the Std. Std. Error Diff erence Mean Dev iation Mean Lower Upper t df Sig. (2-tailed)

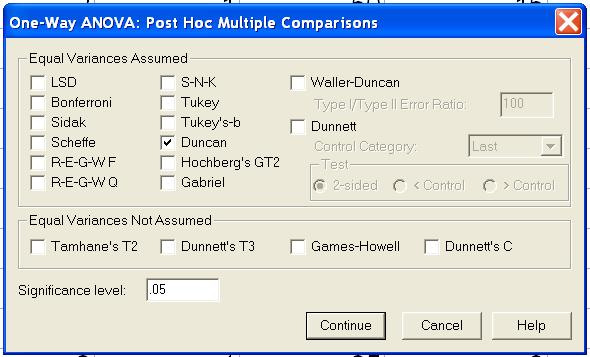
66 One Way ANOVA - Command
67 One way ANOVA (k independent) Question: Does intention vary by position? ANOVA Intention Between Groups Within Groups Total Sum of Squares df Mean Square F Sig Duncan a,b Current Position Engineer Manager Technician Sr Engineer Abov e manager Sig. Intentio n Subset f or alpha =.05 N Means f or groups in homogeneous subsets are display ed. a. Uses Harmonic Mean Sample Size = b. The group sizes are unequal. The harmonic mean of the group sizes is used. Ty pe I error levels are not guaranteed.
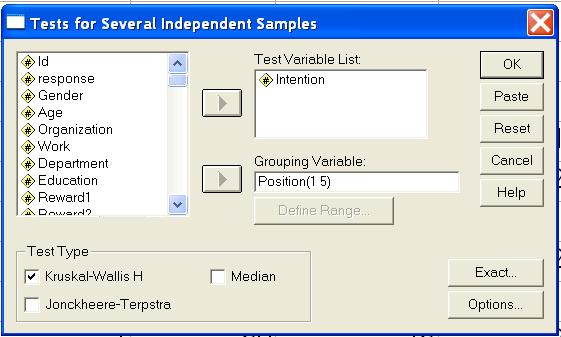
68 Kruskal-Wallis - Command
69 Kruskal-Wallis (k independent) Question: Does the variables vary by position? Ranks Intention Position Technician Engineer Sr Engineer Manager Abov e manager Total N Mean Rank Test Statistics a,b Chi-Square df Asy mp. Sig. Intention a. Kruskal Wallis Test b. Grouping Variable: Posit ion
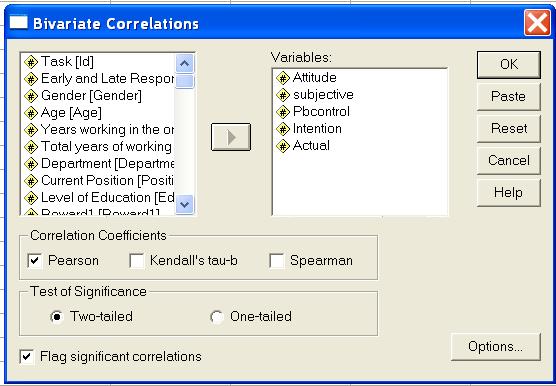
70 Correlation - Command
71 Correlation (Interval/ratio) Question: Are the variables related? Attitude subjectiv e Pbcontrol Intention Actual Pearson Correlation Sig. (2-tailed) N Pearson Correlation Sig. (2-tailed) N Pearson Correlation Sig. (2-tailed) N Pearson Correlation Sig. (2-tailed) N Pearson Correlation Sig. (2-tailed) N Correlati ons **. Correlation is signif icant at the 0.01 lev el (2-t ailed). At tit ude subjectiv e Pbcontrol Intention Actual 1.697**.212**.808**.606** ** **.552** ** ** **.653**.281** 1.817** **.552** **
72 Table Presentation Attitude subjective Pbcontrol Intention Attitude subjective Pbcontrol Intention Actual 1.740** 1.201** **.662**.326** 1 Actual.660**.553** ** 1 *p< 0.05, **p< 0.01
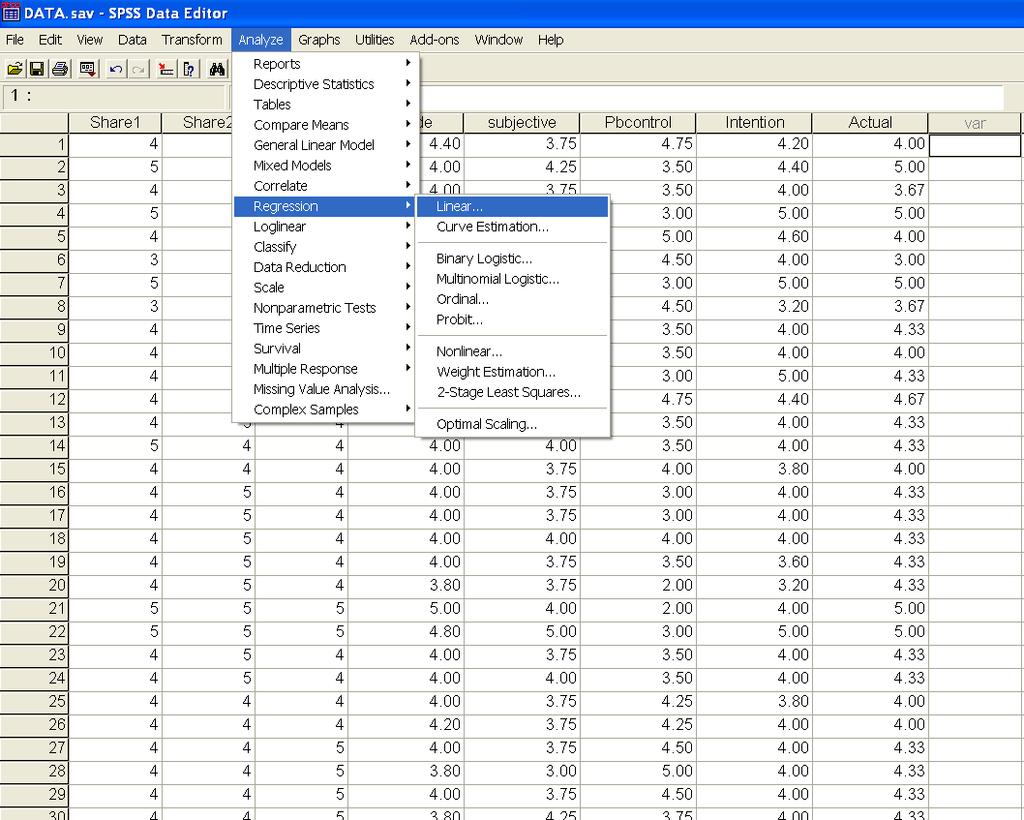
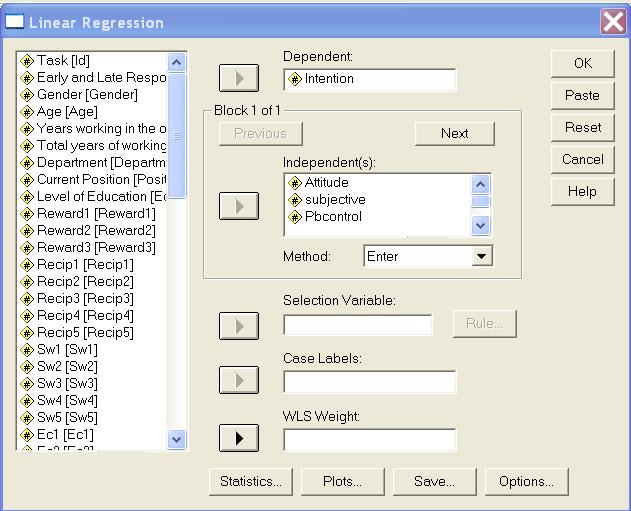
73 Regression - Command
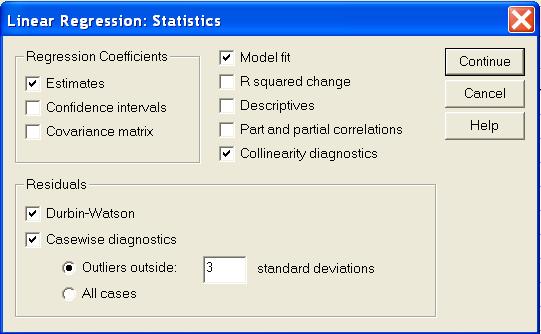
74 Multiple Regression Question: Which variables can explain the intention to share? Model 1 Variables Entered/Removed b Variables Variables Entered Remov ed Method Pbcontrol, subjectiv e, Attitude a. Enter a. All requested v ariables ent ered. b. Dependent Variable: Intent ion R square how much of the variance in the dependent variable is explained by the model Model 1 Model Summary b Adjusted Std. Error of Durbin- R R Square R Square the Estimate Watson.832 a a. Predictors: (Constant), Pbcontrol, subjective, Attitude b. Dependent Variable: Intention
75 Multiple Regression Model 1 Model 1 Regression Residual Total ANOVA b Sum of Squares df Mean Square F Sig a a. Predictors: (Constant), Pbcontrol, subjectiv e, Attitude b. Dependent Variable: Intention (Constant) Attitude subjectiv e Pbcontrol a. Dependent Variable: Intention Coefficients a Unstandardized Standardized Coeff icients Coeff icients Collinearity Statistics B Std. Error Beta t Sig. Tolerance VIF
76 Regression Equation

77 Thank you
Business Research Methods. Introduction to Data Analysis
 Business Research Methods Introduction to Data Analysis Data Analysis Process STAGES OF DATA ANALYSIS EDITING CODING DATA ENTRY ERROR CHECKING AND VERIFICATION DATA ANALYSIS Introduction Preparation of
Subescala D CULTURA ORGANIZACIONAL. Factor Analysis
 Subescala D CULTURA ORGANIZACIONAL Factor Analysis Descriptive Statistics Mean Std. Deviation Analysis N 1 3,44 1,244 224 2 3,43 1,258 224 3 4,50,989 224 4 4,38 1,118 224 5 4,30 1,151 224 6 4,27 1,205
Subescala B Compromisso com a organização escolar. Factor Analysis
 Subescala B Compromisso com a organização escolar Factor Analysis Descriptive Statistics Mean Std. Deviation Analysis N 1 4,42 1,108 233 2 4,41 1,001 233 3 4,99 1,261 233 4 4,37 1,055 233 5 4,48 1,018
Quantitative Methods in Computing Education Research (A brief overview tips and techniques)
") Quantitative Methods in Computing Education Research (A brief overview tips and techniques) Dr Judy Sheard Senior Lecturer Co-Director, Computing Education Research Group Monash University judy.sheard@monash.edu
Quantitative Methods in Computing Education Research (A brief overview tips and techniques) Dr Judy Sheard Senior Lecturer Co-Director, Computing Education Research Group Monash University judy.sheard@monash.edu
APÊNDICE 6. Análise fatorial e análise de consistência interna
 APÊNDICE 6 Análise fatorial e análise de consistência interna Subescala A Missão, a Visão e os Valores A ação do diretor Factor Analysis Descriptive Statistics Mean Std. Deviation Analysis N 1 4,46 1,056
Analysis and Interpretation of Data Part 1
 Analysis and Interpretation of Data Part 1 DATA ANALYSIS: PRELIMINARY STEPS 1. Editing Field Edit Completeness Legibility Comprehensibility Consistency Uniformity Central Office Edit 2. Coding Specifying
CHAPTER VI RESEARCH METHODOLOGY
 CHAPTER VI RESEARCH METHODOLOGY 6.1 Research Design Research is an organized, systematic, data based, critical, objective, scientific inquiry or investigation into a specific problem, undertaken with the
Statistics as a Tool. A set of tools for collecting, organizing, presenting and analyzing numerical facts or observations.
 Statistics as a Tool A set of tools for collecting, organizing, presenting and analyzing numerical facts or observations. Descriptive Statistics Numerical facts or observations that are organized describe
RESULTS. Chapter INTRODUCTION
 8.1 Chapter 8 RESULTS 8.1 INTRODUCTION The previous chapter provided a theoretical discussion of the research and statistical methodology. This chapter focuses on the interpretation and discussion of the
What you should know before you collect data. BAE 815 (Fall 2017) Dr. Zifei Liu
 Dr. Zifei Liu") What you should know before you collect data BAE 815 (Fall 2017) Dr. Zifei Liu Zifeiliu@ksu.edu Types and levels of study Descriptive statistics Inferential statistics How to choose a statistical test
What you should know before you collect data BAE 815 (Fall 2017) Dr. Zifei Liu Zifeiliu@ksu.edu Types and levels of study Descriptive statistics Inferential statistics How to choose a statistical test
isc ove ring i Statistics sing SPSS
 isc ove ring i Statistics sing SPSS S E C O N D! E D I T I O N (and sex, drugs and rock V roll) A N D Y F I E L D Publications London o Thousand Oaks New Delhi CONTENTS Preface How To Use This Book Acknowledgements
MMI 409 Spring 2009 Final Examination Gordon Bleil. 1. Is there a difference in depression as a function of group and drug?
 MMI 409 Spring 2009 Final Examination Gordon Bleil Table of Contents Research Scenario and General Assumptions Questions for Dataset (Questions are hyperlinked to detailed answers) 1. Is there a difference
bivariate analysis: The statistical analysis of the relationship between two variables.
 bivariate analysis: The statistical analysis of the relationship between two variables. cell frequency: The number of cases in a cell of a cross-tabulation (contingency table). chi-square (χ 2 ) test for
Survey research (Lecture 1) Summary & Conclusion. Lecture 10 Survey Research & Design in Psychology James Neill, 2015 Creative Commons Attribution 4.
 Summary & Conclusion. Lecture 10 Survey Research & Design in Psychology James Neill, 2015 Creative Commons Attribution 4.") Summary & Conclusion Lecture 10 Survey Research & Design in Psychology James Neill, 2015 Creative Commons Attribution 4.0 Overview 1. Survey research 2. Survey design 3. Descriptives & graphing 4. Correlation
Summary & Conclusion Lecture 10 Survey Research & Design in Psychology James Neill, 2015 Creative Commons Attribution 4.0 Overview 1. Survey research 2. Survey design 3. Descriptives & graphing 4. Correlation
Survey research (Lecture 1)
") Summary & Conclusion Lecture 10 Survey Research & Design in Psychology James Neill, 2015 Creative Commons Attribution 4.0 Overview 1. Survey research 2. Survey design 3. Descriptives & graphing 4. Correlation
Summary & Conclusion Lecture 10 Survey Research & Design in Psychology James Neill, 2015 Creative Commons Attribution 4.0 Overview 1. Survey research 2. Survey design 3. Descriptives & graphing 4. Correlation
Summary & Conclusion. Lecture 10 Survey Research & Design in Psychology James Neill, 2016 Creative Commons Attribution 4.0
 Summary & Conclusion Lecture 10 Survey Research & Design in Psychology James Neill, 2016 Creative Commons Attribution 4.0 Overview 1. Survey research and design 1. Survey research 2. Survey design 2. Univariate
Statistical analysis DIANA SAPLACAN 2017 * SLIDES ADAPTED BASED ON LECTURE NOTES BY ALMA LEORA CULEN
 Statistical analysis DIANA SAPLACAN 2017 * SLIDES ADAPTED BASED ON LECTURE NOTES BY ALMA LEORA CULEN Vs. 2 Background 3 There are different types of research methods to study behaviour: Descriptive: observations,
List of Figures. List of Tables. Preface to the Second Edition. Preface to the First Edition
 List of Figures List of Tables Preface to the Second Edition Preface to the First Edition xv xxv xxix xxxi 1 What Is R? 1 1.1 Introduction to R................................ 1 1.2 Downloading and Installing
Collecting & Making Sense of
 Collecting & Making Sense of Quantitative Data Deborah Eldredge, PhD, RN Director, Quality, Research & Magnet Recognition i Oregon Health & Science University Margo A. Halm, RN, PhD, ACNS-BC, FAHA Director,
Business Statistics Probability
 Business Statistics The following was provided by Dr. Suzanne Delaney, and is a comprehensive review of Business Statistics. The workshop instructor will provide relevant examples during the Skills Assessment
Still important ideas
 Readings: OpenStax - Chapters 1 11 + 13 & Appendix D & E (online) Plous - Chapters 2, 3, and 4 Chapter 2: Cognitive Dissonance, Chapter 3: Memory and Hindsight Bias, Chapter 4: Context Dependence Still
Study Guide #2: MULTIPLE REGRESSION in education
 Study Guide #2: MULTIPLE REGRESSION in education What is Multiple Regression? When using Multiple Regression in education, researchers use the term independent variables to identify those variables that
Statistics is the science of collecting, organizing, presenting, analyzing, and interpreting data to assist in making effective decisions
 Readings: OpenStax Textbook - Chapters 1 5 (online) Appendix D & E (online) Plous - Chapters 1, 5, 6, 13 (online) Introductory comments Describe how familiarity with statistical methods can - be associated
What Causes Stress in Malaysian Students and it Effect on Academic Performance: A case Revisited
 Advanced Journal of Technical and Vocational Education 1 (1): 155-160, 2017 eissn: 2550-2174 RMP Publications, 2017 What Causes Stress in Malaysian Students and it Effect on Academic Performance: A case
Selecting the Right Data Analysis Technique
 Selecting the Right Data Analysis Technique Levels of Measurement Nominal Ordinal Interval Ratio Discrete Continuous Continuous Variable Borgatta and Bohrnstedt state that "the most of central constructs
Examining differences between two sets of scores
 6 Examining differences between two sets of scores In this chapter you will learn about tests which tell us if there is a statistically significant difference between two sets of scores. In so doing you
Small Group Presentations
 Admin Assignment 1 due next Tuesday at 3pm in the Psychology course centre. Matrix Quiz during the first hour of next lecture. Assignment 2 due 13 May at 10am. I will upload and distribute these at the
Describe what is meant by a placebo Contrast the double-blind procedure with the single-blind procedure Review the structure for organizing a memo
 Please note the page numbers listed for the Lind book may vary by a page or two depending on which version of the textbook you have. Readings: Lind 1 11 (with emphasis on chapters 10, 11) Please note chapter
Unit outcomes. Summary & Conclusion. Lecture 10 Survey Research & Design in Psychology James Neill, 2018 Creative Commons Attribution 4.0.
 Summary & Conclusion Image source: http://commons.wikimedia.org/wiki/file:pair_of_merops_apiaster_feeding_cropped.jpg Lecture 10 Survey Research & Design in Psychology James Neill, 2018 Creative Commons
STATISTICS AND RESEARCH DESIGN
 Statistics 1 STATISTICS AND RESEARCH DESIGN These are subjects that are frequently confused. Both subjects often evoke student anxiety and avoidance. To further complicate matters, both areas appear have
SOME NOTES ON STATISTICAL INTERPRETATION
 1 SOME NOTES ON STATISTICAL INTERPRETATION Below I provide some basic notes on statistical interpretation. These are intended to serve as a resource for the Soci 380 data analysis. The information provided
ANOVA in SPSS (Practical)
") ANOVA in SPSS (Practical) Analysis of Variance practical In this practical we will investigate how we model the influence of a categorical predictor on a continuous response. Centre for Multilevel Modelling
ANOVA in SPSS (Practical) Analysis of Variance practical In this practical we will investigate how we model the influence of a categorical predictor on a continuous response. Centre for Multilevel Modelling
Describe what is meant by a placebo Contrast the double-blind procedure with the single-blind procedure Review the structure for organizing a memo
 Business Statistics The following was provided by Dr. Suzanne Delaney, and is a comprehensive review of Business Statistics. The workshop instructor will provide relevant examples during the Skills Assessment
Validity and Reliability of Sport Satisfaction
 International Research Journal of Applied and Basic Sciences 2014 Available online at www.irjabs.com ISSN 2251-838X / Vol, 8 (10): 1782-1786 Science Explorer Publications Validity and Reliability of Sport
SUMMER 2011 RE-EXAM PSYF11STAT - STATISTIK
 SUMMER 011 RE-EXAM PSYF11STAT - STATISTIK Full Name: Årskortnummer: Date: This exam is made up of three parts: Part 1 includes 30 multiple choice questions; Part includes 10 matching questions; and Part
Collecting & Making Sense of
 Collecting & Making Sense of Quantitative Data Deborah Eldredge, PhD, RN Director, Quality, Research & Magnet Recognition i Oregon Health & Science University Margo A. Halm, RN, PhD, ACNS-BC, FAHA Director,
Still important ideas
 Readings: OpenStax - Chapters 1 13 & Appendix D & E (online) Plous Chapters 17 & 18 - Chapter 17: Social Influences - Chapter 18: Group Judgments and Decisions Still important ideas Contrast the measurement
Basic Steps in Planning Research. Dr. P.J. Brink and Dr. M.J. Wood
 Basic Steps in Planning Research Dr. P.J. Brink and Dr. M.J. Wood Research Levels Level 1: There is little or no literature available on the topic or on the population. The purpose is to describe what
Readings Assumed knowledge
 3 N = 59 EDUCAT 59 TEACHG 59 CAMP US 59 SOCIAL Analysis of Variance 95% CI Lecture 9 Survey Research & Design in Psychology James Neill, 2012 Readings Assumed knowledge Howell (2010): Ch3 The Normal Distribution
POST GRADUATE DIPLOMA IN BIOETHICS (PGDBE) Term-End Examination June, 2016 MHS-014 : RESEARCH METHODOLOGY
 Term-End Examination June, 2016 MHS-014 : RESEARCH METHODOLOGY") No. of Printed Pages : 12 MHS-014 POST GRADUATE DIPLOMA IN BIOETHICS (PGDBE) Term-End Examination June, 2016 MHS-014 : RESEARCH METHODOLOGY Time : 2 hours Maximum Marks : 70 PART A Attempt all questions.
No. of Printed Pages : 12 MHS-014 POST GRADUATE DIPLOMA IN BIOETHICS (PGDBE) Term-End Examination June, 2016 MHS-014 : RESEARCH METHODOLOGY Time : 2 hours Maximum Marks : 70 PART A Attempt all questions.
Understandable Statistics
 Understandable Statistics correlated to the Advanced Placement Program Course Description for Statistics Prepared for Alabama CC2 6/2003 2003 Understandable Statistics 2003 correlated to the Advanced Placement
Table of Contents. Plots. Essential Statistics for Nursing Research 1/12/2017
 Essential Statistics for Nursing Research Kristen Carlin, MPH Seattle Nursing Research Workshop January 30, 2017 Table of Contents Plots Descriptive statistics Sample size/power Correlations Hypothesis
Prepared by: Assoc. Prof. Dr Bahaman Abu Samah Department of Professional Development and Continuing Education Faculty of Educational Studies
 Prepared by: Assoc. Prof. Dr Bahaman Abu Samah Department of Professional Development and Continuing Education Faculty of Educational Studies Universiti Putra Malaysia Serdang At the end of this session,
Teachers Sense of Efficacy Scale: The Study of Validity and Reliability
 EUROPEAN ACADEMIC RESEARCH Vol. II, Issue 12/ March 2015 ISSN 2286-4822 www.euacademic.org Impact Factor: 3.1 (UIF) DRJI Value: 5.9 (B+) Teachers Sense of Efficacy Scale: The Study of Validity and Dr.
CHAPTER 3 RESEARCH METHODOLOGY
 CHAPTER 3 RESEARCH METHODOLOGY 3.1 Introduction 3.1 Methodology 3.1.1 Research Design 3.1. Research Framework Design 3.1.3 Research Instrument 3.1.4 Validity of Questionnaire 3.1.5 Statistical Measurement
Unit 1 Exploring and Understanding Data
 Unit 1 Exploring and Understanding Data Area Principle Bar Chart Boxplot Conditional Distribution Dotplot Empirical Rule Five Number Summary Frequency Distribution Frequency Polygon Histogram Interquartile
11/18/2013. Correlational Research. Correlational Designs. Why Use a Correlational Design? CORRELATIONAL RESEARCH STUDIES
 Correlational Research Correlational Designs Correlational research is used to describe the relationship between two or more naturally occurring variables. Is age related to political conservativism? Are
WELCOME! Lecture 11 Thommy Perlinger
 Quantitative Methods II WELCOME! Lecture 11 Thommy Perlinger Regression based on violated assumptions If any of the assumptions are violated, potential inaccuracies may be present in the estimated regression
Overview of Lecture. Survey Methods & Design in Psychology. Correlational statistics vs tests of differences between groups
 Survey Methods & Design in Psychology Lecture 10 ANOVA (2007) Lecturer: James Neill Overview of Lecture Testing mean differences ANOVA models Interactions Follow-up tests Effect sizes Parametric Tests
PTHP 7101 Research 1 Chapter Assignments
 PTHP 7101 Research 1 Chapter Assignments INSTRUCTIONS: Go over the questions/pointers pertaining to the chapters and turn in a hard copy of your answers at the beginning of class (on the day that it is
Psychology Research Process
 Psychology Research Process Logical Processes Induction Observation/Association/Using Correlation Trying to assess, through observation of a large group/sample, what is associated with what? Examples:
Principal Components Factor Analysis in the Literature. Stage 1: Define the Research Problem
 Principal Components Factor Analysis in the Literature This problem is taken from the research article: Charles P. Flynn and Suzanne R. Kunkel, "Deprivation, Compensation, and Conceptions of an Afterlife."
Undertaking statistical analysis of
 Descriptive statistics: Simply telling a story Laura Delaney introduces the principles of descriptive statistical analysis and presents an overview of the various ways in which data can be presented by
HOW STATISTICS IMPACT PHARMACY PRACTICE?
 HOW STATISTICS IMPACT PHARMACY PRACTICE? CPPD at NCCR 13 th June, 2013 Mohamed Izham M.I., PhD Professor in Social & Administrative Pharmacy Learning objective.. At the end of the presentation pharmacists
Before we get started:
 Before we get started: http://arievaluation.org/projects-3/ AEA 2018 R-Commander 1 Antonio Olmos Kai Schramm Priyalathta Govindasamy Antonio.Olmos@du.edu AntonioOlmos@aumhc.org AEA 2018 R-Commander 2 Plan
Reveal Relationships in Categorical Data
 SPSS Categories 15.0 Specifications Reveal Relationships in Categorical Data Unleash the full potential of your data through perceptual mapping, optimal scaling, preference scaling, and dimension reduction
Basic Biostatistics. Chapter 1. Content
 Chapter 1 Basic Biostatistics Jamalludin Ab Rahman MD MPH Department of Community Medicine Kulliyyah of Medicine Content 2 Basic premises variables, level of measurements, probability distribution Descriptive
Item-Total Statistics
 64 Reliability Case Processing Summary N % Cases Valid 46 00.0 Excluded a 0.0 46 00.0 a. Listwise deletion based on all variables in the procedure. Reliability Statistics Cronbach's Alpha N of Items.869
ADMS Sampling Technique and Survey Studies
 Principles of Measurement Measurement As a way of understanding, evaluating, and differentiating characteristics Provides a mechanism to achieve precision in this understanding, the extent or quality As
investigate. educate. inform.
 investigate. educate. inform. Research Design What drives your research design? The battle between Qualitative and Quantitative is over Think before you leap What SHOULD drive your research design. Advanced
Factorial Validity and Reliability of 12 items General Health Questionnaire in a Bhutanese Population. Tshoki Zangmo *
 Factorial Validity and Reliability of 12 items General Health Questionnaire in a Bhutanese Population Tshoki Zangmo * Abstract The aim of this study is to test the factorial structure and the internal
PRINCIPLES OF STATISTICS
 PRINCIPLES OF STATISTICS STA-201-TE This TECEP is an introduction to descriptive and inferential statistics. Topics include: measures of central tendency, variability, correlation, regression, hypothesis
Statistics Guide. Prepared by: Amanda J. Rockinson- Szapkiw, Ed.D.
 This guide contains a summary of the statistical terms and procedures. This guide can be used as a reference for course work and the dissertation process. However, it is recommended that you refer to statistical
Statistics is the science of collecting, organizing, presenting, analyzing, and interpreting data to assist in making effective decisions
 Readings: OpenStax Textbook - Chapters 1 5 (online) Appendix D & E (online) Plous - Chapters 1, 5, 6, 13 (online) Introductory comments Describe how familiarity with statistical methods can - be associated
Readings: Textbook readings: OpenStax - Chapters 1 4 Online readings: Appendix D, E & F Online readings: Plous - Chapters 1, 5, 6, 13
 Readings: Textbook readings: OpenStax - Chapters 1 4 Online readings: Appendix D, E & F Online readings: Plous - Chapters 1, 5, 6, 13 Introductory comments Describe how familiarity with statistical methods
11/24/2017. Do not imply a cause-and-effect relationship
 Correlational research is used to describe the relationship between two or more naturally occurring variables. Is age related to political conservativism? Are highly extraverted people less afraid of rejection
Introduction to Statistical Data Analysis I
 Introduction to Statistical Data Analysis I JULY 2011 Afsaneh Yazdani Preface What is Statistics? Preface What is Statistics? Science of: designing studies or experiments, collecting data Summarizing/modeling/analyzing
Readings: Textbook readings: OpenStax - Chapters 1 13 (emphasis on Chapter 12) Online readings: Appendix D, E & F
 Online readings: Appendix D, E & F") Readings: Textbook readings: OpenStax - Chapters 1 13 (emphasis on Chapter 12) Online readings: Appendix D, E & F Plous Chapters 17 & 18 Chapter 17: Social Influences Chapter 18: Group Judgments and Decisions
Readings: Textbook readings: OpenStax - Chapters 1 13 (emphasis on Chapter 12) Online readings: Appendix D, E & F Plous Chapters 17 & 18 Chapter 17: Social Influences Chapter 18: Group Judgments and Decisions
Readings: Textbook readings: OpenStax - Chapters 1 11 Online readings: Appendix D, E & F Plous Chapters 10, 11, 12 and 14
 Readings: Textbook readings: OpenStax - Chapters 1 11 Online readings: Appendix D, E & F Plous Chapters 10, 11, 12 and 14 Still important ideas Contrast the measurement of observable actions (and/or characteristics)
9 research designs likely for PSYC 2100
 9 research designs likely for PSYC 2100 1) 1 factor, 2 levels, 1 group (one group gets both treatment levels) related samples t-test (compare means of 2 levels only) 2) 1 factor, 2 levels, 2 groups (one
Describe what is meant by a placebo Contrast the double-blind procedure with the single-blind procedure Review the structure for organizing a memo
 Please note the page numbers listed for the Lind book may vary by a page or two depending on which version of the textbook you have. Readings: Lind 1 11 (with emphasis on chapters 5, 6, 7, 8, 9 10 & 11)
Basic concepts and principles of classical test theory
 Basic concepts and principles of classical test theory Jan-Eric Gustafsson What is measurement? Assignment of numbers to aspects of individuals according to some rule. The aspect which is measured must
THE STATSWHISPERER. Introduction to this Issue. Doing Your Data Analysis INSIDE THIS ISSUE
 Spring 20 11, Volume 1, Issue 1 THE STATSWHISPERER The StatsWhisperer Newsletter is published by staff at StatsWhisperer. Visit us at: www.statswhisperer.com Introduction to this Issue The current issue
Covered in Research Design/Grant Writing. Covered in Writing for Scientific Publication. (c) Alan Schwartz, UIC DME,
 Alan Schwartz, UIC DME,") MHPE 494: Data Analysis Alan Schwartz, PhD Matt Lineberry, PhD Department of Medical Education College of Medicine University of Illinois at Chicago Welcome! Your name, specialty, institution, position
MHPE 494: Data Analysis Alan Schwartz, PhD Matt Lineberry, PhD Department of Medical Education College of Medicine University of Illinois at Chicago Welcome! Your name, specialty, institution, position
Daniel Boduszek University of Huddersfield
 Daniel Boduszek University of Huddersfield d.boduszek@hud.ac.uk Introduction to Multiple Regression (MR) Types of MR Assumptions of MR SPSS procedure of MR Example based on prison data Interpretation of
Chapter 1: Explaining Behavior
 Chapter 1: Explaining Behavior GOAL OF SCIENCE is to generate explanations for various puzzling natural phenomenon. - Generate general laws of behavior (psychology) RESEARCH: principle method for acquiring
Overview of Non-Parametric Statistics
 Overview of Non-Parametric Statistics LISA Short Course Series Mark Seiss, Dept. of Statistics April 7, 2009 Presentation Outline 1. Homework 2. Review of Parametric Statistics 3. Overview Non-Parametric
Statistical Techniques. Masoud Mansoury and Anas Abulfaraj
 Statistical Techniques Masoud Mansoury and Anas Abulfaraj What is Statistics? https://www.youtube.com/watch?v=lmmzj7599pw The definition of Statistics The practice or science of collecting and analyzing
VARIABLES AND MEASUREMENT
 ARTHUR SYC 204 (EXERIMENTAL SYCHOLOGY) 16A LECTURE NOTES [01/29/16] VARIABLES AND MEASUREMENT AGE 1 Topic #3 VARIABLES AND MEASUREMENT VARIABLES Some definitions of variables include the following: 1.
International Conference on Humanities and Social Science (HSS 2016)
") International Conference on Humanities and Social Science (HSS 2016) The Chinese Version of WOrk-reLated Flow Inventory (WOLF): An Examination of Reliability and Validity Yi-yu CHEN1, a, Xiao-tong YU2,
International Conference on Humanities and Social Science (HSS 2016) The Chinese Version of WOrk-reLated Flow Inventory (WOLF): An Examination of Reliability and Validity Yi-yu CHEN1, a, Xiao-tong YU2,
Choosing the Correct Statistical Test
 Choosing the Correct Statistical Test T racie O. Afifi, PhD Departments of Community Health Sciences & Psychiatry University of Manitoba Department of Community Health Sciences COLLEGE OF MEDICINE, FACULTY
Dr. SANDHEEP S. (MBBS MD DPH) Dr. BENNY PV (MBBS MD DPH) (DATA ANALYSIS USING SPSS ILLUSTRATED WITH STEP-BY-STEP SCREENSHOTS)
 Dr. BENNY PV (MBBS MD DPH) (DATA ANALYSIS USING SPSS ILLUSTRATED WITH STEP-BY-STEP SCREENSHOTS)") Dr. SANDHEEP S. (MBBS MD DPH) Dr. BENNY PV (MBBS MD DPH) (DATA ANALYSIS USING SPSS ILLUSTRATED WITH STEP-BY-STEP SCREENSHOTS) Biostatistics in a Nut Shell For Medical Researchers i Publishing-in-support-of,
Dr. SANDHEEP S. (MBBS MD DPH) Dr. BENNY PV (MBBS MD DPH) (DATA ANALYSIS USING SPSS ILLUSTRATED WITH STEP-BY-STEP SCREENSHOTS) Biostatistics in a Nut Shell For Medical Researchers i Publishing-in-support-of,
Introduction to statistics Dr Alvin Vista, ACER Bangkok, 14-18, Sept. 2015
 Analysing and Understanding Learning Assessment for Evidence-based Policy Making Introduction to statistics Dr Alvin Vista, ACER Bangkok, 14-18, Sept. 2015 Australian Council for Educational Research Structure
AMSc Research Methods Research approach IV: Experimental [2]
![AMSc Research Methods Research approach IV: Experimental [2]](/thumbs/96/127502980.jpg "AMSc Research Methods Research approach IV: Experimental [2]") AMSc Research Methods Research approach IV: Experimental [2] Marie-Luce Bourguet mlb@dcs.qmul.ac.uk Statistical Analysis 1 Statistical Analysis Descriptive Statistics : A set of statistical procedures
AMSc Research Methods Research approach IV: Experimental [2] Marie-Luce Bourguet mlb@dcs.qmul.ac.uk Statistical Analysis 1 Statistical Analysis Descriptive Statistics : A set of statistical procedures
SPSS output for 420 midterm study
 Ψ Psy Midterm Part In lab (5 points total) Your professor decides that he wants to find out how much impact amount of study time has on the first midterm. He randomly assigns students to study for hours,
Ecological Statistics
 A Primer of Ecological Statistics Second Edition Nicholas J. Gotelli University of Vermont Aaron M. Ellison Harvard Forest Sinauer Associates, Inc. Publishers Sunderland, Massachusetts U.S.A. Brief Contents
Using a Likert-type Scale DR. MIKE MARRAPODI
 Using a Likert-type Scale DR. MIKE MARRAPODI Topics Definition/Description Types of Scales Data Collection with Likert-type scales Analyzing Likert-type Scales Definition/Description A Likert-type Scale
One-Way Independent ANOVA
 One-Way Independent ANOVA Analysis of Variance (ANOVA) is a common and robust statistical test that you can use to compare the mean scores collected from different conditions or groups in an experiment.
Associate Prof. Dr Anne Yee. Dr Mahmoud Danaee
 Associate Prof. Dr Anne Yee Dr Mahmoud Danaee 1 2 What does this resemble? Rorschach test At the end of the test, the tester says you need therapy or you can't work for this company 3 Psychological Testing
Applications. DSC 410/510 Multivariate Statistical Methods. Discriminating Two Groups. What is Discriminant Analysis
 DSC 4/5 Multivariate Statistical Methods Applications DSC 4/5 Multivariate Statistical Methods Discriminant Analysis Identify the group to which an object or case (e.g. person, firm, product) belongs:
An Introduction to Research Statistics
 An Introduction to Research Statistics An Introduction to Research Statistics Cris Burgess Statistics are like a lamppost to a drunken man - more for leaning on than illumination David Brent (alias Ricky
Data and Statistics 101: Key Concepts in the Collection, Analysis, and Application of Child Welfare Data
 TECHNICAL REPORT Data and Statistics 101: Key Concepts in the Collection, Analysis, and Application of Child Welfare Data CONTENTS Executive Summary...1 Introduction...2 Overview of Data Analysis Concepts...2
Here are the various choices. All of them are found in the Analyze menu in SPSS, under the sub-menu for Descriptive Statistics :
 Descriptive Statistics in SPSS When first looking at a dataset, it is wise to use descriptive statistics to get some idea of what your data look like. Here is a simple dataset, showing three different
AS Psychology Curriculum Plan & Scheme of work
 AS Psychology Curriculum Plan & Scheme of work 2015-16 Week Content Further detail and reference to specification H/w. Reading & Notes, Resources, Extension activities Hodder textbook pages 1-12 Hodder
WDHS Curriculum Map Probability and Statistics. What is Statistics and how does it relate to you?
 WDHS Curriculum Map Probability and Statistics Time Interval/ Unit 1: Introduction to Statistics 1.1-1.3 2 weeks S-IC-1: Understand statistics as a process for making inferences about population parameters
HS Exam 1 -- March 9, 2006
 Please write your name on the back. Don t forget! Part A: Short answer, multiple choice, and true or false questions. No use of calculators, notes, lab workbooks, cell phones, neighbors, brain implants,
Measuring the User Experience
 Measuring the User Experience Collecting, Analyzing, and Presenting Usability Metrics Chapter 2 Background Tom Tullis and Bill Albert Morgan Kaufmann, 2008 ISBN 978-0123735584 Introduction Purpose Provide
Validity and reliability of measurements
 Validity and reliability of measurements 2 3 Request: Intention to treat Intention to treat and per protocol dealing with cross-overs (ref Hulley 2013) For example: Patients who did not take/get the medication