Alcohol consumption, alcohol dependence and attributable burden of disease in Europe
|
|
|
- Roy Fields
- 6 years ago
- Views:
Transcription


1 Alcohol consumption, alcohol dependence and attributable burden of disease in Europe Potential gains from effective interventions for alcohol dependence jürgen rehm kevin d. shield Maximilien X. Rehm Gerrit Gmel Ulrich Frick
2 Alcohol consumption, alcohol dependence and attributable burden of disease in Europe: Potential gains from effective interventions for alcohol dependence ISBN: (PRINT) ISBN: (PDF) ISBN: (HTML) ISBN: (epub) Printed in Canada Copyright 2012 Centre for Addiction and Mental Health No part of this work may be reproduced or transmitted in any form or by any means electronic or mechanical, including photocopying and recording, or by any information storage and retrieval system without written permission from the publisher except for a brief quotation (not to exceed 200 words) in a review or professional work. Website: /
3 Alcoholconsumption,alcoholdependence andattributableburdenofdiseaseineurope: Potentialgainsfromeffectiveinterventionsforalcoholdependence Authors:JürgenRehm, 16 * KevinD.Shield, 1,3 *MaximilienX.Rehm, 7 GerritGmel, 1,8 UlrichFrick 9 *JRandKSsharefirstauthorship. Affiliations CentreforAddictionandMentalHealth(CAMH),Toronto InstituteforClinicalPsychologyandPsychotherapy,TechnischeUniversität,Dresden,Germany InstituteofMedicalScience,UniversityofToronto,Canada DallaLanaSchoolofPublicHealth(DLSPH),UniversityofToronto,Canada DepartmentofPsychiatry,UniversityofToronto,Canada PAHO/WHOCollaboratingCentreforMentalHealthandAddiction FacultyofArtsandSciences/PoliticsandGovernance,RyersonUniversity,Toronto,Canada EcolePolytechniqueFédéraledeLausanne,Lausanne,Switzerland Dept.HealthcareManagement,CarinthiaUniversityofAppliedSciences,Feldkirchen,Austria Correspondingauthor:J.Rehm,CAMH,33RussellStreet,Toronto,ON,M5S2S1,Canada Competinginterests:Theauthorshavedeclaredthatnocompetinginterestsexist. Funding:ThisworkwassupportedbyanunrestrictedcontractfromLundbeckA/S.Inaddition,WHO EuropeanRegionsupportedthecalculationsofalcoholattributableharm;andthemethodologyfor determiningalcoholattributablefractionswasdevelopedasaresultofthecomparativerisk AssessmentoftheGlobalBurdenofDisease2005study. Acknowledgments:TheauthorswouldliketothankPeterAnderson,PeterIversenandUliWittchenfor theirveryhelpfulcommentsonanearlierversionofthismanuscript.thanksalsogotojuliegraysonfor Englishcopyediting,andtoMichelleTortoloandChristineVrbanacforreferencingthemultipleversions ofthismanuscript. 1
4
5 TABLEOFCONTENTS ALCOHOLCONSUMPTION,ALCOHOLDEPENDENCEANDATTRIBUTABLEBURDENOFDISEASEIN EUROPE:POTENTIALGAINSFROMEFFECTIVEINTERVENTIONSFORALCOHOLDEPENDENCE... 1 FOREWORD...7 WAKEUPCALLFOREUROPE SDRINKINGPROBLEM...8 DealingwithEurope sdrinkingproblem...8 WhyhasEuropegotitsowrong?...8 Enterthepharmaceuticalbusiness...9 References...10 EXECUTIVESUMMARY...11 ABBREVIATIONSUSED...14 THEAIMOFTHISBOOK...15 TRADITIONALPATTERNSOFALCOHOLCONSUMPTIONINEUROPE...16 KEYINDICATORSOFALCOHOLCONSUMPTIONINEUROPE...18 Drinkingstatusandvolumeofdrinking...18 Table1:Keyalcoholconsumptionindicators Derivingindicatorsforalcoholconsumption...22 Measuresofalcoholconsumption:definitionsandprocedures Adultalcoholconsumptionin Figure1:Adultconsumptioninlitres Table2:Adultconsumptionanddrinkingpatterns Timetrendsinconsumption Figure2:Adultconsumptioninlitressince Patternsofdrinking...28 Figure3:Globalpatternsofdrinking(2005) Heavydrinkingoccasions...29 Table3:Frequencyofdrinkingbycountry ALCOHOLATTRIBUTABLEBURDENOFDISEASEINEUROPE...31 Acknowledgment...31 Relationshipsbetweenalcohol,diseaseandinjury...32 Methodologyforderivingthealcoholattributableburden...32 Theproblemoftimelag...33 Alcoholattributablemortality
6 Deathsduetoalcoholconsumption Figure4:Regionalvariationsinproportionsofdeaths Figure5:Countryvariationsintheproportionsofdeaths Table4:Deathsbydiseasecategories Figure6:Proportionofdeathsformajordiseasecategories PotentialYearsofLifeLost(PYLL)duetoalcohol Figure7:RegionalvariationsintheproportionofPYLL Figure8:ProportionofPYLLformajordiseasecategories Alcoholattributabledisabilityandburdenofdisease...44 YearsofLifeLostDuetoDisability(YLD) Figure9:AlcoholattributableYLDtoallYLD,byregion Burdenofdiseaseduetoalcohol Figure10:AlcoholattributableDALYstoallDALYs,byregion Figure11:ProportionofalcoholattributableDALYstoallDALYs Table5:AlcoholattributableDALYsbydiseasecategories Figure12:ProportionsofalcoholattributableburdenofdiseaseinDALYs Healthharmstoothersduetoalcoholconsumption...50 Table6:Alcoholattributablemortalityanddiseasecausedbyharmstoothers THECONTRIBUTIONOFHEAVYDRINKING...53 Table7:Alcoholattributablemortalityanddisease ALCOHOLDEPENDENCE:PREVALENCEANDASSOCIATEDHARM...55 Definitionofalcoholdependence...55 Prevalenceofalcoholdependence...56 Table8:Peopleaffectedwithalcoholdependence,bycountry Mortalityandburdenofdiseaseofalcoholdependenceasadiseasecategoryin Table9:Deaths,PYLLandDALYslostduetoalcoholdependence Theoverallhealthburdenattributabletoalcoholdependenceasariskfactor...63 QuantifyingthemortalityburdenofAD...65 Comparingalcoholattributablemortality...66 Figure13:MortalityattributabletoalcoholconsumptionandAD OVERALLBURDENANDSOCIALCOSTSOFALCOHOLDEPENDENCE...69 BurdensattributabletoAD...69 Figure14:BurdensofAD,afterincidence...70 Figure15:BurdensofpersistentAD ThesocialcostofalcoholandAD...72 Figure16:SocialcostsofalcoholintheEU, THEMEDICALTREATMENTSYSTEMFORALCOHOLDEPENDENCE...74 ProportionofpeoplewithADintreatment
7 TreatmentintheEU:reductionofdrinkingasagoal...75 Table10:CharacteristicsofADTsystems INTERVENTIONSCENARIOS...79 Dointerventionsaffectsurvival?...80 EffectivenessofADTonreducingconsumption...82 Table11:Assumptionsformodellinginterventions Thestatisticalmodelforestimatinginterventioneffects...85 Thedistributionofabstainersanddrinkers...85 Figure17:AlcoholconsumptioninmenwithAD,beforeandafterintervention Figure18:AlcoholconsumptioninwomenwithAD,beforeandafterintervention Deathsavoidedduetointerventions...88 Figure19a:Deathsavoidedinmen Figure19b:Deathsavoidedinwomen Figure20a:Deathsavoidedinmen Figure20b:Deathsavoidedinwomen Figure21a:Deathsavoidedinmen(asaproportionofalldeaths) Figure21b:Deathsavoidedinwomen(asaproportionofalldeaths) CONCLUSIONSFORALCOHOLPOLICY...92 WEBAPPENDIX1:ADULTALCOHOLCONSUMPTION...95 WEBAPPENDIX2:ESTIMATINGTHEALCOHOLATTRIBUTABLEBURDEN...97 Modellingaverageconsumption...97 DerivingalcoholattributablefractionsfromexposureandRRs...98 Step1:CalculationofAAFsbycountry,age,andsex...98 Definingagecategories Countriesincludedintheanalysis Sourcesformodellingriskrelations AAFsforchronicandinfectiousdiseases(exceptischemicheartdisease) AAFsforischemicheartdisease EstimatingAAFsforlowbirthweight EstimatingAAFsforinjuries EstimatingAAFsduetoheavydrinking EstimatingconfidenceintervalsfortheAAFs Step2:ApplicationoftheAAFstoregionspecificmortality,PYLL,YLDandDALYsdata Estimatingmortalityandmorbidity WEBAPPENDIX3:SOURCESFORDETERMININGRISKSFORDISEASECATEGORIES WEBAPPENDIX4:CONFIDENCEINTERVALSFORESTIMATESOFMORTALITY WEBAPPENDIX5:STANDARDIZEDMORTALITYPER100,
8 WEBAPPENDIX6:ALCOHOLATTRIBUTABLEPYLL WEBAPPENDIX7:ALCOHOLATTRIBUTABLEYLD WEBAPPENDIX8:ALCOHOLATTRIBUTABLEDALYS WEBAPPENDIX9:ALCOHOLATTRIBUTABLEDEATHS,BYREGION CentralWestandWesternEurope:alcoholattributabledeaths CentralEastandEasternEurope:alcoholattributabledeaths Nordiccountries:alcoholattributabledeaths SouthernEurope:alcoholattributabledeaths WEBAPPENDIX10:ALCOHOLATTRIBUTABLEDALYS CentralWestandWesternEurope:alcoholattributableDALYs CentralEastandEasternEurope:alcoholattributableDALYs Nordiccountries:alcoholattributableDALYs SouthernEurope:alcoholattributableDALYs WEBAPPENDIX11:ESTIMATINGHARMTOOTHERS,BYCOUNTRY Figure22a:Alcoholattributabledeathscausedbyharmstoothers Figure22b:AlcoholattributableDALYscausedbyharmstoothers WEBAPPENDIX12:PREVALENCEOFALCOHOLDEPENDENCE,BYCOUNTRY WEBAPPENDIX13:PREVALENCEOFALCOHOLDEPENDENCE,BYREGION WEBAPPENDIX14:ALCOHOLATTRIBUTABLEMORTALITY WEBAPPENDIX15:PROPORTIONOFMORTALITYBYREGION CentralWestandWesternEuropeanRegion CentralEastandEasternEuropeanRegion NordicCountries SouthernEuropeanRegion WEBAPPENDIX16:TREATMENTACCESSFORPEOPLEWITHAD WEBAPPENDIX17:ESTIMATINGINTERVENTIONEFFECTS WEBAPPENDIX18:ALCOHOLATTRIBUTABLEDEATHSPREVENTEDBYTREATMENT EuropeanUnionEstimates RegionalEstimates REFERENCES
9 Foreword AlcoholremainsEurope sfavouritedrug.whileoverallalcoholconsumptionineuropehas remainedrelativelystableoverrecentyears,itstillcontributestoasubstantialburdenofdiseaseand prematuredeaths.alongwithsmokingandobesity,alcoholisaleadingpreventablecauseofillhealth. Further,althoughoverallpercapitaconsumptionofalcoholisrelativelystable,thisconcealsvariation betweencountries:alcoholconsumptionhasincreasedinsomenorthernandeasterneuropean countriescomparedtoreductionsintraditionallywinedrinkingcountries.inadditiontothehealth consequences,alcoholcontributestoawiderangeofsocialandcriminaljusticecosts placinga considerableburdenontheeuropeaneconomy. Thisreportprovidesatimelyandcomprehensivereviewoftherelationshipbetweenalcohol consumptionandharmineurope.whileeuropeanalcoholstrategieshavetypicallyfocusedonreducing alcoholmisusethroughcontrolsonavailability,marketingandprice,anddrunkdriving countermeasures,thisreporthighlightstheconsiderablepotentialtoreducealcoholrelatedharm throughwiderimplementationofindividuallydirectedinterventionsforpeoplewithalcohol dependence.thereisnowaconsiderableevidencebasewhichsupportstheeffectivenessandcost effectivenessofbriefinterventions,andarangeofspecialisttreatmentforpeoplewithalcoholuse disorders.however,thisreporthighlightsthecurrentgapbetweenevidenceandpractice.lessthan10% ofpeoplewithalcoholdependencereceivetreatmentineurope;andyetalcoholdependenceaccounts forasubstantialproportionofallharmassociatedwithalcohol. RehmandcolleaguesprovideacompellingcaseforactioninEurope atbothanindividual countrylevelandapaneuropeanleveltomaketreatmentforalcoholdependencemorewidely available.thecurrentpatchworkofservicesforpeoplewithalcoholdependencehasresultedfroma lackofstrategicdirectionandafailuretoexploitknowledgewealreadypossessonwhatworksin helpingpeopletoreduceorstopdrinkingalcohol.manyeuropeancountrieshavenonationalor professionalguidelinestoinformcliniciansandcommissionersofhealthcare. Increasingtheproportionofpeoplewithalcoholdependencewhogainaccesstoeffective treatmentmustnowbeaeuropewidepriority.indoingso,onemustnotunderestimatethepotential challengesincludingtrainingforhealthprofessionalsandcostsofimplementation.however,giventhe provencosteffectivenessoftreatmentforalcoholdependence,suchinvestmentislikelytoyield significantcostsavingsaswellasreducedhumansuffering. ColinDrummond,MD,FRCPsych ProfessorofAddictionPsychiatry,NationalAddictionCentre,InstituteofPsychiatry, King scollegelondon,london,uk 7
10 WakeupcallforEurope sdrinkingproblem ThisstudyisawakeupcallthattheEuropeanUnionhasadrinkingproblem.Andnotjusta drinkingproblem,butanenormousdrinkingproblem.anypracticingdoctor,particularlyafamilydoctor, asiwas,oraliverdoctororpsychiatrist,willknowthedevastationthatbeingdependentonalcohol wreaksonthelivesnotjustofthedrinker,butalsoonthoseoffamily,friendsandworkcolleagues.itis simplyawful.terriblethoughalcoholdependenceis,asapublichealthdoctor,ialwaysthoughtitthetip oftheicebergofalcoholrelatedpublichealthproblems.but,accordingtothisstudy,whenitisfully analysed,heavydrinkingandalcoholdependenceistheiceberg.andatthepublichealthlevel,itisalso simplyawful.foralldrinkingasawhole,oneinsevenofallmaledeathsintheeuropeanunioninthe agerangeof15 64yearsisduetoalcohol,andonein13ofallfemaledeaths.Accordingtothisreport, sevenoutoftenofthesedeathscomefromalcoholdependence,andnineoutoftenofalltheeuropean illhealthandprematuredeathduetoalcoholcomesfromheavydrinking(definedhereas60+gramsof alcoholperdayformenand40+forwomen). DealingwithEurope sdrinkingproblem Intheirjointsubmissiontothe2011UNhighlevelmeetingonnoncommunicablediseases,the WorldEconomicForumandtheWorldHealthOrganization(2011)listedthethree bestbuys for alcoholpolicyaspriceincrease,limitsonavailabilityandbansonadvertising.thisreportonalcohol dependenceclearlydemonstratesthatbriefinterventionsforheavydrinking,andtreatmentsforalcohol dependence,urgentlyneedtobeaddedtothislist,totrytoclosetheimmoralgapbetweenneedand uptakeofeffectiveevidencebasedtreatment. WhyhasEuropegotitsowrong? ThefactthattheEuropeanUnionhasadrinkingproblem,andthatitsoverallconsumption(at morethantwicetheworld saverage)hasremainedstaticinthelasttenyears,suggeststhatthe EuropeanUnionisnotdoingatallwell.Bytheirownadmission,forthemostpart,countriesthemselves saythattheyhavebeendoingthewrongthings.overthefiveyears ,accordingtothe2012 WorldHealthOrganizationreportonAlcoholintheEuropeanUnion(Anderson,Møller&Galea2012), areasofpolicythatgotstrongerineuropeanunioncountrieswereprimarilymoreeducationandmore communityaction;andthepolicyareasthatdidnotgetstronger,orgotweaker,werepricingand advertising.thisissimplythewrongwayround,giventheevidenceonwhatmighthavemadea differencetoreducingtheharmdonebyalcohol.tosomeextent,ofcourse,thesecountrieswere consistentinfollowingtheadvicethattheyweregiven theeuropeancommission scommunicationon 8
11 Alcohol(2006)hadalottosayabouttheimportanceofmoreeducation,buthardlyanythingtosay abouttheimportanceofprice.therehasbeenalotwrittenaboutwhythisis(gordon&anderson 2011).Onesuggestedreasonhasbeenthepolicyinfluenceofthealcoholindustryitself theec Communicationbeingwellalignedwiththeindustry sviewsonalcoholpolicy.further,theeuropean bodyinvitedtobrokerdiscussionbetweenthealcoholindustryandpublichealthactors,theeuropean PolicyCentre,hasindustry sviewsatheart havingbeenemployed,forexample,bythetobacco industrytolobbytheeuropeancommissionintheindustry scommercialinterests(smithetal2010). TheCommissionpurportstoengagethealcoholbusinessthroughitsAlcoholandHealthForum. Butthishasnotbeendoneinanymeaningfulway,withengagementbeingattoolowalevel,and expectationstootrivial oftenonlyatthelevelofpublicrelations,suchasfinancingalcoholeducation orrunningvoluntarycodesonadvertisingcontent(celiaetal2010).theeuropeancommission s complicity,alongwiththengocommunitythathasgonealongwiththeprocess,hascostlives:600,000 EuropeanUnioncitizenshavediedfromapreventablealcoholcauseddeathoverafiveyeartimespan ofthecommission scommunication. Interestingly,theUKgovernment salcoholstrategy,launchedinmarch2012,illustrateswhat meaningfulactionbythealcoholindustrymightlooklike:removing8billiongramsofalcoholfromthe marketby2015bysellingproductswithaloweralcoholconcentration,incentivizedbylowertaxeson loweralcoholstrengthbeers(hermajesty sgovernment2012).thiswouldmeanthatthese8billion gramsofalcoholarenotconsumedbyanyoneandthuscannotcreateharm.thereisadesperateneed fortheeuropeancommissiontogetitrightthenexttimeroundinitscommunicationonalcohol perhapsbyconsideringthatthewellbeingandhealthofthepeopleofeuropeactuallymatter. Enterthepharmaceuticalbusiness WhenIwasregionaladvisorfortobaccocontrolintheWHOEuropeanOfficeinthelate1990s,I setupapublic/privatesectorpartnershipbetweenwho,europeanpublichealth,andfour pharmaceuticalcompaniesmanufacturingtreatmentproductsfornicotinedependence.thiswasa highlysuccessfulinitiativeinmakingarealdifference,butperhapswhatwasshockingwasthatittook thepharmaceuticalbusinesstodragthereluctantpublichealthsectorintotherealworldofurgencyto helpsmokersquitsmoking throughbothimplementingeffectivetobaccopolicyandmakingevidence basedtreatmentsmuchmoreaccessible.perhapsthisreportcanbeasimilarwakeupcallformore urgentandeffectiveeuropeanactiononalcohol. 9
12 PeterAnderson,MD,MPH,PhD,FRCP Professor,SubstanceUse,PolicyandPractice,InstituteofHealthandSociety,NewcastleUniversity, England Professor,AlcoholandHealth,FacultyofHealth,MedicineandLifeSciences,MaastrichtUniversity, Netherlands References Anderson,P.,Møller,L.,Galea,G.(Eds)(2012).AlcoholintheEuropeanUnion.Copenhagen,Denmark: WorldHealthOrganization. Celia,C.,Diepeveen,S.,Ling,T.(2010).TheEuropeanAlcoholandHealthForum:FirstMonitoring ProgressReport.RANDEuropeforEuropeanCommission. EuropeanCommission(2006).CommunicationonAlcohol. Gordon,R.,Anderson,P.(2011).Scienceandalcoholpolicy:acasestudyoftheEUStrategyonAlcohol. Addiction.106Supplement HerMajesty sgovernment(2012).thegovernment salcoholstrategy.london,uk:hermajesty s Government. Smith,K.,Fooks,G.,Collin,J.,Weishaar,H.,Mandal,S.,Gilmore,A.(2010). Workingthesystem BritishAmericanTobacco sinfluenceontheeuropeanuniontreatyanditsimplicationsforpolicy:an analysisofinternaltobaccoindustrydocuments.plosmedicine.7(1). WorldHealthOrganizationandWorldEconomicForum(2011).Fromburdento bestbuys :reducing theeconomicimpactofnoncommunicablediseasesinlowandmiddleincomecountries. 10
13 ExecutiveSummary AlcoholconsumptionhasbeendeeplyembeddedinEuropeancultureforcenturies.Whilethe currentvolumeofalcoholconsumptionintheeuropeanunion(eu)hasbeenstableforseveralyears,it isstillhigh morethantwicethegloballevel.therearealsodivergingregionaltrends:thetraditional winedrinkingcountrieshavebeenreducingalcoholconsumptionformorethantwodecades,whilethe Nordiccountries,theCentralEastandEasternEUcountriesandtheBritishIsleshavebeenincreasing consumptionoverthepastdecade(s).withineurope,drinkingpatternsvaryconsiderably:thereare moreirregularoccasionsofheavydrinkingineasterneuropeanandnordiccountries,aswellasinthe BritishIsles. Alcoholconsumptionisacontributorycauseofmorethan200illnessesdefinedbythe InternationalClassificationofDiseases(ICD10)asthreedigitdiseasecodes.Thesearemostlyinadose responsemanner i.e.themorealcoholconsumed,thehighertherisksforalcoholattributabledisease. Asaconsequence,intheEUin2004,almost95,000menandmorethan25,000women,aged15to64, diedofalcoholattributablecauses(total120,000).thismeansthat1in7maledeaths,and1in13 femaledeaths,inthisagecategorywerecausedbyalcohol.(thesenetnumbershavealreadytakeninto considerationtheprotectiveeffectofalcoholconsumptiononischemicdiseaseanddiabetes.)the proportionalcontributiontomorbidityanddisabilityisevenhigher.thismakesalcoholconsumption oneofthemostimportantriskfactorsforavoidablemortalityanddiseaseinearlyandmiddle adulthood. Mostofthehealthharmsrelatedtoalcoholarecausedbyheavydrinking.Almost80%ofall malenetdeathsattributabletoalcohol,andabout67%ofallfemalealcoholattributablenetdeaths, wereduetoheavydrinking definedasconsumingatleast60gofpurealcoholperdayformen,andat least40gforwomen.withrespecttotheburdenofdisease,heavydrinkingaccountedforaneven higherproportionofalcoholattributablenetdisabilityadjustedlifeyears(dalys)lost,withalmost90% oftheburdencausedbythisformofconsumption.heavydrinking,bothregularandirregular,thus causestheoverwhelmingmajorityofthealcoholattributablehealthburden. Themostimportantcauseofthesignificanthealthburdenisalcoholdependence both directly,asadisease,andindirectly,asariskfactor:alcoholdependencecausesbothmortalityand diseasessuchaslivercirrhosisandcancer.mostoftheimpactofalcoholdependenceseemstobe 11
14 mediatedbyirregularandregularheavydrinking.in2004,alcoholdependenceaccountedformorethan 70%oftheoverallalcoholattributablenetmortalitybeforeage65,andproportionallymoreinyounger agegroups.thisproportionisallthemoreastonishingsincealcoholdependence(likeothermental disorders)isusuallyclassifiedasdisablingbutnotfatal. Whiletheimpactofalcoholconsumptionanddependenceonmortalityanddiseaseis substantial,therearealsomanysocialandeconomicburdensresultingfromtheeffectsofalcoholon individuals,families,workplaces,andsocietyasawhole.thismeansthatalcoholconsumptionand dependencehavesizableimpactsonmanypeopleotherthanthedrinker.amongthemostdevastating effectsareinsufficientfulfillmentsofroles;familyproblems,includingdivorce;problemswithparenting atthefamilylevel;andlostproductivityintheworkplace.theseeffectsadduptoastaggeringnumber ofalcoholattributablesocialcosts,whichcanbeestimatedat 155.8billionayearinEurope.Tothis mustbeaddedtheintangible,nonmonetarycostssuchaspainandemotionalsuffering. However,asubstantialportionofthealcoholrelatedburdenisavoidable.Costeffective measuresexisttoreduceitbypreventativemeasuressuchastaxationofalcohol,bansonalcohol marketing,anddrunkdrivingcountermeasures.still,consideringthecurrenttollofalcoholdependence ineurope,additionalmeasuresshouldbetakentoreduceitseffect.treatmentofalcoholdependence shouldplayakeyroleinfuturepolicy,sincetheconditionisextremelyundertreated:lessthan10%of Europeanslivingwithalcoholdependencereceivetreatment.Thislackofmentalhealthcareisalarming, sincemanyeffectivetreatmentoptionsareavailable.increasingtreatmentcoverageisarealisticgoal, andwouldprovidemeasurableresultsinloweringalcoholrelatedharms,evenintheshortterm. Toquantifythepotentialreductionofalcoholattributablemortalitybytreatment,fivedifferent interventionscenariosweremodelled.theiraimwastoincreasetreatmenttoupto40%ofallpeople withalcoholdependenceineurope.thesescenarioswerebasedoninterventionsthathadbeenproven tobeefficaciousinrandomizedclinicaltrials:pharmacotherapywithcounselling,cognitivebehavioural therapy,motivationalinterviewing,andtwobriefinterventions.theeffectsizesoftheseinterventions weredeterminedusingresultsfromcochranereviewsandmetaanalyses.overall,itwasfoundthat pharmacotherapyandbriefinterventionsinhospitalshadthelargesteffectsonreducingmortality. Overall,themosteffectivetypeofinterventionwaspharmacotherapy.If40%ofallpeoplewith alcoholdependenceweretreatedthisway,theresultwouldbeareductionof11,740deathsintheeu (10,040menand1,700women)injustthefirstyear adecreaseof13.3%ofalcoholattributabledeaths 12
15 inmen,andalmost9.3%inwomen.(thiscorrespondsto1.5%ofalldeathsinmen,and0.5%inwomen, in2004.)thesenumberstakeintoconsiderationbothabstinenceandareductionofalcohol consumptionaspossibletreatmentoutcomes. Insummary,giventhesubstantialhealthburdenattributabletoalcoholdependenceinEurope, itisrecommendedtosupplementtheproposedalcoholpreventionpolicieswithothermeasures designedtoincreasetreatmentratesandtheprovisionofappropriateservices.alcoholpolicyshould striveforanintegratedpackageofvariousformsofeffectivepreventionmeasures,suchasataxation increase,limitationsonavailability,andbansonadvertising.thesemeasuresshouldbesupplemented byinterventionsforproblemdrinkers,andpsychotherapeuticandpharmacologicaltreatmentforpeople withalcoholdependence. Regions and Countries of the European Union (total 27 countries) (Note that the italicized countries Iceland, Norway and Switzerland are not EU member states; they are included only for comparison, and are not included in the EU average) Central-East and Eastern Europe (10 countries): Bulgaria, Czech Republic, Estonia, Hungary, Latvia, Lithuania, Poland, Romania, Slovakia, Slovenia Nordic Countries (5 countries): Denmark, Finland, Iceland, Norway, Sweden Central-West and Western Europe (9 countries): Austria, Belgium, France, Germany, Ireland, Luxembourg, Netherlands, Switzerland, UK Southern Europe (6 countries): Cyprus, Greece, Italy, Malta, Spain, Portugal 13
16 AbbreviationsUsed AA:AlcoholicsAnonymous AAF:AlcoholAttributableFraction AD:AlcoholDependence ADT:AlcoholDependenceTreatment AUD:AlcoholUseDisorders definedinmostconventionsascomprisingharmfuluseof Alcohol,andAlcoholDependence(whenusingtheInternationalClassificationofDiseases, ICD),orasAlcoholAbuseandAlcoholDependence(whenusingtheDiagnosticStatistical ManualofMentalDisorders,DSM) BI:BriefInterventions CBT:CognitiveBehaviouralTherapy CI:ConfidenceInterval CRA:CommunityReinforcementApproach CVD:CardiovascularDisease DALY:DisabilityAdjustedLifeYear EU:EuropeanUnion GBD:GlobalBurdenofDisease GDP:GrossDomesticProduct GDPPPP:GrossDomesticProductPurchasingPowerParity ICD10:InternationalClassificationofDiseases,10thRevision IHD:IschemicHeartDisease MI:MotivationalInterviewing MET:MotivationalEnhancementTherapy PYLL:PotentialYearsofLifeLost RR:RelativeRisk SMR:StandardizedMortalityRatio WHO:WorldHealthOrganization YLD:YearsofLifeLostDuetoDisability YLL:YearsofLifeLost 14
17 TheAimofThisBook Alcoholconsumptionhasoftenbeendescribedasadoubleedgedsword.Ontheonehand,itis deeplyengrainedinmanycultures,certainlyinalleuropeancultures,andthuscontributestopleasure andpositivewellbeing. 1 Ontheotherhand,itisamajorriskfactorforhealthharms,andalso contributestoapersonalandsocialburdenofdiseaseandinjury. 2 Thisbook sfirstobjectiveistodescribetheuseofalcoholineuropeinthe21 st century,using thelatestavailablestatisticsfortheeuropeanunion(eu)asawhole,andforitsindividualcountries. Thisreportfocusesalmostexclusivelyontheadultpopulation:thatis,onpeopleaged15to64.Few peopleyoungerthan15experienceseverenegativehealthconsequencesoftheirdrinking;andalcohol consumptiontendstodecreasemarkedlyafterage60,inbothsexes,inalmostallcountries.for comparison,weincludethreecountriescloselyassociatedwiththeeu Iceland,Norway,and Switzerland plusrussiaasanexternalcomparison,andasasemieuropeancountrywithahighlevelof problemscausedbyalcohol. 25 Thesecondobjectiveofthebookistoestimatetheburdenofdiseaseandinjuryattributableto alcoholconsumption,basedonthemethodologydevelopedinthecomparativeriskassessmentswithin theglobalburdenofdisease(gbd)studies(seereference2forresults,andreferences68for methodology).inaddition,wereviewthesocialandeconomicburdensattributabletoalcohol.thethird objectiveistoestimatethecontributionofalcoholdependence(ad)totheoverallburdenofdisease andinjury. TheburdenofdeathanddiseaseduetoalcoholconsumptionorADis,inprinciple,avoidable; andeveninpracticeitcanbemarkedlyreduced.(anexampleistheeffectofthesocalledgorbachev reformonalcoholattributablemortalityatapopulationlevel). 910 Theliteraturesofarhasconcentrated ontheeffects,atthepopulationlevel,ofpolicyinterventionssuchastaxationincreases,banson marketing,andimplementationoflawstopreventdrunkdriving Thisbookproposestosupplement theliteraturewithestimatesoftheeffectsofinterventionsforadattheindividuallevel,i.e.of improvingtheavailabilityofeffectivetreatmentoptions.again,theseeffectswillbepresentedforthe EUasawhole,andseparatelybycountry.Weconcludewithpolicyrecommendationsforreducingthe burdenofalcoholconsumptionineurope. 15
18 TraditionalPatternsofAlcoholConsumptioninEurope AlcoholconsumptionhasalongtraditioninEurope.Lookingat drinkingculturesacrossthecontinent,threedistincttraditional regionalpatternscanbeidentified: WinedrinkingcountriesintheMediterraneanregion, wherealcoholisconsumeddaily,usuallywithmeals. ACentralWestandWesternregionwithasimilarstyle, butwithbeerasthebeverageofchoice;and proportionallylessdrinkingwithmeals,andmoredrinking withoutconsumingfood. IntheNordiccountriesandintheCentralEastandEastern partofeurope,astyleofirregularheavydrinking. Althoughthesecharacteristicsoftraditionaldrinkingculturesstill lingertoday,modernlifestyleshavebecomemoreglobalized. Consequently,drinkingpatternshavebecomemoresimilaracross Europe,andwillcontinuetohomogenize. Europehasalongtraditionofconsumingalcohol,withboththeGreeksandRomansbeing classicexamplesofsocietieswithafairlywidespreaduseofalcohol However,thisbynomeans indicatesthatalcoholconsumptionisuniformacrosseurope.onthecontrary,differentdrinkingcultures canbedistinguishedbasedontheproductsmade,thepatternsofdrinking,andthesocialreactionsto alcohol Thereareessentiallythreesuchcultures: TheMediterraneanpattern:winecountriesinthesoutharetraditionallycharacterizedby almostdailydrinkingofalcohol mostoftenwine,andmostoftenconsumedwithmeals.these 16
19 societiesavoidirregularheavydrinking,andhavenoacceptanceofpublicdrunkenness.especiallyinthe southeastoftheeu,wineisnowcomplementedbyfruitliquor. TheCentralEuropeanpattern:beeristhedominantalcoholicbeverage,anditsconsumptionis similartothemediterraneanstyle,bothinfrequencyofdrinkingandinthelackofacceptanceofpublic drunkenness(althoughinrecentdecadestherehasbeenmoreacceptanceofintoxication). 19 However, thereismoreconsumptionoutsideofmeals,andtherearemorealcoholrelatedproblems. TheNorthernEuropeanpattern:thedrinksofchoicearevodkaandspirits,whoseproduction onlybeganaftertheinventionofthedistillationprocess henceithasasubstantiallyshortertradition thanwinedrinkinginthemediterraneanregion.thepatternofdrinkinginthesecountriesis characterizedbynondailydrinking,inirregularepisodesofheavyandveryheavydrinking(e.g.during weekendsandatfestivities);andbyamuchhigherlevelofacceptanceofpublicdrunkenness.(thisstyle wasoncealsoprevalentintheukandireland,butwithmoredominanceofbeerandlessofspirits.)the formersovietbloccountrieshaddifferentpolicies,asthestatewasalwaysambivalentaboutalcohol. Ontheonehanditrecognizedvodka sdeleteriouseffectsintheworkplaceandindailylife,butitalso considereditan opiateforthepeople. Thereissomespeculationthatthesedifferencesindrinkingstylescanbetracedbackto antiquity, 20 eventhoughdrinkingcultureshavechangedagreatdealduringdifferenttimesofhistory.in Europetoday,itseemsthatthelocaldrinkingstyleislessstronglyassociatedwithregionalpatternsthan before. 21 Forexample,adolescentsandyoungadultsinmanytraditionalwinedrinkingregionsnow preferalcoholicbeveragesotherthanwine.thus,whilewestillfindcharacteristicsoftheolddrinking cultures,modernlifestyleshavebecomemoreglobalized.overall,spiritsarestilllessimportantin Europe;beeristhemostconsumedbeverage,followedbywine;andthepracticeofdrinkingalcoholat bothlunchanddinner,onaregularbasis,hasbecomealmostnonexistentinallcountries. 17
20 KeyIndicatorsofAlcoholConsumptioninEurope Onaverage,Europe slevelofalcoholconsumptionismorethan doubletheglobalaverage.theoveralltrendinlevelsof consumptionhasbeenstableforthepastdecade,butthereare regionaltrendstowardslightlyincreasingconsumptioninsome places thecentraleastandeasternregioncountries,thenordic countries,andthebritishisles plusanoppositetrendtoward decreasingconsumptioninthesouthernandthecentralwestern regions.however,variationbetweencountriesinlevelsof drinkingislesspronouncedthanthevariationinpatternsof drinking:bingedrinkingismorepronouncedinthenorthernand NorthEasternpartsofEurope,andintheBritishIsles.These regionaldifferencesandtheirimplicationsareoneofthefocal pointsofthisassessment. Drinkingstatusandvolumeofdrinking TheeconomicandpoliticalunionoftheEUcurrentlyencompassesawidevarietyofnationsand cultures:27memberstateslocatedacrosseurope.excludingoverseasterritories(suchasthefrench departmentsinguiana,guadeloupeandmartinique),thewesternmostmemberisireland,andthe easternmostmembersarecyprustothesouth,andfinlandinthenorth.in2005,thetotalpopulation (includingchildrenandadolescents)wascloseto500million;theunionpassedthe500millionmarkin i Onaverage,everyEUcountryhadover16millionadultinhabitants(aged15andabove)in2009, thelatestyearwithavailabledataonpercapitaconsumption.inthatyear,5.6%ofadultmenand13.5% iseeonline: tnotes=yes&labeling=labels&plugin=1 18
21 ofadultwomenwerelifetimeabstainersfromalcohol;and7.3%ofmenand11.0%ofwomenidentified as former drinkers.someofthesepeoplewereatincreasedriskforhealthissues,includingdeath as sickquitters, theyhadstoppeddrinkingforhealthreasons AnoverviewofkeyalcoholconsumptionindicatorsfordifferentEUcountriesisprovidedin Table1.Asmostcalculationsarerestrictedtopeopleaged15to64,theprevalencegivenappliestothis agerangeaswell.eventhoughthereisconsiderablevariationbetweencountries,itisclearthateu countriesasawholecanbecharacterizedbyalowrateofabstention,andahighrateofpeoplewho drinkmorethan40gofpurealcoholperday.infact,comparedtotherestoftheworld, 24 theeuhasthe highestproportionofpeoplewhodrinkthatmucheveryday,ofanyregionexcepttheeasterneuropean countriesaroundrussia. Inthecategories 25 fromtheeuropeanmedicinesagency, ii adaptedfromtheworldhealth Organization 26 :intheeufortheyear2009,15.0%ofthemenweredrinkinganamount(i.e.60g+pure alcoholaday)thatputthemata high or veryhigh riskofbothchronicandacutehealthharms;and 7.7%ofthewomenwereatthisrisklevel(definedasdrinking40g+purealcoholaday).Thisresultsin an atrisk populationof11.2%.ofcourse,theseproportionsarehigherfortheagegroupsfocusedon inthisreport.inthattargetgroup,16.1%ofmenand9.3%ofwomenweredrinkingata high or very high risklevel,foracombinedtotalof12.7%.(seetable1fordetailsatthecountrylevel.) iiseeonline: 19
22 Table1:Keyalcoholconsumptionindicators Thetablebelowdescribeskeyindicatorsofalcoholconsumption,brokendownbycountryandsex,forpeopleaged15 64livingintheEU.(Allfiguresareforthe EuropeanMedicinesAgency/WHO,drinkingcategoriesforrisk,2009.) Men Women Prevalenceofaveragealcoholconsumption Prevalenceofaveragealcoholconsumption Country Lifetime abstainers Former drinkers >0<40 grams 40<60 grams 60<100 grams 100+ grams Lifetime abstainers Former drinkers >0<20 grams 20<40 grams 40<60 grams Austria 4.0% 5.3% 62.5% 11.2% 11.4% 5.5% 4.6% 7.5% 62.9% 14.9% 5.8% 4.3% Belgium 2.8% 6.2% 65.0% 10.9% 10.5% 4.6% 6.8% 5.6% 64.5% 14.3% 5.2% 3.5% Bulgaria 9.2% 4.7% 60.4% 10.4% 10.4% 4.9% 20.7% 4.9% 53.5% 12.7% 4.8% 3.3% Cyprus 5.7% 5.0% 68.6% 9.7% 8.2% 2.9% 8.8% 6.2% 67.5% 12.0% 3.6% 1.9% CzechRepublic 2.9% 6.7% 56.7% 11.9% 13.8% 8.1% 4.2% 12.5% 55.9% 15.2% 6.6% 5.7% Denmark 0.5% 2.0% 69.7% 11.6% 11.2% 4.9% 0.5% 5.3% 70.8% 14.9% 5.2% 3.3% Estonia 6.5% 17.8% 46.0% 10.1% 12.2% 7.5% 10.9% 17.1% 47.1% 13.4% 6.0% 5.6% Finland 2.8% 4.7% 65.7% 11.1% 10.8% 4.8% 5.8% 2.8% 68.1% 14.7% 5.2% 3.4% France 1.5% 2.8% 67.9% 11.5% 11.2% 5.0% 1.8% 5.3% 69.1% 14.9% 5.3% 3.5% Germany 1.1% 2.0% 68.7% 11.7% 11.4% 5.1% 1.0% 1.9% 73.2% 15.3% 5.3% 3.3% Greece 5.5% 7.4% 63.6% 10.2% 9.4% 3.9% 11.5% 14.2% 51.9% 12.9% 5.2% 4.2% Hungary 3.8% 9.3% 57.3% 11.1% 12.0% 6.4% 6.2% 9.5% 61.0% 14.3% 5.4% 3.7% Iceland 4.5% 8.0% 72.6% 7.9% 5.5% 1.5% 8.0% 6.0% 74.0% 9.2% 2.1% 0.7% Ireland 15.0% 4.4% 53.8% 10.2% 10.9% 5.6% 15.9% 3.8% 55.7% 14.1% 5.8% 4.7% Italy 4.6% 3.1% 70.9% 10.0% 8.4% 3.0% 9.9% 4.4% 66.2% 13.0% 4.2% 2.4% Latvia 5.0% 8.7% 49.7% 11.7% 14.9% 9.9% 11.0% 17.0% 41.4% 14.0% 7.4% 9.2% Lithuania 3.7% 5.5% 60.4% 11.6% 12.4% 6.4% 13.5% 10.9% 52.0% 13.5% 5.6% 4.5% Luxembourg 5.1% 5.1% 63.2% 10.9% 10.8% 4.9% 8.7% 6.2% 61.4% 14.3% 5.4% 4.0% Malta 5.4% 5.1% 72.9% 8.5% 6.3% 1.8% 8.8% 6.1% 70.9% 10.4% 2.7% 1.1% 60+ grams 20
23 Netherlands 5.1% 9.9% 63.4% 9.6% 8.6% 3.4% 9.6% 14.7% 55.8% 12.3% 4.5% 3.0% Norway 2.0% 5.0% 75.7% 8.9% 6.5% 1.9% 2.3% 5.6% 78.5% 10.4% 2.4% 0.9% Poland 7.3% 8.3% 55.4% 10.8% 11.9% 6.4% 14.6% 10.2% 51.9% 13.4% 5.5% 4.4% Portugal 15.8% 12.9% 44.1% 9.5% 11.1% 6.6% 27.0% 17.4% 31.2% 10.8% 5.8% 7.8% Romania 7.0% 13.2% 48.1% 10.7% 12.9% 8.1% 13.2% 24.6% 35.9% 12.1% 6.3% 7.9% Slovakia 7.8% 13.9% 48.8% 10.3% 12.1% 7.1% 5.1% 12.3% 58.7% 14.3% 5.6% 4.1% Slovenia 3.9% 3.6% 60.1% 11.9% 13.2% 7.2% 5.8% 9.5% 58.5% 15.0% 6.2% 4.9% Spain 8.0% 18.8% 46.0% 9.6% 11.1% 6.5% 27.6% 23.6% 27.2% 9.5% 5.1% 7.0% Sweden 4.4% 5.3% 70.4% 9.5% 7.8% 2.7% 5.8% 8.8% 68.1% 11.9% 3.5% 1.8% Switzerland 6.1% 3.2% 65.6% 10.7% 10.1% 4.3% 11.5% 3.8% 60.7% 14.5% 5.6% 3.9% UnitedKingdom 7.5% 1.2% 64.8% 11.0% 10.7% 4.8% 8.5% 2.2% 65.9% 14.5% 5.3% 3.6% Total (EuropeanUnion) Forcomparison: RussianFederation 5.0% 6.1% 62.1% 10.8% 10.9% 5.2% 9.5% 8.5% 59.1% 13.6% 5.2% 4.1% 9.7% 17.7% 42.7% 9.8% 12.2% 7.9% 24.1% 21.2% 31.8% 10.6% 5.5% 6.9% 21
24 Derivingindicatorsforalcoholconsumption Measuresofalcoholconsumption:definitionsandprocedures Thisreportdefinesthe drinkingstatus ofindividualsinthreeways: currentdrinkers:peoplewhohaveconsumedalcoholatleastonceinthepastyear formerdrinkers:peoplewhohaveconsumedalcohol,buthavenotdonesointhepastyear lifetimeabstainers:peoplewhohaveneverconsumedalcohol. Dataondrinkingstatuswereobtainedfromgovernmentstatisticsonpercapitaalcoholconsumption, andfromlargerepresentativepopulationsurveysundertakeninthe2000s. 24 Averagedailyconsumptionofpurealcoholwascalculatedbasedonatriangulationofsurvey dataandgovernmentaldataonpercapitaconsumption,mainlyderivedfromsalesandtaxationfigures. 8 Triangulationisnecessarybecausesurveystendtounderestimatetrueconsumptionconsiderably,and withhighvariation:dependingonthesurvey,consumptionmaybeunderestimatedbetween30%and 70%. 7 Theconsumptionestimatesarelessbiased,andserveasstandardization. 8 Inordertobe consistentwiththealgorithmsusedinthegbdcomparativeriskassessmentforalcohol,80%ofper capitaconsumptionofalcoholwasusedasthestandardtoaccountforalcoholboughtbutnot consumed.italsohelpedtoimprovecomparabilitywiththerelativerisks(rrs)fromcohortstudies, wherewewouldalsoexpectpeopletounderestimatetheirownconsumption. Totaladult(15+)alcoholconsumptionforeachcountryin2009wascalculatedbyaddingthe estimatedrecordedandunrecordedpercapitaconsumption,andthensubtractingthevolumeof touristconsumption (alcoholconsumedbynonresidents). 7 Dataonaverageconsumptionforeach agegroupwerethencalculated,basedontheproportionofalcoholconsumedbyeachageandsex group takingintoaccounttherelativepopulationsizeofthegroups,aswellastheprevalenceof currentdrinkers. Onesubcategoryof currentdrinker identifiedinthedatawasthebingedrinker,definedasa personwhohadconsumedatleastfivedrinks(formen)orfour(forwomen),onatleastoneoccasionin thepastmonth.assumingtheaveragedrinksizetobe12grams,thisindicatestheconsumptionofsome 22
25 50 60gofpurealcohol. iii Estimatesusedfortheprevalenceofdrinkingstatusandforbingedrinking wereconsistentwiththegbd s2005comparativeriskassessmentstudyestimates. 27 Forwomen,drinkingwhilepregnantpresentsanumberofrisksthatmayaffectthehealthofthe newborn,suchasbyreducingitsbirthweight.the2005comparativeriskassessmentstudyassumed thatthepatternofwomen sdrinking thatis,theproportionwhodrankthesameamountaspre pregnancy,theproportionswhodrankless,andtheproportionofwomenwhoabstainedfromalcohol throughoutpregnancy wassimilartoestimatesofsuchproportionsforcanadaandtheunitedstates. Theprevalenceofwomenwhocontinuedtodrinkwhilepregnant,butwhodrankless,wascalculated accordingtofloydandsidhu, 28 bydividingthecorrectedaveragedailyconsumptionbyafactoroffour. Adultalcoholconsumptionin2009 AverageadultpercapitaconsumptionintheEUamountedto12.5litresofpurealcoholper capitafortheyear2009(onaverage,1.6lareunrecorded).whilethereissomevariation,alleuropean countrieswerewellabovetheworldaverageconsumptionof6.1lofpurealcoholpercapitaperyear. 24 Ontheotherendofthecontinuum,thenewEasternEuropeanmembercountrieshadnotonlyahigher overallconsumption,butalsoahigherunrecordedconsumption(seefigure2andtable2).thecentral WestandWesternEuropeancountrieshadanaverageadultpercapitaconsumptionof12.4Lofpure alcohol(unrecorded1l);thenordiccountrieshad10.4l(1.9l);southerneurope11.2l(2.0l);andthe CentralEastandEasternEuropeancountries14.5L(2.5L).(Forexactdefinitionsofgeographical regions,seethechartonpage13.)table2,onpage25,givesanoverviewofconsumptionbycountry. iiiseeonline: 23
26 Maltaisinthegreencategorywith 8.0Lofpurealcoholpercapita. Figure1:Adultconsumptioninlitres Thefigureaboveindicatesthepercapitaconsumption,inlitresofpurealcohol,foradults(15+years)in EUcountries(2009). 24
27 Table2:Adultconsumptionanddrinkingpatterns ThetablebelowoutlinesadultconsumptionanddrinkingpatternsinEuropeduring2009. Country Total per capita consumption (litres pure alcohol)* Recorded per capita consumption (average ) Unrecorded per capita consumption Pattern of Drinking Austria Belgium Bulgaria Cyprus Czech Republic Denmark Estonia Finland France Germany Greece Hungary Iceland Ireland Italy Latvia Currently under Currently under 9.00 review: review: around Lithuania Luxembourg Malta Netherlands Norway Poland Portugal Romania Slovakia Slovenia Spain Sweden Switzerland United Kingdom EU For comparison Russian Federation * Note that for the total per capita consumption, the recorded average was for , plus the unrecorded estimate. In the red-shaded countries, adult consumption of alcohol is equal to or greater than 130% of the EU average. In the green-shaded 25
28 countries, consumption is equal to, or less than, 70% of the EU average. (Source: WHO Regional Office for Europe; 29 Global Information System for Alcohol and Health; and reference 24.) 26
29 Timetrendsinconsumption TherecordedadultconsumptionfortheEUasawholehasbeenconstantoverthepastten years(seefigure2,basedonwhofigures; iv thedataupto2004arepublishedinreference24;thedata for2008areinreference30).suchtrendscanonlydescriberecordedconsumption,asmostcountries havenotyetinstalledsystemstoregularlymonitorunrecordedconsumption.however,itisknownthat inmosteucountries,unrecordedconsumptionhasnotchangedmarkedlyoverthepastdecade. Figure2:Adultconsumptioninlitressince2000 Thefigurebelowshowsthepercapitaalcoholconsumption,inlitresofpurealcohol,recordedforallEU adults(15+years)since2000. WhileconsumptionfortheEUasawholehasbeenstable,differenttrendscanbeobservedfor differentregions(seewebappendix1).southerneuropeancountrieshavedecreasedtheiralcohol consumptionsince1999,partofanongoingdecreaseoverthepastseveraldecades. 31 InSpain,for example,atraditionalwinecountry,beerhasreplacedwineasthebeverageofchoice.therehavealso beensomedecreasingtrendsincentralwestandwesterneurope,exceptforthebritishisles.however, ivseeonline: 27
30 thenordiccountries,andthecentraleastandeasterneuropeancountries,haveincreasedtheir consumption. 24 (SeeWebAppendix1foradditionaldetails.) Patternsofdrinking Oneelementofthisreportisthecreationofsummaryscorestodefineaverage patternsof drinking fordifferenteucountries.thesearecomposedofthefollowingelements, 32 originallyderived fromanoptimalscalinganalysisofdrinkingindicators: 6 Heavydrinkingoccasions,includingthefrequencyofgettingintoxicated;usualquantityper drinkingoccasion;drinkingspreadoutovermoreoccasions;drinkingatfiestasorspecialevents; bingedrinkingoverprolongedtimes.(theseaccountfor64.7%ofthescore). Drinkingwithmeals(23.5%). Drinkinginpublicplaces(11.8%). Theaverage patternofdrinking scoreintheeuis2.1,indicatingalcoholconsumptionhabits thatarelessdetrimentalthanthoseinotherregionsoftheworld 6 (seefigure3foraglobalcomparison). PatternsofdrinkingaremoredetrimentalintheCentralEastandEasternEuropeanandNordic countries,asindicatedintable2,above.russiaandthesurroundingcountrieshavethemost detrimentaldrinkingscores. 18 Patternsofdrinkinghavebeenshowntobemarkedlyrelatedtothealcoholattributableburden ofdisease,especiallyinjury,ischemicdisease,andhiv/aids. 6;3336 Thepatternshavebeenincorporated intothecomparativeriskassessmentsofthegbdstudyfor2000, 6;37 andwillalsobepartofthe estimationsforthenewgbdandinjurystudyfor2005and2010,tobepublishedin

31 Figure3:Globalpatternsofdrinking(2005) 1:leasthazardous:regulardrinking,oftenwith meals,andwithoutheavydrinkingbouts 5:mosthazardous:infrequentbutheavydrinking outsideofmeals Heavydrinkingoccasions Thefrequencyofconsumingmorethanfivedrinksononeoccasionisthemostimportantsingle indicatorinthepatternofdrinkingscore.thisindicatorisavailableformanycountries, 24 andhasbeen showntobelinkedtovariousformsofharm. 8;39 Havingfivedrinksonanyoneoccasion,almostdailyor severaltimesaweek,isanindicatorofchronicheavydrinking,andislinkedtomanycategoriesof diseases(includingnoncommunicable,mentalhealth,andinfectious). 40 Fiveormoredrinks,uptoonce aweek,indicatesirregularheavydrinking.suchbehavioursarelinkedtospecifichealthrisks, 41 most importantlyforischemicheartdisease.(infact,theprotectiveeffectofmoderatedrinkingonheart diseaseiscompletelywipedoutifthereareheavydrinkingoccasionsatleastonceamonth,evenfor averagedrinkers;seereference35).irregularheavydrinkingoccasionsalsohaveamarkedeffecton injury.whileallheavydrinkinghasbeenassociatedwithinjuryduetoelevatedbloodalcohol concentrationlevels,ceterisparibustheeffectofhighbloodalcoholoninjuryismoremarkedforpeople whodrinklessthanchronicheavydrinkers.thisisbecausethealcoholtoleranceofthemoderategroup islower,leadingtoagreaterintoxicatingeffectfromthesameamountofalcohol.(seetheclassic studiesreferencedinreferences42and43.) 29
32 Table3:Frequencyofdrinkingbycountry Thetablebelowindicatesthefrequencyofdrinkingmorethanfivedrinksatatime,onanyoccasion,in termsofdaily,weekly,monthly,etc.thedata(for2009)arebrokendownbycountry; 44 theredshaded cellsindicateirregularheavydrinkingoccasions. Country several times a week once a week once a month less than once a month never do not know Austria 17% 19% 16% 23% 24% 1% Belgium 12% 16% 15% 21% 36% 0% Bulgaria 8% 10% 9% 15% 57% 1% Cyprus 9% 17% 7% 12% 55% 0% Czech Rep. 7% 17% 20% 32% 24% 0% Denmark 7% 15% 24% 37% 17% 0% Estonia 4% 14% 23% 26% 32% 1% Finland 5% 17% 23% 33% 22% 0% France 7% 13% 15% 20% 45% 0% Germany 14% 22% 15% 23% 25% 1% Greece 15% 19% 12% 20% 34% 0% Hungary 11% 13% 16% 20% 40% 0% Ireland 12% 32% 18% 22% 14% 2% Italy 16% 14% 8% 12% 50% 0% Latvia 3% 8% 15% 23% 50% 0% Lithuania 6% 8% 14% 21% 51% 0% Luxembourg 6% 12% 24% 35% 23% 0% Malta 7% 19% 12% 31% 30% 1% Netherlands 9% 14% 15% 24% 38% 0% Poland 3% 16% 18% 34% 26% 3% Portugal 20% 8% 9% 12% 50% 1% Romania 19% 20% 13% 19% 27% 2% Slovakia 5% 12% 21% 31% 30% 1% Slovenia 8% 10% 18% 22% 42% 0% Spain 15% 19% 13% 20% 33% 0% Sweden 2% 11% 20% 32% 35% 0% UK 14% 20% 14% 20% 31% 1% EU 12% 17% 14% 22% 35% 1% 30
33 AlcoholAttributableBurdenofDiseaseinEurope Alcoholconsumptionisacontributorycauseofmorethan200 ICD10threedigitdiseasecodes,mostlyinadoseresponse manner(i.e.themorealcoholconsumed,thehighertherisksfor alcoholattributabledisease).asaconsequence,in2004almost 95,000adultmen,andmorethan25,000adultwomen(foratotal of120,000),diedofalcoholattributablecausesintheeu.this meansthat1in7maledeaths,and1in13femaledeaths,were causedbyalcohol.moreover,asalcoholconsumptionalso contributessubstantiallytomorbidityanddisability,morelosses couldbeattributedtothisbehaviour:in2004morethanfour milliondisabilityadjustedlifeyearswerelost eitherdueto prematuremortality,ortoalcoholrelateddisability.thuswecan seethatalcoholconsumptiontakesanimmensetollontheoverall healthofacountry. Acknowledgment Thestatisticsonalcoholattributablemortalityandburdenofdiseasefollowourchapterinthe publication AlcoholintheEuropeanUnion:Consumption,HarmandPolicyApproaches ofthewho RegionalOfficeforEurope. 29 WewouldliketoacknowledgethefinancialsupportoftheWHORegional OfficeforEurope,anditsprovisionofdatafromthelatestsurveyonalcoholconsumptionandpolicyfor allmemberstates. 31
34 Relationshipsbetweenalcohol,diseaseandinjury Alcoholisanessentialcauseofmanycategoriesofdiseasesthatare100%attributableto alcohol.whilealcoholusedisorders(auds) thatis,ad,andtheharmfuluseofalcoholasdefinedby ICD10 arecertainlythemostimportant,theyarefarfrombeingtheonlyones.rehmandcolleagues listedmorethan40suchconditionsrecordedintheicd10,rangingfromchronicdiseases(e.g.k70, alcoholicliverdisease;ork86.0,alcoholinducedchronicpancreatitis),toinjuries(e.g.x45,accidental poisoningbyandexposuretoalcohol),tothedrinkingofapregnantwomanharmingherunbornchild (e.g.q86.0,foetalalcoholsyndrome). 8 However,thereareevenmoreconditionswherealcoholisa componentcause: 45 notallarecausedbyalcohol,butincertaincasesalcoholisacausalfactor.inthe exampleoftrafficinjurymortality,therearemanyinfluencingfactors,suchasroadconditions,traffic density,ortheuseornonuseofseatbelts.inacertainpercentageofthese,alcoholisacausalfactor withoutalcoholconsumption,thedeathswouldnothavehappened. Methodologyforderivingthealcoholattributableburden WebAppendix2describesindetailthemethodologiesusedtodeterminewhatproportionsof diseaseandinjurywerecausedbyalcohol(=alcoholattributablefractions).first,wewouldliketo introducetheseestimates.topredictthealcoholattributableburden,twofactorswereused:average volumeofalcoholconsumption,andpatternsofdrinking.forthefirstexample,alcoholattributable cancers,onlyvolumeisimportant(seethegraphicbelow).theriskrelationisquitesimple:themore alcoholconsumed,thehighertheriskforcancer.socalculatingtheproportionofagivenformofcancer causedbyalcoholrequiresthisinformation:theproportionofdrinkersinthepopulationunder consideration,thedistributionofhowmuchalcoholtheyconsume,andtherisksassociatedwith differentvolumesofdrinking.thedistributionsandassociatedrisksforeachlevelofdrinkingare combinedmultiplicativelytoderivetheattributablefraction(seewebappendix2).thus,themore peoplewhoconsumealcohol,thehigherthelevelofalcoholconsumptionamongthesedrinkers,and thehighertheriskforaspecificcancerassociatedwithagivenlevelofdrinking,thenthehigherthe proportionofthiscancerattributabletoalcohol.thisisasimplifiedexplanation,astheactual calculationsaremorecomplicated;foronething,theyaredoneseparatelybysexandagegroups.as well,thecalculationstakeotherfactorsintoconsideration.onesuchistheproportionofexdrinkers: somepeoplequitdrinkingforhealthreasons,butstillhaveahigherriskforalcoholrelateddiseases thanlifetimeabstainers

35 Otherdiseaseoutcomesaremorecomplexthancancer,astheriskrelationsarenotalways direct.inthecaseofischemicheartdisease,lightandmoderatedrinkingleadstoadecreaseinrisk comparedtolifetimeabstention butonlyifthisaveragedrinkingfrequencyisnotcoupledwith occasionalheavydrinking 35;4648 (seealsowebappendix3).heavyaveragedrinkingleadstoanincrease inheartdisease.sotheformulahastotakeintoconsiderationnotonlytheaveragevolumeofdrinking, butalsotherisksassociatedwithirregularheavydrinking(fordetails,seewebappendix2).andthe relationshipofinjuriestoalcoholisanothercomplicatedone,asitdependsontheconcentrationof bloodalcoholandassociatedrisks.thegraphicbelowprovidesanoverviewofthediseaseandinjury conditionsforwhichalcoholisdeterminedtobecausal,andoftheconditionswewereabletomodelfor whichdatawereavailable. 40 Theproblemoftimelag Inmostanalysesofalcoholattributableburden,thecalculationsareconductedasifthehealth consequencesofalcoholconsumptionareimmediate.onanepidemiologicallevel,thismaybepartially trueformostofthealcoholattributablehealthburden:eventheeffectsofalcoholconsumptionon chronicdiseasessuchascirrhosiscanbeseenimmediatelyatthepopulationlevel. 9;49;50 (Forageneral discussionofthis,seereferences5152.)however,cancerisdifferent.theeffectofalcoholconsumption 33
36 oncancercanonlybeseenaftermanyyears,oftenaslongastwodecades.however,forthepurposeof illustratingtheentirealcoholattributableburden,itisimportanttoincludecancerdeaths especially sinceineurope,arecentlargestudyfoundthat1in10cancersinmen,and1in33cancersinwomen, werealcoholrelated. 53 Sointhischapter sinterpretationofalcohol seffectonmortalityanddisease,it shouldbekeptinmindthatthecalculationsassumeuniformexposuretoalcoholforatleastthe previoustwodecades. Alcoholattributablemortality Thissectionprovidesanoverviewofalcoholattributablemortality,showingboththenumberof actualdeathsandthepotentialyearsoflifelost(pyll)duetoprematuremortality.asintherestofthis report,wefocusonthe15 64agerange.Onereasonforthisisthatdeathcertificatesbecomemore problematicforolderages, 54 especiallyfortheveryold. 55 Aswell,RelativeRisks(RRs)foralcohol attributablecausesalsotendtogodownwithage, 56 meaningthattheconsequencesofconsumption (bothdetrimentalandbeneficial)tendtobeexaggeratedintheolderagegroup.however,agespecific RRsarenotavailableformostalcoholattributablediseasecategories.Thissectionalsoexcludesunder 15yearolds,sincealcoholattributabledeathsinthisagegroupareveryrare.Theexceptionsaredeaths astheresultofsomeoneelse sdrinking,suchastrafficfatalitiescausedbydrunkdrivers.theseare reportedinthesection Healthharmstoothersduetoalcoholconsumption. Inthefollowingsection,allgraphsseparatethefourregionsbycolourcoding,basedontheir averagevolumeandpatternsofdrinking: Colour Codes for EU Regions and Countries The European Union (total 27 countries): blue Central-East and Eastern Europe (10 countries): Bulgaria, Czech Republic, Estonia, Hungary, Latvia, Lithuania, Poland, Romania, Slovakia, Slovenia: red Nordic Countries (5 countries): Denmark, Finland, Iceland, Norway, Sweden: grey Central-West and Western Europe (9 countries): Austria, Belgium, France, Germany, Ireland, Luxembourg, Netherlands, Switzerland, UK: yellow Southern Europe (6 countries): Cyprus, Greece, Italy, Malta, Spain, Portugal: light grey (Note that the italicized countries Iceland, Norway and Switzerland are not EU member states; they are included only for comparison.) 34
37 Deathsduetoalcoholconsumption Intermsofoveralldeathsformenandwomenaged15 64intheEUin2004,weestimatedthat 94,451(95%ConfidenceInterval CI:55,376to130,712)menand25,284(95%CI:10,390to39,973) womendiedofalcoholattributablecauses(total119,735(95%ci:65,766to170,685)).thiscorresponds to13.9%(95%ci:8.1%to19.2%)ofalldeathsinmeninthisagecategory;7.7%(95%ci:3.1%to12.1%) ofalldeathsinwomen;and11.9%(95%ci:6.5%to16.9%)ofalldeaths.(figures4and5providean overviewofdetailsbyregionandcountry.)theproportionsofalcoholattributabledeathstoalldeaths showsomevariation,asseeninfigure4.thetollof11.9%mortalitycausedbyalcoholsignalsahigh levelofoverallburden.evenintheregionwiththelowestburden,southerneurope,about9.2%(95% CI:4.5%to13.7%)and6.4%(95%CI:2.4%to10.5%)ofalldeathsinmenandwomenrespectivelyare duetoalcohol.thismeansthatevenintheleastaffectedregion,morethan1inevery11maledeaths, and1inevery16femaledeaths,isstillduetoalcohol. Figure4:Regionalvariationsinproportionsofdeaths Thefigurebelowindicatestheregionalvariationsintheproportionsofalcoholattributabledeathstoall deaths,forpeopleaged15 64livingintheEUin
38 Ininterpretingthesefigures,weshouldkeepinmindthatalcoholattributablemortalityand burdenofdiseasearedeterminedbyfourfactors(seewebappendix2foraformaldescriptionofthe underlyingmethodsandformulas): thelevelandpatternofalcoholconsumption; theriskrelationsbetweenalcoholconsumptionandvariouscausesofdeath; thedistributionofcausesofdeath; theeconomicwealthofacountry. Thelastfactor,economicwealth,isimportant,asresearchhasshownthatthesamequantityof alcohol,consumedinthesamepattern,producesmoreharminpoorercountriesthaninricher countries. 2;57 Thisfactoralsocontributestothehigheralcoholattributablemortalityburdeninthe CentralEastandEasternEuropeancountries,asthisregionispoorerthantheotherthreeregions.(In 2005,theGrossDomesticProductadjustedforPurchasePriceParity knownasthegdpppp per capitaforthisregionwaslessthanhalftheeuaverage.)inthecentraleastandeasterneuroperegion, severalcountries Bulgaria,theBalticcountries,theCzechRepublic,Poland,Romania,Slovakiaand Slovenia havebeenclassifiedasuppermiddleincomeformostofthepastdecade.inthemostrecent 36
39 classification,however,onlyfourcountries(bulgaria,latvia,lithuaniaandromania)remainedinthis category. v Figure5,below,providesanoverviewoftheproportionsofalcoholattributabledeathsatthe countrylevel;whilewebappendices4and5providethecisfortheseestimatesatacountrylevel,and alsogivethestandardizedratesofalcoholattributabledeaths. vseeonline: groups#upper_middle_income.) 37

40 Figure5:Countryvariationsintheproportionsofdeaths Thefigurebelowindicatesthevariations,bycountry,oftheproportionsofalcoholattributabledeaths toalldeaths,forpeopleaged15 64livingintheEUin2004. Theseparationbetweenregionsisquiteclear,especiallyformen.However,differentcountries rankedhighestwithincentraleastandeasterneuropebygender.inthebalticcountriesofestoniaand Lithuania,morethan25%ofmaledeathswereattributabletoalcohol;whereasforwomen,Romania borethehighestburden.attheotherendofthespectrum,thesmallislandsofcyprus,icelandand Maltadisplayedthelowestburdenofalcoholattributablemortality,forbothsexes. Thusfar,wehaveonlyconsideredalcoholattributabledeathsasaproportionofmortalityfrom allcauses.movingontobroaddiseasecategories,table4providesanoverviewofalcohol attributabledeaths,separatingdetrimentalandprotectiveinfluences.thedistributionvaries markedlybysexandregion(regionaldifferencesareoutlinedinmoredetailinwebappendix9).for 38
41 men,livercirrhosis(26%)andunintentionalinjury(23%)contributedthemosttoalcohol attributablemortality,followedbycancer(16%)andintentionalinjury(15%).forwomen,liver cirrhosis(37%)andcancer(31%)madeupalmost70%ofthealcoholattributabledeaths,with cardiovasculardisease(cvd)otherthanischemicheartdisease(ihd)adistantthird(11%).the beneficialeffectsofalcoholconsumptionintermsofmortalitywereprimarilyobservedwith respecttoihdinmen(98%);incontrast,some33%ofthesebeneficialeffectsinwomenwere observedinotherdiseasecategories(includingdiabetes,butmainlycvd(otherthanihd), hypertensivediseases,andischemicstroke). Table4:Deathsbydiseasecategories Thetablebelowindicatestheprevalenceofalcoholattributabledeathsbybroaddiseasecategories,for peopleaged15 64livingintheEUin2004. Detrimentaleffects Men #s Women #s Men % Women % Cancer 17,358 8, % 30.7% CVD(otherthanIHD) 7,914 3, % 11.1% Mentalandneurologicaldisorders 10,868 2, % 8.3% Livercirrhosis 28,449 10, % 37.2% Unintentionalinjury 24,912 1, % 6.4% Intentionalinjury 16,562 1, % 4.1% Otherdetrimental 3, % 2.3% Totaldetrimental 109,517 28, % 100.0% Beneficialeffects IHD 14,736 1, % 61.1% Otherbeneficial 330 1, % 38.9% Totalbeneficial 15,065 2, % 100.0% 39
42 Inallregions,men salcoholattributabledeathsweredistributedmoreevenlyacrossdisease categoriesthanwomen s.formen,nocategoryinanyregionincludedmorethan33%ofalldeaths; whereasforwomen,thetoptwodiseasecategories(cancerandlivercirrhosis)inallregionswereabove 60%,andover70%intwoofthefourregions. Themortalityfiguresshowedconsiderablevariationbetweenregions.Twocauses injuries,and CVD(otherthanIHD) wereproportionallyhigherincentraleastandeasterneurope,whichreflected thatregion scombinationofhighconsumptioncoupledwithirregularheavydrinking. 41;58 Mentaland neurologicaldisorderswereproportionallyhigherinnordiccountries,reflectingtherelativelyhigh prevalenceofadandaudinthatregion(seefigure6,below).cancerwasproportionallyhigherin SouthernEurope,reflectingthemuchhigherlevelsofconsumptiontwodecadesago 24 (seereference59 formoredetails).asindicatedabove,cancertakesalongtimetodevelop.thecategorywiththemost similarrelativeproportionacrossallregionswaslivercirrhosis,whichvariedbetween23.3%and28.4% formen,and31.0%and39.9%forwomen.figure6,below,providesanoverviewoftheproportionsof alcoholattributablediseasecategories. Figure6:Proportionofdeathsformajordiseasecategories Thefigurebelowindicatestheproportionofalcoholattributabledeathsforthemajordisease categories,forpeopleaged15 64livingintheEUin
43 Intermsofthelargestcategory,livercirrhosis,alcoholcausedbetween75%and80%ofcases. ThiscanbeattributedtoarelativelylowprevalenceofotherriskfactorsforthisdiseaseinEurope;asa consequence,trendsinlivercirrhosismortalityratescloselyfollowedtrendsinalcoholconsumption. (Seereference50forageneraloverview,andreference60foranexampleinBritain.)Asdescribedin WebAppendix3,alcoholattributableproportionswereestimatedusingAlcoholAttributableFractions (AAFs)foralllivercirrhosis.ThesewerebasedonexposureandtheRR, 61 ratherthanoncauseofdeath recordsindicatingalcoholiclivercirrhosis.therearetworeasonsforthisprocedure.oneisthatdeath certificatesoftenunderestimate 6263 theproportionoflivercirrhosisattributabletoalcoholforanumber ofreasons,suchassocialstigmaorpotentialinsuranceproblems.second,ithaslongbeenrecognized thatwhendeathcertificatesindicatedetailed causeofdeath categories,thereisoftenahighdegree ofmisclassification.thecombinationofthesetwofactorsmeansthatthemisclassificationassociated withthe combined categoryoflivercirrhosisshouldbesmallerthanthemisclassificationforthe differentsubcategoriesofthedisease,suchasalcoholiclivercirrhosis. Withrespecttoproportionsoftheotherdiseases,weobservedamarkedimpactofalcohol consumptiononcancermortality,whichisinlinewiththeresultsofotherstudies.theseincludethe largestcohortstudyonalcoholandcancerintheeu. 53 Weobservedlargedetrimentaleffectsofalcohol consumptiononbothmortalityfromcvd(otherthanheartdisease,forwhichweobservedanoverall cardioprotectiveeffect;seereference4748)andinjury(bothunintentionalandintentional).theeffect onmentalhealthandneurologicaldisorderswasduemainlytoad,whichwasmoreprevalentineurope thaninmostotherpartsoftheworld. 2;64 TherewasaveryhighcongruenceofalcoholattributablemortalitybetweenEuropeanregions, withtheexceptionofischemicheartdisease(ihd),whereweobservedlesscardioprotection,inboth menandwomen,inthecentraleastandeasternregionscomparedtootherregions. 6;6566 This differencecouldbeexplainedbydataonlevelsandpatternsofdrinkinginthisregion,andbythehigher frequencyofheavydrinkingoccasions. 67 Consistentwiththisexplanation,thecardioprotectiveeffectof alcoholconsumptiondisappearedalmostcompletelyinrussia,wheretheneteffectwashighly detrimental. 9 Anotherobserveddifferencewasthelowerproportionofalcoholattributabledeathsfrom mentalhealthandneurologicaldisordersinsoutherneuropeanmen.thiswasduetothelowernumber ofindividualswithadinthisregion(seesectiononadbelowforfurtherexplanation).finally,therate 41
44 ofalcoholattributableinjurywashigherincentraleastandeasterneuropeanregions(seealso reference67). PotentialYearsofLifeLost(PYLL)duetoalcohol AnotherimportantmeasureinvolvingmortalityisPotentialYearsofLifeLost(PYLL) ameasure ofprematuremortalitythatattemptstoestimatethelengthoftimeapersonwouldhavelivedifheor shehadnotdiedearly.thisalternativemethodtousingthenumberofdeaths(ordeathrates)gives moreweighttodeathsthatoccuramongyoungerpeople.overall,weestimatedthatintheeuin2004, 1,684,000(95%CI:1,009,000to2,310,000)PYLLinmen,and408,000(95%CI:190,000to624,000)PYLL inwomen,wereduetoalcoholconsumption(total2,092,000(95%ci:1,199,000to2,934,000)).this correspondedto16.0%(95%ci:9.6%to22.0%)ofallpyllinmen,and8.0%(95%ci:3.7%to12.2%)of allpyllinwomen(13.4%(95%ci:7.7%to18.8%ofallpyll).theslightlyhigherproportionofalcohol attributablepyllcomparedtodeathsindicatesthatthesefatalitiesoccur,onaverage,earlierthanother fatalities.figure7providesdetailsoftheproportionsofallpyllbyregion.again,thecentraleastand EasternEuropeanregionhadthemostprematuremortality,andtherankorderisthesameasfor deaths(seefigure4,above). Figure7:RegionalvariationsintheproportionofPYLL ThefigurebelowindicatestheregionalvariationsintheproportionofalcoholattributablePYLLtoall PYLL,forpeopleaged15 64livingintheEUin
45 TheremainingstatisticsforPYLLalsolookfairlysimilartotherespectivestatisticsfordeaths,but withslightlymorevariationattheregionallevel,andbetweencountries.(seewebappendix6for estimatesandcisofpyllatthecountrylevel.) Figure8:ProportionofPYLLformajordiseasecategories ThefigurebelowindicatestheproportionofalcoholattributablePYLLforthemajordiseasecategories, forpeopleaged15 64livingintheEUin
46 Alcoholattributabledisabilityandburdenofdisease YearsofLifeLostDuetoDisability(YLD) ThenextmeasureofhealthtobereportedisYearsofLifeLostDuetoDisability(YLD),which measurestimelostduetodisability.tocalculatethisindicator,oneneeds(inadditiontodataon averageduration)aspecificdisabilityweightforeachhealthcondition,denotingtheproportionof detrimentitcauses.forexample,acertaincondition,suchasprofounddeafness,maybe30%disabling (seereference68forfurtherexplanation). Overall,intheEUin2004,1,675,000(95%CI:1,467,000to1,881,000)YLDinmen,and276,000 (95%CI:140,000to407,000)YLDinwomen,werelosttoalcoholattributablecauses(totalof1,951,000 (95%CI:1,607,000to2,288,000YLD)).Thiscorrespondsto14.5%(95%CI:12.7%to16.2%)ofallYLDin men,and2.2%(95%ci:1.1%to3.3%)ofallyldinwomen(8.1%(95%ci:6.7%to9.5%ofallyld)). Intermsofdisabilitycausingdiseases,AUDscontributedproportionallymoretodisability(as measuredbyyld)thantomortality:thiscategoryofdiseaseismoredisablingthanlethal.thismeans thatcountrieswithahigherincidenceofaudshavealargerproportionofalcoholattributableyldtoall YLD.ThisisespeciallyrelevantforNordiccountries,whichhaveaproportionallyhighlevelofAUD comparedtotheirdrinkingvolume(seefigure7;seewebappendix7forestimatesandcisofyldata countrylevel 69 ).TheproportionsofalcoholattributableYLDwerenotperfectlyassociatedwithabsolute ratesofyld.centraleastandeasterneuropeancountrieshadthehighestratesofalcoholattributable YLD,despitenothavingthelargestproportionofalcoholattributableYLDtoallYLDformen. 44
47 Figure9:AlcoholattributableYLDtoallYLD,byregion ThefigurebelowindicatestheregionalvariationsintheproportionofalcoholattributableYLDtoall YLD,forpeopleaged15 64livingintheEUin2004. Burdenofdiseaseduetoalcohol DisabilityAdjustedLifeYears(DALYs)areasummarymeasureofhealththataddtogetherPYLL andyldtocreateameasureofallyearsoflifelostdueeithertoprematuremortality,ortolivingwitha disability.dalyshavebecomethemostusedindicatorforcomparinghealthacrossdifferent jurisdictions.theyareusedbythewhoforitsregularhealthmonitoring,bytheworldbank,andby scientificstudiessuchasthegbd. Weestimatedthatin2004intheEU,3,359,000(95%CI:2,477,000to4,191,000)DALYsinmen, and684,000(95%ci:330,000to1,030,000)dalysinwomen,werelostduetoalcoholattributable causes(total4,043,000(95%ci:2,807,000to5,221,000)).thiscorrespondedto15.2%(95%ci:11.2%to 19.0%)ofallDALYsinmen,3.9%(95%CI:1.9%to5.9%)ofallDALYsinwomen,and10.2%(95%CI:7.1% to13.2%)ofalldalys.thefollowinggraphics,figures10and11,provideanoverviewofdetailsby regionandcountry. 45
48 Figure10:AlcoholattributableDALYstoallDALYs,byregion ThefigurebelowindicatestheregionalvariationintheproportionofalcoholattributableDALYstoall DALYs,forpeopleaged15 64livingintheEUin2004. Thedifferenceismorethandoublebetweentheregionwiththelowestproportionsofalcohol attributabledalysinbothsexes(southerneurope:men7.9%(95%ci:4.5%to11.3%);women:2.4% (95%CI:0.6%to4.2%)),andtheregionwiththehighest(CentralEastandEasternEurope:men20.2% (95%CI:14.3%to25.3%);women:5.0%(95%CI:2.1%to7.9%)).Nordiccountriesshowedoverallhigher ratesofalcoholattributabledalys,duetotheirrelativelyhigher(comparedtoothereuropeanregions) YLD(seeFigure10,above).Forbothmenandwomen,proportionsofalcoholattributableDALYsinthe NordiccountrieswereabovetheEUaverage.Thisobservationfitswellwiththeresultsoftimeseries modelling,inwhichtheeffectsof alcoholperunitconsumed werehigherinthenordiccountriesthan inthecentralwestandwesterncountries,aswellasthesoutherncountries.(thecentraleastand Easterncountrieswerenotincludedinpreviousanalyses,asoutlinedinreference70,mainlydueto alcohol seffectsonratesofinjury,bothintentionalandunintentional ) Alookatindividualcountriesrevealedgreatervariation,thoughmostvariationstilloccurred betweenregions.forcentraleastandeasterneurope(theregionwiththehighestalcoholattributable 46
49 burdenofdisease),bulgariahadthelowestburdenforbothmenandwomen(seefigure11;forcis,see WebAppendix8).Nordiccountriesdisplayedthegreatestvariationwithinaregion,withSwedenand Norwayamongthecountrieswiththehighestproportionofdiseaseforwomen,andIcelandwithoneof thelowest.formen,norwayandfinlandwereamongthecountrieswiththehighestproportionof disease;iceland,again,hadoneofthelowest.countriesfromcentralwestandwesterneuropeall clusteredaroundtheeumean,andthesoutherneuropeancountrieswereallamongthosewiththe lowerburdens(seefigure11,nextpage). 47

50 Figure11:ProportionofalcoholattributableDALYstoallDALYs ThefigurebelowindicatesthevariationoftheproportionofalcoholattributableDALYstoallDALYs,by country,formenandwomenaged15 64livingintheEUin
51 Table5:AlcoholattributableDALYsbydiseasecategories ThetablesbelowindicatethealcoholattributableburdenofdiseaseinDALYs,bybroaddisease categories,forpeopleaged15 64livingintheEUin2004. Detrimentaleffects Men Women Men Women Cancer 251, , % 17.5% CVD(otherthanIHD) 128,336 25, % 3.0% Mentalandneurologicaldisorders 1,691, , % 44.2% Livercirrhosis 512, , % 24.6% UnintentionalInjury 634,959 50, % 5.9% Intentionalinjury 347,225 24, % 2.8% Otherdetrimental 83,640 18, % 2.1% Totaldetrimental 3,649, , % % Beneficialeffects IHD 275,588 87, % 48.3% Otherbeneficial 15,049 94, % 51.7% Totalbeneficial 290, , % 100.0% Table5providesanoverviewofthemaincausesofthealcoholattributableburdenofdisease, whicharemarkedlydifferentfromthemaincausesofmortality.mentalandneurologicaldisorders comprisedthelargestproportionofdisease(asmeasuredindalys)forbothmen(46%)and women(44%).formen,injurieswerethesecondlargestcontributors(unintentional17%; intentional10%),whereasforwomenlivercirrhosiswasthesecondlargestcontributor(25%).the highburdenofmentalandneurologicaldisorderswasalmostentirelyduetoaud,especiallyad. ADwaslessfatalthanotherdiseasessuchascancerandCVD,andsocontributedrelativelymore tothediseaseburdenthantomortality.(webappendix10outlinesthemaincausesofdiseasein DALYsbybroaddiseasecategories,bysexandbyregion.) Mostregionaldifferencesintheproportionalcompositionoftheburdenofdiseasewere similartothedifferencesobservedfordeaths(seealsothemoredetailedexplanationabove followingtable4).themajordifferenceswerethattwocategories,injuryandcvd(otherthan 49
52 IHD),werebothproportionallyhighestinCentralEastandEasternEurope.Thebiggestdifferences betweenregionswereobservedformentalandneurologicaldisorders,whichcomprised approximatelytwothirdsofallalcoholattributabledalysforthenordiccountries;abouthalffor CentralWestandWesternEurope;slightlymorethanonethirdforCentralEastandEastern Europeancountries;andaboutonethirdfortheSouthernEuropeancountries.Overall,itwas observedthattheproportionsofalcoholattributabledalystoalldalyswithinthemajordisease categorieswererelativelysimilartotherespectiveproportionsformortality. Figure12:ProportionsofalcoholattributableburdenofdiseaseinDALYs ThefigurebelowindicatestheproportionsoftheburdenofalcoholattributablediseaseinDALYs,by diseasecategories,forpeopleaged15 64livingintheEUin2004. Healthharmstoothersduetoalcoholconsumption Thusfarwehavediscussedtheeffectsofalcoholconsumptionintermsofdiseaseandmortality affectingthedrinkersthemselves.however,drinkersnotonlyendangertheirownhealth,butalsothe healthofothers.thissectionwilldescribethemajorharmstoothersduetoalcoholconsumption.the victimsofthesedamagesarepeoplewhomayormaynotdrinkthemselves,butareaffectedbyother people sdrinking.thiscategoryincludesthreemajoritems,withgreatlydifferentprevalencerates.the largestistransportinjuries:passengersorotherdriverswhoareinjuredorkilledbydrunkdrivers.thisis themaincauseofharmstoothers,withthenextitemcomingadistantsecond:physicalviolenceor 50
53 homicideengagedinbyindividualsundertheinfluenceofalcohol.(thisreportfocusessolelyonthe drinkingofthepersonsresponsibleforassault.althoughitistruethatpeoplewhodrinkdoincrease theirownprobabilityofbeingassaulted,weonlycalculatedmortalityandmorbiditybasedonthe drinkingofothers.)finally,babiesbornwithlowbirthweightduetothemother sdrinkingaccountfora smallbutsignificantproportionofharmstoothers. Onewayinwhichthissectiondiffersfromourmainanalysisofalcoholrelatedharmsisthatit includesallagegroups.thecategoryof harmstoothers affectspeopleofallages,andsothis particularanalysisisnotrestrictedtopeople15 64yearsofage. IntheEUin2004,formenofallages,theharmstootherscausedbyalcoholconsumption included5,564deaths,139,824pyll,18,987yld,and158,811dalys allestimatedtobeattributable todrinking.forwomenofallages,theanalogousfigureswere2,146deaths,51,326pyll,8,423yldand 59,749DALYs.Forbothsexes,thetotalswere7,710deaths,191,151PYLL,27,410YLD,and218,560 DALYs(seeWebAppendix11formoredetails,includingCIs).Table6outlinesthealcoholattributable burdencausedbyharmstoothers. Ourfindingsontheproportionsofthethreemaincategoriesofalcoholattributableharmsto others transportinjuries,violence,andlowbirthweightinbabies weresimilartothoseobservedin anaustralianstudyin2005.inthatcase,atotalof367peoplediedduetoalcoholconsumptionby others:75.4%frommotorvehicleaccidents,21.0%fromassaults,and3.6%fromfetalalcoholsyndrome (FAS),whichincludeslowbirthweight. 74 (ThemortalitypercentagesforFASwerehigherinAustralia thanthelowbirthweightmortalitypercentagesintheeu.thisisbecausethefasdatafromaustralia includedothercausesofdeathanddisabilitythatarenotincludedinthisreport,duetothelimitations ofmortalitydataonaninternationallevel.) 51
54 Table6:Alcoholattributablemortalityanddiseasecausedbyharmstoothers Thetablebelowindicatesthealcoholattributablemortalityandburdenofdiseasecausedbyharmsto others,forpeopleaged15 64livingintheEUin2004. HealthBurden Numbers Percentageoftotal Deaths Men Women Men Women Lowbirthweight % 2.1% Violence 1, % 31.9% Transportinjuries 3,916 1, % 66.0% Total 5,564 2, % 100.0% DALYs Lowbirthweight 2,685 2, % 3.5% Violence 47,956 18, % 31.7% Transportinjuries 108,170 38, % 64.8% Total 158,811 59, % 100.0% Intermsofdeathscausedbyharmstoothersin2004,menhadalowerpercentagethanwomen acrosstheeu withtheexceptionofsoutherneurope.ofthetotalalcoholburdenmeasuredindeaths, thenumbersforalcoholattributableharmstootherswere3.3%forbothsexes(3.1%formen;3.8%for women);andmeasuredindalys,4.5%forbothsexes(4.0%formen;6.9%forwomen). 52
55 TheContributionofHeavyDrinking Ourresearchfoundthatheavydrinking definedasconsuming, onaverage,atleastfivestandarddrinksofpurealcoholadayfor men,andatleastthreeforwomen causedmostofthealcohol attributableburdenin2004.intermsofdalys,89%were attributabletoheavydrinking;andintermsofdeaths,77.3%were alcoholattributable.thisworkedouttoatotalof92,600deaths: 75,200amongmen,and17,400amongwomen.Reducingthe incidenceofheavydrinkingisthekeytoreducingthehealthtoll onsocietyintheeu. Heavydrinking inmenisdefinedasconsuming60+gofpurealcoholperday(theequivalent ofatleast5standarddrinksof12gpurealcohol);andinwomenasconsuming40+g(equaltoatleast 3.33standarddrinks).Thiscorrespondstothecategoriesdefinedas highrisk/veryhighrisk bythe EuropeanMedicinesAgency,basedonWHOguidelines. 25 Heavydrinkingisconsideredtoberesponsible foralargeproportionofthealcoholattributableburdenofdiseaseamongeuresidentsaged15to64. Table7,below,outlinestherelativealcoholattributablemortalityandburdenofdiseasecausedin2004 byheavydrinking. Weestimatedthatmorementhanwomenwereheavydrinkers(seeTable1),andsowe expectedthatheavydrinkingwouldcauserelativelymoreharmtomenthanwomen.indeed,basedon the2004data,heavydrinkinginmenwasresponsiblefor11.1%ofalldeaths,68.7%ofharmfulalcohol attributabledeaths,and79.6%ofnetalcoholattributabledeaths(foratotalof75,200maledeaths).in contrast,amongwomenheavydrinkingwasresponsiblefor5.3%ofalldeaths,61.6%ofharmful alcoholattributabledeaths,and68.8%ofnetalcoholattributabledeaths(foratotalof17,400female deaths).thesefiguresshowthatintermsofalldeaths,theharmfuleffectsofheavydrinkingonmenare roughlydoublethoseonwomen. 53
56 Similarly,intermsofDALYs,heavydrinkinghadmoreofanimpactonmen sthanitdidon women s.weestimatedthatamongmen,heavydrinkingwasresponsiblefor13.3%ofalldalys,80.5% ofharmfulalcoholattributabledalys,and87.4%ofnetalcoholattributabledalys.forwomen,we estimatedasmallerrelativeburden heavydrinkingwasresponsiblefor3.8%ofalldalys,and76.4%of harmfulalcoholattributabledalys.however,therewasalargerrelativeburdenfornetalcohol attributabledalys:heavydrinkingwasresponsiblefor96.7%.table7,below,breaksdownthenumbers bycategory,sex,andagerange. Table7:Alcoholattributablemortalityanddisease Thetablebelowindicatesthealcoholattributablemortalityandburdenofdiseasecausedbyheavy drinking,forpeopleaged15 64livingintheEUin2004. HealthBurden Number Percentageoftotal Percentageofthenet alcoholattributableburden Men Women Men Women Men Women Deaths 15to34 8, % 3.5% 61.1% 54.9% 35to64 67,155 16, % 5.4% 82.6% 69.9% Total 75,191 17, % 5.3% 79.6% 68.8% PYLL 15to34 227,083 26, % 3.3% 59.4% 54.5% 35to64 1,034, , % 5.7% 79.5% 67.5% Total 1,261, , % 5.3% 74.9% 66.0% DALYs 15to34 1,231, , % 4.2% 86.9% 93.7% 35to64 1,705, , % 3.5% 87.8% 98.7% Total 2,936, , % 3.8% 87.4% 96.8% 54
57 AlcoholDependence:PrevalenceandAssociatedHarm AlcoholDependence(AD),amaladaptivepatternofalcoholusein whichindividualslosecontrolovertheirdrinking,isoneofthe mostsevereconsequencesofalcoholconsumption.adislinkedto manypersonalandsocialharmsthataffectphysiological, psychologicalandsocialaspectsofpeople slives.ineuropein 2005,ADaffectedanestimated5.4%ofallmen,and1.5%ofall women,betweentheagesof18and64.recentevidence indicatesthatadaccountsfor62%ofallalcoholattributablenet deaths,and71%ofalcoholattributabledeaths.themaincauseof thismortalityseemstobeheavydrinking,ashigherlevelsof consumptionareclearlylinkedtoahigherriskofdeath. Definitionofalcoholdependence ADcanbecharacterizedasanindividual sinabilitytocontroltheirdrinking.thediagnosticand StatisticalManualofMentalDisorders(DSMIV)defineditas amaladaptiveuseofalcohol with clinicallysignificantimpairmentoveraperiodofatleastayear.thisimpairmentmanifestsitselfin peopleinanumberofways,suchas: havingincreasedtoleranceforalcohol(i.e.apersonmustdrinkmoretofeelitseffects) experiencingwithdrawalsymptomswhennotdrinking consumingalcoholingreateramountsthanintended,oroveralongertime makingunsuccessfulattemptstocutdownorcontrolalcoholuse spendingagreatdealoftimeobtainingalcohol,drinkingit,orrecoveringfromitsuse givinguporreducingformersocial,occupational,orrecreationalactivities continuingtodrinkdespiteknowledgeofalcohol sphysicalandpsychologicaldamages
58 Inotherwords,anumberofaspects physiological,psychological,andsocial arerelevantfora diagnosisofad(seereference76fortheclassicdiscussionofthesubject).theicdusesasimilar definitionasthedsm, 77 anditsmeasurementofadoverlapsthedsm stoalargedegree. 78 Prevalenceofalcoholdependence Overall,in2005closeto11millionpeopleaged18 64intheEUsufferedfromAD.Ifweinclude theyoungerandolderagegroupsaswell,thisestimateincreasestoabout12million(seewebappendix 12;forregionalestimates,seeWebAppendix13).Table8providesanoverviewofthe12month prevalenceratesforadinall27eucountries.iceland,norwayandswitzerlandareincludedaswell,plus Russiaasanexternalcomparison. ToestimateprevalenceinEurope,weusedlargegeneralpopulationsurveyswhenthesewere available;whennot,wereliedonthewhoregionalofficeforfigures(seetable8forreferences). CountrieslocatedinSouthernEurope(primarilyMediterraneancountries)hadthelowestADrates: 0.6%forwomen,and1.7%formen(seeWebAppendix13fordetailsonregionaldifferences).These primarilywinedrinkingcountriesnotonlyhadloweroverallconsumptionrates,butconsistentlyhadthe mostfavourabledrinkingpatternsineurope,andalsointheworld(seereferences6and32).soit comesasnosurprisethattheyhadthelowestprevalenceofadineuropeaswell(seeabove).however, itshouldbecautionedthatthesefiguresmaynotbeentirelyreliable,duetotherolethatalcoholplays inthesecountries.ontheonehand,alcohol(mostoftenwine)isdeeplyculturallyembedded;buton theotherhand,alcoholproblemsanddependencearedeeplytaboo.thismeansthatresidentsofthese particularcountries,morethanothers,maytendnottoreportsymptomsofad,forreasonsofsocial stigma.(forawidercontextandadditionalexplanations,seereference79.)otherindirectindicators traditionallyusedforestimatingadrates(thesocalledjellinekformula;seereference80)suggesta potentialunderestimationforitalyandspain,inparticular. vi Butofcourse,indirectestimatesofAD entailproblemsaswell vitheproblemofprevalencefiguresforitalyandspainwasfurthercomplicatedbythefactthattheoriginal surveysusedaflawedmethodology.questionsaboutalcoholdependencewereonlyaskedofrespondentswho hadalreadyscoredpositivelyforquestionsrelatingtoalcoholabuse.thisfactledtoasevereunderestimateof alcoholdependenceinthegeneralpopulation. 81 Weattemptedtocorrectforthismethodologybyusingnumbers fromthegermanmentalhealthsurvey,wheredependenceandabusewereassessedindependently However,thisonlycorrectssomeoftheunderestimation.Incountrieswith Mediterraneanstyle drinking(mostly withmeals),theproportionofadtoalcoholabuseisusuallylargerthanincountrieswith Nordicstyle drinking thatis,higherratesofdrinkingapartfrommeals,andmoreirregularbingedrinking. 56
59 IntherestofEurope,especiallyintheNordiccountriesandtheCentralEastandEastern Europeancountries,prevalencefiguresarenotablyhigher(allregionalestimatesaregiveninWeb Appendix13).EvenNordiccountrieswithrelativelylowconsumptionlevels,suchasSweden,havea proportionallymuchhigherpercentageofad.thecentraleastandeasterneuropeancountries, particularlythebalticcountries,havethehighestprevalenceofad.thisstemsprimarilyfromthe combinationofhighoverallconsumptionanddetrimentaldrinkingpatterns includingheavybinge drinking.(seereference69forfurtherexplanation.) 57
60 Table8:Peopleaffectedwithalcoholdependence,bycountry Thetablebelowindicatesthenumbersandprevalence(inpercentages)ofmenandwomenaged18 64affectedwithalcoholdependence,living intheeuin2005,bycountry(bestestimates). Women Men W M affected affected Year Source Austria , , See reference 86 Belgium , , Bulgaria , , See reference 87 Cyprus ,400 13, See reference 87 Czech Republic , , WHS Denmark ,300 83, See reference 88 Estonia ,500 45, See reference 87 (own calculations) median of two major surveys: WMHS (corrected), and Belgian Health Survey 2001, cf. GSRA Finland , , See reference 89 for under 30-year-olds; 90 for year-olds (see also 91) France ,700 1,001, WMHS, adjusted Germany ,900 1,445, See reference (personal communication) Greece , , See reference 87 Hungary , , See reference 87 Iceland , See reference 87 Ireland ,600 86, See reference 87 Italy , , See reference 92 (adjusted) Latvia ,400 60, See reference 87 (own calculations) Lithuania , , See reference 87 (own calculations) Luxembourg ,000 8, median of France and Germany Malta ,000 3, See reference 87 Netherlands ,000 53, /2009 See reference 93 Norway , , See reference 94 Poland ,500 1,058, See reference 87 Portugal , , See reference 87 (we asked for new data from the 2008 survey) 58
61 Romania , , See reference 95 et al., 2009 (adjusted) Slovakia , , /2001 MCSS Slovenia ,200 71, GSRA (adjusted for screening scale) Spain , , /2001 WMHS, adjusted Sweden , , PART study, cf. 69 Switzerland , , See reference 96 UK 6 (England only) ,300 1,745, EU ,400,00 8,500,000 own calculations For comparisons Russia ,104,800 8,888, aft%202009%20v7.pdf Based on treatment data from Kirzhanova, V.V., National Research Centre of Narcology, under the Ministry of Health and Social Development of Russia, Moscow 7 Note: The red-shaded cells indicate more than 150% of the EU average, and the green-shaded cells less than 50%. If the male and female figures have the same shading, the country name is also shaded. Abbreviations for Data Sources GSRA: Global Status Report on Alcohol 97 MCSS: Multi-Country Survey Study 98 WHS: World Health Survey 99 WMHS: World Mental Health Survey 100 Notes on Table 8 1 There are several regional studies in Germany (see overview in reference 69), but this is the latest national survey with comparable methodology. The next national mental health survey is ongoing. 2 Indirect estimations are around 8% for both genders combined, based on a variant of Jellinek's formula (see 3 A recent general-population survey from Latvia in 2011 found prevalence rates of 21% for men, and 4% for women, using standardized methodology (CIDI; personal communication from M. Trapencieris, from the Latvian Centre for Disease Control and Prevention). 4 The prevalence of abuse was found to be 5 times higher in the Netherlands. AUDs have been stable for the past decade, but AD estimates had beenmarkedly higher in past surveys. 5 The prevalence of AD in primary health care in Poland was found to be 19%, using the CAGE screening scale Other UK estimates include the one cited by the National Institute for Health and Clinical Excellence, 103 which amounted to 6% of men and 2% of women. 7 The Russian treatment multiplier used was quite conservative. We estimated that 33% of urban dwellers with AD are treated, and 10% of rural dwellers. For Western and Central Europe, less than 10% of all people with AD are treated
62 Mortalityandburdenofdiseaseofalcoholdependenceasadiseasecategoryin2004 Table9givesanoverviewoftheimpactofADdiseaseandmortalityinEurope.Thefiguresfor deatharerestrictedtosituationswhereadismentionedonthedeathcertificate;andtheburdenof diseaseisderivedbycalculatingtwofactors,pyllandyld.weaddedtogetherthepyllforad causeof deaths, andtheyld theestimatedadincidenteventsweremultipliedbythedisabilityweight,and theaverageduration. 104 AsTable9indicates,theburdenofdiseasefromADinEuropeancountriesvariedsubstantially, eventhoughtheaveragelevelofalcoholconsumptiondidnot.thereasonsareatleastthreefold: Drinkingpatternsvariedfromcountrytocountry;andtheburdenfromAUDseemedtobemore prevalentincountrieswithmoreproblematicpatterns. 69 Therewerecleardifferencesbetweencountriesinthecodingpracticesformedicaldeath certificates.somecountries(suchasslovakia)rarely,ifever,indicatedad,or harmfuluseof alcohol, asthecauseofdeath,eventhoughthosecountrieshadahighprevalenceof dependenceandahighburdenofdisease.themostlikelyreasonswerethestigmatizationof AD,whichvariesaccordingtoacountry sculture and,overall,isstrongerthanforother mentaldisorders. 107 Afurtherissuemaywellbetheimpactofinsurancerules,sinceinsome countrieslifeinsurancedoesnotcoverdeathfromalcoholrelatedcauses. TheWHOalgorithmsseemednottoworkinsomecountries,whereADorharmfuluseofalcohol wasdeterminedasthecauseofdeathinonegenderonly(e.g.cyprus).thisisimplausible,since ADwasclearlypresentinallEuropeancountriesforbothmenandwomen(seeTable8,above). 60
63 Table9:Deaths,PYLLandDALYslostduetoalcoholdependence Thetablebelowindicatesthepopulationstandardizeddeaths,PYLLandDALYslostduetoalcohol dependenceasadiseasecategory,bysexandcountry,forpeopleaged15 64livingintheEUin2004. Deaths (per 100,000 people) PYLL (per 100,000 people) DALYs (per 100,000 people) Country Women Men Total Women Men Total Women Men Total Austria Belgium Bulgaria Cyprus Czech Republic Denmark Estonia Finland France Germany Greece Hungary Iceland Ireland Italy Latvia Lithuania Luxembourg Malta Netherlands Norway Poland Portugal Romania Slovakia Slovenia Spain Sweden Switzerland United Kingdom Total (European Union) For comparison: Russia Federation
64 Note: The red-shaded countries had an AD-related burden of disease (DALYs) that was more than 50% above the EU average; the burden of the green-shaded countries was at least 50% below the EU average. 62
65 DespiteconsiderableproblemswithmeasurementintheofficialWHOstatistics, vii andinthe underlyingsurveys(seeabove),wecanstillidentifyclearpatternsintheburdenofadacrosstheeu. ThetraditionalwinedrinkingcountriesintheMediterraneanandCentralWesternEurope(Italy,France, Greece,Portugal,Spain),whichhaveconsistentlydecreasedtheiroverallconsumptionofalcoholin recentyears, 24 hadlowerratesofadthantheeuaverage(seetable8).thismaybeduetothepattern ofdrinkinginthosecountries,wherealcoholisconsumedpredominately(oftenexclusively)withmeals; ingeneral,intoxicationandbingedrinkingareavoided.whilewebelievetheprevalenceofadtobe underestimatedinitalyandspain,allindicatorsstillpointtoarelativelylowprevalenceinthesouthern Europeanregion. ThispatternofdrinkingcontrastswithcountriesinEasternEurope,whereoverallconsumption ismuchhigher.drinkingspiritsratherthanwine,aswellasdrinkingtointoxication,ismuchmore commonthere;andthisleadstoagreaterburdenofad.thesearemainlythebalticcountries,aswell ashungaryandslovakia.notably,thesearealsolesswealthycountries,wherethegdppppisbelowthe EUaverage. TheNordiccountries,andtheCentralWestandWesternEuropeancountries,exhibitedADrates thatfellinbetweenthesoutherneuropeanandeasterneuropeanrates.thenordiccountries rates wererelativelyhighcomparedtotheirconsumptionlevels,whichmaybeexplainedbytheirhigherrates ofirregularheavydrinkingleadingtointoxication. 69 FortheCentralWestandWesternEuropeanregion, drinkingpatternsinthelargestcountries GermanyandFrance areclosertothesoutherneuropean patterndescribedabove.thismeansthattheoverallpopulationstandardizedimpactofadinthe CentralWestandWesternEuropeancountriesislowerthanintheNordiccountriesandtheCentralEast andeasterneuropeancountries. Theoverallhealthburdenattributabletoalcoholdependenceasariskfactor ADisnotonlyadiseasethatcanleadtoprematuredeathanddisability;itisalsoamajorrisk factorforotherdiseases,withtheirownassociatedmortalityanddisabilityburdens.(thecomparative RiskAssessmentoftheGBDdefinesariskfactorasanyattributeorexposurethatiscausallyassociated viitherearealsosomepeculiaritiesintheunderlyingwhostatistics.forinstance,thewhoidentifiedcyprusasa countrywithnoauddeathsorburdenofdiseaseforwomen,whichwascertainlyincorrect.similarly,thedeath rateinslovakiaduetoaudwascalculatedaszero.thisfactwasidentifiedastheresultofacountryspecific codingpatternforcauseofdeathcertificates,whichledtoanunderestimationoftheaudrelatedburdenof disease. 63
66 withtheincreasedprobabilityofadiseaseorinjury )Thedifferencebetweenadiseasecondition andariskfactoriscrucial.admayleadtoanoverdoseindrinking,andthusmayappearonthedeath certificateasthecauseofdeathaspartofroutinevitalregistration.however,admayalsocauseother fatalconditions,suchasoesophagealcancerorlivercirrhosis;andthusitwouldstillbecausaltothese deaths,eventhoughitisnotlistedascauseofdeathonthedeathcertificate.insuchcases,whenthe causeofdeathisadiseaseorinjuryotherthanad,adisconsideredariskfactor. HarrisandBarraclough, 110 inthemostrecent(1998)systematicreviewandmetaanalysisofthe mortalityburdenattributabletoad,foundthatthestandardizedmortalityratio viii (SMR)forpeoplewith ADwasabouttwicethatofthegeneralpopulation(ofthesamesexandage,inthesameregion).For bothsexescombined,excessmortalitywashighestinthetwocategoriesofinjury,andmentaland digestivedisorders.inthecaseofinjury,bothunintentionalandintentional,suicidewastheleading causeofintentionaldeath;andinthecaseofmentalanddigestivedisorders,livercirrhosiswasthe leadingcauseofthelatter. Studiessince1998havesupportedHarrisandBarraclough sfindings,butfoundconsiderably highersmrs,especiallyintreatmentpopulations.(forsomeeuropeanexamples,seereferences )Forinstance,Hayesandcolleagues 113 recentlyconductedalargefollowupstudyinenglandof morethan10,000patients.thestudy,basedontreatmentregistersinlondon,reportedsmrsof9.3for patientsundertheageof45,andof4.5forpatientsaged45 64.ThedifferencebetweentheSMRof2 foundintheharrisandbarracloughmetaanalysis,andthemuchhighernumbersinthehayesstudyof 2011,canbeexplainedinpartbythefactthattheoriginalmetaanalysis 110 includedallcohortsofad; whereasthelondonstudy 113 includedonlypatientsinspecializedtreatmentforalcoholusedisorders, whomayhavehadmoresevereformsofdependence.thisconclusionissupportedbythefactthat cohortsfromthegeneralpopulationwithadtendtohavesmallerrisks.(forexamples,seereferences ,includingstudiesbyPeräläandcolleaguesforthesubgroupwithoutpsychoticdisorders.) Insummary,ADisastrongriskfactornotjustforprematuremortality,butalsoforother diseasesandinjuries. viiithestandardizedmortalityratio(smr)isameasureofmortalityinagivenstudypopulation inourcase, peoplewithad relativetothemortalityinareferencepopulation inourcase,thegeneralpopulationofthe samesexandage.inthiscase,ansmrof2meansthatmortalitywastwiceashighinthestudypopulationasit wasinthegeneralpopulation(samesexandage)inthatregion. 64
67 QuantifyingthemortalityburdenofAD WeestimatedthemortalityburdenofADacrosstheEUbyusingthefollowingassumptions, basedonthescientificliterature: For20%ofthepeoplewithAD,weutilizedtheSMRsofHayesandcolleagues, 113 assumingthat 20%reflectedthenumberofpeopleintreatmentorwithsimilarlyseveredependence. Fortheremaining80%ofthepeoplewithAD,weassumeddifferentlevelsofSMRbasedonsex andage.intheagerangeof1544,weassumedansmrof2.25formen,and2.7forwomen.in theagerangeof45andolder,weassumedansmrof2formen,and2.4forwomen.these figuresreflectedthesmrassociatedwithaverageseverityofuntreatedadinthegeneral population.(therearethreestudiesinthecommunityofmortalityrisksformen,twoinvolvinga verylongfollowupperiod;seereferences ) TheseRelativeRisks(RRs)canbecombinedwiththeoverallprevalenceofADinEuropeto obtainalcoholattributablefractions.theexactformulausedforcalculatingcategoricalriskwasderived fromthegeneralformulaforcounterfactuals(seereferences109and121),withnoadassumedtobe thecounterfactualofminimumrisk: n P i RR i P i RR i i PAF n i P i RR i i n Inthisformula,P i representstheproportionofthepopulationwithad;p i representsthe proportionofthepopulationgivenacounterfactualexposurelevel,i.e.noadinthepopulationunder consideration;rrrepresentstherelativeriskofagivenoutcomeatexposureleveli;andnisthenumber ofexposurelevels.inotherwords,thesepopulationattributablefractionsmeasuredthepotential proportionalreductionofmortality,assumingthattherewasnoadineurope.iftheattributable fractionsareappliedtotheactualmortalityburden,theycanbeinterpretedastheadattributable burden,similartothealcoholattributableburdendescribedabove(seealsowebappendix2).ifwe applytheseformulastothedifferentcountriesoftheeu,andthenaddtheresultstogethertocalculate thetotaleuburden,theresultisafigureof72,888deathsformen,and12,179forwomen,duetoad. 65
68 Comparingalcoholattributablemortality Inthefollowingsection,wewillexaminethedifferentfractionsoftheEUmortalityburden causedbyalcoholconsumptionasawhole,byheavydrinking,andbyad.figure13summarizesthese differentmortalityburdensinthepopulationaged15 64years.Itoutlinestheoverallburdenofalcohol consumption(consideringonlythedetrimentaleffectsonmortality,notanybeneficialeffects;seetable 4,above);thenetburden,whichhasbeenmainlyconsideredbefore(i.e.takingintoconsiderationthe beneficialeffects);theburdenforheavydrinking,usingthewhoriskcategories(40+gofpurealcohol forwomen,60+gofpurealcoholformen);andthemortalityburdenduetoad. Figure13:MortalityattributabletoalcoholconsumptionandAD ThefigurebelowindicatestheproportionofmortalityattributabletoalcoholconsumptionandAD,for peopleaged15 64livingintheEUin2004. Note: Heavydrinking isdefinedas40+gofpurealcoholperdayforwomen,and60+gofpurealcohol perdayformen.thetechnicaldetailsofthecalculationsofmortalityattributabletoad(includingthe CIs)canbefoundinWebAppendix14;theotheralcoholattributablefractionsinFigure13are explainedabove. Ascanbeseen,mostofthemortalityburdenstemsfromheavydrinkers(about77%ofthenet burden,67%oftheoverallburden).admakesupof71%ofthenetburden,and62%ofallharmful 66
69 alcoholattributablemortality.inotherwords,asubstantialpartoftheoverallalcoholattributable mortalityburdenisduetoad,causedinpartbyheavydrinking.thisfindinghassomeimportant implicationsforpublichealth: IfaneffectivetreatmentforADcouldbedeliveredtoasizableportionoftheaffected population,itwouldhaveaprofoundandpositiveeffectonoverallpublichealththrough reductionofmortality. Tobeeffective,atreatmentmustreduceheavydrinkinginpeoplewithAD.Thiscanbedone eitherbyencouragingabstinence,orbysubstantiallyreducingtheaveragelevelofdrinking especiallybyreducingepisodesofheavydrinking.asmostrrshaveanexponentialdose responserelationship(thatis,alinearrelationshipbetweenexposureandlogarithmizedrisk),a reductionintheheaviestdrinkingoccasionswouldproduceadisproportionalbenefitinthe numberofdeathsavoided. ThereductionofthealcoholattributableriskinEuropeshouldbeseenonacontinuumofrisk involvingthreegroups: o o o Inthegeneralpopulation,thelevelofoverallconsumptionshouldbereduced. Specialemphasis,intheformofeffectivebriefinterventions,shouldbegiventopeople whoareproblemdrinkers,andthosewhodrinkheavilybutarenottechnically dependent. 122 PeoplewithADshouldbetreated. Beforewediscusstheseimplicationsfurther,thepotentiallimitationsofthiskeyresultshould beexamined.theseconclusionsrelyontheunderlyingassumptionsofthevalidityoftheprevalence data,andoftherrs.therehavebeensomeproblemsincertaincountries(seeabove)withmeasuring theprevalenceofad:someoftheindividualcountryfiguresmaybeunderoroverestimated.inthe generaleupopulation,however,therearesufficientwellconductedstudiestoindicatethattheoverall figureofabout3.4%isnotanoverestimate.foronething,thisfigureisquiteclosetotheestimatesfor otherhighincomecountries,suchastheusat3.8%(seereference123).thesamecaveatappliestothe RRs.Themortalityrisksuseddependonpooledestimatesofgeneralpopulationstudies,plustheuseof oneofthelargestrecentstudiesforthetreatmentsamples.methodologicallyrigorousmetaanalyses 67
70 arenecessarytoquantifytherisksforboththegeneralpopulationandthetreatmentsamples;and theseformalanalysesmayresultinslightlydifferentestimates.however,thisdoesnotseemto invalidatetheoverallconclusion. Asexpected,theproportionsofheavydrinkingtoallalcoholattributablemortalityburdens (bothnetandtotal)donotvarybetweeneuregions(seewebappendix15).however,theproportions oftheadmortalityburdentoallalcoholattributablemortalityburdensdovaryconsiderably:from slightlyover30%inthesoutherneuropeanregioncountries,toalmost95%inthenordiccountries. Bothotherregions(EasternandWestern)arerelativelyclosetotheEuropeanaverage.Thisunderlines, yetagain,theculturaldifferenceswhenitcomestorespondentsansweringadsurveys:southern Europeansclearlyhaveatendencytoanswersuchquestionslessaffirmatively,especiallywithrespectto losingcontrolasaresultofdrinking. 68
71 OverallBurdenandSocialCostsofAlcoholDependence WhiletheburdenofADisamajorpublichealthproblem,other consequencesalsohavemarkedimpactsonthesocietiesofthe countriesaffected.theseincludesocietalharmssuchasdivorce, familyproblems,workplaceproblems,andvandalism;andalso economicdamages,suchasindividualcosts,lostworkplace productivity,increasedhealthcarecosts,etc.in2010,theoverall socialcostsofalcoholconsumptionineuropewereestimatedat some 155.8billion.Acautiousestimateoftheeconomiccostsof ADwouldbebetween 50billionand 120billion.Further researchisneededtocalculatethisfiguremoreprecisely. BurdensattributabletoAD Thusfarinthisreport,wehaveconcentratedexclusivelyonthealcoholattributablehealth burden.however,adcausesadditionalburdensthatgobeyondhealth.figures14and15,below,givea conceptualoverviewnotjustofthehealthburdens,butalsoofthesocialandeconomicburdens.these arefurtherbrokendownintotheireffectsonfouraffectedgroups:individuals,families,work,and society.thetwotablesalsobreakdowntheeffectsintotwotimeframes.thefirst,figure14,showsthe effectsimmediatelyfollowingalcoholattributableincidence;thesecond,figure15,showstheeffects after3 5yearsofpersistingalcoholdependence.(Theseresultsarebasedontheliteratureoutlinedin thefollowingreferences:forhealth,see110;124125;foreconomicburden,see7;126128;for interpersonalrelationshipsandsociety,see129;andforwork,see130.) 69
72 Figure14:BurdensofAD,afterincidence Thefigurebelowprovidesaconceptualoverviewoftheburdensofalcoholdependence,afterincidence. Burdens Individual 131 Family/partnerships/close friendships 132 Work 130 Society 128 Healthburden Injuries; blackouts; hours of drunkenness; alcohol-dependent style of drinking that could aggravate existing health problems Injury (e.g. from child neglect or drunk driving); stress-related problems for other family members; FASD; interpersonal violence Injury Injuries to self and others, including consequences; acutecare hospitalizations for health problems caused by alcohol; FASD Socialburden 131 Decreases in functionality associated with AD (blackouts, hours of drunkenness); decline in social role; loss of friendships; stigma Problems with parental roles, partnership roles, and caregiver roles (e.g. to children, parents) Teamwork problems; others having to compensate for lack of productivity Social costs of alcohol; vandalism Economicburden Depends on country and socio-economic status; often cost of alcohol plus cost of possible job loss, or absenteeism Financial problems resulting from the health and social consequences of alcohol; negative effects on family budgets and household expenses Absenteeism and other productivity costs (mainly suboptimal performance when on the job, and short-term disability) Productivity losses; health care costs (including treatment of AD); costs in the legal sector (police, court, prisons) 70
73 Figure15:BurdensofpersistentAD Thefigurebelowprovidesaconceptualoverviewoftheburdensofpersistentalcoholdependence,after 3 5years. Burdens Individual 131 Family 132 Work 130 Society 128 Healthburden Morbidity from diseases caused or worsened by AD and associated premature mortality Injury (e.g. from child neglect or drunk driving); stress-related problems for other family members; FASD; interpersonal violence Injury Acute care hospitalizations for health problems caused by alcohol; injuries; infectious diseases; FASD Socialburden 131 Decreases in functionality associated with AD (blackouts, hours of drunkenness); decrease in social role; loss of friendships; stigma Problems with parental roles, partnership roles, and roles as caregiver in general (e.g. to parents) Team problems; others having to compensate for lack of productivity Social costs of alcohol; vandalism Economicburden Dependent on society and on socio-economic status of person with AD; often cost of alcohol plus cost of possible job loss or absenteeism; possible social drift downwards Financial problems resulting from health and social consequences of alcohol impacting on family budget and household expenses Absenteeism and other productivity costs (mainly suboptimal performance when working and disability, short- and longterm); replacement costs in case of premature mortality or long-term disability Productivity losses; health care costs; costs in the legal sector (police, court, prisons) Oneproblemwiththisapproachisthatitisdifficulttomeasurealltheburdenscomparatively acrosseucountries.whilethehealthcaresectorisstandardizedbytheicdsystem,withcomparable diagnosesandcausesofdeath,thesocialandeconomicsectorsarenotsimilarlystandardized.oneway aroundthisistocomparecountriesbasedonstudiesof socialcosts definedasallcoststosociety arisingfromalcoholconsumptionthatarenotborneexclusivelybythedrinker.thismeasurerepresents thenegativeeconomicimpactofalcoholconsumptiononthematerialwelfareofasociety. 71

74 ThesocialcostofalcoholandAD GiventhisdescriptionofEurope salcoholandadburden,itcomesasnosurprisethatthe overallsocialcostsofalcoholusearesohigh.whendefiningsocialcosts,itisimportanttomakeakey distinctionbetweendirectandindirectcosts.directcostsrefertothevalueofgoodsandservices actuallydeliveredtoaddresstheharmfuleffectsofalcoholconsumption.indirectcostsrepresentlosses ofpotentialproductivity,i.e.thevalueofservicesnotperformedbyindividualsbecauseoftheadverse consequencesoftheirdrinking.inseveralstudiesofsocialcosts,itwasfoundthatthedirectcoststo sectors(otherthanthehealthcaresector)werehigherthanthehealthcarecosts(seetheoverviewin reference2).inaddition,moststudiesfoundthattheindirectcosts,i.e.productivitylosses,outweighed thedirectcostsbyfar. ThefirstcomprehensiveestimatesofsocialcostsfortheEUin2003weremadebyAnderson andbaumbergin Basedonthisseminalwork,thesocialcostsfor2010canbebrokendownand summarizedinfigure16.theseestimatesassumethattheproportionofgdpattributabletoalcohol consumption 1.3% hasbeenconstantsinceandersonandbaumberg sassessmentfor2003.(average 1.3%ofGDP;lowerlimit0.9%;upperlimit2.4%.)Usingthatfigureasaguide,thesocialcostsofalcohol consumptionfortheyear2010wouldamountto 155.8billion(lowerlimit 107.9billion,upperlimit 287.7billion). Figure16:SocialcostsofalcoholintheEU,2010 Thefigurebelowindicatesthe2010socialcostsofalcoholintheEU(in billion). 72
75 Toputthisestimateinperspective,Rehmetal. 2 foundhigherproportionsofgdp,2.5%,in selectedhighincomecountries.butthisweightedaveragewashugelyimpactedbyusfigures,where Mohapatraandcolleagues 128 foundaslightlyhigherproportionthanandersonandbaumberg sreview ofallhighincomeeucountries:1.6%ofgdp.itshouldbenotedthattheeudoesnotonlyconsistof highincomecountries.however,theonlysocialcoststudytodatefromanuppermiddleincomeeu country(estonia,whichatthattimewaslessprosperous)alsofoundasocialcostproportionof1.6%of GDP. 133 Wemayask:whatproportionofthesealcoholattributablesocialcostsisduetoAD?Mohapatra etal. 128 estimatedthesocialcostsofalcoholdependenceviaheavydrinking.theyconcludedthat0.96% ofgdp,or62%ofallsocialcostsattributabletoalcohol,wereduetoad whichworksouttoafigureof 94.6billion.Ifweappliedtheestimateof0.96%ofGDPtotheEuropeanGDPfor2010,theresultwould be 115.1billion.ThemostrecentEuropeancoststudy,in2011, 134 estimatedthecostsforselected addictions(includingalcoholandopioids)at 65.7billion.Thisismuchlowerthantheaboveestimates, andnotreallycomparable,sinceitalsoincludedthecostsforopioiddependence. Aswecansee,itishardtoestimatethetruecostsofADfortheEUfromthesedata.Still,a cautiousestimatemightbesomewherebetween 50billionand 120billion.Thisisadmittedlyawide interval,andunderscorestheneedtoconductanewstudyonthesocialcostsofad:furtherresearchis neededtocalculatethisfiguremorepreciselyfortheeu.however,italsorevealsthatthecostsofadin Europeareenormous,evenusingthelowestavailableestimates. 73
76 TheMedicalTreatmentSystemforAlcoholDependence Lessthan10%ofpeoplewithADintheEUreceivetreatmentfor theiralcoholdependence,meaningthattheoverwhelming majorityofpeoplewithad(9outof10)receivenointervention. TreatmentsystemsdifferacrossEurope;butinalmostall countries,psychotherapeuticinterventionisthebackboneof rehabilitationtreatmentaimedatpreventingrelapsesofheavy drinking. ProportionofpeoplewithADintreatment Aswehaveseen,ADisanimportantcontributortotheburdenofdisease(seereferences2and 64).Giventhissituation,evidencebasedmeanstoreducetheADrelatedburdenarevital.One importantmeasureisalcoholdependencetreatment(adt).howeverad,likemostothermental disorders,isseverelyundertreated;thatis,mostpeoplewithaddonotseekorreceivetreatment.(see reference102;formentalhealthingeneral,seereference135).intheeuropeanstudyofthe EpidemiologyofMentalDisorders(ESEMeD),withgeneralpopulationsurveysinBelgium,France, Germany,Italy,theNetherlandsandSpain,only8.3%(95%CI:3.8% 12.8%)ofpeoplewhowere diagnosedwithaudinthepast12monthsreceivedanyformaltreatmentfortheirconditionduringthat period.thisproportionissmallerthanforanyothermentaldisorders(seereference102forthe prevalenceofconsultingaformalmentalhealthservicewithanymentaldisorder:25.7%(95%ci: )). Mostserviceswereprovidedeitherbymentalhealthprofessionals,suchaspsychotherapistsor addictioncounsellors;orbyacombinationofgeneralpractitioners(gps)andmentalhealth specialists. 102 Themajorityoftreatments(twothirds)involvedpsychotherapeuticinterventions,either aloneorincombinationwithdrugtreatment.pharmacologicaltreatmentwasusedinabout50%ofthe 74
77 treatments,with60%ofallpharmacologicaltreatmentoccurringincombinationwithpsychological interventions. 102 AnotherwaytoestimatetreatmentcoverageinEuropeisbycomparingtheestimatesfor peoplewithadwiththestatisticsofpeopleintreatment.unfortunately,thewhoprovidesfiguresonly forinpatienttreatment,andeventhesearenotavailableforseveraleucountries(seewebappendix 16).AnddataonoutpatientandGPtreatmentareevenscarcer.Asaresult,wehadtousetwo statisticaltechniquesforestimatingthemissingvalues.theseledtocomparableresults.iftheestimate fortreatmentcoveragewasbasedontheavailableproportionofpeoplewithadtreatedingermany, Hungary,ItalyandSweden(seeWebAppendix16),wecalculatedabouta8.7%treatmentcoverage rate;whereasbasingourestimateontheproportionofinpatienttooutpatienttreatment,thefigureis 10.2%.Thus,ourindirectestimates(basedontreatmentstatistics)corroboratetheresultfromthe ESEMeDstudy:fewerthan1in10peoplewithADreceiveADT. TreatmentintheEU:reductionofdrinkingasagoal Therehavebeenfew,ifany,systematiccomparativestudiesontheactualpracticeofAD treatmentineurope. ix Onesystematicreviewoftheliterature,andakeyinformantsurveyontreatment practices,wasconductedin2011byrehmandcolleagues.theyreliedonnationalandotherguidelines fortreatment,supplementedbythesurvey.whilemanyoftheresultsarequalitativeinnature,andthus allowonlycautiousconclusionstobedrawn,theresultsaresummarizedintable10,below. Thesurveyfoundthatonlyabout33%ofEUcountrieshavenationalguidelinesgoverningADT, andaboutasimilarnumberhaveprofessionalguidelines(althoughthereissomeoverlap,withgermany andtheukhavingbothformsofguidelines).generally,intheeupsychotherapiesareusedtotreatad, mostoftencognitivebehaviouraltherapy(cbt)andmotivationalinterviewing(mi;seetable10).when wespeakabouttreatmenthere,thisreferstotherehabilitationphase usuallyafteradetoxification phase(dependingonthetreatmentgoal).somecountriesalsoemploytheminnesotamodel,oranother 12stepapproach.Thelatterarebasedontheconceptof alcoholism asachronic,incurable,but stoppabledisease;whereascbtandotherconceptsdonotimplyanyexplanationsof chronicity to justifythetherapeuticprocess. ixthissectionisbasedinpartonrehm,rehm,ahlo,allamani,aubin,bühringer,daeppen,frick,gual,&heather (2011).AlcoholdependencetreatmentintheEU:asystematicreviewoftreatmentgoalsandmodalitiesinallEU countriesplusiceland,norwayandswitzerland.camh:centreforaddictionandmentalhealth. 75
78 RegionalpatternsintheEUaredifficulttodistinguish.ThemajorWesterncountriesalluseCBT andsomeformofmotivationaltreatment,whiletheeasterncountriesgenerallyseemtoprefer12step programsandselfhelpgroups.everyeucountryusesatleastoneadmedication,andoftenmore:the mostcommonlyprescribedareacamprosate,disulfiramandnaltrexone.however,pharmacotherapy seemstobeusedinonlyaminorityofalladt.itshouldbenotedthatreduceddrinkingasatreatment outcomeisaccepted(inpractice)inalleucountries,asidefromthesmallernationsofcyprusandmalta. 76
79 Table10:CharacteristicsofADTsystems ThetablebelowgivesanoverviewofthecharacteristicsofalcoholdependencetreatmentsystemsindifferentEuropeancountries. National guideline Other professional guidelines Abstinence as main goal Reduced drinking acceptable (in practice) Main psychotherapy used (abbreviations below) Main pharmacotherapy used in rehabilitation phase Austria No Yes Yes Yes wide variety used Acamprosate, Naltrexone, Disulfiram Belgium No No Yes Yes counselling; family-oriented interventions Acamprosate, Disulfiram Bulgaria No No Yes Yes multidisciplinary (12-step oriented), CBT Naltrexone, Disulfiram (not officially registered) Cyprus Yes No Yes No Czech Republic No Yes Yes Yes CBT, MET, relapse prevention, family-oriented BI, CBT, MET, family therapy / intervention? Mainly benzodiazepines for withdrawal; Acamprosate for rehabilitation treatment Acamprosate, Naltrexone, Disulfiram Denmark No Yes No Yes MET, CBT Acamprosate, Naltrexone, Disulfiram Estonia No* No Yes Yes CBT, group therapy, family therapy Disulfiram Finland No Yes No Yes CBT, MET, Minnesota model, AA Naltrexone, Disulfiram, Nalmefene (Acamprosate only under special licence) France Yes No Yes Yes CBT, group therapy, self-help Acamprosate, Naltrexone, Disulfiram Germany Yes Yes Yes Yes CBT, family, ergo & socio therapy Acamprosate, Disulfiram Greece No No Yes Yes CBT Naltrexone, Disulfiram (rarely) Hungary Yes No Yes Yes CBT, MET, family, problem & group therapy Acamprosate, Naltrexone, Disulfiram Ireland No No Yes Yes Minnesota model, MI, CBT (AA aftercare) Acamprosate, Disulfiram Italy No No Yes Yes family, group & individual counselling Disulfiram, chlordiazeposside Latvia No Yes Yes Yes wide variety used Disulfiram (Acamprosate and Naltrexone only rarely) Lithuania No No Yes Yes Minnesota model, group therapy Naltrexone, Disulfiram 77
80 Luxembourg No No Yes Yes MI, CBT, family & group therapy Disulfiram, Acamprosate Malta No No Yes No Minnesota model Disulfiram Netherlands Yes No No Yes MET, CBT, CRA Disulfiram, Naltrexone, Acamprosate Poland Yes No Yes Yes CBT, self-help (AA) Disulfiram, Acamprosate Portugal No No Yes Yes CBT, 12-step treatment Acamprosate, Disulfiram Romania No No Yes Yes Minnesota model, AA Rarely Naltrexone Slovakia No No Yes Yes CBT Acamprosate Slovenia Yes No Yes Yes psychodynamic therapy, CBT, MET Naltrexone Spain No Yes Yes Yes CBT, group therapy Disulfiram, Naltrexone, Topiramate, Acamprosate Sweden Yes No Possible Yes CBT, 12-step, MI, CRA, BI Naltrexone, Topiramate, Acamprosate United Kingdom Yes Yes Possible Yes CBT, MET, 12-step, psychosocial Disulfiram, Acamprosate EU 33.3% Yes/ 66.7 No 29.6% Yes/ 70.4% No 88.9% Yes/ 11.1% No 92.6% Yes/ 7.4% No mainly CBT, MET, BI, group/family, sometimes Minnesota Model, AA Disulfiram, Acamprosate, Naltrexone Iceland Yes No Yes No Minnesota model, BI, MI, CBT, family antipsychotic medication Norway No No? Yes CBT Disulfiram, Acamprosate Switzerland No No Yes Yes CBT, psychodynamic therapies Acamprosate, Disulfiram, Naltrexone List of Abbreviations AA: Alcoholics Anonymous BI: brief interventions CBT: cognitive behavioural therapy CRA: community reinforcement approach MET: motivational enhancement therapy MI: motivational interviewing *Estonia has guidelines governing drug abuse that do not specifically mention ADT. 78
81 InterventionScenarios Therearetreatmentinterventionsavailable,intheformof psychotherapiesandpharmacotherapies,thatcouldreducethe burdenofalcoholattributablemortality.themostefficacious currentoptionswouldreducethedeathratebysome13%inmen (morethan10,000deathsavoided),andbysome9%inwomen (morethan1,700deathsavoided).thisimprovementcouldbe accomplishedwithin12months.thisestimateassumesa treatmentcoverageof40%ofallpeoplewithad,andalso assumesthattheaveragetreatmenteffect(derivedfrompast randomizedtrials)holdstrue. GiventheextentoftheburdenfromalcoholuseandADinEurope,apublichealthperspective certainlyindicatestheurgencyofinitiatingandimplementinginterventionstoreducethisburden.aswe willdiscuss,traditionalalcoholpolicyismainlyconcernedwithpreventivemeasuressuchastaxation, bansonmarketingandadvertising,anddrinkinganddrivingcountermeasures.however,asthemajority oftheburdenisduetoad,andasfewerthan10%ofthepeopleaffectedbythisdiseasearecurrently treated(seereference102),improvingaccesstotreatmentseemsimportant. However,suchastrategywouldonlyworkifthetreatmentoptionsavailableareeffectivein termsofimprovingsurvival,andreducingtheburdenofdisease.thisrequiresdemonstratingthe followingtwokeypoints: 1) Provingthatreductionsindrinkingrates including,thoughnotlimitedto,achieving abstinence haveademonstrableeffectonsurvivalandburdenofdisease. 2) ProvingthattreatmentinterventionsforADaresuccessfulinreducingdrinkingrates,or leadingtoabstinence. 79
82 Ifthiscanbedoneeffectively,treatmentinterventionswillleadtoimprovedsurvivalrates,and toareducedburdenofdisease.however,beforestatisticallymodellingsucheffects,wemustfirst reviewtheliteratureonthesetwokeypoints. Dointerventionsaffectsurvival? TheeffectivenessofADtreatmentinterventionsareusuallydefinedbyhowmuchtheyaffect alcoholconsumption i.e.whethertheyleadallthewaytoabstinence(thetraditionalaimofad therapy,asindicatedabove),oratleasttoareductioninconsumption Inthefollowingsection,we willexaminewhetherthesetwoapproacheshaveanyimpactonmortality. Atthepopulationlevel,alargevolumeofliteraturesuggeststhatchangesindrinkinglevelare associatedwithchangesinmortalityduetoalcoholrelateddiseases,aswellasallcausemortality(for Europe,seereferences70and138;forgeneraldata,see139).Thisliteratureisbasedontimeseries analyses;andasisthecasewithallecologicaldata,associationscanbemeasuredbutcausalitymaynot necessarilybeestablished. However,therearealsoanumberof naturalexperiments thatdemonstratehowmarked reductionsinavailabilityofalcoholcanleadtoreductionsinbothdrinkingandmortality.themost prominentexampleisthegorbachevreformofthe1980s,duringwhichlegalalcoholproductionwas drasticallyreducedinthesovietunion.oneresultwasthattheoverallannualconsumptionofpure alcoholfellfrom14.2lpercapitain1984,to10.7lin1987 adecreaseofsome25%.asa consequence,inthattimeperiod,allcausemortalityratesinrussiainthe40 44agerangedecreased by39%formen,andby29%forwomen.butwhenthealcoholbanwasrescinded,consumption increasedagaintoslightlymorethanitsformerlevel:14.5lpercapita.andbetween1987and1994, whenalcoholconsumptionincreasedagain,allcausemortalityratesmorethandoubledformen,and almostdoubledforwomenintheagegroup Otherexamplesofnaturalexperimentswhereareductionofalcoholavailabilityresultedina reductionofmortalityare: ThetwelvefoldriseoftaxesondistilledspiritsduringtheFirstWorldWarinDenmark,whichled toasubsequentreductionofoverallconsumptionandrelatedmortality TheimpactofProhibitionintheUS(1919)onlivercirrhosisdeaths:thebillreducedalcohol consumptionto30%ofitsformerlevelintheyearsafteritsenactment
83 TheeffectofGermanseizureofwineinFranceduringWorldWarII,againreducingboth consumptionandmortalityfromlivercirrhosis. 50 Unfortunately,such natural experimentsthataffectlargecohortsarescarce;andsmaller scaleexperimentsarenotfeasible,sinceforobviousethicalreasonswecannotconductexperimentson individuals longtermalcoholconsumption.however,therehavebeensomeshorttermexperimental studiesthatdealwiththeeffectsofmanipulatingalcoholintakeonbloodpressure animportantrisk factorforhypertensivedisease,strokeandothercardiovascularoutcomes.thesestudiesclearlyshow thatareductionofalcoholintakewillreducebloodpressure. 143 Aswell,someliteratureexistsonthe effectsofalcoholcessationonbothlivercirrhosisandcancer;again,thissupportsthehypothesisthat stoppingdrinkingleadstoareductionofrisksforthosediseases Theeffectdoesincludeatimelag, withacomplicatedstructurethatdependsonthedisease.forlivercirrhosismortality,thereisbothan immediateeffectaswellasalaggedeffect:mostimprovementoccursduringthefirstyear.forcancer therearenoimmediateeffects,onlydelayedones(seereferences ,and49).Butdespitethis timelageffectforcancer,moststudieshavecalculatedtheeffectasifitwereimmediate(seereference 6,aswellasthediscussionin59).Thecalculationsforburdenofdisease,notedabove,alsofollowedthis tradition.however,inthischapterwewillleavecanceroutofourcalculations,asweaimtomodelthe effectsoftreatmentonareductionofmortalitywithin12monthsaftertheintervention. Literatureontheeffectsofconsumptionreductionorcessationisscarce.Fillmoreand colleagues 146 analyzedanationallyrepresentativesamplefromtheus,andfoundthatingeneral, reductionofheavydrinkinginmenwasassociatedwithanincreaseinsurvival.theseeffectsareinline withthoseobservedincrosssectionalstudies,wherehigherlevelsofconsumptionwereconsistently associatedwithhighermortalityrisks. 40 Asaresult,briefinterventionsadministeredtoheavydrinkers admittedtogeneralhospitalsinacochraneanalysisnotonlyresultedinasignificantreductionof alcoholconsumption,butalsoinasubstantialreductionofmortalityriskuptoayearlater.(riskratio: 0.6,95%CI:0.40.9;seereference147;basedon7randomizedclinicaltrials). Asindicatedabove,thecrucialelementinreducingthemortalityburdenofADisalcoholintake aftertreatment.thisfactisoutlinedinthefivestudiescitedbelow. InaGermanstudyconductedbyFeuerleinandcolleaguesin1994,patientswhoabstainedforat leastsixmonthshadonlyathirdofthemortalityriskofthepeoplewhorelapsed
84 InSwedenin1997,Gerdnerandcolleaguesfoundthatsurvivalafter8.5yearsinasmallsample ofadpatientsdependedontheshorttermoutcome.noneofthepeoplewhoachieved abstinencedied;andforwomen(butnotformen)thereductionofdrinkinghadasignificant positiveeffectonsurvivalrate(smr5.0vs.13.3). 112 AUSstudyfrom2000foundthatpatientswhodiedprematurelyina10 14yearfollowuphad consumedmorealcoholintheyearaftertreatmentthanthesurvivors. 149 Inanother1994studyofindividualsseekinghelpforanAUDintheUS,readmissionto treatmentwithinayearwasfoundtobeasignificantpredictorformortality. 150 Whenthis characteristicwascontrolledfor,betterdrinkingoutcomesattheoneyearmarkwere associatedwithalowerlikelihoodofsubsequentdeathinthe16yearfollowup. 151 InaUSstudyfrom1991,individualswhorelapsedinthesecondyearhadslightlyelevated mortalityrisksinthetenthyear,butthisdifferencewasnotsignificant. 152 Thisstudyisalso notableforrevealingthatbehindthecategoricalstatementsofrelapseandremission,thereare cleardifferencesdependingonthequantityofalcoholconsumed.reformedalcoholicswho drank,consumed1ounceofpurealcoholdaily;whereasrelapsedalcoholicsconsumed3.5 ounces(communitycontrols:0.7ounces). Takentogether,thesestudiesclearlyshowedthattheoutcomesoftreatmentareimportantfor survival.peoplehadahigherchanceofsurvivaliftheyachievedabstinenceaftertreatment,orifthey couldreducetheirvolumeofconsumption. EffectivenessofADTonreducingconsumption Forthegoalofsettingupinterventionmodels,thenextstepistoshowthatADTdoesinfact reducedrinking,sometimestotheextentofabstinence.themostcomprehensiveoverviewonthe effectsofalcoholismtreatmentisinhesterandmiller sseminal2003reportonapproachesandtheir effectiveness. 153 Otherreviews(seereferences103and154),plusanalysesonindividualformsof treatment(suchasthecochranereviewsdescribedbelow)alsosupporttheconclusionthateffective formsoftreatmentcanreducedrinkinglevelsandleadtoabstinence. Ournextstepwastoselectthetreatmentinterventionsforoursimulationstudy.Wetookthe mosteffectiveapproaches(accordingtotheleaguetableinthemainsystematicreview 153 ),and 82
85 estimatedeffectsizesbasedoncochranemetaanalyses.(inthecaseofcbt,wherenocochranereview wasavailable,weusedthemostrecentmetaanalysis.)thefollowingadtherapieswereselected: CognitiveBehaviouralTherapy(CBT).Aformofpsychologicaltreatmentwithacomprehensive theoryofpsychopathologyandpersonality,andspecificmodelsforvariousdisorders.the therapyrequiresanempatheticclinician,whoactivelycollaborateswithpatientsinstructured sessionstodefinetheirtreatmentgoals.thegoalistoreducesymptoms,andforpatientsto learnthecognitiveandbehaviouralskillstocopewiththeirdisorder. MotivationalInterviewing(MI).Adirective,clientcentredcounsellingstyle,withthegoalof elicitingbehaviouralchangesinclientsbyhelpingthemtoexploreandresolvetheirambivalent thinkingpatterns. BriefInterventions(BIs).Short,oneononecounsellingsessionsthatareideallysuitedfor peoplewhodrinkinaharmfulorabusiveway.thesetypicallyconsistofonetofourshort counsellingsessionswithatrainedinterventionist(e.g.,physician,psychologist,socialworker). Theygenerallyaimtomoderateaperson salcoholconsumptiontosensiblelevels,andto eliminateharmfulpracticessuchasbingedrinking. Pharmacology.Thisapproachisusuallycombinedwithcounselling.Wemodelledthe effectivenessofthistreatmentbasedonthemostrecentcochranereviewsofacamprosateand opioidantagonisttreatment Table11,onthenextpage,givesanoverviewofthetypesandsizesoftreatmenteffects.(In ordertoassesstheeffectoftherapeuticinterventionsatthepopulationlevel,weselectedinformation ontheiroverallsuccess.wecomparedtheresultsbeforeandaftertherapy,orbetweentreated populationsandnontreatedcontrolgroups.) 83
86 Table11:Assumptionsformodellinginterventions Thetablebelowgivesanoverviewoftheassumptionsbehindourmodellingoftreatmentinterventions. Interventions Main results on exposure (effects assumed to be stable for 1 year) Risk relations Source MI and CBT 1 MI and CBT 2 BI 1 BI 2 For MI, an average drop of 15.8 g of pure alcohol per day was assumed (measured against no intervention; 95% CI from -9.6 g to g of pure alcohol). The effect after one year was very small and not significant (average: 1.2 g pure alcohol reduction per day), the average effect over the year was a 3.2 g reduction of pure alcohol per day (95% CI: -1.2 g to -5.2g pure alcohol per day). For CBT, almost the same effect was found in studies with a no-treatment control as the comparison condition (15.9 g of pure alcohol per day). In addition, Project Match did not find any significant differences 160 between MI and CBT. We modelled the results based on a drop 15.8 g/day over the year. An average drop of 21.8 g of pure alcohol per day was assumed as the upper limit of the CI for MI/CBT (see above). We assumed proportional CIs compared to the first MI/CBT scenario. An average drop of 13.5 g of pure alcohol per day with a 95% CI from -2.7 to of pure alcohol. An average reduction of the RR for mortality by 0.6 (95% CI: 0.40 to 0.91). This scenario represents the best case for BI, as hospitalization is linked to mortality, and AD plays an important role in mediating and moderating this premature mortality (e.g. references ). However, similar effects were obtained in a metaanalysis of all BIs. 167 The usual dose-dependent risk relations between average consumption of alcohol and disease outcomes were used, multiplied by 2 to account for the overall higher mortality risk of people with AD. 110 For injury, the same RR was used for AD; and for non-dependent people, the RR from reference 161 was used. MI: reference 162 CBT: reference 163 reference 162 references 147 and164 reference 147 Pharmacological therapy (for simulation, the effects of RCTs on acamprosate and opioid antagonist treatment were combined Overall, for 55.0% of the patient population a reduction in drinking by 13% on average; for 18.1% of the patient population a reduction in drinking by 50%; and for 26.8% of the population abstinence. Pooled estimates of references 158 and 159. For this simulation we are concerned about the differences in consumption between baseline and follow-up in the group receiving medications only. 84
87 Itshouldbenotedthattheunderlyingrandomizedcontrolledtrialsforpsychotherapiesdidnot requireadiagnosisofadasaninclusioncriterioninallcases.thisisespeciallytrueforbis,whichare designedforproblemdrinkersandheavyalcoholusers mostofwhommaynotqualifyforad.asa result,theeffectsofpsychotherapeuticinterventionmaybeoverestimated.furthermore,thereissome questionaboutwhethertheresultsofrandomizedclinicaltrialscanbegeneralizedtoapotential treatmentrateof40%ofallpeoplewithad,eventhoughweselectedonlyfromthemoreseverecases. Thisquestiontouchesontheoverallissueofefficacyversuseffectiveness. 168 Thesamplesinthe randomizedtrialsaredifferentfromcommunitysampleswithad; 169 butitishardtopredictwhatthis meansintermsofoutcome.atthispoint,wecanonlyindicatethispotentialbiasinourestimations. Thestatisticalmodelforestimatinginterventioneffects Aspresentedabove,theinterventionscanbeinterpretedasdownwardshiftsinthedaily alcoholintake,orasdecreasesoftherrassociatedwithalcoholconsumption.themodellingofthe interventioneffectswasachievedbyapplyingtheseeffectstosimulatedpopulationsforeachcountry. Theanalysisofeachinterventionwascarriedoutassumingthatdifferentproportionsofallpeoplewith AD 10%,20%,30%and40% wouldundergotreatment.thedetailsofthestatisticalmethodusedcan befoundinwebappendix17. Thedistributionofabstainersanddrinkers Figure17showstheresultingsimulationoftheEUpopulationdistribution,formenonly,with respecttoalcoholconsumptionbeforeandaftertheinterventions.(dataforwomenareincludedin Figure18,below.)Onlyoneinterventionscenario,themosteffective,wasselectedtodemonstratethe methodology;itseffectscanbebettertracedinthegraphsonthenextpage. 85

88 Figure17:AlcoholconsumptioninmenwithAD,beforeandafterintervention Thefigurebelowindicatesthepopulationdistributionforaveragedailyconsumptionofalcohol,before andafterintervention,for40%ofmenwithad. Figure18,below,showsthesamedistributionforwomen.Basedonthefactthatthereare proportionallymoremenwithadthanwomenatthepopulationlevel,theconsequencesofthe interventionintermsofshiftingtoadifferentdrinkingcategoryaremuchmorepronouncedinmen. 86
89 Figure18:AlcoholconsumptioninwomenwithAD,beforeandafterintervention Thefigurebelowindicatesthepopulationdistributionforaveragedailyconsumptionofalcohol,before andafterintervention,for40%ofwomenwithad. 87
90 Deathsavoidedduetointerventions Figures19aand19bprovideanoverviewofdeathsavoidedoverthecourseofayearintheEU,intheagegroup1564, duetotreatmentforad. Figure19a:Deathsavoidedinmen Figure19b:Deathsavoidedinwomen 88
91 Assumingthat40%ofpeoplewithADaretreated,andassumingthattheaverageeffectiveness oftreatmentisasspecifiedinrecentcochranereviews,wecanestimatethatabout10,000deathsof mencouldbeavoidedwithpharmacologicaltreatment,andmorethan1,700deathsofwomen(alldata arefortheagegroup1564intheeu).thisdifferencebetweensexesisduetotheassumptionthat5.4% ofmenfulfilledtheminimumcriteriaforad,butonly1.5%ofwomen.inaddition,theallcause mortalityrateofwomenismarkedlylowerthanthatofmen.asindicatedabove,nodifferentialeffects areassumedwithrespecttotreatmenteffectiveness.briefinterventionsforheavydrinkerswhoarealso acutecarehospitalpatientsyieldalmostthesamenumberofdeathsavoided(figures19aand19b, interventionbihospital2),whereastheothertwotreatmentsareassociatedwithaconsiderablysmaller numbersofdeathsavoided.whilethenumberofwomen sdeathsavoidedbyanygiventreatmentis onlyupto30%ofthemen sdeathsavoided,theproportionaldifferencesaremuchsmaller.these numbersareoutlinedinfigures20aand20b,below,whichshowtheproportionofalcoholattributable deathsavoidedinmenandwomen,overthecourseofayear,bytreatmentforad. Figure20a:Deathsavoidedinmen 89
92 Figure20b:Deathsavoidedinwomen TheresultingchangesinoverallmortalityfortheEUaresummarizedinFigures21aand21b, below.inthemostsuccessfulscenario,1.48%ofalldeathscouldbesavedinoneyearineuropeif40% ofallpeoplewithadweretreatedwithpharmacotherapy.itisclearthatproportionallythemost alcoholattributabledeathscanbesavedbytreatmentinthenordiccountries.(countrydataare displayedintherespectivecountryreports,andregionaldatainwebappendix18.) Onthenextpage,Figures21aand21bshowtheproportionofalcoholattributabledeathstoall deaths,avoidedoveroneyearbytreatmentforad. 90
93 Figure21a:Deathsavoidedinmen(asaproportionofalldeaths) Figure21b:Deathsavoidedinwomen(asaproportionofalldeaths) 91
94 ConclusionsforAlcoholPolicy Treatmentforalcoholdependenceshouldbemadeavailableat muchlowerthresholdsthanatpresent;anditshouldbean additionalpolicyoption,supplementingothercurrentalcohol policymeasures(suchastaxation,bansonadvertising,anddrunk drivingmeasures). Alcoholpolicyhasbecomethefocusofattentiongloballyinrecentyears,especiallysincethe adoptionofthewhoglobalstrategytoreducetheharmfuluseofalcohol. 170 Thisstrategyfocuseson tenkeyareasofpolicyoptionsandinterventionsatthenationallevel: leadership,awarenessandcommitment responsesbyhealthservices communityaction drunkdrivingpoliciesandcountermeasures limitingtheavailabilityofalcohol limitingthemarketingofalcoholicbeverages pricingpolicies reducingthenegativeconsequencesofdrinkingandintoxication reducingthepublichealthimpactofillicitalcohol monitoringandsurveillance. Mostofthesepoliciesfocusonpreventingharmfulalcoholconsumption,andarebasedonthe growingliteratureoncosteffectivemeasurestopreventalcoholattributableharms. 11;13; Their underlyingassumptionisthatreductionsinasociety soverallrateofdrinkingwillleadtoreductionsin heavydrinkingandalcoholrelatedharm.theevidenceforthisassumptionisstrong.oneexample concernspricingpolicies,specificallytheimpactoftaxationonpricing.wagenaarandcolleagues 92
95 conductedtwometaanalyses,andfoundthatthepriceofalcoholisinverselyrelatednotonlyto consumption, 173 butalsotomorbidityandmortality. 174 Theirfindingssuggestthatdoublingtaxationon alcoholwouldreducerelatedmortalitybyanaverageof35%,trafficdeathsby11%,sexuallytransmitted diseasesby6%,violenceby2%,andcrimeby1.4%.however,themainproblemwithsuchpoliciesis thattheyarequiteunpopularintoday spoliticalenvironment.europeangovernmentsfearthat taxpayerswillperceivethemaspenalizingthemajorityofdrinkers(thosewithlowtomoderate consumptionrates) sonotmanygovernmentswillconsiderdoublingtaxes. However,theWHO ssecondtargetarea responsebyhealthservices includesoffering preventionandtreatmentinterventionstoindividualsandfamiliesaffectedbyaudandassociated conditions(seereference170).thephilosophyoftheglobalstrategyistobuilduponandexpandthe variousiterationsoftheeuropeanalcoholactionplan.theseplanshavebeenimplementedtoreach Europe stargetgoals,inallitsmemberstates,ofsignificantlyreducingtheadversehealtheffectsof consumingaddictivesubstancessuchastobacco,alcoholandpsychoactivedrugs.(thisisthecurrent iterationofthegoalsadoptedbythewhoregionalcommitteeforeuropeatits48thsession,in Copenhagen,Denmark,inSeptember1998.)ThefirstEuropeanAlcoholActionPlandatesbackto1993, x andthecurrenteuropeanalcoholactionplan hasjustbeenaccepted. xi Attheinfluential conferenceinparisin1995,theoverallgoalforalcoholpolicyofthewhoregionalofficewas Lessis better ;andtheinterventionssuggestedtoreducealcoholattributableharmweresubsumedunderthis goal(seereferences175and176).aswithitsglobalstrategy,thewhofocusesonalcoholpoliciesfor prevention,astheyareconsideredtobethemostcosteffective. 175 TheEU sstrategytoreducealcoholrelatedharms xii haddifferentfoci: protectingyoungpeopleandchildren preventingdrunkdriving reducingalcoholrelatedharmamongadults raisingawareness collectingreliabledata xseeonline: xiseeonline: data/assets/pdf_file/0006/147732/wd13e_alcohol_ pdf xiiseeonline: 93
96 Theeffectivenessofthestrategytoreachitsoutcomesiscurrentlybeingevaluated.Treatmentand systemsdonotfigureinthisstrategy,presumablybecausetheresponsibilitiesforthemareatthe nationallevel. Inconclusion,wemayassumethattreatmentofADdoesnotplayaprominentroleinthe currentstrategiesofeitherthewhoortheeu.thepublichealthbenefitsofimprovingtreatmentrates, andprovidingappropriateservices,seemtobeoverlooked.however,giventhesizeofthehealthand socialburdensthatarelinkedtoad,wesuggestthatitshouldbemadeaprioritytosupplementthe currentcapacityfortreatingthisdisorder. Asindicatedabove,thereissufficientevidenceoftheeffectivenessofADT. 171;172;175 Inaddition, thereisanethicalobligationforeuropeancountriestohelpthosewhoarecurrentlysuffering.the simulationsofinterventionsoutlinedabovedemonstratethatadtnotonlyhelpstheindividuals affected,butalsosubstantiallyimprovespublichealthingeneral.soeventhoughadtmaybelesscost effectivethanotherstrategiesintermsofavoidingthefutureburdenofalcoholattributabledisease,it isanecessarycomplementtootherpolicies.puttogether,allthesestrategiescouldhelptomarkedly decreaseeurope salcoholrelatedburden. 94
alcohol consumptionpercapita,since2000.")
97 WebAppendix1:AdultAlcoholConsumption ThefollowinggraphicsrepresentEurope sregionaltrendsinrecordedadult(15+)alcohol consumptionpercapita,since
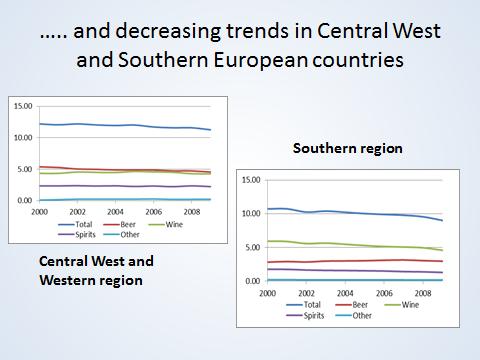
98 96
99 WebAppendix2:EstimatingtheAlcoholAttributableBurden Thissectionexaminesthemethodsusedtoestimatethealcoholattributableburdenofdisease,for diseasesnotwhollyattributabletoalcohol. Modellingaverageconsumption Averagealcoholconsumptionamonggeneralpopulationscanbemodelledusingagamma distribution, 8;177 asfollows: where k x k e x k x f x k k k x dx isthegammafunction. for x and k Thescaleparameterandashapeparameterarelinkedtothemeanandstandarddeviation ofthefunctionby: Hence, and and Moreover,ithasbeenshownthatthereisalinearrelationshipbetweenthemeanandthe standarddeviationofthisgammadistributioninbothmaleandfemalepopulations. 8 Byknowingtheper capitaconsumption,itispossibletomodeltheprevalenceoftheentiredrinkingpopulation.the proportionsofanysubcategoryofthedrinkingpopulation(e.g.60+g/day)canthenbeestimatedby integratingthegammadistributionforalcoholconsumptionwithinsetboundaries.forexample,the integralofthegammadistributionforaveragealcoholconsumptionfrom60gtoinfinitywillbean estimateoftheprevalenceofcurrentdrinkerswhoconsume(onaverage)60+gperday.previous analyseshaveshownthatcappingthedistributiondoesnotresultinsubstantiallydifferentprevalence estimates;however,itdoeschangethegammadistribution. 8 Summarydataonexposurevariablesare displayedintable2,inthemaintext. 97
100 DerivingalcoholattributablefractionsfromexposureandRRs Inalcoholepidemiology,thenumberofdeathscausedbyconsumptioniscalculatedusingan AlcoholAttributableFraction(AAF).Thisisdefinedasthefractionofmortalitythatwouldnotbepresent ifexposuretoalcoholwas0 asin,ifeverypersonwasalifetimeabstainer. 45;178 Themethodologyforcalculatingseveralalcoholattributablefactors numberofdeaths, potentialyearsoflifelost(pyll),yearsoflifelostduetodisability(yld),anddisabilityadjustedyearsof lifelost(dalys) hastwomainsteps.first,thecountry,age,andsexspecificaafsarecalculated. ThentheseAAFsareappliedtothecorrespondingmortality,PYLL,YLDandDALYsdata. Step1:CalculationofAAFsbycountry,age,andsex Definingagecategories Threeagecategorieswereusedbasedonthe2005GlobalBurdenofDisease(GBD)study:15 34,35 64,and65orolder.Ageswereclusteredtobecomparabletothe2005GBDstudy. 27 Countriesincludedintheanalysis Weuseddatafromall27memberstatesoftheEU.Populationestimatesbycountryfor2004 and2009werebasedondataobtainedfromthe2008revisionsoftheunitednationspopulation Division. 179 Sourcesformodellingriskrelations SourcesforRRfunctionsbyGBDcodeareoutlinedinWebAppendix3.Alcoholattributable harmswerecalculatedbasedonmetaanalysesreportingacontinuousrrfunctionbydoseofexposure. AnoutlineofthecausalrelationshipbetweenalcoholandtheseGBDcodecategoriesisdescribedin detailelsewhere. 40 AAFsforchronicandinfectiousdiseases(exceptischemicheartdisease) AAFcalculationswerebasedonthedistributionofalcoholconsumption;ontheprevalenceof currentdrinkers,formerdrinkersandlifetimeabstainers;andontherr.thecalculationwasasfollows: AAF P abs P former RR former P abs P former RR former P current xrr current xdx P current xrr current xdx wherep abs representslifetimeabstainers,p former istheprevalenceofformerdrinkers,rr former istherr forformerdrinkers,p current istheprevalenceofcurrentdrinkerswhoconsumeanaverageamount(x)of alcohol,andrr current istherrgivenanaveragedailyconsumptionofx. 98
101 AAFsforischemicheartdisease Theriskforischemicheartdiseaseisaffectedbyboththeaveragevolumeofalcohol consumption,andbypatternsofdrinking Forourmodelling,webasedaveragevolumeof consumptiononthewellknownjshapedcurve(seereference46,also180,or181forsimilarresults), forallindividualswhodidnothaveirregularheavydrinkingoccasions(seetable3,above).forpeople withatleastoneirregularheavydrinkingoccasionpermonth(seetable3),weusedtherrfromthe respectivemetaanalysis, 35 andassumednocardioprotectiveeffect. EstimatingAAFsforlowbirthweight TocalculatetheAAFsformortalitycausedbylowbirthweightattributabletoalcohol consumption,weusedamodellingstrategythattakesintoaccountthedistributionofwomenwho drankthesameamountofalcoholduringpregnancyasprepregnancy,andwomenwhodranklesswhile pregnant.thenwecalculatedtheaafsforlowbirthweightasfollows: AAF P abs P same xrrxdx P less xrrxdx P abs P same xrrxdx P less xrrxdx wherep abs representstheproportionofwomenwhoabstainedfromalcoholwhilepregnant,p same representstheproportionofwomenwhoconsumedthesameamountasinprepregnancy,andp less representstheproportionofwomenwhoconsumedlessthaninprepregnancy. EstimatingAAFsforinjuries EstimatingtheAAFsforharmscausedtothedrinker WemodelledtheAAFsforinjuriesaccordingtoamethodologythattakesintoaccounttwo dimensionsofalcoholconsumption:bingedrinking(boththenumberofoccasions,andtheamount consumedperoccasion),andaveragedailyconsumption(onnonbingedays).whencalculatingthe AAFs,wealsoincludedalcoholmetabolismrates(forbothmenandwomen)tocalculateaperson srisk ofaninjury,accordingtomethodsoutlinedbytaylorandcolleagues. 182 TheAAFsforintentionalandunintentionalinjuriesattributabletoalcoholconsumptionwere calculatedasfollows: AAF P abs P currentnonbinge RR currentnonbinge P currentbinge RR currentbinge P abs P currentnonbinge RR currentnonbinge P currentbinge RR currentbinge 99
102 wherep abs representstheprevalenceofcurrentabstainers;andp current(binge) andp current(nonbinge) are respectivelytheprevalenceofcurrentdrinkerswhoengageinbingedrinking,andtheprevalenceof currentdrinkerswhodonotengageinbingedrinking.therrswerecalculatedseparatelyforboththe lattercases.rr current(nonbinge) wascalculatedasfollows: andrr current(binge) wascalculatedasfollows: andwhereriskonaveragedrinkingdays(rr average )wascalculatedasfollows: RR average P x RR x dayatrisk avg non binge andwhereriskonbingedrinkingdays(rr binge )wascalculatedasfollows: andwherep dayatrisk representstheproportionofadayatrisk,andrr binge andrr current aretherelative risksforinjurygivenanamountofalcoholconsumed.p dayatrisk iscalculatedbasedontheaveragerateat whichalcoholismetabolized. SincetheseAAFswerecalculatedbasedonsamplesofemergencypatients,weestimatedthe AAFformortalityfrommotorvehicleaccidentsbymultiplyingtheAAFformorbidityformotorvehicle accidentsby3/2.similarly,toestimatetheaafformortalityduetonon motorvehicleaccidents,we multipliedtheaafformorbidityfornon motorvehicleaccidentsby9/4.thesemethodswerebasedon twostudiesthatcomparedbloodalcohollevelsofemergencypatientswithlevelsobtainedfrom coroners reportsofpatientswhodiedfrominjuries. Forwomen,theAAFformotorvehicleaccidentswascalculatedbymultiplyingthemen saaf formotorvehicleaccidentsbytheproductofthepercapitaconsumptionofalcoholforwomen,divided bythepercapitaconsumptionofalcoholformen. TheAAFsfordeathsandmorbiditycausedbydrinkerstoothersduetomotorvehicleaccidents werecalculatedbasedonrecentdatareportedbylaslettetal., TheAAFsforthealcohol attributableinjuriestootherswerecalculatedasfollows: 100
103 AAF Otherage AAF selfagecountryi AAF selfcounrtyi AAF otherageaustralia AAFselfAustralia whereaaf othersage representstheaafformotorvehicleaccidentinjuriescausedbyothers,aaf selfcountryi representstheaafformotorvehicleaccidentinjuriescausedtooneselfforanentirecountry,and AAF selfagecountryi representstheaafformotorvehicleaccidentinjuriescausedtooneselfforeachspecific agegroup.aaf selfaustralia representstheaafformotorvehicleaccidentinjuriescausedtooneselfin Australia,andAAF otherageaustralia representstheaafformotorvehicleaccidentinjuriescausedbyothers foreachspecificagegroupinaustralia. TheAAFsfordeathsandinjuriescausedbyanassaultbysomeonewhohasbeendrinkingwere calculatedbasedonrecentdatareportedbylaslettetal., TheseAAFswerecalculatedas follows: whereaaf othersage representstheaaffordeathsorinjuriescausedbyassaults,aaf selfcountryi represents theaaffordeathsorinjuriescausedbyassaultsforanentirecountry,andaaf selfageaustraliai represents theaaffordeathsorinjuriescausedbyassaultsforeachspecificagegroupinaustralia,and AAF selfaustralia representstheaaffordeathsorinjuriescausedbyassaultsinaustralia. EstimatingAAFsduetoheavydrinking Theprevalenceofpercapitaconsumptionwasestimatedusingagammafunction,normalized to1ifintegratedfrom0to150gofpurealcohol/day.thisisequivalenttoacapat150g/dayinraw data. The HeavyDrinkerAttributableFraction (HDAF),i.e.thefractionofdeathsorDALYs attributabletoheavydrinking,isdefinedasfollows: wherep form representstheproportionofformerdrinkers,p(x)representstheprevalenceofdrinkinga dailyamountofalcoholx,p abs representstheproportionofabstainers,rr form representstherrfor formerdrinkers,andrr(x)representstherrfordrinkersassociatedwithadailyalcoholintakeofx.the 101
104 variablex 1 isthethresholdafterwhichadrinkerisconsideredaheavydrinker.inourcase,x 1 is60g/day formenand40g/dayforwomen. Estimatingtheproportionofcurrentheavydrinkersandtheirriskissimple;itisonlynecessary tointegratetheprevalenceriskratioproductfromacertainminimumamount(x 1 )to150.however,the proportionofdeathsattributabletoformerdrinkerswhowereonceheavydrinkersisnot straightforward.anestimateoftheproportionofformerdrinkerswasobtainedbyconsideringthisfact: thattheratioofharmincurrentheavydrinkers,withrespecttothetotalconsumingpopulation,isthe sameastheharmofformerheavydrinkerswithrespecttothetotalformerdrinkers.thus,thefactorc intheaboveformulacanbedefinedas: Thisassumesthattheproportionofharmisaccountedforonlybytheproportionofformer heavydrinkers,andnotbyachangeintherr.thesehdafswerethenappliedtothenumbersfor mortalityanddalysforeacheucountry,aswellasfornorway,russia,icelandandswitzerland. EstimatingconfidenceintervalsfortheAAFs Tocalculatethe95%confidenceintervals(CIs)fortheAAFs,weusedaMonteCarlo type approach describedbygmelandcolleagues 183 forchronicandinfectiousdiseases,andbytaylorand colleagues 182 forinjuries.toestimatethevarianceforeachaaf,wegenerated40,000setsofthe lowestlevelparameters,andthenusedthesesetstocalculate40,000aafs.fromtheseaafswe calculatedthevariances,whichwerethenusedtocalculatethe95%cis.(allstatisticalanalysesand modellingwereperformedusingrversion ) Step2:ApplicationoftheAAFstoregionspecificmortality,PYLL,YLDandDALYsdata Forthisstep,wemultipliedspecificAAFs bycountry,ageandsex byeachofthefiguresfor alcoholattributablemortality,pyll,yld,anddalys. Estimatingmortalityandmorbidity Weusedaneventbasedmeasure(mortality)andtimebasedmeasures(PYLL,YLDandDALYs) toquantifytheburdenofinjuries. 184 DALYscombinePYLLandYLD.Comprehensiverevisionestimates 102
105 for2004ofmortality,pyll,yldanddalysforthe160gbddiseaseandinjurycategorieswereprovided bythewho.estimatesofmortality,pyll,yldanddalyswereavailableforeachcountry. Themortality,PYLL,YLDandDALYsestimatesfor2004werebasedonananalysisofthelatest availablenationalinformationconcerninglevelsofmortalityandcausedistributions,asoftheendof 2007;andonthelatestavailableinformationfromtheWHO,concerning35causesofdeathandburden ofdiseasewithpublichealthimportance.standardizedratesformortalitydatawerecalculatedusing the2006revisionofthe2004populationestimatesofwhomemberstates,preparedbytheun PopulationDivision. 185 YearsofLifeLost(YLL)werecalculatedasthenumberofcausespecificdeaths,multipliedbya globalfigurereflectingstandardlifeexpectancy,i.e.theusualageofdeath. 104;186 YLDwereestimatedin ordertomeasuretheimpactofdiseaseandinjury.toestimateyldforaparticularinjuryordisease duringaparticulartimeperiod,thenumberofincidentcasesinthatperiodweremultipliedbothbythe averagedurationoftheinjuryordisease;andbyaweightfactorthatreflectedtheseverityofthe resultinghealthstate onascalefrom0(perfecthealth)to1(death).bothyllandyldtookinto accountsocialpreferences. 104 FortheYLLandYLDestimates,3%timediscountingandnonuniformage weightswereapplied.forexample,applyingdiscountingandageweights,adeathininfancy correspondedto33yll,andadeathatanagebetween5and20correspondedtoaround36yll. 187 Full detailsondata,methodsandcausecategoriesformortality,pyll,yldanddalysaredescribed elsewhere. 104;
106 WebAppendix3:SourcesforDeterminingRisksforDiseaseCategories Thistableoutlinesthecategoriesofalcoholattributablediseases,plusthesourcesusedfordeterminingtheriskrelationsofeachdisease. Condition ICD10Code SourceforAAF Infectiousandparasiticdiseases Tuberculosis A15A19 Seereference189;forcausalrelationship,see190 HIV/AIDS B20B24 Malignantneoplasms Seereference191,foranestimateoftheeffectofalcoholonworsening treatmentoutcomesbydisruptingmedicationschedules Mouthandoropharynxcancer C00C14 Seereferences (basedonRelativeRisksfromreference161) Esophagealcancer C15 Seereferences (basedonRelativeRisksfromreference161) Livercancer C22 Seereferences (basedonRelativeRisksfromreference161) Laryngealcancer C32 Seereferences (basedonRelativeRisksfromreference161) Breastcancer C50 Seereferences (basedonRelativeRisksfromreference161) Coloncancer C18 Seereferences (basedonRelativeRisksfromreference161) Rectalcancer C20 Seereferences (basedonRelativeRisksfromreference161) Diabetes Diabetesmellitus E10E14 Seereference194 Neuropsychiatricconditions Alcoholicpsychosis(partofAUD) F10.0,F10.3F %AAFperdefinition Alcoholabuse(partofAUD) F %AAFperdefinition Alcoholdependence(partofAUD) F %AAFperdefinition Epilepsy G40G41 Seereference195 Cardiovasculardiseases Hypertensivedisease I10I15 Seereference196 Ischemicheartdisease I20I25 Seereference46forvolume;35forpattern Cardiacarrhythmia I47I49 Seereference197 Ischemicstroke I60I62 Seereference198 Hemorrhagic/othernonischemicstroke I63I66 Seereference
107 Digestivediseases Cirrhosisoftheliver K70,K74 Seereference61 Acuteandchronicpancreatitis K85,K86.1 Seereference199 Respiratoryinfections Lowerrespiratoryinfection J10 J18,J20 J22 Seereference200 Conditionsarisingbeforebirth Lowbirthweight(asdefinedbytheGBD) P05P07 Seereference201 Unintentionalinjuries Motorvehicleaccident Seereference202forRelativeRisk;methodologyadoptedfrom182 Poisoning X40X49 Seereference202forRelativeRisk;methodologyadoptedfrom182 Falling W00W19 Seereference202forRelativeRisk;methodologyadoptedfrom182 Fires X00X09 Seereference202forRelativeRisk;methodologyadoptedfrom182 Drowning W65W74 Seereference202forRelativeRisk;methodologyadoptedfrom182 Otherunintentionalinjury Intentionalinjuries RestofVseries andw20w64,w 75W99,X10X39, X50X59,Y40Y86, Y88,andY89 Seereference202forRelativeRisk;methodologyadoptedfrom182 Selfinflictedinjury X60X84andY87.0 Seereference202forRelativeRisk;methodologyadoptedfrom182 Homicide X85Y09,Y87.1 Seereference202forRelativeRisk;methodologyadoptedfrom182 Otherintentionalinjury Seereference202forRelativeRisk;methodologyadoptedfrom
108 WebAppendix4:ConfidenceIntervalsforEstimatesofMortality ThistableoutlinestheConfidenceIntervalsforallestimatesofalcoholattributablemortality,bysex,forpeopleaged 15 64livinginEuropeancountriesin2004. Women Men Total Point Lower Upper Point Lower Upper Point Lower Upper Countries estimate estimate estimate estimate estimate estimate estimate estimate estimate Austria , ,114 1,925 1,167 2,674 Belgium , ,998 1, ,783 Bulgaria , ,575 1, ,309 Cyprus Czech Republic ,055 3,199 1,851 4,246 3,842 2,072 5,302 Denmark , ,388 1, ,885 Estonia , ,464 1, ,746 Finland , ,044 1, ,547 France 2,998 1,898 4,089 12,284 8,401 16,134 15,282 10,298 20,223 Germany 3,953 1,859 6,001 13,625 8,649 18,505 17,578 10,508 24,506 Greece , ,544 Hungary 1, ,867 5,483 3,835 7,114 6,716 4,419 8,981 Iceland Ireland Italy 1, ,749 3,794 1,467 6,070 5,320 1,749 8,819 Latvia ,011 1,335 2,244 2,366 1,472 2,817 Lithuania ,741 1,784 3,634 3,080 1,941 4,152 Luxembourg Malta Netherlands , ,614 1, ,437 Norway Poland 2, ,761 12,426 6,921 17,878 14,498 7,293 21,639 Portugal ,009 2,250 1,285 3,172 2,917 1,610 4,181 Romania 3,516 1,678 5,340 11,659 7,574 14,463 15,175 9,252 19,804 Slovakia , ,121 2, ,896 Slovenia , ,279 Spain 1, ,336 5,974 3,453 8,474 7,585 4,336 10,811 Sweden ,282 Switzerland , ,370 United Kingdom 2, ,274 5,482 2,235 8,656 8,089 3,143 12,930 European Union 25,284 10,390 39,973 94,451 55, , ,736 65, ,685 For comparison Russia 44,976 21,315 68, , , , , , ,746 Regions Central-West and Western Europe 11,419 5,570 17,164 36,561 22,087 50,797 47,980 27,658 67,960 Central-East and Eastern Europe 9,197 3,181 15,148 43,186 26,168 57,777 52,383 29,349 72,924 Nordic Countries ,562 3,173 1,343 4,978 4,088 1,600 6,539 Southern Europe 4,091 1,509 6,642 12,572 6,197 18,815 16,663 7,707 25,
109 WebAppendix5:StandardizedMortalityper100,000 Thesetablesoutlinethestandardizedmortalityper100,000,bysex,forpeopleaged15 64livinginEuropeancountries in
110 WebAppendix6:AlcoholAttributablePYLL ThetablebelowoutlinestheestimatesandconfidenceintervalsoftheproportionofalcoholattributablePYLLtoallPYLL,forpeople aged15 64livinginEuropeancountriesin2004. Women Men Total Point Lower Upper Point Lower Upper Point Lower Upper Countries estimate estimate estimate estimate estimate estimate estimate estimate estimate Austria 8.2% 4.6% 11.8% 17.4% 10.9% 23.9% 14.4% 8.9% 19.9% Belgium 7.9% 4.1% 11.7% 12.8% 7.3% 18.2% 11.1% 6.2% 15.9% Bulgaria 3.7% -0.9% 8.3% 9.8% 4.4% 15.2% 7.9% 2.7% 13.0% Cyprus 2.6% -0.8% 6.0% 3.1% -0.7% 6.7% 2.8% -0.8% 6.4% Czech Republic 8.4% 3.5% 13.3% 21.0% 12.5% 27.7% 17.0% 9.6% 23.0% Denmark 8.2% 4.6% 11.8% 16.8% 11.0% 22.6% 13.5% 8.6% 18.4% Estonia 13.2% 8.0% 18.4% 33.5% 22.5% 41.9% 28.0% 18.5% 35.5% Finland 8.3% 2.2% 14.3% 18.4% 7.8% 29.1% 15.2% 6.0% 24.4% France 8.7% 5.6% 11.7% 17.0% 11.4% 22.5% 14.4% 9.7% 19.2% Germany 7.9% 4.2% 11.5% 14.9% 9.7% 20.1% 12.5% 7.8% 17.1% Greece 4.9% 0.8% 9.0% 5.4% 0.9% 9.9% 5.2% 0.8% 9.6% Hungary 10.5% 5.5% 15.4% 22.6% 15.9% 29.3% 18.9% 12.7% 25.0% Iceland 2.6% -1.5% 6.5% 4.6% -2.1% 11.3% 3.7% -2.0% 9.4% Ireland 7.0% 3.3% 10.8% 12.0% 5.4% 18.6% 10.2% 4.6% 15.7% Italy 5.0% 1.3% 8.5% 7.2% 3.1% 11.1% 6.4% 2.5% 10.3% Latvia 12.8% 5.9% 19.6% 34.0% 23.2% 37.1% 27.8% 18.1% 31.9% Lithuania 10.1% 5.3% 14.7% 32.8% 21.9% 42.7% 26.9% 17.6% 35.5% Luxembourg 7.9% 2.4% 13.3% 16.1% 8.1% 24.0% 13.3% 6.2% 20.4% Malta 2.4% -0.8% 5.5% 3.7% 0.1% 7.2% 3.2% -0.3% 6.6% Netherlands 5.1% 2.5% 7.8% 7.5% 3.6% 11.3% 6.5% 3.1% 9.8% Norway 3.5% 0.0% 7.0% 8.1% 1.3% 14.8% 6.4% 0.8% 11.9% Poland 6.9% 1.9% 11.9% 18.9% 10.9% 26.7% 15.4% 8.3% 22.4% Portugal 9.9% 5.1% 14.7% 16.2% 9.1% 22.9% 14.3% 8.0% 20.5% Romania 14.4% 7.3% 21.5% 25.4% 16.5% 31.4% 22.0% 13.6% 28.3% Slovakia 9.0% 0.9% 16.9% 21.7% 10.6% 31.3% 18.2% 7.9% 27.3% Slovenia 11.6% 6.5% 16.7% 24.7% 16.1% 32.8% 20.8% 13.2% 28.0% Spain 8.5% 4.7% 12.2% 14.1% 7.9% 20.3% 12.4% 7.0% 17.8% Sweden 4.3% 1.3% 7.3% 8.4% 4.0% 12.8% 6.8% 2.9% 10.7% Switzerland 6.7% 4.1% 9.3% 12.3% 7.0% 17.5% 10.2% 5.9% 14.4% United Kingdom 7.1% 3.1% 11.1% 10.5% 5.0% 15.9% 9.2% 4.3% 14.0% European Union 8.0% 3.7% 12.2% 16.0% 9.6% 22.0% 13.4% 7.7% 18.8% For comparison Russia 15.5% 7.8% 23.2% 33.9% 21.9% 40.1% 29.3% 18.4% 35.8% Regions Central-West and Western Europe 7.7% 4.1% 11.1% 14.0% 8.6% 19.3% 11.8% 7.1% 16.5% Central-East and Eastern Europe 9.6% 3.9% 15.2% 21.8% 13.5% 28.9% 18.1% 10.6% 24.7% Nordic Countries 6.1% 2.1% 10.1% 13.3% 6.3% 20.2% 10.7% 4.8% 16.5% Southern Europe 6.6% 2.7% 10.4% 10.5% 5.3% 15.7% 9.3% 4.5% 14.0% 108
111 WebAppendix7:AlcoholAttributableYLD ThetablebelowoutlinestheestimatesandconfidenceintervalsoftheproportionofalcoholattributableYLDtoallYLD,forpeople aged15 64livinginEuropeancountriesin2004. Countries Point estimate Women Men Total Lower estimate Upper estimate Point estimate Lower estimate Upper estimate Point estimate Lower estimate Upper estimate Austria 2.2% 1.3% 3.1% 14.2% 12.8% 15.6% 7.6% 6.4% 8.7% Belgium 1.8% 0.8% 2.7% 7.6% 6.2% 9.1% 4.3% 3.0% 5.5% Bulgaria 0.4% -0.9% 1.6% 10.3% 7.9% 12.8% 5.3% 3.4% 7.1% Cyprus -2.8% -4.2% -1.4% 7.1% 5.6% 8.5% 1.9% 0.4% 3.3% Czech Republic 1.3% -0.2% 2.7% 15.1% 12.6% 17.5% 7.9% 5.9% 9.8% Denmark 2.0% 1.0% 2.9% 14.0% 12.5% 15.4% 7.2% 5.9% 8.4% Estonia 4.1% 3.0% 5.2% 26.8% 24.6% 28.9% 15.9% 14.2% 17.5% Finland 2.6% 1.1% 4.0% 19.1% 16.7% 21.4% 10.4% 8.5% 12.3% France 2.8% 1.9% 3.6% 15.5% 14.1% 16.9% 8.5% 7.4% 9.6% Germany 1.9% 0.8% 2.9% 16.0% 14.5% 17.4% 8.3% 7.0% 9.5% Greece 1.6% 0.2% 2.9% 12.2% 10.2% 14.2% 6.6% 4.8% 8.2% Hungary 4.9% 3.6% 6.0% 33.5% 31.7% 35.2% 19.3% 17.7% 20.8% Iceland 1.5% 0.7% 2.3% 10.0% 8.4% 11.5% 5.2% 3.9% 6.4% Ireland 2.8% 1.9% 3.6% 14.8% 13.5% 16.1% 8.3% 7.1% 9.3% Italy 0.4% -0.6% 1.4% 2.4% 0.6% 4.2% 1.3% -0.1% 2.7% Latvia 4.4% 2.9% 5.9% 28.0% 25.5% 30.2% 16.6% 14.6% 18.5% Lithuania 4.9% 3.8% 5.8% 30.4% 28.2% 32.5% 18.4% 16.7% 20.0% Luxembourg 2.5% 1.2% 3.7% 14.7% 12.8% 16.5% 8.0% 6.5% 9.6% Malta -0.2% -1.5% 1.0% 8.2% 6.4% 9.9% 3.5% 1.9% 5.0% Netherlands 2.0% 1.2% 2.7% 17.7% 16.7% 18.7% 9.1% 8.2% 10.0% Norway 6.2% 5.2% 7.2% 26.1% 24.7% 27.4% 15.6% 14.4% 16.8% Poland 1.9% 0.7% 3.0% 13.6% 11.0% 16.3% 7.7% 5.7% 9.6% Portugal 3.4% 2.2% 4.6% 13.9% 11.8% 16.0% 8.5% 6.8% 10.2% Romania 3.5% 1.8% 5.1% 17.7% 14.4% 20.9% 10.6% 8.0% 13.0% Slovakia 1.6% -0.1% 3.4% 22.8% 19.9% 25.8% 12.8% 10.4% 15.2% Slovenia 2.4% 1.2% 3.6% 13.0% 10.6% 15.4% 7.3% 5.5% 9.1% Spain 1.0% 0.1% 1.9% 5.4% 3.6% 7.3% 3.1% 1.7% 4.5% Sweden 5.7% 4.9% 6.5% 21.2% 20.2% 22.3% 12.5% 11.6% 13.5% Switzerland 2.2% 1.5% 2.9% 13.7% 12.5% 14.8% 7.3% 6.3% 8.3% United Kingdom 3.5% 2.4% 4.5% 19.0% 17.7% 20.2% 10.7% 9.4% 11.9% European Union 2.2% 1.1% 3.3% 14.5% 12.7% 16.2% 7.9% 6.5% 9.4% For comparison Russia 6.5% 4.6% 8.3% 30.0% 27.1% 32.8% 19.6% 17.1% 22.0% Regions Central-West and Western Europe 2.6% 1.6% 3.5% 16.3% 14.9% 17.6% 8.8% 7.6% 9.9% Central-East and Eastern Europe 2.5% 1.2% 3.9% 18.1% 15.4% 20.7% 10.3% 8.2% 12.3% Nordic Countries 4.2% 3.1% 5.2% 20.0% 18.5% 21.5% 11.3% 10.0% 12.6% Southern Europe 1.0% -0.1% 2.0% 5.8% 3.9% 7.6% 3.1% 1.7% 4.6% 109
112 WebAppendix8:AlcoholAttributableDALYs ThetablebelowoutlinestheestimatesandconfidenceintervalsoftheproportionofalcoholattributableDALYstoallDALYs,for peopleaged15 64livinginEuropeancountriesin2004. Countries Point estimate Women Men Total Lower estimate Upper estimate Point estimate Lower estimate Upper estimate Point estimate Lower estimate Upper estimate Austria 3.8% 2.2% 5.3% 15.6% 11.9% 19.3% 10.1% 7.3% 12.8% Belgium 3.5% 1.7% 5.2% 10.1% 6.7% 13.4% 6.9% 4.2% 9.5% Bulgaria 1.6% -0.9% 4.0% 10.1% 5.9% 14.1% 6.6% 3.0% 10.0% Cyprus -1.6% -3.5% 0.2% 5.6% 3.3% 7.8% 2.2% 0.0% 4.2% Czech Republic 3.6% 1.0% 6.1% 18.1% 12.6% 22.8% 11.9% 7.5% 15.7% Denmark 3.8% 2.1% 5.5% 15.3% 11.9% 18.6% 9.6% 6.9% 12.2% Estonia 7.7% 5.0% 10.4% 31.0% 23.3% 37.1% 22.6% 16.6% 27.5% Finland 4.2% 1.4% 6.9% 18.8% 12.6% 24.9% 12.3% 7.5% 17.1% France 4.3% 2.9% 5.7% 16.2% 12.9% 19.6% 10.8% 8.3% 13.3% Germany 3.6% 1.8% 5.3% 15.5% 12.4% 18.6% 9.9% 7.3% 12.4% Greece 2.5% 0.4% 4.5% 9.1% 5.9% 12.3% 6.1% 3.3% 8.7% Hungary 7.1% 4.4% 9.7% 27.2% 22.6% 31.8% 19.1% 15.2% 22.9% Iceland 1.8% 0.1% 3.4% 7.9% 4.4% 11.4% 4.7% 2.1% 7.3% Ireland 4.0% 2.2% 5.6% 13.6% 10.0% 17.2% 9.0% 6.2% 11.7% Italy 1.6% -0.1% 3.3% 4.6% 1.7% 7.3% 3.1% 0.8% 5.4% Latvia 7.9% 4.1% 11.6% 31.7% 24.0% 34.6% 22.8% 16.5% 26.0% Lithuania 6.9% 4.4% 9.2% 31.9% 24.3% 38.9% 23.0% 17.2% 28.5% Luxembourg 3.9% 1.5% 6.3% 15.3% 10.7% 19.8% 10.0% 6.4% 13.5% Malta 0.5% -1.3% 2.2% 6.4% 3.8% 8.8% 3.4% 1.2% 5.5% Netherlands 2.9% 1.6% 4.2% 13.7% 11.6% 15.8% 8.2% 6.4% 9.9% Norway 5.5% 3.8% 7.1% 19.2% 15.7% 22.6% 12.5% 9.8% 15.1% Poland 3.5% 1.1% 6.0% 16.5% 10.9% 22.0% 11.3% 6.9% 15.6% Portugal 5.3% 3.0% 7.6% 15.0% 10.5% 19.4% 10.9% 7.3% 14.5% Romania 7.6% 3.9% 11.3% 22.1% 15.6% 26.9% 16.3% 10.8% 20.7% Slovakia 4.0% 0.2% 7.7% 22.3% 15.1% 28.6% 15.2% 9.2% 20.6% Slovenia 5.1% 2.7% 7.4% 19.0% 13.4% 24.3% 13.1% 8.8% 17.1% Spain 2.9% 1.2% 4.5% 9.4% 5.6% 13.2% 6.6% 3.7% 9.5% Sweden 5.3% 4.0% 6.7% 16.4% 14.0% 18.7% 10.7% 8.8% 12.6% Switzerland 3.3% 2.1% 4.5% 13.1% 10.3% 15.9% 8.3% 6.2% 10.3% United Kingdom 4.5% 2.6% 6.4% 15.6% 12.6% 18.5% 10.1% 7.6% 12.6% European Union 3.9% 1.9% 5.9% 15.2% 11.2% 19.0% 10.1% 6.9% 13.1% For comparison Russia 11.0% 6.2% 15.8% 32.8% 23.4% 37.9% 25.9% 17.9% 30.9% Regions Central-West and Western Europe 4.0% 2.3% 5.6% 15.3% 12.2% 18.4% 9.9% 7.4% 12.3% Central-East and Eastern Europe 5.0% 2.1% 7.9% 20.2% 14.3% 25.3% 14.1% 9.4% 18.3% Nordic Countries 4.7% 2.9% 6.5% 17.2% 13.4% 21.0% 11.1% 8.2% 14.0% Southern Europe 2.4% 0.6% 4.2% 7.9% 4.5% 11.3% 5.4% 2.7% 8.1% 110
113 WebAppendix9:AlcoholAttributableDeaths,byRegion ThetablesbelowoutlinealcoholattributabledeathsforthefourEuropeanregions,brokendownbysex andbybroaddiseasecategories,forpeopleaged15 64livinginEuropeancountriesin2004. CentralWestandWesternEurope:alcoholattributabledeaths Detrimentaleffects Men #s Women #s Men % Women % Cancer 8,770 4, % 35.2% CVD(otherthanIHD) 2, % 4.1% Mentalandneurologicaldisorders 6,836 1, % 12.8% Livercirrhosis 12,443 4, % 37.4% Unintentionalinjury 5, % 4.0% Intentionalinjury 6, % 4.6% Otherdetrimental % 1.8% Totaldetrimental 43,875 13, % 100.0% Beneficialeffects IHD (7,106) (1,097) 97.2% 64.6% Otherbeneficial (207) (600) 2.8% 35.4% Totalbeneficial (7,313) (1,698) 100.0% 100.0% CentralEastandEasternEurope:alcoholattributabledeaths Detrimentaleffects Men #s Women #s Men % Women % Cancer 5,124 2, % 20.3% CVD(otherthanIHD) 4,403 2, % 20.5% Mentalandneurologicaldisorders 2, % 4.5% Livercirrhosis 11,127 3, % 39.8% Unintentionalinjury 14, % 8.7% Intentionalinjury 7, % 3.2% Otherdetrimental 1, % 2.9% Totaldetrimental 47,741 9, % 100.0% Beneficialeffects IHD (4,524) (427) 99.3% 61.5% Otherbeneficial (32) (268) 0.7% 38.5% Totalbeneficial (4,555) (695) 100.0% 100.0% 111
114 Nordiccountries:alcoholattributabledeaths Detrimentaleffects Men #s Women #s Men % Women % Cancer % 33.7% CVD(otherthanIHD) % 2.6% Mentalandneurologicaldisorders % 16.5% Livercirrhosis % 33.4% Unintentionalinjury % 7.0% Intentionalinjury % 5.3% Otherdetrimental % 1.6% Totaldetrimental 3,908 1, % 100.0% Beneficialeffects IHD (709) (85) 96.5% 58.0% Otherbeneficial (26) (62) 3.5% 42.0% Totalbeneficial (734) (147) 100.0% 100.0% SouthernEurope:alcoholattributabledeaths Detrimentaleffects Men #s Women #s Men % Women % Cancer 3,284 1, % 40.5% CVD(otherthanIHD) 1, % 11.8% Mentalandneurologicaldisorders % 1.9% Livercirrhosis 4,165 1, % 31.0% Unintentionalinjury 3, % 7.7% Intentionalinjury 1, % 4.8% Otherdetrimental % 2.3% Totaldetrimental 15,279 4, % 100.0% Beneficialeffects IHD (2,633) (220) 97.3% 48.2% Otherbeneficial (74) (237) 2.7% 51.8% Totalbeneficial (2,707) (456) 100.0% 100.0% 112
115 WebAppendix10:AlcoholAttributableDALYs ThetablesbelowoutlinethealcoholattributableburdenofdiseaseinDALYsforthefourEuropean regions,brokendownbysexandbybroaddiseasecategories,forpeopleaged15 64in2004. CentralWestandWesternEurope:alcoholattributableDALYs Detrimentaleffects Men #s Women #s Men % Women % Cancer 126,235 81, % 18.4% CVD(otherthanIHD) 37, % 0.0% Mentalandneurologicaldisorders 991, , % 51.2% Livercirrhosis 222, , % 22.7% Unintentionalinjury 150,413 15, % 3.5% Intentionalinjury 147,055 12, % 2.8% Otherdetrimental 24,208 6, % 1.4% Totaldetrimental 1,698, , % 100.0% Beneficialeffects IHD (132,108) (45,336) 94.3% 45.8% Otherbeneficial (8,056) (50,157) 5.7% 50.7% CVDotherthanIHD (3,530) 0.0% 3.6% Totalbeneficial (140,164) (99,022) 100.0% 100.0% CentralEastandEasternEurope:alcoholattributableDALYs Detrimentaleffects Men #s Women #s Men % Women % Cancer 75,905 33, % 12.3% CVD(otherthanIHD) 68,122 24, % 9.2% Mentalandneurologicaldisorders 497,910 93, % 34.7% Livercirrhosis 204,754 79, % 29.5% Unintentionalinjury 365,247 23, % 8.8% Intentionalinjury 153,543 6, % 2.5% Otherdetrimental 45,330 8, % 3.0% Totaldetrimental 1,410, , % 100.0% Beneficialeffects IHD (83,826) (27,714) 98.0% 59.5% Otherbeneficial (1,724) (18,857) 2.0% 40.5% Totalbeneficial (85,551) (46,570) 100.0% 100.0% 113
116 Nordiccountries:alcoholattributableDALYs Detrimentaleffects Men #s Women #s Men % Women % Cancer 5,772 6, % 12.3% CVD(otherthanIHD) 3, % 0.0% Mentalandneurologicaldisorders 122,365 33, % 66.8% Livercirrhosis 17,313 7, % 14.0% Unintentionalinjury 20,021 1, % 3.8% Intentionalinjury 12,774 1, % 2.3% Otherdetrimental 1, % 0.8% Totaldetrimental 183,132 50, % 100.0% Beneficialeffects IHD (12,773) (4,188) 93.0% 41.7% Otherbeneficial (954) (5,023) 7.0% 50.0% CVDotherthanIHD (837) 0.0% 8.3% Totalbeneficial (13,727) (10,048) 100.0% 100.0% SouthernEurope:alcoholattributableDALYs Detrimentaleffects Men #s Women #s Men % Women % Cancer 47,163 33, % 26.4% CVD(otherthanIHD) 20,762 5, % 4.0% Mentalandneurologicaldisorders 132,266 42, % 33.4% Livercirrhosis 72,625 27, % 21.7% Unintentionalinjury 105,983 10, % 8.2% Intentionalinjury 39,203 4, % 3.6% Otherdetrimental 13,066 3, % 2.7% Totaldetrimental 431, , % 100.0% Beneficialeffects IHD (51,530) (12,009) 91.6% 35.1% Otherbeneficial (4,731) (22,217) 8.4% 64.9% Totalbeneficial (56,262) (34,226) 100.0% 100.0% 114

117 WebAppendix11:EstimatingHarmtoOthers,byCountry Figure22a:Alcoholattributabledeathscausedbyharmstoothers Thefigurebelowshowstheproportionofalcoholattributabledeathscausedbyharmstoothers. 115
118 Figure22b:AlcoholattributableDALYscausedbyharmstoothers ThisfigureindicatestheproportionofallalcoholattributableDALYscausedbyharmstoothers. 116
119 WebAppendix12:PrevalenceofAlcoholDependence,byCountry Thistableoutlinestheprevalenceofadults(15+)withalcoholdependenceinEuropeancountries.(The figuresrepresentthebestestimatesfor2005.) Country Women Men Women affected Men affected Year Austria , , Belgium , , Bulgaria , , Cyprus ,700 14, Czech Republic , , Denmark ,200 88, Estonia ,500 48, Finland , , France ,100 1,073, Germany ,900 1,558, Greece , , Hungary , , Iceland , Ireland ,300 90, Italy , , Latvia ,800 63, Lithuania , , Luxembourg ,200 8, Malta ,100 4, Netherlands ,300 56, /2009 Norway , , Poland ,300 1,111, Portugal , , Romania , , Slovakia , , /2001 Slovenia ,500 75, Spain , , /2001 Sweden , , Switzerland , , UK ,400 1,994, EU ,707,200 9,213,300 For comparison Russia ,129,200 8,701,
120 WebAppendix13:PrevalenceofAlcoholDependence,byRegion Thistableoutlinestheprevalenceofalcoholdependenceinwomenandmen,aged18 64,and15+,in thedifferentregionsofeurope(allfiguresfortheyear2005). Region AD prevalence women in % AD prevalence men in % Women affected Men affected Central-West and Western Europe ,519,400 4,915,600 Central-East and Eastern Europe ,700 2,635,700 Nordic Countries , ,500 Southern Europe , ,500 Region AD prevalence 15+ women in % AD prevalence 15+ men in % Women affected Men affected Central-West and Western Europe ,743,800 5,434,000 Central-East and Eastern Europe ,200 2,780,100 Nordic Countries , ,000 Southern Europe , ,
121 WebAppendix14:AlcoholAttributableMortality Thissectionoutlinestheestimatesandconfidenceintervalsofmortalityattributabletoalcohol consumptionandad,forpeopleaged15 64livinginEuropein2004.Thetablebelowoutlinesthe proportionsofmortalitythatareattributabletoalcohol,inbothsexes,plustheconfidenceintervals. European Union Alcoholattributable (onlydetrimental effects) Alcoholattributable (neteffects) Duetoheavy drinking Duetoalcohol dependence Men 16.11% (95%CI: ) 13.89% (95%CI: ) 11.06% (95%CI: ) 10.72% (95%CI: ) Women 8.54% (95%CI: ) 7.65% (95%CI: ) 5.27% (95%CI: ) 3.69% (95%CI: ) Total 13.63% (95%CI: ) 11.85% (95%CI: ) 9.16% (95%CI: ) 8.42% (95%CI: ) TheconfidenceintervalaroundthemortalityattributabletoADwascalculatedbymergingthe variancesoftheindividualparameters,usingfirstordertaylorseriesapproximations.thebasicfunction formortalityduetoalcoholdependence(adaf)canbewrittenas: wherep AD istheprevalenceofalcoholdependence,rr h1 andrr h2 aretherelativerisks(takenfrom Hayesandcolleagues 113 fortheages15 44and45 64);RR 1 andrr 2 areadaptedfromareviewofthe literature(seerelevantarticleinthetext)fortheagegroups15 44and45 64;andP 1 andp 2 arethe prevalenceofadintheagegroups15 44and45 64.Thisequationcanbewrittenas: withz=.thevarianceofzissimplyacombination oftheindividualparameters,andhasaclosedmathematicalexpression.finally,thevarianceofadaf (giventhevarianceofz)canbeapproximatedusingafirstordertaylorseriesexpansion: 119
122 WebAppendix15:ProportionofMortalitybyRegion ThetablesbelowoutlinetheproportionofmortalityattributabletoalcoholconsumptionandAD,for peopleaged15 64,livingindifferentregionsofEuropein2004. CentralWestandWesternEuropeanRegion 120
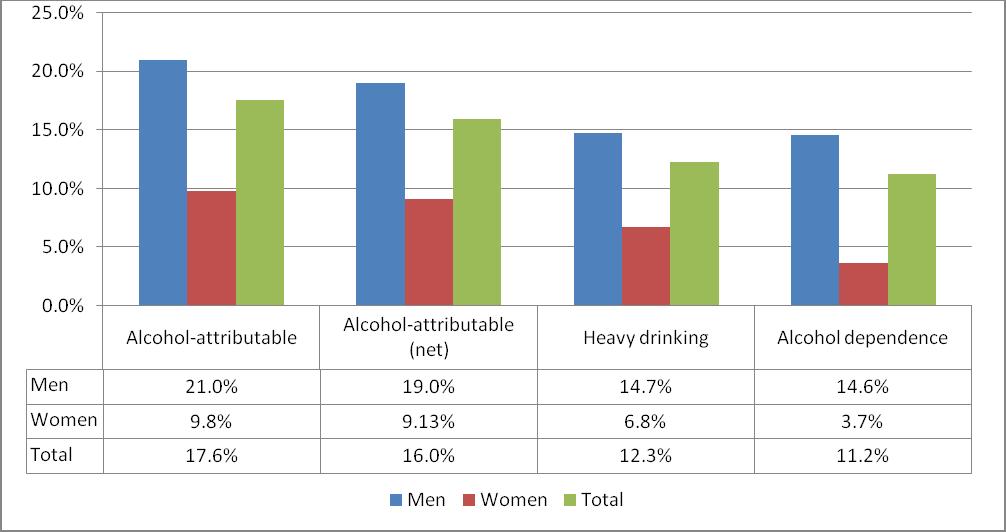
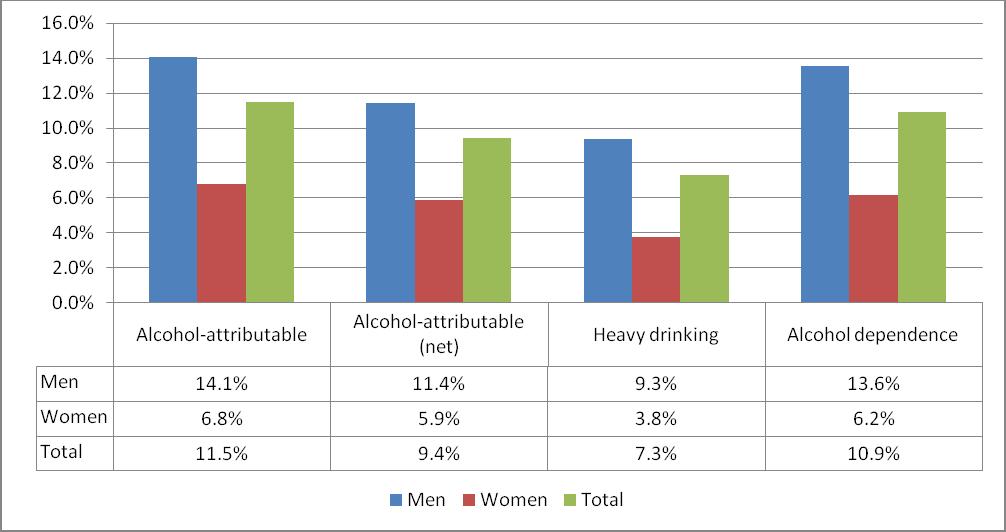
123 CentralEastandEasternEuropeanRegion NordicCountries 121
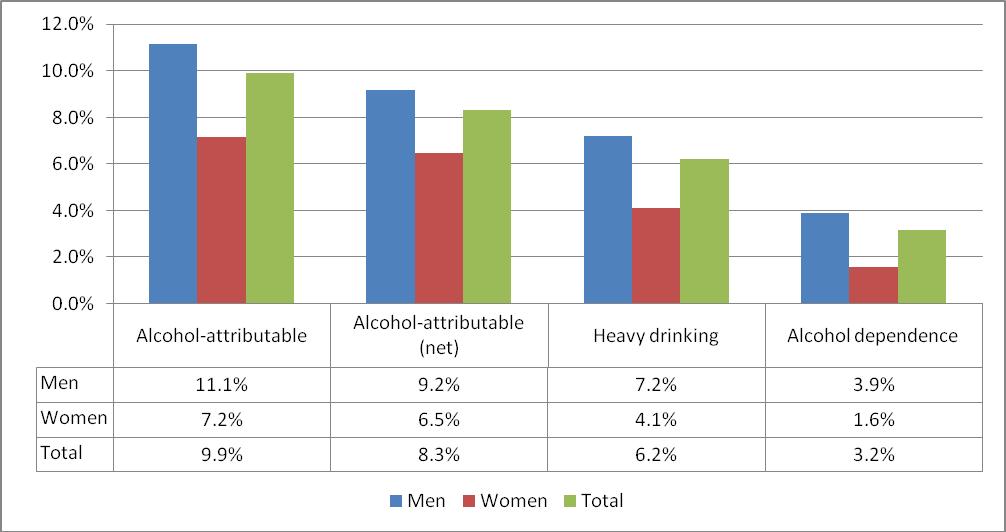
124 SouthernEuropeanRegion 122
Smokefree Policies in Europe: Are we there yet?
 Smokefree Policies in Europe: Are we there yet? 14 April 2015, 9:00 10:30am Rue de l Industrie 24, 1040 Brussels Permanent Partners: Temporary Partners: The research for the SFP Smokefree Map was partially
Burden and cost of alcohol, tobacco and illegal drugs globally and in Europe
 Burden and cost of alcohol, tobacco and illegal drugs globally and in Europe Jürgen Rehm 1-4 Kevin D. Shield 1,2,3 1) Centre for Addiction and Mental Health, Toronto, Canada 2) University of Toronto, Canada
WCPT COUNTRY PROFILE December 2017 HUNGARY
 WCPT COUNTRY PROFILE December 2017 HUNGARY HUNGARY NUMBERS WCPT Members Practising physical therapists 727 Total number of physical therapist members in your member organisation 4,000 Total number of practising
WCPT COUNTRY PROFILE December 2017 SWEDEN
 WCPT COUNTRY PROFILE December 2017 SWEDEN SWEDEN NUMBERS WCPT Members Practising physical therapists 11,043 Total number of physical therapist members in your member organisation 17,906 Total number of
Alcohol-related harm in Europe and the WHO policy response
 Alcohol-related harm in Europe and the WHO policy response Lars Moller Programme Manager World Health Organization Regional Office for Europe Date of presentation NCD global monitoring framework: alcohol-related
WCPT COUNTRY PROFILE December 2017 SERBIA
 WCPT COUNTRY PROFILE December 2017 SERBIA SERBIA NUMBERS WCPT Members Practising physical therapists 622 Total number of physical therapist members in your member organisation 3,323 Total number of practising
ALCOHOL CONSUMPTION IN EUROPE; TRADITIONS, GENERATIONS, CULTURE AND POLICY
 ALCOHOL CONSUMPTION IN EUROPE; TRADITIONS, GENERATIONS, CULTURE AND POLICY JACEK MOSKALEWICZ INSTITUTE OF PSCHIATRY AND NEUROLOGY WARSAW, POLAND THIRD EUROPEAN CONFERENCE ON ALCOHOL AND LAW ENFORCEMENT,
The Risk of Alcohol in Europe. Bridging the Gap June 2004
 The Risk of Alcohol in Europe Bridging the Gap 16-19 June 2004 1. What is the relationship between alcohol and the risk of heart disease? 2. What is the relationship between alcohol and the risk of other
European Status report on Alcohol and Health
 European Status report on Alcohol and Health Dr Lars Moller Regional Advisor a.i. WHO Regional Office for Europe Main killers in the WHO European Region Source: Preventing chronic diseases. A vital investment.
Where we stand in EFORT
 Where we stand in EFORT Engaging with the new EU regulatory landscape for medical devices. Challenges & opportunities Brussel, Belgium April 6, 2018 Per Kjaersgaard-Andersen Associate Professor Section
Overview of drug-induced deaths in Europe - What does the data tell us?
 Overview of drug-induced deaths in Europe - What does the data tell us? João Matias, Isabelle Giraudon, Julián Vicente EMCDDA expert group on the key-indicator Drug-related deaths and mortality among drug
Cross Border Genetic Testing for Rare Diseases
 Cross Border Genetic Testing for Rare Diseases EUCERD Joint Action WP8 Helena Kääriäinen National Institute for Health an Welfare, Helsinki, Finland Starting point Possibilities and demand for genetic
The burden caused by alcohol
 The burden caused by alcohol Presentation at REDUCING THE HARM CAUSED BY ALCOHOL: A COORDINATED EUROPEAN RESPONSE Tuesday, November 13 Jürgen Rehm Centre for Addiction and Mental Health, Toronto, Canada
Where do EU Contries set the limit for low risk drinking.
 Where do EU Contries set the limit for low risk drinking. Results from the EU RARHA survey E. Scafato,L. Galluzzo, S. Ghirini, C. Gandin Istituto Superiore di Sanità, Italy WP5: Outline of the work (tasks)
PARALLELISM AND THE LEGITIMACY GAP 1. Appendix A. Country Information
 PARALLELISM AND THE LEGITIMACY GAP 1 Appendix A Country Information PARALLELISM AND THE LEGITIMACY GAP 2 Table A.1 Sample size by country 2006 2008 2010 Austria 2405 2255 0 Belgium 1798 1760 1704 Bulgaria
Drinking guidelines used in the context of early identification and brief interventions in Europe: overview of RARHA survey results
 Drinking guidelines used in the context of early identification and brief interventions in Europe: overview of RARHA survey results E. Scafato, C. Gandin, L. Galluzzo, S. Ghirini, S. Martire Istituto Superiore
Rehm, Jürgen; Shield, K D; Rehm, M X; Gmel, Gerhard; Frick, Ulrich
 Zurich Open Repository and Archive University of Zurich Main Library Strickhofstrasse 39 CH-8057 Zurich www.zora.uzh.ch Year: 2012 Alcohol consumption, alcohol dependence, and attributable burden of disease
Men & Health Work. Difference can make a difference Steve Boorman & Ian Banks RSPH Academy 2013
 Men & Health Promotion @ Work Difference can make a difference Steve Boorman & Ian Banks RSPH Academy 2013 Difference can make a Difference Mens health: State of mens health Use of services Role of the
The health economic landscape of cancer in Europe
 1 Approval number The health economic landscape of cancer in Europe Bengt Jönsson, Professor Emeritus of Health Economics Stockholm School of Economics 2 Disclaimer This presentation was developed by Professor
National Institute on Alcohol Abuse and Alcoholism. Environmental Approaches
 Environmental Approaches Consumption of 10+ and 21+ Drinks on an Occasion At Least Once in the Past Year, 2013 30 25 20 15 10+ drinks 15 25 10+ drinks 16 25 10 5 0 21+ drinks 3 2 21+ drinks 18-20 21-24
Alcohol in Europe and Brief Intervention. Dr Lars Møller Programme Manager World Health Organization Regional Office for Europe
 Alcohol in Europe and Brief Intervention Dr Lars Møller Programme Manager World Health Organization Regional Office for Europe Global risk factors ranked by attributable burden of disease 2010 (GBD, Lancet,
The cancer burden in the European Union and the European Region: the current situation and a way forward
 The cancer burden in the European Union and the European Region: the current situation and a way forward Presented by Zsuzsanna Jakab WHO Regional Director for Europe Informal Meeting of Health Ministers
Engagement in language assessment / Regions of Europe
 Summary table: Engagement in language / Regions of This table lists the statistically significant differences in the engagement in activities by the respondents from different s of : If the word or appears
Yersiniosis SURVEILLANCE REPORT. Annual Epidemiological Report for Key facts. Methods. Epidemiology
 SURVEILLANCE REPORT Annual Epidemiological Report for 2015 Yersiniosis Key facts In 2015, 26 countries reported 7 279 confirmed yersiniosis cases in the EU/EEA. The overall notification rate was 2.0 cases
CNAPA Meeting Luxembourg September 2016
 CNAPA Meeting Luxembourg September 2016 Manuel Cardoso RARHA Executive Coordinator Public Health MD Senior Advisor Deputy General-Director of SICAD - Portugal RARHA Events Policy Dialogue and Final Conference
Manuel Cardoso RARHA Executive Coordinator Public Health MD Senior Advisor Deputy General-Director of SICAD - Portugal
 Manuel Cardoso RARHA Executive Coordinator Public Health MD Senior Advisor Deputy General-Director of SICAD - Portugal Public Health Public health is the science and art of preventing disease, prolonging
Rheumatoid Arthritis Disease Burden and Access to Treatment
 Berlin, April 2012 Rheumatoid Arthritis Disease Burden and Access to Treatment Gisela Kobelt, PhD Visiting Professor, Lund University (Sweden) President, European Health Economics (France) Disclaimers
Monthly measles and rubella monitoring report
 SURVEILLANCE REPORT Monthly measles and rubella monitoring report December 2018 Period covered: 1 November 2017 to 31 October 2018 Introduction This monitoring report is based on measles and rubella data
European status report on alcohol and health Leadership, awareness and commitment
 European status report on alcohol and health 2014 Leadership, awareness and commitment Leadership, awareness and commitment Background Strong leadership from national and local governments is essential
UK bowel cancer care outcomes: A comparison with Europe
 UK bowel cancer care outcomes: A comparison with Europe What is bowel cancer? Bowel cancer, which is also known as colorectal or colon cancer, is a cancer that affects either the colon or the rectum. The
TEDDY. Teddy Network of Excellence. Annagrazia ALTAVILLA. Ph.D. Sciences Ethics LL.M. Health Law. diterranée
 Teddy Network of Excellence Annagrazia ALTAVILLA TEDDY Task-force in Europe for Drug Development for the Young Ph.D. Sciences Ethics LL.M. Health Law Associated Senior Lecturer Université de la MéditerranM
LEBANON. WCPT COUNTRY PROFILE December 2018
 LEBANON WCPT COUNTRY PROFILE December 2018 LEBANON NUMBERS 1600 1400 1200 1000 800 600 400 200 0 Physical therapists in the country Members in MO 1,480 1,480 Total PTs in country 800000 700000 600000 500000
European Collaboration on Dementia. Luxembourg, 13 December 2006
 European Collaboration on Dementia Luxembourg, 13 December 2006 2005 Call for projects Special attention has also to be given to information and definition of indicators on neurodegenerative, neurodevelopment,
DENMARK. WCPT COUNTRY PROFILE December 2018
 DENMARK WCPT COUNTRY PROFILE December 2018 DENMARK NUMBERS 14000 12000 10000 8000 6000 4000 2000 0 Physical therapists in the country Members in MO 11,720 12,975 Total PTs in country 800000 700000 600000
Trichinellosis SURVEILLANCE REPORT. Annual Epidemiological Report for Key facts. Methods
 Annual Epidemiological Report for 2015 Trichinellosis Key facts In 2015, a total of 156 confirmed cases of trichinellosis was reported from 29 EU/EEA countries. The overall notification rate was 0.03 cases
Underage drinking in Europe
 Underage drinking in Europe There are two major studies on underage drinking which are published every 4 years: HBSC (Health Behaviour in School-aged Children) and ESPAD (The European School survey Project
GERMANY. WCPT COUNTRY PROFILE December 2018
 GERMANY WCPT COUNTRY PROFILE December 2018 GERMANY NUMBERS 160000 140000 120000 100000 80000 60000 40000 20000 0 Physical therapists in the country Members in MO 21,502 136,000 Total PTs in country 800000
REPORT FROM THE COMMISSION TO THE EUROPEAN PARLIAMENT, THE COUNCIL, THE EUROPEAN ECONOMIC AND SOCIAL COMMITTEE AND THE COMMITTEE OF THE REGIONS
 EUROPEAN COMMISSION Brussels, 17.6.011 COM(011) 35 final REPORT FROM THE COMMISSION TO THE EUROPEAN PARLIAMENT, THE COUNCIL, THE EUROPEAN ECONOMIC AND SOCIAL COMMITTEE AND THE COMMITTEE OF THE REGIONS
Atherosclerotic Cardiovascular Diseases: ischaemic heart disease and stroke
 «L Europe de la santé au service des patients» 13-14 October 2008 - Institut Pasteur Paris Atherosclerotic Cardiovascular Diseases: ischaemic heart disease and stroke Simona Giampaoli National Centre of
PRESS RELEASE ISSUED BY THE STATE UNIVERSITY OF NEW YORK AT ALBANY
 PRESS RELEASE ISSUED BY THE STATE UNIVERSITY OF NEW YORK AT ALBANY EMBARGOED FOR RELEASE AT 6:00A.M. EST, FEBRUARY 20, 2001. NOTE TO EDITORS These results will be presented today (Tuesday, February 20,
Department of Biological Standardisation OMCL Network & Healthcare (DBO)
") Department of Biological Standardisation OMCL Network & Healthcare (DBO) Implementation of Pathogen Reduction Technologies for Blood Components for Transfusion: Updated Table 2009-2010 COUNCIL OF EUROPE
Department of Biological Standardisation OMCL Network & Healthcare (DBO) Implementation of Pathogen Reduction Technologies for Blood Components for Transfusion: Updated Table 2009-2010 COUNCIL OF EUROPE
Estimating Smoking Related Cause of Death: a Cohort Approach Based on Lung Cancer Mortality in six European Countries
 1 Estimating Smoking Related Cause of Death: a Cohort Approach Based on Lung Cancer Mortality in six European Countries Introduction Mariachiara Di Cesare and Mike Murphy Department of Social Policy, London
Media Release. Inaugural study reveals that more than one in four women in European and Central Asian prisons locked up for drug offences
 Media Release Embargoed 00.01 CET Monday 12 th March 2012 Inaugural study reveals that more than one in four women in European and Central Asian prisons locked up for drug offences Up to 70 percent of
Cost of Disorders of the Brain in Europe Gustavsson et al. Cost of disorders of the brain in Europe Eur. Neuropsych. (2011) 21,
 21,") Cost of Disorders of the Brain in Europe 2010 Gustavsson et al. Cost of disorders of the brain in Europe 2010. Eur. Neuropsych. (2011) 21, 718-779 Steering Committee Prof Jes Olesen 1 Prof Bengt Jönsson
Cost of Disorders of the Brain in Europe 2010 Gustavsson et al. Cost of disorders of the brain in Europe 2010. Eur. Neuropsych. (2011) 21, 718-779 Steering Committee Prof Jes Olesen 1 Prof Bengt Jönsson
Biology Report. Is there a relationship between Countries' Human Development Index (HDI) level and the incidence of tuberculosis?
 level and the incidence of tuberculosis?") Biology Report Is there a relationship between Countries' Human Development Index (HDI) level and the incidence of tuberculosis? Introduction Tuberculosis is a serious disease caused by the bacterium Mycobacterium
Biology Report Is there a relationship between Countries' Human Development Index (HDI) level and the incidence of tuberculosis? Introduction Tuberculosis is a serious disease caused by the bacterium Mycobacterium
Table 7.1 Summary information for lung cancer in Ireland,
 7 Lung cancer 7.1 Summary Lung cancer is the third most common cancer in Ireland, accounting for 15% of cancers in men and 9% in women, if non-melanoma skin cancer is excluded (table 7.1). Each year, approximately
WHO REGIONAL OFFICE FOR EUROPE RECOMMENDATIONS ON INFLUENZA
 WHO REGIONAL OFFICE FOR EUROPE RECOMMENDATIONS ON INFLUENZA September 2017 Address requests about publications of the WHO Regional Office for Europe to: Publications WHO Regional Office for Europe Marmorvej
Alcohol Prevention Day
 Alcohol Prevention Day Rome, 16 May 2018 Hana Horka Policy Officer, Unit C4 Health Determinants and International Relations European Commission DG Health and Food Safety (SANTE) Alcohol consumption in
Overview of European Consumption Databases
 FEDERAL INSTITUTE FOR RISK ASSESSMENT Overview of European Consumption Databases Katrin Büsch Workshop Food Consumption Data and Dietary Exposure in the European Union, 15-16 May 2008, Berlin Introduction
Access to treatment and disease burden
 Access to treatment and disease burden Robert Flisiak Department of Infectious Diseases and Hepatology Medical University in Białystok, Poland Moulin de Vernègues, 27-29 August 2015 Disclosures Advisor
Alcohol related harms to children and youth and ways to address it Case of Finland
 Alcohol related harms to children and youth and ways to address it Case of Finland Researcher Jaana Markkula Injury prevention unit European Child Safety Alliance meeting 6th of June 2013, Cluj-Napoca,
Table 9.1 Summary information for stomach cancer in Ireland,
 9 Stomach cancer 9.1 Summary Stomach cancer ranks seventh in terms of the most common cancers in Ireland, accounting for 4.1% of all malignant neoplasia in men and 2.8% in women, when non-melanoma skin
Table 6.1 Summary information for colorectal cancer in Ireland,
 6 Colorectal cancer 6.1 Summary Colorectal cancer is the second most common cancer in Ireland (excluding non-melanoma skin cancer). It accounts for 12% of all malignant neoplasia in females and 15% in
11 Melanoma of the skin
 11 Melanoma of the skin 11.1 Summary Melanoma of the skin is the ninth most common cancer in Ireland, accounting for 2.4 of all malignant neoplasia in men and 4.2 in women, if non-melanoma skin cancers
RECOMMENDATIONS ON INFLUENZA VACCINATION DURING THE WINTER SEASON
 RECOMMENDATIONS ON INFLUENZA VACCINATION DURING THE 2018 2019 WINTER SEASON October 2018 Address requests about publications of the WHO Regional Office for Europe to: Publications WHO Regional Office for
Inequalities in health: challenges and opportunities in Europe Dr Zsuzsanna Jakab WHO Regional Director for Europe
 Inequalities in health: challenges and opportunities in Europe Dr Zsuzsanna Jakab WHO Regional Director for Europe 21st Congress of the European Association of Dental Public Health 1 October 2016 Budapest
Outcome of proficiency test on EIA serology
 Outcome of proficiency test on EIA serology Anses Dozulé Laboratory for equine diseases VIPARE unit Delphine Gaudaire EIA PT GENERAL INFORMATION AIM OF THE PT Detect EIA antibodies: using Agar Gel Immuno-Diffusion
Q1 What age are you?
 Q1 What age are you? Answered: 504 Skipped: 0 18 19 20 21 22 23 24 25 26 27 28 29 30 31 32 33 34 35 4.56% 23 3.77% 19 4.56% 23 6.15% 31 3.97% 20 6.55% 33 5.95% 30 6.75% 34 6.35% 32 4.37% 22 6.75% 34 5.56%
508 the number of suicide deaths in deaths per 100,000 people was the suicide rate in Suicide deaths in 2013 by gender
 An overview of suicide statistics This document summarises information about suicide deaths in New Zealand covering up to 13. It does not attempt to explain causes of suicidal behaviour or causes of changes
European Community Pharmacy: a reference in Public Health
 European Community Pharmacy: a reference in Public Health Ilaria Passarani PGEU Secretary General 4 October 2018, Burgos, Spain Pharmaceutical Group of European Union Members: Professional Bodies & Pharmacists
Situation update in the European Region: overview of influenza surveillance data week 40/2009 to week 07/2010.
 Situation update in the European Region: overview of influenza surveillance data week 40/2009 to week 07/2010. WHO/Europe publishes a weekly electronic bulletin on influenza activity in the Region 1 and
A report on the epidemiology of selected vaccine-preventable diseases in the European Region 30% 20% 10%
 % of reported measles cases WHO EpiBrief A report on the epidemiology of selected vaccine-preventable diseases in the European Region No. /17 This issue of WHO EpiBrief provides an overview of selected
Screening for Cervical Cancer in Europe
 Asturias, 23 October, 2011 Asturias, 23 October Screening for Cervical Cancer in Europe M. Arbyn Unit Cancer Epidemiology, IPH, Brussels, Belgium Rue Juliette Wytsmanstraat 14 1050 Brussels Belgium T +32
Giardiasis (lambliasis)
") SURVEILLANCE REPORT Annual Epidemiological Report for 2016 Giardiasis (lambliasis) Key facts In 2016, 18 985 confirmed giardiasis cases were reported in the EU/EEA, representing an increase of 5.3% from
SURVEILLANCE REPORT Annual Epidemiological Report for 2016 Giardiasis (lambliasis) Key facts In 2016, 18 985 confirmed giardiasis cases were reported in the EU/EEA, representing an increase of 5.3% from
European Report on Alcohol Policy
 European Report on Alcohol Policy A Review 2016 17 Rue Archimede I 1000 Brussels I Belgium I Tel +32 (0)2 736 05 72 I Tel +32 (0)2 732 67 82 info@eurocare.org I www.eurocare.org Disclaimer: This document
Finnish international trade 2017 Figures and diagrams. Finnish Customs Statistics
 Finnish international trade 217 Figures and diagrams Finnish Customs Statistics IMPORTS, EXPORTS AND TRADE BALANCE 199-217 Billion e 7 6 5 4 3 2 1-1 9 91 92 93 94 95 96 97 98 99 1 2 3 4 5 6 7 8 9 1 11
Global Trade in Lightweight Coated Writing Paper TradeData International Pty Ltd (www.tradedata.net) Page 1 5/18/2015
 Page 1 5/18/2015") Page 1 5/18/2015 An Analysis of Global Trade in Lightweight paper, coated with inorganic substances, used for writing etc., of which more than 10% by weight of total fibre content consists of fibres obtained
Page 1 5/18/2015 An Analysis of Global Trade in Lightweight paper, coated with inorganic substances, used for writing etc., of which more than 10% by weight of total fibre content consists of fibres obtained
Finnish international trade 2017 Figures and diagrams. Finnish Customs Statistics
 Finnish international trade 217 Figures and diagrams Finnish Customs Statistics IMPORTS, EXPORTS AND TRADE BALANCE 199-217 Billion e 7 6 5 4 3 2 1-1 9 91 92 93 94 95 96 97 98 99 1 2 3 4 5 6 7 8 9 1 11
Real Life, Real PD Survey
 Real Life, Real PD Survey Final Pan-European Survey Results Survey Objectives The survey was carried out to provide insights into the realities of living with PD and to highlight some of the symptoms of
Overall survival: 1 st line therapy
 1 3 Overall survival: 1 st line therapy 2-year OS phase III studies mm Prices per month of oncology medicin Bloomberg Business weekly 26 Feb 2015 Presented By Veena Shankaran at 2016 ASCO Annual Meeting
Injecting trends in Austria including results of a systematic literature review on interventions aiming to influence the route of administration
 Injecting trends in Austria including results of a systematic literature review on interventions aiming to influence the route of administration Alexander Grabenhofer-Eggerth TDI expert meeting - Lisbon,
Nutrient profiles for foods bearing claims
 Nutrient profiles for foods bearing claims Fields marked with * are mandatory. Background Regulation (EC) 1924/2006 (Nutrition and Health Claims NHC Regulation) establishes EU rules on nutrition and health
31 countries (117 registries, 20 national) Increased coverage in countries with regional registries 50% European population Overall >20 million
 Increased coverage in countries with regional registries 50% European population Overall >20 million") 31 countries (117 registries, 20 national) Increased coverage in countries with regional registries 50% European population Overall >20 million cancer cases Adult patients (age 15+) 45 major cancer sites
31 countries (117 registries, 20 national) Increased coverage in countries with regional registries 50% European population Overall >20 million cancer cases Adult patients (age 15+) 45 major cancer sites
Primary and secondary prevention of sudden cardiac death in emerging economies
 Primary and secondary prevention of sudden cardiac death in emerging economies Béla Merkely MD, PhD, DSc, FESC Heart Center Semmelweis University Budapest Common risk factors for sudden cardiac death Increasing
real-time AQ data 2007 and plans for 2008
 real-time AQ data 2007 and plans for 2008 Tim Haigh - project manager Information Resources http://www.eea.europa.eu/maps/ozone/map/ Where is all the data coming from? EEA NRT Database 4000 2000 700 EEA
Emerging Risks Mapping of Activities in Member States. 67th Advisory Forum meeting, Utrecht, The Netherlands, 6 February 2018
 Emerging Risks Mapping of Activities in Member States 67th Advisory Forum meeting, Utrecht, The Netherlands, 6 February 2018 BACKGROUND 67 th Advisory Forum Meeting, Utrecht, The Netherlands, 6 February
Research paper: Legal treatment of the use of cannabis for medical purposes in the member states of the European Union
 Parliament of Montenegro Parliamentary Institute Research Centre Research paper: Legal treatment of the use of cannabis for medical purposes in the member states of the European Union Podgorica, December
FOURIER STUDY GREYLOCK PRESS: CTS PRODUCT SAMPLE - FOURIER YES. Did the study achieve its main objective?
 FOURIER STUDY Did the study achieve its main objective? 2 15% 1 5% 9.8% YES FOURIER compared Repatha with placebo in patients who were taking a statin and had hardening or narrowing of the arteries and
Differences make a Difference
 Differences make a Difference The European Mens Health Forum: Overview European Mens Health: An oxymoron? Mens use of services: Self-care & navigation Good practice: Wot does work? A Storm is coming: Man
EUDY JUNIOR CAMP 2018 FIRST ANNOUNCEMENT
 EUDY JUNIOR CP 2018 FIRST ANNOUNCEMENT 21. 29. July 2018 Tesáre, SLOVAKIA IDENTITY OF THE DEAF EUROPEAN UNION OF THE DEAF YOUTH (EUDY) The European Union of the Deaf Youth is a European non-profit organisation
Is there a relationship between Countries' Human Development Index (HDI) level and the incidence of tuberculosis?
 level and the incidence of tuberculosis?") Is there a relationship between Countries' Human Development Index (HDI) level and the incidence of tuberculosis? Introduction Tuberculosis is a serious disease caused by the bacterium Mycobacterium tuberculosis.
Is there a relationship between Countries' Human Development Index (HDI) level and the incidence of tuberculosis? Introduction Tuberculosis is a serious disease caused by the bacterium Mycobacterium tuberculosis.
European Association of Dental Public Health Prevention of Oral Cancer
 European Association of Dental Public Health Prevention of Oral Cancer Special Interest Working Group Thursday 14th November 2013 PD Dr. Katrin Hertrampf, MPH Dr. Colwyn Jones, Associate Editor Malta 2013
Prevention of Oral Cancer Special Interest Working Group
 Prevention of Oral Cancer Special Interest Working Group Dr Colwyn Jones, Consultant in Dental Public Health, NHS Health Scotland, 1 South Gyle Crescent, Edinburgh EH12 9EB, Scotland. colwyn.jones@nhs.net
Who is a migrant? 12/10/2018. HIV and migrants. Heterogeneous groups of persons with different migration drivers
 HIV and migrants Julia del Amo has received research grants awarded to her institution from Companies BMS, Gilead, ViiV and epidemiology teaching fees from ViiV, Gilead and MSD Dr Julia del Amo National
Open Access & research metrics Establishing reliable baselines for science policy
 Open Access & research metrics Establishing reliable baselines for science policy Thed van Leeuwen, Rodrigo Costas, Alfredo Yegros-Yegros, and Ingeborg Meijer CWTS, Leiden University STI Conference 2017,
Low risk drinking guidelines in Europe: results from RARHA survey E. Scafato, Istituto Superiore di Sanità, Italy
 Low risk drinking guidelines in Europe: results from RARHA survey E. Scafato, Istituto Superiore di Sanità, Italy Work Package Guidelines Co-led by the National Institute for Health and Welfare, Finland,
This document is a preview generated by EVS
 TECHNICAL REPORT RAPPORT TECHNIQUE TECHNISCHER BERICHT CEN/TR 17223 March 2018 ICS 03.100.70; 11.040.01 English version Guidance on the relationship between EN ISO 13485: 2016 (Medical devices - Quality
Hepatitis A SURVEILLANCE REPORT. Annual Epidemiological Report for Key facts. Methods
 SURVEILLANCE REPORT Annual Epidemiological Report for 2015 Hepatitis A Key facts In 2015, 29 EU/EEA countries reported a total of 12 641 cases of hepatitis A, 12 527 (99.1%) of which were confirmed. The
E. Scafato, C. Gandin, L. Galluzzo, S. Ghirini
 Drinking guidelines in the context of brief interventions. Results from EU RARHA survey E. Scafato, C. Gandin, L. Galluzzo, S. Ghirini Istituto Superiore di Sanità, Italy WP5: Outline of the work (tasks)
EFSA s Concise European food consumption database. Davide Arcella Data Collection and Exposure Unit
 EFSA s Concise European food consumption database Davide Arcella Data Collection and Exposure Unit 1 The EFSA raison d être Risk assessment authority created in 2002 as part of a comprehensive program
Measles and rubella monitoring January 2015
 Measles and rubella monitoring January 215 Reporting on January December 214 surveillance data and epidemic intelligence data to the end of January 215 Main developments Measles During the 12-month period
EUVAC.NET A surveillance network for vaccine-preventable diseases
 EUVAC.NET A surveillance network for vaccine-preventable diseases Mark Muscat EUVAC.NET Co-ordinator Department of Epidemiology Statens Serum Institut Denmark Email: mmc@ssi.dk Viral Hepatitis Prevention
Identifying Europe s information needs for effective drug policy Lisbon, EMCCDA
 Cannabis Market in Europe: A Growing Domestic Market (First Results) Jean-Michel Costes, Christian Ben Lakhdar OFDT 3 avenue du Stade de France 93218 Saint-Denis La Plaine cedex Tel : 01 41 62 77 16 Fax