Alcohol and Drug-Crash Problem in Canada 2012 Report
|
|
|
- Gyles Arnold
- 5 years ago
- Views:
Transcription


1 CCMTA Road Safety Research Report Series Alcohol and Drug-Crash Problem in Canada 2012 Report Prepared for the Canadian Council of Motor Transport Administrators by the Traffic Injury Research Foundation of Canada
2
3 December 2015 Canadian Council of Motor Transport Administrators Prepared by: S.W. Brown, W.G.M. Vanlaar, and R.D. Robertson The Traffic Injury Research Foundation of Canada Ottawa, Ontario This publication may be reproduced without permission provided that its use is solely for the purposes of private study, research, criticism, review or newspaper summary and the source if fully acknowledged. ISBN# iii
4 ABSTRACT This report describes the magnitude and characteristics of the alcohol-crash and drug-crash problems in Canada during 2012 as well as trends in these problems. Information contained in this report was drawn from two national databases compiled and maintained by the Traffic Injury Research Foundation (TIRF) and funded jointly by the Public Health Agency of Canada and State Farm. One database contains information on persons fatally injured in motor vehicle crashes; the other has information on persons seriously injured in motor vehicle crashes. This report is prepared on behalf of the Canadian Council of Motor Transport Administrators (CCMTA). This report examines: data on alcohol in fatally injured drivers and pedestrians; the number and percent of people who died in alcohol-related crashes; alcohol involvement in those crashes in which someone was seriously injured but not killed; and data on drugs in fatally injured drivers. Thus, in the report, various indicators are used to estimate the magnitude and extent of the alcohol-crash problem and drug-crash problem in Canada during 2012 as well as changes in these problems over the past few years. The indicators include: > the number and percent of people who were killed in crashes that involved alcohol; > the number and percent of fatally injured drivers who had been drinking; > the number and percent of fatally injured pedestrians who had been drinking; > the number and percent of drivers in serious injury crashes that involved alcohol; and > the number and percent of fatally injured drivers who were positive for drugs. As well, these indicators are presented separately for each province and territory. Finally, this report also examines the degree to which there has been a reduction in: (1) fatalities and serious injuries in collisions involving a drinking driver; and (2) the presence of drugs among fatally injured drivers. Analysis is provided for Canada and each province/territory. An average of the 2011 and 2012 data are compared to data from the baseline period. The opinions expressed in this report are those of the authors and do not necessarily represent the views or opinions of the reviewers, jurisdictions or CCMTA, who commissioned this report. iv
5 TABLE OF CONTENTS ABSTRACT... iii ACKNOWLEDGEMENTS... ix 1.0 INTRODUCTION DATA SOURCES AND INDICATORS OF THE ALCOHOL-CRASH PROBLEM Sources of the data Indicators of the problem CANADA Deaths in alcohol-related crashes Alcohol in fatally injured drivers Alcohol in fatally injured pedestrians Drivers involved in alcohol-related serious injury crashes Drug use among fatally injured drivers Trends in alcohol and drug-impaired driving BRITISH COLUMBIA Deaths in alcohol-related crashes Alcohol in fatally injured drivers Drivers involved in alcohol-related serious injury crashes Drug use among fatally injured drivers Trends in alcohol and drug-impaired driving ALBERTA Deaths in alcohol-related crashes Alcohol in fatally injured drivers Drivers involved in alcohol-related serious injury crashes Drug use among fatally injured drivers Trends in alcohol and drug-impaired driving SASKATCHEWAN Deaths in alcohol-related crashes Alcohol in fatally injured drivers Drivers involved in alcohol-related serious injury crashes Drug use among fatally injured drivers Trends in alcohol and drug-impaired driving MANITOBA Deaths in alcohol-related crashes Alcohol in fatally injured drivers Drivers involved in alcohol-related serious injury crashes Drug use among fatally injured drivers Trends in alcohol and drug-impaired driving ONTARIO v
6 8.1 Deaths in alcohol-related crashes Alcohol in fatally injured drivers Drivers involved in alcohol-related serious injury crashes Drug use among fatally injured drivers Trends in alcohol and drug-impaired driving QUEBEC Deaths in alcohol-related crashes Alcohol in fatally injured drivers Drivers involved in alcohol-related serious injury crashes Drug use among fatally injured drivers Trends in alcohol and drug-impaired driving NEW BRUNSWICK Deaths in alcohol-related crashes Alcohol in fatally injured drivers Drivers involved in alcohol-related serious injury crashes Drug use among fatally injured drivers Trends in alcohol and drug-impaired driving NOVA SCOTIA Deaths in alcohol-related crashes Alcohol in fatally injured drivers Drivers involved in alcohol-related serious injury crashes Drug use among fatally injured drivers Trends in alcohol and drug-impaired driving PRINCE EDWARD ISLAND Deaths in alcohol-related crashes Alcohol in fatally injured drivers Drivers involved in alcohol-related serious injury crashes Drug use among fatally injured drivers Trends in alcohol and drug-impaired driving NEWFOUNDLAND AND LABRADOR Deaths in alcohol-related crashes Alcohol in fatally injured drivers Drivers involved in alcohol-related serious injury crashes Drug use among fatally injured drivers Trends in alcohol and drug-impaired driving YUKON Deaths in alcohol-related crashes Alcohol in fatally injured drivers Drivers involved in alcohol-related serious injury crashes Drug use among fatally injured drivers Trends in alcohol and drug-impaired driving NORTHWEST TERRITORIES Deaths in alcohol-related crashes Alcohol use among fatally injured drivers Drivers involved in alcohol-related serious injury crashes vi
7 15.4 Drug use among fatally injured drivers Trends in alcohol and drug-impaired driving NUNAVUT Deaths in alcohol-related crashes Alcohol in fatally injured drivers Drivers involved in alcohol-related serious injury crashes Drug use among fatally injured drivers Trends in alcohol and drug-impaired driving REFERENCES vii
8
9 ACKNOWLEDGEMENTS The Traffic Injury Research Foundation of Canada (TIRF) has compiled data on alcohol use among motor vehicle fatalities since the 1973 calendar year. Beginning in 1995, TIRF has also compiled data on alcohol use in serious injury motor vehicle crashes. All aspects of this work, particularly the development, maintenance, and extension of the Fatality Database and the Serious Injury Database, would have been impossible without the generous support and co-operation of sponsors and collaborating agencies. The maintenance and extension of the Fatality Database and the Serious Injury Database are co-funded by the Public Health Agency of Canada and State Farm. This report was prepared on behalf of the Canadian Council of Motor Transport Administrators. We gratefully acknowledge the following individuals, their organizations and members of their staff for ensuring that complete and accurate data were made available to us: S. Senghera Manager, Road Safety Policy and Programming Insurance Corp. of British Columbia W. Doyle Executive Director Office of Traffic Safety Alberta Transportation R. Brenner Traffic Accident Information System Saskatchewan Government Insurance W.A. Keith Registrar of Motor Vehicles Manitoba Public Insurance H. Francis Director Safety Policy and Education Branch Ontario Ministry of Transportation L. Vézina Directrice des études et des stratégies en sécurité routière Société de l'assurance automobile du Québec C. O Connell Registrar of Motor Vehicles Department of Public Safety New Brunswick L. Lapointe Chief Coroner Office of the Chief Coroner British Columbia A. Sauvageau, M.D. Chief Medical Examiner Alberta Attorney General K. Stewart Chief Coroner Saskatchewan Justice T. Balachandra, M.D. Chief Medical Examiner Manitoba Justice D. Huyer, M.D. Interim Chief Coroner for Ontario Ontario Ministry of the Solicitor General Dre L. Nolet Le coroner en chef Bureau du Coroner Québec G. Forestell Chief Coroner Department of Public Safety New Brunswick ix
10 P. Arsenault Registrar of Motor Vehicles Service Nova Scotia & Municipal Relations Nova Scotia C. Burggraaf Registrar of Motor Vehicles Department of Government Services and Lands Newfoundland and Labrador M. Conway Director Road Licensing and Safety Division Dept. of Transportation Northwest Territories T. Bendera Manager, Motor Vehicles Yukon Department of Motor Vehicles G. Miner Director, Highway Safety Department of Transportation and Public Works Prince Edward Island L. Gee Director, Motor Vehicle Division Nunavut M. Bowes, M.D. Chief Medical Examiner Department of the Attorney General Nova Scotia Dr. S. Avis Chief Medical Examiner Newfoundland and Labrador C. Menard Chief Coroner Department of Justice Northwest Territories K. MacDonald Chief Coroner Yukon Department of Justice H. Khanam, M.D. Director of Laboratory Medicine Queen Elizabeth Hospital Prince Edward Island C. Trainor, M.D. Chief Medical Examiner Prince Edward Island P. Suramala Chief Coroner Nunavut x
11 1.0 INTRODUCTION This report describes the magnitude and characteristics of the alcohol-crash and drug-crash problems in Canada during 2012 as well as trends in these problems. It includes data on alcohol in fatally injured drivers and pedestrians as well as data on drugs in fatally injured drivers derived from the Fatality Database. For the past two and a half decades, the Fatality Database, developed and maintained by the Traffic Injury Research Foundation (TIRF), has provided objective data on alcohol use among persons fatally injured in motor vehicle crashes. Each year, TIRF compiles information from coroner and medical examiners files on the results of toxicological tests for alcohol and drugs in the blood of fatally injured drivers and pedestrians. Given a high testing rate for alcohol in all jurisdictions, particularly among fatally injured drivers, the Fatality Database has proven a valid and reliable source of descriptive data on the magnitude and characteristics of the alcohol-fatal crash problem, a means for monitoring changes/trends in the problem as well as a valuable tool for research on alcohol-impaired driving. Previously, funding for the maintenance of the Fatality Database and the publication of a related report, The Alcohol-Crash Problem in Canada, was co-funded by Transport Canada and the Canadian Council of Motor Transport Administrators (CCMTA). Presently, the data collection component of the Fatality Database is co-funded by the Public Health Agency of Canada and State Farm. This report was prepared on behalf of the Canadian Council of Motor Transport Administrators (CCMTA) who provided funding for its publication. This report also uses supplemental data obtained from police collision reports and coroner files to examine the number and percent of people who died in alcohol-related crashes and the number and percent of drivers testing positive for drugs in Canada. Thus, it extends the focus beyond fatally injured drivers to include all persons killed in road crashes, to provide a better indication of the magnitude and nature of the alcohol-crash problem and drug-crash problem. This report also examines alcohol involvement in those crashes in which someone was seriously injured but not killed. For this purpose, relevant information is derived from a Serious Injury Database that is constructed and maintained by TIRF. Funding for the construction of the Serious Injury Database was initially provided by Transport Canada and CCMTA as part of a previous project. The continued support of the Serious Injury Database is provided by the Public Health Agency of Canada and State Farm. Since few drivers involved in serious injury crashes are tested for alcohol, a surrogate or indirect measure is used to assess the incidence of alcohol involvement in these crashes. The report is divided into the following fifteen sections: Section 2.0 briefly describes the sources of the data the Fatality Database and Serious Injury Database and the various indicators of the alcohol-crash problem and drug-crash problem used in this report. Section 3.0 provides descriptive data on the incidence of alcohol involvement in fatal and serious injury crashes and drug involvement in fatal crashes in Canada during 2012 as well as trends in the problem. In subsequent sections (4.0 through 16.0), descriptive data on alcohol involvement in fatal and serious injury crashes and drug use by fatally injured drivers in each province and territory are summarized. Trends 1
12 2 in the problem and comparisons between the period and the baseline period are also examined. Caution should be exercised in interpreting some of the numbers and percentages in Sections 4.0 through 16.0 as some of the subgroups examined are small in number.
13 2.0 DATA SOURCES AND INDICATORS OF THE ALCOHOL-CRASH PROBLEM Information contained in this report was drawn from two national databases compiled and maintained by TIRF and funded jointly by the Public Health Agency of Canada and State Farm. One database contains information on persons fatally injured in motor vehicle crashes; the other has information on persons seriously injured in motor vehicle crashes. These two sources of information are described in this section of the report. The section also describes the various indicators that are used to estimate the magnitude and extent of the alcohol-fatal, alcohol-serious injury and drug-fatal crash problems in Canada during 2012 as well as changes in the problem over the past few years. The indicators include: > the number and percent of people who were killed in crashes that involved alcohol; > the number and percent of fatally injured drivers who had been drinking; > the number and percent of fatally injured pedestrians who had been drinking; > the number and percent of drivers in serious injury crashes that involved alcohol; and, > the number and percent of fatally injured drivers who were positive for drugs. 2.1 Sources of the data Two national databases were used to generate the statistics for this report the Fatality Database and the Serious Injury Database. The Fatality Database was initially developed in the early 1970s to provide a comprehensive source of objective data on alcohol use among persons fatally injured in motor vehicle crashes occurring on and off public highways in Canada. It is historically intact from 1973 to 2011, inclusive, for seven provinces British Columbia, Alberta, Saskatchewan, Manitoba, Ontario, New Brunswick, and Prince Edward Island. Beginning with 1987, data are available from all jurisdictions in Canada. The Serious Injury Database was initially constructed in the mid-1990s to examine the incidence of alcohol in crashes that involve a serious injury i.e., a crash that resulted in a person being admitted to a hospital. It was originally used as a means to assess the extent to which the federal-provincial/territorial Strategy to Reduce Impaired Driving initiatives (STRID 2001, STRID 2010 and now STRID 2015) achieved a reduction in alcohol-related serious injury crashes. Since 1995, relevant information on crashes that involve serious injury has been assembled from all jurisdictions in Canada The Fatality Database. The Fatality Database consists of case files (records) of persons fatally injured in motor vehicle crashes. Two sources of information provide data for most case files: (1) police reports on fatal motor vehicle collisions and (2) coroners and medical examiners reports. In general, both sources must be accessed to obtain complete data on victims, crashes, vehicles, and toxicology. 3
14 Police-reported data include characteristics of the victim (age and sex, position in the vehicle driver, passenger) and details of the crash (type of vehicle(s) and collision, time, date). Objective, toxicological data on alcohol and drug use among victims are obtained from files in coroners' and medical examiners' offices. The alcohol and drug data are the results of chemical tests, performed on body fluid samples (typically blood) by recognized forensic laboratories or other facilities. Uniform and rigorous testing procedures in each jurisdiction ensure reliable and accurate data on the prior use of alcohol and drugs by victims of motor vehicle collisions. As will be discussed in a subsequent section, there is a high rate of testing for alcohol in most jurisdictions, especially among drivers fatally injured in motor vehicle collisions. Details of the method used to access and collect relevant police-reported and coroner/medical examiner data on persons fatally injured in motor vehicle collisions as well as the approach used to create case files for the Fatality Database are contained in previous annual reports in this series (e.g., see Mayhew et al. 1999). The sections below provide a definition of a motor vehicle fatality, describe the number and type of victim contained in the Fatality Database, and discuss the testing rates for alcohol overall in Canada as well as in each jurisdiction. Motor vehicle fatality. A motor vehicle fatality is defined in the data capture procedures, and in this report, as any person dying within 12 months as a result of injuries sustained in a collision involving a motor vehicle. This is different than the 30 day definition which is typically used by the jurisdictions. Out of 2,159 persons fatally injured in 2012 within 12 months of the collision in Canada, 2,118 (or 98.1%) died within 30 days of the collision. Since this definition of a motor vehicle fatality differs somewhat from those of some coroners/medical examiners and some provincial transportation agencies, the number of fatalities included in the Fatality Database may also differ slightly from those reported by other official sources (see Mayhew et al for a description of how these agencies define motor vehicle fatalities). The fatality data reported in Section 2 includes those persons dying within 12 months of the collision. However, in order to increase the compatibility of this report with other sources, data are provided for both victims dying within 12 months of the collision and those dying within 30 days of the collision in Sections 3 thru 16. Number of fatalities: Official sources compared to the Fatality Database. The Fatality Database contains information on 2,159 persons fatally injured in motor vehicle collisions in Canada during 2012 (excluding British Columbia). This figure is higher than the number that would be obtained by adding together the fatalities officially reported in each jurisdiction in Canada. A key explanation of why the Fatality Database comprises more cases than those identified by transportation agencies is due to historical differences in reporting procedures. TIRF has included persons dying within 12 months (365 days) of the collision whereas transportation agencies have included persons dying within 30 days of the collision. To address this issue, several sections of this report provide data for both victims dying within 12 months and 30 days of the collision. There are several other explanations why the Fatality Database has more cases than the transportation agencies. Cases that are not captured by transportation agencies yet account for fatalities within the Fatality Database include the following: 4
; > Victims in collisions which occur on private property, crown land, First Nations lands, or government property; > Victims")
15 > Victims of motor vehicle crashes that occurred off-road (e.g., ATV, dirt bike, snowmobile, farm tractors, industrial motor vehicles); > Victims in collisions which occur on private property, crown land, First Nations lands, or government property; > Victims involved in a collision in one jurisdiction that die in another jurisdiction; > Victims involved in a collision in one year that die in the subsequent year (e.g., collide in 2011, die in 2012), provided that the date of death is within 12 months (365 days) of the collision; and, > Victims identified by the coroner/medical examiner that were coded as an injury or omitted from transportation agency databases (procedures for data collection available to coroners and medical examiners can be more robust and conducive to avoiding the underreporting of crashes). Figure 2-1 provides a comparison of the number of traffic fatalities reported by transportation agencies with the number of motor vehicle fatalities included in the Fatality Database for For most of the jurisdictions, the number of cases in the TIRF database is higher than that officially reported by transportation agencies. Data shown exclude British Columbia, whose 2012 fatality data were not available at the time of the publication of this report. Type of victim. The Fatality Database contains information on three types of victims fatally injured in motor vehicle crashes drivers/riders, passengers, and pedestrians. Drivers include operators of all types of vehicles, both on road (automobiles, trucks/vans, motorcycles, buses, emergency vehicles) and off-road (bicycles, all-terrain vehicles, dirt bikes, snowmobiles, and farm tractors). Similarly, passengers include other 5

16 vehicle occupants as well as persons riding on vehicles (motorcycles, bicycles, ATVs) but not driving or operating them. And, finally, pedestrians are those individuals travelling on foot that were struck and fatally injured by a motor vehicle. In Canada during 2012, almost 2 out of every 3 fatalities were operators of motor vehicles (64.6%); 20.0% were passengers; and 15.4% were pedestrians. From this perspective, vehicle occupants, particularly drivers, remain the major road-user group of concern. Testing rates for alcohol. The inclusion of objective data on the presence of alcohol among traffic victims represents an important feature of the Fatality Database. The value of this information depends greatly on the frequency with which tests for the presence of alcohol are performed on the body fluids of victims. In Canada during 2012, fatally injured drivers were tested most frequently (83.1%), followed by pedestrians (65.5%) and passengers (38.5%). The testing rate among fatally injured pedestrians and passengers increases slightly if victims under the age of 16, who are less often tested, are excluded (68.6% and 40.2%, respectively). Testing rates also increase among fatally injured pedestrians if the analyses focus only on persons dying less than six hours after the crash (applying this restriction, the testing rate among pedestrians increases to 82.2%). The rate of testing for alcohol varies not only as a function of the type of victim but by jurisdiction as well. This is illustrated graphically in Figure 2-2, which shows the rate of testing for alcohol among fatally injured drivers in the various jurisdictions. Most jurisdictions test over 80.0% of the driver fatalities. In some jurisdictions, there is clearly room for improvement the testing rates need to be increased to enhance the reliability and utility of the information. In those jurisdictions with a high rate of testing for fatally injured drivers, there are various reasons why tests are not done on some drivers. This occurs, for example, when the victim survived the initial crash and died much later the alcohol results at that time would be of little value. Or, if extensive transfusions were given to the victim prior to death, there is little point in taking a blood sample for an 6

17 alcohol test. And, if the victim were incinerated in a vehicle fire, or massive injuries resulted in exsanguination (i.e., excessive loss of blood), body fluids may not be available for testing. Figure 2-3 shows the rate of testing for alcohol among fatally injured pedestrians in the various jurisdictions. As can be seen, there is considerable variation in the rate of testing from 50.0% in Nova Scotia and Newfoundland and Labrador to 100.0% in Prince Edward Island and the Northwest Territories The Serious Injury Database. The Serious Injury Database contains information on persons seriously injured in crashes and on all drivers involved in these crashes, whether the driver was injured or not. The data come from motor vehicle crash reports completed by investigating police officers. The information compiled for each seriously injured person and crash-involved driver includes: personal characteristics (age and sex); factors contributing to the crash, including police-reported alcohol involvement; type of vehicle driven/occupied (e.g., automobile, truck/van, motorcycle) and the details of the crash (time, date, type of collision multiple vehicle/single vehicle). To construct the database, annual motor vehicle collision data are obtained from each jurisdiction in Canada. These data are either provided to TIRF by the relevant agency in the jurisdiction or, in some cases, provided to TIRF by Transport Canada who received the collision data from the jurisdiction. Relevant information on collisions in which someone was seriously injured is extracted from the provincial/territorial data files and then aggregated into the national Serious Injury Database. The Serious Injury Database provides data from 1995 to 2012 for most jurisdictions. Only since 1998 in the Yukon and 2005 in British Columbia have investigating officers been able to record on the police report form whether the crash involved a serious injury or, at the person level, the severity of the injury a person sustained in the crash. Accordingly, it was not possible to identify persons who sustained a serious injury or drivers involved in serious injury crashes in those jurisdictions prior to the dates indicated. For this reason, the Canadian trend data presented in Section include only data from 2005 to However, for other jurisdictions, trend data are available since
18 In the case of British Columbia (17.6%), Newfoundland and Labrador (2.9%), and the Northwest Territories (2.7%), some injury severities are recorded as unspecified, so the number of drivers in serious injury crashes used in this report for these three jurisdictions might be underestimated. The sections below provide a definition of a serious injury crash, describe the number and type of cases contained in the Serious Injury Database, and discuss the use of a surrogate or indirect measure to assess alcohol involvement in these crashes. Serious injury. A serious injury crash is one that resulted in at least one person being admitted to a hospital. The serious injury may have been sustained by a driver, passenger or pedestrian involved in the crash (i.e., the driver involved in a serious injury crash may not have been the person seriously injured). Number of cases. In Canada during 2012, 10,921 persons were seriously injured in motor vehicle crashes; 13,569 drivers were involved in these crashes. These numbers for Canada exclude Nunavut because data on serious injury cases were not available at the time this report was being prepared. Table 2-1 shows the number of drivers for each province and territory. Ontario accounts for the largest number of the drivers involved in serious injury crashes (3,450 drivers or 25.4% of the national total); the Northwest Territories account for the lowest number of drivers in such crashes, 13 drivers (or 0.1% of all drivers). Table 2-1 Number and Percent of Drivers Involved in Serious Injury Crashes in Each Jurisdiction: Canada, 2012 Jurisdiction Number % of of Drivers Total British Columbia 2, Alberta 3, Saskatchewan Manitoba Ontario 3, Quebec 2, New Brunswick Nova Scotia Prince Edward Island Newfoundland and Labrador Yukon Territory Northwest Territories Nunavut* TOTAL 13, * Data not available at time of publication. Type of cases. The Serious Injury Database includes information on persons who sustained a serious injury in a motor vehicle crash and information on all drivers involved in these crashes. Drivers include operators of all types of vehicles: automobiles, trucks/vans, motorcycles, bicycles, all-terrain vehicles, dirt bikes, and snowmobiles. It should be noted that analysis of the vehicle occupied by drivers in Canada involved in serious injury crashes in 2012 excludes Quebec. Since March 2010, Quebec has regrouped automobiles and light trucks into a single category in its collision data. Of all the drivers involved in serious injury crashes: 8
19 almost half were automobile drivers (47.6%); one-third were truck/van drivers (33.5%); 8.7% were motorcycle riders; 5.0% were off-road vehicle drivers (e.g., snowmobiles, all-terrain vehicles, dirt bikes); 3.4% were tractor-trailer drivers; and 1.2% were drivers of other types of highway vehicles (e.g., buses, emergency vehicles). A surrogate measure of alcohol involvement. Drivers in serious injury crashes are seldom tested for alcohol. The investigating police officer may, however, indicate the condition of each of the drivers involved in the crash (e.g., whether or not they had been drinking), or in the case of Quebec, if alcohol was a probable cause in the crash. Unfortunately, a judgement by police about the drivers use of alcohol is not always made. In addition, the investigating police officer may determine that some other factor e.g., driver fatigue, medical or physical defect would more accurately describe the condition of the driver. Thus, relying exclusively on police-reported alcohol involvement would underestimate the magnitude of the alcohol-related serious injury crash problem. To overcome this data limitation, a surrogate or indirect measure of alcohol involvement is used in this report. A description of this surrogate measure is provided in the next section. 2.2 Indicators of the problem The indicators used to describe the magnitude and nature of the alcohol-related fatal and serious injury crash problem include: > the number and percent of people who are killed in alcohol-related crashes; > the number and percent of fatally injured drivers who had been drinking or were legally impaired; > the number and percent of pedestrians who had been drinking; > the number and percent of drivers in serious injury crashes that involved alcohol. In addition, the following indicator is used to describe the magnitude and nature of the drug-crash problem: > the number and percent of fatally injured drivers who were positive for drugs. Each of these indicators of the problem is described briefly below The number and percent of people killed in alcohol-related crashes. For each person killed in a motor vehicle crash, it was possible to determine if alcohol was a factor in the crash. A motor vehicle fatality was considered to be alcohol-related if there was at least one drinking driver or drinking pedestrian in the fatal crash. To determine if alcohol was involved in the fatal crash, information on the BAC of fatally injured drivers and pedestrians from the Fatality Database was supplemented with any other evidence of alcohol in the fatal crash identified from either the coroner s report or from the police collision report e.g., the police reported that a driver or pedestrian in the fatal crash had consumed alcohol. The review of coroner files and police reports provided information on the presence of alcohol among drivers who died but were not 9
20 chemically tested for alcohol; drivers who survived (virtually all of whom are not tested), and pedestrians who were not tested. Among all the people who died in motor vehicle crashes both on- and off-road in Canada during 2012, it was possible to determine if alcohol was a factor in the crash in 91.8% of the cases. In addition, for Canada and each jurisdiction, this report describes characteristics and trends in the number of deaths in crashes involving a drinking driver. This particular indicator only considers a fatality to be alcohol-related if at least one driver (either killed or surviving) had been drinking. For this variable, only fatalities occurring on public roadways are included. Furthermore, at least one of the vehicles involved must be a principal highway vehicle (e.g., automobile, truck, van, motorcycle, tractor trailer, etc.). Among the people who died in motor vehicles crashes on public roadways that involved at least one principal highway vehicle, it was possible to determine if a drinking driver had been involved in 93.1% of the cases The number and percent of fatally injured drivers who had been drinking. The magnitude of the alcohol-fatal crash problem is usually stated in terms of the number and percent of fatally injured drivers who were positive for alcohol. As mentioned previously, this indicator of the problem is useful because of its validity and because the requisite data have been routinely compiled each year as part of the Fatality Database project. The indicator is a highly valid and reliable measure of the problem because almost all drivers who are killed in crashes are tested for the presence of alcohol i.e., similar to previous years, there was a high testing rate in Canada during 2012, with 83.2% of fatally injured drivers being tested for alcohol. Although it is not provided in Sections 2 and 3 of this report, some trend tables and figures dealing with alcohol use among fatally injured drivers is limited to those drivers who died within six hours of the collision. The six-hour window is used since it represents the average amount of time that would be required for drivers with BACs of 80 mg% to metabolize the alcohol in their bloodstream The number and percent of fatally injured pedestrians who had been drinking. Drinking pedestrians not just drinking drivers contribute to the overall magnitude of the alcohol-fatal crash problem each year in Canada. This occurs because walking on or beside the highways after drinking is extremely risky. Accordingly, this report uses information from the Fatality Database to examine the number and percent of fatally injured drinking pedestrians. This is possible because testing for alcohol, especially among those over 16 years of age is reasonably high 65.5% overall, which increases to 68.6% if victims under the age of 16 are excluded. Descriptive data on fatally injured drinking pedestrians are provided in the Canada section (3.0) but not in the provincial/territorial sections (4.0 through 16.0) of the report. The number of fatally injured pedestrians in most jurisdictions is relatively small, so detailed results for these jurisdictions would not be reliable. Jurisdictional results are also not reported to protect privacy. However, data on the overall incidence of fatally injured drinking pedestrians in each jurisdiction are presented in the Canada section of the report (3.3). 10
21 2.2.4 The number and percent of drivers in serious injury crashes that involved alcohol. The extent to which alcohol is involved in serious injury crashes is not well documented and, consequently, poorly understood for two primary reasons. First, drivers involved in such crashes are seldom tested for the presence of alcohol. Second, investigating police officers do not always report the presence of alcohol in these crashes see Mayhew et al. (1997) for a discussion of the limitations of information on alcohol involvement contained in police collision reports. For these reasons, a surrogate or indirect measure of the alcohol-related serious injury crash problem has been used. A driver is identified as having been involved in an alcohol-related serious injury crash if the crash in which someone was seriously injured involved a single vehicle at night, from 9:00 pm to 6:00 am (SVN), or if, in the case of a non-svn serious injury crash, the police reported alcohol involvement i.e., at least one drinking driver in the crash. Surrogate measures have been shown to correlate strongly with more direct measures of the alcohol-crash problem e.g., the number of drinking driver fatalities as determined by chemical tests in blood and provide a reasonably reliable estimate of trends in alcohol-related serious injury crashes. Such measures, however, have limited validity i.e., not all drinking drivers are identified so this measure likely provides a conservative estimate of the magnitude of the problem (see Mayhew et al. 1997) The number and percent of fatally injured drivers who were positive for drugs. The magnitude of the drug-fatal crash problem is usually stated in terms of the number and percent of fatally injured drivers who tested positive for drugs. This indicator of the problem has become more valid as more historical data on this indicator have been compiled in TIRF s Fatality Database. The indicator is a relatively reliable measure of the problem as a growing percentage of drivers who are killed in crashes are tested for the presence of drugs i.e., similar to previous years, there was a respectable testing rate in Canada during 2012, with 75.3% of fatally injured drivers being tested for drugs. The rate of testing for alcohol varies by jurisdiction. Figure 2-4 shows the rate of testing for drugs among fatally injured drivers in the various jurisdictions. Testing rates vary from 50.0% in Nunavut to 100.0% in the Yukon. 11

22 Not only does the Fatality Database capture information on whether or not a driver tests positive for drugs. Data are also collected to indicate the type of drug or drugs that are found in the blood sample of a fatally injured driver. These drugs can include illicit, prescription, and over-the-counter drugs as many different types of drugs adversely affect driving performance. Drug Evaluation Classification (DEC) programs, used by police services throughout North America categorize drugs into the various groups on the basis of common signs and symptoms exhibited by persons using these drugs (Jonah, 2012). This report uses these categories which are: > Cannabis; > Central nervous system depressants (e.g., benzodiazepines and antihistamines); > Central nervous system stimulants such as cocaine, amphetamine, methamphetamine, and ecstasy (MDMA); > Hallucinogens (e.g., LSD, magic mushrooms); > Dissociative anesthetics such as ketamine and phencyclidine (PCP); > Narcotic analgesics (e.g., morphine, heroin, methadone, codeine, oxycodone); and, > Inhalants (e.g., toluene, gasoline, cleaning solvents). In Section 3.5 and corresponding sections for each jurisdiction, tables are provided to show how many drivers tested positive for each of the afore-mentioned drug categories. Although there is no recognized average interval of time for a driver to metabolize drugs in his/her bloodstream, some jurisdictional trend tables and figures dealing with drug use among fatally injured drivers is limited to those drivers who died within six hours of the collision. The six-hour window is used to compare the same sample of drivers who were tested for alcohol. 12
23 3.0 CANADA This section of the report reviews the major findings on alcohol involvement in fatal and serious injury motor vehicle collisions as well as drug involvement in fatal motor vehicle collisions in Canada. It describes data on: > people who were killed in alcohol-related crashes (Section 3.1); > alcohol use among fatally injured drivers (Section 3.2); > alcohol use among fatally injured pedestrians (Section 3.3); > drivers involved in alcohol-related serious injury crashes (Section 3.4); > drug use among fatally injured drivers (Section 3.5); and, > trends in the alcohol-crash and drug-crash problems (Section 3.6). 3.1 Deaths in alcohol-related crashes Table 3-1 presents information on people who died in alcohol-related crashes in Canada during 2012 for persons dying within 12 months of the collision (one calendar year) and for persons dying within 30 days of the collision. At the time this report was being prepared, 2012 coroner data from British Columbia were not available. For this reason, 2012 data reported in this section excludes this jurisdiction. This report will be updated when these data become available. Motor vehicle deaths are categorized in terms of the victim s age, gender, type (i.e., driver, passenger, pedestrian) and the type of vehicle they occupied. In each section, the first column in the table presents the number of deaths. The next two columns show the number and percent of these fatalities in which sufficient information was available to determine if alcohol was involved. A motor vehicle fatality was considered to be alcohol involved if there was at least one drinking driver or drinking pedestrian in the fatal crash. For example, within the first section, it can be seen that among persons dying within 12 months of the collision, 207 people aged were killed in motor vehicle crashes in Canada during And, in 193 cases (93.2%) it was possible to determine if alcohol was a factor in the crash. The next column shows the number of people killed in crashes that were known to be alcohol-involved. For example, 75 people aged died in alcohol-related crashes in Canada during The next column expresses this as a percentage i.e., 38.9% of the year olds who were killed died in an alcohol-related crash. The final column (percent of all alcohol-related deaths) expresses the number of deaths in alcohol-related crashes as a percent of all the deaths in such crashes. For example, the alcohol-related deaths among year olds represent 10.6% of all the people killed in alcohol-related crashes in Canada during An examination of the section for persons dying within 30 days of the collision shows that 205 persons aged died in motor vehicle crashes. In 191 of these cases (93.2%), it was possible to determine if alcohol 13
24 was a factor in the crash. Among these persons, 74 (38.7%) were alcohol-related deaths. And year olds accounted for 10.5% of people dying in alcohol-related crashes. The totals at the bottom of the table provide a summary. As can be seen, 2,159 persons died within 12 months of a motor vehicle crash in Canada during In 1,984 (91.9%) of these cases, it was possible to determine if alcohol was a factor. Of these known cases, 707 (35.6%) involved alcohol. Extrapolating this figure to the total number of motor vehicle fatalities (2,159 x.356) it can be estimated that in Canada (excluding British Columbia) during 2012, 769 persons died in alcohol-related crashes within 12 months of the collision. Category of Victim Age Group < > Gender No. of Deaths Male Female Victim Type Driver/ Operator Passenger Pedestrian Unknown Vehicle Occupied Automobiles Trucks/Vans Motorcycles Other Hwy Vehicles Off-road Vehicles (Pedestrians) unknown Collision Location Public Road Off-road TOTAL * excluding British Columbia Table 3-1 Deaths in Alcohol-Related Crashes: Canada, 2012* Persons Dying Within 12 Months of Collision Alcohol Use Known % of No. total Alcohol-Related Deaths (ARDs) % of % of all No. known ARDs Persons Dying Within 30 Days of Collision No. of Deaths Alcohol Use Known % of No. total Alcohol-Related Deaths (ARDs) % of known % of all ARDs Among the 2,118 persons dying within 30 days of the collision, it was possible to determine if alcohol was a factor in 92.5% of the cases. Of these known cases, 703 (35.9%) involved alcohol. Extrapolating this figure to No. 14
 it can be estimated that in Canada (excluding British Columbia) during 2012, 760 persons died in alcohol-related crashes within 30 days of the collision. 3.1.1 Victim age.")
25 the total number of motor vehicle fatalities (2,118 x.359) it can be estimated that in Canada (excluding British Columbia) during 2012, 760 persons died in alcohol-related crashes within 30 days of the collision Victim age. Of all the people who died in alcohol-related crashes within 12 months of the collision (see last column in the first section), 22.5% were aged 26-35; 22.2% were aged 20-25; 16.5% were aged 46-55; 16.0% were aged 36-45; 11.5% were over 55; and 10.6% were aged The youngest (<16) group accounted for only 0.7% of all people who died in alcohol-related crashes. Figure 3-1 shows the percent of alcohol-related deaths within each age group. The highest incidence of alcohol involvement occurred in the crashes in which persons aged and died (53.0% and 49.8%, respectively). The lowest incidence of alcohol involvement was found among the youngest and oldest fatalities as only 7.6% of persons under 16 and 14.2% of persons over 55 years of age died in crashes involving alcohol Gender. Of all the people who died in alcohol-related crashes within 12 months of the collision, 80.1% were males. The incidence of alcohol in crashes in which a male died (39.9%) was greater than the incidence of alcohol in crashes in which a female died (24.9%) Victim type. Of all the people who died in alcohol-related crashes within 12 months of the collision, 66.3% were drivers/operators of a vehicle; 19.4% were passengers; and 14.3% were pedestrians. Within each of these victim types, there are some differences in alcohol involvement. Among the principal victim types, the highest incidence of alcohol involvement (36.2%) occurred in the crashes in which a pedestrian died. Alcohol was involved in 35.6% of the crashes in which a driver/operator died and 35.5% of those in which a passenger died Type of vehicle occupied. Of all the people who died in alcohol-related crashes within 12 months of the collision, two-fifths (38.6%) were in an automobile; 25.6% were in a truck/van; 15.1% were on an offroad vehicle (e.g., bicycle, snowmobile, all-terrain vehicle); and 5.4% were on a motorcycle. 15
26 The incidence of alcohol involvement in which a truck/van occupant died was greater than the incidence of alcohol in crashes in which an automobile occupant died (41.4% versus 32.0%). The incidence of alcohol involvement in which a motorcycle occupant died was 24.7%. Alcohol was involved in 48.2% of the crashes in which an off-road vehicle occupant died Collision location. Of all the people who died in alcohol-related crashes within 12 months of the collision, 88.3% died in a collision which occurred on a public road and 11.7% died in an off-road collision. However, the incidence of alcohol involvement in which a victim died in an alcohol-related crash was greater for those dying in off-road collisions (51.6%) than it was for persons dying in a collision which occurred on a public road (34.2%). 3.2 Alcohol in fatally injured drivers This section presents information on the presence of alcohol, exclusively among drivers fatally injured in Canada during At the time this report was being prepared, 2012 coroner data from British Columbia were not available. For this reason, 2012 data reported in this section excludes this jurisdiction. Table 3-2 shows the information by age group, gender, vehicle type, collision type (single vs. multiple), and duration between crash time and death time (within 12 months vs. within 30 days of the collision). The data are presented for drivers of the principal types of vehicles (i.e., automobiles, trucks, vans, motorcycles, tractortrailers) who died in public road and off-road collisions. The first column in the table shows the number of drivers killed. The next two columns show the number and percent of these victims who were tested for alcohol. The remaining columns provide information on the results of the alcohol tests this includes the percent of those tested who were positive for alcohol in each of five blood alcohol concentration (BAC) levels. To illustrate, among year olds there were 185 drivers killed during 2012; 160 of these fatally injured drivers (86.5%) were tested for alcohol. Of those who were tested, 57.5% showed no evidence of alcohol, 3.1% had BACs below 50 mg%, 3.8% had BACs from 50 to 80 mg%, 8.8% had BACs from 81 to 160 mg%, and 26.9% had BACs over 160 mg%. The main findings are shown by the totals at the bottom of the table. As can be seen, there were 1,172 drivers fatally injured in traffic crashes in Canada during The overall rate of testing for alcohol in drivers was 84.1%, slightly higher than the rate in 2011 (82.5%). Among tested drivers in Canada: > 66.7% showed no evidence of alcohol as 33.3% had been drinking; > 3.1% had BACs from 1-49 mg%; > 1.6% had BACs from mg% > 7.2% had BACs from 81 to 160 mg%; and, > 21.3% had BACs over 160 mg%. Thus, 33.3% of fatally injured drivers in Canada had been drinking and 85.7% of fatally injured drinking drivers had BACs over 80 mg%. 16
27 Age Category Number Drivers Tested Percent of Tested Drivers with BACs of: of of % of Number Driver Drivers* total Zero >160 <20** > Gender Table 3-2 Alcohol Use Among Fatally Injured Drivers of Highway Vehicles: Canada, 2012 (excluding British Columbia) Male Female Vehicle Type Automobile Motorcycle Tractor Trailer Heavy Truck Van Light Truck Other Truck Other Hwy. Vehicle Collision Type Single-Vehicle Multiple-Vehicle Duration Between Crash and Death Time Within 30 Days > 30 Days TOTAL * Excludes operators of bicycles, snowmobiles, farm tractors and other non-highway vehicles. ** Drivers in multiple age groups have been aggregated to ensure that an individual will not be identified. 1 Trucks over 4500 kg. 2 e.g., pickup trucks. 3 Motorhomes, utility vehicles, plows and trucks of unknown type. 4 Emergency vehicles and buses. Note: The vehicle types that appear in the shaded area correspond to the truck/van category used in the jurisdictional sections of this report. In Figure 3-2, the BAC distribution for tested fatally injured drivers is extrapolated to reflect the BAC distribution for all fatally injured drivers. In this figure, 389 of 1,172 drivers (33.2%) have a positive BAC. And among fatally injured drinking drivers, 334 (85.9%) have BACs over 80 mg%. 17


28 3.2.1 Age differences. Figures 3-3 and 3-4 summarize the data from Table 3-2 for the various age groups. Figure 3-3 shows the percent of all drinking drivers accounted for by each age group. The bar on the left shows the percent of all fatally injured drivers with any evidence of alcohol accounted for by each age group. On the right is shown the percent of legally impaired drivers BACs over 80 mg% accounted for by each age group. Drivers under 16 are not included because very few of them had been drinking. Of all the fatally injured drinking drivers, 28.1% were aged 26-35; 20.8% were aged 20-25; 17.7% were aged 46-55; 16.5% were aged 36-45; and 9.5% were over 55. Those aged accounted for only 7.3% of the fatally injured drinking drivers. Of all the fatally injured legally impaired drivers (i.e., those with BACs over 80 mg%), 29.5% were aged 26-35; 20.3% were aged 20-25; 18.5% were aged 46-55; 17.1% were aged 36-45; and 8.2% were over 55. Those aged accounted for only 6.4% of fatally injured drivers who were over the legal limit. Figure 3-4 presents the information in a slightly different manner. For each age group, the percentage of drivers who were sober (zero BAC) is shown by the lower, black portion of the bar; the percent who were 18

29 positive for alcohol but whose BAC was below the legal limit (1-80 mg%) is shown by the white section in the middle, and the percent with BACs over the legal limit (>80 mg%) is shown by the upper, grey part of the bar. Fatally injured drivers age were the most likely to have been drinking 52.3% of drivers in this age group had been drinking. By contrast, only 11.7% of tested drivers over age 55 had been drinking Gender differences. Males dominate the picture they account for 84.4% of all the fatally injured drivers who had been drinking and 84.3% of all of the fatally injured drivers who were legally impaired. Males dominate the picture largely because they account for 77.4% of the drivers who are killed (907 of the 1,172 fatalities are males). A comparison in the prevalence of alcohol use among male and female fatally injured drivers is shown in Figure 3-5. The pie chart shows within each gender, the percent who were sober (i.e., 0 BAC) and positive for alcohol (+ BAC). The bar to the right of the pie chart shows the distribution of alcohol levels found among those who were drinking the percent who had alcohol levels above and below the legal limit. Percentages are given inside the figures; the absolute number of cases is shown adjacent to the figure. Fatally injured male drivers were considerably more likely to have been drinking than female drivers (35.9% and 23.8%, respectively). And, most of the male and female drivers who were drinking had BACs over the legal limit (85.6% and 86.3%, respectively). 19
30 3.2.3 Vehicle differences. Table 3-3 shows the number and percent of drinking and legally impaired drivers accounted for by drivers of different types of vehicles. Of all the fatally injured drinking drivers (i.e., those with a positive BAC), 51.5% were automobile drivers; 29.6% were light truck drivers; 10.4% were motorcycle riders; 7.3% were van drivers; and 1.2% were tractor-trailer drivers. Of all the fatally injured legally impaired drivers (i.e., those with BACs over 80 mg%), 52.7% were automobile drivers; 31.3% were light truck drivers; 8.5% were motorcycle riders; 6.8% were van drivers; and 0.7% were tractor-trailer drivers. Table 3-3 Number and Percent of Fatally Injured Drinking and Legally Impaired Drivers Accounted for by Drivers* of Different Vehicle Types: Canada, 2012 Vehicle Number of % of All Number of Legally % of All Legally Type Drinking Drivers Drinking Drivers Impaired Drivers Impaired Drivers Automobile Motorcycle Tractor-Trailer Heavy Truck Van Light Truck TOTAL * Excludes operators of bicycles, snowmobiles, farm tractors and other non-highway vehicles. 1 Trucks over 4500 kg. 2 e.g., pickup trucks. 20
; motorcycle riders and drivers of light trucks (Figure 3-6b); and drivers of heavy trucks and tractor-trailers (Figure 3-6c). A common format is used in all cases.")
31 Figures 3-6a, 3-6b and 3-6c summarize the results of alcohol tests for drivers fatally injured in 2012 according to the type of vehicle being operated: automobile drivers and drivers of vans (Figure 3-6a); motorcycle riders and drivers of light trucks (Figure 3-6b); and drivers of heavy trucks and tractor-trailers (Figure 3-6c). A common format is used in all cases. The pie chart shows the number and percent of drivers who were sober as well as the number and percent of drivers who had been drinking. The bar chart displays the BAC distribution among those who were positive for alcohol. Among fatally injured automobile drivers, 31.5% had been drinking. Of those who were drinking, the vast majority (87.6%) had alcohol levels in excess of the legal limit. Among fatally injured van drivers, 32.9% had been drinking and most (79.2%) of these had BACs over the legal limit. Among motorcycle riders, 26.6% had been drinking and 70.6% of these had BACs over the legal limit. The highest incidence of drinking was found among drivers of light trucks 46.4% had been drinking and 90.7% of these had illegal BACs. Heavy truck and tractor-trailer drivers have a much lower frequency of alcohol involvement. Indeed, 0.0% of heavy truck drivers and 12.9% of tractor-trailer drivers had been drinking. Among those fatally injured tractor-trailer drivers who had been drinking, 50.0% had BACs over the legal limit. 21
.")

32 22 Figures 3-6d and 3-6e present similar information on the incidence of drinking among drivers operating recreational vehicles (results for these vehicle types are not included in Tables 3-2 or 3-3). As can be seen, the lowest incidence of drinking was found among bicyclists as only 26.5% of fatally injured bicyclists had been drinking at the time of the collision. Among those bicyclists who had been drinking, 84.6% had BACs over the legal limit. Among snowmobile drivers, 72.7% had been drinking and 78.1% had BACs over the legal

. The reason for this apparent disparity is because alcohol is overrepresented in single-vehicle crashes.")
.")
33 limit. Operators of off-road vehicles (ATVs, dirt bikes, etc.) were less likely than snowmobile drivers to have been drinking (60.0%) and 90.2% of these drinking drivers had BACs over the legal limit Collision differences. Less than half of all drivers killed (537 out of 1,172, or 45.8%) were involved in single-vehicle collisions but these crashes accounted for over two-thirds of the drivers who had been drinking or were legally impaired (70.4% and 74.0%, respectively). The reason for this apparent disparity is because alcohol is overrepresented in single-vehicle crashes. As shown in Figure 3-7, over half of the drivers involved in single-vehicle crashes (51.9%) were positive for alcohol, compared to only 17.9% of those involved in multiple-vehicle collisions. Most drinking drivers in single-vehicle crashes had BACs over the legal limit (90.0%). Among drinking drivers in multiple-vehicle crashes, 75.3% had BACs over the legal limit. 23

34 3.2.5 Duration between crash and death time. Given that only 13 fatally injured drivers died more than 30 days after the collision, and only two of these drivers was tested for alcohol, a comparison of alcohol use among drivers based on differences in the duration between crash time and death time cannot be performed. 3.3 Alcohol in fatally injured pedestrians This section presents information on the presence of alcohol among pedestrians fatally injured as a result of being hit by a motor vehicle in Canada during At the time this report was being prepared, 2012 coroner data from British Columbia were not available. For this reason, 2012 data reported in this section excludes this jurisdiction. Table 3-4 shows the information by age group, gender and jurisdiction. The first column in the table shows the number of pedestrians killed. The next two columns show the number and percent of these victims who were tested for alcohol. The remaining columns provide information on the results of the alcohol tests this includes the percent of those tested who were positive for alcohol in each of five BAC levels. During 2012, as shown by the totals at the bottom of the table, there were 333 pedestrians fatally injured; 218 (65.5%) of these pedestrians were tested for the presence of alcohol. Among tested pedestrians: > 60.1% showed no evidence of alcohol as 39.9% had been drinking; > 2.3% had BACs below 50 mg%; > 0.9% had BACs from 50 to 80 mg%; > 8.3% had BACs from 81 to 160%; and 24
35 > 28.4% had BACs over 160 mg%. Thus, 39.9% of fatally injured pedestrians had been drinking and most of these had BACs over 80 mg%. Age Category Number Pedestrians Tested Percent of Tested Pedestrians with BACs of: of of % of Number Pedestrian Pedestrians total Zero >160 < > Gender Table 3-4 Alcohol Use Among Fatally Injured Pedestrians: Canada, 2012* Male Female Jurisdiction Alberta Saskatchewan Manitoba Ontario Quebec New Brunswick Nova Scotia Prince Edward Island NL/NT** TOTAL * Excluding British Columbia. * Newfoundland and Labrador and the Northwest Territories (NL/NT) have been aggregated to protect the identity of one of the pedestrians Age difference. Of all the fatally injured pedestrians, two-fifths (39.0%) were over 55 years of age (130 of the 333 pedestrian fatalities). The oldest pedestrians, however, accounted for a much smaller portion of the drinking pedestrians and those with BACs over 80 mg%. This is illustrated in Figure 3-8. The figure shows the percent of all drinking pedestrians accounted for by each age group. The bar on the left shows the percent of all fatally injured pedestrians with any evidence of alcohol accounted for by each age group. On the right is shown the percent of pedestrians with BACs over 80 mg% accounted for by each age group. Of all the fatally injured drinking pedestrians, 25.3% were aged 26-35; 23.0% were aged 20-25; 16.1% were aged 46-55; 14.9% were aged 16-19; and 10.3% were aged and over 55. Of all the fatally injured pedestrians with BACs over 80 mg%, 25.0% were aged and 26-35; 16.3% were aged 46-55; 15.0% were aged 16-19; 10.0% were aged 36-45; and 8.8% were over
 is shown by the lower, dark portion of the bar; the percent who were positive for")

 of all the fatally injured pedestrians who had been drinking, and 81.")
36 Figure 3-9 presents the information in a slightly different manner. For each age group, the percent of pedestrians who were sober (zero BAC) is shown by the lower, dark portion of the bar; the percent who were positive for alcohol but whose BAC was less than or equal to 80 mg% is shown by the white section in the middle, and the percent with BACs over 80 mg% is shown by the upper, grey part of the bar. Fatally injured pedestrians age were the most likely to have been drinking 61.1% of pedestrians in this age group had been drinking. By contrast, only 14.5% of tested pedestrians over age 55 had been drinking Gender differences. Males account for four-fifths (81.6%) of all the fatally injured pedestrians who had been drinking, and 81.3% of all of the fatally injured pedestrians who had BACs over 80 mg%. Males dominate the picture because they account for 64.2% of the pedestrians who are killed (213 of the 332 fatalities are male). 26
37 Figure 3-10 summarizes the findings for alcohol use among fatally injured male and female pedestrians. The pie chart shows the proportion of those pedestrians who were sober (0 BAC) and those positive for alcohol (+ BAC). The bar to the right of the pie chart shows the distribution of alcohol levels found among those who had been drinking; the percent who had BACs above and below 80 mg%. Percentages are given inside the figures; the absolute number of cases is shown adjacent to the figure. Among fatally injured male pedestrians, 47.3% had been drinking and 91.5% of these pedestrians had BACs over 80 mg%. Among fatally injured female pedestrians, 23.5% had been drinking and 93.8% had BACs over 80 mg% Jurisdictional differences. Pedestrians from Newfoundland and Labrador and the Northwest Territories have been regrouped into a single category (NL/NT) to protect the identity of an individual pedestrian. Of all the fatally injured pedestrians, 45.1% were killed in Ontario, 18.9% were killed in Alberta, and 15.6% were killed in Quebec. Alberta accounted for 33.3%, Ontario accounted for 31.0%, and Saskatchewan accounted for17.2% of the fatally injured drinking pedestrians. Alberta accounted for 32.5% and Ontario accounted for 30.0% of the fatally injured pedestrians with BACs over 80 mg%. It should be noted that the figures for drinking and legally impaired pedestrians in Quebec are underestimated because they are based on tested pedestrians and the rate of testing for alcohol is low in this jurisdiction e.g., only 59.6% of pedestrians fatally injured in Quebec were tested, compared to 100.0% in Prince Edward Island, 77.8% in Saskatchewan, and 76.2% in Alberta. As shown in Table 3-4, the highest incidence of alcohol in fatally injured pedestrians, however, was in Saskatchewan (71.4%). The lowest incidence of alcohol in fatally injured pedestrians was in New Brunswick, Nova Scotia and Prince Edward Island where 0.0% had been drinking. 27
38 3.4 Drivers involved in alcohol-related serious injury crashes This section presents information on drivers involved in alcohol-related crashes in which someone was seriously injured in 2012 in Canada, excluding Nunavut because data from this jurisdiction were not available at the time this report was being prepared. A surrogate or indirect measure is used to estimate alcohol involvement because drivers in serious injury crashes are seldom tested for alcohol. A driver is identified as having been involved in an alcohol-related serious injury crash if the crash in which someone was seriously injured involved a single vehicle, at night (SVN), or if, in the case of a non-svn serious injury crash, the police reported alcohol involvement i.e., they noted that at least one drinking driver was involved in the crash. Age Table 3-5 Drivers in Alcohol-Related Serious Injury Crashes: Canada, 2012* Category of Drivers Alcohol-Related % of % of all drivers in Number total alcohol-related crashes < > unknown Gender Male Female unknown Vehicle Type** Auto Truck/Van Motorcycle Tractor Trailer Other Hwy. Vehicle Off-Road Unknown Collision Type Single-Vehicle Multiple-Vehicle TOTAL * Excluding data from Nunavut. Number of Drivers ** Vehicle type section excludes Quebec since this jurisdiction has grouped automobiles and light trucks together in its collision data since March The results are shown in Table 3-5 for drivers grouped in terms of age, gender, type of vehicle driven, and type of collision. The first column shows the number of drivers involved in serious injury crashes. The number and percent of drivers in such crashes that involved alcohol is shown in the next two columns. The final column expresses the number of drivers involved in alcohol-related serious injury crashes in any row as a percent of all drivers involved in alcohol-related serious injury crashes. 28

.")
39 As shown, by the totals at the bottom of the table, 13,569 drivers were involved in crashes in which someone was seriously injured. Among these, 17.1% were alcohol-related crashes Driver age. Of all the drivers involved in alcohol-related serious injury crashes, 23.1% were aged 26-35; 21.8% were aged 20-25; and 14.7% were aged Drivers under the age of 16 accounted for only 0.3% of all those involved in alcohol-related crashes. Figure 3-11 shows for each age group the percent of drivers who were in a serious injury crash that involved alcohol. The highest incidence of alcohol involvement was found for drivers aged (26.1%). The lowest incidence of involvement in alcoholrelated crashes was found for the youngest and oldest age groups of drivers as 8.9% of drivers under 16 and 8.0% of drivers over 55 were in a serious injury crash that involved alcohol Driver gender. Of all the drivers involved in alcohol-related serious injury crashes, 75.6% were males. The incidence of involvement in alcohol-related serious injury crashes was also greater for males than for females (18.8% and 12.4%, respectively) Type of vehicle driven. The numbers and percentages in the vehicle type section exclude Quebec since this jurisdiction has grouped automobiles and light trucks together in its collision data since March Of all the drivers involved in alcohol-related serious injury crashes, 53.1% were automobile drivers and 32.6% were truck/van drivers. Almost one out of five serious injury crashes involving automobile drivers were alcohol related (18.8%). The percentage of involvement in alcohol-related serious injury crashes was 16.5% for truck/van drivers, 13.6% for tractor-trailer drivers, 13.3% for drivers of other highway vehicles, and 12.8% for motorcycle riders. The lowest incidence of involvement in alcohol-related serious injury crashes was found among off-road vehicle drivers (11.1%) Type of collision. Of all the drivers involved in alcohol-related serious injury crashes, 71.8% of them were in single-vehicle crashes. The highest incidence of involvement in alcohol-related serious injury crashes 29
40 was also found among drivers in single-vehicle crashes (36.2%) compared to only 7.3% for drivers involved in multiple-vehicle crashes. 3.5 Drug use among fatally injured drivers This section presents information on the presence of drugs, exclusively among drivers fatally injured in Canada during At the time this report was being prepared, 2012 coroner data from British Columbia were not available. For this reason, 2012 data reported in this section excludes this jurisdiction. Table 3-6 shows the information by age group, gender, vehicle type, collision type (single vs. multiple), and duration between crash time and death time (within 12 months vs. within 30 days of the collision). The data are presented for drivers of the principal types of vehicles (i.e., automobiles, trucks, vans, motorcycles, tractortrailers) who died in public road and off-road collisions. The first column in the table shows the number of drivers killed. The next two columns show the number and percent of these victims who were tested for drugs. The remaining columns provide information on the results of the drug tests this includes the number and percent of those tested who were positive for drugs. As can be seen, in 2012, 77.4% of fatally injured drivers in Canada were tested for drug use. Among fatally injured tested drivers, 363 out of 907 (40.0%) were positive for drugs Age differences. Fatally injured drivers aged were the most likely to have been positive for drugs 45.7% of drivers in this age group were positive for drugs. By contrast, 31.2% of tested drivers over 55 were positive for drugs Gender differences. Males dominate the picture as they account for 79.9% of all the fatally injured drivers who were positive for drugs. Males dominate the picture largely because they account for 77.4% of the drivers who are killed (907 of the 1,172 fatalities are males). Fatally injured male drivers were more likely to have been positive for drugs than female drivers (40.8% and 37.1%, respectively) Vehicle differences. Within each of the principal vehicle types, 47.5% of fatally injured light truck drivers, 40.3% of van drivers, 38.4% of automobile drivers, and 36.8% of motorcyclists tested positive for drugs. Among drivers of principal vehicle types, the lowest percentage of drivers testing positive for drugs were heavy truck drivers (0.0%) and tractor trailer drivers (34.5%) Collision differences. Almost half of the drivers who were killed in single-vehicle collisions (48.2%) tested positive for drugs compared to 33.2% of those involved in multiple vehicle crashes Duration between crash and death time. Given that only 13 fatally injured drivers died more than 30 days after the collision, and only three of these drivers were tested for drugs, a comparison of drug use among drivers based on differences in the duration between crash time and death time cannot be performed. 30
41 Table 3-6 Drug Use Among Fatally Injured Drivers of Highway Vehicles: Canada, 2012 (Excluding British Columbia) Category of Driver Drivers Tested Positive for Drugs Number of % of % of Drivers* Number Number total total Age <20** > Gender Male Female Vehicle Type Automobile Motorcycle Tractor Trailer Heavy Truck Van Light Truck Other Truck Other Hwy. Vehicle Collision Type Single-Vehicle Multiple-Vehicle Duration Between Crash and Death Time Within 30 Days > 30 Days TOTAL * Excludes operators of bicycles, snowmobiles, farm tractors and other non-highway vehicles. ** Drivers in two age groups have been aggregated to ensure that an individual will not be identified. 1 Trucks over 4500 kg. 2 e.g., pickup trucks. 3 Motorhomes, utility vehicles, plows and trucks of unknown type. 4 Emergency vehicles and buses. Note: The vehicle types that appear in the shaded area correspond to the truck/van category used in the jurisdictional sections of this report Types of drugs detected. In Table 3-7, the types of drugs found among fatally injured drivers testing positive for drugs is shown. Among the 363 fatally injured drivers who tested positive for drugs, 45.5% tested positive for cannabis. Other categories of drugs found in fatally injured drivers testing positive for drugs were CNS depressants (36.9%), narcotic analgesics (24.8%), CNS stimulants (23.4%), dissociative anesthetics (1.9%), and hallucinogens (0.3%). 31
42 Table 3-7 Drug Use Among Fatally Injured Drivers of Highway Vehicles: Canada, 2012 Prevalence of Drug Use Number of Drivers Tested Positive for Drugs Drivers Number % of total Number % of tested (77.4) 363 (40.0) Categories of Drugs Found Among Drivers Testing Positive Positive for Drug Type Drug Category Number of Drivers % of drivers testing positive* Cannabis CNS Depressants Narcotic Analgesics CNS Stimulants Dissociative Anesthetics Hallucinogens Inhalants (45.5) (36.9) (24.8) (23.4) (1.9) (0.3) (0.0) * Percentages will not add up to 100% due to multiple drug types found in blood samples of some drivers. 3.6 Trends in alcohol and drug-impaired driving The previous sections examined four indicators of the alcohol-crash problem: the number and percent of people who died in crashes that involved alcohol; the number and percent of fatally injured drivers who had been drinking; the number and percent of fatally injured pedestrians who had been drinking; and the number and percent of drivers in serious injury crashes that involved alcohol. The drug use among fatally injured drivers indicator was also examined. This section examines changes in these four indicators of the alcohol-crash problem and one indicator of the drug-crash problem. Findings for these indicators of the alcohol-crash problem and drug-crash problem in the period are compared with those taken from the baseline period Deaths in alcohol-related crashes: As mentioned earlier in Section 3.1, at the time this report was being prepared, 2012 coroner data from British Columbia were not available. For this reason, trend data reported in this section excludes this jurisdiction. Table 3-8 and Figure 3-12 show the number and percent of people who died in crashes involving a drinking driver from 1995 to These results differ slightly from those in Section 3.1 for two reasons. First, deaths that occur in crashes that involve a drinking pedestrian are not necessarily classified as alcohol-related deaths. The focus here is more restrictive, on deaths that occur in crashes involving at least one drinking driver. Second, the trend analyses focus on fatal crashes on public roadways involving principal vehicle types (where at least one of the vehicles involved is an automobile, truck/van, motorcycle or other highway vehicle). The previous analyses included all types of motorized vehicles (e.g., snowmobiles) on both public roadways and in off-road locations. As shown in the table and figure, the number of deaths in crashes that involved a drinking driver generally dropped from 1,054 to 593 in 2009, rose to 622 in 2010, decreased to 553 in 2011, and rose slightly to
43 in The percentage of alcohol-related fatalities generally decreased from 37.2% in 1995 to a low of 28.6% in 2005, eventually rose to 33.8% in 2010, and decreased to 29.9% in As shown at the bottom of the table, during the baseline period there was an average of 671 fatalities involving a drinking driver and they accounted for 32.7% of all fatalities. This means that the percent of fatalities involving a drinking driver decreased by 7.0% from 32.7% in the baseline period ( ) to 30.4% in the period. And in terms of the number of persons killed in crashes involving a drinking driver, there has been a 16.8% decrease from an average of 671 in the baseline period ( ) to 558 in the period. Table 3-8 Number* and Percent of Motor Vehicle Deaths** Involving a Drinking Driver: Canada, *** Persons Dying Within 12 Persons Dying Within 30 Days Months of Collision of Collision Year of Number of Alcohol-Related Deaths Number of Alcohol-Related Deaths Death Deaths Number % of total Deaths Number % of total baseline period * numbers are estimates based on the percent of deaths for which information was available to determine alcohol use. ** only on public roadways involving principal vehicle types. *** excludes British Columbia
44 3.6.2 Alcohol use among fatally injured drivers: As mentioned earlier in Section 3.2, at the time this report was being prepared, 2011and 2012 coroner data from British Columbia were not available. For this reason, trend data reported in this section excludes this jurisdiction. Data on alcohol use among fatally injured drivers over the 26-year period from 1987 to 2012 are shown in Table 3-9. Trends are illustrated in Figure 3-13 which shows changes in the percent of fatally injured drivers who: (1) showed no evidence of alcohol represented by the white area; (2) had BACs below the legal limit shown by the light grey area; and (3) had BACs over the legal limit the dark grey area. The number of fatally injured drivers with BACs over the legal limit (> 80 mg%) generally declined from 618 to 317 between 1987 and 2004, rose to 373 in 2005, fell to a low of 260 in 2011, and rose again to 280 in The percent of fatally injured drivers with BACs over the legal limit generally decreased from 43.3% to 27.7% between 1987 and 2004, rose to 32.5% in 2009, declined again to 28.1% in 2011, and rose slightly to 28.4% in By contrast, the number of fatally injured drivers with zero BACs has fluctuated over this 26-year period, from 665 in 1987 to a high of 873 in In 2012, there were 658 fatally injured drivers with zero BACs. The percent of fatally injured drivers with zero BACs generally increased from 46.6% to 67.6% between 1987 and 1999, remained stable until 2007, decreased to 61.8% in 2009, and rose again to 66.8% in The number of fatally injured drivers with BACs between 1-80 mg% generally declined from 145 to 69 between 1987 and 2005, rose to 85 in 2007, and decreased to 47 in The percent of fatally injured drivers with BACs between 1 and 80 mg% generally dropped from 10.2% in 1987 to 5.5% in 2005, rose in 2007 (7.2%), and decreased to its lowest level in 2012 (4.8%). When compared to the baseline period shown at the bottom of Table 3-9, the percentage of fatally injured drivers with zero BACs in the period increased by 5.9% (from 62.6% to 66.3%). Among drivers with BACs from 1-80 mg%, there was a 17.2% decrease (from 6.4% to 5.3%). And among those with BACs over 80 mg%, there was an 8.4% decrease (from 30.9% to 28.3%). 34
45 Alcohol Use Among Fatally Injured Drivers of Highway Vehicles: Canada, Number of Drivers Tested Drivers Grouped by BAC (mg%) Year Drivers* No. (% Total) Zero (% Tested) 1-80 (% Tested) >80 (% Tested) baseline (84.1) 690 (62.6) 71 (6.4) 341 (30.9) period * excludes British Columbia. Table (83.3) 634 (66.3) 51 (5.3) 271 (28.3) Table 3-10 and Figure 3-14 show data on alcohol use among fatally injured drivers over a shorter period from These results also differ from those reported above for two reasons. First, the number of drivers is extrapolated to reflect the BAC distribution of drivers tested for alcohol (see Figure 3-2). Second, drivers are grouped in only two BAC categories: zero and positive. 35

46 As can be seen at the bottom of Table 3-10, the percentage of fatally injured drivers testing positive for alcohol from , the baseline period, is 37.3%. In the period, 33.7% of fatally injured drivers tested positive for alcohol, which represents a 9.7% decrease from the baseline period. Table 3-10 Alcohol Use Among Fatally Injured Drivers of Highway Vehicles*: Canada, ** Year Zero (% Tested) Positive (% Tested) (55.3) 816 (44.7) (51.4) 858 (48.6) (53.0) 806 (47.0) (56.6) 768 (43.4) (56.3) 695 (43.7) (58.0) 688 (42.0) (59.7) 597 (40.3) (62.4) 581 (37.6) (61.6) 564 (38.4) (67.6) 503 (32.4) (65.0) 508 (35.0) (63.2) 516 (36.8) (66.5) 485 (33.5) (61.7) 547 (38.3) (66.0) 459 (34.0) (64.5) 531 (35.5) (63.4) 546 (36.6) (63.4) 516 (36.6) (62.0) 495 (38.0) (61.9) 455 (38.1) (62.4) 435 (37.6) (65.8) 384 (34.2) (66.8) 389 (33.2) baseline period Number of Drivers Drivers Grouped by BAC (mg%) (62.7) 489 (37.3) (66.3) 386 (33.7) * numbers are estimates based on the BAC distribution of drivers tested for alcohol ** excludes British Columbia 36
47 3.6.3 Fatally injured pedestrians: As mentioned earlier in Section 3.3, at the time this report was being prepared, 2011and 2012 coroner data from British Columbia were not available. For this reason, trend data reported in this section excludes this jurisdiction. Data on alcohol use among fatally injured pedestrians over the 26-year period from 1987 to 2012 are shown in Table Trends are illustrated in Figure 3-15 which shows changes in the percent of fatally injured pedestrians who: (1) showed no evidence of alcohol represented by the white area; (2) had BACs below the legal limit shown by the light grey area; and (3) had BACs over 80 mg% the dark grey area. The number of fatally injured pedestrians with a BAC over 80 mg% generally declined from a high of 135 in 1987 to 56 in 2008, rose to 77 in 2010, decreased to 43 in 2011, and rose again to 80 in The percent of fatally injured pedestrians with a BAC over 80 mg% generally declined from 40.4% in 1987 to 31.7% in 2007, rose to 41.8% in 2010, decreased to 35.1% in 2011, and rose again in 2012 (36.7%). The number of fatally injured pedestrians with no evidence of alcohol generally decreased from 174 to 94 between 1987 and 2009, and rose again to 131 in The percent of fatally injured pedestrians with zero BACs has ranged from about 50% to 60% over this 26-year period. In 1987, 52.1% of fatally injured pedestrians showed no evidence of alcohol compared to 60.1% in The number of fatally injured pedestrians with BACs between 1-80 mg% fluctuated over this 26-year period from 25 in 1987 to a low of six in 2010, increased to 14 in 2011, and decreased again to seven in The percent of fatally injured drivers with BACs between 1-80 mg% also fluctuated between 7.5% in 1987 and 3.2% in 2010, rose to 7.4% in 2011, and declined to a low of 3.2% in When compared to the baseline period shown at the bottom of Table 3-11, the percentage of fatally injured pedestrians with zero BACs in the period increased by 2.1% (from 57.4% to 58.6%). Among pedestrians with BACs from 1-80 mg%, there was an 8.4% decrease (from 5.9% to 5.4%). And among those with BACs over 80 mg%, there was a 1.9% decrease (from 36.7% to 36.0%). 37
48 Canada*, Pedestrians Number of Pedestrians Grouped by BAC (mg%) Year Tested Pedestrians* No. (% Total) Zero (% Tested) 1-80 (% Tested) >80 (% Tested) baseline period * excludes British Columbia Table 3-11 Alcohol Use Among Fatally Injured Pedestrians: (58.9) 108 (57.4) (61.7) 119 (58.6) 11 (5.9) 69 (36.7) 11 (5.4) 73 (36.0) Drivers in serious injury crashes: Table 3-12 and Figure 3-16 show information on drivers involved in alcohol-related serious injury crashes. For most jurisdictions, serious injury collision data are available as early as However, these data were not available for British Columbia until 2005 and the Yukon until Thus, in order to provide data for the greatest number of cases, the data shown in this 38
49 table cover the period. However, there are still some jurisdictions that did not have data available at the time this report was being prepared. These jurisdictions include Newfoundland and Labrador ( ), and Nunavut ( ). Thus Table 3-12 and Figure 3-16 exclude these two jurisdictions. As can be seen, the incidence of alcohol-involvement in serious crashes has declined only slightly. Between 2005 and 2006 the number of drivers in serious injury crashes that involved alcohol rose from 3,673 to 3,768. This number gradually decreased to 2,282 in 2011 and remained at this level in The number of drivers in alcohol-related serious injury crashes from 2009 to 2012, however, is an underestimate since data exclude the following jurisdictions- Newfoundland and Labrador and Nunavut. The percentage of drivers in serious injury crashes that involved alcohol generally rose from 19.1% to 20.3% in 2006, decreased in 2008 (19.8%), rose in 2009 (20.1%), and decreased until 2012 (17.0%). In the baseline period, an average of 19.9% of drivers in serious injury crashes were in an alcohol-involved crash. In the period, the incidence of drivers in alcohol-involved crashes declined to 17.2%, a decrease of 13.6%. Table 3-12 Number and Percent of All Drivers in Serious Injury Crashes* that Involved Alcohol: Canada, ** Year Number of Drivers Number in Alcohol- Involved Crashes Percent (19.1) (20.3) (20.3) (19.8) (20.1) (18.9) (17.4) (17.0) baseline (19.9) period (17.2) * single-vehicle nighttime crashes (SVN) as well as non-svn crashes that have police-reported alcohol involvement ** Excludes data from Newfoundland and Labrador and Nunavut. 39

50 Table 3-13 and Figure 3-17 also show information on drivers involved in alcohol-related serious injury crashes. These results differ slightly from those reported earlier in Section 3-4. Certain vehicle types e.g., bicycles, snowmobiles, farm tractors and other non-highway vehicles are excluded. And similar to Table 3-12, this table does not include 2012 data for Newfoundland and Labrador and Nunavut. As can be seen, the incidence of alcohol-involvement in serious crashes has declined slightly. Between 2005 and 2006 the number of drivers of highway vehicles in serious injury crashes that involved alcohol rose from 3,493 to 3,600. This number gradually decreased to 2,159 in 2011 and rose slightly to 2,168 in Similar to Table 3-12, the number of drivers in alcohol-related serious injury crashes from 2009 to 2012 is an underestimate since data exclude Newfoundland and Labrador and Nunavut. The percentage of drivers of highway vehicles in serious injury crashes that involved alcohol rose from 19.5% in 2005 to 20.8% in 2007 before generally decreasing to 17.3% in In the baseline period ( ), an average of 20.2% of drivers in serious injury crashes were in an alcohol-involved crash. In the period, the incidence of drivers in alcohol-involved crashes was 17.3%, a 13.3% decrease. 40
 2006 17452 3600 (20.6) 2007 15986 3331 (20.8) 2008 14579 2934 (20.1) 2009 13498 2743 (20.3) 2010 13367 2537 (19.0) 2011 12223 2159 (17.7) 2012 12507 2168 (17.")
51 Table 3-13 Number and Percent of Drivers* of Highway Vehicles in Serious Injury Crashes** that Involved Alcohol: Canada, *** Year Number of Drivers Number in Alcohol- Involved Crashes Percent (19.5) (20.6) (20.8) (20.1) (20.3) (19.0) (17.7) (17.3) baseline period (20.2) (17.5) * excludes operators of bicycles, snowmobiles, farm tractors, and other nonhighway vehicles. ** single-vehicle nighttime crashes (SVN) as well as non-svn crashes that have police-reported alcohol involvement. ** Excludes data from Newfoundland and Labrador and Nunavut Drug use among fatally injured drivers: As mentioned earlier in Section 3.5, at the time this report was being prepared, 2011and 2012 coroner data from British Columbia were not available. For this reason, trend data reported in this section excludes this jurisdiction. Data on drug use among fatally injured drivers of highway vehicles over the 13-year period from 2000 to 2012 are shown in Table Trends are illustrated in Figure 3-18 which shows changes in the percent of fatally injured drivers who tested positive for drugs. Unlike trends in the number of fatally injured drivers testing positive for alcohol, the corresponding trends in the number of drivers testing positive for drugs is more difficult to analyse since testing rates for drugs are less consistent than those for alcohol. For example, in 2000, only 36.3% of fatally injured drivers were tested for drugs compared to 77.4% in
, an average of 35.6% of fatally injured drivers tested positive for drugs.")
52 The percent of fatally injured drivers testing positive for drugs rose from 34.7% in 2000 to 41.5% in 2002, stabilized at 36.1% in 2009, rose to 40.8% in 2011, and declined to 40.0% in During the baseline period ( ), an average of 35.6% of fatally injured drivers tested positive for drugs. In the period, the incidence of fatally injured drivers testing positive for drugs rose to 40.4%, a 13.4% increase. Drug Use Among Fatally Injured Drivers* of Highway Vehicles: Canada, Number of Drivers YEAR Drivers* Tested (% Total) Drivers Tested for Drugs Negative (% Tested) Positive (% Tested) baseline period * excludes British Columbia. Table
53 4.0 BRITISH COLUMBIA This section of the report reviews the major findings on alcohol involvement in fatal and serious injury motor vehicle collisions as well as drug involvement in fatal motor vehicle collisions in British Columbia. It describes data on: > people who were killed in alcohol-related crashes (Section 4.1); > alcohol use among fatally injured drivers (Section 4.2); > drivers involved in alcohol-related serious injury crashes (Section 4.3); > drug use among fatally injured drivers (Section 4.4); and, > trends in the alcohol-crash and drug-crash problems (Section 4.5). 4.1 Deaths in alcohol-related crashes Table 4-1 presents information on people who died in alcohol-related crashes in British Columbia during 2010 for persons dying within 12 months of the collision (one calendar year) and for persons dying within 30 days of the collision. At the time this report was being prepared, 2011and 2012 coroner data from British Columbia were not available. For this reason, 2010 data will be reported in this section. Motor vehicle deaths are categorized in terms of the victim s age, gender, type (i.e., driver, passenger, pedestrian) and the type of vehicle they occupied. In each section, the first column in the table presents the number of deaths. The next two columns show the number and percent of these fatalities in which sufficient information was available to determine if alcohol was involved. A motor vehicle fatality was considered to be alcohol involved if there was at least one drinking driver or drinking pedestrian in the fatal crash. For example, within the first section, it can be seen that among persons dying within 12 months of the collision, 26 people aged were killed in motor vehicle crashes in British Columbia during And, in 25 cases (96.2%) it was possible to determine if alcohol was a factor in the crash. The next column shows the number of people killed in crashes that were known to be alcohol-involved. For example, 15 people aged died in alcohol-related crashes in British Columbia during The next column expresses this as a percentage i.e., 60.0% of the year olds who were killed died in an alcohol-related crash. The final column (percent of all alcohol-related deaths) expresses the number of deaths in alcohol-related crashes as a percent of all the deaths in such crashes. For example, the alcohol-related deaths among year olds represent 10.5% of all the people killed in alcohol-related crashes in British Columbia during An examination of the section for persons dying within 30 days of the collision shows that 25 persons aged died in motor vehicle crashes. In 24 of these cases (96.0%), it was possible to determine if alcohol was a factor in the crash. Among these persons, 15 (62.5%) were alcohol-related deaths. And year olds accounted for 10.7% of people dying in alcohol-related crashes. 43
54 The totals at the bottom of the table provide a summary. As can be seen, 387 persons died within 12 months of a motor vehicle crash in British Columbia during In 365 (94.3%) of these cases, it was possible to determine if alcohol was a factor. Of these known cases, 143 (39.2%) involved alcohol. Extrapolating this figure to the total number of motor vehicle fatalities (387 x.392) it can be estimated that in British Columbia during 2010, 152 persons died in alcohol-related crashes within 12 months of the collision. Among the 373 persons dying within 30 days of the collision, it was possible to determine if alcohol was a factor in 94.4% of the cases. Of these known cases, 140 (39.8%) involved alcohol. Extrapolating this figure to the total number of motor vehicle fatalities (373 x.398) it can be estimated that in British Columbia during 2010, 148 persons died in alcohol-related crashes within 30 days of the collision. Category of Victim Table 4-1 Deaths in Alcohol-Related Crashes: British Columbia, 2010 Persons Dying Within 12 Months of Collision No. of Deaths Alcohol Use Known % of No. total Alcohol-Related Deaths (ARDs) % of % of all No. known ARDs Persons Dying Within 30 Days of Collision No. of Deaths Alcohol Use Known % of No. total Alcohol-Related Deaths (ARDs) % of known % of all ARDs Age Group < > Gender Male Female Victim Type Driver/ Operator Passenger Pedestrian Vehicle Occupied Automobiles Trucks/Vans Motorcycles Other Hwy Vehicles Off-road Vehicles (Pedestrians) Collision Location Public Road Off-road TOTAL No Victim age. Of all the people who died in alcohol-related crashes within 12 months of the collision, 24.5% (see last column in the first section) were aged 26-35; 20.3% were aged 46-55; 16.1% were aged and 36-45; 11.2% were over age 55; 10.5% were aged 16-19; and 1.4% were under age 16. The highest incidence of alcohol involvement occurred in the crashes in which a person aged and died (61.4% and 60.5%, respectively). The lowest incidence of alcohol involvement was found among the 44
55 oldest and youngest fatalities 13.3% of persons under 16 and 15.0% of the fatalities over 55 years of age died in crashes involving alcohol Gender. Of all the people who died in alcohol-related crashes within 12 months of the collision, 72.0% were males. The incidence of alcohol in crashes in which a male died (42.2%) was greater than the incidence of alcohol in crashes in which a female died (33.1%) Victim type. Of all the people who died in alcohol-related crashes within 12 months of the collision, 55.9% were drivers/operators of a vehicle; 27.3% were passengers; and 16.8% were pedestrians. Within each of the victim types, the highest incidence of alcohol involvement (43.8%) occurred in the crashes in which a passenger died. Alcohol was involved in 40.0% of the crashes in which a pedestrian died and 37.0% of those in which a driver/operator died Type of vehicle occupied. Of all the people who died in alcohol-related crashes within 12 months of the collision, 42.0% were in an automobile; 26.6% were in a truck/van; 7.7% were motorcyclists; 6.3% were off-road vehicle occupants; and 0.7% were occupants of other highway vehicles. Within each of these vehicle types, the incidence of alcohol involvement in which an automobile occupant died was greater than the incidence of alcohol in crashes in which a truck/van occupant or motorcyclist died (41.7% versus 38.4% and 30.6%). Among off-road vehicle occupants, 60.0% were in an alcohol-related crash Collision location. Of all the people who died in alcohol-related crashes within 12 months of the collision, 95.1% died in a collision which occurred on a public road and 4.9% died in an off-road collision. However, the incidence of alcohol involvement in which a victim died in an alcohol-related crash was greater for those dying in off-road collisions (63.3%) than it was for persons dying in a collision which occurred on a public road (38.4%). 4.2 Alcohol in fatally injured drivers This section presents information on the presence of alcohol, exclusively among drivers fatally injured in British Columbia during At the time this report was being prepared, 2011and 2012 coroner data from British Columbia were not available. For this reason, 2010 data will be reported in this section. Table 4-2 shows the information by age group, gender, vehicle type, collision type (single vs. multiple), and duration between crash time and death time (within 12 months vs. within 30 days of the collision). The first column in the table shows the number of drivers killed. The next columns show the number and percent of these victims who were tested for alcohol. The remaining columns provide information on the results of the alcohol tests: the first three of these present results for drivers who showed any evidence of alcohol; the last three columns present information on drivers who had BACs over the statutory limit of 80 mg%. To illustrate, among year olds there were 13 drivers killed during 2010; 11 of these fatally injured drivers (84.6%) were tested for alcohol. Of those who were tested, three (27.3%) were positive for alcohol. 45
56 This means that year old fatally injured drinking drivers accounted for 4.8% of all drinking drivers who were killed. Then, in the final three columns, it can be seen that three of the 11 (27.3%) fatally injured year olds who were tested for alcohol had BACs in excess of 80 mg%. This means that all three of the drivers who were positive for alcohol had BACs in excess of the legal limit. The final column expresses the number of drivers with illegal BACs as a percent of all drivers with BACs over the limit. Thus, year old drivers accounted for 5.8% of all the drivers with BACs over the legal limit. The main findings are shown by the totals at the bottom of the table. British Columbia had a high testing rate in 2010, with 84.1% of fatally injured drivers being tested for alcohol use. Table 4-2 Alcohol Use Among Fatally Injured Drivers of Highway Vehicles: British Columbia, 2010 Drivers Tested Positive BAC BAC >80 mg% Category of No. of % of all % of all drivers % of % of % of Driver Drivers No. No. drivers with No. with BAC >80 total tested tested +BAC mg% Age Group < > Gender Male Female Vehicle Type Automobiles Truck/Van Motorcycles Tractor Trailer Other Vehicle Collision Type Single vehicle Multiple vehicle Duration Between Crash and Death Time Within 30 Days > 30 Days TOTAL In British Columbia, 35.0% had been drinking and 52 of 63 (82.5%) fatally injured drinking drivers had BACs over 80 mg%. Although not shown in the table, more refined analyses by different BAC categories show that among tested drivers: > 65.0% had BACs of zero mg%; > 2.2% had BACs from 1-49 mg%; > 3.9% had BACs from mg% 46

57 > 7.8% had BACs from 81 to 160 mg%; and, > 21.1% had BACs over 160 mg%. In Figure 4-1, the BAC distribution for tested fatally injured drivers is extrapolated to reflect the BAC distribution for all fatally injured drivers. In this figure, 75 of 214 (35.0%) fatally injured drivers have a positive BAC. And among fatally injured drinking drivers, 62 (82.7%) have BACs over 80 mg%. According to the British Columbia member jurisdiction of CCMTA, where information is presented on blood alcohol concentration (BAC) levels of deceased drivers (e.g., Figure 3-2 on page 18, Figure 4-1 on page 47 reflecting British Columbia data), the following must be taken into account: BAC values presented in these figures only represent BAC values for deceased drivers exclusively and therefore represent only a subset of the BAC levels of drivers involved in motor vehicle crashes that cause deaths and injuries. For example, where a driver is assigned alcohol as a contributing factor to a crash and that driver survives that crash but, another road user is killed (pedestrian, cyclist or another driver or occupants of any vehicle), that driver s BAC level is not reflected in the figures shown above or the similar figures assembled for other Canadian provinces and territories. Furthermore, where a driver is assigned alcohol as a contributing factor to a crash and that driver survives that crash but are themselves injured or another road user is injured (pedestrian, cyclist or any driver or occupants of any vehicle involved in the crash), that driver s BAC level is again NOT reflected in the figures 3-2, 4-1, or the similar figures assembled for other Canadian provinces and territories. This is a major and prevailing limitation of these data and the BAC values represented herein. This means that the BAC levels reflected in these tables do not reflect the full range of BAC levels of drivers involved in serious crashes and should not be relied upon to draw conclusions about BAC levels and motor vehicle crash risk. In order to understand BAC levels and motor vehicle crash risk, a number of research studies exist to do that. Based on an extensive amount of research, there is overwhelming evidence that even BAC levels as low as.02 impair driving abilities and at.04 to.05 BAC there is a clear relationship between crash risk and alcohol (see Zador et al. 2000; Blomberg et al. 2009; Moskowitz et al. 2000). 47
58 4.2.1 Age differences. Of all the fatally injured drinking drivers (i.e., those with a positive BAC), 28.6% were aged 26-35; 20.6% were aged and 46-55; 12.7% were aged and over 55; and 4.8% were aged Of all the fatally injured legally impaired drivers (i.e., those with BACs over 80 mg%), 28.8% were aged 26-35; 23.1% were aged 46-55; 21.2% were aged 36-45; 15.4% were aged 20-25; and 5.8% were aged and over age 55. When comparing the incidence of drinking and driving among fatally injured drivers by age group, fatally injured drivers aged were the most likely to have been drinking (56.3%). By contrast, the lone tested driver under 16 had not been drinking and only 15.4% of the tested drivers aged over 55 had been drinking Gender differences. Males dominate the picture they account for 76.2% of all the fatally injured drivers who had been drinking, and 75.0% of all of the fatally injured drivers who were legally impaired. Males dominate the picture largely because they account for most of the drivers who are killed (162 of the 214 fatalities or 75.7% are males). Fatally injured male drivers were slightly more likely to have been drinking than female drivers (35.6% and 33.3%, respectively). And, 81.3% of the male and 86.7% of the female drivers who were drinking had BACs over the legal limit Vehicle differences. Of all the fatally injured drinking drivers (i.e., those with a positive BAC), 50.8% were automobile drivers; 34.9% were truck/van drivers; 12.7% were motorcyclists; and 1.6% were tractortrailer drivers. Of all the fatally injured legally impaired drivers (i.e., those with BACs over 80 mg%), 50.0% were automobile drivers, 36.5% were truck/van drivers; 11.5% were motorcyclists; and 1.9% were tractor-trailer drivers. Within each of the vehicle types, 39.3% of fatally injured drivers of truck/vans, 35.6% of automobile drivers, 30.8% of motorcyclists, and 12.5% of tractor-trailer drivers were found to have been drinking Collision differences. Just over half of the drivers killed (121 of the 214) were involved in single-vehicle collisions but these crashes accounted for four-fifths of the drivers who had been drinking or were legally impaired (81.0% and 86.5%, respectively). The reason for this apparent disparity is because alcohol is overrepresented in single-vehicle crashes. Over half of the drivers involved in single-vehicle crashes (52.6%) were positive for alcohol, compared to only 14.5% of those involved in multiple-vehicle collisions Duration between crash and death time. Given that only six fatally injured drivers died more than 30 days after the collision, and none of these drivers were tested for alcohol, a comparison of alcohol use among drivers based on differences in the duration between crash time and death time cannot be performed. 4.3 Drivers involved in alcohol-related serious injury crashes This section presents information on drivers involved in alcohol-related crashes in which someone was seriously injured in 2012 in British Columbia. A surrogate or indirect measure is used to estimate alcohol 48
59 involvement because drivers in serious injury crashes are seldom tested for alcohol. A driver is identified as having been involved in an alcohol-related serious injury crash if the crash in which someone was seriously injured involved a single vehicle at night (SVN), or if, in the case of a non-svn serious injury crash, the police reported alcohol involvement i.e., at least one drinking driver in the crash (see Section 2.2.4). The results are shown in Table 4-3 for drivers grouped in terms of age, gender, type of vehicle driven, and type of collision. The first column shows the number of drivers involved in serious injury crashes. The number and percent of drivers in such crashes that involved alcohol is shown in the next two columns. The final column expresses the number of drivers involved in alcohol-related serious injury crashes in any row as a percent of all drivers involved in alcohol- related serious injury crashes. As shown, by the totals at the bottom of the table, 2,173 drivers were involved in crashes in which someone was seriously injured, and among these 20.0% were alcohol-related crashes Driver age. Of all the drivers involved in alcohol-related serious injury crashes, 21.4% were aged 46-55, 20.5% were aged 26-35; and 19.4% were aged Drivers under 16 and respectively accounted for only 0.3% and 6.2% of those involved in alcohol-related serious injury crashes. Almost one-third (31.0%) of the drivers aged were involved in alcohol-related serious injury crashes. The lowest incidence of involvement in alcohol-related crashes was found for those under 16 years of age (0.0%) and over 55 (8.4%) Driver gender. Of all the drivers involved in alcohol-related serious injury crashes, 74.4% were males. The incidence of involvement in alcohol-related serious injury crashes was also greater for males than for females (21.2% and 15.7%, respectively) Type of vehicle driven. Of all the drivers involved in alcohol-related serious injury crashes, 50.7% were automobile drivers; 31.6% were truck/van drivers; 8.3% were motorcyclists; 3.7% were tractor-trailer drivers; 3.5% were off-road vehicle drivers; and 1.4% were drivers of other highway vehicles. The highest incidence of involvement in alcohol-related serious injury crashes was found for automobile drivers (23.1%), compared to 21.4% for drivers of other highway vehicles; 18.7% for truck/van drivers; 16.8% for tractor-trailer drivers; and 16.0% for motorcyclists. Among off-road vehicle drivers, 11.8% were involved in alcohol-related crashes Type of collision. Of all the drivers involved in alcohol-related serious injury crashes, 68.4% of them were in single-vehicle crashes. The highest incidence of involvement in alcohol-related serious injury crashes was also found among drivers in single-vehicle crashes 37.0% of these drivers, compared to only 10.0% for drivers involved in multiple-vehicle crashes. 49
60 Table 4-3 Drivers in Alcohol-Related Serious Injury Crashes: British Columbia, 2012 Category of Drivers Number of Drivers Alcohol-Related % of % of all drivers in Number total alcohol-related crashes Age < > unknown Gender Male Female unknown Vehicle Type Auto Truck/Van Motorcycle Tractor Trailer Other Hwy. Vehicle Off-Road Unknown Collision Type Single-Vehicle Multiple-Vehicle TOTAL Drug use among fatally injured drivers This section presents information on the presence of drugs, exclusively among drivers fatally injured in British Columbia during At the time this report was being prepared, 2011and 2012 coroner data from British Columbia were not available. For this reason, 2010 data will be reported in this section. Table 4-4 shows the prevalence of drug use among fatally injured drivers of highway vehicles as well as the number of drivers who tested positive for various categories of drugs. As can be seen, British Columbia had a high testing rate in 2010, with 80.4% of fatally injured drivers being tested for drug use. Among fatally injured tested drivers, 80 out of 209 (38.3%) were positive for drugs. The most common category of drugs found within drivers testing positive for drug use was cannabis (52.1%). Other categories of drugs found in fatally injured drivers testing positive for drugs were CNS depressants (43.7%), CNS stimulants (28.2%), narcotic analgesics (14.1%), and dissociative anesthetics (2.8%). 50
61 Table 4-4 Drug Use Among Fatally Injured Drivers of Highway Vehicles: British Columbia, 2010 Prevalence of Drug Use Number of Drivers Tested Positive for Drugs Drivers Number % of total Number % of tested (80.4) 71 (41.3) Categories of Drugs Found Among Drivers Testing Positive Positive for Drug Type Drug Category Number of Drivers % of drivers testing positive* Cannabis CNS Depressants CNS Stimulants (52.1) (43.7) (28.2) Narcotic Analgesics 10 (14.1) Dissociative Anesthetics Hallucinogens Inhalants (2.8) (0.0) (0.0) * Percentages will not add up to 100% due to multiple drug types found in blood samples of some drivers. 4.5 Trends in alcohol and drug-impaired driving Sections 4.1 through 4.3 examined three indicators of the alcohol-crash problem: (1) the number and percent of people who died in crashes that involved alcohol; (2) the number and percent of fatally injured drivers who had been drinking; and (3) the number and percent of drivers in serious injury crashes that involved alcohol. Section 4.4 examined drug use among fatally injured drivers in This section examines changes in these four indicators over time Deaths in alcohol-related crashes: As mentioned earlier in Section 4.1, at the time this report was being prepared, 2011 and 2012 coroner data from British Columbia were not available. For this reason, 2010 data will be reported in this section. Table 4-5 and Figure 4-2 show the number and percent of people who died in crashes involving a drinking driver from 1995 to These results differ slightly from those in Section 4.1 for two reasons. First, deaths that occur in crashes that involve a drinking pedestrian are not necessarily classified as alcohol-related deaths. The focus here is more restrictive, on deaths that occur in crashes involving at least one drinking driver. Second, the trend analyses focus on fatal crashes on public roadways involving principal vehicle types (where at least one of the vehicles involved is an automobile, truck/van, motorcycle or other highway vehicle). The previous analyses included all types of motorized vehicles (e.g., snowmobiles) on both public roadways and in off-road locations. As shown in the figure, the number of deaths in crashes that involved a drinking driver generally dropped from 241 to 134 between 1995 and 2003, increased to 161 in 2005, decreased to 143 in 2006, rose to 150 in 2007, fell to a low of 121 in 2009, and remained at 121 in The percentage of alcohol-related fatalities in British Columbia generally decreased from 47.6% in 1995 to its lowest level in 2003 (29.5%), rose to 51

62 36.9% in 2005, decreased to 33.6% in 2006, rose in 2007 (35.6%), decreased in 2009 (31.3%), and rose again to 32.7% in As shown at the bottom of the table, during the baseline period there was an average of 132 fatalities involving a drinking driver and they accounted for 33.4% of all fatalities. In 2010, the percent of fatalities involving a drinking driver was 32.7% and the number of persons killed in crashes involving a drinking driver was 121. Table 4-5 Number* and Percent of Motor Vehicle Deaths** Involving a Drinking Driver: British Columbia, Persons Dying Within 12 Persons Dying Within 30 Days Months of Collision of Collision Year of Number of Alcohol-Related Deaths Number of Alcohol-Related Deaths Death Deaths Number % of total Deaths Number % of total baseline * numbers are estimates based on the percent of deaths for which information was available to determine alcohol use. ** only on public roadways involving principal vehicle types. 52
63 4.5.2 Alcohol use among fatally injured drivers: As mentioned earlier in Section 4.2, at the time this report was being prepared, 2011and 2012 coroner data from British Columbia were not available. For this reason, data will be reported in this section in Table 4-6. Trends are illustrated in Figure 4-3 which shows changes in the percent of fatally injured drivers who: (1) showed no evidence of alcohol (represented by the white area); (2) had BACs below the legal limit (shown by the light grey area); and (3) had BACs over the legal limit (the dark grey area). The data reported here are restricted to drivers who died in less than six hours after the crash (see Section 2.2.2). As can be seen, the percent of fatally injured drivers with BACs over the legal limit generally increased from 1989 (36.1%) to 1993 (50.4%), dropped to a low of 29.2% in 2004, rose to 36.6% in 2005, decreased in 2006 (32.6%), rose in 2007 (38.8%), and decreased in 2010 (28.9%). The percent of fatally injured drivers with zero BACs decreased from 1989 (55.0%) to its lowest point in 1992 (44.8%), generally increased until 2004 (62.2%), declined in 2005 (57.7%), increased in 2006 (60.0%), declined in 2007 (52.7%), and peaked in 2009 (65.1%), and decreased slightly in 2010 (64.8%). The percent of fatally injured drivers with BACs between 1 and 80 mg% was at its highest level in 1987 (10.2%), dropped to its lowest mark in 1991 (4.0%), remained stable from 1992 to 2005 (5.6%), rose in 2007 (8.5%), decreased in 2009 (4.2%), and rose again in 2010 (6.3%). During the baseline period, the percentage of fatally injured drivers was 59.7% for drivers with zero BACs, 6.5% for drivers with BACs from 1-80 mg%, and 33.9% for drivers with BACs over 80 mg%. 53
64 Alcohol Use Among Fatally Injured Drivers of Highway Vehicles: British Columbia, Number of Drivers Tested Drivers Grouped by BAC (mg%) Year Drivers* No. (% Total) Zero (% Tested) 1-80 (% Tested) >80 (% Tested) baseline (94.9) * dying in less than six hours. Table (59.7) 12 (6.5) 63 (33.9) Table 4-7 and Figure 4-4 show data on alcohol use among fatally injured drivers over a shorter period from These results also differ from those reported above for several reasons. First, the number of drivers is extrapolated to reflect the BAC distribution of drivers tested for alcohol (see Figure 4-1). Second, estimates are based on all fatally injured drivers, not just those who died in less than six hours from the 54

65 crash. Third, drivers are grouped in only two BAC categories: zero and positive. As can be seen in Table 4-6, the baseline percentage of fatally injured drivers testing positive for alcohol from is 39.7%. In 2010, 35.0% of fatally injured drivers tested positive for alcohol. Table 4-7 Alcohol Use Among Fatally Injured Drivers of Highway Vehicles*: British Columbia, Year Number of Drivers Grouped by BAC (mg%) Drivers Zero (% Tested) Positive (% Tested) (50.8) 174 (49.2) (55.6) 134 (44.4) (45.1) 146 (54.9) (47.1) 144 (52.9) (54.9) 133 (45.1) (48.8) 147 (51.2) (50.4) 123 (49.6) (51.8) 123 (48.2) (56.7) 106 (43.3) (62.7) 90 (37.3) (61.1) 100 (38.9) (55.6) 107 (44.4) (57.6) 126 (42.4) (62.0) 92 (38.0) (62.2) 107 (37.8) (58.3) 120 (41.7) (60.1) 99 (39.9) (54.1) 119 (45.9) (57.7) 99 (42.3) (64.7) 85 (35.3) (65.0) 75 (35.0) baseline (60.3) 95 (39.7) * numbers are estimates based on the BAC distribution of drivers tested for alcohol Drivers in serious injury crashes: In British Columbia, data are only available since 2005 to indicate the degree of injury severity for collision victims. Thus trend tables in this section include data from 2005 to 2012, as opposed to the period reported for serious injury collisions in most other jurisdictions. 55

66 Table 4-8 and Figure 4-5 show information on drivers involved in alcohol-related serious injury crashes. During the baseline period ( ), an average of 26.2% of drivers in serious injury crashes were in an alcohol-involved crash. This compares to 19.7% in the period, a 24.8% decrease in the problem. Table 4-8 Number and Percent of All Drivers in Serious Injury Crashes* that Involved Alcohol: British Columbia, Year Number of Drivers Number in Alcohol- Involved Crashes Percent (27.2) (27.0) (27.1) (25.9) (27.0) (23.4) (19.5) (20.0) baseline (26.2) period (19.7) * single-vehicle nighttime crashes (SVN) as well as non-svn crashes that have police-reported alcohol involvement Table 4-9 and Figure 4-6 also show information on drivers involved in alcohol-related serious injury crashes. These results differ from those in Section 4.3 which reports drivers involved in alcohol-related serious injury crashes. These results also differ slightly from those found in Table 4-8 and Figure 4-5 above because they exclude certain vehicle types e.g., bicycles, snowmobiles, farm tractors and other non-highway vehicles. As can be seen, the incidence of alcohol-involvement in serious injury crashes has increased slightly over this eight-year period. Between 2005 and 2009 the percentage of drivers in serious injury crashes that involved alcohol fluctuated, decreased to 19.8% in 2011, and rose to 20.5% in

67 As shown in Table 4-9, in the baseline period ( ), an average of 26.5% of drivers in serious injury crashes were in an alcohol-involved crash. In the period, the incidence of drivers in alcoholinvolved serious injury crashes declined to 20.1%, an 24.2% decrease. Table 4-9 Number and Percent of Drivers* of Highway Vehicles in Serious Injury Crashes** that Involved Alcohol: British Columbia, Year Number of Drivers (27.5) (27.0) (27.5) (26.4) (27.2) (23.8) (19.8) (20.5) baseline (26.5) period Number in Alcohol- Involved Crashes Percent (20.1) * excludes operators of bicycles, snowmobiles, farm tractors, and other nonhighway vehicles. ** single-vehicle nighttime crashes (SVN) as well as non-svn crashes that have police-reported alcohol involvement Drug use among fatally injured drivers: Table 4-10 and Figure 4-7 show data on drug use among fatally injured drivers over an 11-year period ( ). At the time of publication, drug use data among fatally injured drivers in British Columbia for 2011 and 2012 was not yet available. Similar to Table 4-6, these results are based on fatally injured drivers of highway vehicles who died less than six hours after the crash (see Section 2.2.5). As can be seen at the bottom of Table 4-10, the percentage of fatally injured drivers testing positive for drugs from , the baseline period, is 46.4%. In 2010, 42.0% of fatally injured drivers tested positive for drugs. 57
68 Table 4-10 Drug Use Among Fatally Injured Drivers* of Highway Vehicles: British Columbia, YEAR Number of Drivers Drivers* Tested (% Total) Drivers Tested for Drugs Negative (% Tested) Positive (% Tested) baseline * dying in less than six hours
69 5.0 ALBERTA This section of the report reviews the major findings on alcohol involvement in fatal and serious injury motor vehicle collisions as well as drug involvement in fatal motor vehicle collisions in Alberta. It describes data on: > people who were killed in alcohol-related crashes (Section 5.1); > alcohol use among fatally injured drivers (Section 5.2); > drivers involved in alcohol-related serious injury crashes (Section 5.3); > drug use among fatally injured drivers (Section 5.4); and, > trends in the alcohol-crash and drug-crash problems (Section 5.5). 5.1 Deaths in alcohol-related crashes Table 5-1 presents information on people who died in alcohol-related crashes in Alberta during 2012 for persons dying within 12 months of the collision (one calendar year) and for persons dying within 30 days of the collision. Motor vehicle deaths are categorized in terms of the victim s age, gender, type (i.e., driver, passenger, pedestrian) and the type of vehicle they occupied. In each section, the first column in the table presents the number of deaths. The next two columns show the number and percent of these fatalities in which sufficient information was available to determine if alcohol was involved. A motor vehicle fatality was considered to be alcohol involved if there was at least one drinking driver or drinking pedestrian in the fatal crash. For example, within the first section, 36 people age were killed in motor vehicle crashes in Alberta during And, in 32 cases (88.9%) it was possible to determine if alcohol was a factor in the crash. The next column shows the number of people killed in crashes that were known to be alcohol-involved. For example, 19 people aged died in alcohol-related crashes in Alberta during The next column expresses this as a percentage i.e., 59.4% of the year olds who were killed died in an alcohol-related crash. The final column (percent of all alcohol-related deaths) expresses the number of deaths in alcohol-related crashes as a percent of all the deaths in such crashes. For example, the alcohol-related deaths among year olds represent 13.0% of all the people killed in alcohol-related crashes in Alberta during The totals at the bottom of the table provide a summary. As can be seen, 366 persons died within 12 months of a motor vehicle crash in Alberta during In 337 (92.1%) of these cases, it was possible to determine if alcohol was a factor. Of these known cases, 146 (43.3%) involved alcohol. Extrapolating this figure to the total number of motor vehicle fatalities (366 x.433) it can be estimated that in Alberta during 2012, 159 persons died in alcohol-related crashes within 12 months of the collision. 59
70 Among the 365 persons dying within 30 days of the collision, it was possible to determine if alcohol was a factor in 92.3% of the cases. Of these known cases, 146 (43.3%) involved alcohol. Extrapolating this figure to the total number of motor vehicle fatalities (365 x.433) it can be estimated that in Alberta during 2012, 158 persons died in alcohol-related crashes within 30 days of the collision Victim age. Of all the people who died in alcohol-related crashes within 12 months of the collision, 23.3% (see last column in the first section) were aged and 26-35; 15.8% were aged 36-45; 14.4% were aged 46-55; 13.0% were aged 16-19; 9.6% were over age 55; and 0.7% were under 16. The highest incidence of alcohol involvement occurred in the crashes in which a person aged and died (59.4% and 53.8%, respectively). The lowest incidence of alcohol involvement was found among the youngest and oldest fatalities 19.2% of persons over 55 and 10.0% of the fatalities under age 16 died in crashes involving alcohol. Category of Victim Age Group < > Gender Table 5-1 Deaths in Alcohol-Related Crashes: Alberta, 2012 Persons Dying Within 12 Months of Collision No. of Deaths Alcohol Use Known No. % of total Alcohol-Related Deaths (ARDs) % of % of all No. known ARDs Persons Dying Within 30 Days of Collision No. of Deaths Alcohol Use Known % of No. total Alcohol-Related Deaths (ARDs) % of known Male Female Victim Type Driver/ Operator Passenger Pedestrian Vehicle Occupied Automobiles Trucks/Vans Motorcycles Other Hwy Vehicles Off-road Vehicles (Pedestrians) Collision Location Public Road Off-road % of all ARDs TOTAL No Gender. Of all the people who died in alcohol-related crashes within 12 months of the collision, 79.5% were males. The incidence of alcohol in crashes in which a male died (47.0%) was greater than the incidence of alcohol in crashes in which a female died (33.3%). 60
71 5.1.3 Victim type. Of all the people who died in alcohol-related crashes within 12 months of the collision, 58.2% were drivers/operators of a vehicle; 21.9% were pedestrians; and 19.9% were passengers. Within each of the principal victim types, the highest incidence of alcohol involvement (62.7%) occurred in the crashes in which a pedestrian died. Alcohol was involved in 48.3% of the crashes in which a passenger died and 37.6% of those in which a driver/operator died Type of vehicle occupied. Of all the people who died in alcohol-related crashes within 12 months of the collision, 40.4% were in a truck/van; 26.0% were in an automobile; 5.5% were off-road vehicle occupants; 4.8% were motorcyclists; and 1.4% were occupants of other highway vehicles. Within each of these vehicle types, the incidence of alcohol involvement in which a truck/van occupant died was greater than the incidence of alcohol in crashes in which a motorcyclist or automobile occupant died (47.2% versus 36.8% and 33.6%). Among fatally injured off-road vehicle occupants, 47.1% were involved in an alcohol-related crash Collision location. Of all the people who died in alcohol-related crashes within 12 months of the collision, 93.2% died in a collision which occurred on a public road and 6.8% died in an off-road collision. However, the incidence of alcohol involvement in which a victim died in an alcohol-related crash was greater for those dying in off-road collisions (52.6%) than it was for persons dying in a collision which occurred on a public road (42.8%). 5.2 Alcohol in fatally injured drivers This section presents information on the presence of alcohol, exclusively among drivers fatally injured in Alberta during Table 5-2 shows the information by age group, gender, vehicle type, collision type (single vs. multiple), and duration between crash time and death time (within 12 months vs. within 30 days of the collision). The first column in the table shows the number of drivers killed. The next columns show the number and percent of these victims who were tested for alcohol. The remaining columns provide information on the results of the alcohol tests the first three of these present results for drivers who showed any evidence of alcohol; the last three columns present information on drivers who had BACs over the statutory limit of 80 mg%. To illustrate, among year olds there were 17 drivers killed during 2012; 16 of these fatally injured drivers (94.1%) were tested for alcohol. Of those who were tested, seven (43.8%) were positive for alcohol. This means that year old fatally injured drinking drivers accounted for 9.9% of all drinking drivers who were killed. 61
72 Table 5-2 Alcohol Use Among Fatally Injured Drivers of Highway Vehicles: Alberta, 2012 Category of Driver Age Group > Gender No. of Drivers Drivers Tested No. % of total Male Female Vehicle Type Automobiles Truck/Van Motorcycles Tractor Trailer Collision Type Single vehicle Multiple vehicle Duration Between Crash and Death Time No. Positive BAC % of tested % of all drivers with +BAC % of tested Within 30 Days > 30 Days TOTAL No. BAC >80 mg% % of all drivers with BAC >80 mg% Then, in the final three columns, it can be seen that four of the 16 (25.0%) fatally injured year olds who were tested for alcohol had BACs in excess of 80 mg%. This means that four of the seven drivers who were positive for alcohol had BACs in excess of the legal limit. The final column expresses the number of drivers with illegal BACs as a percent of all drivers with BACs over the limit. As can be seen, year old drivers accounted for 6.2% of all the drivers with BACs over the legal limit. The main findings are shown by the totals at the bottom of the table. Alberta had a very high testing rate in 2012, with 96.4% of fatally injured drivers being tested for alcohol use. In Alberta, 33.5% had been drinking and 65 of 71 (91.5%) fatally injured drinking drivers had BACs over 80 mg%. Although not shown in the table, more refined analyses by different BAC categories show that among tested drivers: > 66.5% had BACs of zero mg%; > 0.9% had BACs from 1-49 mg%; > 1.9% had BACs from mg% > 8.0% had BACs from 81 to 160 mg%; and, > 22.6% had BACs over 160 mg%. 62
73 In Figure 5-1, the BAC distribution for tested fatally injured drivers is extrapolated to reflect the BAC distribution for all fatally injured drivers. In this figure, 74 of 220 (33.6%) fatally injured drivers have a positive BAC. And among fatally injured drinking drivers, 68 (91.9%) have BACs over 80 mg% Age differences. Of all the fatally injured drinking drivers (i.e., those with a positive BAC), 32.4% were aged 26-35; 21.1% were aged 20-25; 14.1% were aged and 46-55; 9.9% were aged 16-19; and 8.5% were over age 55. Of all the fatally injured legally impaired drivers (i.e., those with BACs over 80 mg%), 35.4% were aged 26-35; 20.0% were aged 20-25; 15.4% were aged 36-45; 13.8% were aged 46-55; and 9.2% were over 55. Of the fatally injured drivers who were over the legal limit, 6.2% were aged When comparing the incidence of drinking and driving among fatally injured drivers by age group, fatally injured drivers aged were the most likely to have been drinking (52.3%). By contrast, only 12.8% of the tested drivers over age 55 had been drinking Gender differences. Males dominate the picture they account for 88.7% of all the fatally injured drivers who had been drinking, and 89.2% of all of the fatally injured drivers who were legally impaired. Males dominate the picture largely because they account for most of the drivers who are killed (174 of the 220 or 79.1% of the fatalities are males). Fatally injured male drivers were more likely to have been drinking than female drivers (37.3% and 18.6%, respectively). And, 92.1% of the male and 87.5% of the female drivers who were drinking had BACs over the legal limit Vehicle differences. Of all the fatally injured drinking drivers (i.e., those with a positive BAC), 54.9% were truck/van drivers; 35.2% were automobile drivers; 8.5% were motorcyclists and 1.4% were tractortrailer drivers. Of all the fatally injured legally impaired drivers (i.e., those with BACs over 80 mg%), 53.8% were truck/van drivers; 36.9% were automobile drivers; 7.7% were motorcyclists and 1.5% were tractor-trailer drivers. 63
74 Within each of the vehicle types, 41.1% of fatally injured truck/van drivers, 29.4% of automobile drivers, 28.6% of motorcyclists, and 9.1% of tractor-trailer drivers had been drinking Collision differences. Two-fifths of the drivers killed (96 of the 220) were involved in single-vehicle collisions but these crashes accounted for a majority of the drivers who had been drinking or were legally impaired (64.1% and 83.1%, respectively). The reason for this apparent disparity is because alcohol is overrepresented in single-vehicle crashes. Almost two-thirds of the drivers involved in single-vehicle crashes (64.1%) were positive for alcohol, compared to only 10.0% of those involved in multiple-vehicle collisions Duration between crash and death time. Given that only one fatally injured driver died more than 30 days after the collision and was not tested for alcohol, a comparison of alcohol use among drivers based on differences in the duration between crash time and death time cannot be performed. 5.3 Drivers involved in alcohol-related serious injury crashes This section presents information on drivers involved in alcohol-related crashes in which someone was seriously injured in 2012 in Alberta. A surrogate or indirect measure is used to estimate alcohol involvement because drivers in serious injury crashes are seldom tested for alcohol. A driver is identified as having been involved in an alcohol-related serious injury crash if the crash in which someone was seriously injured involved a single vehicle at night (SVN), or if, in the case of a non-svn serious injury crash, the police reported alcohol involvement i.e., at least one drinking driver in the crash (see Section 2.2.4). The results are shown in Table 5-3 for drivers grouped in terms of age, gender, type of vehicle driven, and type of collision. The first column shows the number of drivers involved in serious injury crashes. The number and percent of drivers in such crashes that involved alcohol is shown in the next two columns. The final column expresses the number of drivers involved in alcohol-related serious injury crashes in any row as a percent of all drivers involved in alcohol-related serious injury crashes. As shown, by the totals at the bottom of the table, 3,286 drivers were involved in crashes in which someone was seriously injured, and among these 15.5% were alcohol-related crashes Driver age. Of all the drivers involved in alcohol-related serious injury crashes, 26.8% were aged 26-35, 20.1% were aged 20-25; and 14.8% were aged Drivers under 16 and over 55 accounted for only 0.0% and 9.4%, respectively, of those involved in alcohol-related serious injury crashes. Almost one-quarter of the drivers aged were involved in alcohol-related serious injury crashes (26.1%). The lowest incidence of involvement in alcohol-related crashes was found for those under 16 (0.0%) Driver gender. Of all the drivers involved in alcohol-related serious injury crashes, 74.2% were males. The incidence of involvement in alcohol-related serious injury crashes was also greater for males than for females (17.0% and 12.0%, respectively). 64
75 5.3.3 Type of vehicle driven. Of all the drivers involved in alcohol-related serious injury crashes, 48.6% were truck/van drivers; 39.8% were automobile drivers; 5.7% were motorcyclists; 3.0% were off-road vehicle drivers; 2.4% were tractor-trailer drivers; and 0.4% were drivers of other highway vehicles. The highest incidence of involvement in alcohol-related serious injury crashes was found for automobile drivers as 17.2% of these drivers were in crashes that involved alcohol, compared to 15.5% for truck/van drivers; 13.2% for motorcyclists; 10.7% for tractor-trailer drivers; and 10.1% for off-road vehicle drivers. Among drivers of other highway vehicles, 7.7% were involved in alcohol-related crashes. Age Table 5-3 Drivers in Alcohol-Related Serious Injury Crashes: Alberta, 2012 Category of Drivers Alcohol-Related % of % of all drivers in Number total alcohol-related crashes < > unknown Gender Male Female unknown Vehicle Type Auto Truck/Van Motorcycle Tractor Trailer Other Hwy. Vehicle Off-Road Unknown Collision Type Number of Drivers Single-Vehicle Multiple-Vehicle TOTAL Type of collision. Of all the drivers involved in alcohol-related serious injury crashes, 69.9% of them were in single-vehicle crashes. The highest incidence of involvement in alcohol-related serious injury crashes was also found among drivers in single-vehicle crashes 35.8% of these drivers, compared to only 6.7% for drivers involved in multiple-vehicle crashes. 65
76 5.4 Drug use among fatally injured drivers This section presents information on the presence of drugs, exclusively among drivers fatally injured in Alberta during Table 5-4 shows the prevalence of drug use among fatally injured drivers of highway vehicles as well as the number of drivers who tested positive for various categories of drugs. As can be seen, Alberta had a high testing rate in 2012, with 90.9% of fatally injured drivers being tested for drug use. Among fatally injured tested drivers, 82 out of 200 (41.0%) were positive for drugs. The most common category of drugs found within drivers testing positive for drug use was cannabis (43.9%). Other categories of drugs found in fatally injured drivers testing positive for drugs were narcotic analgesics (41.5%), CNS depressants (28.0%), CNS stimulants (24.4%), and dissociative anesthetics (4.9%). Table 5-4 Drug Use Among Fatally Injured Drivers of Highway Vehicles: Alberta, 2012 Prevalence of Drug Use Number of Drivers Tested Positive for Drugs Drivers Number % of total Number % of tested (90.9) 82 (41.0) Categories of Drugs Found Among Drivers Testing Positive Positive for Drug Type Drug Category Number of Drivers % of drivers testing positive* Cannabis Narcotic Analgesics CNS Depressants (43.9) (41.5) (28.0) CNS Stimulants 20 (24.4) Dissociative Anesthetics Hallucinogens Inhalants (4.9) (0.0) (0.0) * Percentages will not add up to 100% due to multiple drug types found in blood samples of some drivers. 5.5 Trends in alcohol and drug-impaired driving Sections 5.1 through 5.3 examined three indicators of the alcohol-crash problem: (1) the number and percent of people who died in crashes that involved alcohol; (2) the number and percent of fatally injured drivers who had been drinking; and (3) the number and percent of drivers in serious injury crashes that involved alcohol. Section 5.4 examined drug use among fatally injured drivers in This section examines changes in these four indicators over time Deaths in alcohol-related crashes: Table 5-5 and Figure 5-2 show the number and percent of people who died in crashes involving a drinking driver from 1995 to These results differ slightly from those in Section 5.1 for two reasons. First, deaths that occur in crashes that involve a drinking pedestrian are not necessarily classified as alcohol-related deaths. The focus here is more restrictive, on 66
77 deaths that occur in crashes involving at least one drinking driver. Second, the trend analyses focus on fatal crashes on public roadways involving principal vehicle types (where at least one of the vehicles involved is an automobile, truck/van, motorcycle or other highway vehicle). The previous analyses included all types of motorized vehicles (e.g., snowmobiles) on both public roadways and in off-road locations. Table 5-5 Number* and Percent of Motor Vehicle Deaths** Involving a Drinking Driver: Alberta, Persons Dying Within 12 Persons Dying Within 30 Days Months of Collision of Collision Year of Number of Alcohol-Related Deaths Number of Alcohol-Related Deaths Death Deaths Number % of total Deaths Number % of total baseline period * numbers are estimates based on the percent of deaths for which information was available to determine alcohol use. ** only on public roadways involving principal vehicle types. As shown in the figure, the number of deaths in crashes that involved a drinking driver generally decreased from a high of 182 in 1995 to 125 in The number fluctuated between 1999 and 2004, increased to 170 in 2007, dropped to a low of 109 in 2011, and rose again to 123 in The percentage of alcohol-related fatalities generally decreased from a high of 45.1% in 1996 to a low of 34.0% in 2004, eventually rose to 43.0% in 2009; decreased 35.5% in 2011, and rose again to 36.9% in As shown at the bottom of the table, during the baseline period, there was an average of 155 fatalities involving a drinking driver and they accounted for 39.5% of all fatalities. This means that the percent of fatalities involving a drinking driver decreased by 6.6% from 39.5% in the baseline period ( ) to 36.9% in the period. And, in terms of the number of persons killed in crashes involving a drinking driver, there has been a 25.2% decrease from an average of 155 in the baseline period to 116 in the period. 67
78 5.5.2 Alcohol use among fatally injured drivers: Data on alcohol use among fatally injured drivers over the 26-year period from are shown in Table 5-6. Trends are illustrated in Figure 5-3 which shows changes in the percent of fatally injured drivers who: (1) showed no evidence of alcohol (represented by the white area); (2) had BACs below the legal limit (shown by the light grey area); and (3) had BACs over the legal limit (the dark grey area). The data reported here are restricted to drivers who died in less than six hours after the crash (see Section 2.2.2). As can be seen, the percent of fatally injured drivers with BACs over the legal limit generally declined from 1987 (41.1%) to 2004 (28.5%), rose to 36.4% in 2007, dropped to 35.3% in 2008, rose slightly to 35.6% in 2009, decreased to 26.6% in 2011, and rose again in 2012 (31.8%). The percent of fatally injured drivers with zero BACs generally increased from 1987 (51.0%) to a peak of 67.9% in 1997, stabilized between 1999 and 2002, rose in 2004 (66.8%), decreased in 2007 (58.9%), rose in 2008 (60.1%) decreased in 2010 (58.3%), and rose again in 2012 (66.2%). The percent of fatally injured drivers with BACs between 1 and 80 mg% peaked in 1988 (9.3%), fell to 3.1% in 2001, rose in 2003 (7.0%), remained stable until 2008 (4.8%), rose until 2010 (7.8%), and decreased to its lowest level in 2012 (2.1%). When compared to the baseline period shown at the bottom of Table 5-6, the percentage of fatally injured drivers with zero BACs in the period increased by 10.8% (from 59.3% to 65.7%). Among drivers with BACs from 1-80 mg%, there was a 21.4% decrease (from 5.6% to 4.4%). And among those with BACs over 80 mg%, there was a 15.3% decrease (from 35.2% to 29.8%). 68
79 Table 5-6 Alcohol Use Among Fatally Injured Drivers of Highway Vehicles: Alberta, Year Number of Drivers Tested Drivers Grouped by BAC (mg%) Drivers* No. (% Total) Zero (% Tested) 1-80 (% Tested) >80 (% Tested) baseline (98.2) 128 (59.3) 12 (5.6) 76 (35.2) period (98.4) 119 (65.7) * dying in less than six hours. 8 (4.4) 54 (29.8) Table 5-7 and Figure 5-4 show data on alcohol use among fatally injured drivers over a shorter period from These results also differ from those reported above for several reasons. First, the number of drivers is extrapolated to reflect the BAC distribution of drivers tested for alcohol (see Figure 5-1). Second, 69

80 estimates are based on all fatally injured drivers, not just those who died in less than six hours from the crash. Third, drivers are grouped in only two BAC categories: zero and positive. As can be seen at the bottom of Table 5-7, the percentage of fatally injured drivers testing positive for alcohol from , the baseline period, is 40.2%. In the period, 33.2% of fatally injured drivers tested positive for alcohol, a 17.4% decrease from the baseline period. Table 5-7 Alcohol Use Among Fatally Injured Drivers of Highway Vehicles*: Alberta, Year Number of Drivers Grouped by BAC (mg%) Drivers Zero (% Tested) Positive (% Tested) (148.4) 93 (100.0) (56.0) 99 (44.0) (55.2) 94 (44.8) (65.3) 75 (34.7) (64.1) 83 (35.9) (65.8) 77 (34.2) (62.6) 77 (37.4) (67.7) 83 (32.3) (61.2) 97 (38.8) (66.0) 73 (34.0) (63.6) 75 (36.4) (60.5) 90 (39.5) (63.9) 83 (36.1) (60.5) 94 (39.5) (67.1) 74 (32.9) (60.1) 115 (39.9) (59.6) 115 (40.4) (59.3) 109 (40.7) (60.9) 108 (39.1) (58.6) 91 (41.4) (60.5) 88 (39.5) (67.4) 62 (32.6) (66.4) 74 (33.6) baseline period (59.8) (66.8) (40.2) (33.2) * numbers are estimates based on the BAC distribution of drivers tested for alcohol 70
81 5.5.3 Drivers in serious injury crashes: Table 5-8 and Figure 5-5 show information on drivers involved in alcohol-related serious injury crashes. As shown in Table 5-8, during the baseline period ( ), an average of 19.8% of drivers in serious injury crashes were in an alcohol-involved crash. This compares to 16.0% in the period, a 19.2% decrease in the problem. Table 5-8 Number and Percent of All Drivers in Serious Injury Crashes* that Involved Alcohol: Alberta, Year Number of Drivers Number in Alcohol- Involved Crashes Percent (24.2) (20.3) (24.9) (24.4) (22.9) (22.3) (23.2) (20.8) (20.1) (20.6) (20.6) (21.4) (20.0) (19.7) (18.9) (18.5) (16.6) (15.5) baseline (19.8) period (16.0) * single-vehicle nighttime crashes (SVN) as well as non-svn crashes that have police-reported alcohol involvement 71
82 Table 5-9 and Figure 5-6 also show information on drivers involved in alcohol-related serious injury crashes. These results differ slightly from those in Section 5.3 and in Table 5-8 and Figure 5-5 above because they exclude certain vehicle types e.g., bicycles, snowmobiles, farm tractors, and other non-highway vehicles. As can be seen, the incidence of alcohol-involvement in serious injury crashes has been relatively stable. Between 1995 and 2005 the percentage of drivers in serious injury crashes that involved alcohol generally dropped from 24.4% to 20.6%, rose to 21.8% in 2006, and decreased again to 15.7% in As shown Table 5-9, in the baseline period ( ) an average of 19.7% of drivers in serious injury crashes were in an alcohol-involved crash. In the period, the incidence of drivers in alcoholinvolved crashes decreased to 16.2%, a 17.8% decrease. Table 5-9 Number and Percent of Drivers* of Highway Vehicles in Serious Injury Crashes** that Involved Alcohol: Alberta, Year Number of Drivers Number in Alcohol- Involved Crashes Percent (24.4) (20.6) (25.5) (24.6) (23.3) (22.7) (23.1) (20.8) (20.3) (20.7) (20.6) (21.8) (20.0) (19.5) (18.7) (18.0) (16.7) (15.7) baseline period (19.7) (16.2) * excludes operators of bicycles, snowmobiles, farm tractors, and other nonhighway vehicles. ** single-vehicle nighttime crashes (SVN) as well as non-svn crashes that have police-reported alcohol involvement 72
83 5.5.4 Drug use among fatally injured drivers: Table 5-10 and Figure 5-7 show data on drug use among fatally injured drivers over a 13-year period ( ). Similar to Table 5-6, these results are based on fatally injured drivers of highway vehicles who died less than six hours after the crash (see Section 2.2.5). As can be seen at the bottom of Table 5-10, the percentage of fatally injured drivers testing positive for drugs from , the baseline period, is 40.5%. The percentage of fatally injured drivers testing positive for drugs was 36.1% in 2011 and 40.4% in From 2011 to 2012, the average percentage of fatally injured drivers testing positive for drugs was 38.6%, a 4.7% decrease from the baseline period. Table 5-10 Drug Use Among Fatally Injured Drivers* of Highway Vehicles: Alberta, Number of Drivers YEAR Drivers* Tested (% Total) Drivers Tested for Drugs Negative (% Tested) Positive (% Tested) baseline period * dying in less than six hours
84 74
85 6.0 SASKATCHEWAN This section of the report reviews the major findings on alcohol involvement in fatal and serious injury motor vehicle collisions as well as drug involvement in fatal motor vehicle collisions in Saskatchewan during It describes data on: > people who were killed in alcohol-related crashes (Section 6.1); > alcohol use among fatally injured drivers (Section 6.2); > drivers involved in alcohol-related serious injury crashes (Section 6.3); > drug use among fatally injured drivers (Section 6.4); and, > trends in the alcohol-crash and drug-crash problems (Section 6.5). 6.1 Deaths in alcohol-related crashes Table 6-1 presents information on people who died in alcohol-related crashes in Saskatchewan during 2012 for persons dying within 12 months of the collision (one calendar year) and for persons dying within 30 days of the collision. Motor vehicle deaths are categorized in terms of the victim s age, gender, type (i.e., driver, passenger, pedestrian) and the type of vehicle they occupied. In each section, the first column in the table presents the number of deaths. The next two columns show the number and percent of these fatalities in which sufficient information was available to determine if alcohol was involved. A motor vehicle fatality was considered to be alcohol involved if there was at least one drinking driver or drinking pedestrian in the fatal crash. For example, within the first section, it can be seen that among persons dying within 12 months of the collision, 18 people aged were killed in motor vehicle crashes in Saskatchewan during And, in 17 cases (94.4%) it was possible to determine if alcohol was a factor in the crash. The next column shows the number of people killed in crashes that were known to be alcohol-involved. There were nine people aged who died in alcohol-related crashes in Saskatchewan during The next column expresses this as a percentage i.e., 52.9% of the year olds who were killed died in an alcohol-related crash. The final column (percent of all alcohol-related deaths) expresses the number of deaths in alcohol-related crashes as a percent of all the deaths in such crashes. For example, the alcohol-related deaths among year olds represent 10.2% of all the people killed in alcohol-related crashes in Saskatchewan during An examination of the section for persons dying within 30 days of the collision shows that 18 persons aged died in motor vehicle crashes. In 17 of these cases (94.4%), it was possible to determine if alcohol was a factor in the crash. Among these persons, nine (52.9%) were alcohol-related deaths. And year olds accounted for 10.5% of people dying in alcohol-related crashes. The totals at the bottom of the table provide a summary. As can be seen, 203 persons died within 12 months of a motor vehicle crash in Saskatchewan during In 191 (94.1%) of these cases, it was possible 75
86 to determine if alcohol was a factor. Of these known cases, 88 (46.1%) involved alcohol. Extrapolating this figure to the total number of motor vehicle fatalities (203 x.461) it can be estimated that in Saskatchewan during 2012, 94 persons died in alcohol-related crashes within 12 months of the collision. Among the 200 persons dying within 30 days of the collision, it was possible to determine if alcohol was a factor in 94.0% of the cases. Of these known cases, 86 (45.7%) involved alcohol. Extrapolating this figure to the total number of motor vehicle fatalities (200 x.457) it can be estimated that in Saskatchewan during 2012, 91 persons died in alcohol-related crashes within 30 days of the collision. Category of Victim Age Group < > Gender Table 6-1 Deaths in Alcohol-Related Crashes: Saskatchewan, 2012 Persons Dying Within 12 Months of Collision No. of Deaths Alcohol Use Known % of No. total Alcohol-Related Deaths (ARDs) % of % of all No. known ARDs Persons Dying Within 30 Days of Collision No. of Deaths Alcohol Use Known % of No. total Alcohol-Related Deaths (ARDs) % of known Male Female Victim Type Driver/ Operator Passenger Pedestrian Vehicle Occupied Automobiles Trucks/Vans Motorcycles Other Hwy Vehicles Off-road Vehicles (Pedestrians) Collision Location Public Road Off-road % of all ARDs TOTAL No Victim age. Of all the people who died in alcohol-related crashes within 12 months of the collision, 31.8% (see last column in the first section) were aged 26-35; 18.2% were aged 36-45; 17.0% were aged 20-25; 12.5% were aged 46-55; 10.2% were aged 16-19; 9.1% were over age 55; and 1.1% were under 16. The highest incidence of alcohol involvement occurred in the crashes in which a person aged and died (70.0% and 55.6%, respectively). The lowest incidence of alcohol involvement was found among the youngest and oldest fatalities 0.0% of persons under 16 and 21.1% of the fatalities over 55 years of age died in crashes involving alcohol. 76
87 6.1.2 Gender. Of all the people who died in alcohol-related crashes within 12 months of the collision, 73.9% were males. The incidence of alcohol in crashes in which a male died (49.2%) was greater than the incidence of alcohol in crashes in which a female died (39.0%) Victim type. Of all the people who died in alcohol-related crashes within 12 months of the collision, 51.1% were drivers/operators of a vehicle; 28.4% were passengers; and 20.5% were pedestrians. Within each of the victim types, the highest incidence of alcohol involvement (78.3%) occurred in the crashes in which a pedestrian died. Alcohol was involved in 43.9% of the crashes in which a passenger died and 40.5% of those in which a driver/operator died Type of vehicle occupied. Of all the people who died in alcohol-related crashes within 12 months of the collision, 38.6% were truck/van occupants; 29.5% were automobile occupants; 10.2% were off-road vehicle occupants; and 1.1% were motorcyclists. Within each of these vehicle types, the incidence of alcohol involvement in which an off-road vehicle occupant died (69.2%) was greater than the incidence of alcohol crashes in which a truck/van occupant, automobile occupant or motorcyclist died (44.7%, 37.7% and 14.3%, respectively) Collision location. Of all the people who died in alcohol-related crashes within 12 months of the collision, 77.3% died in a collision which occurred on a public road and 22.7% died in an off-road collision. However, the incidence of alcohol involvement in which a victim died in an alcohol-related crash was much greater for those dying in off-road collisions (95.2%) than it was for persons dying in a collision which occurred on a public road (40.0%). 6.2 Alcohol in fatally injured drivers This section presents information on the presence of alcohol, exclusively among drivers fatally injured within 12 months of the collision in Saskatchewan during Table 6-2 shows the information by age group, gender, vehicle type, collision type (single vs. multiple), and duration between crash time and death time (within 12 months vs. within 30 days of the collision). The first column in the table shows the number of drivers killed. The next columns show the number and percent of these victims who were tested for alcohol. The remaining columns provide information on the results of the alcohol tests: the first three of these present results for drivers who showed any evidence of alcohol; the last three columns present information on drivers who had BACs over the statutory limit of 80 mg%. To illustrate, among year olds there were 11 drivers killed during 2012; all 11 of these fatally injured drivers (100.0%) were tested for alcohol. Of those who were tested, six (54.5%) were positive for alcohol. This means that fatally injured drinking drivers aged accounted for 18.2% of all drinking drivers who were killed. 77
88 Table 6-2 Alcohol Use Among Fatally Injured Drivers of Highway Vehicles: Saskatchewan, 2012 Category of Driver Age Group > Gender No. of Drivers Male Female Vehicle Type Automobiles Truck/Van Motorcycles Tractor Trailer Other Hwy. Veh Collision Type Single vehicle Multiple vehicle Duration Between Crash and Death Time Within 30 Days > 30 Days TOTAL Then, in the final three columns, it can be seen that five of the 11 (45.5%) fatally injured drivers aged who were tested for alcohol had BACs in excess of 80 mg%. This means that five of the six drivers who were positive for alcohol had BACs in excess of the legal limit. The final column expresses the number of drivers with illegal BACs as a percent of all drivers with BACs over the limit. Thus, drivers aged accounted for 17.2% of all the drivers with BACs over the legal limit. The main findings are shown by the totals at the bottom of the table. Saskatchewan had a very high testing rate in 2012, with 94.1% of fatally injured drivers being tested for alcohol use. In Saskatchewan, 34.7% had been drinking and 29 of 33 (87.9%) fatally injured drinking drivers had BACs over 80 mg%. Although not shown in the table, more refined analyses by different BAC categories show that among tested drivers: > 65.3% had BACs of zero mg%; > 3.2% had BACs from 1-49 mg%; > 1.1% had BACs from mg% > 5.3% had BACs from 81 to 160 mg%; and, > 25.3% had BACs over 160 mg%. Drivers Tested No. % of total No. Positive BAC % of tested % of all drivers with +BAC No. BAC >80 mg% % of tested % of all drivers with BAC >80 mg% 78
89 In Figure 6-1, the BAC distribution for tested fatally injured drivers is extrapolated to reflect the BAC distribution for all fatally injured drivers. In this figure 35 of 101 (34.7%) fatally injured drivers have a positive BAC. And among fatally injured drinking drivers, 31 (88.6%) have BACs over 80 mg% Age differences. Of all the fatally injured drinking drivers (i.e., those with a positive BAC), 33.3% were aged 26-35; 18.2% were aged and 46-55; 15.2% were aged 36-45; 9.1% were over 55; and 6.1% were aged Of all the fatally injured legally impaired drivers (i.e., those with BACs over 80 mg%), 37.9% were aged 26-35; 17.2% were aged 20-25, and 46-55; 6.9% were aged 16-19; and 3.4% were over 55 years of age. When comparing the incidence of drinking and driving among fatally injured drivers by age group, fatally injured drivers aged were the most likely to have been drinking (54.5%). By contrast, only 15.8% of the tested drivers over age 55 had been drinking Gender differences. Males dominate the picture they account for 78.8% of all the fatally injured drivers who had been drinking, and 82.8% of all of the fatally injured drivers who were legally impaired. Males dominate the picture largely because they account for most of the drivers who are killed (80 of the 101 drivers are males). However, fatally injured female drivers were slightly more likely to have been drinking than male drivers (36.8% and 34.2%, respectively). And, 92.3% of the male and 71.4% of the female drivers who were drinking had BACs over the legal limit Vehicle differences. Of all the fatally injured drinking drivers (i.e., those with a positive BAC), 60.6% were truck/van drivers; 36.4% were automobile drivers; and 3.0% were motorcyclists. Of all the fatally injured legally impaired drivers (i.e., those with BACs over 80 mg%), 62.1% were truck/van drivers, 34.5% were automobile drivers; and 3.4% were motorcyclists. Within each of the vehicle types, 43.5% of truck/van drivers, 30.8% of automobile drivers, and 14.3% of motorcyclists were found to have been drinking. Neither of the tractor-trailer drivers nor the lone other highway vehicle driver had been drinking. 79
90 6.2.4 Collision differences. Less than two-fifths of the drivers killed (39 of the 101) were involved in singlevehicle collisions but these crashes accounted for over two-thirds of the drivers who had been drinking or were legally impaired (66.7% and 75.9%, respectively). The reason for this apparent disparity is because alcohol is overrepresented in single-vehicle crashes. Over half of the drivers involved in single-vehicle crashes (57.9%) were positive for alcohol, compared to only 19.3% of those involved in multiple-vehicle collisions Duration between crash and death time. Only one fatally injured driver died more than 30 days after the collision, and this person tested negative for alcohol. Thus, a comparison of alcohol use among drivers based on differences in the duration between crash time and death time cannot be performed. 6.3 Drivers involved in alcohol-related serious injury crashes This section presents information on drivers involved in alcohol-related crashes in which someone was seriously injured in 2012 in Saskatchewan. A surrogate or indirect measure is used to estimate alcohol involvement because drivers in serious injury crashes are seldom tested for alcohol. A driver is identified as having been involved in an alcohol-related serious injury crash if the crash in which someone was seriously injured involved a single vehicle at night (SVN), or if, in the case of a non-svn serious injury crash, the police reported alcohol involvement i.e., at least one drinking driver in the crash (see Section 2.2.4). The results are shown in Table 6-3 for drivers grouped in terms of age, gender, type of vehicle driven, and type of collision. The first column shows the number of drivers involved in serious injury crashes. The number and percent of drivers in such crashes that involved alcohol is shown in the next two columns. The final column expresses the number of drivers involved in alcohol-related serious injury crashes in any row as a percent of all drivers involved in alcohol-related serious injury crashes. As shown, by the totals at the bottom of the table, 479 drivers were involved in crashes in which someone was seriously injured, and among these 28.2% were alcohol-related crashes Driver age. Of all the drivers involved in alcohol-related serious injury crashes, 25.2% were aged 20-25, 23.7% were aged 26-35; and 16.3% were aged Drivers under 16 and over 55 accounted for only 0.0% and 5.9% respectively of those involved in alcohol-related serious injury crashes. Two-fifths of the drivers aged and were involved in alcohol-related serious injury crashes (41.5% and 40.5%, respectively). The lowest incidence of involvement in alcohol-related crashes was found for those aged under 16 and over 55 (0.0% and 11.1%, respectively). 80
91 Age Table 6-3 Drivers in Alcohol-Related Serious Injury Crashes: Saskatchewan, 2012 Category of Drivers Alcohol-Related % of % of all drivers in Number total alcohol-related crashes < > unknown Gender Male Female unknown Vehicle Type Auto Truck/Van Motorcycle Tractor Trailer Other Hwy. Vehicle Off-Road Unknown Collision Type Number of Drivers Single-Vehicle Multiple-Vehicle TOTAL Driver gender. Of all the drivers involved in alcohol-related serious injury crashes, 73.3% were males. The incidence of involvement in alcohol-related serious injury crashes was also greater for males than for females (29.8% and 21.5%, respectively) Type of vehicle driven. Of all the drivers involved in alcohol-related serious injury crashes, 45.9% were automobile drivers; 41.5% were truck/van drivers; 4.4% were motorcyclists; and 3.7% were tractor-trailer drivers and off-road vehicle drivers. The highest incidence of involvement in alcohol-related serious injury crashes was found for automobile drivers 40.5% of these drivers were in crashes that involved alcohol, compared to 26.5% for truck/van drivers; 20.8% for off-road vehicle drivers; 16.2% for motorcyclists; and 10.6% for tractor-trailer drivers Type of collision. Of all the drivers involved in alcohol-related serious injury crashes, 72.6% of them were in single-vehicle crashes. The highest incidence of involvement in alcohol-related serious injury crashes was also found among drivers in single-vehicle crashes 50.3% of these drivers, compared to only 13.0% for drivers involved in multiple-vehicle crashes. 81
92 6.4 Drug use among fatally injured drivers This section presents information on the presence of drugs, exclusively among drivers fatally injured in Saskatchewan during Table 6-4 shows the prevalence of drug use among fatally injured drivers of highway vehicles as well as the number of drivers who tested positive for various categories of drugs. As can be seen, Saskatchewan had a high testing rate in 2012, with 88.1% of fatally injured drivers being tested for drug use. Table 6-4 Drug Use Among Fatally Injured Drivers of Highway Vehicles: Saskatchewan, 2012 Prevalence of Drug Use Number of Drivers Tested Positive for Drugs Drivers Number % of total Number % of tested (88.1) 34 (38.2) Categories of Drugs Found Among Drivers Testing Positive Positive for Drug Type Drug Category Number of % of drivers testing Drivers positive* CNS Depressants Cannabis CNS Stimulants Narcotic Analgesics Hallucinogens Dissociative Anesthetics Inhalants (41.2) (32.4) (17.6) (14.7) (0.0) (0.0) (0.0) * Percentages will not add up to 100% due to multiple drug types found in blood samples of some drivers. Among fatally injured tested drivers, 34 out of 89 (38.2%) were positive for drugs. The most common category of drugs found within drivers testing positive for drug use was CNS depressants (41.2%). Other categories of drugs found in fatally injured drivers testing positive for drugs were cannabis (32.4%), CNS stimulants (17.6%), and narcotic analgesics (14.7%). 6.5 Trends in alcohol and drug-impaired driving Sections 6.1 through 6.3 examined three indicators of the alcohol-crash problem: (1) the number and percent of people who died in crashes that involved alcohol (within 12 months and 30 days of the collision); (2) the number and percent of fatally injured drivers who had been drinking; and (3) the number and percent of drivers in serious injury crashes that involved alcohol. Section 6.4 examined drug use among fatally injured drivers in This section examines changes in these four indicators over time Deaths in alcohol-related crashes: Table 6-5 and Figure 6-2 show the number and percent of people who died in crashes involving a drinking driver from 1995 to These results differ slightly from those in Section 6.1 for two reasons. First, deaths that occur in crashes that involve a drinking 82
93 pedestrian are not necessarily classified as alcohol- related deaths. The focus here is more restrictive, on deaths that occur in crashes involving at least one drinking driver. Second, the trend analyses focus on fatal crashes on public roadways involving principal vehicle types (where at least one of the vehicles involved is an automobile, truck/van, motorcycle or other highway vehicle). The previous analyses included all types of motorized vehicles (e.g., snowmobiles) on both public roadways and in off-road locations. Table 6-5 Number* and Percent of Motor Vehicle Deaths** Involving a Drinking Driver: Saskatchewan, Persons Dying Within 12 Persons Dying Within 30 Days Months of Collision of Collision Year of Number of Alcohol-Related Deaths Number of Alcohol-Related Deaths Death Deaths Number % of total Deaths Number % of total baseline period * numbers are estimates based on the percent of deaths for which information was available to determine alcohol use. ** only on public roadways involving principal vehicle types. As shown in the table and figure, the number of deaths in crashes that involved a drinking driver generally decreased from 64 in 1995 to a low of 44 in 2004, increased to 74 in 2008, decreased to 63 in 2009, rose to 68 in 2010, and decreased again to 62 in 2011 and The percentage of alcohol-related fatalities generally decreased from 43.8% in 1995 to a low of 31.3% in 2005, peaked at 51.0% in 2008, and generally decreased to 36.0% in As shown at the bottom of the table, during the baseline period there was an average of 62 fatalities involving a drinking driver and they accounted for 43.4% of all fatalities. This means that the percent of fatalities involving a drinking driver decreased by 10.1% from 43.4% in the baseline period ( ) to 39.0% in the period. And, in terms of the number of persons killed in crashes involving a 83
94 drinking driver, there has been no change in the average of 62 in the baseline period ( ) to 62 in the period Alcohol use among fatally injured drivers: Data on alcohol use among fatally injured drivers over the 26-year period from are shown in Table 6-6. Trends are illustrated in Figure 6-3 which shows changes in the percent of fatally injured drivers who: (1) showed no evidence of alcohol (represented by the white area); (2) had BACs below the legal limit (shown by the light grey area); and (3) had BACs over the legal limit (the dark grey area). The data reported here are restricted to drivers who died in less than six hours after the crash (see Section 2.2.2). As can be seen, the percent of fatally injured drivers with BACs over the legal limit generally declined from 1987 (52.9%) to its lowest mark in 2006 (30.6%), rose in 2008 (49.4%), and generally decreased until 2012 (31.0%). The percent of fatally injured drivers with zero BACs increased from 1987 (40.0%) to its highest mark in 2000 (65.7%), remained relatively stable until 2007 (61.4%), declined in 2008 (45.8%), rose until 2010 (58.3%), decreased in 2011 (52.1%), and rose again in 2012 (64.3%). The percent of fatally injured drivers with BACs from 1-80 mg% peaked in 1991 (14.1%), dropped to its lowest mark in 1998 (1.4%), fluctuated until 2003 (3.7%), generally rose until 2006 (8.3%), and remained relatively stable until 2012 (4.8%). When compared to the baseline period shown at the bottom of Table 6-6, the percentage of fatally injured drivers with zero BACs in the period increased by 5.1% (from 55.4% to 58.2%). Among drivers with BACs from 1-80 mg%, there was a 15.0% decrease (from 6.0% to 5.1%). And among those with BACs over 80 mg%, there was a 4.9% decrease (from 38.6% to 36.7%). 84
95 Table 6-6 Alcohol Use Among Fatally Injured Drivers of Highway Vehicles: Saskatchewan, Year Number of Drivers Tested Drivers Grouped by BAC (mg%) Drivers* No. (% Total) Zero (% Tested) 1-80 (% Tested) >80 (% Tested) baseline (95.4) 46 (55.4) 5 (6.0) 32 (38.6) period (95.2) 46 (58.2) * dying in less than six hours. 4 (5.1) 29 (36.7) Table 6-7 and Figure 6-4 show data on alcohol use among fatally injured drivers over a shorter period from These results also differ from those reported above for several reasons. First, the number of drivers is extrapolated to reflect the BAC distribution of drivers tested for alcohol (see Figure 6-1). Second, estimates are based on all fatally injured drivers, not just those who died in less than six hours from the crash. Third, drivers are grouped in only two BAC categories: zero and positive. 85

96 As can be seen at the bottom of Table 6-7, the percentage of fatally injured drivers testing positive for alcohol from , the baseline period, is 44.3%. In the period, 39.6% of fatally injured drivers tested positive for alcohol, an 10.6% decrease from the baseline period. Table 6-7 Alcohol Use Among Fatally Injured Drivers of Highway Vehicles*: Saskatchewan, Year Number of Drivers Drivers Grouped by BAC (mg%) Zero (% Tested) Positive (% Tested) (57.0) 40 (43.0) (47.7) 46 (52.3) (51.4) 36 (48.6) (60.0) 36 (40.0) (59.5) 32 (40.5) (53.1) 38 (46.9) (58.9) 30 (41.1) (61.5) 30 (38.5) (63.5) 31 (36.5) (53.1) 45 (46.9) (65.1) 29 (34.9) (49.5) 50 (50.5) (52.0) 36 (48.0) (60.9) 36 (39.1) (54.2) 33 (45.8) (59.8) 33 (40.2) (61.4) 34 (38.6) (61.9) 37 (38.1) (44.8) 53 (55.2) (56.3) 45 (43.7) (55.0) 45 (45.0) (55.6) 40 (44.4) (65.3) 35 (34.7) baseline (55.7) 43 (44.3) (60.4) 38 (39.6) period * numbers are estimates based on the BAC distribution of drivers tested for alcohol 86
, an average of 29.5% of drivers in serious injury crashes were in an alcohol-involved crash. This percentage decreased to 26.3% in 2011, then rose to 28.")
97 6.5.3 Drivers in serious injury crashes: Table 6-8 and Figure 6-5 show information on drivers involved in alcohol-related serious injury crashes. During the baseline period ( ), an average of 29.5% of drivers in serious injury crashes were in an alcohol-involved crash. This percentage decreased to 26.3% in 2011, then rose to 28.2% in From 2011 to 2012, an average of 27.3% of drivers in serious injury crashes were in an alcohol-involved crash. This represents a 6.8% decrease in the problem compared to the baseline period. Table 6-8 Number and Percent of All Drivers in Serious Injury Crashes* that Involved Alcohol: Saskatchewan, Year Number of Drivers Number in Alcohol- Involved Crashes Percent (24.6) (25.7) (23.1) (25.8) (25.2) (26.3) (27.9) (29.0) (26.8) (25.5) (27.5) (26.9) (30.6) (32.6) (27.7) (29.2) (26.3) (28.2) baseline (29.5) (27.3) period * single-vehicle nighttime crashes (SVN) as well as non-svn crashes that have police-reported alcohol involvement 87
98 Table 6-9 and Figure 6-6 also show information on drivers involved in alcohol-related serious injury crashes. These results differ slightly from those in Section 6.3 and in Table 6-8 and Figure 6-5 above because they exclude certain vehicle types e.g., bicycles, snowmobiles, farm tractors and other non-highway vehicles. As can be seen, the incidence of alcohol-involvement in serious injury crashes has increased gradually until 2002, declined until 2004, and generally increased in the past six years. Between 1995 and 2002 the percentage of all drivers in serious injury crashes that involved alcohol generally rose from 25.0% to 29.5%, peaked at 33.2% in 2008, decreased to 27.7% in 2009, rose to 28.9% in 2010, decreased in 2011 (27.8%), and rose again in 2012 (28.6%). In the baseline period ( ), an average of 29.5% of highway vehicle drivers in serious injury crashes were in an alcohol-involved crash. From 2011 to 2012, the average percentage of drivers in alcohol-involved crashes declined to 28.3%, a 4.1% decrease from the baseline period. Table 6-9 Number and Percent of Drivers* of Highway Vehicles in Serious Injury Crashes** that Involved Alcohol: Saskatchewan, Year Number of Drivers Number in Alcohol- Involved Crashes Percent (25.0) (25.6) (23.4) (26.3) (25.8) (26.4) (28.1) (29.5) (26.5) (25.4) (27.5) (26.8) (30.7) (33.2) (27.7) (28.9) (27.8) (28.6) baseline (29.5) (28.3) period * excludes operators of bicycles, snowmobiles, farm tractors, and other nonhighway vehicles. ** single-vehicle nighttime crashes (SVN) as well as non-svn crashes that have police-reported alcohol involvement 88
99 6.5.4 Drug use among fatally injured drivers: Table 6-10 and Figure 6-7 show data on drug use among fatally injured drivers over a 13-year period ( ). Similar to Table 6-6, these results are based on fatally injured drivers of highway vehicles who died less than six hours after the crash (see Section 2.2.5). As can be seen at the bottom of Table 6-10, the percentage of fatally injured drivers testing positive for drugs from , the baseline period, is 37.8%. The percentage of fatally injured drivers testing positive for drugs was 42.5% in 2011 and 42.0% in From 2011 to 2012, the average percentage of fatally injured drivers testing positive for drugs was 42.3%, an 11.9% increase from the baseline period. Table 6-10 Drug Use Among Fatally Injured Drivers* of Highway Vehicles: Saskatchewan, Number of Drivers YEAR Drivers* Tested (% Total) Drivers Tested for Drugs Negative (% Tested) Positive (% Tested) baseline period * dying in less than six hours

100 90
101 7.0 MANITOBA This section of the report reviews the major findings on alcohol involvement in fatal and serious injury motor vehicle collisions as well as drug involvement in fatal motor vehicle collisions in Manitoba during It describes data on: > people who were killed in alcohol-related crashes (Section 7.1); > alcohol use among fatally injured drivers (Section 7.2); > drivers involved in alcohol-related serious injury crashes (Section 7.3); > drug use among fatally injured drivers (Section 7.4); and, > trends in the alcohol-crash and drug-crash problems (Section 7.5). 7.1 Deaths in alcohol-related crashes Table 7-1 presents information on people who died in alcohol-related crashes in Manitoba during 2012 for persons dying within 12 months of the collision (one calendar year) and for persons dying within 30 days of the collision. Motor vehicle deaths are categorized in terms of the victim s age, gender, type (i.e., driver, passenger, pedestrian) and the type of vehicle they occupied. In each section, the first column in the table presents the number of deaths. The next two columns show the number and percent of these fatalities in which sufficient information was available to determine if alcohol was involved. A motor vehicle fatality was considered to be alcohol involved if there was at least one drinking driver or drinking pedestrian in the fatal crash. For example, within the first section, it can be seen that among persons dying within 12 months of the collision, 19 people aged were killed in motor vehicle crashes in Manitoba during And, in 19 cases (100.0%) it was possible to determine if alcohol was a factor in the crash. The next column shows the number of people killed in crashes that were known to be alcohol-involved. Thirteen people aged died in alcohol-related crashes in Manitoba during The next column expresses this as a percentage i.e., 68.4% of the year olds who were killed died in an alcohol-related crash. The final column (percent of all alcohol-related deaths) expresses the number of deaths in alcohol-related crashes as a percent of all the deaths in such crashes. For example, the alcohol-related deaths among year olds represent 26.0% of all the people killed in alcohol-related crashes in Manitoba during An examination of the section for persons dying within 30 days of the collision shows that 19 persons aged died in motor vehicle crashes. In 19 of these cases (100.0%), it was possible to determine if alcohol was a factor in the crash. Among these persons, 13 (68.4%) were alcohol-related deaths. And year olds accounted for 26.0% of people dying in alcohol-related crashes. The totals at the bottom of the table provide a summary. As can be seen, 115 persons died within 12 months of a motor vehicle crash in Manitoba during In 110 (95.7%) of these cases, it was possible to 91
102 determine if alcohol was a factor. Of these known cases, 50 (45.5%) involved alcohol. Extrapolating this figure to the total number of motor vehicle fatalities (115 x.455) it can be estimated that in Manitoba during 2012, 53 persons died in alcohol-related crashes within 12 months of the collision. Among the 110 persons dying within 30 days of the collision, it was possible to determine if alcohol was a factor in 97.3% of the cases. Of these known cases, 50 (46.7%) involved alcohol. Extrapolating this figure to the total number of motor vehicle fatalities (110 x.467) it can be estimated that in Manitoba during 2012, 51 persons died in alcohol-related crashes within 30 days of the collision. Category of Victim Age Group < > Gender Table 7-1 Deaths in Alcohol-Related Crashes: Manitoba, 2012 Persons Dying Within 12 Months of Collision No. of Deaths Alcohol Use Known No. % of total Alcohol-Related Deaths (ARDs) % of % of all No. known ARDs Persons Dying Within 30 Days of Collision No. of Deaths Alcohol Use Known % of No. total Alcohol-Related Deaths (ARDs) % of known Male Female Victim Type Driver/ Operator Passenger Pedestrian Unknown Vehicle Occupied Automobiles Trucks/Vans Other Vehicles* (Pedestrians) Unknown % of all ARDs Collision Location Public Road Off-road TOTAL * Motorcyclists and off-road vehicle occupants have been aggregated to ensure that an individual will not be identified. No Victim age. Of all the people who died in alcohol-related crashes within 12 months of the collision, 26.0% (see last column of the first section) were aged and 26-35; 18.0% were aged 36-45; 16.0% were aged 16-19; 8.0% were aged 46-55; and 6.0% were over age 55. The highest incidence of alcohol involvement occurred in the crashes in which a person aged died (81.8%). The lowest incidence of alcohol involvement was found among the youngest and oldest fatalities as only 0.0% of fatalities among those under 16 and 11.1% of the fatalities over 55 years of age died in crashes involving alcohol. 92
103 7.1.2 Gender. Of all the people who died in alcohol-related crashes within 12 months of the collision, 86.0% were males. The incidence of alcohol in crashes in which a male died (58.9%) was greater than the incidence of alcohol in crashes in which a female died (18.9%) Victim type. Of all the people who died in alcohol-related crashes within 12 months of the collision, 66.0% were drivers/operators of a vehicle; 22.0% were passengers; and 12.0% were pedestrians. Within each of the victim types, the highest incidence of alcohol involvement (49.3%) occurred in the crashes in which a driver/operator died. Alcohol was involved in 40.0% of the crashes in which a pedestrian died and 39.3% of those in which a passenger died Type of vehicle occupied. Motorcyclists and off-road vehicle occupants have been regrouped into other vehicles to ensure that individuals cannot be identified. Of all the people who died in alcohol-related crashes within 12 months of the collision, 36.0% were automobile occupants; 28.0% were truck/van occupants; and 22.0% were occupants of other vehicles. Within each of these vehicle types, the incidence of alcohol involvement in which an occupant of another vehicle died was greater than the incidence of alcohol in crashes in which a truck/van occupant or automobile occupant died (61.1% versus 50.0% and 37.5%) Collision location. Of all the people who died in alcohol-related crashes within 12 months of the collision, 86.0% died in a collision which occurred on a public road and 14.0% died in an off-road collision. However, the incidence of alcohol involvement in which a victim died in an alcohol-related crash was greater for those dying in off-road collisions (58.3%) than it was for persons dying in collisions on public roads (43.9%). 7.2 Alcohol in fatally injured drivers This section presents information on the presence of alcohol, exclusively among drivers fatally injured within 12 months of the collision in Manitoba during Table 7-2 shows the information by age group, gender, vehicle type, collision type (single vs. multiple), and duration between crash time and death time (within 12 months vs. within 30 days of the collision). The first column in the table shows the number of drivers killed. The next columns show the number and percent of these victims who were tested for alcohol. The remaining columns provide information on the results of the alcohol tests the first three of these present results for drivers who showed any evidence of alcohol; the last three columns present information on drivers who had BACs over the statutory limit of 80 mg%. To illustrate, among those aged there were five drivers killed during 2012; all five of these fatally injured drivers (100.0%) were tested for alcohol. Of those who were tested, two (40.0%) were positive for alcohol. This means fatally injured drinking drivers aged accounted for 8.3% of all drinking drivers who were killed. 93
104 Then, in the final three columns, it can be seen that one (20.0%) fatally injured driver aged who was tested for alcohol had a BAC in excess of 80 mg%. This means that one of the two drivers who were positive for alcohol had a BAC in excess of the legal limit. The final column expresses the number of drivers with illegal BACs as a percent of all drivers with BACs over the limit. Thus, drivers aged accounted for 5.9% of all the drivers with BACs over the legal limit. The main findings are shown by the totals at the bottom of the table. Manitoba had a very high testing rate in 2012, with 92.6% of fatally injured drivers being tested for alcohol use. Table 7-2 Alcohol Use Among Fatally Injured Drivers of Highway Vehicles: Manitoba, 2012 Drivers Tested Positive BAC BAC >80 mg% Category of No. of % of all % of all drivers % of % of % of Driver Drivers No. No. drivers with No. with BAC >80 total tested tested +BAC mg% Age Group > Gender Male Female Vehicle Type Automobiles Other Hwy Veh.* Collision Type Single vehicle Multiple vehicle Duration Between Crash and Death Time Within 30 Days > 30 Days TOTAL * Truck/van drivers and motorcyclists have been aggregated to ensure that an individual will not be identified. In Manitoba, 48.0% had been drinking and 17 of 24 (70.8%) fatally injured drinking drivers had BACs over 80 mg%. Although not shown in the table, more refined analyses by different BAC categories show that among tested drivers: > 52.0% had BACs of zero mg%; > 10.0% had BACs from 1-49 mg%; > 4.0% had BACs from mg% > 4.0% had BACs from 81 to 160 mg%; and, 94
105 > 30.0% had BACs over 160 mg%. In Figure 7-1, the BAC distribution for tested fatally injured drivers is extrapolated to reflect the BAC distribution for all fatally injured drivers. In this figure, 26 of 54 (48.1%) fatally injured drivers have a positive BAC. And among fatally injured drinking drivers, 18 (69.2%) have BACs over 80 mg% Age differences. Of all the fatally injured drinking drivers (i.e., those with a positive BAC), 37.5% were aged 26-35; 20.8% were aged 36-45; 16.7% were aged 20-25; and 8.3% were aged 16-19, and over 55. Of all the fatally injured legally impaired drivers (i.e., those with BACs over 80 mg%), 41.2% were aged 26-35; 17.6% were aged 36-45; 11.8% were aged 20-25, and over 55; and 5.9% were aged When comparing the incidence of drinking and driving among fatally injured drivers by age group, fatally injured drivers aged were the most likely to have been drinking (83.3%). By contrast, 15.4% of the tested drivers over age 55 had been drinking Gender differences. Males dominate the picture as they account for 87.5% of all the fatally injured drivers who had been drinking and 94.1% of all of the fatally injured drivers who were legally impaired. Males dominate the picture largely because they account for 37 of the 54 drivers (68.5%) who are killed. Fatally injured male drivers were more likely to have been drinking than female drivers (61.8% and 18.8%, respectively). And, 76.2% of the male drivers and 33.3% of the female drivers who were drinking had BACs over the legal limit Vehicle differences. Truck/van drivers and motorcyclists have been regrouped into other highway vehicles to ensure that individuals cannot be identified. Of all the fatally injured drinking drivers (i.e., those with a positive BAC), 54.2% were drivers of other highway vehicles and 45.8% were automobile drivers. Of all the fatally injured legally impaired drivers (i.e., those with BACs over 80 mg%), 58.8% were drivers of other highway vehicles and 41.2% were automobile drivers. Within each of the vehicle types, 61.9% of fatally injured drivers of other highway vehicles and 37.9% of automobile drivers had been drinking. 95
106 7.2.4 Collision differences. Less than half of the drivers killed (26 of the 54) were involved in single-vehicle collisions but these crashes accounted for a vast majority of the drivers who had been drinking or were legally impaired (75.0% and 82.4%, respectively). The reason for this apparent disparity is because alcohol is overrepresented in single-vehicle crashes. Almost three-quarters of the drivers involved in single-vehicle crashes (72.0%) were positive for alcohol compared to 24.0% of those involved in multiple-vehicle collisions Duration between crash and death time. Given that only one fatally injured driver died more than 30 days after the collision, and this driver was not tested for alcohol, a comparison of alcohol use among drivers based on differences in the duration between crash time and death time cannot be performed. 7.3 Drivers involved in alcohol-related serious injury crashes This section presents information on drivers involved in alcohol-related crashes in which someone was seriously injured in 2012 in Manitoba. A surrogate or indirect measure is used to estimate alcohol involvement because drivers in serious injury crashes are seldom tested for alcohol. A driver is identified as having been involved in an alcohol-related serious injury crash if the crash in which someone was seriously injured involved a single vehicle at night (SVN), or if, in the case of a non-svn serious injury crash, the police reported alcohol involvement i.e., at least one drinking driver in the crash (see Section 2.2.4). The results are shown in Table 7-3 for drivers grouped in terms of age, gender, type of vehicle driven, and type of collision. The first column shows the number of drivers involved in serious injury crashes. The number and percent of drivers in such crashes that involved alcohol is shown in the next two columns. The final column expresses the number of drivers involved in alcohol-related serious injury crashes in any row as a percent of all drivers involved in alcohol- related serious injury crashes. As shown, by the totals at the bottom of the table, 448 drivers were involved in crashes in which someone was seriously injured, and among these 10.7% were alcohol-related crashes Driver age. Of all the drivers involved in alcohol-related serious injury crashes, 29.2% were aged 20-25; 18.8% were aged and over 55; and 14.6% were aged and Drivers aged accounted for 4.2% of those involved in alcohol-related serious injury crashes. Approximately one-fifth of the drivers aged were involved in alcohol-related serious injury crashes (20.3%). The lowest incidence of involvement in alcohol-related crashes was found for those under 16 (0.0%) Driver gender. Of all the drivers involved in alcohol-related serious injury crashes, 66.7% were males. The incidence of involvement in alcohol-related serious injury crashes was greater for males than for females (11.9% and 8.9%) Type of vehicle driven. Of all the drivers involved in alcohol-related serious injury crashes, 62.5% were automobile drivers; 31.3% were truck/van drivers; 4.2% were motorcyclists; and 2.1% were off-road vehicle drivers. 96
107 The highest incidence of involvement in alcohol-related serious injury crashes was found for motorcyclists (12.5%) compared to 11.8% for automobile drivers; 10.0% for off-road vehicle drivers, and 9.0% for truck/van drivers. Age Table 7-3 Drivers in Alcohol-Related Serious Injury Crashes: Manitoba, 2012 Category of Drivers Type of collision. Of all the drivers involved in alcohol-related serious injury crashes, 87.5% of them were in single-vehicle crashes. The highest incidence of involvement in alcohol-related serious injury crashes was also found among drivers in single-vehicle crashes 30.7% of these drivers, compared to only 1.9% for drivers involved in multiple-vehicle crashes. 7.4 Drug use among fatally injured drivers Alcohol-Related % of % of all drivers in Number total alcohol-related crashes < > Gender Male Female Vehicle Type Auto Truck/Van Motorcycle Other Hwy. Vehicle Off-Road Collision Type Number of Drivers Single-Vehicle Multiple-Vehicle TOTAL This section presents information on the presence of drugs, exclusively among drivers fatally injured in Manitoba during Table 7-4 shows the prevalence of drug use among fatally injured drivers of highway vehicles as well as the number of drivers who tested positive for various categories of drugs. As can be seen, Manitoba had a very high testing rate in 2012, with 92.6% of fatally injured drivers being tested for drug use. 97
108 Among fatally injured tested drivers, 24 out of 50 (48.0%) were positive for drugs. The most common category of drugs found within drivers testing positive for drug use was CNS depressants (58.3%). Other categories of drugs found in fatally injured drivers testing positive for drugs were narcotic analgesics (37.5%), and CNS stimulants (25.0%). Table 7-4 Drug Use Among Fatally Injured Drivers of Highway Vehicles: Manitoba, 2012 Prevalence of Drug Use Number of Drivers Tested Positive for Drugs Drivers Number % of total Number % of tested (92.6) 24 (48.0) Categories of Drugs Found Among Drivers Testing Positive Positive for Drug Type Drug Category Number of % of drivers testing Drivers positive* CNS Depressants Narcotic Analgesics CNS Stimulants Cannabis Hallucinogens (58.3) (37.5) (25.0) (0.0) (0.0) Dissociative Anesthetics Inhalants 0 0 (0.0) (0.0) * Percentages will not add up to 100% due to multiple drug types found in blood samples of some drivers. 7.5 Trends in alcohol and drug-impaired driving Sections 7.1 through 7.3 examined three indicators of the alcohol-crash problem: (1) the number and percent of people who died in crashes that involved alcohol; (2) the number and percent of fatally injured drivers who had been drinking; and (3) the number and percent of drivers in serious injury crashes that involved alcohol. Section 7.4 examined drug use among fatally injured drivers in This section examines changes in these four indicators over time Deaths in alcohol-related crashes: Table 7-5 and Figure 7-2 show the number and percent of people who died in crashes involving a drinking driver from 1995 to These results differ slightly from those in Section 7.1 for two reasons. First, deaths that occur in crashes that involve a drinking pedestrian are not necessarily classified as alcohol-related deaths. The focus here is more restrictive, on deaths that occur in crashes involving at least one drinking driver. Second, the trend analyses focus on fatal crashes on public roadways involving principal vehicle types (where at least one of the vehicles involved is an automobile, truck/van, motorcycle or other highway vehicle). The previous analyses included all types of motorized vehicles (e.g., snowmobiles) on both public roadways and in off-road locations. 98
109 As shown in the table and figure, the number of deaths in crashes that involved a drinking driver generally dropped from 46 to a low of 29 between 1995 and The number of alcohol-related fatalities generally increased to 46 in 2007, decreased to 34 in 2009, rose to 42 in 2011, and decreased to 38 in The percentage of alcohol-related fatalities increased from 34.8% in 1995 to 40.2% in 2003, decreased to a low of 28.0% in 2005, peaked in 2008 (55.7%), decreased to 38.2% in 2009, rose to 42.0% in 2010, decreased to 37.5% in 2011, and rose to 38.4% in As shown at the bottom of the table, during the baseline period there was an average of 41 fatalities involving a drinking driver and they accounted for 41.8% of all fatalities. This means that the percent of fatalities involving a drinking driver decreased by 9.8% from 41.8% in the baseline period ( ) to 37.7% in the period. In terms of the number of persons killed in crashes involving a drinking driver, there was a 2.4% decrease from an average of 41 in the baseline period ( ) to 40 in the period. Table 7-5 Number* and Percent of Motor Vehicle Deaths** Involving a Drinking Driver: Manitoba, Persons Dying Within 12 Persons Dying Within 30 Days Months of Collision of Collision Year of Number of Alcohol-Related Deaths Number of Alcohol-Related Deaths Death Deaths Number % of total Deaths Number % of total baseline period * numbers are estimates based on the percent of deaths for which information was available to determine alcohol use. ** only on public roadways involving principal vehicle types
 showed no evidence of alcohol (represented by the white area); (2) had BACs below the legal")
.")
110 7.5.2 Alcohol use among fatally injured drivers: Data on alcohol use among fatally injured drivers over the 26-year period from are shown in Table 7-6. Trends are illustrated in Figure 7-3 which shows changes in the percent of fatally injured drivers who: (1) showed no evidence of alcohol (represented by the white area); (2) had BACs below the legal limit (shown by the light grey area); and (3) had BACs over the legal limit (the dark grey area). The data reported here are restricted to drivers who died in less than six hours after the crash (see Section 2.2.2). As can be seen, the percent of fatally injured drivers with BACs over the legal limit generally declined from 1987 (60.0%) to a low of 18.8% in 2005, fluctuated until 2010 (35.0%), decreased in 2011 (22.8%), and rose again in 2012 (31.1%). The percent of fatally injured drivers with zero BACs generally increased from a low of 33.0% in 1987 to its highest level in 2005 (79.2%), decreased in 2008 (38.1%), generally increased until 2011 (70.2%), and decreased again in 2012 (53.3%). The percent of fatally injured drivers with BACs between 1 and 80 mg% peaked in 1994 (18.9%), dropped to a low of 1.9% in 2001, generally increased until 2008 (16.7%), decreased until 2011 (7.0%), and rose again in 2012 (15.6%). When compared to the baseline period shown at the bottom of Table 7-6, the percentage of fatally injured drivers with zero BACs in the period increased by 16.5% (from 53.8% to 62.7%). Among drivers with BACs from 1-80 mg%, there was a 2.1% increase (from 9.6% to 9.8%) and among those with BACs over 80 mg%, there was a 24.7% decrease (from 36.5% to 27.5%). 100
111 Table 7-6 Alcohol Use Among Fatally Injured Drivers of Highway Vehicles: Manitoba, Year Number of Drivers Tested Drivers Grouped by BAC (mg%) Drivers* No. (% Total) Zero (% Tested) 1-80 (% Tested) >80 (% Tested) baseline period (98.1) (100.0) (53.8) (62.7) 5 5 (9.6) (9.8) (36.5) (27.5) * dying in less than six hours. Table 7-7 and Figure 7-4 show data on alcohol use among fatally injured drivers over a shorter period from These results also differ from those reported above for several reasons. First, the number of drivers is extrapolated to reflect the BAC distribution of drivers tested for alcohol (see Figure 7-1). Second, estimates are based on all fatally injured drivers, not just those who died in less than six hours from the crash. Third, drivers are grouped in only two BAC categories: zero and positive. 101

112 As can be seen at the bottom of Table 7-7, the percentage of fatally injured drivers testing positive for alcohol from , the baseline period, is 45.8%. In the period, 38.6% of fatally injured drivers tested positive for alcohol, a 15.7% decrease from the baseline period. Table 7-7 Alcohol Use Among Fatally Injured Drivers of Highway Vehicles*: Manitoba, Year Number of Drivers Drivers Grouped by BAC (mg%) Zero (% Tested) Positive (% Tested) (50.0) 32 (50.0) (43.1) 41 (56.9) (50.0) 29 (50.0) (51.5) 33 (48.5) (45.3) 35 (54.7) (60.0) 28 (40.0) (43.8) 27 (56.3) (60.0) 26 (40.0) (65.7) 23 (34.3) (66.7) 20 (33.3) (62.7) 25 (37.3) (62.9) 23 (37.1) (62.7) 22 (37.3) (46.8) 33 (53.2) (59.6) 23 (40.4) (76.4) 13 (23.6) (61.1) 28 (38.9) (56.5) 30 (43.5) (38.3) 29 (61.7) (55.6) 28 (44.4) (57.8) 19 (42.2) (70.5) 18 (29.5) (51.9) 26 (48.1) baseline (54.2) 27 (45.8) period (61.4) 22 (38.6) * numbers are estimates based on the BAC distribution of drivers tested for alcohol 102
113 7.5.3 Drivers in serious injury crashes: Table 7-8 and Figure 7-5 show information on drivers involved in alcohol-related serious injury crashes. As shown in Table 7-8, during the baseline period ( ), an average of 18.3% of drivers in serious injury crashes were in an alcohol-involved crash. This compares to 13.2% in the period, a 27.9% decrease in the problem. Year Number of Drivers Number in Alcohol- Involved Crashes Percent (22.7) (21.4) (25.8) (22.4) (19.9) (18.7) (18.6) (20.2) (18.9) (16.9) (19.0) (17.5) (21.4) (15.3) (18.1) (19.6) (15.6) (10.7) baseline (18.3) period Table 7-8 Number and Percent of All Drivers in Serious Injury Crashes* that Involved Alcohol: Manitoba, (13.2) * single-vehicle nighttime crashes (SVN) as well as non-svn crashes that have police-reported alcohol involvement 103
114 Table 7-9 and Figure 7-6 also show information on drivers involved in alcohol-related serious injury crashes. These results differ slightly from those in Section 7.3 and in Table 7-8 and Figure 7-5 above because they exclude certain vehicle types e.g., bicycles, snowmobiles, farm tractors and other non-highway vehicles. As can be seen, the incidence of alcohol-involvement in serious injury crashes has generally declined. Between 1995 and 2004 the percentage of all drivers in serious injury crashes that involved alcohol generally decreased from 22.9% to 17.3%, rose to 22.1% in 2007, decreased to 15.6% in 2008, rose to 18.8% in 2009, and decreased again to 10.7% in In the baseline period ( ), an average of 18.4% of drivers in serious injury crashes were in an alcohol-involved crash. During the period, the incidence of drivers in alcohol-involved crashes dropped to 13.1%, a 28.8% decrease. Table 7-9 Number and Percent of Drivers* of Highway Vehicles in Serious Injury Crashes** that Involved Alcohol: Manitoba, Year Number of Drivers (22.9) (21.6) (25.7) (23.0) (20.2) (18.7) (19.3) (20.6) (19.2) (17.3) (19.1) (17.3) (22.1) (15.6) (18.8) (18.5) (15.6) (10.7) baseline (18.4) period Number in Alcohol- Involved Crashes Percent (13.1) * excludes operators of bicycles, snowmobiles, farm tractors, and other nonhighway vehicles. ** single-vehicle nighttime crashes (SVN) as well as non-svn crashes that have police-reported alcohol involvement 104
.")
115 7.5.4 Drug use among fatally injured drivers: Table 7-10 and Figure 7-7 show data on drug use among fatally injured drivers over a 13-year period ( ). Similar to Table 7-6, these results are based on fatally injured drivers of highway vehicles who died less than six hours after the crash (see Section 2.2.5). As can be seen at the bottom of Table 7-10, the percentage of fatally injured drivers testing positive for drugs from , the baseline period, is 35.3%. In the period, 38.0% of fatally injured drivers tested positive for drugs, a 7.6% increase from the baseline period baseline period * dying in less than six hours. Table 7-10 Drug Use Among Fatally Injured Drivers of Highway Vehicles: Manitoba, Number of Drivers YEAR Drivers* Tested (% Total) Drivers Tested for Drugs Negative (% Tested) Positive (% Tested)
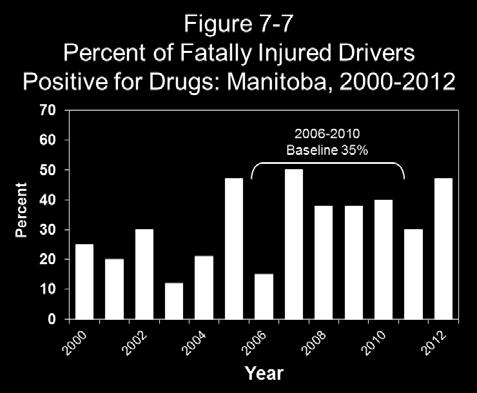
116 106
117 8.0 ONTARIO This section of the report reviews the major findings on alcohol involvement in fatal and serious injury motor vehicle collisions as well as drug involvement in fatal motor vehicle collisions in Ontario during It describes data on: > people who were killed in alcohol-related crashes (Section 8.1); > alcohol use among fatally injured drivers (Section 8.2); > drivers involved in alcohol-related serious injury crashes (Section 8.3); > drug use among fatally injured drivers (Section 8.4); and, > trends in the alcohol-crash and drug-crash problems (Section 8.5). 8.1 Deaths in alcohol-related crashes Table 8-1 presents information on people who died in alcohol-related crashes in Ontario during 2012 for persons dying within 12 months of the collision (one calendar year) and for persons dying within 30 days of the collision. Motor vehicle deaths are categorized in terms of the victim s age, gender, type (i.e., driver, passenger, pedestrian) and the type of vehicle they occupied. In each section, the first column in the table presents the number of deaths. The next two columns show the number and percent of these fatalities in which sufficient information was available to determine if alcohol was involved. A motor vehicle fatality was considered to be alcohol involved if there was at least one drinking driver or drinking pedestrian in the fatal crash. For example, within the first section, it can be seen that among persons dying within 12 months of the collision, 102 people aged were killed in motor vehicle crashes in Ontario during And, in 94 cases (92.2%) it was possible to determine if alcohol was a factor in the crash. The next column shows the number of people killed in crashes that were known to be alcohol-involved. In 2012, 46 people aged died in alcohol-related crashes in Ontario. The next column expresses this as a percentage i.e., 48.9% of the year olds who were killed died in an alcohol-related crash. The final column (percent of all alcohol-related deaths) expresses the number of deaths in alcohol-related crashes as a percent of all the deaths in such crashes. For example, the alcohol-related deaths among year olds represent 22.2% of all the people killed in alcohol-related crashes in Ontario during An examination of the section for persons dying within 30 days of the collision shows that 102 persons aged died in motor vehicle crashes. In 94 of these cases (92.2%), it was possible to determine if alcohol was a factor in the crash. Among these persons, 46 (48.9%) were alcohol-related deaths. And year olds accounted for 22.2% of people dying in alcohol-related crashes. The totals at the bottom of the table provide a summary. As can be seen, 728 persons died within 12 months of a motor vehicle crash in Ontario during In 651 (89.4%) of these cases, it was possible to 107
118 determine if alcohol was a factor. Of these known cases, 207 (31.8%) involved alcohol. Extrapolating this figure to the total number of motor vehicle fatalities (728 x.318) it can be estimated that in Ontario during 2012, 231 persons died in alcohol-related crashes within 12 months of the collision. Among the 712 persons dying within 30 days of the collision, it was possible to determine if alcohol was a factor in 90.4% of the cases. Of these known cases, 207 (32.1%) involved alcohol. Extrapolating this figure to the total number of motor vehicle fatalities (712 x.321) it can be estimated that in Ontario during 2012, 229 persons died in alcohol-related crashes within 30 days of the collision. Category of Victim Age Group < > Gender Table 8-1 Deaths in Alcohol-Related Crashes: Ontario, 2012 Persons Dying Within 12 Months of Collision No. of Deaths Alcohol Use Known No. % of total Alcohol-Related Deaths (ARDs) % of % of all No. known ARDs Persons Dying Within 30 Days of Collision No. of Deaths Alcohol Use Known % of No. total Alcohol-Related Deaths (ARDs) % of known Male Female Victim Type Driver/ Operator Passenger Pedestrian Vehicle Occupied Automobiles Trucks/Vans Motorcycles Other Hwy. Vehicles Offroad Vehicles (Pedestrians) Unknown Collision Location Public Road Offroad % of all ARDs TOTAL No Victim age. Of all the people who died in alcohol-related crashes within 12 months of the collision, 23.7% (see last column in the first section) were aged 20-25; 22.2% were aged 26-35; 16.4% were aged 46-55; 15.9% were aged 36-45; 12.1% were over age 55; 8.7% were aged 16-19; and 1.0% were under 16. The highest incidence of alcohol involvement occurred in the crashes in which a person aged and died (50.0% and 48.9% respectively). The lowest incidence of alcohol involvement was found among the youngest and oldest fatalities 10.0% of persons under 16 and 11.7% of the fatalities over 55 years of age died in crashes involving alcohol. 108
119 8.1.2 Gender. Of all the people who died in alcohol-related crashes within 12 months of the collision, 80.7% were males. The incidence of alcohol in crashes in which a male died (36.8%) was greater than the incidence of alcohol in crashes in which a female died (20.3%) Victim type. Of all the people who died in alcohol-related crashes within 12 months of the collision, 68.1% were driver/operators of a vehicle; 16.4% were passengers; and 15.5% were pedestrians. Within each of the victim types, the highest incidence of alcohol involvement (35.2%) occurred in the crashes in which a driver/operator died. Alcohol was involved in 27.4% of the crashes in which a passenger died and 25.4% of the crashes in which a pedestrian died Type of vehicle occupied. Of all the people who died in alcohol-related crashes within 12 months of the collision, 43.0% were in an automobile; 17.4% were truck/van occupants; 15.9% were off-road vehicle occupants; and 7.7% were motorcyclists. Within each of these vehicle types, the incidence of alcohol involvement in which a truck/van occupant died was greater than the incidence of alcohol in crashes in which an automobile occupant or motorcyclist died (33.6% versus 32.2% and 26.2%). Among off-road vehicle occupants, 47.8% were involved in an alcoholrelated crash Collision location. Of all the people who died in alcohol-related crashes within 12 months of the collision, 89.9% died in a collision which occurred on a public road and 10.1% died in an off-road collision. However, the incidence of alcohol involvement in which a victim died in an alcohol-related crash was greater for those dying in off-road collisions (53.8%) than it was for persons dying in a collision which occurred on a public road (30.4%). 8.2 Alcohol in fatally injured drivers This section presents information on the presence of alcohol, exclusively among drivers fatally injured within 12 months of the collision in Ontario during Table 8-2 shows the information by age group, gender, vehicle type, collision type (single vs. multiple), and duration between crash time and death time (within 12 months vs. within 30 days of the collision). The first column in the table shows the number of drivers killed. The next columns show the number and percent of these victims who were tested for alcohol. The remaining columns provide information on the results of the alcohol tests: the first three of these present results for drivers who showed any evidence of alcohol; the last three columns present information on drivers who had BACs over the statutory limit of 80 mg%. To illustrate, among year olds there were 54 drivers killed during 2012; 50 of these fatally injured drivers (92.6%) were tested for alcohol. Of those who were tested, 21 (42.0%) were positive for alcohol. This means that year old fatally injured drinking drivers accounted for 21.9% of all drinking drivers who were killed. Then, in the final three columns, it can be seen that 18 of the 50 (36.0%) fatally injured year olds who were tested for alcohol had BACs in excess of 80 mg%. This means that 18 of the 21 drivers who were 109
120 positive for alcohol had BACs in excess of the legal limit. The final column expresses the number of drivers with illegal BACs as a percent of all drivers with BACs over the limit. Thus, year old drivers accounted for 22.2% of all the drivers with BACs over the legal limit. Table 8-2 Alcohol Use Among Fatally Injured Drivers of Highway Vehicles: Ontario, 2012 Drivers Tested Positive BAC BAC >80 mg% Category of No. of % of all % of all drivers % of % of % of Driver Drivers No. No. drivers with No. with BAC >80 total tested tested +BAC mg% Age Group > Gender Male Female Vehicle Type Automobiles Truck/Van Motorcycles Tractor Trailer Collision Type Single vehicle Multiple vehicle Duration Between Crash and Death Time Within 30 Days > 30 Days TOTAL The main findings are shown by the totals at the bottom of the table. Ontario had a high testing rate in 2012, with 85.4% of fatally injured drivers being tested for alcohol use. In Ontario, 31.1% had been drinking and 81 of 96 (84.4%) fatally injured drinking drivers had BACs over 80 mg%. Although not shown in the table, more refined analyses by different BAC categories show that among tested drivers: > 68.9% had BACs of zero mg%; > 3.6% had BACs from 1-49 mg%; > 1.3% had BACs from mg% > 5.2% had BACs from 81 to 160 mg%; and, > 21.0% had BACs over 160 mg%. 110
121 In Figure 8-1, the BAC distribution for tested fatally injured drivers is extrapolated to reflect the BAC distribution for all fatally injured drivers. In this figure, 113 of 362 (31.2%) fatally injured drivers have a positive BAC. And among fatally injured drinking drivers, 95 (84.1%) have BACs over 80 mg% Age differences. Of all the fatally injured drinking drivers (i.e., those with a positive BAC), 29.2% were aged 26-35; 21.9% were aged 20-25; 17.7% were aged and 46-55; 8.3% were over 55; and 5.2% were aged Of all the fatally injured legally impaired drivers (i.e., those with BACs over 80 mg%), 30.9% were aged 26-35; 22.2% were aged 20-25; 18.5% were aged 46-55; 17.3% were aged 36-45; 7.4% were aged over 55; and 3.7% were aged When comparing the incidence of drinking and driving among fatally injured drivers by age group, fatally injured drivers aged were the most likely to have been drinking (45.9%). By contrast, only 9.2% of the tested drivers aged over 55 had been drinking Gender differences. Males dominate the picture as they account for 82.3% of all the fatally injured drivers who had been drinking and 80.2% of all of the fatally injured drivers who were legally impaired. Males dominate the picture largely because they account for most of the drivers who are killed (276 of the 362 drivers are males). Fatally injured male drivers were more likely to have been drinking than female drivers (33.3% and 23.6%, respectively). And, 82.3% of the male and 94.1% of the female drivers who were drinking had BACs over the legal limit Vehicle differences. Of all the fatally injured drinking drivers (i.e., those with a positive BAC), 60.4% were automobile drivers; 25.0% were truck/van drivers; 13.5% were motorcyclists; and 1.0% were tractortrailer drivers. Of all the fatally injured legally impaired drivers (i.e., those with BACs over 80 mg%), 63.0% were automobile drivers, 25.9% were truck/van drivers; 9.9% were motorcyclists; and 1.2% were tractor-trailer drivers. Within each of the vehicle types, 36.9% of truck/van drivers, 32.4% of fatally injured automobile drivers, 24.1% of motorcyclists; and 9.1% of tractor-trailer drivers had been drinking. 111
122 8.2.4 Collision differences. Less than half of the drivers killed (160 of the 362) were involved in singlevehicle collisions but these crashes accounted for two-thirds of the drivers who had been drinking or were legally impaired (64.6% and 67.9%, respectively). The reason for this apparent disparity is because alcohol is over represented in single-vehicle crashes. Almost half of the drivers involved in single-vehicle crashes (47.7%) were positive for alcohol, compared to only 19.0% of those involved in multiple-vehicle collisions Duration between crash and death time. Given that only four fatally injured drivers died more than 30 days after the collision, and none of these drivers were tested for alcohol, a comparison of alcohol use among drivers based on differences in the duration between crash time and death time cannot be performed. 8.3 Drivers involved in alcohol-related serious injury crashes This section presents information on drivers involved in alcohol-related crashes in which someone was seriously injured in 2012 in Ontario. A surrogate or indirect measure is used to estimate alcohol involvement because drivers in serious injury crashes are seldom tested for alcohol. A driver is identified as having been involved in an alcohol-related serious injury crash if the crash in which someone was seriously injured involved a single vehicle at night (SVN), or if, in the case of a non-svn serious injury crash, the police reported alcohol involvement i.e., at least one drinking driver in the crash (see Section 2.2.4). The results are shown in Table 8-3 for drivers grouped in terms of age, gender, type of vehicle driven, and type of collision. The first column shows the number of drivers involved in serious injury crashes. The number and percent of drivers in such crashes that involved alcohol is shown in the next two columns. The final column expresses the number of drivers involved in alcohol-related serious injury crashes in any row as a percent of all drivers involved in alcohol- related serious injury crashes. As shown, by the totals at the bottom of the table, 3,450 drivers were involved in crashes in which someone was seriously injured, and among these 14.6% were alcohol-related crashes Driver age. Of all the drivers involved in alcohol-related serious injury crashes, 27.2% were aged 26-35, 21.3% were aged and 15.3% were aged Drivers under 16 accounted for 0.2% and drivers aged accounted for only 8.3% of those involved in alcohol-related serious injury crashes. One-quarter of the drivers under 16 years of age and were involved in alcohol-related serious injury crashes (25.0% and 24.3%, respectively). The lowest incidence of involvement in alcohol-related crashes was found for those over 55 (6.8%) Driver gender. Of all the drivers involved in alcohol-related serious injury crashes, 77.7% were males. The incidence of involvement in alcohol-related serious injury crashes was also greater for males than for females (16.4% and 10.5%, respectively). 112
123 Table 8-3 Drivers in Alcohol-Related Serious Injury Crashes: Ontario, 2012 Category of Drivers Number of Drivers Alcohol-Related % of % of all drivers in Number total alcohol-related crashes Age < > unknown Gender Male Female unknown Vehicle Type Auto Truck/Van Motorcycle Tractor Trailer Other Hwy. Vehicle Off-Road Unknown Collision Type Single-Vehicle Multiple-Vehicle TOTAL Type of vehicle driven. Of all the drivers involved in alcohol-related serious injury crashes, 68.0% were automobile drivers; 18.1% were truck/van drivers; 6.6% were motorcyclists and 3.0% were tractor-trailer drivers. The highest incidence of involvement in alcohol-related serious injury crashes was found for automobile drivers 16.2% of these drivers were in crashes that involved alcohol, compared to 16.0% of tractor-trailer; 13.5% of truck/van drivers; 12.5% for drivers of other highway vehicles and 10.2% for motorcyclists. Among off-road vehicle drivers, 5.5% were involved in alcohol-related crashes Type of collision. Of all the drivers involved in alcohol-related serious injury crashes, 72.8% of them were in single-vehicle crashes. The highest incidence of involvement in alcohol-related serious injury crashes was also found among drivers in single-vehicle crashes 36.1% of these drivers, compared to only 5.6% for drivers involved in multiple-vehicle crashes. 8.4 Drug use among fatally injured drivers This section presents information on the presence of drugs, exclusively among drivers fatally injured in Ontario during Table 8-4 shows the prevalence of drug use among fatally injured drivers of highway vehicles as well as the number of drivers who tested positive for various categories of drugs. 113
124 As can be seen, Ontario had a high testing rate in 2012, with 73.2% of fatally injured drivers being tested for drug use. Among fatally injured tested drivers, 125 out of 265 (47.2%) were positive for drugs. The most common category of drugs found within drivers testing positive for drug use was cannabis (57.6%). Other categories of drugs found in fatally injured drivers testing positive for drugs were CNS depressants (38.4%), CNS stimulants (17.6%), narcotic analgesics (16.8%), dissociative anesthetics (2.4%), and hallucinogens (0.8%). Table 8-4 Drug Use Among Fatally Injured Drivers of Highway Vehicles: Ontario, 2012 Prevalence of Drug Use Number of Drivers Tested Positive for Drugs Drivers Number % of total Number % of tested (73.2) 125 (47.2) Categories of Drugs Found Among Drivers Testing Positive Positive for Drug Type Drug Category Number of % of drivers testing Drivers positive* Cannabis CNS Depressants CNS Stimulants Narcotic Analgesics Dissociative Anesthetics Hallucinogens Inhalants (57.6) (38.4) (17.6) (16.8) (2.4) (0.8) (0.0) * Percentages will not add up to 100% due to multiple drug types found in blood samples of some drivers. 8.5 Trends in alcohol and drug-impaired driving Sections 8.1 through 8.3 examined three indicators of the alcohol-crash problem: (1) the number and percent of people who died in crashes that involved alcohol; (2) the number and percent of fatally injured drivers who had been drinking; and (3) the number and percent of drivers in serious injury crashes that involved alcohol. Section 8.4 examined drug use among fatally injured drivers in This section examines changes in these four indicators over time Deaths in alcohol-related crashes: Table 8-5 and Figure 8-2 show the number and percent of people who died in crashes involving a drinking driver from 1995 to These results differ slightly from those in Section 8.1 for two reasons. First, deaths that occur in crashes that involve a drinking pedestrian are not necessarily classified as alcohol-related deaths. The focus here is more restrictive, on deaths that occur in crashes involving at least one drinking driver. Second, the trend analyses focus on fatal crashes on public roadways involving principal vehicle types (where at least one of the vehicles involved is 114
125 an automobile, truck/van, motorcycle or other highway vehicle). The previous analyses included all types of motorized vehicles (e.g., snowmobiles) on both public roadways and in off-road locations. As shown in the figure, the number of deaths in crashes that involved a drinking driver generally dropped from 399 to 210 between 1995 and The number of deaths decreased to 169 in 2009, rose to 181 in 2010, decreased to a low of 138 in 2011, and rose again to 169 in The percentage of alcohol-related fatalities generally declined from 37.7% in 1995 to 25.6% in 2002, rose to 28.9% in 2006, decreased to 26.9% in 2009, rose to 28.9% in 2010, dropped to a low of 24.6% in 2011, and rose again to 26.0% in As shown at the bottom of the table, during the baseline period there was an average of 199 fatalities involving a drinking driver and they accounted for 28.2% of all fatalities. Thus, it can be seen that the percent of fatalities involving a drinking driver decreased by 9.9% from 28.2% in the baseline period ( ) to 25.4% in the period. And, in terms of the number of persons killed in crashes involving a drinking driver, there has been a 22.6% decrease from an average of 199 in the baseline period ( ) to 154 in the period. Table 8-5 Number* and Percent of Motor Vehicle Deaths** Involving a Drinking Driver: Ontario, Persons Dying Within 12 Persons Dying Within 30 Days Months of Collision of Collision Year of Number of Alcohol-Related Deaths Number of Alcohol-Related Deaths Death Deaths Number % of total Deaths Number % of total baseline period * numbers are estimates based on the percent of deaths for which information was available to determine alcohol use. ** only on public roadways involving principal vehicle types
 showed no evidence of alcohol (represented by the white area); (2) had BACs below the legal")
126 8.5.2 Alcohol use among fatally injured drivers: Data on alcohol use among fatally injured drivers over the 26-year period from are shown in Table 8-6. Trends are illustrated in Figure 8-3 which shows changes in the percent of fatally injured drivers who: (1) showed no evidence of alcohol (represented by the white area); (2) had BACs below the legal limit (shown by the light grey area); and (3) had BACs over the legal limit (the dark grey area). The data reported here are restricted to drivers who died in less than six hours after the crash (see Section 2.2.2). As can be seen, the percent of fatally injured drivers with BACs over the legal limit generally declined from 1987 (39.6%) to 2008 (21.1%), rose until 2010 (26.6%) decreased in 2011 (22.8%), and rose again in 2012 (25.4%). The percent of fatally injured drivers with zero BACs generally increased from 1987 (53.0%) to its highest level in 2008 (74.2%), decreased until 2010 (69.2%) rose in 2011 (71.5%), and decreased again in 2012 (69.5%). The percent of fatally injured drivers with BACs between 1 and 80 mg% peaked in 1988 (12.5%), dropped in 2001 (4.3%), rose in 2003 (5.9%), dropped in 2005 (4.8%), rose in 2007 (8.5%), decreased to its lowest mark in 2009 (3.9%), rose in 2011 (5.7%), and decreased again in 2012 (5.0%). When compared to the baseline period, the percentage of fatally injured drivers with zero BACs in the period increased by 0.9% (from 69.6% to 70.2%). Among drivers with BACs from 1-80 mg%, there was an 8.3% decrease (from 6.0% to 5.5%). Among drivers with BACs over 80 mg%, there was no change (from 24.4% to 24.4%). 116
 Zero (% Tested) 1-80 (% Tested) >80 (% Tested) 1987 613 540 88.1 286 53.0 40 7.4 214 39.6 1988 555 521 93.9 281 53.9 65 12.5 175 33.6 1989 642 586 91.3 345 58.9 49 8.4 192 32.")
127 Table 8-6 Alcohol Use Among Fatally Injured Drivers: Ontario, Year Number of Drivers Tested Drivers Grouped by BAC (mg%) Drivers* No. (% Total) Zero (% Tested) 1-80 (% Tested) >80 (% Tested) baseline period (95.4) (95.4) (69.6) (70.2) (6.0) (5.5) (24.4) (24.4) * dying in less than six hours. Table 8-7 and Figure 8-4 show data on alcohol use among fatally injured drivers over a shorter period from These results also differ from those reported above for several reasons. First, the number of drivers is extrapolated to reflect the BAC distribution of drivers tested for alcohol (see Figure 8-1). Second, estimates are based on all fatally injured drivers, not just those who died in less than six hours from the crash. Third, drivers are grouped in only two BAC categories: zero and positive. 117

128 As can be seen in Table 8-7, the baseline percentage of fatally injured drivers testing positive for alcohol from is 30.5%. In the period, 30.3% of fatally injured drivers tested positive for alcohol, a 0.7% decrease from the baseline period. Table 8-7 Alcohol Use Among Fatally Injured Drivers of Highway Vehicles*: Ontario, Year Number of Drivers Drivers Grouped by BAC (mg%) Zero (% Tested) Positive (% Tested) (59.1) 268 (40.9) (54.7) 300 (45.3) (53.7) 314 (46.3) (55.0) 320 (45.0) (56.4) 274 (43.6) (58.3) 263 (41.7) (63.1) 193 (36.9) (64.6) 210 (35.4) (64.4) 186 (35.6) (70.6) 167 (29.4) (68.5) 163 (31.5) (70.2) 155 (29.8) (73.0) 140 (27.0) (68.9) 161 (31.1) (70.0) 151 (30.0) (70.1) 144 (29.9) (68.0) 148 (32.0) (68.5) 157 (31.5) (73.6) 112 (26.4) (69.9) 110 (30.1) (67.3) 129 (32.7) (71.0) 96 (29.0) (68.8) 113 (31.2) baseline (69.5) 131 (30.5) period (69.7) 105 (30.3) * numbers are estimates based on the BAC distribution of drivers tested for alcohol 118
129 8.5.3 Drivers in serious injury crashes: Table 8-8 and Figure 8-5 show information on drivers involved in alcohol-related serious injury crashes. During the baseline period ( ), an average of 16.6% of drivers in serious injury crashes were in an alcohol-involved crash. This compares to 14.9% in the period, resulting in a 10.2% decrease in the problem. Year Number of Drivers Number in Alcohol- Involved Crashes Percent (22.6) (21.8) (20.0) (18.8) (19.6) (19.6) (17.2) (17.7) (16.1) (16.9) (16.3) (18.1) (17.2) (16.3) (16.6) (14.2) (15.2) (14.6) baseline (16.6) period Table 8-8 Number and Percent of All Drivers in Serious Injury Crashes* that Involved Alcohol: Ontario, (14.9) * single-vehicle nighttime crashes (SVN) as well as non-svn crashes that have police-reported alcohol involvement 119
130 Table 8-9 and Figure 8-6 also show information on drivers involved in alcohol-related serious injury crashes. These results differ slightly from those in Section 8.3 and in Table 8-8 and Figure 8-5 above because they exclude certain vehicle types e.g., bicycles, snowmobiles, farm tractors, and other non-highway vehicles. As can be seen, the incidence of alcohol-involvement in serious injury crashes has been relatively stable. Between 1995 and 2003 the percentage of drivers in serious injury crashes that involved alcohol generally decreased from 22.9% to 16.3%, reached 18.3% in 2006, decreased to a low of 14.5% in 2010, rose to 15.4% in 2011, and decreased again to 15.0% in As shown in Table 8-9, in the baseline period ( ) an average of 16.9% of drivers in serious injury crashes were in an alcohol-involved crash. During the period, the incidence of drivers in alcoholinvolved crashes dropped to 15.2%, a 10.1% decrease from the baseline period. Table 8-9 Number and Percent of Drivers* of Highway Vehicles in Serious Injury Crashes** that Involved Alcohol: Ontario, Year Number of Drivers (22.9) (22.1) (20.3) (19.0) (19.8) (20.1) (17.6) (17.2) (16.3) (17.2) (16.6) (18.3) (17.7) (16.6) (16.8) (14.5) (15.4) (15.0) baseline (16.9) period Number in Alcohol- Involved Crashes Percent (15.2) * excludes operators of bicycles, snowmobiles, farm tractors, and other nonhighway vehicles. ** single-vehicle nighttime crashes (SVN) as well as non-svn crashes that have police-reported alcohol involvement 120
131 8.5.4 Drug use among fatally injured drivers: Table 8-10 and Figure 8-7 show data on drug use among fatally injured drivers over a 13-year period ( ). Similar to Table 8-6, these results are based on fatally injured drivers of highway vehicles who died less than six hours after the crash (see Section 2.2.5). As can be seen at the bottom of Table 8-10, the percentage of fatally injured drivers testing positive for drugs from , the baseline period, is 38.8%. In the period, 45.3% of fatally injured drivers tested positive for drugs, a 16.8% increase from the baseline period. Year Drug Use Among Fatally Injured Drivers of Highway Vehicles: Ontario, Number of Drivers Drivers* Tested (% Total) Drivers Tested for Drugs Negative (% Tested) Positive (% Tested) baseline period * dying in less than six hours. Table
132 122
133 9.0 QUEBEC This section of the report reviews the major findings on alcohol involvement in fatal and serious injury motor vehicle collisions as well as drug involvement in fatal motor vehicle collisions in Quebec during It describes data on: > people who were killed in alcohol-related crashes (Section 9.1); > alcohol use among fatally injured drivers (Section 9.2); > drivers involved in alcohol-related serious injury crashes (Section 9.3); > drug use among fatally injured drivers (Section 9.4); and, > trends in the alcohol-crash and drug-crash problems (Section 9.5). 9.1 Deaths in alcohol-related crashes Table 9-1 presents information on people who died in alcohol-related crashes in Quebec during 2012 for persons dying within 12 months of the collision (one calendar year) and for persons dying within 30 days of the collision. Motor vehicle deaths are categorized in terms of the victim s age, gender, type (i.e., driver, passenger, pedestrian) and the type of vehicle they occupied. In each section, the first column in the table presents the number of deaths. The next two columns show the number and percent of these fatalities in which sufficient information was available to determine if alcohol was involved. A motor vehicle fatality was considered to be alcohol involved if there was at least one drinking driver or drinking pedestrian in the fatal crash. For example, within the first section, it can be seen that among persons dying within 12 months of the collision, 63 people aged were killed in motor vehicle crashes in Quebec during And, in 60 cases (95.2%) it was possible to determine if alcohol was a factor in the crash. The next column shows the number of people killed in crashes that were known to be alcohol-involved. In 2012, 24 people aged died in alcohol-related crashes in Quebec. The next column expresses this as a percentage i.e., 40.0% of the year olds who were killed died in an alcohol-related crash. The final column (percent of all alcohol-related deaths) expresses the number of deaths in alcohol-related crashes as a percent of all the deaths in such crashes. For example, the alcohol-related deaths among year olds represent 18.5% of all the people killed in alcohol-related crashes in Quebec during An examination of the section for persons dying within 30 days of the collision shows that 62 persons aged died in motor vehicle crashes. In 59 of these cases (95.2%), it was possible to determine if alcohol was a factor in the crash. Among these persons, 24 (40.7%) were alcohol-related deaths. And year olds accounted for 18.5% of people dying in alcohol-related crashes. The totals at the bottom of the table provide a summary. As can be seen, 511 persons died within 12 months of a motor vehicle crash in Quebec during In 474 (92.8%) of these cases, it was possible to 123
134 determine if alcohol was a factor. Of these known cases, 130 (27.4%) involved alcohol. Extrapolating this figure to the total number of motor vehicle fatalities (511 x.274) it can be estimated that in Quebec during 2012, 140 persons died in alcohol-related crashes within 12 months of the collision. Among the 503 persons dying within 30 days of the collision, it was possible to determine if alcohol was a factor in 92.8% of the cases. Of these known cases, 130 (27.8%) involved alcohol. Extrapolating this figure to the total number of motor vehicle fatalities (503 x.278) it can be estimated that in Quebec during 2012, 140 persons died in alcohol-related crashes within 30 days of the collision Victim age. Of all the people who died in alcohol-related crashes within 12 months of the collision, 23.8% (see last column in the first section) were aged 20-25; 21.5% were aged 46-55; 18.5% were aged 26-35; 14.6% were aged 36-45; 11.5% were over age 55; and 10.0% were aged Category of Victim Age Group < > Gender Table 9-1 Deaths in Alcohol-Related Crashes: Quebec, 2012 Persons Dying Within 12 Months of Collision No. of Deaths Alcohol Use Known No. % of total Alcohol-Related Deaths (ARDs) % of % of all No. known ARDs Persons Dying Within 30 Days of Collision No. of Deaths Alcohol Use Known % of No. total Alcohol-Related Deaths (ARDs) % of known Male Female Victim Type Driver/ Operator Passenger Pedestrian Vehicle Occupied Automobiles Trucks/Vans Motorcycles Other Hwy. Vehicles Offroad Vehicles (Pedestrians) Collision Location Public Road Offroad % of all ARDs TOTAL No. The highest incidence of alcohol involvement occurred in the crashes in which persons aged and died (44.9% and 40.0% respectively). The lowest incidence of alcohol involvement was found among the youngest and oldest fatalities as 0.0% of persons under 16 and 9.9% of the fatalities over 55 years of age died in crashes involving alcohol. 124
135 9.1.2 Gender. Of all the people who died in alcohol-related crashes within 12 months of the collision, 80.0% were males. The incidence of alcohol in crashes in which a male died (30.1%) was greater than the incidence of alcohol in crashes in which a female died (20.2%) Victim type. Of all the people who died in alcohol-related crashes within 12 months of the collision, 76.9% were drivers/operators of a vehicle; 14.6% were passengers; and 8.5% were pedestrians. Within each of the victim types, the highest incidence of alcohol involvement (28.7%) occurred in the crashes in which a driver/operator died. Alcohol was involved in 24.4% of the crashes in which a passenger died and 23.4% of those in which a pedestrian died Type of vehicle occupied. Of all the people who died in alcohol-related crashes within 12 months of the collision, 50.0% were in an automobile; 20.0% were off-road vehicle occupants; 15.4% were truck/van occupants; 5.4% were motorcyclists; and 0.8% were occupants of other highway vehicles. Within each of these vehicle types, the incidence of alcohol involvement in which a truck/van occupant died was slightly greater than the incidence of alcohol in crashes in which an automobile occupant died (29.4% versus 28.0%). Among off-road vehicle occupants, 35.6% died in an alcohol-related crash compared to 15.6% of motorcyclists Collision location. Of all the people who died in alcohol-related crashes within 12 months of the collision, 88.5% died in a collision which occurred on a public road and 11.5% died in an off-road collision. However, the incidence of alcohol involvement in which a victim died in an alcohol-related crash was slightly greater for those dying in off-road collisions (28.3%) than it was for persons dying in collisions on public roads (27.3%). 9.2 Alcohol in fatally injured drivers This section presents information on the presence of alcohol, exclusively among drivers fatally injured within 12 months of the collision in Quebec during Table 9-2 shows the information by age group, gender, vehicle type, collision type (single vs. multiple), and duration between crash time and death time (within 12 months vs. within 30 days of the collision). The first column in the table shows the number of drivers killed. The next columns show the number and percent of these victims who were tested for alcohol. The remaining columns provide information on the results of the alcohol tests the first three of these present results for drivers who showed any evidence of alcohol; the last three columns present information on drivers who had BACs over the statutory limit of 80 mg%. To illustrate, among year olds there were 27 drivers killed during 2012; 17 of these fatally injured drivers (63.0%) were tested for alcohol. Of those who were tested, five (29.4%) were positive for alcohol. This means that year old fatally injured drinking drivers accounted for 7.6% of all drinking drivers who were killed. Then, in the final three columns, it can be seen that five of the 15 (29.4%) fatally injured year olds who were tested for alcohol had BACs in excess of 80 mg%. This means that all five of the drivers who were 125
136 positive for alcohol had BACs in excess of the legal limit. The final column expresses the number of drivers with illegal BACs as a percent of all drivers with BACs over the limit. Thus, year old drivers accounted for 8.8% of all the drivers with BACs over the legal limit. Table 9-2 Alcohol Use Among Fatally Injured Drivers of Highway Vehicles: Quebec, 2012 Category of Driver Age Group > Gender No. of Drivers Drivers Tested No. % of total Male Female Vehicle Type Automobiles Truck/Van Motorcycles Tractor Trailer Other Hwy. Veh Collision Type Single vehicle Multiple vehicle Duration Between Crash and Death Time No. Positive BAC % of tested % of all drivers with +BAC BAC >80 mg% % of tested Within 30 Days > 30 Days TOTAL No. % of all drivers with BAC >80 mg% The main findings are shown by the totals at the bottom of the table. Quebec had a low testing rate in 2012, with 65.9% of fatally injured drivers being tested for alcohol use. In Quebec, 33.2% had been drinking and 57 of 66 (86.4%) fatally injured drinking drivers had BACs over 80 mg%. Although not shown in the table, more refined analyses by different BAC categories show that among tested drivers: > 66.8% had BACs of zero mg%; > 3.0% had BACs from 1-49 mg%; > 1.5% had BACs from mg% > 10.6% had BACs from 81 to 160 mg%; and, > 18.1% had BACs over 160 mg%. 126
137 In Figure 9-1, the BAC distribution for tested fatally injured drivers is extrapolated to reflect the BAC distribution for all fatally injured drivers. In this figure, 100 of 302 (33.1%) fatally injured drivers have a positive BAC. And among fatally injured drinking drivers, 86 (86.0%) have BACs over 80 mg% Age differences. Of all the fatally injured drinking drivers (i.e., those with positive BAC), 27.3% were aged 20-25; 22.7% were aged 46-55; 21.2% were aged 26-35; 13.6% were aged 36-45; and 7.6% were aged and over 55. Of all the fatally injured legally impaired drivers (i.e., those with BACs over 80 mg%), 26.3% were aged 20-25; 22.8% were aged 46-55; 19.3% were aged 26-35; 15.8% were aged 36-45; 8.8% were aged 16-19; and 7.0% were over 55. When comparing the incidence of drinking and driving among fatally injured drivers by age group, fatally injured drivers aged were the most likely to have been drinking (51.9%). By contrast, only 8.8% of the tested drivers over 55 had been drinking Gender differences. Males dominate the picture as they account for 81.8% of all the fatally injured drivers who had been drinking and 80.7% of all of the fatally injured drivers who were legally impaired. Males dominate the picture largely because they account for most of the drivers who are killed (236 of the 302 fatalities or 78.1% are males). Fatally injured male drivers were more likely to have been drinking than female drivers (34.0% and 30.0%, respectively). And, 85.2% of the male and 91.7% of the female drivers who were drinking had BACs over the legal limit Vehicle differences. Of all the fatally injured drinking drivers (i.e., those with a positive BAC), 62.1% were automobile drivers; 25.8% were truck/van drivers; 10.6% were motorcyclists; and 1.5% were tractortrailer drivers. Of all the fatally injured legally impaired drivers (i.e., those with BACs over 80 mg%), 63.2% were automobile drivers; 28.1% were truck/van drivers; and 8.8% were motorcyclists. 127
138 Within each of the vehicle types, 37.8% of fatally injured truck/van drivers, 32.8% of automobile drivers, 29.2% of motorcyclists, and 20.0% of tractor-trailer drivers had been drinking. The lone driver of another highway vehicle had not been drinking Collision differences. Less than half of the drivers killed (141 of the 302) were involved in singlevehicle collisions but these crashes accounted for two-thirds of the drivers who had been drinking or were legally impaired (65.2% and 70.2%, respectively). The reason for this apparent disparity is because alcohol is overrepresented in single-vehicle crashes. Almost half of the drivers involved in single-vehicle crashes (46.7%) were positive for alcohol, compared to only 21.5% of those involved in multiple-vehicle collisions Duration between crash and death time. Given that only six fatally injured drivers died more than 30 days after the collision, and only one of these drivers was tested for alcohol, a comparison of alcohol use among drivers based on differences in the duration between crash time and death time cannot be performed. 9.3 Drivers involved in alcohol-related serious injury crashes This section presents information on drivers involved in alcohol-related crashes in which someone was seriously injured in 2012 in Quebec. A surrogate or indirect measure is used to estimate alcohol involvement because drivers in serious injury crashes are seldom tested for alcohol. A driver is identified as having been involved in an alcohol-related serious injury crash if the crash in which someone was seriously injured involved a single vehicle at night (SVN), or if, in the case of a non-svn serious injury crash, the police reported alcohol involvement i.e., at least one drinking driver in the crash (see Section 2.2.4). The results are shown in Table 9-3 for drivers grouped in terms of age, gender, type of vehicle driven, and type of collision. The first column shows the number of drivers involved in serious injury crashes. The number and percent of drivers in such crashes that involved alcohol is shown in the next two columns. The final column expresses the number of drivers involved in alcohol-related serious injury crashes in any row as a percent of all drivers involved in alcohol- related serious injury crashes. As shown by the totals at the bottom of the table, 2,848 drivers were involved in crashes in which someone was seriously injured, and among these 17.6% were alcohol-related crashes Driver age. Of all the drivers involved in alcohol-related serious injury crashes, 23.7% were aged 20-25, 17.9% were aged 26-35; and 12.0% were aged Drivers under 16 accounted for only 1.4% of those involved in alcohol-related serious injury crashes. Over one-quarter of the drivers aged were involved in alcohol-related serious injury crashes (28.5%). The lowest incidence of involvement in alcohol-related crashes was found for those over 55 (8.5%) Driver gender. Of all the drivers involved in alcohol-related serious injury crashes, 75.5% were males. The incidence of involvement in alcohol-related serious injury crashes was also greater for males than for females (19.4% and 11.7%, respectively) Type of vehicle driven. Drivers of automobiles and light trucks have been merged in this table as Quebec has regrouped these vehicle types into one category in its collision data since March Of all the 128
139 drivers involved in alcohol-related serious injury crashes, 80.7% were automobile-truck/van drivers; 10.0% were off-road vehicle drivers; and 6.4% were motorcyclists. The highest incidence of involvement in alcohol-related serious injury crashes was found for automobiletruck/van drivers 19.4% of these drivers were in crashes that involved alcohol, compared to 14.9% for offroad vehicle drivers, 11.2% for motorcyclists; and 7.5% for drivers of other highway vehicles. Among tractortrailer drivers, 7.3% were involved in alcohol-related crashes. Table 9-3 Drivers in Alcohol-Related Serious Injury Crashes: Quebec, 2012 Category of Drivers Number of Drivers Type of collision. Of all the drivers involved in alcohol-related serious injury crashes, 70.1% of them were in single-vehicle crashes. The highest incidence of involvement in alcohol-related serious injury crashes was also found among drivers in single-vehicle crashes 33.8% of these drivers, compared to only 8.3% for drivers involved in multiple-vehicle crashes. 9.4 Drug use among fatally injured drivers Alcohol-Related % of % of all drivers in Number total alcohol-related crashes Age < > unknown Gender Male Female unknown Vehicle Type Auto and Truck/Van Motorcycle Tractor Trailer Other Hwy. Vehicle Off-Road Unknown Collision Type Single-Vehicle Multiple-Vehicle TOTAL * Automobiles and light trucks have been regrouped in collision data as of March This section presents information on the presence of drugs, exclusively among drivers fatally injured in Quebec during Table 9-4 shows the prevalence of drug use among fatally injured drivers of highway vehicles as well as the number of drivers who tested positive for various categories of drugs. 129
140 As can be seen, Quebec had an average testing rate in 2012, with 65.2% of fatally injured drivers being tested for drug use. Among fatally injured tested drivers, 62 out of 197 (31.5%) were positive for drugs. The most common category of drugs found within drivers testing positive for drug use was cannabis (45.2%). Other categories of drugs found in fatally injured drivers testing positive for drugs were CNS depressants (37.1%), CNS stimulants (33.9%), and narcotic analgesics (21.0%). Table 9-4 Drug Use Among Fatally Injured Drivers of Highway Vehicles: Quebec, 2012 Prevalence of Drug Use Number of Drivers Tested Positive for Drugs Drivers Number % of total Number % of tested (65.6) 62 (31.3) Categories of Drugs Found Among Drivers Testing Positive Positive for Drug Type Drug Category Number of Drivers % of drivers testing positive* Cannabis CNS Depressants CNS Stimulants Narcotic Analgesics (45.2) (37.1) (33.9) (21.0) Dissociative Anesthetics 0 (0.0) Hallucinogens 0 (0.0) Inhalants 0 (0.0) * Percentages will not add up to 100% due to multiple drug types found in blood samples of some drivers. 9.5 Trends in alcohol and drug-impaired driving Sections 9.1 through 9.3 examined three indicators of the alcohol-crash problem: (1) the number and percent of people who died in crashes that involved alcohol; (2) the number and percent of fatally injured drivers who had been drinking; and (3) the number and percent of drivers in serious injury crashes that involved alcohol. Section 9.4 examined drug use among fatally injured drivers in This section examines changes in these four indicators over time Deaths in alcohol-related crashes: Table 9-5 and Figure 9-2 show the number and percent of people who died in crashes involving a drinking driver from 1995 to These results differ slightly from those in Section 9.1 for two reasons. First, deaths that occur in crashes that involve a drinking pedestrian are not necessarily classified as alcohol-related deaths. The focus here is more restrictive, on deaths that occur in crashes involving at least one drinking driver. Second, the trend analyses focus on fatal crashes on public roadways involving principal vehicle types (where at least one of the vehicles involved is an automobile, truck/van, motorcycle or other highway vehicle). The previous analyses included all types of motorized vehicles (e.g., snowmobiles) on both public roadways and in off-road locations. 130
141 As shown in the table and figure, the number of deaths in crashes that involved a drinking driver generally dropped from 255 to 111 between 1995 and 2007, increased to 130 in 2008, decreased to 109 in 2009, rose to 133 in 2011, and decreased again to a low of 106 in The percentage of alcohol-related fatalities generally decreased from 31.6% in 1995 to 24.2% in 2005, rose to 29.6% in 2006, decreased to a low of 21.8% in 2007, generally increased to 28.9% in 2011, and decreased again to 24.4% in As shown at the bottom of the table, during the baseline period there was an average of 129 fatalities involving a drinking driver and they accounted for 26.5% of all fatalities. This means that the percent of fatalities involving a drinking driver increased by 1.1% from 26.5% in the baseline period ( ) to 26.8% in the period. In terms of the number of persons killed in crashes involving a drinking driver, there has been a 7.0% decrease from an average of 129 in the baseline period ( ) to 120 in the period. Table 9-5 Number* and Percent of Motor Vehicle Deaths** Involving a Drinking Driver: Quebec, Persons Dying Within 12 Persons Dying Within 30 Days Months of Collision of Collision Year of Number of Alcohol-Related Deaths Number of Alcohol-Related Deaths Death Deaths Number % of total Deaths Number % of total baseline period * numbers are estimates based on the percent of deaths for which information was available to determine alcohol use. ** only on public roadways involving principal vehicle types
 showed no evidence of alcohol (represented by the white area); (2) had BACs below the legal")
142 9.5.2 Alcohol use among fatally injured drivers: Data on alcohol use among fatally injured drivers over the 26-year period from are shown in Table 9-6. Trends are illustrated in Figure 9-3 which shows changes in the percent of fatally injured drivers who: (1) showed no evidence of alcohol (represented by the white area); (2) had BACs below the legal limit (shown by the light grey area); and (3) had BACs over the legal limit (the dark grey area). As can be seen, the percent of fatally injured drivers with BACs over the legal limit generally declined from 1987 (49.5%) to its lowest point in 1999 (22.3%), generally rose until 2003 (38.4%), declined in 2005 (29.6%), fluctuated until 2010 (31.0%), rose in 2011 (32.9%), and decreased again in 2012 (28.6%). The percent of fatally injured drivers with zero BACs generally increased from 1987 (30.9%) to 1999 (71.5%), fluctuated until 2010 (62.0%), decreased in 2011 (61.4%), and rose again in 2012 (66.8%). The percent of fatally injured drivers with BACs between 1 and 80 mg% peaked in 1987 (19.6%), fell to its lowest mark in 2002 (4.4%), fluctuated until 2009 (7.1%), and decreased until 2012 (4.5%). When compared to the baseline period shown at the bottom of Table 9-6, the percentage of fatally injured drivers with zero BACs in the period increased by 3.7% (from 61.6% to 63.9%). Among drivers with BACs from 1-80 mg%, there was a 19.4% decrease (from 6.7% to 5.4%). And among those with BACs over 80 mg%, there was a 3.2% decrease (from 31.7% to 30.7%). 132
143 Year Quebec, Number of Drivers Tested Drivers Grouped by BAC (mg%) Drivers* No. (% Total) Zero (% Tested) 1-80 (% Tested) >80 (% Tested) baseline (67.5) 138 (61.6) 15 (6.7) 71 (31.7) period Table 9-6 Alcohol Use Among Fatally Injured Drivers: (66.1) 131 (63.9) 11 (5.4) 63 (30.7) Table 9-7 and Figure 9-4 show data on alcohol use among fatally injured drivers over a shorter period from These results also differ from those reported above for two reasons. First, the number of drivers is extrapolated to reflect the BAC distribution of drivers tested for alcohol (see Figure 9-1). Second, drivers are grouped in only two BAC categories: zero and positive. 133

144 As can be seen at the bottom of Table 9-7, the percentage of fatally injured drivers testing positive for alcohol from , the baseline period, is 38.3%. In the period, 35.8% of fatally injured drivers tested positive for alcohol, a 6.5% decrease from the baseline period. Table 9-7 Alcohol Use Among Fatally Injured Drivers of Highway Vehicles*: Quebec, Year Zero (% Tested) Positive (% Tested) (48.8) 298 (51.2) (47.4) 294 (52.6) (54.7) 232 (45.3) (58.9) 205 (41.1) (55.1) 201 (44.9) (55.7) 206 (44.3) (57.8) 200 (42.2) (59.0) 170 (41.0) (59.3) 162 (40.7) (71.6) 128 (28.4) (63.9) 154 (36.1) (62.7) 132 (37.3) (66.3) 142 (33.7) (55.7) 168 (44.3) (60.8) 144 (39.2) (63.6) 162 (36.4) (60.9) 167 (39.1) (68.4) 108 (31.6) (59.5) 130 (40.5) (57.0) 129 (43.0) (61.9) 102 (38.1) (61.6) 122 (38.4) (66.9) 100 (33.1) baseline period Number of Drivers Drivers Grouped by BAC (mg%) (61.7) 127 (38.3) (64.2) 111 (35.8) * numbers are estimates based on the BAC distribution of drivers tested for alcohol Drivers in serious injury crashes: Table 9-8 and Figure 9-5 show information on drivers involved in alcohol-related serious injury crashes. During the baseline period ( ), an average of 17.0% of 134

145 drivers in serious injury crashes were in an alcohol-involved crash. This compares to 17.2% in the period, resulting in a 1.2% increase in the problem. Table 9-8 Number and Percent of All Drivers in Serious Injury Crashes* that Involved Alcohol: Quebec, Year Number of Drivers Number in Alcohol- Involved Crashes Percent (17.3) (18.1) (16.4) (16.1) (15.8) (16.4) (16.1) (16.6) (15.0) (16.6) (14.5) (16.1) (16.5) (17.2) (18.0) (17.7) (16.8) (17.6) baseline (17.0) period (17.2) * single-vehicle nighttime crashes (SVN) as well as non-svn crashes that have police-reported alcohol involvement Table 9-9 and Figure 9-6 also show information on drivers involved in alcohol-related serious injury crashes. These results differ slightly from those in Section 9.3 and in Table 9-8 and Figure 9-5 above because they exclude certain vehicle types e.g., bicycles, snowmobiles, farm tractors and other non-highway vehicles. 135
146 As can be seen, the incidence of alcohol-involvement in serious injury crashes has been relatively stable from 1997 until 2005 and then risen in the past three years. Between 1995 and 1996 the percentage of all drivers in serious injury crashes that involved alcohol rose only slightly from 17.7% to 18.9%. The incidence generally dropped to a low of 15.3% in 2005, rose to 18.8% in 2009, decreased to 17.4% in 2011, and rose again to 18.0% in As shown in Table 9-9, in the baseline period ( ), an average of 17.8% of drivers in serious injury crashes were in an alcohol-involved crash. During the period, the incidence of drivers in alcoholinvolved crashes was 17.7% a 0.6% decrease. Table 9-9 Number and Percent of Drivers* of Highway Vehicles in Serious Injury Crashes** that Involved Alcohol: Quebec, Year Number of Drivers (17.7) (18.9) (16.9) (16.7) (16.2) (16.8) (16.7) (17.3) (15.5) (17.5) (15.3) (16.8) (17.4) (18.1) (18.8) (18.3) (17.4) (18.0) baseline (17.8) period Number in Alcohol- Involved Crashes Percent (17.7) * excludes operators of bicycles, snowmobiles, farm tractors, and other nonhighway vehicles. ** single-vehicle nighttime crashes (SVN) as well as non-svn crashes that have police-reported alcohol involvement 136
147 9.5.4 Drug use among fatally injured drivers: Table 9-10 and Figure 9-7 show data on drug use among fatally injured drivers over a 13-year period ( ). Similar to Table 9-6, these results are based on fatally injured drivers of highway vehicles. As can be seen at the bottom of Table 9-10, the percentage of fatally injured drivers testing positive for drugs from , the baseline period, is 28.2%. In the period, 38.3% of fatally injured drivers tested positive for drugs, a 35.8% increase from the baseline period. Year Drug Use Among Fatally Injured Drivers of Highway Vehicles: Quebec, Number of Drivers Drivers* Tested (% Total) Drivers Tested for Drugs Negative (% Tested) Positive (% Tested) baseline period Table
148 138
149 10.0 NEW BRUNSWICK This section of the report reviews the major findings on alcohol involvement in fatal and serious injury motor vehicle collisions as well as drug involvement in fatal motor vehicle collisions in New Brunswick during It describes data on: > people who were killed in alcohol-related crashes (Section 10.1); > alcohol use among fatally injured drivers (Section 10.2); > drivers involved in alcohol-related serious injury crashes (Section 10.3); > drug use among fatally injured drivers (Section 10.4); and, > trends in the alcohol-crash and drug-crash problems (Section 10.5) Deaths in alcohol-related crashes Table 10-1 presents information on people who died in alcohol-related crashes in New Brunswick during 2012 for persons dying within 12 months of the collision (one calendar year) and for persons dying within 30 days of the collision. Motor vehicle deaths are categorized in terms of the victim s age, gender, type (i.e., driver, passenger, pedestrian) and the type of vehicle they occupied. In each section, the first column in the table presents the number of deaths. The next two columns show the number and percent of these fatalities in which sufficient information was available to determine if alcohol was involved. A motor vehicle fatality was considered to be alcohol involved if there was at least one drinking driver or drinking pedestrian in the fatal crash. For example, within the first section, it can be seen that among persons dying within 12 months of the collision, 12 people aged were killed in motor vehicle crashes in New Brunswick during And, in 11 cases (91.7%) it was possible to determine if alcohol was a factor in the crash. The next column shows the number of people killed in crashes that were known to be alcohol-involved. There were three people aged who died in alcohol-related crashes in New Brunswick during The next column expresses this as a percentage i.e., 27.3% of the year olds who were killed died in an alcohol-related crash. The final column (percent of all alcohol-related deaths) expresses the number of deaths in alcohol-related crashes as a percent of all the deaths in such crashes. For example, the alcohol-related deaths among year olds represent 9.4% of all the people killed in alcohol-related crashes in New Brunswick during An examination of the section for persons dying within 30 days of the collision shows that 12 persons aged died in motor vehicle crashes. In 11 of these cases (91.7%), it was possible to determine if alcohol was a factor in the crash. Among these persons, three (27.3%) were alcohol-related deaths. And year olds accounted for 9.4% of people dying in alcohol-related crashes. The totals at the bottom of the table provide a summary. As can be seen, 83 persons died within 12 months of a motor vehicle crash in New Brunswick during In 77 (92.8%) of these cases, it was possible to 139
150 determine if alcohol was a factor. Of these known cases, 32 (41.6%) involved alcohol. Extrapolating this figure to the total number of motor vehicle fatalities (83 x.416) it can be estimated that in New Brunswick during 2012, 34 persons died in alcohol-related crashes within 12 months of the collision. Among the 82 persons dying within 30 days of the collision, it was possible to determine if alcohol was a factor in 93.9% of the cases. Of these known cases, 32 (41.6%) involved alcohol. Extrapolating this figure to the total number of motor vehicle fatalities (82 x.416) it can be estimated that in New Brunswick during 2012, 34 persons died in alcohol-related crashes within 30 days of the collision. Category of Victim Age Group < > Gender Table 10-1 Deaths in Alcohol-Related Crashes: New Brunswick, 2012 Persons Dying Within 12 Months of Collision No. of Deaths Alcohol Use Known % of No. total Alcohol-Related Deaths (ARDs) % of % of all No. known ARDs Persons Dying Within 30 Days of Collision No. of Deaths Alcohol Use Known % of No. total Alcohol-Related Deaths (ARDs) % of % of all No. known ARDs Male Female Victim Type Driver/ Operator Passenger Pedestrian Vehicle Occupied Automobiles Trucks/Vans Motorcycles Offroad Vehicles (Pedestrians) Unknown Collision Location Public Road Offroad TOTAL Victim age. Of all the people who died in alcohol-related crashes within 12 months of the collision, 28.1% (see last column in the first section) were aged 20-25; 21.9% were aged 46-55; 15.6% were aged 26-35; 12.5% were aged and over 55; and 9.4% aged The highest incidence of alcohol involvement occurred in the crashes in which a person aged died (69.2%). The lowest incidence of alcohol involvement was found among fatalities under 16 and over % of persons under 16 and 21.1% of the fatalities over 55 died in crashes involving alcohol Gender. Of all the people who died in alcohol-related crashes within 12 months of the collision, 78.1% were males. The incidence of alcohol in crashes in which a male died (46.3%) was greater than the incidence of alcohol in crashes in which a female died (30.4%). 140
151 Victim type. Of all the people who died in alcohol-related crashes within 12 months of the collision, 71.9% were drivers/operators of a vehicle; 28.1% were passengers; and 0.0% were pedestrians. Within each of the victim types, the highest incidence of alcohol involvement (56.3%) occurred in the crashes in which a passenger died. Alcohol was involved in 41.1% of the crashes in which a driver/operator died and 0.0% of those in which a pedestrian died Type of vehicle occupied. Of all the people who died in alcohol-related crashes within 12 months of the collision, 40.6% were automobile occupants; 37.5% were off-road vehicle occupants; 16.6% were truck/van occupants; and 6.3% were motorcyclists. Within each of these vehicle types, the incidence of alcohol involvement in which an off-road vehicle occupant died was greater than the incidence of alcohol in crashes in which a truck/van occupant died (70.6% versus 38.5%). Among automobile occupants and motorcyclists, 37.1% and 28.6% died in alcoholrelated crashes, respectively Collision location. Of all the people who died in alcohol-related crashes within 12 months of the collision, 87.5% died in a collision which occurred on a public road and 12.5% died in an off-road collision. However, the incidence of alcohol involvement in which a victim died in an alcohol-related crash was greater for those dying in off-road collisions (66.7%) than it was for persons dying in a collision which occurred on a public road (39.4%) Alcohol in fatally injured drivers This section presents information on the presence of alcohol, exclusively among drivers fatally injured within 12 months of the collision in New Brunswick during Table 10-2 shows the information by age group, gender, vehicle type, collision type (single vs. multiple), and duration between crash time and death time (within 12 months vs. within 30 days of the collision). The first column in the table shows the number of drivers killed. The next columns show the number and percent of these victims who were tested for alcohol. The remaining columns provide information on the results of the alcohol tests: the first three of these present results for drivers who showed any evidence of alcohol; the last three columns present information on drivers who had BACs over the statutory limit of 80 mg%. To illustrate, among year olds there were four drivers killed during 2012; all four of these fatally injured drivers (100.0%) were tested for alcohol. Of those who were tested, one (25.0%) was positive for alcohol. This means that fatally injured drinking drivers aged accounted for 8.3% of all drinking drivers who were killed. 141
152 Table 10-2 Alcohol Use Among Fatally Injured Drivers of Highway Vehicles: New Brunswick, 2012 Category of Driver Age Group > Gender No. of Drivers Drivers Tested No. % of total Male Female Vehicle Type Automobiles Truck/Van Motorcycles Collision Type Single vehicle Multiple vehicle Duration Between Crash and Death Time No. Positive BAC % of tested % of all drivers with +BAC BAC >80 mg% % of tested Within 30 Days >30 Days TOTAL No. % of all drivers with BAC >80 mg% Then, in the final three columns, it can be seen that one of the four (25.0%) fatally injured year olds who were tested for alcohol had BACs in excess of 80 mg%. This means that the driver who was positive for alcohol had a BAC above the legal limit. The final column expresses the number of drivers with illegal BACs as a percent of all drivers with BACs over the limit. Thus, year old drivers accounted for 9.1% of all the drivers with BACs over the legal limit. The main findings are shown by the totals at the bottom of the table. New Brunswick had a very high testing rate in 2012, with 90.2% of fatally injured drivers being tested for alcohol use. In New Brunswick, 32.4% had been drinking and 11 of 12 (91.7%) fatally injured drinking drivers had BACs >80 mg%. Although not shown in the table, more refined analyses by different BAC categories show that among tested drivers: > 67.6% had BACs of zero mg%; > 0.0% had BACs from 1-49 mg%; > 2.7% had BACs from mg% > 8.1% had BACs from 81 to 160 mg%; and, > 21.6% had BACs over 160 mg%. 142
153 In Figure 10-1, the BAC distribution for tested fatally injured drivers is extrapolated to reflect the BAC distribution for all fatally injured drivers. In this figure 13 of 41 (31.7%) fatally injured drivers have a positive BAC. And among fatally injured drinking drivers, 12 (92.3%) have BACs over 80 mg% Age differences. Of all the fatally injured drinking drivers (i.e., those with positive BAC), 33.3% were aged and 46-55; and 8.3% were aged 16-19, 20-25, and over 55. Of all the fatally injured legally impaired drivers (i.e., those with BACs over 80 mg%), 36.4% were aged and 46-55; and 9.1% were aged 16-19, 20-25, and When comparing the incidence of drinking and driving among fatally injured drivers by age group, fatally injured drivers aged were the most likely to have been drinking (100.0%). By contrast, 9.1% of the tested drivers over age 55 had been drinking Gender differences. Males dominate the picture they account for 91.7% of the fatally injured drivers who had been drinking and 90.9% of those who were legally impaired. Males dominate the picture largely because they account for most of the drivers who are killed (31 of the 41 fatalities or 75.6% are males). Fatally injured male drivers were more likely to have been drinking than female drivers (37.9% and 12.5%, respectively). And, 100.0% of the female drivers and 90.9% of the male drivers who were drinking had BACs over the legal limit Vehicle differences. Of all the fatally injured drinking drivers (i.e., those with a positive BAC), 41.7% were automobile drivers and truck/van drivers; and 16.7% were motorcyclists. Of all the fatally injured legally impaired drivers (i.e., those with BACs over 80 mg%), 45.5% were automobile drivers, 36.4% were truck/van drivers; and 18.2% were motorcyclists. Within each of the vehicle types, 50.0% of fatally injured truck/van drivers, 28.6% of motorcyclists and 25.0% of automobile drivers had been drinking Collision differences. Almost three-fifths of the drivers killed (24 of the 41) were involved in singlevehicle collisions but these crashes accounted two-thirds of the drivers who had been drinking or were legally impaired (66.7% and 72.7%, respectively). 143
154 The reason for this apparent disparity is because alcohol is overrepresented in single-vehicle crashes. Over one-third of the drivers involved in single-vehicle crashes (38.1%) were positive for alcohol, compared to 25.0% of those involved in multiple-vehicle collisions Duration between crash and death time. Given that all of the fatally injured drivers died within 30 days of the collision, a comparison of alcohol use among drivers based on differences in the duration between crash time and death time is not applicable Drivers involved in alcohol-related serious injury crashes This section presents information on drivers involved in alcohol-related crashes in which someone was seriously injured in 2012 in New Brunswick. A surrogate or indirect measure is used to estimate alcohol involvement because drivers in serious injury crashes are seldom tested for alcohol. A driver is identified as having been involved in an alcohol-related serious injury crash if the crash in which someone was seriously injured involved a single vehicle at night (SVN), or if, in the case of a non-svn serious injury crash, the police reported alcohol involvement i.e., at least one drinking driver in the crash (see Section 2.2.4). The results are shown in Table 10-3 for drivers grouped in terms of age, gender, type of vehicle driven, and type of collision. The first column shows the number of drivers involved in serious injury crashes. The number and percent of drivers in such crashes that involved alcohol is shown in the next two columns. The final column expresses the number of drivers involved in alcohol-related serious injury crashes in any row as a percent of all drivers involved in alcohol- related serious injury crashes. As shown, by the totals at the bottom of the table, 242 drivers were involved in crashes in which someone was seriously injured, and among these 24.4% were involved in alcohol-related crashes Driver age. Of all the drivers involved in alcohol-related serious injury crashes, 23.7% were aged 26-35, 22.0% were aged 20-25; and 18.6% were aged Drivers aged under 16 and respectively accounted for only 0.0% and 6.8% of those involved in alcohol-related serious injury crashes. Two-fifths of the drivers aged were involved in alcohol-related serious injury crashes (43.3%). The lowest incidence of involvement in alcohol-related crashes was found for those aged under 16 and over 55 (0.0% and 9.2%, respectively) Driver gender. Of all the drivers involved in alcohol-related serious injury crashes, 81.4% were males. The incidence of involvement in alcohol-related serious injury crashes was also greater for males than for females (27.0% and 18.0%, respectively) Type of vehicle driven. Of all the drivers involved in alcohol-related serious injury crashes, 55.9% were automobile drivers; 32.2% were truck/van drivers; 6.8% were motorcyclists; and 1.7% were tractortrailer drivers. The highest incidence of involvement in alcohol-related serious injury crashes was found for automobile and truck/van drivers 26.8% of these drivers were in crashes that involved alcohol, compared to 20.0% for tractor-trailer drivers, 16.7% for off-road vehicle drivers and 13.8% for motorcyclists. 144
155 Table 10-3 Drivers in Alcohol-Related Serious Injury Crashes: New Brunswick, 2012 Category of Drivers Number of Drivers Type of collision. Of all the drivers involved in alcohol-related serious injury crashes, 76.3% of them were in single-vehicle crashes. The highest incidence of involvement in alcohol-related serious injury crashes was also found among drivers in single-vehicle crashes 42.9% of these drivers, compared to only 10.2% for drivers involved in multiple-vehicle crashes Drug use among fatally injured drivers Alcohol-Related % of % of all drivers in Number total alcohol-related crashes Age < > unknown Gender Male Female unknown Vehicle Type Auto Truck/Van Motorcycle Tractor Trailer Other Hwy. Vehicle Off-Road Collision Type Single-Vehicle Multiple-Vehicle TOTAL This section presents information on the presence of drugs, exclusively among drivers fatally injured in New Brunswick during Table 10-4 shows the prevalence of drug use among fatally injured drivers of highway vehicles as well as the number of drivers who tested positive for various categories of drugs. As can be seen, New Brunswick had a high testing rate in 2012, with 82.9% of fatally injured drivers being tested for drug use. Among fatally injured tested drivers, nine out of 34 (26.5%) were positive for drugs. The most common category of drugs found within drivers testing positive for drug use was cannabis (44.4%). Other categories of drugs found in fatally injured drivers testing positive for drugs were narcotic analgesics and CNS depressants (33.3% each), and CNS stimulants (22.2%). 145
156 Table 10-4 Drug Use Among Fatally Injured Drivers of Highway Vehicles: New Brunswick, 2012 Prevalence of Drug Use Number of Drivers Tested Positive for Drugs Drivers Number % of total Number % of tested (82.9) 9 (26.5) Categories of Drugs Found Among Drivers Testing Positive for Drug Type Drug Category Number of % of drivers testing Drivers positive* Cannabis Narcotic Analgesics CNS Depressants CNS Stimulants Hallucinogens Dissociative Anesthetics Inhalants (44.4) (33.3) (33.3) (22.2) (0.0) (0.0) (0.0) * Percentages will not add up to 100% due to multiple drug types found in blood samples of some drivers Trends in alcohol and drug-impaired driving Sections 10.1 through 10.3 examined three indicators of the alcohol-crash problem: (1) the number and percent of people who died in crashes that involved alcohol (within 12 months and 30 days of the collision); (2) the number and percent of fatally injured drivers who had been drinking; and (3) the number and percent of drivers in serious injury crashes that involved alcohol. Section 10.4 examined drug use among fatally injured drivers in This section examines changes in these four indicators over time Deaths in alcohol-related crashes: Table 10-5 and Figure 10-2 show the number and percent of people who died in crashes involving a drinking driver from 1995 to These results differ slightly from those in Section 10.1 for two reasons. First, deaths that occur in crashes that involve a drinking pedestrian are not necessarily classified as alcohol-related deaths. The focus here is more restrictive, on deaths that occur in crashes involving at least one drinking driver. Second, the trend analyses focus on fatal crashes on public roadways involving principal vehicle types (where at least one of the vehicles involved is an automobile, truck/van, motorcycle or other highway vehicle). The previous analyses included all types of motorized vehicles (e.g., snowmobiles) on both public roadways and in off-road locations. As shown in the figure, the number of deaths in crashes that involved a drinking driver generally dropped from 42 in 1995 to 25 in 2004, rose to 40 in 2010, fell to a low of 23 in 2011 and remained at this level in The percentage of alcohol-related fatalities generally decreased from 37.5% in 1995 to its lowest level in 2000 (27.4%), peaked at 41.2% in 2010, decreased to 34.8% in 2011, and rose to 36.5% in As shown at the bottom of the table, during the baseline period there was an average of 31 fatalities involving a drinking driver and they accounted for 35.2% of all fatalities. This means that the 146
157 percent of fatalities involving a drinking driver increased by 0.6% from 35.2% in the baseline period ( ) to 35.4% in the period. However, in terms of the number of persons killed in crashes involving a drinking driver, there has been a 1.1% decrease from an average of 31 in the baseline period ( ) to 23 in the period. Table 10-5 Number* and Percent of Motor Vehicle Deaths** Involving a Drinking Driver: New Brunswick, Persons Dying Within 12 Persons Dying Within 30 Days Months of Collision of Collision Year of Number of Alcohol-Related Deaths Number of Alcohol-Related Deaths Death Deaths Number % of total Deaths Number % of total baseline period * numbers are estimates based on the percent of deaths for which information was available to determine alcohol use. ** only on public roadways involving principal vehicle types
158 Alcohol use among fatally injured drivers: Data on alcohol use among fatally injured drivers over the 26-year period from are shown in Table Trends are illustrated in Figure 10-3 which shows changes in the percent of fatally injured drivers who: (1) showed no evidence of alcohol (represented by the white area); (2) had BACs below the legal limit (shown by the light grey area); and (3) had BACs over the legal limit (the dark grey area). The data reported here are restricted to drivers who died in less than six hours after the crash (see Section 2.2.2). As can be seen, the percentage of fatally injured drivers with BACs over the legal limit fluctuated, peaking in 1993 (56.0%), declining to its lowest mark in 2005 (27.5%), fluctuating until 2010 (42.0%), and decreasing until 2012 (26.5%). The percent of fatally injured drivers with zero BACs generally increased from 1987 (46.8%) to 2000 (66.7%), fluctuated until 2005 (66.7%), declined in 2007 (51.1%), and eventually peaked in 2012 (70.6%). The percent of fatally injured drivers with BACs between 1 and 80 mg% declined until 1990 (0.0%), peaked in 2007 (11.1%), decreased until 2011 (2.7%), and rose slightly in 2012 (2.9%). When compared to the baseline period shown at the bottom of Table 10-6, the percentage of fatally injured drivers with zero BACs in the period increased by 22.2% (from 56.8% to 69.4%). Among drivers with BACs from 1-80 mg%, there was a 58.8% decrease (from 6.8% to 2.8%). And among drivers with BACs over 80 mg%, there was a 23.6% decrease (from 36.4% to 27.8%). Table 10-6 Alcohol Use Among Fatally Injured Drivers of Highway Vehicles: New Brunswick, Year Number of Drivers Tested Drivers Grouped by BAC (mg%) Drivers* No. (% Total) Zero (% Tested) 1-80 (% Tested) >80 (% Tested) baseline period (97.8) (97.3) (56.8) (69.4) 3 1 (6.8) (2.8) (36.4) (27.8) * dying in less than six hours. 148
159 Table 10-7 and Figure 10-4 show data on alcohol use among fatally injured drivers over a shorter period from These results also differ from those reported above for several reasons. First, the number of drivers is extrapolated to reflect the BAC distribution of drivers tested for alcohol (see Figure 10-1). Second, estimates are based on all fatally injured drivers, not just those who died in less than six hours from the crash. Third, drivers are grouped in only two BAC categories: zero and positive. As can be seen in Table 10-7, the baseline percentage of fatally injured drivers testing positive for alcohol from is 41.5%. From 2011 to 2012, an average of 32.6% of fatally injured drivers tested positive for alcohol, a 21.4% decrease from the baseline period. 149
 29 (33.0) 1991 61 31 (50.8) 30 (49.2) 1992 76 35 (46.1) 41 (53.9) 1993 84 38 (45.2) 46 (54.8) 1994 49 23 (46.9) 26 (53.1) 1995 70 38 (54.3) 32 (45.7) 1996 58 36 (62.1) 22 (37.9) 1997 59 33 (55.")
160 Table 10-7 Alcohol Use Among Fatally Injured Drivers of Highway Vehicles*: New Brunswick, Year Number of Drivers Drivers Grouped by BAC (mg%) Zero (% Tested) Positive (% Tested) (67.0) 29 (33.0) (50.8) 30 (49.2) (46.1) 41 (53.9) (45.2) 46 (54.8) (46.9) 26 (53.1) (54.3) 32 (45.7) (62.1) 22 (37.9) (55.9) 26 (44.1) (56.9) 25 (43.1) (65.0) 21 (35.0) (60.4) 21 (39.6) (45.6) 31 (54.4) (59.4) 26 (40.6) (59.3) 24 (40.7) (67.4) 14 (32.6) (64.5) 22 (35.5) (67.7) 21 (32.3) (52.0) 24 (48.0) (53.7) 19 (46.3) (60.8) 20 (39.2) (51.7) 29 (48.3) (66.7) 15 (33.3) (68.3) 13 (31.7) baseline (58.5) 22 (41.5) period (67.4) 14 (32.6) * numbers are estimates based on the BAC distribution of drivers tested for alcohol Drivers in serious injury crashes: Table 10-8 and Figure 10-5 show information on drivers involved in alcohol-related serious injury crashes. During the baseline period ( ), an average of 25.4% of drivers in serious injury crashes were in an alcohol-involved crash. This percentage increased to 26.1% in 2011, then decreased to 24.4% in In the period, an average of 25.5% of drivers in serious injury crashes were in an alcohol-involved crash. This represents a 0.4% increase in the problem compared to the baseline period. 150
 1996 606 151 (24.9) 1997 614 132 (21.5) 1998 560 125 (22.3) 1999 527 126 (23.9) 2000 512 112 (21.9) 2001 547 148 (27.1) 2002 457 109 (23.9) 2003 447 111 (24.8) 2004 444 109 (24.")
161 Table 10-8 Number and Percent of All Drivers in Serious Injury Crashes* that Involved Alcohol: New Brunswick, Year Number of Drivers Number in Alcohol- Involved Crashes Percent (28.8) (24.9) (21.5) (22.3) (23.9) (21.9) (27.1) (23.9) (24.8) (24.5) (23.8) (24.3) (25.5) (25.2) (25.3) (26.8) (26.1) (24.4) baseline (25.4) (25.5) period * single-vehicle nighttime crashes (SVN) as well as non-svn crashes that have police-reported alcohol involvement Table 10-9 and Figure 10-6 also show information on drivers involved in alcohol-related serious injury crashes. These results differ slightly from those in Section 10.3 and in Table 10-8 and Figure 10-5 because they exclude certain vehicle types e.g., bicycles, snowmobiles, farm tractors and other non-highway vehicles. 151
162 As can be seen, the incidence of alcohol-involvement in serious injury crashes has fluctuated over this 18- year period. Between 1995 and 1997 the percentage of all drivers in serious injury crashes that involved alcohol dropped from 29.2% to 21.0%. Since then, the incidence fluctuated until 2007 (26.0%), declined slightly to 25.6% in 2009, rose in 2010 (27.5%), and decreased until 2012 (24.8%). In the baseline period ( ), an average of 25.6% of drivers in serious injury crashes were in an alcohol-involved crash. In the period, the percentage of drivers in serious injury crashes involving alcohol was 26.4%, resulting in a 3.1% increase. Table 10-9 Number and Percent of Drivers* of Highway Vehicles in Serious Injury Crashes** that Involved Alcohol: New Brunswick, Year Number of Drivers (29.2) (24.5) (21.0) (22.3) (24.2) (22.7) (27.8) (23.9) (25.8) (25.4) (23.8) (24.1) (26.0) (25.8) (25.6) (27.5) (27.4) (24.8) baseline (25.6) period Number in Alcohol- Involved Crashes Percent (26.4) * excludes operators of bicycles, snowmobiles, farm tractors, and other nonhighway vehicles. ** single-vehicle nighttime crashes (SVN) as well as non-svn crashes that have police-reported alcohol involvement 152
163 Drug use among fatally injured drivers: Table and Figure 10-7 show data on drug use among fatally injured drivers over a 13-year period ( ). Similar to Table 10-6, these results are based on fatally injured drivers of highway vehicles who died less than six hours after the crash (see Section 2.2.5). As can be seen at the bottom of Table 10-10, the percentage of fatally injured drivers testing positive for drugs from , the baseline period, is 37.2%. In the period, an average of 33.3% of fatally injured drivers tested positive for drugs, a 10.5% decrease from the baseline period. Table Drug Use Among Fatally Injured Drivers* of Highway Vehicles: New Brunswick, Number of Drivers YEAR Drivers* Tested (% Total) Drivers Tested for Drugs Negative (% Tested) Positive (% Tested) baseline average * dying in less than six hours
164 154
165 11.0 NOVA SCOTIA This section of the report reviews the major findings on alcohol involvement in fatal and serious injury motor vehicle collisions as well as drug involvement in fatal motor vehicle collisions in Nova Scotia during It describes data on: > people who were killed in alcohol-related crashes (Section 11.1); > alcohol use among fatally injured drivers (Section 11.2); > drivers involved in alcohol-related serious injury crashes (Section 11.3); > drug use among fatally injured drivers (Section 11.4); and, > trends in the alcohol-crash and drug-crash problems (Section 11.5) Deaths in alcohol-related crashes Table 11-1 presents information on people who died in alcohol-related crashes in Nova Scotia during 2012 for persons dying within 12 months of the collision (one calendar year) and for persons dying within 30 days of the collision. Motor vehicle deaths are categorized in terms of the victim s age, gender, type (i.e., driver, passenger, pedestrian) and the type of vehicle they occupied. In each section, the first column in the table presents the number of deaths. The next two columns show the number and percent of these fatalities in which sufficient information was available to determine if alcohol was involved. A motor vehicle fatality was considered to be alcohol involved if there was at least one drinking driver or drinking pedestrian in the fatal crash. For example, within the first section, it can be seen that among persons dying within 12 months of the collision, 18 people aged were killed in motor vehicle crashes in Nova Scotia during And, in 17 cases (94.4%) it was possible to determine if alcohol was a factor in the crash. The next column shows the number of people killed in crashes that were known to be alcohol-involved. There were eight people aged who died in alcohol-related crashes in Nova Scotia during The next column expresses this as a percentage i.e., 47.1% of the year olds who were killed died in an alcohol-related crash. The final column (percent of all alcohol-related deaths) expresses the number of deaths in alcohol-related crashes as a percent of all the deaths in such crashes. For example, the alcohol-related deaths among year olds represent 27.6% of all the people killed in alcohol-related crashes in Nova Scotia during An examination of the section for persons dying within 30 days of the collision shows that 18 persons aged died in motor vehicle crashes. In 17 of these cases (94.4%), it was possible to determine if alcohol was a factor in the crash. Among these persons, eight (47.1%) were alcohol-related deaths. And year olds accounted for 27.6% of people dying in alcohol-related crashes. The totals at the bottom of the table provide a summary. As can be seen, 92 persons died within 12 months of a motor vehicle crash in Nova Scotia during In 88 (95.7%) of these cases, it was possible to 155
166 determine if alcohol was a factor. Of these known cases, 29 (33.0%) involved alcohol. Extrapolating this figure to the total number of motor vehicle fatalities (92 x.33) it can be estimated that in Nova Scotia during 2012, 30 persons died in alcohol-related crashes within 12 months of the collision. Among the 90 persons dying within 30 days of the collision, it was possible to determine if alcohol was a factor in 96.7% of the cases. Of these known cases, 29 (33.3%) involved alcohol. Extrapolating this figure to the total number of motor vehicle fatalities (90 x.333) it can be estimated that in Nova Scotia during 2012, 30 persons died in alcohol-related crashes within 30 days of the collision. Category of Victim Age Group <20* > Gender Table 11-1 Deaths in Alcohol-Related Crashes: Nova Scotia, 2012 No. of Deaths Persons Dying Within 12 Months of Collision Alcohol Use Known % of No. No. total Alcohol-Related Deaths (ARDs) % of % of all known ARDs Persons Dying Within 30 Days of Collision No. of Deaths Alcohol Use Known % of No. total Male Female Victim Type Driver/ Operator Passenger Pedestrian Vehicle Occupied Automobiles Trucks/Vans Motorcycles Other Hwy. Vehicles Offroad Vehicles (Pedestrians) Collision Location Public Road Offroad TOTAL * Persons in two age groups have been aggregated to ensure that an individual will not be identified. Alcohol-Related Deaths (ARDs) % of % of all No. known ARDs Victim age. Persons under 16 and have been regrouped (under 20 age group) to ensure that individuals cannot be identified. Of all the people who died in alcohol-related crashes within 12 months of the collision, 27.6% (see last column of the first section) were aged 46-55; 24.1% were over 55; 17.2% were aged 36-45; 13.8% were aged 26-35; 10.3% were under 20; and 6.9% were aged The highest incidence of alcohol involvement occurred in the crashes in which a person aged died (66.7%). The lowest incidence of alcohol involvement was found among those aged (18.2%) and over 55 (21.2%). 156
167 Gender. Of all the people who died in alcohol-related crashes within 12 months of the collision, 89.7% were males. The incidence of alcohol in crashes in which a male died (36.6%) was greater than the incidence of alcohol in crashes in which a female died (17.6%) Victim type. Of all the people who died in alcohol-related crashes within 12 months of the collision, 79.3% were drivers/operators of a vehicle; 20.7% were passengers; and 0.0% were pedestrians. Within each of the victim types, the highest incidence of alcohol involvement (40.0%) occurred in the crashes in which a passenger died. Alcohol was involved in 34.8% of the crashes in which a driver/operator died and 0.0% of those in which a pedestrian died Type of vehicle occupied. Of all the people who died in alcohol-related crashes within 12 months of the collision, 55.2% were in an automobile; 24.1% were truck/van occupants; 17.2% were off-road vehicle occupants; and 3.4% were motorcyclists. Within each of these vehicle types, the incidence of alcohol involvement in which a truck/van occupant died was greater than the incidence of alcohol in crashes in which an automobile occupant died (63.6% versus 29.6%). The number of fatalities in each of the other types of vehicles is too small to produce reliable estimates of alcohol-involvement Collision location. Of all the people who died in alcohol-related crashes within 12 months of the collision, 86.2% died in a collision which occurred on a public road and 13.8% died in an off-road collision. However, the incidence of alcohol involvement in which a victim died in an alcohol-related crash was greater for those dying in off-road collisions (66.7%) than it was for persons dying in a collision which on a public road (30.5%) Alcohol in fatally injured drivers This section presents information on the presence of alcohol, exclusively among drivers fatally injured within 12 months of the collision in Nova Scotia during Table 11-2 shows the information by age group, gender, vehicle type, collision type (single vs. multiple), and duration between crash time (within 12 months of the collision vs. within 30 days of the collision). The first column in the table shows the number of drivers killed. The next columns show the number and percent of these victims who were tested for alcohol. The remaining columns provide information on the results of the alcohol tests the first three of these present results for drivers who showed any evidence of alcohol; the last three columns present information on drivers who had BACs over the statutory limit of 80 mg%. To illustrate, among year olds there were nine drivers killed during 2012; eight of these fatally injured drivers (88.9%) were tested for alcohol. Of those who were tested, one (12.5%) was positive for alcohol. This means that year old fatally injured drinking drivers accounted for 6.7% of all drinking drivers who were killed. 157
168 Then, in the final three columns, it can be seen that one of the eight (12.5%) fatally injured year olds who were tested for alcohol had BACs in excess of 80 mg%. The final column expresses the number of drivers with illegal BACs as a percent of all drivers with BACs over the limit. Thus, year old drivers accounted for 7.7% of all the drivers with BACs over the legal limit. Table 11-2 Alcohol Use Among Fatally Injured Drivers of Highway Vehicles: Nova Scotia, 2012 Category of Driver Age Group <20* > Gender No. of Drivers Male Female Vehicle Type Automobiles Truck/Van Motorcycles Tractor Trailer Collision Type Single vehicle Multiple vehicle Duration Between Crash and Death Time Within 30 Days > 30 Days TOTAL * Drivers in two age groups have been aggregated to ensure that an individual will not be identified. The main findings are shown by the totals at the bottom of the table. Nova Scotia had a very high testing rate in 2012, with 91.7% of fatally injured drivers being tested for alcohol use. In Nova Scotia, 27.3% had been drinking and 13 of 15 (86.7%) fatally injured drinking drivers had BACs over 80 mg%. Although not shown in the table, more refined analyses by different BAC categories show that among tested drivers: > 72.7% had BACs of zero mg% > 3.6% had BACs from 1-49 mg%; > 0.0% had BACs from mg% > 9.1% had BACs from 81 to 160 mg%; and, > 14.5% had BACs over 160 mg%. Drivers Tested No. % of total No. Positive BAC % of tested % of all drivers with +BAC No. BAC >80 mg% % of tested % of all drivers with BAC >80 mg% 158
 have BACs over 80 mg%. 11.2.1 Age differences.")
169 The BAC distribution for fatally injured drivers is shown in Figure In this figure 16 of 60 (26.7%) fatally injured drivers have a positive BAC. And among fatally injured drinking drivers, 14 (87.5%) have BACs over 80 mg% Age differences. Drivers under 16 and have been regrouped (under 20 age group) to ensure that individuals cannot be identified. Of all the fatally injured drinking drivers (i.e., those with a positive BAC), 33.3% were aged 36-45; 20.0% were aged and over 55; 13.3% were under 20 years of age; and 6.7% were aged and Of all the fatally injured legally impaired drivers (i.e., those with BACs over 80 mg%), 38.5% were aged 36-45; 23.1% were aged 46-55; 15.4% were over 55; and 7.7% were aged under 20, and When comparing the incidence of drinking and driving among fatally injured drivers by age group, fatally injured drivers aged were the most likely to have been drinking (62.5%). By contrast, 12.5% of the tested drivers aged had been drinking Gender differences. Males dominate the picture they account for 93.3% of all of the fatally injured drivers who had been drinking and 92.3% of those who were legally impaired. Males dominate the picture largely because they account for most of the drivers who are killed (48 of the 60 fatalities or 80.0% are males). Fatally injured male drivers were more likely to have been drinking than female drivers (31.1% and 10.0%, respectively). And 85.7% of the male drivers and 100.0% of the female drivers who were drinking had BACs over the legal limit Vehicle differences. Of all the fatally injured drinking drivers (i.e., those with a positive BAC), 73.3% were automobile drivers; 20.0% were truck/van drivers; and 6.7% were motorcyclists. Of all the fatally injured legally impaired drivers (i.e., those with BACs over 80 mg%), 76.9% were automobile drivers; 15.4% were truck/van drivers; and 7.7% were motorcyclists. Within each of the vehicle types, 50.0% of fatally injured truck/van drivers, 26.8% of automobile drivers; and 14.3% of motorcyclists were found to have been drinking. 159
170 Collision differences. Just over half of the drivers killed (33 of the 60) were involved in single-vehicle collisions but these crashes accounted for 73.3% of the drivers who had been drinking and 69.2% of the drivers who were legally impaired. The reason for this apparent disparity is because alcohol is overrepresented in single-vehicle crashes. Over one-third of the drivers involved in single-vehicle crashes (36.7%) were positive for alcohol, compared to 16.0% of those involved in multiple-vehicle collisions Duration between crash and death time. Given that all of the fatally injured drivers died within 30 days of the collision, a comparison of alcohol use among drivers based on differences in the duration between crash time and death time is not applicable Drivers involved in alcohol-related serious injury crashes This section presents information on drivers involved in alcohol-related crashes in which someone was seriously injured in 2012 in Nova Scotia. A surrogate or indirect measure is used to estimate alcohol involvement because drivers in serious injury crashes are seldom tested for alcohol. A driver is identified as having been involved in an alcohol-related serious injury crash if the crash in which someone was seriously injured involved a single vehicle at night (SVN), or if, in the case of a non-svn serious injury crash, the police reported alcohol involvement i.e., at least one drinking driver in the crash (see Section 2.2.4). The results are shown in Table 11-3 for drivers grouped in terms of age, gender, type of vehicle driven, and type of collision. The first column shows the number of drivers involved in serious injury crashes. The number and percent of drivers in such crashes that involved alcohol is shown in the next two columns. The final column expresses the number of drivers involved in alcohol-related serious injury crashes in any row as a percent of all drivers involved in alcohol- related serious injury crashes. As shown, by the totals at the bottom of the table, 368 drivers were involved in crashes in which someone was seriously injured, and among these 19.0% were alcohol-related crashes Driver age. Of all the drivers involved in alcohol-related serious injury crashes, 28.6% were aged 26-35; 22.9% were aged 20-25; 14.3% were aged and 36-45; 8.6% were aged 46-55; and 7.1% were over 55. Almost one-third of the drivers aged and were involved in alcohol-related serious injury crashes (30.3% and 30.2%, respectively). The lowest incidence of involvement in alcohol-related crashes was found for those under 16 and over 55 (0.0 and 7.0%, respectively) Driver gender. Of all the drivers involved in alcohol-related serious injury crashes, 82.9% were males. The incidence of involvement in alcohol-related serious injury crashes was greater for males than for females (22.8% and 9.2%, respectively) Type of vehicle driven. Of all the drivers involved in alcohol-related serious injury crashes, 57.1% were automobile drivers; 30.0% were truck/van drivers; and 8.6% were off-road vehicle drivers. The highest incidence of involvement in alcohol-related serious injury crashes was found for drivers of offroad vehicles 28.6% of these drivers were in crashes that involved alcohol, compared to 22.1% for 160
171 truck/van drivers; 20.6% for automobile drivers; and 9.1% for tractor-trailer drivers. Among motorcyclists, 4.7% were involved in alcohol-related crashes. Table 11-3 Drivers in Alcohol-Related Serious Injury Crashes: Nova Scotia, 2012 Category of Drivers Number of Drivers Alcohol-Related % of % of all drivers in Number total alcohol-related crashes Age < > unknown Gender Male Female unknown Vehicle Type Auto Truck/Van Motorcycle Tractor Trailer Other Hwy. Vehicle Off-Road Unknown Collision Type Single-Vehicle Multiple-Vehicle TOTAL Type of collision. Of all the drivers involved in alcohol-related serious injury crashes, 80.0% of them were in single-vehicle crashes. The highest incidence of involvement in alcohol-related serious injury crashes was also found among drivers in single-vehicle crashes 33.5% of these drivers, compared to only 7.0% for drivers involved in multiple-vehicle crashes Drug use among fatally injured drivers This section presents information on the presence of drugs, exclusively among drivers fatally injured in Nova Scotia during Table 11-4 shows the prevalence of drug use among fatally injured drivers of highway vehicles as well as the number of drivers who tested positive for various categories of drugs. As can be seen, Nova Scotia had a very high testing rate in 2012, with 90.0% of fatally injured drivers being tested for drug use. Among fatally injured tested drivers, 20 out of 54 (37.0%) were positive for drugs. The most common category of drugs found within drivers testing positive for drug use was cannabis (55.0%). Other categories 161
172 of drugs found in fatally injured drivers testing positive for drugs were CNS stimulants (35.0%), CNS depressants (30.0%), and narcotic analgesics (25.0%). Table 11-4 Drug Use Among Fatally Injured Drivers of Highway Vehicles: Nova Scotia, 2012 Prevalence of Drug Use Number of Drivers Tested Positive for Drugs Drivers Number % of total Number % of tested (90.0) 20 (37.0) Categories of Drugs Found Among Drivers Testing Positive Positive for Drug Type Drug Category Number of % of drivers testing Drivers positive* Cannabis CNS Stimulants CNS Depressants Narcotic Analgesics Hallucinogens Dissociative Anesthetics Inhalants (55.0) (35.0) (30.0) (25.0) (0.0) (0.0) (0.0) * Percentages will not add up to 100% due to multiple drug types found in blood samples of some drivers Trends in alcohol and drug-impaired driving Sections 11.1 through 11.3 examined three indicators of the alcohol-crash problem: (1) the number and percent of people who died in crashes that involved alcohol (within 12 months and 30 days of the collision); (2) the number and percent of fatally injured drivers who had been drinking; and (3) the number and percent of drivers in serious injury crashes that involved alcohol. Section 11.4 examined drug use among fatally injured drivers in This section examines changes in these four indicators over time Deaths in alcohol-related crashes: Table 11-5 and Figure 11-2 show the number and percent of people who died in crashes involving a drinking driver from 1995 to These results differ slightly from those in Section 11.1 for two reasons. First, deaths that occur in crashes that involve a drinking pedestrian are not necessarily classified as alcohol-related deaths. The focus here is more restrictive, on deaths that occur in crashes involving at least one drinking driver. Second, the trend analyses focus on fatal crashes on public roadways involving principal vehicle types (where at least one of the vehicles involved is an automobile, truck/van, motorcycle or other highway vehicle). The previous analyses included all types of motorized vehicles (e.g., snowmobiles) on both public roadways and in off-road locations. As shown in the figure, the number of deaths in crashes that involved a drinking driver generally dropped from 56 in 1995 to a low of 17 in 2008, increased to 25 in 2009, decreased to 18 in 2010, and rose again to 23 in The percentage of alcohol-related fatalities generally decreased from 50.9% in 1995 to a low of 21.3% in 2008, increased to 36.8% in 2009, decreased to 26.9% in 2010, and increased again to 28.4% in
173 As shown at the bottom of the table, during the baseline period there was an average of 25 fatalities involving a drinking driver and they accounted for 31.3% of all fatalities. This means that the percent of fatalities involving a drinking driver decreased by 10.5% from 31.3% in the baseline period ( ) to 28.0% in the period. In terms of the number of persons killed in crashes involving a drinking driver, there has been a 16.0% decrease from an average of 25 in the baseline period ( ) to 21 in the period. Table 11-5 Number* and Percent of Motor Vehicle Deaths** Involving a Drinking Driver: Nova Scotia, Persons Dying Within 12 Persons Dying Within 30 Days Months of Collision of Collision Year of Number of Alcohol-Related Deaths Number of Alcohol-Related Deaths Death Deaths Number % of total Deaths Number % of total baseline period * numbers are estimates based on the percent of deaths for which information was available to determine alcohol use. ** only on public roadways involving principal vehicle types
 showed no evidence of alcohol (represented by the white area); (2) had BACs below the")
174 Alcohol use among fatally injured drivers: Data on alcohol use among fatally injured drivers over the 26-year period from are shown in Table Trends are illustrated in Figure 11-3 which shows changes in the percent of fatally injured drivers who: (1) showed no evidence of alcohol (represented by the white area); (2) had BACs below the legal limit (shown by the light grey area); and (3) had BACs over the legal limit (the dark grey area). The data reported here are restricted to drivers who died in less than six hours after the crash (see Section 2.2.2). As can be seen, the percent of fatally injured drivers with BACs over the legal limit peaked in 1989 (53.5%), generally decreased to a low in 2008 (18.4%), rose to 39.5% in 2009, decreased in 2010 (25.0%), rose in 2011 (32.4%), and decreased again in 2012 (24.5%). The percent of fatally injured drivers with zero BACs dropped to its lowest point in 1989 (35.6%) peaked in 2008 (77.6%), decreased in 2009 (58.1%), rose in 2010 (67.5%), decreased in 2011 (61.8%), and rose again in 2012 (71.7%). The percent of fatally injured drivers with BACs between 1 and 80 mg% dropped to its lowest mark in 1993 and 2000 (0.0%), peaked at 20.0% in 2002, generally decreased until 2009 (2.3%), rose in 2010 (7.5%), and decreased until 2012 (3.8%). When compared to the baseline period shown at the bottom of Table 11-6, the percentage of fatally injured drivers with zero BACs in the period decreased by 1.2% (from 69.0% to 68.2%). Among drivers with BACs from 1-80 mg%, there was a 6.3% decrease (from 4.8% to 4.5%). And among drivers with BACs over 80 mg%, there was a 4.2% increase (from 26.2% to 27.3%). 164
175 Alcohol Use Among Fatally Injured Drivers of Highway Vehicles: Nova Scotia, Number of Drivers Tested Drivers Grouped by BAC (mg%) Year Drivers* No. (% Total) Zero (% Tested) 1-80 (% Tested) >80 (% Tested) baseline (97.7) 29 (69.0) 2 (4.8) 11 (26.2) period * dying in less than six hours. Table (100.0) 30 (68.2) 2 (4.5) 12 (27.3) Table 11-7 and Figure 11-4 show data on alcohol use among fatally injured drivers over a shorter period from These results also differ from those reported above for several reasons. First, the number of drivers is extrapolated to reflect the BAC distribution of drivers tested for alcohol (see Figure 11-1). Second, estimates are based on all fatally injured drivers, not just those who died in less than six hours from the crash. Third, drivers are grouped in only two BAC categories: zero and positive. 165

176 As can be seen at the bottom of Table 11-7, the baseline percentage of fatally injured drivers testing positive for alcohol from is 34.7%. In the period, 31.4% of fatally injured drivers tested positive for alcohol, a 9.5% decrease from the baseline period. Table 11-7 Alcohol Use Among Fatally Injured Drivers of Highway Vehicles*: Nova Scotia, Year Number of Drivers Drivers Grouped by BAC (mg%) Zero (% Tested) Positive (% Tested) (40.9) 37 (39.8) (54.0) 29 (46.0) (48.5) 34 (51.5) (51.7) 29 (48.3) (45.0) 33 (55.0) (49.3) 34 (50.7) (56.1) 25 (43.9) (54.3) 21 (45.7) (45.1) 28 (54.9) (61.7) 23 (38.3) (48.2) 29 (51.8) (54.5) 25 (45.5) (43.9) 23 (56.1) (59.6) 19 (40.4) (75.6) 11 (24.4) (52.4) 20 (47.6) (66.0) 16 (34.0) (61.8) 21 (38.2) (78.2) 12 (21.8) (58.3) 20 (41.7) (65.9) 14 (34.1) (61.9) 16 (38.1) (73.3) 16 (26.7) baseline (65.3) 17 (34.7) (68.6) 16 (31.4) period * numbers are estimates based on the BAC distribution of drivers tested for alcohol 166
177 Drivers in serious injury crashes: Table 11-8 and Figure 11-5 show information on drivers involved in alcohol-related serious injury crashes. During the baseline period ( ), an average of 24.1% of drivers in serious injury crashes were in an alcohol-involved crash. This percentage decreased to 18.1% in 2011, then rose to 19.0% in In the period, an average of 18.5% of drivers in serious injury crashes were in an alcohol-involved crash. This represents a 23.2% decrease in the problem compared to the baseline period. Table 11-8 Number and Percent of All Drivers in Serious Injury Crashes* that Involved Alcohol: Nova Scotia, Year Number of Drivers Number in Alcohol- Involved Crashes Percent (18.2) (23.4) (21.5) (19.4) (21.1) (23.2) (23.6) (20.7) (23.2) (22.5) (25.6) (25.3) (25.7) (20.2) (22.7) (25.9) (18.1) (19.0) baseline (24.1) period (18.5) * single-vehicle nighttime crashes (SVN) as well as non-svn crashes that have police-reported alcohol involvement 167
178 Table 11-9 and Figure 11-6 also show information on drivers involved in alcohol-related serious injury crashes. These results differ slightly from those in Section 11.3 and in Table 11-8 and Figure 11-5 because they exclude certain vehicle types e.g., bicycles, snowmobiles, farm tractors and other non-highway vehicles. As can be seen, the incidence of alcohol-involvement in serious injury crashes has fluctuated over this 18- year period. Between 1995 and 2005 the percentage of all drivers in serious injury crashes that involved alcohol rose from 18.5% to 26.1%. Since then, the incidence generally decreased until 2008 (20.0%), rose until 2010 (25.8%), decreased in 2011 (17.1%), and increased in 2012 (18.3%). In the baseline period ( ), an average of 23.9% of drivers in serious injury crashes were in an alcohol-involved crash. In the period, the percentage of drivers in serious injury crashes involving alcohol was 17.7%, resulting in a 25.9% decrease. 168
179 Table 11-9 Number and Percent of Drivers* of Highway Vehicles in Serious Injury Crashes** that Involved Alcohol: Nova Scotia, Year Number of Drivers (18.5) (24.9) (22.3) (20.4) (21.7) (23.6) (23.3) (21.1) (23.5) (23.1) (26.1) (24.9) (26.2) (20.0) (22.0) (25.8) (17.1) (18.3) baseline (23.9) period Number in Alcohol- Involved Crashes Percent (17.7) * excludes operators of bicycles, snowmobiles, farm tractors, and other nonhighway vehicles. ** single-vehicle nighttime crashes (SVN) as well as non-svn crashes that have police-reported alcohol involvement Drug use among fatally injured drivers: Table and Figure 11-7 show data on drug use among fatally injured drivers over a 13-year period ( ). Similar to Table 11-6, these results are based on fatally injured drivers of highway vehicles who died less than six hours after the crash (see Section 2.2.5). 169

180 As can be seen at the bottom of Table 11-10, the percentage of fatally injured drivers testing positive for drugs from , the baseline period, is 40.0%. In the period, 41.9% of fatally injured drivers tested positive for drugs, a 4.8% increase from the baseline period. Drug Use Among Fatally Injured Drivers* of Highway Vehicles: Nova Scotia, Number of Drivers YEAR Drivers* Tested (% Total) Drivers Tested for Drugs Negative (% Tested) Positive (% Tested) baseline period * dying in less than six hours. Table
181 12.0 PRINCE EDWARD ISLAND This section of the report reviews the major findings on alcohol involvement in fatal and serious injury motor vehicle collisions as well as drug involvement in fatal motor vehicle collisions in Prince Edward Island during It describes data on: > people who were killed in alcohol-related crashes (Section 12.1); > alcohol use among fatally injured drivers (Section 12.2); > drivers involved in alcohol-related serious injury crashes (Section 12.3); > drug use among fatally injured drivers (Section 12.4); and, > trends in the alcohol-crash and drug-crash problems (Section 12.5) Deaths in alcohol-related crashes Table 12-1 presents information on people who died in alcohol-related crashes in Prince Edward Island during 2012 for persons dying within 12 months of the collision (one calendar year) and for persons dying within 30 days of the collision. Motor vehicle deaths are categorized in terms of the victim s age, gender, type (i.e., driver, passenger, pedestrian) and the type of vehicle they occupied. In each section, the first column in the table presents the number of deaths. The next two columns show the number and percent of these fatalities in which sufficient information was available to determine if alcohol was involved. A motor vehicle fatality was considered to be alcohol involved if there was at least one drinking driver or drinking pedestrian in the fatal crash. For example, within the first section, it can be seen that among persons dying within 12 months of the collision, four people aged 25 and under were killed in motor vehicle crashes in Prince Edward Island during And, in all four cases (100.0%) it was possible to determine if alcohol was a factor in the crash. The next column shows the number of people killed in crashes that were known to be alcohol-involved. There were two people aged 25 and under who died in alcohol-related crashes in Prince Edward Island during The next column expresses this as a percentage i.e., 50.0% of those aged 25 and under who were killed died in an alcohol-related crash. The final column (percent of all alcohol-related deaths) expresses the number of deaths in alcohol-related crashes as a percent of all the deaths in such crashes. For example, the alcohol-related deaths among those aged 25 and under represent 25.0% of all the people killed in alcohol-related crashes in Prince Edward Island during An examination of the section for persons dying within 30 days of the collision shows that four persons aged 25 and under died in motor vehicle crashes. In all four of these cases (100.0%), it was possible to determine if alcohol was a factor in the crash. Among these persons, two (50.0%) were alcohol-related deaths. And those aged 25 and under accounted for 25.0% of people dying in alcohol-related crashes. 171
182 The totals at the bottom of the table provide a summary. As can be seen, 13 persons died within 12 months of a motor vehicle crash in Prince Edward Island during In 13 (100.0%) of these cases, it was possible to determine if alcohol was a factor. Of these known cases, eight (61.5%) involved alcohol. In Prince Edward Island during 2012, eight persons died in alcohol-related crashes within 12 months of the collision. Among the 12 persons dying within 30 days of the collision, it was possible to determine if alcohol was a factor in 100.0% of the cases. Of these cases, eight (66.7%) involved alcohol. In Prince Edward Island during 2012, eight persons died in alcohol-related crashes within 30 days of the collision. Age Group 25 and under and over Gender Table 12-1 Deaths in Alcohol-Related Crashes: Prince Edward Island, 2012 Category of Victim No. of Deaths Persons Dying Within 12 Months of Collision Alcohol Use Known % of No. No. total Alcohol-Related Deaths (ARDs) % of % of all known ARDs Persons Dying Within 30 Days of Collision No. of Deaths Alcohol Use Known % of No. total Male Female Victim Type Driver/ Operator Other** Vehicle Occupied Automobiles Other*** Collision Location Public Road Offroad TOTAL * Persons in two age groups have been aggregated to ensure that an individual will not be identified. ** Passengers and pedestrians have been aggregated to ensure that an individual will not be identified. Alcohol-Related Deaths (ARDs) % of % of all No. known ARDs *** Pedestrians, truck/van, tractor-trailer and off-road vehicle occupants have been aggregated to ensure that an individual will not be identified Victim age. Persons under age 16 and (regrouped as 25 and under) and those aged 26-35, 36-45, 46-55, and over 55 (regrouped as 26 and over) have been placed into broader age groups to ensure that individuals cannot be identified. Of all the people who died in alcohol-related crashes within 12 months of the collision, 25.0% (see last column in the first section) were aged 25 and under while 75.0% were aged 26 and over. The highest incidence of alcohol involvement occurred in the crashes in which a person aged 26 and over died (66.7%). The lowest incidence of alcohol involvement was found among the persons 25 and under as 50.0% of persons in this age group died in crashes involving alcohol. 172
183 Gender. Of all the people who died in alcohol-related crashes within 12 months of the collision, 75.0% were males. The incidence of alcohol in crashes in which a male died (66.7%) was greater than the incidence of alcohol in crashes in which a female died (50.0%) Victim type. Passengers and pedestrians have been regrouped into other victim types to ensure that individuals cannot be identified. Of all the people who died in alcohol-related crashes within 12 months of the collision, 75.0% were drivers/operators and 25.0% were other victim types. Within each of the victim types, the highest incidence of alcohol involvement (75.0%) occurred in the crashes in which a driver/operator died. Alcohol was involved in 40.0% of the crashes in which other victim types died Type of vehicle occupied. Pedestrians, truck/van, tractor-trailer, and off-road vehicle occupants have been regrouped into other vehicles occupied to ensure that individuals cannot be identified. Of all the people who died in alcohol-related crashes within 12 months of the collision, 50.0% were automobile occupants and 50.0% were other vehicle occupants. Within each of these vehicle types, the incidence of alcohol involvement in which other vehicle occupants died (66.7%) was greater than the incidence of alcohol in crashes in which an automobile occupant died (57.1%) Alcohol in fatally injured drivers This section presents information on the presence of alcohol, exclusively among drivers fatally injured within 12 months of the collision in Prince Edward Island during Table 12-2 shows the information by age group, gender, vehicle type, collision type (single vs. multiple), and duration between crash time (within 12 months of the collision vs. within 30 days of the collision). The first column in the table shows the number of drivers killed. The next columns show the number and percent of these victims who were tested for alcohol. The remaining columns provide information on the results of the alcohol tests the first three of these present results for drivers who showed any evidence of alcohol; the last three columns present information on drivers who had BACs over the statutory limit of 80 mg%. To illustrate, among year olds there were four drivers killed during 2012; all of these fatally injured drivers (100.0%) were tested for alcohol. Of those who were tested, three (75.0%) were positive for alcohol. This means that fatally injured drinking drivers aged accounted for 75.0% of all drinking drivers who were killed. Then, in the final three columns, it can be seen that two (50.0%) of the fatally injured drivers aged years of age who were tested for alcohol had BACs in excess of 80 mg%. This means that two of the three drivers who were positive for alcohol had a BAC in excess of the legal limit. The final column expresses the number of drivers with illegal BACs as a percent of all drivers with BACs over the limit. As can be seen, drivers aged accounted for 100.0% of all the drivers with BACs over the legal limit. 173
184 The main findings are shown by the totals at the bottom of the table. Prince Edward Island had a high testing rate in 2012, with 83.3% of fatally injured drivers being tested for alcohol use. Table 12-2 Alcohol Use Among Fatally Injured Drivers of Highway Vehicles: Prince Edward Island, 2012 Category of Driver Age Group 20-55* > Gender No. of Drivers Drivers Tested No. % of total Male Female Collision Type Single vehicle Multiple vehicle Duration Between Crash and Death Time No. Positive BAC % of tested % of all drivers with +BAC BAC >80 mg% % of tested Within 30 Days > 30 Days TOTAL * Drivers in multiple age groups have been aggregated to ensure that an individual will not be identified. No. % of all drivers with BAC >80 mg% In Prince Edward Island, 80.0% had been drinking and two out of four (50.0%) of the fatally injured drinking drivers had BACs over 80 mg%. Although not shown in the table, more refined analyses by different BAC categories show that among tested drivers: > 20.0% had BACs of zero mg%; > 40.0% had BACs from 1-49 mg%; > 0.0% had BACs from mg%; > 0.0% had BACs from mg%; and, > 40.0% had BACs over 160 mg%. The BAC distribution for fatally injured drivers is shown in Figure As can be seen, five of six (83.3%) fatally injured drivers have positive BACs. And among fatally injured drinking drivers, three (60.0%) have BACs over 80 mg%. 174
185 Age differences. Drivers aged 20-25, 26-35, and have been regrouped (20-55 age group) to ensure that individuals cannot be identified. Of all the fatally injured drinking drivers (i.e., those with a positive BAC), 75.0% were aged and 25.0% were over age 55. Of all the fatally injured legally impaired drivers (i.e., those with BACs over 80 mg%), 100.0% were aged When comparing the incidence of drinking and driving among fatally injured drivers by age group, fatally injured tested drivers over 55 years of age were the most likely to have been drinking (100.0%). Threequarters (75.0%) of the drivers aged had been drinking Gender differences. Males dominate the picture as they account for 75.0% of all the fatally injured drivers who had been drinking and 50.0% of fatally injured drivers that were legally impaired. Males dominate the picture largely because they account for most of the drivers who are killed (four of the six fatalities or 66.7% are males). However, fatally injured female drivers were more likely to have been drinking than male drivers (100.0% and 75.0%, respectively). And, 100.0% of the female drivers and 33.3% of the male drivers who were drinking had BACs over the legal limit Vehicle differences. In order to ensure that individual drivers cannot be identified, detailed analysis of alcohol use among fatally injured drivers based on vehicle type is not provided in this subsection Collision differences. Four of six drivers killed (66.7%) were involved in single-vehicle collisions and these crashes accounted for 75.0% of the drivers who had been drinking as well as 100.0% those who were legally impaired. The reason for this apparent disparity is because alcohol is overrepresented in single-vehicle crashes. However, a smaller percentage of the drivers involved in single-vehicle crashes (75.0%) were positive for alcohol, compared to 100.0% of those involved in multiple-vehicle collisions Duration between crash and death time. Given only one fatally injured driver died more than 30 days after the collision, and this driver was not tested for alcohol, a comparison of alcohol use among drivers based on differences in the duration between crash time and death time is not applicable. 175
186 12.3 Drivers involved in alcohol-related serious injury crashes This section presents information on drivers involved in alcohol-related crashes in which someone was seriously injured in 2012 in Prince Edward Island. A surrogate or indirect measure is used to estimate alcohol involvement because drivers in serious injury crashes are seldom tested for alcohol. A driver is identified as having been involved in an alcohol-related serious injury crash if the crash in which someone was seriously injured involved a single vehicle at night (SVN), or if, in the case of a non-svn serious injury crash, the police reported alcohol involvement i.e., at least one drinking driver in the crash (see Section 2.2.4). The results are shown in Table 12-3 for drivers grouped in terms of age, gender, type of vehicle driven, and type of collision. The first column shows the number of drivers involved in serious injury crashes. The number and percent of drivers in such crashes that involved alcohol is shown in the next two columns. The final column expresses the number of drivers involved in alcohol-related serious injury crashes in any row as a percent of all drivers involved in alcohol-related serious injury crashes. As shown, by the totals at the bottom of the table, 68 drivers were involved in crashes in which someone was seriously injured, and among these 27.9% were alcohol-related crashes Driver age. Of all the drivers involved in alcohol-related serious injury crashes, 42.1% were aged 20-25; 15.8% were aged 36-45, 46-55, and over 55; and 5.3% were aged and Almost half of the drivers aged were involved in alcohol-related serious injury crashes (47.1%). The lowest incidence of involvement in alcohol-related crashes was found for those under 16 (0.0%), and (12.5% each) Driver gender. Of all the drivers involved in alcohol-related serious injury crashes, 73.7% were males. The incidence of involvement in alcohol-related serious injury crashes was also greater for males than for females (31.1% and 22.7%, respectively) Type of vehicle driven. Of all the drivers involved in alcohol-related serious injury crashes, 73.7% were automobile drivers; 15.8% were off-road vehicle drivers; and 10.5% were motorcyclists. The highest incidence of involvement in alcohol-related serious injury crashes was found for off-road vehicle drivers (60.0%) compared to 34.1% for automobile drivers. Among motorcyclists, 28.6% were involved in alcohol-related crashes Type of collision. Of all the drivers involved in alcohol-related serious injury crashes, 78.9% of them were in single-vehicle crashes. The highest incidence of involvement in alcohol-related serious injury crashes was also found among drivers in single-vehicle crashes 42.9% of these drivers, compared to only 12.1% for drivers involved in multiple-vehicle crashes. 176
187 Table 12-3 Drivers in Alcohol-Related Serious Injury Crashes: Prince Edward Island, 2012 Category of Drivers Number of Drivers Alcohol-Related % of % of all drivers in Number total alcohol-related crashes Age < > unknown Gender Male Female unknown Vehicle Type Auto Truck/Van Motorcycle Tractor Trailer Off-Road Unknown Collision Type Single-Vehicle Multiple-Vehicle TOTAL Drug use among fatally injured drivers This section presents information on the presence of drugs, exclusively among drivers fatally injured in Prince Edward Island during Table 12-4 shows the prevalence of drug use among fatally injured drivers of highway vehicles as well as the number of drivers who tested positive for various categories of drugs. As can be seen, Prince Edward Island had a high testing rate in 2012, with 83.3% of fatally injured drivers being tested for drug use. Among fatally injured tested drivers, one out of five (20.0%) were positive for drugs. The most common categories of drugs found within drivers testing positive for drug use was CNS depressants (100.0%). 177
188 Table 12-4 Drug Use Among Fatally Injured Drivers of Highway Vehicles: Prince Edward Island, 2012 Prevalence of Drug Use Number of Drivers Tested Positive for Drugs Drivers Number % of total Number % of tested 6 5 (83.3) 1 (20.0) Types of Drugs Found Among Drivers Testing Positive Positive for Drug Type Drug Type Number of % of drivers testing Drivers positive* CNS Depressants Cannabis Narcotic Analgesics CNS Stimulants Hallucinogens (100.0) (0.0) (0.0) (0.0) (0.0) Dissociative Anesthetics Inhalants 0 0 (0.0) (0.0) 12.5 Trends in alcohol and drug-impaired driving Sections 12.1 through 12.3 examined three indicators of the alcohol-crash problem: (1) the number and percent of people who died in crashes that involved alcohol (within 12 months and 30 days of the collision); (2) the number and percent of fatally injured drivers who had been drinking; and (3) the number and percent of drivers in serious injury crashes that involved alcohol. Section 12.4 examined drug use among fatally injured drivers in This section examines changes in these four indicators over time Deaths in alcohol-related crashes: Table 12-5 and Figure 12-2 show the number and percent of people who died in crashes involving a drinking driver from 1995 to These results differ slightly from those in Section 12.1 for two reasons. First, deaths that occur in crashes that involve a drinking pedestrian are not necessarily classified as alcohol-related deaths. The focus here is more restrictive, on deaths that occur in crashes involving at least one drinking driver. Second, the trend analyses focus on fatal crashes on public roadways involving principal vehicle types (where at least one of the vehicles involved is an automobile, truck/van, motorcycle or other highway vehicle). The previous analyses included all types of motorized vehicles (e.g., snowmobiles) on both public roadways and in off-road locations. As shown in the table and figure, the number of deaths in crashes that involved a drinking driver generally dropped from nine to three between 1995 and This number fluctuated between 2002 and 2005, peaked at 14 in 2006, generally decreased to a low of one in 2010, rose to 10 in 2011, and decreased again to eight in The percentage of alcohol-related fatalities generally decreased from 56.3% in 1995 to 14.3% in Since then, the percentage of alcohol-related fatalities in Prince Edward Island rose to 56.3% 178


189 in 2003, decreased to 20.0% in 2005, rose to 51.9% in 2006, fell to a low of 11.1% in 2010, and rose again to 66.7% in As shown at the bottom of the table, during the baseline period, there was an average of seven fatalities involving a drinking driver and they accounted for 46.7% of all fatalities. Thus, it can be seen that the percent of fatalities involving a drinking driver increased by 28.5% from 46.7% in the baseline period ( ) to 60.0% in the period. And, in terms of the number of persons killed in crashes involving a drinking driver, there has been a 28.6% increase from an average of seven in the baseline period ( ) to nine in the period. Table 12-5 Number* and Percent of Motor Vehicle Deaths** Involving a Drinking Driver: Prince Edward Island, Persons Dying Within 12 Persons Dying Within 30 Days Months of Collision of Collision Year of Number of Alcohol-Related Deaths Number of Alcohol-Related Deaths Death Deaths Number % of total Deaths Number % of total baseline period * numbers are estimates based on the percent of deaths for which information was available to determine alcohol use. ** only on public roadways involving principal vehicle types. 179
190 Alcohol use among fatally injured drivers: Data on alcohol use among fatally injured drivers over the 26-year period from are shown in Table Trends are illustrated in Figure 12-3 which shows changes in the percent of fatally injured drivers who: (1) showed no evidence of alcohol (represented by the white area); (2) had BACs below the legal limit (shown by the light grey area); and (3) had BACs over the legal limit (the dark grey area). The data reported here are restricted to drivers who died in less than six hours after the crash (see Section 2.2.2). As can be seen, the percent of fatally injured drivers with BACs over the legal limit generally declined from 1987 (60.0%) to 1997 (11.1%), generally increased until 2007 (66.7%), decreased in 2010 (0.0%), rose in 2011 (45.5%), and decreased again in 2012 (40.0%). The percent of fatally injured drivers with zero BACs generally increased from 1987 (40.0%) to its highest level in 1998 (87.5%), stabilized until 2006 (72.7%), dropped in 2007 and 2008 (33.3%), rose in 2010 (83.3%), and decreased to its lowest point in 2012 (20.0%). The percent of fatally injured drivers with BACs between 1 and 80 mg% reached 33.3% in 1990, fell to its lowest mark from 1998 to 2002 (0.0%), increased in 2003 (14.3%), returned to a low of 0.0% from 2005 to 2009, and rose to its highest level in 2012 (40.0%). When compared to the baseline period, the percentage of fatally injured drivers with zero BACs in the period decreased by 60.0% (from 62.5% to 25.0%). Among drivers with BACs from 1-80 mg%, there was an increase from 0.0% to 25.0%. Among drivers with BACs over 80 mg%, there was a 33.3% increase 37.5% in the baseline period to 50.0% in the period. 180
191 Alcohol Use Among Fatally Injured Drivers of Highway Vehicles: Prince Edward Island, Number of Drivers Tested Drivers Grouped by BAC (mg%) Year Drivers* No. (% Total) Zero (% Tested) 1-80 (% Tested) >80 (% Tested) baseline 8 8 (100.0) 5 (62.5) 0 (0.0) 3 (37.5) period 8 8 (100.0) * dying in less than six hours. Table (25.0) 2 (25.0) 4 (50.0) Table 12-7 and Figure 12-4 show data on alcohol use among fatally injured drivers over a shorter period from These results also differ from those reported above for several reasons. First, the number of drivers is extrapolated to reflect the BAC distribution of drivers tested for alcohol (see Figure 12-1). Second, estimates are based on all fatally injured drivers, not just those who died in less than six hours from the crash. Third, drivers are grouped in only two BAC categories: zero and positive. 181

192 As can be seen in Table 12-7, the baseline percentage of fatally injured drivers testing positive for alcohol from is 44.4%. In the period, 66.7% of fatally injured drivers tested positive for alcohol, a 50.2% increase from the baseline period. Table 12-7 Alcohol Use Among Fatally Injured Drivers of Highway Vehicles*: Prince Edward Island, Year Zero (% Tested) Positive (% Tested) (56.3) 7 (43.8) (68.8) 5 (31.3) (50.0) 4 (50.0) (36.4) 7 (63.6) (63.6) 4 (36.4) (41.7) 7 (58.3) (73.3) 4 (26.7) (63.6) 4 (36.4) (90.9) 1 (9.1) (70.0) 3 (30.0) (66.7) 4 (33.3) (66.7) 2 (33.3) (60.0) 4 (40.0) (55.6) 4 (44.4) (56.3) 7 (43.8) (61.5) 5 (38.5) (76.9) 3 (23.1) (25.0) 3 (75.0) (33.3) 8 (66.7) (50.0) 5 (50.0) (83.3) 1 (16.7) (36.4) 7 (63.6) (16.7) 5 (83.3) baseline Number of Drivers Drivers Grouped by BAC (mg%) 9 5 (55.6) 4 (44.4) period 9 3 (33.3) 6 (66.7) * numbers are estimates based on the BAC distribution of drivers tested for alcohol Drivers in serious injury crashes: Table 12-8 and Figure 12-5 show information on drivers involved in alcohol-related serious injury crashes. As shown in Table 12-8, during the baseline period ( ), an 182
 1996 75 22 (29.3) 1997 111 21 (18.9) 1998 112 22 (19.6) 1999 133 34 (25.6) 2000 115 33 (28.7) 2001 94 19 (20.")
193 average of 23.4% of drivers in serious injury crashes were in an alcohol-involved crash. This compares to 26.5% in the period, a 13.2% increase in the problem. Year Number of Drivers Number in Alcohol- Involved Crashes Percent (16.5) (29.3) (18.9) (19.6) (25.6) (28.7) (20.2) (20.2) (16.4) (29.9) (27.5) (24.7) (22.7) (23.1) (29.5) (19.7) (25.4) (27.9) baseline (23.4) period Table 12-8 Number and Percent of All Drivers in Serious Injury Crashes* that Involved Alcohol: Prince Edward Island, (26.5) * single-vehicle nighttime crashes (SVN) as well as non-svn crashes that have police-reported alcohol involvement Table 12-9 and Figure 12-6 also show information on drivers involved in alcohol-related serious injury crashes. These results differ slightly from those in Section 12.3 and in Table 12-8 and Figure 12-5 above because they exclude certain vehicle types e.g., bicycles, snowmobiles, farm tractors, and other nonhighway vehicles. 183
194 As can be seen, the incidence of alcohol-involvement in serious injury crashes has fluctuated over this 18- year period. Between 1995 and 1996 the percentage of drivers in serious injury crashes that involved alcohol rose from 15.1% to 29.7%. Since then, the incidence fluctuated until 2003, rose to 29.3% in 2004, fluctuated until 2009 (31.0%), decreased to 19.7% in 2010, and rose again to 25.8% in As shown Table 12-9, in the baseline period ( ) an average of 23.0% of drivers in serious injury crashes were in an alcohol-involved crash. In the period, the incidence of drivers in alcoholinvolved crashes rose to 25.8%, a 12.2% increase. Table 12-9 Number and Percent of Drivers* of Highway Vehicles in Serious Injury Crashes** that Involved Alcohol: Prince Edward Island, Year Number of Drivers Number in Alcohol- Involved Crashes Percent (15.1) (29.7) (20.6) (20.4) (25.4) (29.1) (19.3) (21.3) (16.2) (29.3) (28.8) (23.4) (22.1) (22.9) (31.0) (19.7) (24.2) (25.8) baseline (23.0) (25.8) period * excludes operators of bicycles, snowmobiles, farm tractors, and other non-highway vehicles. ** single-vehicle nighttime crashes (SVN) as well as non-svn crashes that have police-reported alcohol involvement 184
195 Drug use among fatally injured drivers: Table and Figure 12-7 show data on drug use among fatally injured drivers over a 13-year period ( ). Similar to Table 12-6, these results are based on fatally injured drivers of highway vehicles who died less than six hours after the crash (see Section 2.2.5). As can be seen at the bottom of Table 12-10, the percentage of fatally injured drivers testing positive for drugs from , the baseline period, is 28.6%. In the period, 62.5% of fatally injured drivers tested positive for drugs, a 118.5% increase from the baseline period. Drug Use Among Fatally Injured Drivers* of Highway Vehicles: Prince Edward Island, Number of Drivers YEAR Drivers* Tested (% Total) Drivers Tested for Drugs Negative (% Tested) Positive (% Tested) baseline period * dying in less than six hours. Table

196 186
197 13.0 NEWFOUNDLAND AND LABRADOR This section of the report reviews the major findings on alcohol involvement in fatal and serious injury motor vehicle collisions as well as drug involvement in fatal motor vehicle collisions in Newfoundland and Labrador during It describes data on: > people who were killed in alcohol-related crashes (Section 13.1); > alcohol use among fatally injured drivers (Section 13.2); > drivers involved in alcohol-related serious injury crashes (Section 13.3); > drug use among fatally injured drivers (Section 13.4); and, > trends in the alcohol-crash and drug-crash problems (Section 13.5) Deaths in alcohol-related crashes Table 13-1 presents information on people who died in alcohol-related crashes in Newfoundland and Labrador during 2012 for persons dying within 12 months of the collision (one calendar year) and for persons dying within 30 days of the collision. Motor vehicle deaths are categorized in terms of the victim s age, gender, type (i.e., driver, passenger, pedestrian) and the type of vehicle they occupied. In each section, the first column in the table presents the number of deaths. The next two columns show the number and percent of these fatalities in which sufficient information was available to determine if alcohol was involved. A motor vehicle fatality was considered to be alcohol involved if there was at least one drinking driver or drinking pedestrian in the fatal crash. For example, within the first section, it can be seen that among persons dying within 12 months of the collision, nine people aged were killed in motor vehicle crashes in Newfoundland and Labrador during And, in eight cases (88.9%) it was possible to determine if alcohol was a factor in the crash. The next column shows the number of people killed in crashes that were known to be alcohol-involved. There were three people aged who died in alcohol-related crashes in Newfoundland and Labrador during The next column expresses this as a percentage i.e., 37.5% of the year olds who were killed died in an alcohol-related crash. The final column (percent of all alcohol-related deaths) expresses the number of deaths in alcohol-related crashes as a percent of all the deaths in such crashes. For example, the alcohol-related deaths among year olds represent 23.1% of all the people killed in alcohol-related crashes in Newfoundland and Labrador during An examination of the section for persons dying within 30 days of the collision shows that nine persons aged died in motor vehicle crashes. In eight of these cases (88.9%), it was possible to determine if alcohol was a factor in the crash. Among these persons, three (37.5%) were alcohol-related deaths. And year olds accounted for 23.1% of people dying in alcohol-related crashes. 187
198 The totals at the bottom of the table provide a summary. As can be seen, 41 persons died within 12 months of a motor vehicle crash in Newfoundland and Labrador during In 36 (87.8%) of these cases, it was possible to determine if alcohol was a factor. Of these known cases, 13 (36.1%) involved alcohol. Extrapolating this figure to the total number of motor vehicle fatalities (41 x.361) it can be estimated that in Newfoundland and Labrador during 2012, 15 persons died in alcohol-related crashes within 12 months of the collision. Among the 41 persons dying within 30 days of the collision, it was possible to determine if alcohol was a factor in 87.8% of the cases. Of these known cases, 13 (36.1%) involved alcohol. Extrapolating this figure to the total number of motor vehicle fatalities (41 x.361) it can be estimated that in Newfoundland and Labrador during 2012, 15 persons died in alcohol-related crashes within 30 days of the collision Victim age. Persons aged and have been regrouped (26-45 age group) to ensure that individuals cannot be identified. Of all the people who died in alcohol-related crashes within 12 months of the crash, 46.2% (see last column of the first section) were aged 26-45; 23.1% were aged 46-55; and 15.4% were aged and over 55. Table 13-1 Deaths in Alcohol-Related Crashes: Newfoundland and Labrador, 2012 Category of Victim Age Group < * > Gender Persons Dying Within 12 Months of Collision No. of Alcohol Use Known Alcohol-Related Deaths (ARDs) Deaths % of % of % of No. No. total known all Persons Dying Within 30 Days of Collision Alcohol Use Alcohol-Related No. of Known Deaths (ARDs) Deaths % of % of % of No. No. total known all Male Female Victim Type Driver/ Operator Passenger Pedestrian Vehicle Occupied Automobiles Trucks/Vans Motorcycles Other Hwy. Vehicles Off-Road Vehicles (Pedestrians) Collision Location Public Road Off-Road TOTAL * Persons in two age groups have been aggregated to ensure that an individual will not be identified. 188
199 The highest incidence of alcohol involvement occurred in the crashes in which a person aged died (66.7%). The lowest incidence of alcohol involvement was found among the youngest fatalities 0.0% of persons under age 16 and died in crashes involving alcohol Gender. Of all the people who died in alcohol-related crashes within 12 months of the collision, 84.6% were males. The incidence of alcohol in crashes in which a male died (37.9%) was greater than the incidence of alcohol in crashes in which a female died (28.6%) Victim type. Of all the people who died in alcohol-related crashes within 12 months of the collision, 92.3% were drivers/operators of a vehicle and 7.7% were pedestrians. Within each of the victim types, the highest incidence of alcohol involvement (50.0%) occurred in the crashes in which a pedestrian died. Alcohol was involved in 37.5% of the crashes in which a driver/operator died. None of the fatally injured passengers died in an alcohol-related crash Type of vehicle occupied. Of all the people who died in alcohol-related crashes within 12 months of the collision, 46.2% were off-road vehicle occupants; and 23.1% were automobile occupants and truck/van occupants. Within each of these vehicle types, the incidence of alcohol involvement in which an off-road vehicle occupant died (66.7%) was greater than the incidence of alcohol in crashes in which a truck/van occupant died (60.0%). Among automobile occupants, 18.8% died in an alcohol-related collision Collision location. Of all the people who died in alcohol-related crashes within 12 months of the collision, 76.9% died in a collision which occurred on a public road and 23.1% died in an off-road collision. However, the incidence of alcohol involvement in which a victim died in an alcohol-related crash was greater for those dying in off-road collisions (75.0%) than it was for persons dying in a collision which occurred on a public road (31.3%) Alcohol in fatally injured drivers This section presents information on the presence of alcohol, exclusively among drivers fatally injured within 12 months of the collision in Newfoundland and Labrador during Table 13-2 shows the information by age group, gender, vehicle type, collision type (single vs. multiple), and duration between crash time (within 12 months of the collision vs. within 30 days of the collision). The first column in the table shows the number of drivers killed. The next columns show the number and percent of these victims who were tested for alcohol. The remaining columns provide information on the results of the alcohol tests the first three of these present results for drivers who showed any evidence of alcohol; the last three columns present information on drivers who had BACs over the statutory limit of 80 mg%. To illustrate, among drivers aged there were six drivers killed during 2012; five of these fatally injured drivers (83.3%) were tested for alcohol. Of those who were tested, one (20.0%) was positive for alcohol. This means that fatally injured drinking drivers aged accounted for 14.3% of all drinking drivers who were killed. 189
200 Then, in the final three columns, it can be seen that one of the five (20.0%) fatally injured drivers aged who were tested for alcohol had BACs in excess of 80 mg%. This means that the driver who was positive for alcohol had a BAC in excess of the legal limit. The final column expresses the number of drivers with illegal BACs as a percent of all drivers with BACs over the limit. Thus, drivers aged accounted for 16.7% of all the drivers with BACs over the legal limit. Table 13-2 Alcohol Use Among Fatally Injured Drivers of Highway Vehicles: Newfoundland and Labrador, 2012 Category of Driver Age Group * > Gender No. of Drivers Drivers Tested No. % of total Male Female Vehicle Type Automobiles Truck/Van Motorcycles Collision Type Single vehicle Multiple vehicle Duration Between Crash and Death Time No. Positive BAC % of tested % of all drivers with +BAC BAC >80 mg% % of tested Within 30 Days > 30 Days TOTAL * Drivers in two age groups have been aggregated to ensure that an individual will not be identified. No. % of all drivers with BAC >80 mg% The main findings are shown by the totals at the bottom of the table. Newfoundland and Labrador had a very high testing rate in 2012, with 92.0% of fatally injured drivers being tested for alcohol use. In Newfoundland and Labrador, 30.4% had been drinking and six out of seven (85.7%) fatally injured drinking drivers had BACs over 80 mg%. Although not shown in the table, more refined analyses by different BAC categories show that among tested drivers: > 69.6% had BACs of zero mg%; > 0.0% had BACs from 1-49 mg%; > 4.3% had BACs from mg%; > 8.7% had BACs from 81 to 160 mg%; and, > 17.4% had BACs over 160 mg%. 190
201 The BAC distribution for fatally injured drivers is shown in Figure In this figure seven of 25 (28.0%) fatally injured drivers have a positive BAC. And among fatally injured drinking drivers, six (85.7%) have BACs over 80 mg% Age differences. Drivers aged and have been regrouped (26-45 age group) to ensure that individuals cannot be identified. Of all the fatally injured drinking drivers (i.e., those with a positive BAC), 28.6% were aged and over 55; and 16.7% were aged 16-19, and Of all the fatally injured legally impaired drivers (i.e., those with BACs over 80 mg%), 33.3% were over 55; and 16.7% were aged 16-19, 20-25, 26-45, and When comparing the incidence of drinking and driving among fatally injured drivers by age group, fatally injured drivers aged were the most likely to have been drinking (50.0%). By contrast, 20.0% of fatally injured drivers aged had been drinking Gender differences. Males dominate the picture they account for 85.7% of the fatally injured drivers who had been drinking and 83.3% of those who were legally impaired. Males dominate the picture largely because they account for most of the drivers who are killed (21 of the 25 fatalities or 84.0% are males). Fatally injured male drivers were more likely to have been drinking than female drivers (31.6% and 25.0%, respectively). And, 83.3% of male and 100.0% of female drivers who were drinking had BACs over the legal limit Vehicle differences. Of all the fatally injured drinking drivers (i.e., those with a positive BAC), 57.1% were automobile drivers and 42.9% were truck/van drivers. Among fatally injured legally impaired drivers (i.e., those with BACs over 80 mg%), 66.7% were automobile drivers and 33.3% were truck/van drivers. Within each of the vehicle types, 75.0% of fatally injured truck/van drivers and 26.7% of automobile drivers were found to have been drinking. None of the fatally injured motorcyclists had been drinking Collision differences. Slightly more than half of the drivers killed (14 of the 25) were involved in single-vehicle collisions yet these crashes accounted for 71.4% of drivers who had been drinking and 66.7% of those who were legally impaired. 191
202 The reason for this apparent disparity is because alcohol is usually overrepresented in single-vehicle crashes. Two-fifths of the drivers involved in single-vehicle crashes (38.5%) were positive for alcohol, compared to 20.0% of those involved in multiple-vehicle collisions Duration between crash and death time. Given that all of the fatally injured drivers died within 30 days of the collision, a comparison of alcohol use among drivers based on differences in the duration between crash time and death time is not applicable Drivers involved in alcohol-related serious injury crashes This section presents information on drivers involved in alcohol-related crashes in which someone was seriously injured in 2012 in Newfoundland and Labrador. A surrogate or indirect measure is used to estimate alcohol involvement because drivers in serious injury crashes are seldom tested for alcohol. A driver is identified as having been involved in an alcohol-related serious injury crash if the crash in which someone was seriously injured involved a single vehicle at night (SVN), or if, in the case of a non-svn serious injury crash, the police reported alcohol involvement i.e., at least one drinking driver in the crash (see Section 2.2.4). The results are shown in Table 13-3 for drivers grouped in terms of age, gender, type of vehicle driven, and type of collision. The first column shows the number of drivers involved in serious injury crashes. The number and percent of drivers in such crashes that involved alcohol is shown in the next two columns. The final column expresses the number of drivers involved in alcohol-related serious injury crashes in any row as a percent of all drivers involved in alcohol- related serious injury crashes. As shown, by the totals at the bottom of the table, 174 drivers were involved in crashes in which someone was seriously injured, and among these 18.4% were alcohol-related crashes Driver age. Of all the drivers involved in alcohol-related serious injury crashes, 25.0% were aged 36-45, and 21.9% were over 55. Drivers under 16 accounted for 0.0% of those involved in alcohol-related serious injury crashes. Almost one-third of the drivers aged were involved in alcohol-related serious injury crashes (29.6%). The lowest incidence of involvement in alcohol-related crashes was found for those aged under 16 and over 55 (0.0% and 15.6%, respectively) Driver gender. Of all the drivers involved in alcohol-related serious injury crashes, 78.1% were males. The incidence of involvement in alcohol-related serious injury crashes was also greater for males than for females (20.7% and 13.2%, respectively) Type of vehicle driven. Of all the drivers involved in alcohol-related serious injury crashes, 56.3% were automobile drivers; 18.8% were motorcyclists; 9.4% were truck/van drivers; and 6.3% were off-road vehicle drivers and drivers of other highway vehicles. The highest incidence of involvement in alcohol-related serious injury crashes was found for drivers of offroad vehicles and other highway vehicles (20.0%), compared to 19.4% for motorcyclists, 18.9% for automobile drivers; and 16.7% for truck/van drivers. 192
203 Type of collision. Of all the drivers involved in alcohol-related serious injury crashes, 100.0% of them were in single-vehicle crashes. The highest incidence of involvement in alcohol-related serious injury crashes was also found among drivers in single-vehicle crashes (37.6%) compared to 0.0% for drivers involved in multiple-vehicle crashes. Table 13-3 Drivers in Alcohol-Related Serious Injury Crashes: Newfoundland and Labrador, 2012 Category of Drivers Number of Drivers Alcohol-Related % of % of all drivers in Number total alcohol-related crashes Age < > Gender Male Female Vehicle Type Auto Truck/Van Motorcycle Other Hwy. Vehicle Off-Road Unknown Collision Type Single-Vehicle Multiple-Vehicle TOTAL Drug use among fatally injured drivers This section presents information on the presence of drugs, exclusively among drivers fatally injured in Newfoundland and Labrador during Table 13-4 shows the prevalence of drug use among fatally injured drivers of highway vehicles as well as the number of drivers who tested positive for various categories of drugs. As can be seen, Newfoundland and Labrador had a low testing rate in 2012, with 48.0% of fatally injured drivers being tested for drug use. Among fatally injured tested drivers, six out of 12 (50.0%) were positive for drugs. The most common categories of drugs found within drivers testing positive for drug use were cannabis (50.0%), CNS depressants (33.3%), CNS stimulants and hallucinogens (16.7% each). 193
204 Table 13-4 Drug Use Among Fatally Injured Drivers of Highway Vehicles: Newfoundland and Labrador, 2012 Prevalence of Drug Use Number of Drivers Tested Positive for Drugs Drivers Number % of total Number % of tested (48.0) 6 (50.0) Categories of Drugs Found Among Drivers Testing Positive Positive for Drug Type Drug Category Number of % of drivers testing Drivers positive* Cannabis CNS Depressants CNS Stimulants Hallucinogens Narcotic Analgesics Dissociative Anesthetics Inhalants (50.0) (33.3) (16.7) (16.7) (0.0) (0.0) (0.0) * Percentages will not add up to 100% due to multiple drug types found in blood samples of some drivers Trends in alcohol and drug-impaired driving Sections 13.1 through 13.3 examined three indicators of the alcohol-crash problem: (1) the number and percent of people who died in crashes that involved alcohol (within 12 months and 30 days of the collision); (2) the number and percent of fatally injured drivers who had been drinking; and (3) the number and percent of drivers in serious injury crashes that involved alcohol. Section 13.4 examined drug use among fatally injured drivers in This section examines changes in these four indicators over time Deaths in alcohol-related crashes: Table 13-5 and Figure 13-2 show the number and percent of people who died in crashes involving a drinking driver from 1995 to These results differ slightly from those in Section 13.1 for two reasons. First, deaths that occur in crashes that involve a drinking pedestrian are not necessarily classified as alcohol- related deaths. The focus here is more restrictive, on deaths that occur in crashes involving at least one drinking driver. Second, the trend analyses focus on fatal crashes on public roadways involving principal vehicle types (where at least one of the vehicles involved is an automobile, truck/van, motorcycle or other highway vehicle). The previous analyses included all types of motorized vehicles (e.g., snowmobiles) on both public roadways and in off-road locations. As shown in the table and the figure, the number of deaths in crashes that involved a drinking driver was 10 in 1995, decreased to four in 2000, peaked at 21 in 2008, and settled at eight in Between 1995 and 2000, the percentage of alcohol-related fatalities generally decreased from 35.7% to a low of 8.9%, peaked at 58.3% in 2008, decreased to 16.7% in 2009, and reached 25.8% in As shown at the bottom of the table, during the baseline period there was an average of 13 fatalities involving a drinking driver and they accounted for 38.2% of all fatalities. This means that the percent of fatalities involving a drinking driver decreased by 8.1% from 38.2% in the baseline period (

")


205 2010) to 35.1% in the period. And, in terms of the number of persons killed in crashes involving a drinking driver, there has been no change from an average of 13 in the baseline period ( ) to 13 in the period Alcohol use among fatally injured drivers: Data on alcohol use among fatally injured drivers over the 26-year period from are shown in Table Trends are illustrated in Figure 13-3 which shows 195
206 changes in the percent of fatally injured drivers who: (1) showed no evidence of alcohol (represented by the white area); (2) had BACs below the legal limit (shown by the light grey area); and (3) had BACs over the legal limit (the dark grey area). The data reported here are restricted to drivers who died in less than six hours after the crash (see Section 2.2.2). As can be seen, the percentage of fatally injured drivers with BACs over the legal limit generally decreased from a peak in 1993 (56.3%), to a low in 2000 (10.5%), generally rose until 2008 (47.6%), and fluctuated until 2012 (27.3%). In 1995, 60.0% percent of fatally injured drivers had zero BACs. The percentage fell to a low of 13.3% in 2007, peaked in 2009 (85.7%), and fluctuated until 2012 (68.2%). The percentage of fatally injured drivers with BACs from 1-80 mg% was 0.0% in 1987, peaked in 2007 (40.0%), decreased to 0.0% from 2009 until 2011, and rose to 4.5% in When compared to the baseline period, the percentage of fatally injured drivers with zero BACs in the period increased by 32.9% (from 55.6% to 73.9%). Among drivers with BACs from 1-80 mg%, there was a 61.3% decrease (from 11.1% to 4.3%). And among drivers with BACs over 80 mg%, there was a 34.8% decrease (from 33.3% to 21.7%). Table 13-6 Alcohol Use Among Fatally Injured Drivers of Highway Vehicles: Newfoundland and Labrador, Year Number of Drivers Tested Drivers Grouped by BAC (mg%) Drivers* No. (% Total) Zero (% Tested) 1-80 (% Tested) >80 (% Tested) baseline period (94.7) (95.8) (55.6) (73.9) 2 1 (11.1) (4.3) 6 5 (33.3) (21.7) * dying in less than six hours. 196
207 Table 13-7 and Figure 13-4 show data on alcohol use among fatally injured drivers over a shorter period from These results also differ from those reported above for several reasons. First, the number of drivers is extrapolated to reflect the BAC distribution of drivers tested for alcohol (see Figure 13-1). Second, estimates are based on all fatally injured drivers, not just those who died in less than six hours from the crash. Third, drivers are grouped in only two BAC categories: zero and positive. As can be seen in Table 13-7, the baseline percentage of fatally injured drivers testing positive for alcohol from is 47.6%. From 2011 to 2012, an average of 25.9% of fatally injured drivers tested positive for alcohol, a 45.6% decrease from the baseline period. 197
 17 (60.7) 1991 25 10 (40.0) 15 (60.0) 1992 20 8 (40.0) 12 (60.0) 1993 25 8 (32.0) 17 (68.0) 1994 15 8 (53.3) 7 (46.7) 1995 11 8 (72.7) 3 (27.3) 1996 18 8 (44.4) 10 (55.")
208 Table 13-7 Alcohol Use Among Fatally Injured Drivers of Highway Vehicles*: Newfoundland and Labrador, Year Number of Drivers Drivers Grouped by BAC (mg%) Zero (% Tested) Positive (% Tested) (39.3) 17 (60.7) (40.0) 15 (60.0) (40.0) 12 (60.0) (32.0) 17 (68.0) (53.3) 7 (46.7) (72.7) 3 (27.3) (44.4) 10 (55.6) (50.0) 9 (50.0) (60.0) 8 (40.0) (45.0) 11 (55.0) (84.0) 4 (16.0) (52.9) 8 (47.1) (65.0) 7 (35.0) (61.1) 7 (38.9) (56.3) 7 (43.8) (45.0) 11 (55.0) (68.2) 7 (31.8) (11.1) 16 (88.9) (26.1) 17 (73.9) (84.6) 4 (15.4) (66.7) 6 (33.3) (79.3) 6 (20.7) (72.0) 7 (28.0) baseline (52.4) 10 (47.6) period (74.1) 7 (25.9) * numbers are estimates based on the BAC distribution of drivers tested for alcohol Drivers in serious injury crashes: Collision data from 2009 to 2011 for Newfoundland and Labrador were not available at the time this report was being prepared. For this reason, the serious-injury trend tables and figures in this sub-section will only report data from 1995 to 2008 and 2012 and the comparative baseline will cover the period instead of Table 13-8 shows information on drivers involved in alcohol-related serious injury crashes. During the baseline period ( ), an average of 21.2% of drivers in serious injury crashes were in an alcohol-involved crash. Figure 13-5 rounds the annual 198

209 percentages into whole numbers. In 2012, the percentage of drivers involved in alcohol-involved seriousinjury crashes was 18.4%. This represents a 13.2% decrease in the problem compared to the baseline period. Table 13-8 Number and Percent of All Drivers in Serious Injury Crashes* that Involved Alcohol: Newfoundland and Labrador, Year Number of Alcohol Related Drivers Number % (22.1) (20.4) (17.2) (20.7) (23.7) (15.6) (18.3) (18.3) (17.2) (24.0) (19.3) (21.7) (19.9) (21.4) (18.4) baseline (21.2) * single-vehicle nighttime crashes (SVN) as well as non-svn crashes that have police-reported alcohol involvement Table 13-9 and Figure 13-6 also show information on drivers involved in alcohol-related serious injury crashes. These results differ slightly from those in Section 13.3 and in Table 13-8 and Figure 13-5 because they exclude certain vehicle types e.g., bicycles, snowmobiles, farm tractors and other non-highway vehicles. 199
, and decreased to 18.")
210 As can be seen, the incidence of alcohol-involvement in serious injury crashes has been relatively stable. The percentage of drivers in serious-injury crashes that involved alcohol decreased from 21.6% to 17.6% between 1995 and 1997, peaked at 25.2% in 1999, dropped to a low of 15.7% in 2000, generally rose to 23.3% in 2004, remained relatively stable until 2008 (21.7%), and decreased to 18.5% in As shown in Table 13-9, in the baseline period ( ), an average of 22.3% of drivers in serious injury crashes were in an alcohol-involved crash. In 2012, the incidence of drivers in alcohol-involved crashes was 18.5%, representing a 17.0% decrease. Table 13-9 Number and Percent of Drivers of Highway Vehicles in Serious Injury Crashes* that Involved Alcohol: Newfoundland and Labrador, Year Number of Alcohol Related Drivers Number % (21.6) (20.9) (17.6) (19.8) (25.2) (15.7) (17.9) (17.8) (17.3) (23.3) (18.4) (22.1) (22.5) (21.7) (18.5) baseline (22.3) * excludes operators of bicycles, snowmobiles, farm tractors, and other non-highway vehicles. ** single-vehicle nighttime crashes (SVN) as well as non-svn crashes that have police-reported alcohol involvement 200
.")
211 Drug use among fatally injured drivers: Table and Figure 13-7 show data on drug use among fatally injured drivers over a 13-year period ( ). Similar to Table 13-6, these results are based on fatally injured drivers of highway vehicles who died less than six hours after the crash (see Section 2.2.5). As can be seen at the bottom of Table 13-10, the percentage of fatally injured drivers testing positive for drugs from , the baseline period, is 28.6%. The percentage of fatally injured drivers testing positive for drugs was 28.6% in 2011 and 50.0% in From 2011 to 2012, the average percentage of fatally injured drivers testing positive for drugs was 44.4%, a 55.2% increase from the baseline period. Table Drug Use Among Fatally Injured Drivers* of Highway Vehicles: Newfoundland and Labrador, Number of Drivers YEAR Drivers* Tested (% Total) Drivers Tested for Drugs Negative (% Tested) Positive (% Tested) baseline period * dying in less than six hours
212
213 14.0 YUKON This section of the report reviews the major findings on alcohol involvement in fatal and serious injury motor vehicle collisions as well as drug involvement in fatal motor vehicle collisions in the Yukon during It describes data on: > people who were killed in alcohol-related crashes (Section 14.1); > alcohol use among fatally injured drivers (Section 14.2); > drivers involved in alcohol-related serious injury crashes (Section 14.3); > drug use among fatally injured drivers (Section 14.4); and, > trends in the alcohol-crash and drug-crash problems (Section 14.5). Detailed results are not provided in Sections 14.1, 14.2 and 14.4 because the small number of deaths in alcohol-related crashes only one and drivers fatally injured only one makes the results unreliable Deaths in alcohol-related crashes A motor vehicle fatality was considered to be alcohol involved if there was at least one drinking driver or drinking pedestrian in the fatal crash. During 2012, two persons died in motor vehicle crashes in the Yukon. And, in both of these cases (100.0%), it was possible to determine if alcohol was a factor in the crash. Of these cases, one (50.0%) involved alcohol Alcohol in fatally injured drivers The Yukon had only one fatally injured driver in This driver was tested for alcohol and had a negative BAC Drivers involved in alcohol-related serious injury crashes This section presents information on drivers involved in alcohol-related crashes in which someone was seriously injured in 2012 in the Yukon. A surrogate or indirect measure is used to estimate alcohol involvement because drivers in serious injury crashes are seldom tested for alcohol. A driver is identified as having been involved in an alcohol-related serious injury crash if the crash in which someone was seriously injured involved a single vehicle at night (SVN), or if, in the case of a non-svn serious injury crash, the police reported alcohol involvement i.e., at least one drinking driver in the crash (see Section 2.2.4). The results are shown in Table 14-1 for drivers grouped in terms of age, gender, type of vehicle driven, and type of collision. The first column shows the number of drivers involved in serious injury crashes. The number and percent of drivers in such crashes that involved alcohol are shown in the next two columns. 203
214 The final column expresses the number of drivers involved in alcohol-related serious injury crashes in any row as a percent of all drivers involved in alcohol- related serious injury crashes. As shown, by the totals at the bottom of the table, 20 drivers were involved in crashes in which someone was seriously injured, and among these 15.0% were alcohol-related crashes. Age Alcohol-Related % of % of all drivers in Number total alcohol-related crashes > unknown Gender Male Female unknown Vehicle Type Table 14-1 Drivers in Alcohol-Related Serious Injury Crashes: Yukon, 2012 Category of Drivers Auto Truck/Van Motorcycle Off-Road Collision Type Number of Drivers Single-Vehicle Multiple-Vehicle TOTAL Driver age. Of all the drivers involved in alcohol-related serious injury crashes, 33.3% were aged 20-25, 26-35, and Within each of the age groups, 50.0% of the drivers aged 20-25, and were involved in alcoholrelated serious injury crashes. The lowest incidence of involvement in alcohol-related crashes was found for those aged 16-19, and over 55 (0.0%) Driver gender. Of all the drivers involved in alcohol-related serious injury crashes, 66.7% were males. However, the incidence of involvement in alcohol-related serious injury crashes was greater for females than for males (25.0% and 13.3%, respectively) Type of vehicle driven. Of all the drivers involved in alcohol-related serious injury crashes, 66.7% were truck/van drivers and 33.3% were automobile drivers. The highest incidence of involvement in alcohol-related serious injury crashes was found for truck/van drivers 22.2% of these drivers were in crashes that involved alcohol, compared to 16.7% for automobile drivers and 0.0% for motorcyclists and off-road vehicle operators. 204
215 Type of collision. Of all the drivers involved in alcohol-related serious injury crashes, 100.0% of them were in single-vehicle crashes. The highest incidence of involvement in alcohol-related serious injury crashes was also found among drivers in single-vehicle crashes 23.1% of these drivers, compared to only 0.0% for drivers involved in multiple-vehicle crashes Drug use among fatally injured drivers The Yukon had only one fatally injured driver in This driver was tested for drugs and had a negative result Trends in alcohol and drug-impaired driving Sections 14.1 through 14.3 examined three indicators of the alcohol-crash problem: (1) the number and percent of people who died in crashes that involved alcohol (within 12 months and 30 days of the collision); (2) the number and percent of fatally injured drivers who had been drinking; and (3) the number and percent of drivers in serious injury crashes that involved alcohol. Section 14.4 examined drug use among fatally injured drivers in This section examines changes in these four indicators over time Deaths in alcohol-related crashes: Table 14-2 and Figure 14-1 show the number and percent of people who died in crashes involving a drinking driver from 1995 to These results differ slightly from those in Section 14.1 for two reasons. First, deaths that occur in crashes that involve a drinking pedestrian are not necessarily classified as alcohol-related deaths. The focus here is more restrictive, on deaths that occur in crashes involving at least one drinking driver. Second, the trend analyses focus on fatal crashes on public roadways involving principal vehicle types (where at least one of the vehicles involved is an automobile, truck/van, motorcycle or other highway vehicle). The previous analyses included all types of motorized vehicles (e.g., snowmobiles) on both public roadways and in off-road locations. As shown in the figure, the number of deaths in crashes that involved a drinking driver increased from one to seven between 1995 and 1998, fell to zero in 2001, rose to six in 2002, decreased to one in 2004, rose to five in 2006, fluctuated until 2010, and decreased to one in The percentage of alcohol-related fatalities rose from 7.7% in 1995 to 66.7% in 1996 and Since then, the percentage of alcohol-related fatalities in the Yukon fluctuated until 2000, dropped to 0.0% in 2001, generally rose until 2005 (66.7%), fluctuated until 2009 (28.6%), peaked in 2010 (75.0%), decreased in 2011 (33.3%), and rose again in 2012 (50.0%). It can be seen that during the baseline period that there was an average of three fatalities involving a drinking driver and they accounted for 42.9% of all fatalities. This means that the percent of fatalities involving a drinking driver increased by 16.6% from 42.9% in the baseline period ( ) to 50.0% in the period. In terms of the number of persons killed in crashes involving a drinking driver, there was a 33.3% decrease from an average of three in the baseline period ( ) to two in the period. 205


216 Table 14-2 Number* and Percent of Motor Vehicle Deaths** Involving a Drinking Driver: Yukon, Persons Dying Within 12 Months of Collision Persons Dying Within 30 Days of Collision Year of Number of Alcohol-Related Deaths Number of Alcohol-Related Deaths Death Deaths Number % of total Deaths Number % of total baseline period * numbers are estimates based on the percent of deaths for which information was available to determine alcohol use. ** only on public roadways involving principal vehicle types Alcohol use among fatally injured drivers: Due to the small number of cases e.g., one fatally injured driver in 2012 any trends would be unreliable, and therefore, are not presented in tables and figures Drivers in serious injury crashes: In the Yukon, data are only available since 1998 to indicate the degree of injury severity for collision victims. Thus trend tables in this section include data from 2005 to 2012, as opposed to the period reported for serious injury collisions in most other jurisdictions. Table 14-3 and Figure 14-2 show information on drivers involved in alcohol-related serious injury crashes. 206

217 During the baseline period ( ), an average of 32.1% of drivers in serious injury crashes were in an alcohol-involved crash. This compares to 26.1% in the period, an 18.7% decrease in the problem. Table 14-3 Number and Percent of All Drivers in Serious Injury Crashes* that Involved Alcohol: Yukon, Year Number of Drivers Number in Alcohol- Involved Crashes Percent (40.0) (17.5) (50.0) (22.2) (39.5) (24.1) (42.9) (51.2) (20.7) (35.7) (18.5) (40.7) (44.8) (34.6) (15.0) baseline 28 9 (32.1) period 23 6 (26.1) * single-vehicle nighttime crashes (SVN) as well as non-svn crashes that have police-reported alcohol involvement Table 14-4 and Figure 14-3 also show information on drivers involved in alcohol-related injury crashes. These results differ slightly from those in Section 14.3 and in Table 14-3 and Figure 14-2 because they exclude certain vehicle types e.g., bicycles, snowmobiles, farm tractors and other non-highway vehicles. As can be seen the incidence of alcohol-involvement in injury crashes has fluctuated over this 15-year period. Between 1998 and 2003 the percentage of all drivers in injury crashes that involved alcohol 207
218 fluctuated, rose to 51.2% in 2005, generally decreased until 2008 (18.5%), rose to 44.0% in 2010, and decreased again to 15.8% in As shown in Table 14-4, in the baseline period ( ), an average of 33.3% of drivers in injury crashes were in an alcohol-involved crash. In the period, the incidence of drivers in alcohol-involved crashes was 26.1%, representing a 21.7% decrease. Table 14-4 Number and Percent of Drivers* of Highway Vehicles in Serious Injury Crashes** that Involved Alcohol: Yukon, Year Number of Drivers (40.0) (17.5) (50.0) (22.2) (39.5) (24.1) (42.9) (51.2) (20.7) (37.0) (18.5) (40.7) (44.0) (34.6) (15.8) baseline 27 9 (33.3) period Number in Alcohol- Involved Crashes Percent 23 6 (26.1) * excludes operators of bicycles, snowmobiles, farm tractors, and other nonhighway vehicles. ** single-vehicle nighttime crashes (SVN) as well as non-svn crashes that have police-reported alcohol involvement Fatally injured drivers: Due to the small number of cases e.g., one fatally injured driver in 2012 any trends would be unreliable, and therefore, are not presented in tables and figures. 208
219 15.0 NORTHWEST TERRITORIES This section of the report reviews the major findings on alcohol involvement in fatal and serious injury motor vehicle collisions as well as drug involvement in fatal motor vehicle collisions in the Northwest Territories during It describes data on: > people who were killed in alcohol-related crashes (Section 15.1); > alcohol use among fatally injured drivers (Section 15.2); > drivers involved in alcohol-related serious injury crashes (Section 15.3); > drug use among fatally injured drivers (Section 15.4); and, > trends in the alcohol-crash and drug-crash problems (Section 15.5). Detailed results are not provided in Sections 15.1, 15.2 and 15.4 because the small number of deaths only two and drivers fatally injured none makes the results unreliable Deaths in alcohol-related crashes A motor vehicle fatality was considered to be alcohol involved if there was at least one drinking driver or drinking pedestrian in the fatal crash. During 2012, two persons died in motor vehicle crashes in the Northwest Territories. And, in all (100.0%) of these cases, it was possible to determine if alcohol was a factor in the crash Alcohol use among fatally injured drivers The Northwest Territories had no fatally injured drivers in Drivers involved in alcohol-related serious injury crashes This section presents information on drivers involved in alcohol-related crashes in which someone was seriously injured in 2012 in the Northwest Territories. A surrogate or indirect measure is used to estimate alcohol involvement because drivers in serious injury crashes are seldom tested for alcohol. A driver is identified as having been involved in an alcohol-related serious injury crash if the crash in which someone was seriously injured involved a single vehicle at night (SVN), or if, in the case of a non-svn serious injury crash, the police reported alcohol involvement i.e., at least one drinking driver in the crash (see Section 2.2.4). The results are shown in Table 15-1 for drivers grouped in terms of age, gender, type of vehicle driven, and type of collision. The first column shows the number of drivers involved in serious injury crashes. The number and percent of drivers in such crashes that involved alcohol is shown in the next two columns. The final column expresses the number of drivers involved in alcohol-related serious injury crashes in any row as a percent of all drivers involved in alcohol-related serious injury crashes. 209
220 As shown, by the totals at the bottom of the table, 13 drivers were involved in crashes in which someone was seriously injured, and among these one (7.7%) was an alcohol-related crash. Table 15-1 Drivers in Alcohol-Related Serious Injury Crashes: Northwest Territories, 2012 Category of Drivers Number of Drivers Alcohol-Related % of % of all drivers in Number total alcohol-related crashes Age < > Gender Male Female Vehicle Type Truck/Van Tractor-Trailer Off-Road Collision Type Single-Vehicle Multiple-Vehicle TOTAL Driver age. Among drivers aged 26-35, 50.0% were involved in an alcohol related crash. Among those under 16, 16-19, 20-25, 46-55, and over 55, none (0.0%) were involved in alcohol-related serious injury crashes Driver gender. Among male drivers, 11.1% were involved in an alcohol-related serious injury crash compared to 0.0% of female drivers Type of vehicle driven. Among off-road vehicle drivers, 20.0% were involved in serious injury crashes involving alcohol compared to 0.0% of truck/van and tractor-trailer drivers Type of collision. Among drivers involved in single-vehicle serious injury crashes, 14.3% were in a crash which involved alcohol compared to 0.0% of drivers involved in multiple-vehicle serious injury crashes Drug use among fatally injured drivers The Northwest Territories had no fatally injured drivers in Trends in alcohol and drug-impaired driving Sections 15.1 through 15.3 examined three indicators of the alcohol-crash problem: (1) the number and percent of people who died in crashes that involved alcohol (within 12 months and 30 days of the collision); (2) the number and percent of fatally injured drivers who had been drinking; and (3) the number and percent of drivers in serious injury crashes that involved alcohol. Section 15.4 examined drug use among fatally injured drivers in This section examines changes in these four indicators over time. 210

221 Deaths in alcohol-related crashes: Due to the small number of crashes on public roadways involving principal vehicle types (e.g., two in 2012) any trends would be unreliable, and therefore are not reported Alcohol use among fatally injured drivers: Due to the small number of cases e.g., no fatally injured drivers in 2012 any trends would be unreliable, and therefore are not reported Drivers in serious injury crashes: Table 15-2 and Figure 15-1 show information on drivers involved in alcohol-related serious injury crashes. During the baseline period ( ), an average of 43.8% of drivers in serious injury crashes were in an alcohol-involved crash. This compares to 11.1% in the period, representing a 74.7% decrease. Table 15-2 Number and Percent of All Drivers in Serious Injury Crashes* that Involved Alcohol: Northwest Territories, Year Number of Drivers Number in Alcohol- Involved Crashes Percent (66.7) (38.1) (26.7) (50.0) (29.2) (54.5) (32.0) (27.3) (35.3) (31.3) (32.3) (42.9) (52.9) (46.7) (25.0) (37.5) (0.0) (7.7) baseline 16 7 (43.8) period 9 1 (11.1) * single-vehicle nighttime crashes (SVN) as well as non-svn crashes that have police-reported alcohol involvement 211
222 Table 15-3 and Figure 15-2 also show information on drivers involved in alcohol-related serious injury crashes. These results differ slightly from those in Section 15.3 and in Table 15-2 and Figure 15-1 because they exclude certain vehicle types e.g., bicycles, snowmobiles, farm tractors and other non-highway vehicles. As can be seen, the incidence of alcohol-involvement in serious injury crashes has fluctuated over this 18- year period. Between 1995 and 1999 the percentage of all drivers in serious injury crashes that involved alcohol generally decreased. Since then, the incidence peaked at 66.7% in 2000, generally decreased to 21.4% in 2004, rose to 41.2% in 2006, remained stable until 2008 (41.7%), decreased to 20.0% in 2009, rose in 2010 (25.0%), and decreased to 0.0% in 2011 and As shown in Table 15-3, in the baseline period ( ), an average of 33.3% of drivers in serious injury crashes were in an alcohol-involved crash. In the period, the incidence of drivers in alcoholinvolved crashes declined to 0.0%. Table 15-3 Number and Percent of Drivers of Highway Vehicles in Serious Injury Crashes* that Involved Alcohol: Northwest Territories, Year Number of Drivers Number in Alcohol- Involved Crashes Percent (65.0) (35.7) (25.0) (57.1) (36.8) (66.7) (35.0) (26.3) (37.5) (21.4) (23.8) (41.2) (40.0) (41.7) (20.0) (25.0) (0.0) (0.0) baseline 12 4 (33.3) period 6 0 (0.0) * single-vehicle nighttime crashes (SVN) as well as non-svn crashes that have police-reported alcohol involvement 212

223 Drug use among fatally injured drivers: Due to the small number of cases e.g., no fatally injured drivers in 2012 any trends would be unreliable, and therefore are not reported. 213
224
225 16.0 NUNAVUT This section of the report reviews the major findings on alcohol involvement in fatal and serious injury motor vehicle collisions as well as drug involvement in fatal motor vehicle collisions in Nunavut during It describes data on: > people who were killed in alcohol-related crashes (Section 16.1); > alcohol use among fatally injured drivers (Section 16.2); > drivers involved in alcohol-related serious injury crashes (Section 16.3); > drug use among fatally injured drivers (Section 16.4); and, > trends in the alcohol-crash and drug-crash problems (Section 16.5). Detailed results are not provided in Sections 16.1, 16.2 and 16.4 because the small number of deaths only two and drivers fatally injured none makes the results unreliable Deaths in alcohol-related crashes A motor vehicle fatality was considered to be alcohol involved if there was at least one drinking driver or drinking pedestrian in the fatal crash. During 2012, three persons died in motor vehicle crashes in Nunavut. And, in two of these cases (66.7%), it was possible to determine if alcohol was a factor in the crash Alcohol in fatally injured drivers Nunavut had no fatally injured drivers of highway vehicles in Drivers involved in alcohol-related serious injury crashes This section presents information on drivers involved in alcohol-related crashes in which someone was seriously injured in 2010 in Nunavut. At the time this report was being prepared, 2011 and 2012 collision data from Nunavut were not available. For this reason, 2010 data will be reported in this section. A surrogate or indirect measure is used to estimate alcohol involvement because drivers in serious injury crashes are seldom tested for alcohol. A driver is identified as having been involved in an alcohol-related serious injury crash if the crash in which someone was seriously injured involved a single vehicle at night (SVN), or if, in the case of a non-svn serious injury crash, the police reported alcohol involvement i.e., at least one drinking driver in the crash (see Section 2.2.4). The results are shown in Table 16-1 for drivers grouped in terms of age, gender, type of vehicle driven, and type of collision. The first column shows the number of drivers involved in serious injury crashes. The number and percent of drivers in such crashes that involved alcohol is shown in the next two columns. The 215
226 final column expresses the number of drivers involved in alcohol-related serious injury crashes in any row as a percent of all drivers involved in alcohol- related serious injury crashes. As shown by the totals at the bottom of the table, five drivers were involved in crashes in which someone was seriously injured, and among these 40.0% were alcohol-related crashes. Due to the small number of cases, further analysis of drivers involved in serious injury crashes should be treated with caution. Age Alcohol-Related % of % of all drivers in Number total alcohol-related crashes Gender Male Female Vehicle Type Truck/Van Off-Road Collision Type Table 16-1 Drivers in Alcohol-Related Serious Injury Crashes: Nunavut, 2010 Category of Drivers Number of Drivers Single-Vehicle Multiple-Vehicle TOTAL * These numbers are slightly underestimated since 24.4% of injuries are recorded as unspecified Driver age. Of all the drivers involved in alcohol-related serious injury crashes, 100.0% were aged Two-thirds (66.7%) of the drivers aged were involved in alcohol-related serious injury crashes. The lowest incidence of involvement in alcohol-related crashes was found for those aged (0.0%) Driver gender. Of all the drivers involved in alcohol-related serious injury crashes, 100.0% were males. And, the incidence of involvement in alcohol-related serious injury crashes was greater for males than for females (50.0% and 0.0%, respectively) Type of vehicle driven. Of all the drivers involved in alcohol-related serious injury crashes, 100.0% were off-road vehicle drivers. The highest incidence of involvement in alcohol-related serious injury crashes was found for off-road vehicle drivers 50.0% of these drivers were in crashes that involved alcohol, compared to 0.0% for truck/van drivers Type of collision. Of all the drivers involved in alcohol-related serious injury crashes, 100.0% of them were in single-vehicle crashes. The highest incidence of involvement in alcohol-related serious injury crashes was also found among drivers in single-vehicle crashes 66.7% of these drivers, compared to 0.0% for drivers involved in multiple-vehicle crashes. 216
227 16.4 Drug use among fatally injured drivers Nunavut had no fatally injured drivers of highway vehicles in Trends in alcohol and drug-impaired driving Sections 16.1 through 16.3 examined three indicators of the alcohol-crash problem: (1) the number and percent of people who died in crashes that involved alcohol (within 12 months and 30 days of the collision); (2) the number and percent of fatally injured drivers who had been drinking; and (3) the number and percent of drivers in serious injury crashes that involved alcohol. Section 16.4 examined drug use among fatally injured drivers in This section examines changes in these four indicators over time Deaths in alcohol-related crashes: Due to the small number of crashes on public roadways involving principal vehicle types (e.g., one death in 2012) any trends would be unreliable, and therefore are not reported Alcohol use among fatally injured drivers: Due to the small number of cases e.g., no fatally injured drivers in 2012 any trends would be unreliable, and therefore are not reported Drivers in serious injury crashes: Table 16-2 and Figure 16-1 show information on drivers involved in alcohol-related serious injury crashes. During the baseline period ( ), an average of 30.0% of drivers in serious injury crashes were in an alcohol-involved crash. In 2010, 40.0% of drivers in serious injury collisions were in an alcohol-related crash. Table 16-2 Number and Percent of All Drivers in Serious Injury Crashes* that Involved Alcohol: Nunavut, Year Number of Drivers Number in Alcohol- Involved Crashes Percent (62.5) (40.0) (16.7) (44.4) (40.0) (36.4) (41.2) (21.4) (33.3) (33.3) (21.4) (22.2) (40.0) (0.0) (14.3) (40.0) baseline 10 3 (30.0) * single-vehicle nighttime crashes (SVN) as well as non-svn crashes that have police-reported alcohol involvement 217

228 Table 16-3 and Figure 16-2 also show information on drivers involved in alcohol-related serious injury crashes. These results differ slightly from those in Section 16.3 and in Table 16-2 and Figure 16-1 because they exclude certain vehicle types e.g., bicycles, snowmobiles, farm tractors and other non-highway vehicles. As can be seen the incidence of alcohol-involvement in serious injury crashes has fluctuated over this 16- year period. Between 1995 and 1997 the percentage of all drivers in serious injury crashes that involved alcohol decreased from 50.0% to 0.0%. Since then, the incidence peaked at 75.0% in 1998, generally decreased to 0.0% in 2005, rose to 33.3% in 2006 and 2007, and dropped again to 0.0% from 2008 to As shown in Table 16-3, in the baseline period ( ), an average of 25.0% of drivers in serious injury crashes were in an alcohol-involved crash. In 2010, the incidence of drivers in alcohol-involved crashes was 0.0%. 218
 1998 4 3 (75.0) 1999 2 1 (50.0) 2000 5 2 (40.0) 2001 7 3 (42.9) 2002 5 1 (20.0) 2003 4 1 (25.0) 2004 4 1 (25.0) 2005 6 0 (0.0) 2006 9 3 (33.3) 2007 3 1 (33.3) 2008 2 0 (0.0) 2009 4 0 (0.")
229 Table 16-3 Number and Percent of Drivers* of Highway Vehicles in Serious Injury Crashes** that Involved Alcohol: Nunavut, Year Number of Drivers (50.0) (50.0) (0.0) (75.0) (50.0) (40.0) (42.9) (20.0) (25.0) (25.0) (0.0) (33.3) (33.3) (0.0) (0.0) (0.0) baseline Number in Alcohol- Involved Crashes Percent 4 1 (25.0) * excludes operators of bicycles, snowmobiles, farm tractors, and other nonhighway vehicles. ** single-vehicle nighttime crashes (SVN) as well as non-svn crashes that have police-reported alcohol involvement Drug use among fatally injured drivers: Due to the small number of cases e.g., no fatally injured drivers in 2012 any trends would be unreliable, and therefore are not reported. 219
Alcohol and Drug-Crash Problem in Canada 2011 Report
 CCMTA Road Safety Research Report Series Alcohol and Drug-Crash Problem in Canada 2011 Report Prepared for the Canadian Council of Motor Transport Administrators by the Traffic Injury Research Foundation
CCMTA Road Safety Report Series
 CCMTA Road Safety Report Series ALCOHOL-CRASH PROBLEM IN CANADA: 2010 Prepared For Canadian Council of Motor Transport Administrators Standing Committee on Road Safety Research and Policies and Transport
CCMTA Road Safety Report Series
 CCMTA Road Safety Report Series ALCOHOL-CRASH PROBLEM IN CANADA: 2009 Prepared For Canadian Council of Motor Transport Administrators Standing Committee on Road Safety Research and Policies and Transport
CCMTA Road Safety Report Series
 CCMTA Road Safety Report Series ALCOHOL-CRASH PROBLEM IN CANADA: 2008 Prepared For Canadian Council of Motor Transport Administrators Standing Committee on Road Safety Research and Policies and Transport
MARIJUANA USE AMONG DRIVERS IN CANADA,
 T R A F F I C I N J U R Y R E S E A R C H F O U N D A T I O N MARIJUANA USE AMONG DRIVERS IN CANADA, 2000-2014 Traffic Injury Research Foundation, December 2017 Introduction Public concern about drug-impaired
ALCOHOL AND/OR DRUGS AMONG CRASH VICTIMS DYING WITHIN 12 MONTHS OF A CRASH ON A PUBLIC ROAD, BY JURISDICTION: CANADA, 2014
 ALCOHOL AND/OR DRUGS AMONG CRASH VICTIMS DYING WITHIN 12 MONTHS OF A CRASH ON A PUBLIC ROAD, BY JURISDICTION: CANADA, 2014 April 15, 2018 R. Solomon, Distinguished University Professor, C. Ellis, J.D.
THE PRESENCE OF ALCOHOL AND/OR DRUGS IN MOTOR VEHICLE FATALITIES, BY JURISDICTION: CANADA, 2013 November 15, 2017
 THE PRESENCE OF ALCOHOL AND/OR DRUGS IN MOTOR VEHICLE FATALITIES, BY JURISDICTION: CANADA, 2013 November 15, 2017 R. Solomon, Distinguished University Professor, C. Ellis, J.D. 2018 & C. Zheng, J.D. 2019
COLLISIONS AMONG FATALLY INJURED DRIVERS OF DIFFERENT AGE GROUPS,
 T R A F F I C I N J U R Y R E S E A R C H F O U N D A T I O N COLLISIONS AMONG FATALLY INJURED DRIVERS OF DIFFERENT AGE GROUPS, 2000-2014 Traffic Injury Research Foundation, August 2018 Introduction Research
Estimated Number and Percentage of Alcohol and Impairment- Related Crash Fatalities and Injuries, by Jurisdiction, Age and Population: Canada, 2009
 Estimated Number and Percentage of Alcohol and Impairment- Related Crash and Injuries, by Jurisdiction, Age and Population: Canada, 2009 R. Solomon, Professor M. Cassidy, J.D. 2014 The Faculty of Law Western
INTRODUCTION. The drugs-and-driving problem
 INTRODUCTION The drugs-and-driving problem Following nearly three decades of progress on the alcohol-crash problem, safety advocates, policy-makers, legislators and enforcement agencies have begun to express
CANNABIS AND OTHER DRUGS AMONG DRIVERS OF HIGHWAY VEHICLES DYING WITHIN 30 DAYS OF A CRASH ON A PUBLIC ROAD: CANADA, 2014
 CANNABIS AND OTHER DRUGS AMONG DRIVERS OF HIGHWAY VEHICLES DYING WITHIN 30 DAYS OF A CRASH ON A PUBLIC ROAD: CANADA, 2014 April 15, 2018 R. Solomon, Distinguished University Professor C. Ellis, J.D. 2018
Cannabis and Other Drugs Among Fatally- Injured Drivers In Canada, 2012
 Cannabis and Other Drugs Among Fatally- Injured Drivers In Canada, 2012 R. Solomon, Professor M. Clarizio, J.D. 2017 The Faculty of Law Western University April 18, 2016 1 The 2012 Data This document provides
Physiotherapists in Canada, 2011 National and Jurisdictional Highlights
 pic pic pic Physiotherapists in Canada, 2011 National and Jurisdictional Highlights Spending and Health Workforce Our Vision Better data. Better decisions. Healthier Canadians. Our Mandate To lead the
Impaired Driving in Canada
 www.ccsa.ca www.ccdus.ca May 2018 Topic Summary Impaired Driving in Canada Background Driving while impaired by alcohol or drugs remains the most prominent factor contributing to serious road crashes in
4/27/2016. About CCSA. Impaired Driving Research at CCSA. Background. Presentation Overview. Lessons Learned
 About CCSA Drug-Impaired Driving i in Canada: Lessons Learned International Conference on Urban Traffic Safety Amy Porath-Waller, Ph.D. April 26, 2016 CCSA is Canada s only agency with a legislated national
Impaired driving statistics
 driving statistics Telling Canada s story in numbers Yvan Clermont Canadian Centre for Justice Statistics Standing Senate Committee on Legal and Constitutional Affairs February 8 th, 2018 Key points While
AN OVERVIEW OF FEDERAL DRUG-IMPAIRED DRIVING ENFORCEMENT AND PROVINCIAL LICENCE SUSPENSIONS IN CANADA
 0 AN OVERVIEW OF FEDERAL DRUG-IMPAIRED DRIVING ENFORCEMENT AND PROVINCIAL LICENCE SUSPENSIONS IN CANADA R. Solomon & E. Chamberlain Professors, Faculty of Law Western University September 12 1 INTRODUCTION
ROAD SAFETY MONITOR 2018 DRINKING AND DRIVING IN CANADA Traffic Injury Research Foundation, December 2018
 T R A F F I C I N J U R Y R E S E A R C H F O U N D A T I O N ROAD SAFETY MONITOR 2018 DRINKING AND DRIVING IN CANADA Traffic Injury Research Foundation, December 2018 By: Steve W. Brown, Marisela Mainegra
CANNABIS AND OTHER DRUGS AMONG FATALLY-INJURED DRIVERS OF HIGHWAY VEHICLES: CANADA, 2013 November 15, 2017
 CANNABIS AND OTHER DRUGS AMONG FATALLY-INJURED DRIVERS OF HIGHWAY VEHICLES: CANADA, 2013 November 15, 2017 R. Solomon, Distinguished University Professor C. Ellis, J.D. 2018 & C. Zheng, J.D. 2019 Faculty
The Road Safety Monitor Drugs and Driving A DRIVING FORCE FOR SAFETY
 The Road Safety Monitor 2002 Drugs and Driving T R I N R E F O A F F I C J U R Y S E A R C H U N D A T I O N A DRIVING FORCE FOR SAFETY The Traffic Injury The mission of the Traffic Injury (TIRF) is to
IMPAIRED DRIVING CAUSING DEATH: CHARGES, CASES AND CONVICTIONS: CANADA, /16 November 15, 2017
 IMPAIRED DRIVING CAUSING DEATH: CHARGES, CASES AND CONVICTIONS: CANADA, 1994-2015/16 November 15, 2017 R. Solomon, Distinguished University Professor, C. Ellis, J.D. 2018 & C. Zheng, J.D. 2019 Faculty
INVOLVEMENT OF DRUGS IN ACCIDENT CAUSATION
 INVOLVEMENT OF DRUGS IN ACCIDENT CAUSATION Jim GEROSTAMOULOS, Helen BATZIRIS, Olaf H. DRUMMER Victorian Institute of Forensic Medicine and Department of Forensic Medicine, Monash University, Southbank,
ROAD SAFETY MONITOR 2017 DRINKING AND DRIVING IN CANADA
 T R A F F I C I N J U R Y R E S E A R C H F O U N D A T I O N ROAD SAFETY MONITOR 2017 DRINKING AND DRIVING IN CANADA Traffic Injury Research Foundation, December 2017 By: Steve W. Brown, Marisela Mainegra
PROFILE AND PROJECTION OF DRUG OFFENCES IN CANADA. By Kwing Hung, Ph.D. Nathalie L. Quann, M.A.
 PROFILE AND PROJECTION OF DRUG OFFENCES IN CANADA By Kwing Hung, Ph.D. Nathalie L. Quann, M.A. Research and Statistics Division Department of Justice Canada February 2000 Highlights From 1977 to 1998,
Report from the National Diabetes Surveillance System:
 Report from the National Diabetes Surveillance System: Diabetes in Canada, 28 To promote and protect the health of Canadians through leadership, partnership, innovation and action in public health. Public
The Severity of Pedestrian Injuries in Alcohol-Related Collisions
 The Severity of Pedestrian Injuries in -Related Collisions AUTHORS: Stanley Sciortino, PhD Elyse Chiapello San Francisco Department of Public Health Community Health Education Section The California Statewide
II: ALCOHOL - RELATED CRASHES
 II: ALCOHOL - RELATED CRASHES BACKGROUND AND DEFINITIONS 1. Impaired driving incidents. As used here, an impaired driving incident is one where there was an arrest for driving while under the influence
West Nile virus and Other Mosquito borne Diseases National Surveillance Report English Edition
 and Other Mosquito borne Diseases National Surveillance Report English Edition July to July 8, 17 (Week 7) West Nile Virus Canada Humans As of surveillance week 7, ending on July 8, 17, the Public Health
An Overview of Administrative Driver License Suspensions and Criminal Code Charges for Alcohol and Drug Impaired Driving in Canada:
 An Overview of Administrative Driver License Suspensions and Criminal Code Charges for Alcohol and Drug Impaired Driving in Canada: 2008-2014 September 2016 1 Introduction Alcohol and drug impaired driving
TRANSFUSION TRANSMITTED INJURIES SURVEILLANCE SYSTEM (TTISS): SUMMARY RESULTS. 1 P age
: SUMMARY RESULTS. 1 P age") TRANSFUSION TRANSMITTED INJURIES SURVEILLANCE SYSTEM (TTISS): 2009-2013 SUMMARY RESULTS 1 P age Acknowledgments: The development of the Transfusion Transmitted Surveillance System (TTISS) would not have
TRANSFUSION TRANSMITTED INJURIES SURVEILLANCE SYSTEM (TTISS): 2009-2013 SUMMARY RESULTS 1 P age Acknowledgments: The development of the Transfusion Transmitted Surveillance System (TTISS) would not have
5 ROADSIDE MEMORIAL SIGNAGE PROGRAM MADD CANADA
 5 ROADSIDE MEMORIAL SIGNAGE PROGRAM MADD CANADA The Transportation and Works Committee recommends the following: 1. The recommendations contained in the following report, February 25, 2008, from the Commissioner
Drug-Impaired Driving in Europe
 Drug-Impaired Driving in Europe What is the Drug-Impaired Driving Learning Centre (DIDLC)? The Drug Impaired Driving Learning Centre (DIDLC) is a fully bilingual, web-based educational resource that was
Estimating the volume of Contraband Sales of Tobacco in Canada
 The Canadian Tobacco Market Place Estimating the volume of Contraband Sales of Tobacco in Canada Updated April 2010 Physicians for a Smoke-Free Canada 1226 A Wellington Street Ottawa, Ontario, K1Y 3A1
ATLANTIC CANADA. CHILD & YOUTH UNINTENTIONAL INJURY HOSPITALIZATIONS: 10 Years in Review [ ] Here for you.
![ATLANTIC CANADA. CHILD & YOUTH UNINTENTIONAL INJURY HOSPITALIZATIONS: 10 Years in Review [ ] Here for you.](/thumbs/89/97512367.jpg "ATLANTIC CANADA. CHILD & YOUTH UNINTENTIONAL INJURY HOSPITALIZATIONS: 10 Years in Review [ ] Here for you.") ATLANTIC CANADA CHILD & YOUTH UNINTENTIONAL INJURY HOSPITALIZATIONS: 1 s in Review [24-213] CHILDSAFETYLINK Here for you. Special thanks to for their nancial contribution to support this project. Published
ATLANTIC CANADA CHILD & YOUTH UNINTENTIONAL INJURY HOSPITALIZATIONS: 1 s in Review [24-213] CHILDSAFETYLINK Here for you. Special thanks to for their nancial contribution to support this project. Published
Drug-Impaired Driving in the United States
 Drug-Impaired Driving in the United States What is the Drug-Impaired Driving Learning Centre (DIDLC)? The Drug Impaired Driving Learning Centre (DIDLC) is a fully bilingual, web-based educational resource
Prince Edward Island: Preparation for Cannabis Legalization
 Prince Edward Island: Preparation for Cannabis Legalization Prince Edward Island: Preparation for Cannabis Legalization The Government of Prince Edward Island has an obligation and an opportunity to actively
ALCOHOL, CANNABIS AND IMPAIRED DRIVING
 ALCOHOL, CANNABIS AND IMPAIRED DRIVING July 11, 2018 R. Solomon, Distinguished University Professor, Faculty of Law, Western University; K. Mahdi, J.D. 2020, Faculty of Law, Western University; & A. Sohrevardi,
How Safe Are Our Roads? 2016 Checkpoint Strikeforce campaign poster celebrating real area cab drivers as being Beautiful designated sober drivers.
 How Safe Are Our Roads? 2016 Checkpoint Strikeforce campaign poster celebrating real area cab drivers as being Beautiful designated sober drivers. Annual Data Report on the Impact of Drunk Driving on Road
Subject: The Case for a Provincial 0.00% BAC Limit for All Drivers Under the Age of 21
 Authors: E. Chamberlain & R. Solomon Subject: The Case for a Provincial 0.00% BAC Limit for All Drivers Under the Age of 21 Date: January 9, 2001 Over the last two decades, a significant amount of research
Prevalence of cannabis-impaired driving and crash risk
 Prevalence of cannabis-impaired driving and crash risk Dr. Mark Asbridge Associate Professor, Department of Community Health and Epidemiology and Emergency Medicine, Dalhousie University & MADD Canada
HOW SAFE ARE OUR ROADS?
 HOW SAFE ARE OUR ROADS? 2017 annual data report on the impact of drunk driving on road safety in the Washington D.C. metropolitan region December 2018 HOW SAFE ARE OUR ROADS? ANNUAL DATA REPORT ON THE
Report on Drugged Driving in Louisiana. Quantification of its Impact on Public Health and Implications for Legislation, Enforcement and Prosecution
 Report on Drugged Driving in Louisiana Quantification of its Impact on Public Health and Implications for Legislation, Enforcement and Prosecution Objectives Objective 1: Evaluate laws and policies about
Health Interventions in Ambulatory Cancer Care Centres DRAFT. Objectives. Methods
 ENVIRONMENTAL SCAN Health Interventions in Ambulatory Cancer Care Centres Context Cancer, a complex, chronic condition, will affect an estimated two in five Canadians in their lifetime. 1 Cancer requires
The Drug Evaluation and Classification Program
 The Drug Evaluation and Classification Program International Association of Chiefs of Police Drug Evaluation and Classification (DEC) Program The Drug Evaluation and Classification (DEC) Program is a transportation
Drug Evaluation and Classification Program
 Policy Brief www.ccsa.ca www.ccdus.ca May 2018 Policy Brief Drug Evaluation and Classification Program Key Considerations The Drug Evaluation and Classification (DEC) program is a 12-step systematic, standardized
OxyContin in the 90 days prior to it being discontinued.
 Appendix 1 (as supplied by the authors): Supplementary data Provincial Drug Insurance program formulary listing status for OxyNeo by province Province Listing of OxyNeo BC Listed for patients covered by
Appendix B Fracture incidence and costs by province
 1 Appendix B Fracture incidence and costs by province Comprehensive, accurate fracture numbers and costs are very important data that could help with prioritization and allocation of health care resources.
HIGHway to Hell: The Science Behind Drugged Driving
 HIGHway to Hell: The Science Behind Drugged Driving Facilitator: Brian Ursino, Director, Law Enforcement, AAMVA Presenters: John Lacey, Center Director, Pacific Institute for Research and Evaluation Mike
Health Canada. Santé Canada. Tuberculosis in Canada pre-release
 Health Canada Santé Canada Tuberculosis in Canada 2002 pre-release Our mission is to help the people of Canada maintain and improve their health. Health Canada HOW TO REACH US For more information, copies
Mental Health Statistics, to
 , 1982-83 to 1993-94 Jean Randhawa and Rod Riley* Since the early 1980s, in relation to the size of the population, general and psychiatric hospitals have seen a drop in separations for mental disorders.
CHAPTER 4: Population-level interventions
 CHAPTER 4: Population-level interventions Population-level interventions refer to policies and programs that are applied to entire populations to promote better health outcomes. In this chapter, we describe
Provincial Projections of Arthritis or Rheumatism, Special Report to the Canadian Rheumatology Association
 ARTHRITIS COMMUNITY RESEARCH & EVALUATION UNIT (ACREU) The Arthritis and Immune Disorder Research Centre Health Care Research Division University Health Network February, 2000 Provincial Projections of
West Nile Virus and Other Mosquito-borne Diseases National Surveillance Report English Edition September 11 to September 17, 2016 (Week 37)
") West Nile Virus and Other Mosquito-borne Diseases National Surveillance Report English Edition September 11 to September 17, 16 (Week 37) Canada Humans During surveillance week 37, ending on September
West Nile Virus and Other Mosquito-borne Diseases National Surveillance Report English Edition September 11 to September 17, 16 (Week 37) Canada Humans During surveillance week 37, ending on September
Standardized Field Sobriety Testing Refresher
 Standardized Field Sobriety Testing Refresher Location Date Instructor needs to put in Location and Date. SESSION I: INTRODUCTION AND OVERVIEW Upon successfully completing this session, the participant
November 5 to 11, 2017 (Week 45)
") Hanks you Overall Summary November 5 to 11, 2017 (Week 45) Influenza activity crossed the seasonal threshold in week 45, indicating the beginning of the influenza season at the national level. The number
Hanks you Overall Summary November 5 to 11, 2017 (Week 45) Influenza activity crossed the seasonal threshold in week 45, indicating the beginning of the influenza season at the national level. The number
West Nile Virus and Other Mosquito-borne Diseases National Surveillance Report English Edition September 18 to September 24, 2016 (Week 38)
") West Nile Virus and Other Mosquito-borne Diseases National Surveillance Report English Edition September 18 to September 4, 16 (Week 38) Canada Humans During surveillance week 38, ending on September 4,
West Nile Virus and Other Mosquito-borne Diseases National Surveillance Report English Edition September 18 to September 4, 16 (Week 38) Canada Humans During surveillance week 38, ending on September 4,
Poison Control Centres
 Poison Control Centres Monica Durigon Field Epidemiologist Public Health Agency of Canada Joanne Stares Public Health Officer Public Health Agency of Canada Placement site: BC Centre for Disease Control
Mississippi. Data Sources:
 Data Sources: Multiple Cause of Death (MCOD) Files, 2009-2013, National Center for Health Statistics. The MCOD file is a census of all deaths in the U.S. and some territories. Five years data were combined
The British Columbia Coroners Service is committed to conducting a thorough, independent examination of the factors contributing to death in order to
 The British Columbia Coroners Service is committed to conducting a thorough, independent examination of the factors contributing to death in order to improve community safety and quality of life in the
Review of Pre-crash Behaviour in Fatal Road Collisions Report 1: Alcohol
 Review of Pre-crash Behaviour in Fatal Road Collisions Research Department Road Safety Authority September 2011 Contents Executive Summary... 3 Introduction... 4 Road Traffic Fatality Collision Data in
Antimicrobial Resistant Organisms (ARO) Surveillance SURVEILLANCE REPORT FOR DATA FROM JANUARY TO DECEMBER
 Surveillance SURVEILLANCE REPORT FOR DATA FROM JANUARY TO DECEMBER") Antimicrobial Resistant Organisms (ARO) Surveillance SURVEILLANCE REPORT FOR DATA FROM JANUARY 1 2007 TO DECEMBER 31 2011 TO PROMOTE AND PROTECT THE HEALTH OF CANADIANS THROUGH LEADERSHIP, PARTNERSHIP,
Antimicrobial Resistant Organisms (ARO) Surveillance SURVEILLANCE REPORT FOR DATA FROM JANUARY 1 2007 TO DECEMBER 31 2011 TO PROMOTE AND PROTECT THE HEALTH OF CANADIANS THROUGH LEADERSHIP, PARTNERSHIP,
Alcohol and drugs among motorcycle riders compared with car and van drivers killed in road crashes in Norway during
 Alcohol and drugs among motorcycle riders compared with car and van drivers killed in road crashes in Norway during 2001-2010 Asbjørg S. Christophersen and Hallvard Gjerde Norwegian Institute of Public
WEST NILE VIRUS AND OTHER MOSQUITO-BORNE DISEASE NATIONAL SURVEILLANCE REPORT
 WEST NILE VIRUS AND OTHER MOSQUITO-BORNE DISEASE NATIONAL SURVEILLANCE REPORT NOV 1 TO NOV 7, 215 REPORT WEEK 44 CANADA HUMANS During surveillance week 44, ending on Nov 7, 215, one (1) human clinical
FATIGUE MANAGEMENT Shell Canada Road Transport Forum September 26, 2013
 FATIGUE MANAGEMENT Shell Canada Road Transport Forum September 26, 2013 Bruce Adams, Regional Traffic Safety Consultant Alberta Office of Traffic Safety Copyright 2013 Definition The state of feeling very
December 3 to 9, 2017 (Week 49)
") Hanks you December 3 to 9, 2017 (Week 49) Overall Summary Overall, Influenza activity continues to increase across Canada; however many indicators such as hospitalizations, outbreaks and geographic spread
Hanks you December 3 to 9, 2017 (Week 49) Overall Summary Overall, Influenza activity continues to increase across Canada; however many indicators such as hospitalizations, outbreaks and geographic spread
WEST NILE VIRUS AND OTHER MOSQUITO-BORNE DISEASE NATIONAL SURVEILLANCE REPORT
 WEST NILE VIRUS AND OTHER MOSQUITO-BORNE DISEASE NATIONAL SURVEILLANCE REPORT AUG 3 TO SEPT 5, 215 REPORT WEEK 35 CANADA HUMANS During surveillance week 35, ending on Sept 5, 215, three (3 ) human clinical
RECREATIONAL VEHICLES (WORKING GROUP SESSION)
") RECREATIONAL VEHICLES (WORKING GROUP SESSION) - 825 - - 826 - Fatal Recreational Vehicle Crashes and Alcohol in New Zealand: What does the data tell us? D.J.Begg Injury Prevention Research Unit, Dunedin
RECREATIONAL VEHICLES (WORKING GROUP SESSION) - 825 - - 826 - Fatal Recreational Vehicle Crashes and Alcohol in New Zealand: What does the data tell us? D.J.Begg Injury Prevention Research Unit, Dunedin
ICD-10 Reciprocal Billing File Technical Specifications Reference Guide for Ontario Hospitals
 ICD-10 Reciprocal Billing File Technical Specifications Reference Guide for Ontario Hospitals Ministry of Health and Long-Term Care Version 3 January 2014 ICD Reciprocal Billing File Technical Specifications
Aussi disponible en français sous le titre : Le Diabète au Canada : Rapport du Système national de surveillance du diabète, 2009
 Report from the National Diabetes Surveillance System: Diabetes in Canada, 29 To promote and protect the health of Canadians through leadership, partnership, innovation and action in public health. Public
Canada s Inter agency Wild Bird Influenza Survey. Draft Proposal for the Survey Version 1 25 January 2010
 Canada s Inter agency Wild Bird Influenza Survey Draft Proposal for the 2010 11 Survey Version 1 25 January 2010 Introduction Canada s wild bird influenza survey has been carried out each year since 2005.
Alcohol and Drug Use among Fatally Injured Pedestrians Involved in Motor Vehicle Accidents
 Alcohol and Drug Use among Fatally Injured Pedestrians Involved in Motor Vehicle Accidents Norlen Mohamed, Wahida Ameer Batcha, Mohamad Suffian Ahmad, Aimi Mohd Fahmi, Ilhamah Othman Vehicle Safety and
VEHICULAR FATALITIES IN CUYAHOGA COUNTY, OHIO, U.S.A. Twenty Years Experience ( )
") VEHICULAR FATALITIES IN CUYAHOGA COUNTY, OHIO, U.S.A. Twenty Years Experience (1941-1960) by S. R. GERBER* Orientation THE c o u n t y of Cuyahoga in the State of Ohio encompasses an area of slightly more
VEHICULAR FATALITIES IN CUYAHOGA COUNTY, OHIO, U.S.A. Twenty Years Experience (1941-1960) by S. R. GERBER* Orientation THE c o u n t y of Cuyahoga in the State of Ohio encompasses an area of slightly more
Organ Donation and Transplantation in Canada
 Organ Donation and Transplantation in Canada 216 System Progress Report Update Canadian Blood Services, 217. All rights reserved. Extracts from this report may be reviewed, reproduced or translated for
Medical Aid in Dying A Year of Change
 Medical Aid in Dying A Year of Change Howard Lim, MD, PhD, FRCPC Chair, Gastrointestinal Tumour Group Program Director, Medical Oncology Residency Training Program Clinical Associate Professor, University
VACCINE COVERAGE IN CANADIAN CHILDREN
 VACCINE COVERAGE IN CANADIAN CHILDREN RESULTS FROM THE 2013 CHILDHOOD NATIONAL IMMUNIZATION COVERAGE SURVEY (CNICS) REVISED EDITION FEBRUARY 2017 PROTECTING AND EMPOWERING CANADIANS TO IMPROVE THEIR HEALTH
Provincial and Territorial Smoke-Free Legislation Alberta
 Provincial and Territorial Smoke-Free Legislation Alberta Name of legislation Smoke-Free Places (Tobacco Reduction) Amendment Act, 2007 Tobacco and Smoking Reduction Act, 2013 (amends the Tobacco Reduction
THE ROAD SAFETY MONITOR 2011 FATIGUED DRIVING TRENDS
 T R A F F I C I N J U R Y R E S E A R C H F O U N D A T I O N THE ROAD SAFETY MONITOR 2011 FATIGUED DRIVING TRENDS The knowledge source for safe driving The Traffic Injury Research Foundation The mission
Drug Surveillance Systems in Canada
 Drug Surveillance Systems in Canada Judy Snider Office of Drugs and Alcohol Research and Surveillance Controlled Substances and Tobacco Directorate Drug Observatories Meeting - CICAD Roseau, Dominica August
Addiction Treatment in Canada: The National Treatment Indicators Report
 www.ccsa.ca www.ccdus.ca Addiction Treatment in Canada: The National Treatment Indicators Report 2014 2015 Data December 2017 Addiction Treatment in Canada: The National Treatment Indicators Report 2014
Neurology. Neurology Profile
 Updated March 2018 Click on any of the contents below to navigate to the slide. Please click the home icon located at the top right of each slide to return to the table of contents slide. Neurology Slide
Impaired Driving: Progress and Challenges
 Impaired Driving: Progress and Challenges Brian Jonah Senior Research Scientist Traffic Injury Research Foundation National Conference of State Legislatures Atlanta, GA May 14, 2009 Overview Global road
Drug and Alcohol Impairment. Alabama DRE / SFST Program
 Drug and Alcohol Impairment Alabama DRE / SFST Program WHAT IS A DRUG? Working Definition of Drug : Any substance that, when taken into the human body, can impair the ability of the person to operate a
WEST NILE VIRUS AND OTHER MOSQUITO-BORNE DISEASE NATIONAL SURVEILLANCE REPORT
 WEST NILE VIRUS AND OTHER MOSQUITO-BORNE DISEASE NATIONAL SURVEILLANCE REPORT OCT 4 TO OCT 1, 215 REPORT WEEK 4 CANADA HUMANS During surveillance week 4, ending on Oct.1, 215, six (6) human clinical cases
RESPONSE TO THE DEPARTMENT FOR TRANSPORT S CONSULTATION PAPER
 RESPONSE TO THE DEPARTMENT FOR TRANSPORT S CONSULTATION PAPER REGULATIONS TO SPECIFY THE DRUGS AND CORRESPONDING LIMITS FOR THE NEW OFFENCE OF DRIVING WITH A SPECIFIED CONTROLLED DRUG IN THE BODY ABOVE
Health Interventions in Ambulatory Cancer Care Centres
 ENVIRONMENTAL SCAN Health Interventions in Ambulatory Cancer Care Centres Context Cancer a complex, chronic condition will affect an estimated two in five Canadians in their lifetime. 1 Cancer requires
Injuries in Canada: Insights from the Canadian Community Health Survey
 Component of Statistics Canada Catalogue no. 82-624-X Injuries in Canada: Insights from the Canadian Community Health Survey by Jean-Michel Billette and Teresa Janz June 2011 How to obtain more information
Reactions of teenagers and parents to a zero alcohol tolerance law
 Reactions of teenagers and parents to a zero alcohol tolerance law Dan R. M a y h ew ', H erb. M. S im p s o n 1, Susan A. F ergu so n 2 and Allan F. W illiam s2 1TIRF, 171 Nepean St., Ste. 200, Ottawa,
Health Canada Endorsed Important Safety Information on Infanrix Hexa
 Health Canada Endorsed Important Safety Information on Infanrix Hexa October 30, 2012 Dear Health Care Professional: Subject: Voluntary recall of GlaxoSmithKline (GSK) Infanrix Hexa Vaccine Lot A21CB242A
ANNUAL REPORT OF THE CORONER
 ANNUAL REPORT OF THE CORONER 2007 STEVE MOORE SHERIFF-CORONER PUBLIC ADMINISTRATOR 7000 MICHAEL N.CANLIS BLVD. FRENCH CAMP, CA. 95231 (209) 468-4300 www.sjsheriff.org TABLE OF CONTENTS INTRODUCTION 1
Delaware. Data Sources:
 Data Sources: Multiple Cause of Death (MCOD) Files, 2009-2013, National Center for Health Statistics. The MCOD file is a census of all deaths in the U.S. and some territories. Five years data were combined
Sampling Methodology
 Background CCMTA s Drugs and Driving Framework identified need to raise public s awareness regarding risks associated with drug-impaired driving Purpose of Survey: To determine drivers knowledge, perceptions,
Review of Drug Impaired Driving Legislation (Victoria Dec 2000) and New Random Drug Driving Legislation Based on Oral Fluid Testing
 and New Random Drug Driving Legislation Based on Oral Fluid Testing") Review of Drug Impaired Driving Legislation (Victoria Dec 2000) and New Random Drug Driving Legislation Based on Oral Fluid Testing P D Swann MC Boorman JJ Potter VicRoads Road Safety Department 60 Denmark
Review of Drug Impaired Driving Legislation (Victoria Dec 2000) and New Random Drug Driving Legislation Based on Oral Fluid Testing P D Swann MC Boorman JJ Potter VicRoads Road Safety Department 60 Denmark
Drugs and Driving: Detection and Deterrence
 Drugs and Driving: Detection and Deterrence Advisory Group on Drugs in Traffic Report prepared by : Douglas J. Beirness, Ph.D., Barry K. Logan, Ph.D., Philip Swann, Ph.D. Key Messages Drugs are as serious
Provincial and Territorial Smoke-Free Legislation Alberta
 Provincial and Territorial Smoke-Free Legislation Alberta Name of legislation Bill 33, Tobacco Reduction Amendment Act, 2013 (amends the Tobacco Reduction Act, 2005 and changes the title to the Tobacco
WORKPLACE SMOKING BAN POLICY
 WORKPLACE SMOKING BAN POLICY Introduction: How to Use This Tool Having a smoking policy addresses the hazards of secondhand smoke to the health and well-being of your workforce. In most regions, it is
LIQUOR POLICY REFORM IN BRITISH COLUMBIA
 LIQUOR POLICY REFORM IN BRITISH COLUMBIA A Presentation to MLA John Yap Parliamentary Secretary to British Columbia Minister of Justice and Attorney General for Liquor Policy Reform Andrew Murie Chief
TABLE OF CONTENTS INTRODUCTION 1 -SUMMARY OF CONTENTS 2 -DEATHS REPORTABLE TO THE CORONER 3 INVESTIGATIONS, CORONER CASES AND AUTOPSIES 6
 TABLE OF CONTENTS INTRODUCTION 1 -SUMMARY OF CONTENTS 2 -DEATHS REPORTABLE TO THE CORONER 3 INVESTIGATIONS, CORONER CASES AND AUTOPSIES 6 -SUMMARY OF REPORTABLE DEATHS 7 -SUMMARY OF INVESTIGATIONS 5-YEARS
West Nile virus and Other Mosquito-borne Diseases National Surveillance Report July 30 to August 5, 2017 (Week 31)
") West Nile Virus West Nile virus and Other Mosquito-borne Diseases National Surveillance Report July 3 to August 5, 217 (Week 31) Canada Humans During week 31, July 3 to August 5, 217, the Public Health
West Nile Virus West Nile virus and Other Mosquito-borne Diseases National Surveillance Report July 3 to August 5, 217 (Week 31) Canada Humans During week 31, July 3 to August 5, 217, the Public Health
The Impact of Substance Use Disorders on Hospital Use
 www.ccsa.ca www.cclt.ca Report in Short The Impact of Substance Use Disorders on Hospital Use What Is this Report About? This report: Describes trends in individuals hospitalized because of a primary diagnosis
Canadian Addiction Survey (CAS)
") Canadian Addiction Survey (CAS) A national survey of Canadians use of alcohol and other drugs Prevalence of Use and Related Harms November 2004 HIGHLIGHTS This document was published by the Canadian Centre
Canadian Addiction Survey (CAS) A national survey of Canadians use of alcohol and other drugs Prevalence of Use and Related Harms November 2004 HIGHLIGHTS This document was published by the Canadian Centre