Re: Consumer understanding of healthy, natural, and various ingredient names in food products
|
|
|
- Lawrence Stewart
- 5 years ago
- Views:
Transcription

1 January 24, 2019 Center for Food Safety and Applied Nutrition US Food and Drug Administration 5001 Campus Drive College Park, Maryland Re: Consumer understanding of healthy, natural, and various ingredient names in food products Dear Drs. Gottlieb and Mayne, The Corn Refiners Association (CRA) submits the enclosed report, which presents results of a consumer perception survey CRA commissioned by Jayson Lusk, Ph.D., Head of the Department of Agriculture Economics at Purdue University. CRA respectfully submits that since the US Food and Drug Administration s (FDA) statutory authority for regulation of food product labeling is the prohibition on false and misleading presentation of products, how terms are understood by consumers should guide agency rulemaking regarding such terms. We have requested that Dr. Lusk submit under separate cover the raw data from this consumer survey. CRA is the national trade association representing the corn refining industry of the United States. CRA and its predecessors have served this important segment of American agribusiness since Corn refiners produce sweeteners, ethanol, starch, bioproducts, corn oil, and feed products from corn components such as starch, oil, protein, and fiber. This nationwide, online survey was conducted December 11-17, 2018 and the final results examined in this report consists of responses from 1,290 participants. Two focus groups were conducted in St. Louis, Missouri to assist Dr. Lusk in preparation of his survey. Responses were weighted to be representative of the US population. This survey focused on respondent s food values, including beliefs on healthy and natural product claims, willingness-to-pay, and beliefs about ingredient names. CRA respectfully submits that the results of this survey demonstrate: Regarding healthy o Healthiness was one of the most important factors to consumers, when prompted, in deciding which foods to buy (40.2%, exceeded only by taste (67.3%) and price (55.4%)). (Page 16; Figure 7) o The term healthy had widely varying meanings to substantial segments of consumers. Over half of consumers believed that one s overall diet determines healthiness and the term is not appropriately applied to a single food. (Page 36; Figure 27) Almost half of consumers believed healthy describes characteristics other than nutrient content. (Page 36; Figure 26) When unaided, natural or health(y) were mentioned by fewer than 2% of respondents, among those who said they would like to see more information. (Page 14) Of particular public health importance, about 40% of consumers thought that a healthy label claim implied that they should increase consumption of the food and 15% thought the label meant they could eat all that they wanted. (Page 45; Figure 33)
2 o o FDA s current regulation of healthy, which authorizes use of the claim on a food that is low in fat and saturated fat and must provide minimum amounts of certain vitamins and minerals, is misleading to many consumers. Of the factors consumers regarded to affect whether or not a food is healthy, sugar content (23.7%), use of hormones or antibiotics (23.5%), pesticide residues (18.4%), and use of preservatives (15.9%) ranked high. (Page 36; Figure 25) Only about 2% of consumers jointly rated high fat and low carbohydrate as the healthiest nutrient combination. (Page 42; Figure 31) Absent highly effective consumer education regarding the regulatory definition of healthy, consumers are likely to be misled to perceive the claim to describe factors that are excluded from the regulatory definition of the term or advice to increase consumption of the food without consideration for a balanced diet. Regarding natural o o o Like healthy, the term natural had widely varying meaning to substantial segments of consumers with criteria in food processing practices, agriculture production practices and the facial perception of the food. Dr. Lusk observed that the data indicated consumers do not perceive naturalness as a single unifying construct, but rather a food or process can be seen to be high in one dimension of naturalness but low in another dimension of naturalness. (Page 23) High levels of agreement that natural foods are healthier (53%), safer to eat (47%), and better for the environment (45%) were observed, despite an absence of scientific support for such conclusions. (Page 30; Figure 19) Some consumers perceived various common foods, such as vegetable oil, flour and sugar, as natural, but regarded processes used to make those foods as not natural. (Page 27; Figure 16) Modern agricultural practices were almost universally viewed as not natural, with high levels of skepticism expressed toward all pesticide use and all genetic improvement (including hybridization). (Page 29; Figure 18) As with food processing, apparent lack of knowledge regarding agricultural practices yielded inconsistent responses regarding products and the practices that produce them. 79.9% of consumers considered organically grown crops to be natural, but they considered pesticides used in organic production and the methods (i.e., mutagenesis) used to create organic seeds to be not natural. (Page 29) Beyond wash/clean/chop/grind/slice raw commodities, there was little common understanding of the term natural in terms of food processing. Even that common understanding was at odds with consumer perceptions of the naturalness of agricultural practices used to produce raw commodities. (Page 25; Figure 14) Strong consumer desire for effective regulation of natural claims was observed, but substantial consumer skepticism toward industry use of the claim and FDA s ability to regulate the term. 65.7% of consumers felt FDA should regulate use of the term natural by requiring companies to follow a uniform, consistent definition, but 21.5% of consumers felt FDA should prevent use of the term on food packages. (Page 31; Figure 20) The failure to develop a regulatory scheme that effectively informs consumers of the regulatory definition of natural was demonstrated by data showing that more than half of respondents were misled by the U.S. Department of Agriculture (USDA) definition of natural for claims on meat and poultry products. (Page 33; Figure 22)
3 26.6% of consumers correctly regarded the natural claim to mean the product has been minimally processed. 31.3% of consumers incorrectly believed the term means no hormones. 23.8% of consumers incorrectly believed the term means no antibiotics. Regarding ingredient names o Consumers regarded the ingredient declaration as the most informative source of information on food packages (69%), above the nutrition facts panel (61.1%), package weight (33.3%), and brand name (29.5%). (Page 15; Figure 6) o More than 85% of consumers regarded the lay name of an ingredient to be more informative than the scientific name of the ingredient that is currently required to be used in the ingredient declaration. (Page 49; Figure 37) Corn starch (89.1%) over maltodextrin (10.9%). Vitamin B6 (90.3%) over pyridoxine (9.2%). Soluble corn fiber (86.6%) over resistant maltodextrin (13.4%). Based on the foregoing, we respectfully recommend that FDA: o o o Undertake rulemaking to revise the requirements for healthy claims to include at least total sugars and require the claim be accompanied by a statement that indicates what the claim means. Initiate rulemaking jointly with the USDA s Food Safety Inspection Service (FSIS) to adopt a coordinated approach to regulation of natural claims. We recommend that the starting point in developing such a regulation should be a highly restrictive definition limited to wash/clean/chop/grind/slice of raw commodities. Further, to avoid likely consumer misunderstanding, the proposal should include a requirement for an accompanying statement that, Natural does not indicate the food is healthier, safer or better for the environment, nor does it relate to agricultural production practices. Initiate rulemaking to permit use of consumer-understood common names of food ingredients in the ingredient declaration. We appreciate the opportunity to provide this report and our recommendations based thereon. If there are any questions, please feel free to reach out to CRA. Sincerely, John W. Bode President and CEO Corn Refiners Association CC: Douglas Balentine, Director, Office of Nutrition, Labeling, and Dietary Supplements, Center for Food Safety and Applied Nutrition Vincent de Jesus, Nutritionist, Office of Nutrition and Food Labeling, Center for Food Safety and Applied Nutrition Roberta Wagner, Assistant Administrator, Office of Policy and Program Development, Food Safety and Inspection Service Denise Eblen, Assistant Administrator, Office of Public Health Science, Food Safety and Inspection Service
4 Consumer Perceptions of Healthy and Natural Food Labels Prepared for the Corn Refiners Association* by Jayson L. Lusk, Ph.D. January 15, 2019 *This report conveys the results of a survey funded by the Corn Refiners Association, but the choice of questions asked and the analysis conducted were solely at the discretion of the author, and the discussion and opinions reported herein only reflect the views of the author and not the Corn Refiners Association.
5 Table of Contents Executive Summary... 2 List of Figures Introduction Methods and Procedures Results Label and Food Preferences Open Ended Questions Guided Questions Food Values Natural Beliefs and Preferences Open Ended Questions Guided Questions Policy Questions Healthy Beliefs and Preferences Open Ended Questions Guided Questions Policy Questions Ingredient Name Preferences Labels, Purchase Intention, and Willingness-to-Pay Conclusions References Appendix Demographic Characteristics of Respondents Detailed Analysis of Open-Ended Questions
6 Executive Summary In mid-december 2018, a nationwide survey of over 1,200 U.S. food shoppers was conducted to determine beliefs and preferences related to natural and healthy claims and labels on food products. Some of the key findings are as follows. Label and Food Preferences Only 29.6% of consumers indicated that there is additional information they would like to see on food packages. Of those who wanted more information, the most commonly mentioned issues related to origin, presence of GMOs, and calorie/sugar content. When unaided, natural or health(y) were rarely mentioned. When choosing from pre-defined options, consumers indicated the ingredient list, nutrition facts panel, package weight/volume, and brand name to be most informative. Natural and healthy labels were the least picked of the options provided, chosen by only about 9% of respondents. Overall, consumers indicated the factors most important when buying food are taste and price, followed by healthiness, safety, and naturalness. Familiarity, convenience, and environmental impact were the lowest rated food purchase drivers. Younger consumers valued naturalness more highly than older consumers, and higher income consumers valued healthiness more highly than lower income consumers. Natural Overall, results suggested nuanced, and sometimes logically inconsistent, views about the meaning of natural. Several lines of evidence reveal that consumers do not perceive naturalness as a single unifying construct, but rather a food or process can be seen to be high in one dimension of naturalness and low in another dimension. o When asked an open-ended question about what it meant to respondents for a food to be natural, words like artificial, additive, chemical, and organic were most commonly mentioned. Many respondents suggested the word was meaningless or marketing hype. o Consumers expressed a strong belief that natural implies no preservatives, but when specifically asked about particular types of preservatives, more respondents than not thought various preservation processes like fermentation, canning, and smoking or preservation ingredients like salt, sugar, or vinegar were natural. Artificial- or chemicalsounding preservatives like benzoates, nitrites, and sulphites were considered by more consumers to be unnatural than natural. o Finished food products such as sugar, flour, and vegetable oil were often considered more natural than the processes, such as bleaching/decoloring and crystallization, which are used make them. These findings suggest that it is possible for a final product to be considered natural even if a process used to make the product is not. o Consumers are skeptical of the naturalness of most modern crop production practices. More consumers considered hybrid seeds as unnatural than natural. Crops produced with biotechnology were much more likely to be considered unnatural than natural. Consumers perceived organic production as natural, but not the pesticides used in organic agriculture or crop breeding practices allowable under organic. o Almost two-thirds of consumers indicated a desire for the FDA to regulate the use of the term natural by requiring companies to follow a uniform, consistent definition. Despite 2
7 this policy preference, only about a quarter of respondents correctly knew the USDA definition of natural on meat products, and more than half incorrectly believed the USDA definition of natural implies no hormones or no antibiotics. o Two-thirds or more of consumers thought natural food is better for the environment, safer, and healthier. Healthy Evidence broadly suggests consumers consider healthiness to be a personal concept that differs across people. There was a high level of agreement that individual needs determine whether a food is healthy for an individual. o When asked an open-ended question about what it meant to respondents for a food to be called healthy, words like good, fat, nutrition, natural, sugar, calorie, and organic were most commonly mentioned. o Consumers were about evenly split on whether a food can be deemed healthy based solely on the foods nutritional content (52.1% believing as such) or whether there were other factors that affect whether a food is healthy (47.9% believing as such). Consumers were also about evenly split on whether an individual food can be considered healthy (believed by 47.9%) or whether this healthiness is instead a characteristic of one s overall diet (believed by 52.1%). o Ratings of individual food products revealed that healthy perceptions are comprised of at least three underlying dimensions or factors related to animal origin, preservation, and freshness/processing. o Focusing on individual nutrients, perceived healthiness was generally decreasing in a food s fat, sodium, and carbohydrate content and increasing in protein content. Only about 2% of consumers jointly rated high fat and low carbohydrate as the healthiest nutrient combination. o About 40% of consumers thought a healthy label implied they should increase consumption of the type of food bearing the label, and indeed about 15% thought the label meant they could eat all they wanted. About 35% of consumers indicated that a healthy label doesn t mean anything to them. Ingredient Names In all cases considered, more than 85% of respondents preferred every-day, lay ingredient names to their scientific counterparts (e.g., corn starch vs. maltodextrin) insofar as the word being informative for consumer choice. Purchase Intention and Willingness-to-Pay Simulated purchases of cereal boxes indicated consumers are willing to pay about $0.62, $1.28, and $2.05 premiums for healthy, natural, and organic labels, respectively. Consumers perceived these labels as partial substitutes; when all three labels appeared in combination, the implied willingness-to-pay premium was 36% lower than the sum of the willingness-topay values when the three labels appeared in isolation. 3
8 List of Figures Figure 1. Image used to determine which processes consumers perceive as natural... 9 Figure 2. Images used in the purchase intention and willingness-to-pay questions Figure 3. Desire for additional information on food packages Figure 4. Word cloud constructed from open-ended responses to question, What additional information would you like to see on food packages? Figure 5. Most common words mentioned when asked what additional information is wanted on food packages (among the 29.6% who said they wanted more information) Figure 6. Relative informativeness of different food package labels Figure 7. Relative importance of nine food values when buying food Figure 8. Word cloud constructed from open-ended responses to question, What does it mean to you for a food to be called natural? Figure 9. Most common words mentioned when asked what it means for a food to be called natural Figure 10. Perceived definitions of naturalness Figure 11. Perceived naturalness of 12 food processes Figure 12. Dimensions of naturalness Figure 13. Heatmap showing areas of figure most commonly clicked as natural Figure 14. Percent of respondents indicating food or process as natural Figure 15. Heatmap showing areas of figure most commonly clicked as NOT natural Figure 16. Percent of respondents indicating food or process as NOT natural Figure 17. Net naturalness score. Perceived naturalness of foods and processes as determined by clicks on image of food production process Figure 18. Perceived naturalness of nine crop production practices Figure 19. Beliefs about natural food Figure 20. Preferences for regulation of natural labels Figure 21. Trust in FDA to regulate natural labels Figure 22. Beliefs about definition of USDA natural labels on meat Figure 23. Word cloud constructed from open-ended responses to question, What does it mean to you for a food to be called healthy? Figure 24. Most common words mentioned when asked what it means for a food to be called healthy Figure 25. Factors affecting consumers' perception of a foods' healthiness Figure 26. Is a food's healthiness defined by nutrient content? Figure 27. Is "healthy" best defined on a food-by-food or a whole diet basis? Figure 28. Perceived healthiness of 15 foods Figure 29. Three dimensions of 15 food's healthiness Figure 30. Perception of healthiness of sodium, carbohydrates, fat, and protein Figure 31. Joint perception of healthiness of carbohydrates, fat, and protein Figure 32. Relationship between diseases and health conditions and beliefs about healthiness.. 44 Figure 33. Behavioral implications of healthy food labels Figure 34. Beliefs about healthy food Figure 35. Preferences for regulation of healthy labels Figure 36. Trust in FDA to regulate healthy labels Figure 37. Preferences for scientific vs. lay names in ingredient lists Figure 38. Heat maps associated with most attractive area of 10 cereal boxes
9 Figure 39. Heat maps associated with least attractive area of 10 cereal boxes Figure 40. Variation in clicks and purchase intentions across 10 cereal boxes Figure 41. Effect of prices and labels on purchase intention Figure 42. Willingness-to-pay for healthy, natural, and organic labels
10 1. Introduction In principle, food labels and claims enable consumers to make more informed food choices (Lusk, 2012). However, creating and regulating labels is costly, and labels can sometimes mislead rather than inform (Schuldt and Schwarz, 2010). These competing considerations suggest the need to evaluate the costs and benefits of changes in labeling policy. Several recent events precipitated the need for the present study. While food companies are allowed to use a natural label or claim, the Food and Drug Administration (FDA) has refrained from defining the term. One consequence has been a large number of lawsuits in recent years in which plaintiffs claim to suffer harm from being misled about food product contents or ingredients when accompanied with a natural label (Creswell, 2018). In 2015, the FDA requested public comment on the use of the term natural in food labeling, signaling a potential move to define the term. Such events suggest the need for more information about how food consumers perceive and define the term natural. Prior research shows that natural labels influence consumer choice and that consumers are willing to pay premiums for natural labels (e.g., Asioli et al., 2017; Lusk, 2019); however, research also shows that consumers are sometimes misled by such claims. For example, Syrengelas et al. (2018) showed that consumers were willing to pay significant premiums for meat products labeled natural, a figure that fell to zero when consumers were informed of the U.S. Department of Agriculture s definition of the term on meat products, which is primarily that the product is minimally processed. In addition to natural label claims, there is growing interest in the use of healthy as a food product labeling claim. Healthy has been defined by the FDA since 1993 by reference to total fat content, with changes made in 2016 to discriminate between different types of fat. Recently, however, the FDA has begun a process to re-define the term, suggesting the need for more information on consumer s current perceptions of the term and labeling claim. There is a large academic literature on impacts of health claims and nutritional information on consumer choice (e.g., see Drichoutis et al., 2006 and Williams 2005 for reviews), although much of this literature has focused on issues like how the information is conveyed (e.g., front vs. back of package; traffic light symbol vs. numeric) or impacts of the nutrition facts panel (Teisl et al., 2001). It is clear that consumers are willing to pay more for products they perceive as healthy (e.g., Jo et al., 2016), but more fundamental information is needed on the determinants of health perceptions i.e., what foods, ingredients, and processes consumers perceive as healthy, particularly considering the fact that consumers often infer product healthiness from other product attributes like taste and expense and vice versa (Jo and Lusk, 2018). 6
11 The purpose of this research is to determine beliefs and preferences related to natural and healthy claims and labels. More specific objectives include determining: 1) How consumers define natural and healthy foods, ingredients, and processes; 2) What consumers believe healthy and natural claims on food packages do and should imply (e.g., eat all you want, good for the environment, etc.); 3) Beliefs about the usefulness and accuracy of healthy and natural claims; 4) Importance of healthiness and naturalness relative to other factors when making food choices; 5) Consumers preferences for how labeling claims should be regulated; 6) Consumer reactions to ingredient lists that contain chemical vs. lay descriptions (e.g., cyanocobalamin vs. vitamin B12), and preferences for policies surrounding ingredient lists.; and, 7) How the presence of natural and healthy labels affects purchase intention and willingness-to-pay. 7
12 2. Methods and Procedures A nationwide, online survey of U.S. food consumers was fielded at the end of 2018 from December 11 th to the 17 th. The survey was written and programmed by the author and was administered to an online panel maintained by Survey Sampling International. The survey consisted of several groups or blocks of questions related to: 1) food values and use of food labels, 2) natural, 3) healthy, 4) ingredient lists, 5) purchase intentions, and 6) demographics. The order in which respondents saw the question blocks on natural, healthy, and purchase intention was randomized across respondents; the demographic questions were always presented at the end and the food values and label use questions were always presented at the beginning. Where appropriate, the order of response categories for each question was randomized as were questions within a group/block. The first question on the survey asked how much of the grocery shopping the respondent did for their household. Anyone who provided an answer indicating that they were responsible for less than half their household s grocery shopping was immediately directed to the end of the survey and were excluded from this analysis. Moreover, for quality control, two trap questions were included in the survey, which asked respondents to choose a specific answer (e.g., somewhat agree ) if they were paying attention (see Jones et al., 2015 and Malone and Lusk, 2018 for further discussion on use of trap questions to improve quality of survey responses). Respondents who missed either of the trap questions were also excluded from the analysis. Lastly, as a further quality control measure, responses to three open-ended questions were inspected, and respondents who provided non-sensical answers (e.g., asdkf ) were removed from the sample. After applying the aforementioned exclusionary criteria, the final sample consists of 1,290 respondents, which yields a sampling error of 2.7%. Thus, if for example, 48% of respondents chose a particular response, we can be 95% confident that if the survey were repeated again, that the percentage of respondents who would choose the same response would be within 48% ± 2.7%. Responses were weighted to match the U.S. population in terms of region of residence in the U.S., age, education, and gender. Weighted and unweighted demographic characteristics of the respondents are presented in the appendix. 8
13 Many of the questions asked respondents to choose multiple items from a list. Rather than asking choose all that apply, respondents were asked to choose a limited number, e.g., choose the three items that most apply so as to force respondents to prioritize their responses and to induce more careful consideration. The survey also included several images in which respondents were asked to click the image according to a particular criteria. The figure below shows one such image to ascertain which processes consumers perceived as natural, where respondents were asked Which of the following foods or processes do you consider to be natural? (click up to 5 items on the image that you believe are natural). The question was repeated except natural was replaced with NOT natural. Figure 1. Image used to determine which processes consumers perceive as natural To determine how labels affect consumers purchase intentions and willingness-to-pay, respondents were shown various cereal boxes that differed in terms of prices and labels. Table 1 shows the ten cereal box combinations used in this study, and figure 2 shows how the boxes were visually presented to respondents in the survey. 9
14 Figure 2. Images used in the purchase intention and willingness-to-pay questions 10
15 Table 1. Ten Cereal Box Treatments Cereal Box Price per box Label(s) 1 $2.98 None/Control 2 $4.98 None/Control 3 $2.98 Natural 4 $4.98 Natural 5 $2.98 Healthy 6 $4.98 Healthy 7 $2.98 Organic 8 $4.98 Organic 9 $2.98 Natural, Healthy, and Organic 10 $4.98 Natural, Healthy, and Organic Respondents were randomly presented with two of the 10 boxes, and for each box, were asked to indicte, Which part of the cereal box below is most attractive to you? (please click or touch the image in the most attractive location), Which part of the cereal box below is least attractive to you? (please click or touch the image in the least attractive location), and then for each box, they were presented with a slider scale ranging from 0 to 100 in which they were asked, If you encountered this box of cereal in the grocery store, how likely would you be to purchase it? (0 = no chance of buying; 100 = 100% chance of buying). Responses to the purchase intention question can be used to estimate the following linear regression, which included individual-specific fixed effects (β0,i): Likelihood of Purchaseij = β0,i + β1*pricej + β2*naturalj + β3*healthyj + β4*organicj + β5*naturalj*healthyj*organicj where i indicates as subscript for each person and j indicates a particular cereal box, Price is the price of the cereal box (either $2.98 or $4.98), Naturalj, Healthyj, and Organicj take the value of 1 if box j contains the respective labels and zero otherwise, and β are coefficients to be estimated indicating how purchase intention changes with the various cereal characteristics. The coefficient β5 reveals whether boxes that contain all three labels are valued more or less than when each of the three labels are viewed in isolation; if β5>0, then the labels are complements (each label is more highly valued when in the presence of other labels), but if β5<0, then the labels are substitutes (the value consumers derive from one label is partially subsumed in another label). The coefficients can be used to infer willingness-to-pay values. In short, willingness-to-pay is determined as the estimated price difference necessary to induce indifference (i.e., equal purchase intention) between a box of cereal that possesses a particular label and one that does not. In practice, this value is determined by taking the ratio of the coefficient for a particular label and the price coefficient multiplied by negative one. For example, the willingness-to-pay for the natural label in isolation relative to no label is: -β2/β1. 11
16 3. Results 3.1. Label and Food Preferences Open Ended Questions One of the initial survey questions asked, Is there additional information you would like to see on food packages that is not typically there? As figure 3 shows, only 29.6% responded in the affirmative. Is there additional information you would like to see on food packages that is not typically there? Yes, 29.6% No, 70.4% Figure 3. Desire for additional information on food packages For the 29.6% who indicated that there was more information they wanted to see on food packages, an open-ended follow-up question was provided. In particular, these respondents were asked, What additional information would you like to see on food packages? (please type your answer in the blank below). Figure 4 shows a word cloud illustrating the relative frequency with which different words were mentioned by respondents in response to this question. In creation of the word cloud, commonly mentioned non-descript words like food and ingredient were removed, as were words such as an, the, or, means, etc. Words mentioned fewer than five times were also removed. 12

17 Figure 4. Word cloud constructed from open-ended responses to question, What additional information would you like to see on food packages? The word cloud was used to help identify commonly used words in response to the question. A list of 120 words or phrases was constructed, and each response was inspected to determine how many respondents mentioned each word. Each word was also placed into one of seven categories related to: 1) Ingredients/Additives/Processes (included words like: ingredient, additive, gmo, organic, chemical, pesticide), 2) Origin (included words like: where, from, origin), 3) Packaging (included words like: date, size, serving, when), 4) Nutrients (included words like: fat, sugar, nutria, calorie, vitamin), 5) Nature (included words like: artificial, made, processed, grown, real, natural), 6) Skepticism (included words like: nothing, don t know, not sure, BS, meaningless), and 7) Other Descriptors (included words like: good, great, price, health, harm, flavor, taste). 13
18 What additional information would you like to see on food packages? ingredient where gmo calorie nutri sugar origin made from size date serving fat country 4.7% 4.6% 4.6% 3.9% 3.9% 3.4% 3.4% 2.7% 2.7% 2.7% 6.3% 6.8% 8.1% 11.7% 0% 2% 4% 6% 8% 10% 12% 14% Percent of Respondents Mentioning Word Figure 5. Most common words mentioned when asked what additional information is wanted on food packages (among the 29.6% who said they wanted more information) Of the 29.6% who said they would like more information, when unaided, the most commonly mentioned issues related to origin ( where was mentioned by 8.1% of respondents), presence of GMOs or genetic engineering ( gmo was mentioned by 6.8% of respondents and another 0.5% mentioned genetic ), or caloric and sugar content (mentioned by 6.3% and 4.6% of respondents, respectively). When unaided, natural or health(y) were mentioned by fewer than 2% of respondents, among those who said they would like to see more information. The percent of respondents mentioning words in the seven word categories were as follows: Ingredients/Additives/Processes (31.7%), Nutrients (23.1%), Origin (20.7%), Packaging (17.1%), Nature (14.2%), Other Descriptors (12%), and Skepticism (4.1%). See appendix for a full list of words in each category and additional analysis of responses to this open-ended question. 14
19 Guided Questions Respondents were asked which labels or information is most informative. Ten options were provided in random order, and respondents were asked to pick up to three of the options that most applied. By far, the most commonly chosen options were ingredient list and nutrition facts panel, both of which were picked by more than 60% of respondents as being among the most informative. The next most informative labels were package weight/volume and brand name, which were chosen by 33.3% and 29.5%, respectively, as being among the most informative. Only about 9% of respondents chose the natural label or health claim as being most informative. Which of the following labels or information on food packages do you find to be most informative? (check up to 3 items that most apply) ingredient list 69.0% nutrition facts panel 61.1% package weight or volume brand name 29.5% 33.3% non-gmo label healthy label origin label organic label natural label health claim 15.8% 14.3% 11.6% 10.8% 9.0% 8.6% 0% 10% 20% 30% 40% 50% 60% 70% 80% Percent of Respondents Choosing Label/Information Figure 6. Relative informativeness of different food package labels 15
20 % Choosing Most Important minus % Choosing Least Important Food Values Following on the work of Lusk and Briggeman (2009) and Lusk (2011), respondents food values were measured. In particular, respondents were shown a list of nine items and they were asked which were most and which were least important when buying food. Respondents had to click and drag three of the items into a most important box and also put three in a least important box, leaving three in neither box. The advantage of this questioning approach is that it requires a tradeoff. Respondents cannot say all issues are important and they have to indicate some food values as least important. To create a scale of importance, the percent of times an issue was placed in the least important box was subtracted from the percent of times it was in the most important box, creating a measure that ranges from 100% to -100%. By construction, the sum of the importance score across all nine food values is zero. How important are the following items to you when deciding which foods to buy? 80.0% 60.0% 40.0% 67.3% 55.4% 40.2% 20.0% 16.8% 0.0% -14.6% -20.0% -40.0% -38.5% -40.3% -41.1% -60.0% Figure 7. Relative importance of nine food values when buying food -45.3% As shown in figure 7, taste and price were the two most important values when consumers buy food. 72.7% of consumers indicated taste as most important, and only 5.4% indicated taste as least important, creating an importance score of =67.3% for taste. Similarly, 55.4% more consumers indicated price as important than not important. Healthiness and safety were the third and fourth most important food values. Naturalness was viewed as least important more commonly than most important as indicated by the negative importance score of -14.6%. Environmental impact, familiarity, and convenience were the least important food values. Figure 7 shows the average result across all respondents. Table 2 shows the average food value scores for different demographic groups. 16
21 Table 2. Average food value scores by demographic group Demographic Group Taste Price Safety Naturalness Healthiness Convenience Familiarity Appearance Environmental Impact Men -19.1% 38.7% 65.0% 56.4% 9.7% -40.0% -34.4% -31.7% -44.5% Women -10.2% 41.7% 69.4% 54.5% 23.5% -50.3% -47.5% -44.8% -36.3% 18 age % 40.1% 64.7% 52.3% 23.6% -48.3% -43.5% -61.3% -14.8% 25 age % 35.9% 49.5% 38.4% 21.4% -43.7% -43.4% -46.4% -22.8% 35 age % 42.9% 65.3% 48.2% 17.7% -39.6% -44.9% -29.0% -44.9% 45 age % 41.3% 80.6% 62.0% 17.9% -44.6% -55.5% -39.1% -46.0% 55 age % 43.0% 72.4% 55.8% 12.5% -48.9% -33.6% -28.5% -50.7% 65 age -29.5% 38.5% 71.0% 72.5% 10.4% -47.1% -28.8% -33.0% -54.1% inc<$60k -14.4% 35.9% 65.5% 60.7% 20.5% -47.0% -41.0% -40.0% -40.1% $60k inc<$120k -12.0% 45.6% 70.9% 46.7% 11.3% -43.8% -42.1% -39.4% -37.2% inc $120k -22.1% 48.9% 67.3% 50.6% 11.6% -40.5% -39.1% -27.9% -48.7% HS or less -14.7% 34.7% 68.6% 57.5% 21.3% -49.0% -42.5% -38.2% -37.8% Some college -10.8% 42.3% 65.6% 53.6% 16.2% -40.6% -44.6% -39.5% -42.1% BS, BA or higher -18.3% 45.4% 67.3% 54.7% 11.2% -45.2% -35.5% -37.8% -41.7% Northeast -14.6% 43.1% 62.5% 57.4% 15.2% -45.6% -34.9% -38.2% -44.9% Midwest -19.6% 38.8% 72.5% 62.7% 19.3% -45.5% -50.3% -34.1% -43.8% South -8.9% 39.5% 69.1% 51.7% 19.3% -51.1% -41.4% -43.0% -35.1% West -19.2% 40.4% 63.2% 53.7% 11.7% -35.6% -37.0% -35.1% -42.2% Democrat -12.8% 40.8% 65.2% 52.8% 16.4% -47.6% -44.3% -38.8% -31.7% Republican -18.6% 43.4% 71.7% 57.9% 22.0% -39.7% -42.8% -37.4% -56.5% Independent -11.9% 37.3% 64.9% 55.6% 13.4% -47.8% -35.7% -38.8% -37.1% White -18.0% 37.3% 71.0% 60.7% 11.7% -41.3% -38.9% -37.9% -44.5% Black 0.2% 56.7% 51.9% 38.4% 33.8% -60.8% -54.3% -34.7% -31.4% Hispanic -12.8% 32.7% 58.1% 47.0% 24.6% -38.8% -42.0% -42.1% -26.7% Note: values sum to zero across each row. Each row presents the same type of information as in figure 7 but for the specific demographic group in question. 17
22 As shown in table 2, men placed less value on naturalness than women, and women placed more value on safety than men. Millennials (aged 25 to 34) were the only group to, on net, indicate naturalness as a more important than less important food value. In general, the value of naturalness fell with age. All age groups valued healthiness similarly. Higher income consumers placed more value on healthiness than low income consumers, but the opposite was true with regard to the relationship between income and the importance placed on naturalness. Not surprisingly, lower income individuals placed a higher importance on the price paid for food than higher income consumers. The oldest age group (65 years and older) was the only group for which taste was not the most important food value; for this group, price was slightly more important than taste. Naturalness was most valued in the Southern U.S., whereas healthiness was most valued in the Western and Northeastern U.S. Republicans placed less value on naturalness, and particularly environmental impacts, as compared to Democrats. Black or African American consumers placed significantly higher values on both naturalness and healthiness relative to white and Hispanic consumers. 18
23 3.2. Natural Beliefs and Preferences Open Ended Questions Figure 8 shows a word cloud constructed from responses to the open-ended question, What does it mean to you for a food to be called natural? indicating the frequency with which various words were used by respondents. As previously described, commonly mentioned nondescript and infrequently used words were omitted. Figure 8. Word cloud constructed from open-ended responses to question, What does it mean to you for a food to be called natural? 19
24 What does it mean to you for a food to be called "natural"? ingredient artificial additive nothing natural chemical organic added processed made from good gmo grown health real 3.9% 3.4% 3.0% 2.7% 2.4% 2.3% 5.6% 5.5% 9.0% 8.7% 8.4% 7.9% 7.0% 6.5% 10.7% 14.1% 0% 2% 4% 6% 8% 10% 12% 14% 16% Percent of Respondents Mentioning Word Figure 9. Most common words mentioned when asked what it means for a food to be called natural Responses were inspected for usage of 120 words or phrases that were placed into one of the aforementioned categories. As shown in figure 9, when asked an open ended question about what it meant to respondents for a food to be called natural, words like artificial, additive, chemical, and organic were most commonly mentioned. More than 10% of respondents specifically mentioned the word artificial. A non-trivial share of respondents suggested the word was meaningless, marketing hype, or that they did not know what the word meant (8.7% said the word meant nothing ). Many respondents provided tautological-like definitions, for example using the word natural to define natural. The percent of respondents mentioning words in the seven word categories were as follows: Ingredients/Additives/Processes (53.2%), Nature (46.4%), Skepticism (13.5%), Other Descriptors (10.1%), Origin (5%), Nutrients (1.2%), and Packaging (0.6%). See appendix for a full list of words in each category and additional analysis of responses to this open-ended question. 20
25 Guided Questions Following the open-ended question of the meaning of natural, respondents were provided with a list of 11 possible definitions and were asked which most applied to the meaning of the word natural. Figure 10 shows that more than half of respondents indicated a food was natural if it had no preservatives and no hormones and antibiotics. Almost 40% of respondents said no pesticide residues was natural. Only 29.4% said fresh was indicative of natural, slightly more than the 26% who said the same of organic. Only 22.3% said a food needed few added ingredients to be natural, and only 7.1% said only foods my grandmother would recognize are natural. Consumers do not seem to associate cooking or localness to relate to naturalness. What does it mean to you for a food to be called "natural"? (check up to 3 items that most apply) no preservatives no hormones or antibiotics no pesticide residues fresh organic close to nature few added ingredients foods my grandmother would recognize anything I could make in my kitchen local uncooked 7.1% 4.7% 4.1% 3.0% 29.4% 26.0% 22.8% 22.3% 37.7% 53.5% 58.8% Figure 10. Perceived definitions of naturalness 0% 10% 20% 30% 40% 50% 60% 70% Percent of Respondents Checking Item 21
26 Respondents were provided a list of 12 food processes in random order and were asked to indicate whether each was natural, not natural, or neither natural or not natural. For each item, a naturalness score was created by subtracting the percent of respondents who considered a process not natural from the percent of respondents who considered a process natural. Figure 11 shows the results. 76.9% of respondents indicated chopped was natural, whereas only 5.3% thought this process was not natural, implying =71.7% thought chopping was more natural than not. Thirty percent more respondents thought fermentation and pressing to create vegetable oil was natural as compared to the percentage who found these processes not natural. Preservation by canning and with sugar/salt/vinegar were perceived as net-natural, whereas preservation with benzoates/nitrites/sulphites was not. That washing had an only moderately net positive natural score is likely explained by the parenthetical definition provided, which indicated, (e.g., cleaning grains or fruits and vegetables using organic acids or chlorine). If a food was produced with the following processes or practices, would you consider the food to be natural or not natural? Chopped (e.g., baby carrots, sliced apples, cut watermelon) 71.7% Vegetable oil from pressed grains like soybeans, corn, or canola Fermentation (e.g., sauerkraut, yogurt, bread, beer) 35.1% 32.3% Preserved by canning, freezing, pasteurization, or smoking 17.1% Preserved with sugar, salt, or vinegar Washing (e.g., cleaning grains or fruits and vegetables using organic acids or Extracted starch from corn, potatoes, or wheat 5.0% 5.2% 4.7% Flavor enhanced with sugar, salt, or smoking -19.7% Added enzymes to improve texture (e.g., in cheese or bread) -44.8% Appearance altered through decoloring or bleaching (e.g., flour, sugar, rice) Preserved with benzoates, nitrites, sulphites, or sorbates Flavor enhanced with MSG, guanylic acid, or Monopotassium glutamate -67.2% -72.8% -64.9% Figure 11. Perceived naturalness of 12 food processes -100% -80% -60% -40% -20% 0% 20% 40% 60% 80% % Indicating Natural minus % Indicating Not Natural To further explore how consumers conceptualize the naturalness of different processes, the questions used to create figure 11 were further analyzed using factor analysis. Factor analysis seeks to determine whether there are common forces or factors which caused responses to different questions to correlate with each other. Analysis reveals there are two underlying factors that explain the vast majority of the variance in whether consumers rated a process as natural or not. Figure 12 plots the 12 food processes according to their factor loadings from promax rotation. 22
27 Naturalness as Determined by Means of Preservation Dimensions of Naturalness Fermentation Preserve w/ sugar, salt Preserve w/ canning, freezing,.. Vegetable oil Flavor w/ sugar, salt Extracted starch Chopped Enzymes Decoloring or bleaching Washing Flavor enhanced w/ MSG Preserve w/ benzoates, nitrites,.. Figure 12. Dimensions of naturalness Naturalness as Determined by What is Added to Food The first underlying factor (plotted along the x-axis) seems to relate to whether ingredients perceived as unnatural are believed to be added to the food. Along this dimension, the highest scoring processes are preserved with benzoates, nitrites, etc. and flavor enhanced with MSG, etc., and the lowest-scoring processes are chopped and fermentation. Processes high in this dimension seem to unnaturally affect flavor, taste, or color. The second underlying factor (plotted along the y-axis) seems to relate to whether ingredients used to preserve foods or make them storable are perceived as natural or not. Processes high in this dimension include preservation with sugar/salt, flavor with sugar/salt, and fermentation. One of the take-home points from figure 12 is that consumers do not perceive naturalness as a single unifying construct, but rather a food or process can be seen to be high in one dimension of naturalness but low in another dimension of naturalness. 23

28 One challenge with the responses in figure 11 is that it is unclear how much consumers know or care about the underlying processes used to create the ingredients like sugar, salt, or vinegar that are largely viewed as natural preservatives. It is also unclear when during a particular food production process a consumer perceives a food turns from natural to not. As such, respondents were shown the schematic in figure 1 and were asked, Which of the following foods or processes do you consider to be natural? (click up to 5 items on the image that you believe are natural). Figure 13 shows a heatmap indicating the frequency with which respondents clicked on various areas of the figure, and figure 14 shows the exact percent of respondents who clicked on the area associated with each food or process. Figure 13. Heatmap showing areas of figure most commonly clicked as natural (note: more intense red color means more clicks on the area deemed natural) 24
29 Raw Commodity Grits/Oatmeal Wash/Clean Chop/Grind/Slice Vegetable Oil Flour Transportation Starch Alcohol Soak Sugar Syrup Storage Ferment Press Extract Mill Evaporate Crystalize Bleach Which of the following foods or processes do you consider to be natural? (click up to 5 items on the image that you believe are natural) 13.3% 12.9% 10.5% 10.2% 9.7% 8.6% 7.9% 7.7% 7.1% 6.3% 4.7% 4.0% 3.6% 2.2% 1.2% 19.8% 28.9% 26.3% 23.8% 47.1% 0% 5% 10% 15% 20% 25% 30% 35% 40% 45% 50% Percent of Respondents Choosing Food or Process Figure 14. Percent of respondents indicating food or process as natural Just under half of respondents (47.1%) clicked on the image of the raw commodities as being natural. The next most commonly clicked areas, chosen by between 20% and 30% of respondents, was grits/oatmeal, wash/clean, and wash/grind/slice. Even after showing the processes involved, 19.8% clicked vegetable oil as natural and 13.3% clicked flour as natural. 25

30 Respondents were again showed the image in figure 1, but this time were asked to click up to five areas that were NOT natural. Figure 15 shows a heatmap and figure 16 provides the exact percent of respondents clicking each area. Figure 15. Heatmap showing areas of figure most commonly clicked as NOT natural (note: more intense red color means more clicks on the area deemed NOT natural) Bleach was clicked by 33.8% of respondents as not natural, followed by crystalize, and then alcohol, syrup, and sugar. 26
31 Bleach Crystalize Alcohol Syrup Sugar Starch Flour Extract Ferment Vegetable Oil Storage Evaporate Transportation Raw Commodity Wash/Clean Press Chop/Grind/Slice Soak Mill Grits/Oatmeal Which of the following foods or processes do you consider to be NOT natural? (click up to 5 items on the image that you believe are NOT natural) 5.4% 5.1% 4.3% 4.0% 3.9% 3.7% 2.7% 15.3% 13.4% 13.2% 12.0% 11.7% 10.7% 9.7% 9.4% 9.2% 22.2% 21.7% 20.1% Figure 16. Percent of respondents indicating food or process as NOT natural 33.8% 0% 5% 10% 15% 20% 25% 30% 35% 40% Percent of Respondents Choosing Food or Process Figure 17 combines the data in figures 14 and 16 to create a net natural score by subtracting the percent of times an area of the image was clicked as not natural from the percent of times the same area was clicked as natural. The beginning stages of the food production process are generally perceived as being more natural than not. Grits/oatmeal, vegetable oil, and, by a thin margin, flour, were the only final foods clicked as being more natural than not. Bleach and crystalize were areas of the figure most likely be clicked as not natural relative to being clicked as natural. A curious result revealed from these figures is that, in many case, final foods are often considered more natural than the processes which make them. For example, figure 14 shows more people clicked alcohol as natural than clicked fermentation as natural. Figure 17 shows that vegetable oil has a higher net natural score than pressing or bleaching, both processes which are used to create this final product. Similarly, figure 17 shows sugar has a higher net natural score than crystalize, but of course, the latter is necessary to produce the former. These findings suggest that it is possible for a final product to be considered natural even if a process used to make the product is not. To illustrate, of the 33.8% people who considered bleaching NOT natural, 3.9% consider sugar, 4.3% consider flour, and 8.6% consider vegetable oil natural. Conversely, of the 13.3% of people who consider flour natural, 10.9% consider bleaching NOT natural; of the 19.8% who consider vegetable oil natural, 14.7% consider bleaching NOT natural. 27
32 Raw Commodity Grits/Oatmeal Wash/Clean Chop/Grind/Slice Vegetable Oil Soak Transportation Press Mill Flour Storage Starch Ferment Evaporate Sugar Extract Alcohol Syrup Crystalize Bleach Which of the following foods or processes do you consider natural vs. NOT natural? -32.6% -20.0% -2.0% -2.9% -4.6% -5.8% -6.8% -7.3% -11.5% -12.3% 9.1% 5.8% 3.6% 2.1% 0.3% 0.1% 26.1% 21.2% 19.8% Figure 17. Net naturalness score. Perceived naturalness of foods and processes as determined by clicks on image of food production process 41.7% -40% -30% -20% -10% 0% 10% 20% 30% 40% 50% Percent of Respondents Choosing Food or Processess as Natural minus Not Natural 28
33 Previous questions focused on final foods or food production processes to determine naturalness; however, as figures 8 and 9 suggest, consumers also consider crop production methods when making a determination of naturalness. To explore this issue, respondents were provided a list of nine crop production practices in random order and were asked to indicate whether each was natural, not natural, or neither natural or not natural. For each item, a naturalness score was created by subtracting the percent of respondents who considered a practice natural from the percent of respondents who considered a practice not natural. Figure 18 shows the results. About 80% more respondents said organically grown crops were natural as said such crops were not natural. Crops grown indoors and that are hydroponically grown were, on net, seen as more natural than not. All other crop production practices were rated as not natural by more respondents than were rated as natural. Thus, the results suggest consumers are skeptical of the naturalness of most modern crop production practices. Curiously, this is true for use of hybrid seeds. More consumers considered hybrid seeds as not natural than did the number of consumers who considered hybrid seeds natural. Crops produced with biotechnology were much more likely to be considered not natural than natural. Consumers perceived organic as natural, but not the pesticides used in organic agriculture or the methods (i.e., mutagenesis) used to create many organic seeds. Again, these findings suggest that it is possible for a final product to be considered natural even if a process used to make the product is not; in this case, the finding is likely to result from a lack of knowledge about organic production practices. If a food was produced from a grain, oilseed, fruit, or vegetable that was grown or farmed using the following processes or practices, would you consider the food to be natural or not natural? organically grown crops crops grown indoors in greenhouses 64.7% 79.9% hydroponically grown crops 23.2% hybrid seeds crops sprayed with natural pesticides like copper sulfate or bacillus thuringiensis seeds created using mutagenesis seeds created using gene editing -4.1% -21.4% -43.2% -50.4% seeds created with genetic engineering or GMOs -53.9% crops sprayed with synthetic pesticides like glyphosate or chlorpyrifos -68.1% -80% -60% -40% -20% 0% 20% 40% 60% 80% 100% % Indicating Natural minus % Indicating Not Natural Figure 18. Perceived naturalness of nine crop production practices 29
34 Whereas previous questions have aimed to determine the foods, practices, and processes consumers judge to be natural, it has not yet been ascertained why consumers may or may not prefer more natural products. As figure 7 on food values revealed, naturalness is mid-ranked in terms of factors important to consumers when buying food. Figure 19 shows the results of a series of questions in which respondents were asked to indicate their extent of agreement or disagreement with seven statements such as, Natural food is healthier. There were five potential response categories: strongly disagree, somewhat disagree, neither agree nor disagree, somewhat agree, and strongly agree, which were coded -1, -0.5, 0, 0.5 and 1, respectively. This coding yields positive means when there is more agreement than not to the statement, and negative means when the opposite is true. Figure 19 shows high levels of agreement with the notion that natural foods are healthier, safer to eat, and are better for the environment. There was moderate agreement that natural food is more sustainable and tastier, and split opinion about whether natural food is more convenient. There was moderate disagreement with the natural food is more affordable. To what extent do you agree or disagree with each of the following statements? Natural food is... healthier 0.53 safer to eat better for the environment more sustainable 0.29 tastier 0.21 more convenient to eat 0.03 more affordable Figure 19. Beliefs about natural food Mean response (-1 = Strongly Disagree, -0.5=Somewhat Disagree, 0=Niether Agree nor Disagree, 0.5=Somewhat Agree, 1=Strongly Agree) 30
35 Policy Questions Respondents were asked about their preferences for the regulation of natural labels on food. Almost two-thirds of consumers indicated a desire that the FDA regulate the use of the term natural by requiring companies to follow a uniform, consistent definition. A little over 20% of respondents thought the FDA should prohibit the use of natural labels. How do you believe natural labels should be regulated? The FDA should regulate to prevent the use of the term "natural" on food packages, 21.5% The FDA should not regulate the use of the term "natural" on food packages, 12.8% The FDA should regulate to use of the term "natural" by requiring companies to follow a uniform, consistent definition, 65.7% Figure 20. Preferences for regulation of natural labels Despite this policy preference, figure 21 shows that less than half of respondents (44.4%) either highly or somewhat highly trust the FDA to define the term "natural" in a way that they would find useful in making food choices. A third of respondents said they neither trust nor distrust the FDA to undertake this task. 31
36 % of Respondents To what extent do you trust or distrust the FDA to define the term "natural" in a way that you would find useful in making food choices? 40% 35% 30% 25% 20% 15% 10% 5% 0% 10.0% Highly trust 34.4% Somewhat trust 33.0% Neither trust nor distrust Figure 21. Trust in FDA to regulate natural labels 14.9% Somewhat distrust 7.7% Highly distrust 32
37 Just because a federal definition of natural exists does not mean consumers know or understand the definition. Responses in figure 22 illustrate this point. The USDA currently defines natural for meat products, and it is primarily defined as minimally processed. However, only about a quarter of respondents (26.6%) correctly picked this definition. More than 30% of respondents incorrectly believed the USDA definition of natural implies no hormones and 23.8% thought a natural label implies no antibiotics. These data suggest more than half of respondents are misled by the USDA definition of natural, a result supported by the findings of Syrengelas et al. (2018). The U.S. Department of Agriculture (USDA) regulates the use of the label "natural" for meat. Which of the following best matches the current USDA definition for "natural" meat? cage free 3.8% grass fed 14.5% no antibiotics 23.8% minimally processed 26.6% no hormones 31.3% 0% 5% 10% 15% 20% 25% 30% 35% % of Respondents Chooing Definition Figure 22. Beliefs about definition of USDA natural labels on meat 33
38 3.3. Healthy Beliefs and Preferences Open Ended Questions Figure 23 shows a word cloud constructed from responses to one of the initial the open-ended question, What does it mean to you for a food to be called healthy? The word cloud visually illustrates the frequency with which various words were used by respondents. As previously described, commonly mentioned non-descript and infrequently used word were omitted. Figure 23. Word cloud constructed from open-ended responses to question, What does it mean to you for a food to be called healthy? 34
39 What does it mean to you for a food to be called "healthy"? good fat nutri natural health ingredient sugar calorie nothing organic salt chemical added additive sodium vitamin gmo 4.1% 3.6% 2.8% 2.3% 2.2% 2.2% 2.1% 2.1% 2.1% 2.0% 10.4% 9.10% 8.6% 7.8% 7.5% 6.6% 21.3% 0% 5% 10% 15% 20% 25% Percent of Respondents Mentioning Word Figure 24. Most common words mentioned when asked what it means for a food to be called healthy Responses were inspected for usage of 120 words or phrases that were placed into one of the aforementioned categories. As shown in figure 24, when asked an open-ended question about what it meant to respondents for a food to be called healthy, words like good, fat, nutrition/nutrient/nutritional, natural, sugar, calorie, and organic were most commonly mentioned. Responses provided some support for current FDA definition as fat is one of the most commonly mentioned words (mentioned by 10.4% of respondents), although nearly as many (6.6%) mentioned sugar. More than a quarter of respondents provided imprecise or tautological-like definitions like good ingredients, good for you, or healthy ingredients. The percent of respondents mentioning words in the seven-word categories were as follows: Nutrients (41.6%), Other Descriptors (36.5%), Ingredients/Additives/Processes (21.6%), Nature (18.3%), Skepticism (8.6%), Packaging (1.1%), and Origin (0.6%). See appendix for a full list of words in each category and additional analysis of responses to this open-ended question. 35
40 Guided Questions In addition to the open-ended question on the meaning of healthy, respondents were provided with a list of 13 factors that consumers might use to judge whether a food is healthy. Figure 25 shows that about a quarter of respondents indicated sugar content and use of hormones or antibiotics, 19.2% pointed to fat content, and 18.4% pointed to pesticide residues. The top four answers included two nutrients (sugar and fat) and two food production processes/ingredients (hormones and pesticides), suggesting consumers consider healthiness to be more than just defined by nutrient content. However, it should be noted that hormones and pesticides were infrequently mentioned (both mentioned by less than half a percent of respondents) when unaided. The data also suggests that when aided as in figure 25, consumers are more likely to point to sugar content than the open-ended responses in figures 23 and 24 would suggest. When listed as an option, use of GMOs was considered as a factor affecting healthiness at about the same rate as caloric content. The least frequently picked items were processing, fiber content, and local. Which of the following affects whether or not you would consider a food healthy for you? (check up to 3 items that most apply) sugar content use of hormones or antibiotics fat content pesticide residues use of preservatives use of GMOs number of calories organic protein content vitamin content use of processing fiber content local 2.7% 5.1% 12.9% 12.6% 10.9% 10.3% 9.0% 8.6% 15.9% 19.2% 18.4% 23.7% 23.5% 0% 5% 10% 15% 20% 25% Figure 25. Factors affecting consumers' perception of a foods' healthiness To further explore how consumers define and think about healthiness, a couple binary choice questions were posed. Figure 26 shows consumers were about evenly split on whether a food can be deemed healthy based solely on the foods nutritional content (52.1% believing as such) or whether there were other factors that affect whether a food is healthy (47.9% believing as such). Figure 27 shows consumers were also evenly split on whether an individual food can be considered healthy (believed by 47.9%) or whether this healthiness is instead a characteristic of one s overall diet and the combination of foods consumed (believed by 52.1%). 36
41 Which of the following statements best matches your view? I need to know more than just the nutrient content (the amount of fat, protein, carbs, vitamins, etc.) of a food to decide whether it is healthy, 47.9% If I know the nutrient content of the food (the amount of fat, protein, carbs, vitamins, etc.), I know enough to decide whether a food is healthy, 52.1% Figure 26. Is a food's healthiness defined by nutrient content? Which of the following statements best matches your view? It is better to think about "healthy" by looking at a whole dietary pattern (healthiness is defined by combinations of foods in a diet), 52.1% It is better to think about "healthy" on a food-by-food basis (some foods are healthy and some aren't), 47.9% Figure 27. Is "healthy" best defined on a food-by-food or a whole diet basis? 37
42 Data in figures 26 and 27 suggests difficulty in creating a definition of healthy on food packages that is broadly acceptable to consumers. To further emphasize this point, it should be noted that the answers to these two questions are not determinative of each other, but rather there are four distinct consumer segments with regard to healthy food conceptions. Table 3 shows a cross-tab indicating the percent of respondents who answered these two questions in the four possible manners. Table 3. Percent of respondents with four different views on how healthy should be defined Only a Single foods whole diet can be can be considered considered healthy or healthy or unhealthy unhealthy Healthiness based on nutrients alone 26.5% (Food- Nutrient Focus: health based on a food s nutrients) 25.6% (Diet- Nutrient Focus: health based on nutrients from whole diet) Healthiness based on more than nutrient content 21.4% (Food- Nonnutritive Focus: health based on a food s entire composition) 26.5% (Diet- Nonnutritive Focus: health based on holistic consumption pattern) 38
43 Respondents were provided a list of 15 foods in random order and were asked to indicate whether each was healthy, unhealthy, or neither healthy nor unhealthy. For each item, a healthiness score was created by subtracting the percent of respondents who considered a process unhealthy from the percent of respondents who considered a process healthy. Figure 28 shows the results. Almost all respondents (96.2%) considered fresh vegetables to be healthy, and almost none (0.9%) considered them unhealthy, yielding a net healthy score of =95.3% for fresh vegetables. Fresh fruit, fish, eggs, and chicken were likewise broadly considered healthier than not. Frozen vegetables/fruit were considered less healthy than fresh, and canned were considered less healthy than frozen, although even canned was considered, on net, more healthy than unhealthy. Only three of the 15 items listed were considered by more respondents to be unhealthy than healthy: vegetable oil, bakery and cereal items, and particularly candy. A third of respondents thought bakery and cereal items were unhealthy, but 23.3% thought such items were healthy, and 43.7% thought such items were neither healthy nor unhealthy. 49% (the highest for any food considered) said vegetable oil was neither healthy nor unhealthy. Candy was the only item a plurality of respondents thought was unhealthy. Do you consider each of the following foods to be healthy or unhealthy for you? Fresh vegetables Fresh fruit Fish Eggs Chicken Frozen vegetables Milk Frozen fruit Cheese Beef Canned vegetables Canned fruit Vegetable oil Bakery and cereal items Candy -75.6% -9.7% -0.9% 95.3% 95.1% 85.7% 76.6% 75.7% 66.0% 63.4% 58.6% 47.8% 39.8% 27.9% 15.7% -100% -80% -60% -40% -20% 0% 20% 40% 60% 80% 100% 120% % of Respondents Choosing Food as Healthy minus % Indicating Unhealthy Figure 28. Perceived healthiness of 15 foods 39
44 To explore how consumers conceptualized the healthiness of different foods, the questions used to create figure 28 were further analyzed using factor analysis. As previously indicated, factor analysis is a way to group different foods by a few common forces or factors which cause responses to different questions to correlate with each other. Analysis reveals that there are three underlying factors that explain the vast majority of the variance in whether consumers rate a food as healthy or not. Figure 29 plots the 15 foods according to their factor loadings from promax rotation. The first factor, shown on the vertical axis of the bottom panel of figure 29 shows all animal products with high values and other non-animal products with lower values, suggesting consumers use animal origin as a primary factor in judging whether a food is healthy. A second factor, illustrated on the horizontal axis of the top panel of figure 29, has canned and frozen fruits and vegetables with the highest values, bakery and cereal items, candy, and fresh fruits and vegetables with mid-to-low values, and animal products with the lowest values, which seems to suggest consumers use degree of preservation as another dimension of healthiness. Finally, the third factor, illustrated on the vertical axis of the top panel and the horizontal axis of the bottom panel of figure 29, indicates freshness or degree of processing is another dimension to healthiness evaluations. These results indicate that healthiness is not a single unifying construct, but rather consumers evaluate healthiness along a number of different dimensions or factors. A food, such as beef or fish, can be seen as scoring high in some dimensions of healthy but low in another. 40
45 Healthiness based on Animal Origin Healthiness based on Freshness/Processing Dimensions of Food Healthiness Fresh fruit Beef Fish Chicken Eggs Milk Cheese Fresh vegetables Vegetable oil Bakery and cereal items Frozen fruit Frozen vegetables Canned fruit Canned vegetables Candy Healthiness based on Preservation Beef Cheese Milk Chicken Eggs Fish Bakery and cereal items Vegetable oil Fresh fruit Candy Canned vegetables Fresh vegetables Canned fruit Frozen fruit Frozen vegetables Healthiness based on Freshness/Processing Figure 29. Three dimensions of 15 food's healthiness 41
46 % of Respondents % of Respondents % of Respondents % of Respondents A set of four questions was designed to evaluate how consumers perceived the healthiness of different nutrients and minerals. Consumers were asked, Which of the following do you consumer to be most healthy for you, and indicated low, medium low, medium, medium high, or high levels of sodium, carbohydrates, fat, and protein. Figure 30 shows that about two-thirds of respondents believed low sodium was most healthy for them. There were more disparate views about carbohydrates. A plurality of consumers thought a low amount of carbohydrates was most healthy, but 28.3% considered a medium amount of carbohydrates as most healthy. Low fat diet was considered healthiest by 53.5% of consumers, and another 21.9% thought medium low fat was healthiest. About 6% of respondents thought medium high or high fat diets were healthiest. In general, higher protein diets were considered healthier than lower protein diets. 80% 70% 60% 50% 40% 30% 20% 10% 0% Which of the following do you consider to be the most healthy for you? 66.8% Low sodium 19.7% Medium low sodium 11.4% Medium sodium 1.6% 0.6% Medium high sodium High sodium 80% 70% 60% 50% 40% 30% 20% 10% 0% Which of the following do you consider to be the most healthy for you? 42.6% Low carbohydrates 22.5% Medium low carbohydrates 28.3% Medium carbohydrates 4.0% 2.6% Medium high carbohydrates High carbohydrates 80% 70% 60% 50% 40% 30% 20% 10% 0% Which of the following do you consider to be the most healthy for you? 53.5% 21.9% 18.5% 4.3% Low fat Medium low fat Medium fat Medium high fat Figure 30. Perception of healthiness of sodium, carbohydrates, fat, and protein 1.8% High fat 3.2% 4.4% 24.1% 24.9% Figure 30 indicates the most common category chosen by respondents in each category is at the extreme (lowest sodium, lowest fat, lowest carbohydrate, and highest protein). However, it is useful to consider how consumers evaluated the healthiness of combinations of these nutrients. Figure 31 illustrates the percent of respondents that indicated the healthiness of jointcombinations of carbohydrates, fat, and protein. As the top panel of figure 31 reveals, 24% of respondents indicated the highest level of protein and lowest level of carbohydrates as healthiest. About 10% of respondents indicated high protein and medium carbohydrates as the next most healthy combination, followed by 9% who picked the medium level of both carbohydrates and protein as healthiest. The middle panel indicates 29% of respondents indicated highest protein and lowest fat levels as healthiest, followed by 20% who indicated low fat and medium or medium high protein as healthiest. The final panel in figure 21 plots carbohydrates against fat. There were very few respondents (about 2%) who consider high fat, low carbohydrate diets as healthiest. 80% 70% 60% 50% 40% 30% 20% 10% 0% Which of the following do you consider to be the most healthy for you? Low protein Medium low protein Medium protein Medium high protein 43.5% High protein 42
47 Fat Content Fat Content Carbohydrate Content Healthiness of Carbohydrates vs. Protein 0% 0% 0% 2% 0% 1% 2% 1% 0% 2% 9% 8% 10% 0% 1% 6% 8% 7% 2% 1% 8% 7% 24% Protein Content Healthiness of Fat vs. Protein 0% 0% 0% 1% 0% 1% 2% 2% 0% 1% 7% 5% 6% 0% 1% 6% 8% 6% 3% 2% 10% 10% 29% Protein Content Healthiness of Fat vs. Carbohydrates 1% 0% 0% 0% 0% 1% 0% 2% 1% 0% 3% 4% 10% 1% 1% 4% 9% 8% 1% 0% 34% 9% 8% 1% 1% Carbohydrate Content Figure 31. Joint perception of healthiness of carbohydrates, fat, and protein 43
48 The aforementioned figures suggest some heterogeneity across people in terms of what is considered healthy. To further explore this issue, respondents were asked whether they thought different diseases or health conditions would influence what they considered to be healthy. As figure 32 shows, there were virtually no respondents who did not think their perceptions of a food s health would be influenced by the disease or health conditions listed. Diabetes, heart disease, and obesity were the three conditions most likely to affect perceptions of which foods are healthy. Which of the following diseases or health conditions do you think would affect which foods you consider to be healthy? (check up to 3 items that most apply) diabetes 63.3% heart disease 54.8% obesity 50.1% food allergy cancer 30.5% 29.5% none of the above 0.0% 0% 10% 20% 30% 40% 50% 60% 70% % of Respondents Choosing Health Condition Figure 32. Relationship between diseases and health conditions and beliefs about healthiness 44
49 Moving on from consumers definitions of foods and nutrients that are considered healthy or unhealthy, consumers were asked what they think healthy means in terms of behavior (figure 33) and how this moniker affects other food attributes (figure 34). About 40% of consumers thought a healthy label implied they should increase consumption of this type of food (15.5% thought the label meant they could eat all they wanted). A little over a third of respondents (34.7%) indicated that a healthy label would not mean anything to them. If a food is labeled "healthy", what would that mean to you? (check up to 3 items that most apply) I should increase consumption of this type of food 39.5% I shouldn't avoid this type of food 36.2% It wouldn't mean anything to me 34.7% I can eat all I want 15.5% My diet isn't healthy unless I eat this type of food 13.4% I should reduce consumption of this type of food 7.7% Figure 33. Behavioral implications of healthy food labels 0% 5% 10% 15% 20% 25% 30% 35% 40% 45% % of Respondents Choosing Answer 45
50 Figure 34 shows the results from questions where respondents were asked to indicate their extent of agreement or disagreement with eight statements. There were five potential response categories: strongly disagree, somewhat disagree, neither agree nor disagree, somewhat agree, and strongly agree, which were coded -1, -0.5, 0, 0.5 and 1, respectively. This coding yields positive means when there is more agreement than not to the statement and negative means when the opposite is true. Figure 34 shows the highest levels of agreement with the statement, Individual needs determine whether various foods are healthy for an individual. Only 7.8% of respondents disagreed with this statement, whereas more than 70% agreed with it. There were also strong beliefs that healthy food is safe to eat and natural. There was only moderate agreement that healthier food is tastier. About 44% of respondents neither agreed nor disagreed with this statement. There was slightly more disagreement than agreement that healthy food is more convenient to eat. A majority of consumers (58%) disagreed that healthy is more affordable. To what extent do you agree or disagree with each of the following statements? Individual needs determine whether various foods Healthy food is safer to eat Healthy food is more natural Healthy food is better for the environment Healthy food is more sustainable Healthy food is tastier 0.10 Healthy food is more convenient to eat Healthy food is more affordable Figure 34. Beliefs about healthy food Mean response (-1 = Strongly Disagree, -0.5=Somewhat Disagree, 0=Niether Agree nor Disagree, 0.5=Somewhat Agree, 1=Strongly Agree) 46
51 Policy Questions Consumers were asked how they thought healthy labels should be regulated. Figure 35 shows that a majority of consumers (54.2%) felt the FDA should regulate the use of the term by requiring companies to follow a uniform, consistent definition. Thus, consumers want the FDA to define healthy ; however, it is not clear that consumers agree on the definition. Indeed only 19.3% of respondents believed FDA should keep the current definition. How do you believe healthy labels should be regulated in the future? The FDA should not regulate the use of the term "healthy" on food packages, 9.3% The FDA should regulate to prevent the use of the term "healthy" on food packages, 17.2% The FDA should regulate the use of the term "healthy" by requiring companies follow a uniform, consistent definition, 54.2% The FDA should keep the current definition of "healthy", 19.3% Figure 35. Preferences for regulation of healthy labels 47
52 % of Respondents Figure 36 shows consumer trust in the FDA to regulate healthy labels. 46.2% either highly or somewhat trust the FDA to regulate healthy in a way that would be useful in making food choices. This total is slightly higher than the 44.4% of consumers who said they trusted the FDA to regulate natural (see figure 21). To what extent do you trust or distrust the FDA to define the term "healthy" in a way that you would find useful in making food choices? 40% 35% 30% 25% 20% 15% 10% 5% 0% 8.9% Highly trust 37.3% Somewhat trust 31.1% Neither trust nor distrust Figure 36. Trust in FDA to regulate healthy labels 15.8% Somewhat distrust 7.0% Highly distrust 48
53 % of Repondents Choosing Lay vs. Scientific Word 3.4. Ingredient Name Preferences Figure 37 illustrates the results from three different questions that gave consumers a binary choice between two ingredient names that are equivalent except for whether scientific or lay descriptions were used. In all three cases, more than 85% of respondents preferred the everyday, lay name to its scientific counterpart insofar as the word being informative. 100% Which of the two words below would you find more informative if you saw it on an ingredient list of a food package? (Both words mean the same thing but one is the precise scientific description the other is the common usage) 90% 80% 70% 60% 50% 40% 30% 20% 10% 0% Corn starch, 89.1% Vitamin B-6, 90.3% Maltodextrin, 10.9% Pyridoxine, 9.7% Ingredient word pair Soluble corn fiber, 86.6% Resistant maltodextrin, 13.4% Figure 37. Preferences for scientific vs. lay names in ingredient lists 49
54 3.5. Labels, Purchase Intention, and Willingness-to-Pay As described in the methods section, each consumer was randomly shown two cereal boxes that potentially differed according to price ($2.98 or $4.98) and the presence or absence of three labels (natural, healthy, and organic). Prior to asking respondent s likelihood of purchasing each box, they were asked to click on the image of the cereal box to indicate the most and least attractive area of the box. Figure 38 shows heat maps illustrating the areas of the boxes respondents found most attractive, and figure 39 shows the same for the least attractive areas. Comparing figures 38 to 39, it is clear that the area of the boxes showing price was much more likely to be picked as least than most attractive. Figure 40 reports the share of respondents clicking each area of the box in the least and most attractive conditions. Respondents often picked the healthy, natural, and organic labels as the most attractive area, although these labels were also picked by some consumers as the least attractive area. Figure 40 also shows that, on average, respondents indicated a 41% chance of purchasing a cereal box, but this varied from a low of 34.9% for the box of cereal with no labels priced at $4.98 to a high of 44.1% for the box of cereal with all three labels priced at $2.98. To further summarize the effect of prices and labels on purchase intention, a fixed-effects linear regression was estimated, which indicates the following relationships (R 2 = 0.88; N=2,576; all coefficients are statistically significant at the 0.05 level): Likelihood of Purchaseij = β0,i -3.03*Pricej *Naturalj *Healthyj *Organicj *Naturalj*Healthyj*Organicj These effects are illustrated in figure 41. Each one unit increase in price lowers purchase intention by 3.03%, implying a 2*3.03 = 6.06% increase in purchase intention when price falls from $4.98 to $2.98. Addition of a healthy label increases purchase intention by 1.88% relative to no label being present, whereas addition of a natural label increased purchase intention by 3.87% on average, and addition of an organic label increases purchase intention by 6.22%. The three-way interaction term shows the joint effect when all three labels were present. The estimated coefficient implies that the joint effect of all three labels was to reduce purchase intention by 4.26% relative to what would have been expected from the sum of the individual effects. In other words, healthy, natural, and organic labels are partial substitutes for consumers. Average willingness-to-pay values are reported in figure 42. On average, consumers choices imply they are willing to pay $0.62 more per box when a healthy label was present, $1.28 more per box when a natural label was present, and $2.05 when an organic label was present. The willingness-to-pay value when all three labels were present, $2.54, was $1.40 lower than the value that would be expected from the individual sum of the three labels ($0.62+$1.28+$2.05 = $3.95). Thus, when all three labels appear in combination, the implied willingness-to-pay premium was 36% lower (-1.40/3.99=0.355) than the sum of the willingness-to-pay values when the three labels appeared in isolation. This implies that consumers perceived natural, healthy, and organic labels as partial substitutes for one another. To see this, note that the willingness-to- 50
55 pay for organic label alone was $2.05 but the willingness-to-pay premium when all three labels are present was $2.54. This leaves $2.54-$2.05=$0.49 of extra premium resulting from both the natural and healthy labels, but $0.49 was less than the willingness-to-pay values when either natural alone was labeled ($1.28) or healthy alone was labeled ($0.62). Thus, an organic label must signal to a consumer that a product is partially natural and healthy (the organic seal itself was only providing $0.49 in value above and beyond what was implied by the natural and heathy labels). An alternative interpretation is that a natural label signals to consumers that the product is partially organic and healthy. The estimates in figures 41 and 42 relate to the average effects across all consumers, but there are likely to be different consumer segments that are unique with respect to how they make tradeoffs between price changes and labels. To explore this possibility, latent class regressions were estimated. The best fitting model was one that included seven consumer segments. Table 4 reports the estimated regression coefficients for each class/segment indicating the relationship between prices/labels and purchase intention. The largest group, representing 34.7% of respondents, consists of a group of consumers who pay attention to prices and all labels and are willing to make tradeoffs between each of these. Group or segment two represents 20.2% of respondents. These consumers have an overall high likelihood of purchasing cereal (intercept is 74.7%), and while they are sensitive to price changes and the presence of the organic label, other labels did not have as significant effect on purchase intention. The third segment (12.9% of respondents) did not significantly alter purchase intentions when healthy labels were present, but were otherwise responsive to other changes. Segments 4 and 6 had overall low likelihoods of buying cereals (only 7.5% and 0.9%) and were relatively unmoved by cereal attributes. By contrast, segment 7 had a high certainty of buying cereal (96.9%) irrespective of the price or presence of labels. Segment 5 consists of consumers whose purchase intentions were only influenced by the presence of the organic label. Table 5 shows the demographic characteristics of the consumers most likely to belong to each of the seven purchasing segments. Segment 5 (organic watching indifferent buyers) had the highest share of women at 59.5%, whereas segment 7 (non-reactive cereal buyers) was comprised of 43.7% women - the lowest of any segment. Segment 1 was comprised of 33.5% younger consumers (younger than 34 years of age) whereas segment 2 was comprised of only 16.7% consumers under aged 34. Other demographic effects are similarly interpreted. 51


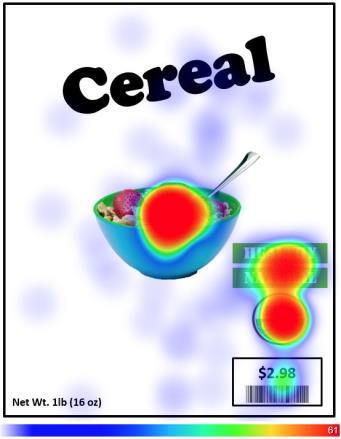


56 Figure 38. Heat maps associated with most attractive area of 10 cereal boxes 52


57 Figure 39. Heat maps associated with least attractive area of 10 cereal boxes 53
PERSPECTIVE A HEALTHY 2017 FOOD & HEALTH SURVEY
 A HEALTHY PERSPECTIVE Healthy is often at the heart of our discussions about food. Still, how Americans think about healthy in the context of dietary decisions remains hotly debated. Defining Healthy Health-promoting
Food Labeling Survey ~ January 2019
 Food Labeling Survey ~ January 2019 1 Introduction Research Objective Understand consumer attitudes towards healthy labels and different food packaging aspects that drive purchase behavior. Sampling Research
IFIC Foundation Survey
 IFIC Foundation Survey Research with Consumers To Test Perceptions and Reactions To Various Stimuli and Visuals Related to Bioengineered Foods June 2018 1 Introduction Research Objectives Measure consumers
Panel on Defining Healthy and Natural
 Panel on Defining Healthy and Natural Panelists: Shirley Blakely, Janet Collins, and Tony Pavel Moderator: Mary Christ-Erwin This image cannot currently be displayed. Natural What is Natural? From a food
May 6, Division of Dockets Management (HFA-305) Food and Drug Administration 5630 Fishers Lane, Rm Rockville, MD 20852
 Food and Drug Administration 5630 Fishers Lane, Rm Rockville, MD 20852") May 6, 2016 Division of Dockets Management (HFA-305) Food and Drug Administration 5630 Fishers Lane, Rm. 1061 Rockville, MD 20852 Submitted electronically via www.regulations.gov Re: Docket No. FDA-2014-N-1207
May 6, 2016 Division of Dockets Management (HFA-305) Food and Drug Administration 5630 Fishers Lane, Rm. 1061 Rockville, MD 20852 Submitted electronically via www.regulations.gov Re: Docket No. FDA-2014-N-1207
FooDS Food Demand Survey Issue 9: January 17, 2014
 FooDS Food Demand Survey Issue 9: January 17, 2014 About the Survey FooDS tracks consumer preferences and sentiments on the safety, quality, and price of food at home and away from home with particular
Nutritional Labeling. University of Connecticut. Emily J. Williams University of Connecticut - Storrs,
 University of Connecticut DigitalCommons@UConn Honors Scholar Theses Honors Scholar Program Spring 5-8-2011 Nutritional Labeling Emily J. Williams University of Connecticut - Storrs, emjw718@gmail.com
Chapter 5: Section 5
 Chapter 5: Section 5 Health Terms Food additives substances added to food intentionally to produce a desired effect. Enriched food a food in which nutrients that were lost in the processing have been added
Article begins on next page
 Public Perceptions of Labeling Genetically Modified Foods Rutgers University has made this article freely available. Please share how this access benefits you. Your story matters. [https://rucore.libraries.rutgers.edu/rutgers-lib/46835/story/]
HEALTH TRANS OMEGA-3 OILS BALANCE GOOD FAT PROTEIN OBESITY USAGE HABITS
 HEALTH TRANS OMEGA-3 OILS BALANCE GOOD FAT PROTEIN OBESITY USAGE HABITS think 15TH ANNUAL consumer attitudes about nutrition Insights into Nutrition, Health & Soyfoods eat Consumer Attitudes about Nutrition
David Fikes, FMI VP Communica6ons & Consumer Affairs
 Solving X in the New Consumer Value Equa:on of Food Purchase Decisions Consumer Beliefs, Knowledge and Willingness-to-Pay for Sustainability-Related Poultry Produc:on Prac:ces David Fikes, FMI VP Communica6ons
CONSUMER ATTITUDES ABOUT NUTRITION
 SOY OBESITY HEART HEALTH GOOD FATS NUTRITION OIL TRANS FAT USAGE BALANCE CONSUMER ATTITUDES ABOUT NUTRITION Insights into Nutrition, Health and Soyfoods TOFU AWARENESS 2006 13 TH ANNUAL NATIONAL REPORT
2012 Food & Health Survey
 I N T E R N A T I O N A L F O O D I N F O R M A T I O N C O U N C I L F O U N D A T I O N Consumer Attitudes Toward Food Safety, Nutrition & Health May 2012 METHODOLOGY An online survey was conducted with
The Law Behind Food Labels 11/28/2016. Nutrition Facts Updates
 Sponsor Disclosure: Support for this presentation was provided by the Foodservice Express division of Med-Diet, Inc. The material herein is for educational purposes only. Reproduction or distribution of
2017 FOOD & HEALTH SURVEY A Focus on Older Adults Funded by
 A Focus on Older Adults 50-80 TABLE OF CONTENTS Background & Methodology 3 Demographics 4 Healthy Eating 7 Food Confusion 23 Packaged Foods 32 Food Values 37 Background The International Food Information
Aim for a healthy weight. Be physically active each day.
 Diet Principles and Dietary these two items should be considered each time we make a choice of what goes into our mouth Guidelines Diet Planning 6 basic diet planning principles adequacy enough energy
Test date Name Meal Planning for the Family Study Sheet References: Notes in class, lectures, labs, assignments
 Test date Name Meal Planning for the Family Study Sheet References: Notes in class, lectures, labs, assignments Food for Today - Chapters 3.1, 3.2, 12.1,2,3 World of Food - Chapters 3, 5, 8 1. Know the
Food Labeling & Its Legal Requirements
 20 th Annual IAOM MEA District Conference October 23-26, 2009, Antalya - Turkey Food Labeling & Its Legal Requirements Dr. Irfan Hashmi & Ajmal Safee Nutrition Labeling- a legal requirement Nutrition Labeling
Survey Reveals Powerful Consumer Sentiments on Various Food Label Statements, Vermont GMO Labeling Mandate Most Disparaging
 Survey Reveals Powerful Consumer Sentiments on Various Food Label Statements, Vermont GMO Labeling Mandate Most Disparaging The large consumer survey, conducted by the MSR Group tested how consumers understood
An FDA Update: Sugary Ingredients' Impact on Added Sugar Labeling
 An FDA Update: Sugary Ingredients' Impact on Added Sugar Labeling October 23, 2018 Lauren Swann, MS, RD, LDN Concept Nutrition, Inc. Sugars Labeling Total Sugars Nutrition Labeling & Education Act of 1990
Department of Nutrition, University of California, Davis; University of California Agriculture and Natural Resources
 Labels Food The United States Food and Drug Administration requires most packaged foods and beverages to have a Nutrition Facts label to help consumers make informed choices about the foods they eat. Serving
FDA Hearing on the Labeling Food from AquAdvantage Salmon September 21, 2010
 FDA Hearing on the Labeling Food from AquAdvantage Salmon September 21, 2010 Presentation by Gregory Jaffe Biotechnology Project Director Center for Science in the Public Interest Before I begin the substantive
Decoding Food Labels. Karen Bryla McNees, Ed.D., R.D. UK Health & Wellness Program March 1, 2012
 Decoding Food Labels Karen Bryla McNees, Ed.D., R.D. UK Health & Wellness Program March 1, 2012 What We ll Cover Basic anatomy of a food label Most common traps on a food label Strategies to cut through
Eating in America. Sooyoung Uhm, RD, LD Student Health Services Jan 2019
 Eating in America Sooyoung Uhm, RD, LD Student Health Services Jan 2019 American eating habits Standard American diet (SAD): excess consumption of refined carbohydrates, fatty meats and added fats that
Avocado Tracking Study
 Avocado Tracking Study 2015 Audience Analysis Prepared by: Hass Avocado Board 230 Commerce, Suite 190 Irvine, CA 92605 www.hassavocadoboard.com Contents Background 3 Summary 6 Detailed Findings Audience
2017 Label Insight Shopper Trends Survey
 2017 Label Insight Shopper Trends Survey KEY FINDINGS WHAT IMPACTS SHOPPER CHOICES? Nearly half of consumers say that food allergies, intolerances, or sensitivities impact the way they shop for food items.
October 11, Dockets Management Staff (HFA-305) Food and Drug Administration 5630 Fishers Lane, Rm Rockville, MD 20852
 Food and Drug Administration 5630 Fishers Lane, Rm Rockville, MD 20852") October 11, 2018 Dockets Management Staff (HFA-305) Food and Drug Administration 5630 Fishers Lane, Rm. 1061 Rockville, MD 20852 Re: The Food and Drug Administration s Comprehensive, Multi-Year Nutrition
October 11, 2018 Dockets Management Staff (HFA-305) Food and Drug Administration 5630 Fishers Lane, Rm. 1061 Rockville, MD 20852 Re: The Food and Drug Administration s Comprehensive, Multi-Year Nutrition
September 21, 18. If adaptations were made or activity was not done, please describe what was changed and why. Please be as specific as possible.
 Washington State Snap-Ed Curriculum Fidelity for Continuous Improvement Lesson Assessment Tool for Food Smarts Workshop: Parenting Adult 5 week, 60 minutes Week 4 Setting the Stage for Healthy Choices
MILLENNIALS AND ORANGE JUICE CONSUMPTION
 MILLENNIALS AND ORANGE JUICE CONSUMPTION Yan Heng, PhD and Lisa House, PhD Presented to the International Citrus Beverage Conference Florida Agricultural Market Research Center Food and Resource Economics
Serving Size. Serving size is written using grams, ounces, cups, pieces, etc. Be sure to compare to the servings per container!
 Reading Food Labels Food Labels HIGHLY regulated by the FDA or USDA Food labeling is required for most prepared foods, such as breads, cereals, canned and frozen foods, snacks, desserts, drinks, etc. Nutrition
Shopper s Guide to Safer Food Choices
 Shopper s Guide to Safer Food Choices AVOID Why? CHOOSE THIS INSTEAD The Dirty Dozen* These fruits and vegetables have been found to contain the highest pesticide residues. USDA Organic The Clean Fifteen*
CHILD AND ADULT MEALS
 UPDATED CHILD AND ADULT CARE FOOD PROGRAM MEAL PATTERNS: CHILD AND ADULT MEALS USDA recently revised the CACFP meal patterns to ensure children and adults have access to healthy, balanced meals throughout
Food Science. Grains Unit Handouts
 Food Science Grains Unit Handouts Whole Grains: The Inside Story Article Questions 1. How many servings of whole grains does the USDA recommend is consumed each day? a. How many servings does the average
Voluntary labelling and claims
 Heading 16 Heading What types of information can be added voluntarily to food labelling to promote the product? 1 Heading Certain pieces of information are often included on food labels but are not required
Health. and the BODY
 Health and the BODY 1 Corinthians 3:16-17 Do you not know that you are God's temple and that God's Spirit dwells in you? If anyone destroys God s temple, God will destroy him. For God s temple is holy,
READING FOOD LABELS: A GREAT TWO MINUTE DRILL
 ELEMENTARY SCHOOL LESSON READING FOOD LABELS: A GREAT TWO MINUTE DRILL OBJECTIVES: 1. Why are food labels important? 2. Parts of a food label: a. Serving size b. Servings per container c. Calories d. Sugar
What Food Labels Tell Us. A Counseling Tool For Health Professionals
 What Food Labels Tell Us A Counseling Tool For Health Professionals Dear Health Professional: As a health professional, you are aware that the U.S. Food and Drug Administration and the U.S. Department
FDA NUTRIENT CONTENT CLAIM GUIDELINES
 FDA NUTRIENT CONTENT CLAIM GUIDELINES AG BM 302 Food Products Marketing Prof. Colby Penn State University From Guidance for Industry: A Food Labeling Guide (Appendix A: Definitions of Nutrient Content
It Is All About Food. International Food Information Council Foundation. Framework for Healthful Eating:
 Framework for Healthful Eating: The 2010 Dietary Guidelines for Americans, MyPlate, and Consumer Insight VSFA / Virginia Tech Nutrition Cow College Roanoke, VA February 15, 2012 Presented by : Marianne
Consumer Sodium Research
 Consumer Sodium Research Concern, Perceptions and Action April 2009 125 CambridgePark Drive Cambridge, MA 02140 www.cogentresearch.com TABLE OF CONTENTS 2 OBJECTIVES & METHODOLOGY EXECUTIVE SUMMARY RESEARCH
4. Which of the following is not likely to contain cholesterol? (a) eggs (b) vegetable shortening (c) fish (d) veal
 eggs (b) vegetable shortening (c) fish (d) veal") Sample Test Questions Chapter 6: Nutrition Multiple Choice 1. The calorie is a measure of (a) the fat content of foods. (b) the starch content of foods. (c) the energy value of foods. (d) the ratio of
Sample Test Questions Chapter 6: Nutrition Multiple Choice 1. The calorie is a measure of (a) the fat content of foods. (b) the starch content of foods. (c) the energy value of foods. (d) the ratio of
IFIC Foundation Food Label Consumer Research Project: Qualitative Research Findings
 : Qualitative Research Findings Introduction Today s food labels provide nutrition information to help consumers make food choices to achieve a healthful diet. The Nutrition Facts Panel (NFP) contains
Reading Food Labels A few questions before we start. Questions Continued. After this session, you will be able to:
 A few questions before we start Reading Food Labels 1. A healthy food might have lots of: a) Cholesterol b) Sugar c) Fibre d) Saturated fat Questions Continued 2. Fibre is healthy because it: a) Helps
Reflections on the 2010 Dietary Guidelines. Minnesota School Nutrition Association August 3, 2011
 Reflections on the 2010 Dietary Guidelines Minnesota School Nutrition Association August 3, 2011 Karen Wilder, RD, MPH, LD Director, Scientific & Regulatory Affairs The Schwan Food Company Today s Agenda
SUPPORT STAFF TRAINING TOOLS MAINTAINING HEALTH. THE HEALTHY MENU (Including the MyPlate Information)
") SUPPORT STAFF TRAINING TOOLS MAINTAINING HEALTH THE HEALTHY MENU (Including the MyPlate Information) Training Program Specialists, LLC 9864 E. Grand River, Suite 110-320 Brighton, Michigan 48116 Phone:
SUPPORT STAFF TRAINING TOOLS MAINTAINING HEALTH THE HEALTHY MENU (Including the MyPlate Information) Training Program Specialists, LLC 9864 E. Grand River, Suite 110-320 Brighton, Michigan 48116 Phone:
2. Tell when and why the Nutrition Facts label was introduced.
 Welcome to Nutrition Facts Labels class! Choosing and preparing foods which meet the needs of many children and adults can be a mystery at times, but we can take a clue from Nutrition Labels. Use the Participant
Nutrition Facts Serving Size: 3 OZ (84g) Servings Per Container: About 161
 Servings Per Container: About 161") Tyson Wei Café Breaded Made with Whole Muscle Dark Meat Chunks Product Code: 24450-928 UPC Code: 00023700037527 Available for commodity reprocessing - USDA 100103 Made with whole muscle dark meat that
Tyson Wei Café Breaded Made with Whole Muscle Dark Meat Chunks Product Code: 24450-928 UPC Code: 00023700037527 Available for commodity reprocessing - USDA 100103 Made with whole muscle dark meat that
Reading Labels: If You Really Have to Buy Something Processed
 Reading Labels: If You Really Have to Buy Something Processed Organic whole foods are now available in packages, cans, and boxes. They tend to be found in whole-foods stores or the health-food section
Eating Well as We Age
 Eating Well as We Age Wheat Bread Nutrition Facts Serving Size 2 slices (56g) Servings Per Container 10 Calories 140 Calories from Fat 10 Amount/serving Total Fat 1.5g Saturated Fat 0g Cholesterol0mg Sodium
UNIT 3, Reading Food Labels Scenario 2 READING FOOD LABELS
 READING FOOD LABELS Anna's new family has learned a lot about nutrition. Bill and his children now eat differently. Now they eat more healthful foods. Bill eats more than just meat, potatoes, and desserts.
Pan-European consumer research on in-store observation, understanding & use of nutrition information on food labels,
 4 EUFIC Forum N 4 February 2009 Pan-European consumer research on in-store observation, understanding & use of nutrition information on food labels, combined with assessing nutrition knowledge February
SHOPPING FOR HEALTH 2009
 SHOPPING FOR HEALTH 2009 WHAT IT TAKES TO EAT HEALTHY Cary Silvers Director of Consumer Insights Whole Grains Council 4.21.09 Cross-roads at the Supermarket Higher food prices Down economy Low consumer
Re: National Bioengineered Food Disclosure Standard; Proposed Rule; Request for Comments, 83 Fed. Reg (May 4, 2018), Docket No.
, Docket No.") VIA ELECTRONIC SUBMISSION July 3, 2018 Dockets Management Staff (HFA-305) Food and Drug Administration 5630 Fishers Lane, Rm. 1061 Rockville, MD 20852 Re: National Bioengineered Food Disclosure Standard;
VIA ELECTRONIC SUBMISSION July 3, 2018 Dockets Management Staff (HFA-305) Food and Drug Administration 5630 Fishers Lane, Rm. 1061 Rockville, MD 20852 Re: National Bioengineered Food Disclosure Standard;
A NATURAL EXPERIMENT: CLAIMS, Consumers, and CASES. Neal Hooker, Christopher Simons, Efthimios Parasidis. Efthimios Parasidis
 A NATURAL EXPERIMENT: CLAIMS, Consumers, and CASES Neal Hooker, Christopher Simons, Efthimios Parasidis The Ohio State University Efthimios Parasidis Associate Professor of Law and Public Health The Ohio
Eat Well. Live Well. Canada s Food Guide Gets an Overhaul
 What do you eat when you re hungry? Is it something sweet? A product you ve seen advertised? Do you care about the calories, the convenience, or the cost? Do you pick a vegetarian dish? Or do you eat anything
INTRODUCTION. CODEX STANDARD FOR PROCESSED CEREAL-BASED FOODS FOR INFANTS AND CHILDREN 1 CODEX STAN (amended 1985, 1987, 1989, 1991)
") CODEX STAN 74 Page 1 of 7 INTRODUCTION The Codex Standard for Processed Cereal-Based Foods for Infants and Children was adopted by the Codex Alimentarius Commission at its 11th Session in 1976. In 1983,
CODEX STAN 74 Page 1 of 7 INTRODUCTION The Codex Standard for Processed Cereal-Based Foods for Infants and Children was adopted by the Codex Alimentarius Commission at its 11th Session in 1976. In 1983,
DIETARY GUIDELINES FOR AMERICANS EIGHTH EDITION
 DIETARY GUIDELINES FOR AMERICANS 2015-2020 EIGHTH EDITION Executive Summary Over the past century, deficiencies of essential nutrients have dramatically decreased, many infectious diseases have been conquered,
Dietary Guidelines Executive Summary
 Page 1 of 7 2015-2020 Dietary Guidelines Executive Summary In this section: 1. The Guidelines 2. Key Recommendations Over the past century, deficiencies of essential nutrients have dramatically decreased,
Healthy Tips for Grocery Shopping *NOTE*
 Healthy Tips for Grocery Shopping Shop the perimeter of the grocery store, where fresh foods like fruits, vegetables, dairy, meat, and fish are usually located. Avoid the center aisles as much as possible
Whole Grains: Dietary Recommendations, Intake Patterns, and Promotion
 Just Ask for Whole Grains Conference Kansas City, Missouri November 5, 2007 Whole Grains: Dietary Recommendations, Intake Patterns, and Promotion Dr. Robert C. Post, Deputy Director Center for Nutrition
A Food Scientist s Approach to Working with Organics
 A Food Scientist s Approach to Working with Organics Sharon Herzog October 29-30, 2013 www.globalfoodforums.com/cleanlabel Overview Background - Country Choice Organic - Natural and Organic Market What
The Best Potato Chip for Young People: A Feasibility Report
 The Best Potato Chip for Young People: A Feasibility Report Prepared for University of North Texas Students Prepared by Alexander Mulcahey Shahrokh Yousefi-Darani Thomas Daly Michael Hill December 2012
Food & Supplement Labels
 Food & Supplement Labels Food Labels List of Ingredients Nutrition Facts Panel Claims Supplement Regulations & Claims DSHEA Food Certifications Organic & Fair Trade List of Ingredients Listed in descending
eat well, live well: EATING WELL FOR YOUR HEALTH
 eat well, live well: EATING WELL FOR YOUR HEALTH It may seem like information on diet changes daily, BUT THERE IS ACTUALLY A LOT WE KNOW ABOUT HOW TO EAT WELL. Eating well can help you improve your overall
m-neat Convenience Stores
 Convenience Stores (i.e. Shoppettes) Data Collection / Instruction Guide These measures are designed to rate the nutrition environment of the convenience stores. The basic principle of these measures is
2013 Food & Health Survey
 2013 Food & Health Survey Consumer Attitudes Toward Food Safety, Nutrition & Health May 2013 I N T E R N A T I O N A L F O O D I N F O R M A T I O N C O U N C I L F O U N D A T I O N An online survey was
Answering the question- Why Should You Care What You Are Eating???
 Answering the question- Why Should You Care What You Are Eating??? Never eat more than you can lift. - Miss Piggy Portion Distortion 6 Main Nutrients Vitamins Minerals Water Carbohydrates Protein Fat Keep
RESEARCH WITH MILLENNIALS: EXECUTIVE SUMMARY
 RESEARCH WITH MILLENNIALS: EXECUTIVE SUMMARY Prepared for: THE BEEF CHECKOFF 9000 E. Nichols Ave., Suite 215 Centennial, CO 80112 Prepared by: SHUGOLL RESEARCH 7475 Wisconsin Avenue, Suite 200 Bethesda,
Food Labeling Enforcement and Compliance Priorities in the Current Environment
 Food Labeling Enforcement and Compliance Priorities in the Current Environment Veronica Colas, Senior Associate April 12, 2018 Role of FDA Regulations and Guidance in Class Action Litigation Why Class
Food Label Reading and Application Sahra Pak, MS, RD
 Food Label Reading and Application Sahra Pak, MS, RD Nutrition & Physical Activity Program Division of Chronic Disease & Injury Prevention Department of Public Health Objectives 1. Understand and identify
FDA Regulation of Claims on Dietary Supplement and Food Products
 FDA Regulation of Claims on Dietary Supplement and Food Products Patricia Kaeding August 2004 Topics FDA Overview What are claims Why claims matter Categories of claims Regulatory requirements for types
HEALTHY EATING ON A BUDGET Eat Well (and Save Well)
") HEALTHY EATING ON A BUDGET Eat Well (and Save Well) First of all. What is healthy eating? A healthy eating plan gives your body the nutrients it needs every day while staying within your daily calorie
HEALTHY EATING ON A BUDGET Eat Well (and Save Well) First of all. What is healthy eating? A healthy eating plan gives your body the nutrients it needs every day while staying within your daily calorie
Fresh Ideas. Fiscal Year 2018 Trimester 2. Crediting Grain Products on the Food Program: An Update (program meal patterns, recordkeeping)
") 1 Fiscal Year 2018 Trimester 2 Adults & Children s Alliance, 2021 East Hennepin Avenue, Ste. LL20, Minneapolis, MN 55413 On the Web at acainc.org E-mail cacfp@acainc.org Phone 651-481-9320 800-433-8108
1 Fiscal Year 2018 Trimester 2 Adults & Children s Alliance, 2021 East Hennepin Avenue, Ste. LL20, Minneapolis, MN 55413 On the Web at acainc.org E-mail cacfp@acainc.org Phone 651-481-9320 800-433-8108
Here are the biggest offenders of 'healthy foods' that aren't so healthy.
 Marketing and the Illusion of Healthy Foods Healthy foods are the latest craze of consumers. It seems like we re reaching for any label that says low-fat, fat-free, no trans fat, gluten-free, all-natural,
STRETCHING YOUR FOOD $ Leader Lesson
 STRETCHING YOUR FOOD $ Leader Lesson YOUR BEST MONEY SAVING TIP Discuss your best money saving tips for grocery shopping with the 3-4 people around you Everyone decide which is the best tip and share it
NUTRITION 101 & CLEAN EATING
 NUTRITION 101 & CLEAN EATING Macro-Nutrients vs Micro-Nutrients NUTRIENTS Carbohydrates 4 Calories/gram Fiber Fats 9 Calories/gram Proteins 4 Calories/gram Alcohol: 7 calories/gram NUTRITION LABEL Required
Healthier Oils Support Emerging Regulations. May 16, 2011
 Healthier Oils Support Emerging Regulations May 16, 2011 Today s Presenters David Dzisiak Dr. Roger Clemens Debe Nagy-Nero, MS, RD This program has been approved by the Commission on Dietetic Registration
A Classic, now with MORE CHEESE!
 Samples Type Serving Size # Of Servings In Sample Case Weight Frozen or Dry States or Regions Available The MAX Real Slice Extra Cheese Buffalo Chicken Pizza (77387-12619) Lunch, Ala carte 4.80 oz 8 servings
VENN DIAGRAM. November Appendix
 VENN DIAGRAM Thanksgiving Today First Thanksgiving NOVEMBER Soybean Information Sheet Soy products come from the soybean, a legume native to northern China. The United States is now the world s largest
Chapter 2. Planning a Healthy Diet
 Chapter 2 Planning a Healthy Diet Principles and Guidelines Diet Planning Principles Adequacy Sufficient energy Adequate nutrients for healthy people Balance Enough but not too much kcalorie (energy) control
FDA EXTENDS PUBLIC COMMENT PERIOD ON PROPOSAL TO DEFINE NATURAL FOR FOOD LABELING PURPOSES By Richard Blau
 FDA EXTENDS PUBLIC COMMENT PERIOD ON PROPOSAL TO DEFINE NATURAL FOR FOOD LABELING PURPOSES By Richard Blau The FDA has extended the deadline for receiving public comments regarding the need for promulgation
The Science of Nutrition, 4e (Thompson) Chapter 2 Designing a Healthful Diet
 Chapter 2 Designing a Healthful Diet") Science of Nutrition 4th Edition Thompson Test Bank Full Download: http://testbanklive.com/download/science-of-nutrition-4th-edition-thompson-test-bank/ The Science of Nutrition, 4e (Thompson) Chapter
Science of Nutrition 4th Edition Thompson Test Bank Full Download: http://testbanklive.com/download/science-of-nutrition-4th-edition-thompson-test-bank/ The Science of Nutrition, 4e (Thompson) Chapter
Healthy Choices in a Healthy Diet. Feed them this not that! Presented By Dr. Sharon Young
 Healthy Choices in a Healthy Diet Feed them this not that! Presented By Dr. Sharon Young Objectives Factors that lead to obesity FDA food pyramid what does it mean? What is a practical portion size What
Nutrition information provided on food labels. Understanding Nutrition Labelling to Make Informed Food Choices. Since 2005
 Understanding Nutrition Labelling to Make Informed Food Choices Nutrition information provided on food labels Nutrition Facts Ingredient List INGREDIENTS: Whole wheat, wheat bran, sugar/glucose-fructose,
HEALTHY EATING. What you need to know for a long and healthy life. March National Nutrition Month
 HEALTHY EATING What you need to know for a long and healthy life March National Nutrition Month 890246 This presentation is for informational purposes only. Material within this presentation should not
CHOOSE HEALTH: FOOD, FUN, AND FITNESS. Read the Label!
 POSTER 1-1: REPLACE SWEETENED DRINKS Read the Label! Nutrition Facts 20 oz. cola Serving Size: 1 bottle (591mL) Servings Per Container: 1 Amount Per Serving Calories 240 Calories from Fat 0 % Daily Value
GUIDE TO HEALTHY SHOPPING WITH DIABETES FOR MORE INFORMATION, VISIT CDIABETES.COM: THE COSTCO DIABETES WEBSITE
 GUIDE TO HEALTHY SHOPPING WITH DIABETES Please note: Product selection may vary between Costco Wholesale locations DIVIDE YOUR CART. MAKE HEALTHIER FOOD CHOICES. Apply MyPlate principles to your cart.
Food and Nutrition at the Queen Victoria Market
 Food and Nutrition at the Queen Victoria Market Introduction to food and nutrition at the Queen Victoria Market On any full market day, shoppers can choose from 80 fruit and vegetable traders, 34 delicatessens,
Nutrition Basics. Chapter McGraw-Hill Higher Education. All rights reserved.
 Nutrition Basics Chapter 12 1 The Body s Nutritional Requirements Essential nutrients The Six Essential Nutrients: Proteins, Fats, Carbohydrates, Vitamins, Minerals, Water Defined as : Nutrients one must
Nutrition and You: Trends 2008
 Nutrition and You: Trends 2008 FOR RELEASE OCTOBER 26, 2008 Media contact: Jennifer Starkey, Tom Ryan 800/877-1600, ext. 4802, 4894 media@eatright.org SUMMARY OF FINDINGS: AMERICAN DIETETIC ASSOCIATION
SMOOTHIES GEORGIA 4-H COTTON BOLL AND CONSUMER JUDGING 2016
 SMOOTHIES GEORGIA 4-H COTTON BOLL AND CONSUMER JUDGING 2016 Smoothies have become a popular choice for snacks and meals. While once something that you could only get from your home blender and a few basic
AWASH - Consumer survey findings SURVEY OF AUSTRALIAN CONSUMER AWARENESS AND PRACTICES RELATING TO SALT REPORT
 2007 SURVEY OF AUSTRALIAN CONSUMER AWARENESS AND PRACTICES RELATING TO SALT REPORT Prepared by: The Secretariat of the Australian Division of World Action on Salt and Health This report was published in
Food labels simplified
 Food labels simplified Cut through the hype on packaging to focus on the food facts that matter most in managing your diabetes. by Hope S. Warshaw, R.D., CDE photos by Blaine Moats 64 Diabetic Living winter
Understanding Nutrition Labelling to Make Informed Food Choices
 Understanding Nutrition Labelling to Make Informed Food Choices Nutrition information provided on food labels Nutrition Facts INGREDIENTS: Whole wheat, Ingredient List Nutrition Claims Health Claims wheat
10 th Seminar on. Nutrition Labeling, Claims and Communication Strategies. Nutrition Labelling and Claims in India An Update
 10 th Seminar on Nutrition Labeling, Claims and Communication Strategies August 28 29, 2018 Renaissance Hotel, Kuala Lumpur, Malaysia Nutrition Labelling and Claims in India An Update Organizers Co-organizer
Purchasing Patterns for Nutritional-Enhanced Foods: The case of Calcium-Enriched Orange Juice
 Purchasing Patterns for Nutritional-Enhanced Foods: The case of Calcium-Enriched Orange Juice By Alla Golub, James J Binkley, and Mark Denbaly Dept of Agricultural Economics, Purdue University; (Golub
A LOOK AT WHO IS EATING AVOCADOS? INFORMATION ABOUT CONSUMERS, DRIVERS AND BARRIERS, AND DEMOGRAPHICS 2015 USER SEGMENTATION ANALYSIS
 A LOOK AT WHO IS EATING AVOCADOS? INFORMATION ABOUT CONSUMERS, DRIVERS AND BARRIERS, AND DEMOGRAPHICS 2015 USER SEGMENTATION ANALYSIS HASS AVOCADO BOARD TABLE OF CONTENTS Tracking Study Consumer Groups
Kaiser Permanente Healthy Eating Environment
 Kaiser Permanente Healthy Eating Environment Kaiser Permanente aspires to improve the health of our members, employees, our communities and the environment by increasing access to fresh, healthy food in