Balancing the Sugar-Fat Seesaw:
|
|
|
- Erik Perkins
- 5 years ago
- Views:
Transcription

1 Balancing the Sugar-Fat Seesaw: Understanding the relatives roles played in obesity Dr Carlos Celis-Morales Institute of Cardiovascular and Medical Sciences University of Glasgow
2
3
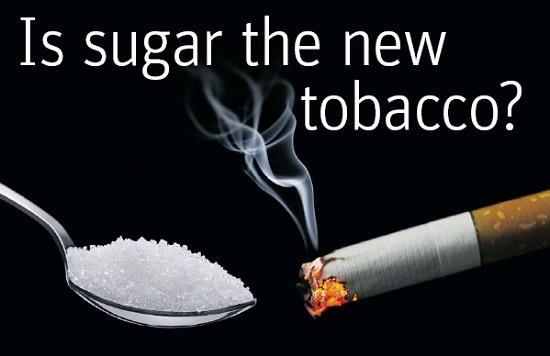
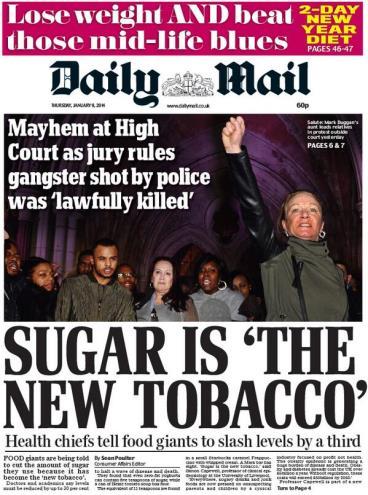
4 Sugar versus Fat: Who is the evil? Sugar is apparently the enemy. More so than fat or calories themselves, sugar is considered the most dangerous thing you can consume and has been compared, even by scientists, to heroin.
5 Executive Summary Observational data from 19.2 millions participants worldwide 1975 BMI: 21.7 kg.m -2 = 62.7 kg (1.7 m height (5.6 foot) Trends in adult body-mass index in 200 countries from 1975 to 2014: a pooled analysis of 1698 population-based measurement studies with 19 2 million participants, The Lancet, April 2016
6 Executive Summary Observational data from 19.2 millions participants worldwide BMI: 21.7 kg.m -2 = 62.7 kg (1.7 m height (5.6 foot) BMI: 24.2 kg.m -2 = 70.1 kg (1.7 m height (5.6 foot) Trends in adult body-mass index in 200 countries from 1975 to 2014: a pooled analysis of 1698 population-based measurement studies with 19 2 million participants, The Lancet, April 2016
7 Executive Summary Observational data from 19.2 millions participants worldwide BMI: 21.7 kg.m -2 = BMI: 24.2 kg.m -2 = 62.7 kg (1.7 m height (5.6 foot) kg 70.1 kg (1.7 m height (5.6 foot) Trends in adult body-mass index in 200 countries from 1975 to 2014: a pooled analysis of 1698 population-based measurement studies with 19 2 million participants, The Lancet, April 2016
8 Executive Summary Obesity (%) 3.2 to 10.8 Men 6.4 to 14.9 Women Trends in adult body-mass index in 200 countries from 1975 to 2014: a pooled analysis of 1698 population-based measurement studies with 19 2 million participants, The Lancet, April 2016
9 Prevalence in the UK from 1980 to 2014
10 Prevalence in the UK from 1980 to 2014

11 Prevalence in the UK from 1980 to 2014
12 Prevalence in the UK from 1980 to 2014
13 Prevalence in the UK from 1980 to 2014
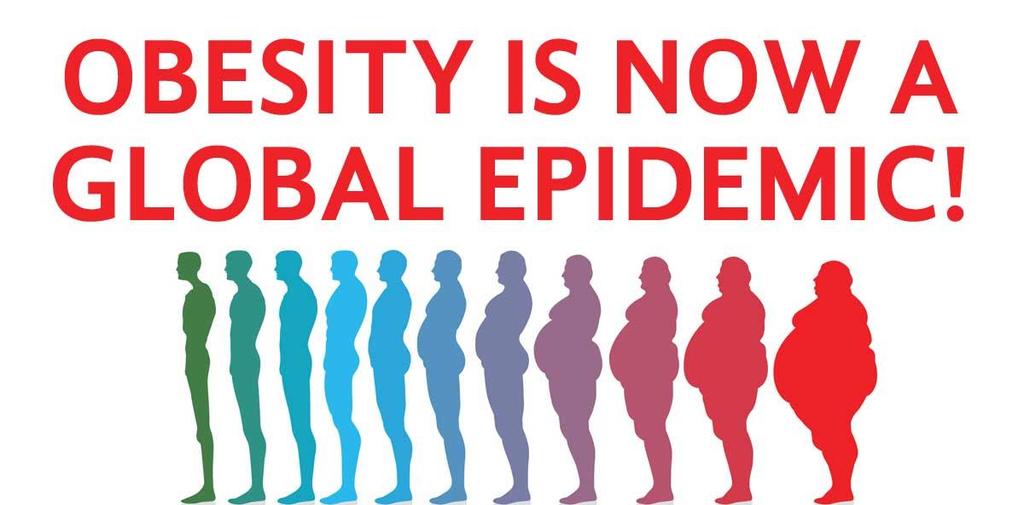
14 Prevalence in the UK from 1980 to 2014 More than 50% of the UK population was overweight or obese by 2010

15 Source: NHS Choices Your Health, Your Choices Prevalence in the UK
16 Sugar has been targeted as Public Enemy No. 1 in the fight against obesity. But is it really where we should be placing all the blame?

17
18 SACN Carbohydrates and Health report Headlines based on evidence reviewed in SACN report: higher consumption of sugars and sugars containing food is associated with a greater risk of tooth decay; increasing or decreasing total energy (calorie) intake from sugars leads to a corresponding increase or decrease in energy intake;


19 Headlines based on evidence reviewed in SACN report: Consumption of sugars-sweetened drinks* results in greater weight gain and increases in BMI in children and adolescents; Greater consumption of sugarssweetened drinks is associated with increased risk of type 2 diabetes.

20 SACN Carbohydrates and Health report This led to the following recommendations from SACN: Average intake across the UK population of free sugars should not exceed 5% of total dietary energy intake for age groups from 2 years upwards; The consumption of sugars-sweetened drinks should be minimised in children and adults.
21 SACN Carbohydrates and Health report


 when naturally present in milk")
22 What are free sugars? All sugars added to foods by the manufacturer, cook or consumer, plus sugars naturally present in honey, syrups and unsweetened fruit juice. What sugars do not count as free sugar? Lactose (the sugar in milk) when naturally present in milk and milk products and the sugars contained within the cellular structure of foods (e.g. fruit and vegetables).
 and around twice the maximum recommended level in adults (12.")
23 UK sugar intake compared to the recommended maximum of 5% of total energy Current estimates of UK sugar intakes from the National Diet and Nutrition Survey programme (NDNS) show that mean intakes are three times higher than the new 5% maximum recommended level in school-aged children and teenagers (14.7% to 15.6% of energy intake) and around twice the maximum recommended level in adults (12.1% of energy intake)
24 Contributors to sugar intake in the UK children aged 4 to 18 years Soft drinks (excluding fruit juice) are the largest single source of sugar for children
25 Contributors to sugar intake in the UK children aged 4 to 18 years Soft drinks provide 29% of daily sugar intake, on average, for this age group as a whole

26 Contributors to sugar intake in the UK children aged 4 to 18 years For younger children the major sources of sugar intake are: 1. soft drinks 2. biscuits 3. buns 4. cakes 5. Pastries and puddings 6. breakfast cereals 7. confectionery 8. fruit juice Soft drinks provide 29% of daily sugar intake, on average, for this age group as a whole
27 Contributors to sugar intake in the UK Adults aged years

28 Contributors to sugar intake in the UK Adults aged years For adults the major sources of sugar intake are: 1. table sugar 2. Biscuits 3. Buns 4. Cakes 5. pastries and puddings 6. soft drinks Alcoholic drinks also contribute to sugar intake in adults
29 Azaïs-Braesco et al. Nutrition Journal (2017) 16:6
30 Sugar intake in European countries - Adults Azaïs-Braesco et al. Nutrition Journal (2017) 16:6 In all countries and at all ages, women/girls had a lower intake in sugars than men, when expressed in g/day
31 Sugar intake in European countries - Adults Azaïs-Braesco et al. Nutrition Journal (2017) 16:6 In all countries and at all ages, women/girls had a lower intake in sugars than men, when expressed in g/day, but this difference disappeared when the sugar contribution to the total energy intake was considered, likely reflecting the higher energy intake of males.
32 Contributors to total sugars among adults. Azaïs-Braesco et al. Nutrition Journal (2017) 16:6
33 Contributors to total sugars among adults. Azaïs-Braesco et al. Nutrition Journal (2017) 16:6 Sweet products were major contributors to the intake of total sugars in all countries and across genders and ages.
 16:6 F&V were major contributors (more than 20% of total sugar intakes) in")
34 Contributors to total sugars among adults. Azaïs-Braesco et al. Nutrition Journal (2017) 16:6 F&V were major contributors (more than 20% of total sugar intakes) in Southern European adults (Spain, Italy and France),
 16:6 Sweet products were major contributors to the intake of total sugars in")
35 Contributors to total sugars among Children. Azaïs-Braesco et al. Nutrition Journal (2017) 16:6 Sweet products were major contributors to the intake of total sugars in all countries and across genders and ages.
36 Contributors to intake of added sugars in adults Azaïs-Braesco et al. Nutrition Journal (2017) 16:6 Sweets products provide between 47% and 61% of the total energy from added sugars Beverages contribute to 12% to 31% of total energy


37 Contributors to intake of added sugars in adults Azaïs-Braesco et al. Nutrition Journal (2017) 16:6 In the UK sweets & beverages contribute to 73% of TE in women and 81% in men
 16:6 Sweets products provide between 40-50% of total energy from added sugars")
38 Contributors to intake of added sugars in Children Azaïs-Braesco et al. Nutrition Journal (2017) 16:6 Sweets products provide between 40-50% of total energy from added sugars Beverages contribute to 20-37% of total energy
39 Total sugars contribute to 15 to 25% of energy supply in several European countries, among which 7.5 to 17% are added sugars or NMES, the highest figure always being for children or teens. From the available data, a large proportion of the European population, especially, but not only children, appears to exceed the 10% WHO threshold.
 and new (eg advergames, social media, online advertising), as well as through sponsorship by food and drinks companies of TV programmes, public amenities and events.")
40 Influencers and food supply role s in promoting sugar intake Children in England are exposed to a high volume of marketing and advertising in many different forms both old (eg TV advertising, radio, cinema, press and billboards) and new (eg advergames, social media, online advertising), as well as through sponsorship by food and drinks companies of TV programmes, public amenities and events. Available research evidence shows that all forms of marketing consistently influence food preference, choice and purchasing in children and adults.


41 Influencers and food supply role s in promoting sugar intake Food retail price promotions are more widespread in Britain than anywhere else in Europe. Foods on promotion account for around 40% of all expenditure on food and drinks consumed at home. Higher sugar products are promoted more than other foods. Price promotions increase the amount of food and drink people buy by around one-fifth.
42 Potential cost savings of achieving SACN s sugar recommendation The majority of the cost savings are realised from reductions in excess body weight and associated ill health.
43
44 Sugar has been targeted as Public Enemy No. 1 in the fight against obesity. But is it really where we should be placing all the blame?
45 Sugar has been targeted as Public Enemy No. 1 in Sugar has been targeted as Public Enemy No. 1 in the fight against the fight obesity. against But obesity. is really But where is it we really should where be placing we all the blame? should be placing all the blame?

46 Executive Summary Observational data from Epidemiological studies
47 Is Sugar to Blame for Obesity? The Numbers Don t Add Up
48 Is Sugar to Blame for Obesity? The Numbers Don t Add Up
49 Is Sugar to Blame for Obesity? The Numbers Don t Add Up

50 Is Sugar to Blame for Obesity? The Numbers Don t Add Up
51 Is Sugar to Blame for Obesity? The Numbers Don t Add Up
52 Mean changes in intakes of added sugars from all sources in children Mean changes in intakes of added sugars from all sources, including discretionary sugars and sugars that were added to processed foods, in Australian children (aged 2 18 y) according to national dietary surveys in 1995 and
53 Mean changes in intakes of added sugars from all sources in children Mean changes in intakes of added sugars from all sources, including discretionary sugars and sugars that were added to processed foods, in Australian children (aged 2 18 y) according to national dietary surveys in 1995 and Added-sugars intake fell 34% in boys (from 96 to 63 g/d) and 26% in girls (from 72 to 53 g/d)
54 The Paradox of Oz: Sugars down, obesity up Country Survey 1 Survey 2 Sugar calories (%) in survey 1 Sugar calories (%) in survey 2 Sugars defined as: Austria Sucrose Denmark / Added Finland Sucrose France 1993/4 2006/ Sugars New Zealand / Sucrose Norway / Added From this data, it is clear that over the last 30 or more years, the intake of sugars, however defined, has not shown any concerted global tend to increase. The above data are for males and the female data is pretty similar. Some countries have data on both sexes combined and again they show no upward trend: Sweden / Sucrose Netherlands 1987/8 2007/ All UK 2000/1 2011/ Added Overall mean Wittekind A & Walton J (2014) Worldwide trends in dietary sugars intake. Nutrition Research Reviews, 27,

55 Evidence from Prospective studies
56 Evidence from observational studies: obesity and sugar intake
 120,877 U.S. women and men Free of chronic diseases and not obese at baseline Follow-up periods from 12 to 20 years")
57 Evidence from observational studies: obesity and sugar intake Prospective investigations involving three separate cohorts (Nurse Healthy Study, Nurse Health Study II and Health Professional study) 120,877 U.S. women and men Free of chronic diseases and not obese at baseline Follow-up periods from 12 to 20 years
58 Relationships between Changes in Food and Beverage Consumption and Weight Changes Every 4 Years, According to Study Cohort. Weight gain associated with increased consumption of refined grains (0.39 lb per serving per day) was similar to that for sweets and desserts (0.41 lb per serving per day).
59 Relationships between Changes in Food and Beverage Consumption and Weight Changes Every 4 Years, According to Study Cohort. Weight gain associated with increased consumption of SSBs (0.98 lb per serving per day) and100%-fruit Juice (0.36 lb per serving per day)
60 Adiposity among UK Biobank participants; contribution of sugar intake vs other macronutrients
61 Body mass index by quintile of percentage of total energy obtained from sugar
62 Body mass index by quintile of percentage of total energy obtained from sugar
63 Body mass index by quintile of percentage of total energy obtained from total sugar
")
64 Fizzy drinks and obesity evidence from the UK Biobank None unit +2 units Fizzy drinks intake (portion per day)

65 Fizzy drinks and visceral fat evidence from the UK Biobank None unit +2 units Fizzy drinks intake (units per day)

66 Evidence from Randomised Controlled Trials
67
68 A Randomized Trial of Sugar-Sweetened Beverages and Adolescent Body Weight 224 adolescents (124 boys and 100 girls) who reported consuming at least one serving (12 oz) per day of sugar-sweetened beverages or 100% fruit juice. A multicomponent intervention was designed to reduce the consumption of sugar-sweetened beverages in the experimental group. The emphasis was on displacing sugar-sweetened beverages with noncaloric beverages in the home as a strategy to decrease consumption. The 1-year intervention consisted of home delivery of noncaloric beverages (e.g., bottled water and diet beverages) every 2 weeks Monthly motivational telephone calls with parents (30 minutes per call), and three check-in visits with participants (20 minutes per visit).
69 A Randomized Trial of Sugar-Sweetened Beverages and Adolescent Body Weight RESULTS At 1 year there were significant between-group differences for changes in BMI ( 0.57, P=0.045) and weight ( 1.9 kg, P=0.04). At 2 years of follow up After an additional 1 year of follow-up without active intervention, the intervention group still had less weight gain than the control group, although the between-group difference was not statistically significant As was expected, the consumption of SSBs in both groups rebounded somewhat after the intervention ceased, suggesting that to achieve long-term benefits, the intervention needs to be sustained over time.
70 A Trial of Sugar-free or Sugar-Sweetened Beverages and Body Weight in Children
71 A Trial of Sugar-free or Sugar-Sweetened Beverages and Body Weight in Children A double-blinded placebo-controlled trial Randomized 641 normal-weight Dutch children to receive: 250 ml (8 oz) per day of a sugar-free, artificially sweetened beverage (sugar-free group) or, a similar sugar-containing beverage that provided 104 kcal per serving (sugar group). 18 months of the intervention
72 A Trial of Sugar-free or Sugar-Sweetened Beverages and Body Weight in Children After 18 months of the intervention, compared with the sugar group, the sugar-free group had significant reductions in BMI z-score weight gain and body fat change. A major advantage of this study is the double-blind design, which avoids potential biases because of psychological cues and social desirability.
73 Is sugar the only evil?

74 Is sugar the only evil?


75 The historically inverse relationship between fat and added sugars intake Published studies* have documented and consumption data** confirms the historically inverse relationship between fat and added sugars intake when expressed as percent of energy in both the United States and the European Union.
76

77 Americans are consuming more than 450 additional calories each day than they were 40 years ago, with these calories coming mostly from refined grains, added fats and oils. That s equivalent to adding a double cheeseburger on to your total calories every day! Comparatively, added sugars contribute only 8 percent (40 calories) to the daily increase in consumption.
78 SACN s analysis reveals that free sugars intake is a dietary factor that increases energy intake in situations where food intake is unrestricted.

79 SACN s analysis reveals that free sugars intake is a dietary factor that increases energy intake in situations where food intake is unrestricted. Decreasing the population intake of free sugars is one step that could be taken to help reduce the current UK overconsumption of energy in relation to energy requirements.

80 Adiposity among UK Biobank participants; contribution of sugar intake vs other macronutrients
81 Body mass index by quintile of percentage of total energy obtained from sugar

82 Body mass index by quintile of percentage of total energy obtained from sugar
83 Body mass index by quintile of percentage of total energy obtained from total sugar
84 Body mass index by quintile of percentage of total energy obtained from total sugar
85 Body mass index by quintile of percentage of total energy obtained from total fat intake

86 Body mass index by quintile of percentage of total energy obtained from total sugar
87 Association between added sugars intake and BMI
88 Association between added sugars intake and BMI
89 Association between added sugars intake and BMI

90 Association between added sugars intake and BMI Data has shown the seesaw effect of restricting individual nutrients only leads to caloric overcompensation with another, whether sugar for fat, or vice-versa.
91 Evidence from observational studies: obesity and sugar intake
92 Relationships between Changes in Food and Beverage Consumption and Weight Changes Every 4 Years, According to Study Cohort. Weight gain associated with increased consumption refined grains lb sweets and desserts lb per serving per day.
93 Relationships between Changes in Food and Beverage Consumption and Weight Changes Every 4 Years, According to Study Cohort. Weight gain associated with increased consumption of high fat foods Potato chips +1.6 lb Fries +1.2 lb Processed meat +1lb


94 What make us fat evidence from a Pan- European study Is it possible to design a better, healthier and more individual diet?
 25 partners from 12 countries What make us fat evidence from a Pan- European")
95 EU FP7 project: Funded for 5 years (2011 to 2015) Led by Mike Gibney (University College Dublin) 25 partners from 12 countries What make us fat evidence from a Pan- European study
 3. Maastricht University (The Netherlands) 4. University of Oslo (Norway) 5. University of Navarra (Spain) 6. University of Reading (UK) 7.")
96 What make us fat evidence from a Pan- European study Led by Prof John Mathers, HNRC, Newcastle University 9 partners from 8 countries 1. Newcastle University (UK) 2. University College Dublin (Ireland) 3. Maastricht University (The Netherlands) 4. University of Oslo (Norway) 5. University of Navarra (Spain) 6. University of Reading (UK) 7. National Food and Nutrition Institute Warsaw (Poland) 8. Harokopio University Athens (Athens) 9. Technische Universitaet Muenchen (Germany)

97 What make us fat evidence from s Pan- European study OR for BMI> % and 58% less likely to had a BMI >25.0 Celis-Morales, Mathers J., (Food4Me), et al., (2016) In progress


, et al.")
98 What make us fat evidence from a Pan- European study 40% and 27% less likely to had a BMI >25.0 Celis-Morales, Mathers J., (Food4Me), et al., (2016) In
99 Summary There is an inverse relationship between the percentage of calories people consume from fat and those consumed from added sugars. In other words, people with diets that are low in fat tend to consume more sugar. The reverse is also true those with diets high in fat are likely to have low sugar intakes.
100 Summary For overweight individuals, SACN advises that reducing the amount of energy consumed as free sugars, without increasing energy intake from other sources, could contribute to a reduction in total energy intake and result in weight loss.

101 Sugar versus Fat: Who is the evil? Focusing public health messages too strongly on reducing sugar consumption may mislead the public on the need to also reduce intake of fat and calories overall.
The Scientific Advisory Committee on Nutrition s recommendations on sugars
 The Scientific Advisory Committee on Nutrition s recommendations on sugars SACN recommends that the average intake, across the UK population, of free sugars should not exceed 5% of total dietary energy
Understanding the public health benefits of sugar reduction. Liz Tucker (RNuTr) Selectfood LLP
 Selectfood LLP") Understanding the public health benefits of sugar reduction Liz Tucker (RNuTr) Selectfood LLP Public Health England - Sugar Reduction The evidence for action - October 2015 1. WHY DO WE HAVE A LOVE AFFAIR
Understanding the public health benefits of sugar reduction Liz Tucker (RNuTr) Selectfood LLP Public Health England - Sugar Reduction The evidence for action - October 2015 1. WHY DO WE HAVE A LOVE AFFAIR
BNF looks at years 7 and 8 of the National Diet and Nutrition Survey (NDNS) Rolling Programme (2014/ /2016)
 Rolling Programme (2014/ /2016)") BNF looks at years 7 and 8 of the National Diet and Nutrition Survey (NDNS) Rolling Programme (2014/2015-2015/2016) Contents 1 Introduction... 1 2. NDNS findings on intake compared to nutrient-based recommendations...
BNF looks at years 7 and 8 of the National Diet and Nutrition Survey (NDNS) Rolling Programme (2014/2015-2015/2016) Contents 1 Introduction... 1 2. NDNS findings on intake compared to nutrient-based recommendations...
Sugar Reduction: The evidence for action. All Party Parliamentary Food and Health Forum October 2015
 Sugar Reduction: The evidence for action All Party Parliamentary Food and Health Forum October 2015 Scientific Advisory Committee on Nutrition report: Carbohydrates & Health Recommendations on sugar* The
Sugar Reduction: The evidence for action PHE s response to the SACN recommendations on sugar
 Sugar Reduction: The evidence for action PHE s response to the SACN recommendations on sugar Dr Alison Tedstone, National Lead for Diet & Obesity and Chief Nutritionist December 2015 Key findings: Scientific
The sugar reduction environment. Professor Julian G. Mercer Rowett Institute
 The sugar reduction environment Professor Julian G. Mercer Rowett Institute June 2014 Eating too much sugar is bad for us..the steps PHE will take to help families and individuals to reduce their sugar
BEVERAGES. Risks and opportunities: the science. Sigrid Gibson. Director, Sig- Nurture Ltd. Nutrition Consultants
 BEVERAGES Risks and opportunities: the science Sigrid Gibson Director, Sig- Nurture Ltd. Nutrition Consultants OTHER ingredients BEVERAGES HEALTHY OR UNHEALTHY? SUGAR(S) & OBESITY JUICES AND 5- A- DAY
Food4Me Project update: how findings may influence the delivery of personalised nutrition John Mathers
 Food4Me Project update: how findings may influence the delivery of personalised nutrition John Mathers This project has received funding from the European Union s Seventh Framework Programme for research,
Percentage of U.S. Children and Adolescents Who Are Overweight*
 Percentage of U.S. Children and Adolescents Who Are Overweight* 20 18 16 14 12 10 8 6 4 2 0 5 1963-65; 1966-70 6 4 4 1971-1974 7 5 1976-1980 11 1988-1994 15 1999-2000 17 16 2001-2002 Ages 6-11 Ages 12-19
The role of beverages in the Australian diet
 The role of in the Australian diet A secondary analysis of the Australian Health Survey: National Nutrition and Physical Activity Survey (211-12) 2 THE ROLE OF BEVERAGES IN THE AUSTRALIAN DIET Snapshot
The purpose of this report is to provide feedback to relevant Councils to help inform decision making on key issues.
 Store Nutrition Report Final Store Turnover Food and Nutrition Results Nganampa Health Council March 2013 Amanda Lee and Jamie Sheard Summary This report provides food and nutrition information about the
Evi Seferidi PhD student Imperial College London
 Associations of sweetened beverage intake with energy, sugar and cardiometabolic markers in UK children: a cross-sectional analysis of the National Diet and Nutrition Survey Rolling Programme Evi Seferidi
Meal Menu Approximate Amount Eaten
 Meal Menu Approximate Amount Eaten Myself 16 Year Old Active Male Teen 3 Year Old Female Child ¼ cup 1 slice 70 Year Old Female Breakfast Special K Cereal(red berries) 1 cup 1 Banana (slices) ¼ cup ¾ cup
Child obesity a national plan for action
 Child obesity a national plan for action Eustace de Sousa Interim Deputy Director for Health & Wellbeing and National Lead - Children, Young People and Families National Children and Adult Services Conference
5. HEALTHY LIFESTYLES
 5. HEALTHY LIFESTYLES 5.1 Healthy Eating This section describes the principles and recommendations for a healthy diet, the impact of healthy eating on health, and what is known about the diet of people
City of Minneapolis Healthier Beverage Initiative Talking Points - suggested answers for partners
 1 City of Minneapolis Healthier Beverage Initiative Talking Points - suggested answers for partners Being prepared for tough questions from employees, visitors, community members, and the media is an important
BNF LOOKS AT THE RECOMMENDATIONS IN THE WORLD CANCER RESEARCH FUND 2018 THIRD EXPERT REPORT* AND HOW IT COMPARES TO UK GUIDELINES
 BNF LOOKS AT THE RECOMMENDATIONS IN THE WORLD CANCER RESEARCH FUND 2018 THIRD EXPERT REPORT* AND HOW IT COMPARES TO UK GUIDELINES *WCRF/AICR Diet, Nutrition, Physical Activity and Cancer: Third Expert
The place of plant-based eating in dietary guidelines The Eatwell Guide and beyond
 The place of plant-based eating in dietary guidelines The Eatwell Guide and beyond Ayela Spiro Senior Nutrition Scientist Nutrition Science Manager The Moment for Plant based eating is Now University of
Current dietary habits in Europe far from plant based eating
 Current dietary habits in Europe far from plant based eating Stefaan De Henauw Ghent University Department of Public Health Stefaan.dehenauw@ugent.be The menu What is plant based diet? Nutrition transition
The role of Sugar in the diet of New Zealanders June 2014
 TABLE OF CONTENTS The role of Sugar in the diet of New Zealanders June 2014 EXECUTIVE SUMMARY... 2 INTRODUCTION... 3 KEY MESSAGES... 4 CONSUMER MESSAGES... 5 WHAT IS SUGAR?... 6 Types of Sugar 6 Digesting
sociodemographic patterns of food purchasing and dietary intake
 A closer look at sociodemographic patterns of food purchasing and dietary intake in Northern Ireland 11 th October 2016 Joanne Casey Aims for today Nutrition surveillance in NI National Diet and Nutrition
REDUCING HEALTH HARMS OF FOODS HIGH IN FAT, SUGAR OR SALT CONSULTATION PAPER
 REDUCING HEALTH HARMS OF FOODS HIGH IN FAT, SUGAR OR SALT CONSULTATION PAPER RESPONDENT INFORMATION FORM This form must be completed and returned with your response. To find out how we handle your personal
Oregon Nutrition Guidelines in the School Environment
 I. GENERAL RECOMMENDATIONS Oregon Nutrition Guidelines in the School Environment These recommendations apply, campus wide, during the instructional day. Eliminate: Candy, soda, fried pastry and foods of
IDENTIFYING KEY CONSUMER TRENDS IN WEIGHT MANAGEMENT EWA HUDSON GLOBAL HEAD OF HEALTH AND WELLNESS RESEARCH FOOD MATTERS LIVE, NOVEMBER 2014
 IDENTIFYING KEY CONSUMER TRENDS IN WEIGHT MANAGEMENT EWA HUDSON GLOBAL HEAD OF HEALTH AND WELLNESS RESEARCH FOOD MATTERS LIVE, NOVEMBER 2014 2 CONSUMER ATTITUDES TOWARDS WEIGHT LOSS AND OBESITY PERFORMANCE
AN UPDATE ON PUBLIC HEALTH POLICIES AND HOW THE INDUSTRY IS RESPONDING
 AN UPDATE ON PUBLIC HEALTH POLICIES AND HOW THE INDUSTRY IS RESPONDING Anna Wheeler RNutr Independent Nutrition Consultant ABOUT ME Nutritionist who used to work for Coca-Cola how does that work?!? Biggest
Which could be made worse by the over-consumption of sugar or calories?
 Which could be made worse by the over-consumption of sugar or calories? Added Sugars are sugars that are not found naturally in a product. Sugars are found naturally in fruits (fructose) and fluid milk
Consumption of Pasta and Carbohydrates in Argentina
 Consumption of Pasta and Carbohydrates in Argentina Sergio Britos Nutritionist Professor of Food Policy and Food Economy, University of Buenos Aires Director of the Center of Studies in Food and Economy
CROATIA NACIONALNE SMJERNICE ZA PREHRANU UČENIKA U OSNOVNIM ŠKOLAMA. School food policy (mandatory) Year of publication 2013
 Year of publication 2013") CROATIA School food policy (mandatory) Developed by Year of publication 2013 Web link(s) NACIONALNE SMJERNICE ZA PREHRANU UČENIKA U OSNOVNIM ŠKOLAMA Ministry of Health http://www.zdravlje.hr/content/download/11609/84157/file/nacionalne_smjernice_za_
CROATIA School food policy (mandatory) Developed by Year of publication 2013 Web link(s) NACIONALNE SMJERNICE ZA PREHRANU UČENIKA U OSNOVNIM ŠKOLAMA Ministry of Health http://www.zdravlje.hr/content/download/11609/84157/file/nacionalne_smjernice_za_
Eating Healthy To Be Healthy
 Just A Reminder what is healthy food? Healthy Eating Healthy To Be Healthy Fruit Vegetables Fish & Meat Eggs, Cheese & Milk Unhealthy Food Chocolate Crisps chips Cake Sweets A Guide To Healthy Eating Being
Calorie reduction programme and OOH leadership
 Calorie reduction programme and OOH leadership Samantha Montel Team Leader, Out of Home Public Health England June 2018 2 Calorie Reduction Summit Obesity affects us all HM Government Childhood Obesity
FACTS ABOUT SUGAR Issue 11 October 2017
 FACTS ABOUT SUGAR Issue 11 October 2017 WHAT IS SUGAR? Sugar is a natural ingredient which provides sweetness to a range of foods and drinks, including fruits and vegetables, fruit juices, jams, soft drinks,
Snack Food and Beverage Interventions in Schools
 Snack Food and Beverage Interventions in Schools Summary Evidence Table Abbreviations Used in This Document: Outcomes: o SSB: sugar sweetened beverage Measurement terms o BMI: body mass index o CI: confidence
COMMISSION OF THE EUROPEAN COMMUNITIES COMMISSION STAFF WORKING DOCUMENT
 COMMISSION OF THE EUROPEAN COMMUNITIES Brussels, 10.7.2008 SEC(2008) 2296 COMMISSION STAFF WORKING DOCUMENT CURRENT POSITION IN EU MEMBER STATES ON FOODS FOR PERSONS SUFFERING FROM CARBOHYDRATE METABOLISM
HOW TO ASSESS NUTRITION IN CHILDREN & PROVIDE PRACTICAL RECOMMENDATIONS FOR THE FAMILY
 HOW TO ASSESS NUTRITION IN CHILDREN & PROVIDE PRACTICAL RECOMMENDATIONS FOR THE FAMILY MARIA HASSAPIDOU, PROFESSOR OF NUTRITION AND DIETETICS, DEPARTMENT OF NUTRITION AND DIETETICS,ALEXANDER TECHNOLOGICAL
Global Burden of Disease Attributable to Sugar Sweetened Beverages
 Global Burden of Disease Attributable to Sugar Sweetened Beverages Dariush Mozaffarian, MD DrPH Dean, Friedman School of Nutrition Science & Policy Press Conference Mexico City, Mexico November 11, 2014
Principles of Healthy Eating and Nutritional Needs of Individuals
 Principles of Healthy Eating and Nutritional Needs of Individuals Physical Activity Food Sources Additives Nutrients Healthy diet Energy Eating Disorders Level 2 Certificate in Nutrition and Health Coronary
Diet and nutrition. Professor Susan Jebb Nuffield Department of Primary Care Health Sciences Tuesday 12 April 2016
 Diet and nutrition Professor Susan Jebb Nuffield Department of Primary Care Health Sciences susan.jebb@phc.ox.ac.uk Tuesday 12 April 2016 No shortage of opinion on what to eat A one-day cleanse from the
Food Labels: what you need to know to help you make better choices for your diabetes and for all your family.
 Food Labels: what you need to know to help you make better choices for your diabetes and for all your family www.diabetes.ie What do you need to know when it comes to food labels? Diabetes is a condition
CZECH REPUBLIC. School food policy (mandatory) Year of publication 2005, 2008
 Year of publication 2005, 2008") CZECH REPUBLIC School food policy (mandatory) Developed by Year of publication 2005, 2008 Web link(s) Vyhláška č. 107/2005 Sb., o školním stravování Vyhláška č. 108/2005 Sb., o školských výchovných a ubytovacích
CZECH REPUBLIC School food policy (mandatory) Developed by Year of publication 2005, 2008 Web link(s) Vyhláška č. 107/2005 Sb., o školním stravování Vyhláška č. 108/2005 Sb., o školských výchovných a ubytovacích
Keeping the Body Healthy!
 Name Hour Food & Nutrition 9 th Grade Keeping the Body Healthy! # Assignment Pts. Possible 1 Create a Great Plate Video 30 2 MyPlate Label & Color 15 3 Color & Food 5 4 6 Basic Nutrients 9 5 Dietary Guidelines
A WHO nutrient profile model: the European perspective. J. Breda Programme Manager Nut., PA & Obesity WHO Regional Office for Europe
 A WHO nutrient profile model: the European perspective J. Breda Programme Manager Nut., PA & Obesity WHO Regional Office for Europe Platform for Action on Diet, Physical Activity and Health Brussels, 24
Nutrition Wars: Choosing Better Carbohydrates
 Nutrition Wars: Choosing Better Carbohydrates What are carbohydrates? There are 2 main types of carbohydrates: Simple carbohydrates include sugars found naturally in fruit, some vegetables, milk and milk
THE BIG DEBATE: SHOULD THE FIZZY DRINK TAX BE EXTENDED TO SUGARY FOODS?
 THE BIG DEBATE: SHOULD THE FIZZY DRINK TAX BE EXTENDED TO SUGARY FOODS? THE DILEMMA This year, the UK Government is introducing a new tax on sugary soft drinks, such as Coca-Cola and Fanta. It s an attempt
Nutrient profiles for foods bearing claims
 Nutrient profiles for foods bearing claims Fields marked with * are mandatory. Background Regulation (EC) 1924/2006 (Nutrition and Health Claims NHC Regulation) establishes EU rules on nutrition and health
Beverage Guidelines: 1 up to 3 Years
 Beverage Guidelines: nutritionally-equivalent nondairy beverages like soy, rice, or lactose-free milks with medical permission). nutritionally-equivalent nondairy beverages like soy, rice, or lactose-free
Understanding Nutrition and Health Level 2 SAMPLE. Officially endorsed by
 Understanding Nutrition and Health Level 2 Officially endorsed by Explore the principles of healthy eating SA M PL E R/505/2204 SECTION 2: COMPONENTS OF A HEALTHY DIET The five food groups It is not easy
Food labels made easy
 Food labels made easy 1 Food labels made easy Healthy eating is important for everyone, whether you ve got diabetes or not. That means eating more wholegrains, beans, peas, lentils, dhal, nuts, fish, fruit
INDUSTRY PERSPECTIVE: CHALLENGES OF REDUCING SUGAR AND USING SWEETENERS DR KAVITA KARNIK, PRINCIPAL SCIENTIST (GLOBAL NUTRITION)
") INDUSTRY PERSPECTIVE: CHALLENGES OF REDUCING SUGAR AND USING SWEETENERS DR KAVITA KARNIK, PRINCIPAL SCIENTIST (GLOBAL NUTRITION) AGENDA Why is calorie reduction needed? Problem and changing picture Challenges
INDUSTRY PERSPECTIVE: CHALLENGES OF REDUCING SUGAR AND USING SWEETENERS DR KAVITA KARNIK, PRINCIPAL SCIENTIST (GLOBAL NUTRITION) AGENDA Why is calorie reduction needed? Problem and changing picture Challenges
Supplemental Table 1: List of food groups
 Supplemental Table 1: List of food groups Food groups names Food groups description Serving size definitions - Examples Fruits and vegetables Vegetables Fruits Whole vegetables All vegetables but soups,
2018 Global Nutrition
 Professor Corinna Hawkes Director, Centre for Food Policy, City, University of London Co-Chair, Independent Expert Group of the Global Nutrition Report 2018 Global Nutrition Report November 2018 About
Policy Statement Low carbohydrate diets for the management of Type 2 Diabetes in adults
 Policy Statement Low carbohydrate diets for the management of Type 2 Diabetes in adults Summary The role and the amounts of carbohydrate in foods as part of the diet of people with type 2 diabetes is often
Evidence into action: Public Health England support at national and local level to tackle obesity
 Evidence into action: Public Health England support at national and local level to tackle obesity Jamie Blackshaw, Team Leader: Obesity and Healthy Weight, Health and Wellbeing, Public Health England 2
Unit 2 Packet Nutrition and Fitness
 First Name Last Name Period Unit 2 Packet Nutrition and Fitness If you are ever absent go on to the class website and use the power points to guide your notes. POINTS ASSIGNMENT / 10 pts Daily Food Log
About Public Health England
 Why 5%? An explanation of the Scientific Advisory Committee on Nutrition s recommendations about sugars and health, in the context of current intakes of free sugars, other dietary recommendations and the
Youth4Health Project. Student Food Knowledge Survey
 Youth4Health Project Student Food Knowledge Survey Student ID Date Instructions: Please mark your response. 1. Are you a boy or girl? Boy Girl 2. What is your race? Caucasian (White) African American Hispanic
WHO Draft Guideline: Sugars intake for adults and children. About the NCD Alliance. Summary:
 WHO Draft Guideline: Sugars intake for adults and children About the NCD Alliance The NCD Alliance is a unique civil society network of over 2,000 organizations in more than 170 countries focused on raising
Interpretation of the mandate and methodology applied
 Interpretation of the mandate and methodology applied Marco Vinceti Chair, EFSA WG on free sugars Technical meeting, 13 February 2018 TERMS OF REFERENCE (TOR) ORIGINAL REQUEST Mandate requestor National
A model of how to eat healthily
 Average adult A model of how to eat healthily Shows the different types of food we need to eat and in what proportions to have a well balanced and healthy diet Not a model of each meal Applies to most
Family Fitness Challenge - Student Fitness Challenge
 Family Fitness Challenge - Student Fitness Challenge COMMUNITY - BASE D OBESITY INTERVENTION PROGRAM MOVES INTO ELEMENTARY SCHOOLS J N E L L E R U S C E T T I, P A L Y N N H U N T L O N G, E D. D. S T
"A science based approach for the validation of nutrient profiles (ILSI workshop on nutrient profiles)"
") "A science based approach for the validation of nutrient profiles (ILSI workshop on nutrient profiles)" Jean-Luc Volatier French Food Safety Agency AFSSA What is a nutritional profiling (NP) scheme «The
"A science based approach for the validation of nutrient profiles (ILSI workshop on nutrient profiles)" Jean-Luc Volatier French Food Safety Agency AFSSA What is a nutritional profiling (NP) scheme «The
Hidden Reasons for the Obesity Epidemic of Our Generation
 Hidden Reasons for the Obesity Epidemic of Our Generation Multiple factors affect teens and adults alike today as they navigate the territory of food, and all things associated with it, especially caloric
Your Guide to. Healthy Eating for Managing Diabetes
 Your Guide to Healthy Eating for Managing Diabetes What is diabetes? A condition when the blood glucose level is higher than normal as described below. Stomach Bloodstream Pancreas 3 1 4 2 1. Food is broken
Foods that Increase Body Fat
 Foods that Increase Body Fat To better learn what foods you should eat, it is best to learn first what you should not eat! Knowing the various food types you should not eat better prepares you to more
To help make sense of some of the different dietary approaches out there, the Ministry has reviewed eight popular diets.
 Popular diets review The Ministry of Health recommends a nutritionally balanced eating pattern consistent with the Eating and Activity Guidelines for New Zealand Adults for good health. For people wanting
Childhood Obesity. Jay A. Perman, M.D. Vice President for Clinical Affairs University of Kentucky
 Childhood Obesity Jay A. Perman, M.D. Dean, College of Medicine Vice President for Clinical Affairs University of Kentucky Epidemic of Overweight & Obesity in Children Prevalence of Overweight by Race/Ethnicity
Intake of sugar-sweetened beverages and weight gain: a systematic review REVIEW ARTICLE
 Intake of sugar-sweetened beverages and weight gain: a systematic review REVIEW ARTICLE 1 American Journal of Clinical Nutrition Vol. 84, No. 2, 274-288, August 2006 Vasanti S Malik, Matthias B Schulze
Eating Healthy on the Run
 Eating Healthy on the Run Do you feel like you run a marathon most days? Your daily race begins as soon as your feet hit the floor in the morning and as your day continues you begin to pick up speed around
Disney Nutrition Guidelines Criteria
 Disney Nutrition Guidelines Criteria e u r o p e, middle east and africa at a glance: The Nutrition Guidelines criteria were developed with the help of nutrition experts and informed by best-in-class science-based
CHOOSE HEALTH: FOOD, FUN, AND FITNESS. Read the Label!
 POSTER 1-1: REPLACE SWEETENED DRINKS Read the Label! Nutrition Facts 20 oz. cola Serving Size: 1 bottle (591mL) Servings Per Container: 1 Amount Per Serving Calories 240 Calories from Fat 0 % Daily Value
Canada s Food Supply: A Preliminary Examination of Changes,
 Canada s Food Supply: A Preliminary Examination of Changes, 1992-2002 Canada's Food Guide to Healthy Eating, released in 1992, is a key nutrition education tool for Canadians aged four years and over.
The Good Food Movement : Catalyzing A Healthy, Local Food System. By Community Health Improvement Partners
 The Good Food Movement : Catalyzing A Healthy, Local Food System By Community Health Improvement Partners Levels of Processed Foods 1: Unprocessed or minimally processed foods 2: Processed culinary ingredients
Food consumption patterns for women of child bearing age with different folic acid intakes (FSANZ April 2007)
") Food consumption patterns for women of child bearing age with different folic acid intakes (FSANZ April 27) The choice of a food vehicle for fortification with folic acid has been the subject of considerable
Food consumption patterns for women of child bearing age with different folic acid intakes (FSANZ April 27) The choice of a food vehicle for fortification with folic acid has been the subject of considerable
Dietary Guidelines for Americans & Planning a Healthy Diet. Lesson Objectives. Dietary Guidelines for Americans, 2010
 Dietary Guidelines for Americans & Planning a Healthy Diet NUTR 2050 NUTRITION FOR NURSING PROFESSIONALS MRS. DEBORAH A. HUTCHEON, MS, RD, LD Lesson Objectives At the end of the lesson, the student will
Implications of a Healthier U.S. Food Stamp Program
 Implications of a Healthier U.S. Food Stamp Program Julian M. Alston Department of Agricultural and Resource Economics University of California, Davis Presented at the International Health Economics Association
Dietary Fat Guidance from The Role of Lean Beef in Achieving Current Dietary Recommendations
 Dietary Fat Guidance from 1980-2006 The Role of Lean Beef in Achieving Current Dietary Recommendations Penny Kris-Etherton, Ph.D., R.D. Department of Nutritional Sciences Pennsylvania State University
Public Health and Nutrition in Older Adults. Patricia P. Barry, MD, MPH Merck Institute of Aging & Health and George Washington University
 Public Health and Nutrition in Older Adults Patricia P. Barry, MD, MPH Merck Institute of Aging & Health and George Washington University Public Health and Nutrition in Older Adults n Overview of nutrition
Weight loss guide. Dietetics Service
 Weight loss guide Dietetics Service Contents Section 1 - thinking about losing weight? Section 2 - Carbohydrate Section 3 - Fruit and vegetables Section 4 - Protein & Dairy Section 5 - Fatty foods Section
Added Sugars: Coming Soon to a Food Label Near You
 Added Sugars: Coming Soon to a Food Label Near You Nick Rose, MS, CN Nutrition Educator - PCC Markets www.nickdigsfood.com Learning Objectives: 1. Explain the updates coming to the Nutrition Facts Panel,
Nutrition Analysis Project. Robin Hernandez. California State University, San Bernardino. HSCL Dr. Chen-Maynard
 Nutrition Analysis Project Robin Hernandez California State University, San Bernardino HSCL 365 - Dr. Chen-Maynard March 15, 2012 1. A) Personal Background: Summary of Findings Name: Pregnancy: Robin S.
Lifelong Nutrition. Jemma O Hanlon BHlthSc(Nutr & Diet) APD AN Accredited Practising Dietitian Accredited Nutritionist
 APD AN Accredited Practising Dietitian Accredited Nutritionist") Lifelong Nutrition Jemma O Hanlon BHlthSc(Nutr & Diet) APD AN Accredited Practising Dietitian Accredited Nutritionist Outline a Macronutrients a Micronutrients a Glycaemic Index a NHPAs The Australian
Lifelong Nutrition Jemma O Hanlon BHlthSc(Nutr & Diet) APD AN Accredited Practising Dietitian Accredited Nutritionist Outline a Macronutrients a Micronutrients a Glycaemic Index a NHPAs The Australian
Nutrition Standards Policy Business Enterprises of Nevada
 Nutrition Standards Policy Business Enterprises of Nevada Allison Schnitzer, RD, LD Office of Chronic Disease Prevention & Health Promotion Southern Nevada Health District Why Healthy Vending? OCDPHP Goal:
Sund skolemad med smag smil og samvaer
 DENMARK School food policy (voluntary) Developed by Year of publication Web link(s) Sund skolemad med smag smil og samvaer Ministry of Food, Agriculture and Fisheries 2012 (website update) http://altomkost.dk/servicemenu/publikationer/publikation/pub/hent-fil/publication/
English *P49950A0112* E202/01. Pearson Edexcel Functional Skills. P49950A 2016 Pearson Education Ltd. Level 2 Component 2: Reading
 Write your name here Surname Other names Pearson Edexcel Functional Skills English Level 2 Component 2: Reading 18 22 July 2016 Time: 60 minutes You may use a dictionary. Centre Number Candidate Number
Childhood Obesity. Geoffrey Axiak REGISTERED NUTRITIONIST
 Childhood Obesity Geoffrey Axiak M.Sc. Nursing (Manchester), B.Sc. Nursing, P.G. Dip. Nutrition & Dietetics, Dip. Public Management, Cert. Clinical Nutrition (Leeds) REGISTERED NUTRITIONIST What is obesity?
Nutrition and Health Foundation Seminar
 Nutrition and Health Foundation Seminar Presentation by Brian Mullen Health Promotion Policy Unit Department of Health and Children Prevalence of overweight and obesity has been described by WHO as an
What are the risk/benefits from high intake of carbohydrates?
 What are the risk/benefits from high intake of carbohydrates? Alan Barclay, PhD 2013 Australia other countries. All rights reserved Prologue: the diabesity epidemic The diabetes epidemic 1 1.15 million
Rachel K. Johnson, PhD, MPH, RD Professor of Nutrition and Associate Provost The University of Vermont Member AHA Nutrition Committee
 Rachel K. Johnson, PhD, MPH, RD Professor of Nutrition and Associate Provost The University of Vermont Member AHA Nutrition Committee 10 committee members 10 liaison members Expertise in nutrition, pediatrics,
The eatwell plate is based on the Government s Eight Guidelines for a Healthy Diet, which are:
 The eatwell plate The eatwell plate is a pictorial food guide showing the proportion and types of foods that are needed to make up a healthy balanced diet. The plate has been produced by the Food Standards
A Quick Lesson in Sugars! Monosaccharides. Simple Sugars. Within the body, ALL are converted to glucose! Carbohydrate Digestion SITE ENZYMES END PROD
 Sugars & Grains Presented by Fred Hardinge, DrPH, RD Associate Health Directo General Conference of SDA Monosaccharides Simple Sugars Glucose (Dextrose) Fructose Galactose Within the body, ALL are converted
TRENDS IN FOOD AND NUTRIENT INTAKES IN IRELAND
 TRENDS IN FOOD AND NUTRIENT INTAKES IN IRELAND Janette Walton PhD School of Food & Nutritional Sciences, UCC Irish Universities Nutrition Alliance www.iuna.net Dietary surveys of Irish adults (18-64y)
NATIONAL COST OF OBESITY SEMINAR. Dr. Bill Releford, D.P.M. Founder, Black Barbershop Health Outreach Program
 NATIONAL COST OF OBESITY SEMINAR Dr. Bill Releford, D.P.M. Founder, Black Barbershop Health Outreach Program 1 INTRODUCTION According to the Center of Disease Control and Prevention, the American society
Nutrition Notes website.notebook October 19, Nutrition
 Nutrition Nutrition Notes website.notebook October 19, 2016 Food is any substance that is ingested ("eaten") and helps sustain life. Food categories: Meats and Alternative Dairy Products Fruits and Vegetables
SUGAR SWEETENED BEVERAGES POLICY
 SUGAR SWEETENED BEVERAGES POLICY OBJECTIVE This policy supports the health of staff, visitors, and elected members at Nelson City Council workplaces through the provision of healthy beverage choices. This
Sugar consumption and health: an update of the evidence
 Sugar consumption and health: an update of the evidence Dr Charlotte Evans c.e.l.evans@leeds.ac.uk Lecturer in nutritional epidemiology School of Food Science and Nutrition, University of Leeds FDIN 8
Briefing. OBESITY and REFORMULATION. Key Points. Key Actions. Definition
 OBESITY and REFORMULATION Briefing July 2016 Key Points Reformulation is a change in the balance and content of ingredients in processed food and drink. To promote a healthy diet, reformulation requires
Current issues in research on food marketing. StanMark. STANMARK, 9th MARCH Jason Halford & Emma Boyland. Liverpool Obesity Research Network
 Current issues in research on food marketing STANMARK, 9th MARCH 2011 Jason Halford & Emma Boyland Liverpool Obesity Research Network BRAND RECOGNITION IN VERY YOUNG CHILDREN Children are very aware of
 EXHIBIT C Center for Science in the Public Interest Publisher of Nutrition Action Healthletter www.cspinet.org/nutritionpolicy EXHIBIT C Committee Name OBESITY Document consists of 43 SLIDES. Entire document
Classroom Lessons in partnership with MyPyramid.gov
 Classroom Lessons in partnership with MyPyramid.gov Why is it important to reach a healthier weight? Reaching and maintaining a healthier weight is important for your overall health and well being. If
Secondary school food survey School lunch: provision, selection and consumption
 Research Report Secondary school food survey 2011 1. School lunch: provision, selection and consumption Overview By September 2009, all secondary schools in England were required by law to meet new food-based
The Great Food Conundrum: Health vs Sustainability
 The Great Food Conundrum: Health vs Sustainability Dr Christian Reynolds Knowledge Exchange Research Fellow (N8 AgriFood project) Department of Geography, University of Sheffield @sartorialfoodie Talk