THE 2016 COLORADO. Celebrating a Decade of Data #COHRC.
|
|
|
- Elisabeth Waters
- 5 years ago
- Views:
Transcription


1 THE 2016 COLORADO Celebrating a Decade of Data #COHRC
 Kevin Esparza, Avari Getchell")


 and Yinsin Limon enjoy using outdoor park space in Denver to play soccer.")


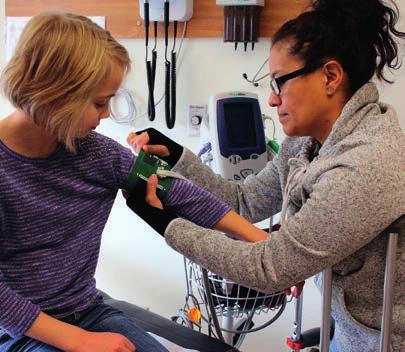
2 For detailed data on each of the Health Report Card s 38 indicators and methodology, visit Join the Conversation #COHRC On the Cover Avon Elementary students (left to right) Kevin Esparza, Avari Getchell and Eduardo Alvarado test some equipment on Principal Roy Getchell at the School Care Clinic. Cailey McDermott Christina Supples and her daughter, Collette Gabreski, enjoy the sun and snow at Alpine Park in Salida with Sarah Gartzman and her son, Ozzie Gartzman. Cailey McDermott Eckhart Elementary School in Trinidad follows national nutrition guidelines and serves yummy and healthy scratch-made lunches. Joey Maldonado is a big fan. Cailey McDermott Miguel (left) and Yinsin Limon enjoy using outdoor park space in Denver to play soccer. James Chance Kathleen Chaffer, Park County s Women, Infants and Children s (WIC) program director, weighs eight-monthold Zayden Rosebrugh at Park County Public Health. Cailey McDermott Amos Lee, general manager of the Farmers Fresh Market in Ignacio, holds his son at the grand opening in October. Support from the Colorado Fresh Food Financing Fund helped bring fresh food back to the southwestern Colorado town. Scott Dressel-Martin Helen Mills (right) greets customer James McCormick at the Walsh Community Grocery Store in southeastern Colorado. Residents became investors to save their only local grocer. James Chance Avari Getchell gets her blood pressure tested by nurse JoAnn Baldwin at the Avon Elementary School Care Clinic, which serves 98 percent of students. Cailey McDermott
3 THE 2016 COLORADO Celebrating a Decade of Data A Decade of Colorado Health Data Marking 10 Years of Progress and Challenges The Colorado Health Report Card, in its 10th year, now has a full decade of data to measure how Colorado s health stacks up against the rest of the nation. The Health Report Card has graded Colorado on its most pressing health issues since The data look at 38 key health indicators across five stages of life: Healthy Beginnings, Healthy Children, Healthy Adolescents, Healthy Adults and Healthy Aging. This decade of data, presented by the Colorado Health Foundation, offers a glimpse into where Colorado is making headway to become a healthier state and critical areas that still need improvement. Key findings from the 2016 Health Report Card: It was a better year for the state s youngest residents. Both babies and children earned their highest grades in the 10-year history of the Health Report Card. The Healthy Beginnings category climbed from a C to a C+, mostly because Colorado momsto-be reached sixth place nationally for timely prenatal care, jumping 12 places. Children also took home a C+, with higher health insurance coverage driving their rise from a C. Teens, adults and seniors didn t pull ahead. The state s teens kept their B average. Adults stayed the same at B+. And Colorado s seniors, consistently among the nation s healthiest, lost a bit of ground, dropping from an A- to a B+, mostly because fewer have a personal doctor or health care provider. The first Health Report Card noted that Colorado fell below the national average for health insurance coverage in every age group. In this Health Report Card, Colorado s children and adults topped the national average. However, momentum is lagging in some areas. Many Coloradans, particularly those facing financial hardships, are falling behind. Of adults with annual incomes between $15,000 and $20,000, 26.1 percent are obese compared with 19 percent of those earning more than $75,000. Health disparities based on race or ethnicity persist too. For instance, the infant mortality rate for black infants is 9.6 per 1,000 births, more than double the rate for white infants. Between 2006 and 2016, the Health Report Card has evolved beyond the health grade. More than a tool to share data, it ignites conversations that are helping to shape the story of Colorado s health. Here s to the next 10 years and even more progress toward making Colorado the healthiest state in the nation. 3

4 Four-year-old Neil McClelland gets active at Alpine Park in Salida, taking advantage of the snow and a sunny winter day. Cailey McDermott
5 The Grades Healthy Beginnings Grade: C Rank: Last Report Card: C/24 21 Healthy Children Healthy Adolescents Grade: Last Report Card: C/24 Grade: C B Rank: Rank: Last Report Card: B/ Healthy Adults Healthy Aging Grade: Last Report Card: B+/13 Grade: B B Rank: Rank: Last Report Card: A-/ Rank reflects Colorado s standing among all states. A rank of 1 is the best.
6 Healthy Beginnings A healthy beginning is vital to a lifetime of good health. Colorado improved from a C to a C+ for these important early years, getting more babies off to a healthy start. A primary reason for the improvement? For the first time in the 10 years of the Health Report Card, Colorado cracked the top 10 for women receiving timely prenatal care, a significant climb to sixth place from 18th last year and 27th place two years ago. Also, the infant mortality rate dropped to 5.1 infant deaths per 1,000 births from the 5.9 deaths per 1,000 births reported in the last Report Card, enough to improve Colorado s rank to 12th from 20th. Decade of Data: Spotlight The percentage of children between 19 and 35 months receiving all of their recommended immunizations dropped from 80.3 in 2007 to 74.3 in Colorado lost ground on women smoking during the late stages of their pregnancies. Although non-smokers dropped slightly to 91 percent, other states outpaced Colorado, and the ranking slid to 21st from 14th. Colorado continues to be in the bottom 10 states for low birth weight babies, holding steady at 8.8 percent. Health Indicator Rank Among States Rank Last Year 11 percent of women received initial prenatal care later than the first trimester or none at all percent of women abstained from cigarette smoking during the last three months of pregnancy percent of babies were born with a low birth weight (less than 5 pounds, 9 ounces) Colorado s infant mortality rate was 5.1 infant deaths per 1,000 live births percent of preschool-age children received all recommended doses of six key vaccines Since last year... Rank improved Rank stayed the same Rank declined 6 Colorado Health Report Card
7 Average Grade: Average Rank: Last Report Card: C/24 21 Colorado jumped from 18th to 6th for prenatal care. Only 11 percent of moms-to-be received their prenatal care late or not at all. C Healthy Beginnings 25% 20% 15% 10% 5% 0% 20.5% 20.8% 20.9% 22.7% 20.7% 19.2% 17.8% 15.4% 11% The infant mortality rate among black babies is more than double that of white babies. (per 1,000 births) 9.6 Non-Hispanic Black 4.2 Non-Hispanic White Colorado slid from 14th to 21st for women smoking in their last trimester. 25 Colorado is ranked for toddlers receiving the recommended immunization series. Policies to Promote Healthy Beginnings Family and Medical Leave Staying current on preventive care like immunizations for babies while maintaining full-time employment can financially strain working parents. Accommodating flexible schedules for medical care can also be challenging for businesses. The federal Family and Medical Leave Act offers some support to working parents confronting these tradeoffs. It requires some employers to provide 12 weeks of unpaid leave when eligible employees face personal health problems, have a new baby or need to care for an ailing family member. 1 But the federal law doesn t offer flexibility or financial protection to many working families. Low-wage earners, for example, are less likely than higher-wage earners to receive paid or unpaid time off for doctor s visits. 2 This can present difficult choices for a working parent who may need an occasional half-day off for prenatal care or a well-child visit. Cities and states across the country have begun to supplement the protections offered under federal law. California, Connecticut, Oregon, Pittsburgh and Seattle, among others, now require most employers to allow their workers to earn paid leave. 3 In Colorado: Colorado employees in same-sex marriages, civil unions or domestic partnerships can receive up to 12 weeks of unpaid leave to care for their partners because of the 2013 Colorado Family Care Act. That law aside, Colorado has not passed new legislation addressing job security or flexibility during times of illness or family caregiving. Nevertheless, some private employers have taken action on their own to support the health of their employees and their families. For example, Colorado-based Chipotle now allows their hourly and part-time workers to earn paid leave. 4 7
8 Healthy Children Colorado s children took a healthy step forward, earning a C+ compared with last year s C. Colorado made a bit of headway in reducing child poverty, trimming the percentage of kids living in families with low incomes to 20.1 percent from 21.6 percent. This moved Colorado s children up two places, to 12th from 14th. A closer look at the data reveal differences by race and ethnicity, with 35.1 percent of Hispanic children and 33.5 percent of black children living in families that can t afford many basic necessities. This means that both black and Hispanic children are three times as likely as white children (11.1 percent) to live in poverty. Decade of Data: Spotlight Only 5 percent of children remain uninsured, down from 14.1 percent in Even so, Colorado s kids still rank 28th in the nation. Families that live in poverty face barriers to a healthy life. For example, an overall child obesity rate of 10.9 percent positions Colorado in fifth place nationally. But Hispanic children, who are more likely to live in households struggling to make ends meet, have a higher level of obesity than white children: 15.5 percent compared with 8.7 percent. Health Indicator Rank Among States Rank Last Year 5 percent of children were not covered by private or public health insurance percent of children lived in families with incomes below the federal poverty level percent of children had a medical home that is accessible, continuous, comprehensive, family-centered, coordinated and compassionate percent of children received all the routine dental preventive care needed in the past 12 months percent of school-age children participated in vigorous physical activity for four or more days per week percent of children were obese Colorado Health Report Card
9 Colorado kids without insurance has dropped to just 5 percent. Colorado ranks 5th BUT in the nation for child obesity. Average Grade: C Average Rank: % % % Last Report Card: C/ % Colorado s Hispanic children rank 33rd One of five Colorado kids live in households facing financial hardship. Children from families that struggle financially are much less likely to have a medical home. Percentage with a Medical Home, by FPL 0-99% FPL 37.6% % FPL 42.8% FPL= Federal Poverty Level % FPL 63% 400+% FPL 65.7% Healthy Children Policies To Promote Healthy Children Health Insurance for Low-Income Children Low-income children are often eligible for health insurance through two public insurance programs, Colorado s Child Health Insurance Program called Child Health Plan Plus (CHP+) or Medicaid. Much progress has been made to ensure that all eligible children are enrolled in one of these insurance programs. Innovative outreach efforts including mobile technology driven by high rates of cell phone ownership are having some success in helping parents know their options. Michigan, for example, uses a text message program to encourage parents to renew their children s health insurance. The program, which includes one-onone assistance for parents, increased retention in public health insurance by 8 percent. 5 In Colorado: Colorado has made gains in ensuring that children have health insurance coverage by deciding to expand insurance eligibility, bolstering outreach efforts and simplifying enrollment processes, according to a recent study by Mathematica Policy Research. 6 Strong statewide outreach and enrollment assistance helped more Colorado families learn about their coverage options and how to enroll. However, the Mathematica study highlighted areas for improvement. There are still gaps in coverage for some children, particularly those who are U.S. citizens even though their parents are not. 9
10 Healthy Adolescents Colorado s teens are maintaining a steady B grade when it comes to their health. But many of their families face financial hardships, an indicator that can directly affect the ability of teens to stay healthy. Nearly one of five teens (17.7 percent) now lives in a family whose income is below the federal poverty level, up from 15.8 percent last year. This pushed Colorado s rank down nine places to 21st from 12th. Among Hispanic teens, 32 percent live in families that can t afford the basics of life. For black teens, it s 25.5 percent. By comparison, the rate for white teens is 9.6 percent. Decade of Data: Spotlight The percentage of teens living in poverty has increased over the decade. The percentage living in families with incomes below the poverty line was 10.3 in 2007 but had risen to 17.7 by However, the state s teens made substantial gains in health insurance coverage. Lack of health insurance fell to 8.5 percent from 11.6 percent for this group. Still, they rank 38th among all states when it comes to insurance. Colorado s teen birth rate continues to decline, falling to 23.4 births for each 1,000 teenagers, down from Health Indicator Rank Among States Rank Last Year 8.5 percent of adolescents are not covered by private or public health insurance percent of adolescents live in families with incomes below the federal poverty level percent of adolescents ate vegetables one or more times during the past seven days percent of adolescents participated in vigorous physical activity on five or more of the past seven days percent of adolescents had five or more drinks of alcohol in a row on one or more of the past 30 days percent of adolescents smoked cigarettes on one or more of the past 30 days percent of adolescents felt so sad or hopeless almost every day for two consecutive weeks during the past 12 months that they stopped doing some usual activities percent of adolescents attempted suicide one or more times during the past 12 months percent of adolescents were sexually active in the past three months. 1 1 Among students who had sexual intercourse during the past three months, 63.7 percent reported using a condom during last sexual intercourse. 3 3 Teen fertility rate (23.4 births to teen mothers per 1,000 teenage females) Colorado Health Report Card
11 Teenage boys out-exercise teenage girls. Boys 57.7% Average Grade: B Average Rank: 16 Percentage Regularly Engaged in Physical Activity Girls 40.3% Last Report Card: B/16 Colorado s teen birth rate is at a record low. (teen birth rate per 1,000) % of teens in the lowest-income families remain uninsured. Healthy Adolescents The percentage of teens who binge drink is almost half of what it was 10 years ago % % 25.1% 22.3% 16.6% Policies To Promote Healthy Adolescents Family Planning Teens who receive family planning education learn about various methods to avoid unintended pregnancies. State and federal health reforms have helped to increase the number of young women who have access to information as well as various forms of contraception. Most private health insurance plans are now required to cover all forms of contraception approved by the U.S. Food and Drug Administration. Many state Medicaid programs, including Colorado s, have benefits for family planning services. 7 Meanwhile, low-income women who don t have insurance or who don t use their insurance for privacy concerns can receive low-cost services and contraception at clinics funded by the federal Title X program. Maryland ranks in the top 10 for states with the lowest teen birth rates, but the city of Baltimore has historically been a different story. A citywide, multiagency campaign to prevent teen pregnancies, B more for Healthy Babies, expanded family planning, increased educational services and provided young women with long-acting reversible contraception (LARC). 8 Since the start of this initiative in 2009, Baltimore s teen birth rate fell from 64.4 births per 1,000 teens to 34.4 births. 9 In Colorado: The teen birth rate is at a record low and many teens have benefited from a variety of resources. For instance, the Colorado Department of Public Health and Environment s family planning initiative provides education to prevent unplanned pregnancies and offers effective contraceptive options, including LARC, at low cost. But some teens still face barriers when seeking family planning services, especially in rural communities. Colorado Medicaid is proposing a more flexible payment structure for Rural Health Clinics that provide family planning services to young women. 11
12 Healthy Adults Colorado adults held onto a B+, tied with seniors for the highest grade across all life stages. This is largely due to increased access to health insurance, low rates of obesity, fewer smokers and fewer binge drinkers. Colorado adults again claimed the nation s best ranking for obesity at 21.5 percent. Even as the state s adults stayed ahead of the pack, though, the obesity rate has increased by three percentage points since 2006, when it was 18.4 percent. Adults lost their nation-leading ranking for physical activity to Oregon, dropping to second place. Colorado adults also lost the nation s top ranking for diabetes, falling to fourth, as the percentage with the disease rose to 5.3 from 4.5. Decade of Data: Spotlight Colorado is falling back when it comes to mental health for adults. The percentage of adults with poor mental health was 11.8 in 2007 but had increased to 13.7 by The uninsured rate for adults fell to 14.1 percent from 18.5 percent, pushing the state ranking up four places to 21st. Colorado s adults posted some gains on lifestyle indicators. Fewer adult Coloradans are smoking cigarettes 17.3 percent compared with 19.4 percent resulting in an improvement to 10th place from 15th. And the percentage of binge drinkers fell to 20.4 percent from 21.2 percent, moving Colorado up to 33rd from 37th. Health Indicator Rank Among States Rank Last Year 14.1 percent of working-age adults are not covered by private or public health insurance percent of adults had one (or more) person(s) they think of as their personal doctor or health care provider percent of adults consumed five or more fruits and/or vegetables per day within the past month percent of adults participated in any physical activity within the past month percent of adults were obese percent of adults smoked cigarettes percent of adults binge drank (males having five or more drinks on one occasion, females having four or more drinks on one occasion) in the past month percent of adults reported that their mental health was not good eight or more days in the past month percent of adults reported that they were diagnosed with diabetes percent of adults reported that they were diagnosed with high blood pressure Colorado Health Report Card
13 The adult uninsurance rate is at a historic low. 20% 15% 10% 5% 0% Average Grade: B Average Rank: % 20.3% 20.6% 20% 19.4% 18.5% Last Report Card: B+/ % Colorado lost its No. 1 ranking for physical activity, dropping to the No.2 slot behind the new leader Oregon and ahead of No. 3 Utah. Healthy Adults Percentage of adults reporting poor mental health by income Women are doing a better job of eating fruits and veggies than men. CO OR UT $75K+ 9.7% <$10K 27.2% Male Female 14.7% 23.9% Policies to Promote Healthy Adults Reducing Sugary Drink Consumption Sugary drinks have been proven to contribute to costly health concerns such as obesity and diabetes. 10,11 Colorado has the nation s lowest obesity rate at 21.5 percent, but that rate has tripled since 1990, when it stood at 6.9 percent. And the number of adults with diabetes is projected to top 500,000 by One possible policy option to discourage the consumption of sugary drinks is a tax modeled after the tobacco tax, which has pushed cigarette smoking rates lower. In Mexico, a one-peso-per-liter tax, or about 10 percent of the price of sugary drinks, has led to lower soda consumption, especially among its lowestincome residents. 13 In the Navajo Nation of Arizona, New Mexico and Utah, a tax on sugary drinks and other junk foods replaced a tax on fresh fruits and vegetables, with the goal of encouraging residents to make healthier choices. In Colorado: Policy efforts to reduce sugary drink consumption in Colorado have often focused on reducing their availability in public settings. For example, certain types of sugary drinks are now prohibited in licensed child care centers and K-12 schools. Local governments and some employers have taken action to remove sugary drinks from public places. In 2013, the city of Fort Collins removed unhealthy beverages from vending machines in city buildings like libraries and recreation centers. Fort Collins has replaced sugary drinks with healthier options, such as carbonated and flavored waters. Several hospitals across Colorado have adopted similar strategies to improve the nutritional quality of beverages sold in vending machines in their facilities. 13
14 Healthy Aging Colorado s seniors continue to score well compared with older adults across the nation. But their grade declined a bit this year to a B+ from last year s A-. The state s seniors lost ground in several areas of health. A driving force behind the lower grade was a decrease in the proportion of those with a personal doctor or health care provider. Colorado s seniors are now 25th instead of last year s 19th. The proportion of seniors receiving the recommended immunizations and flu shots continues to decline, down to 52.8 percent from 53.9 percent last year. Colorado dropped two places, to ninth from seventh. In 2006, 62.2 percent of Colorado seniors were getting their recommended shots. And while a smaller percentage described their physical health as poor 17.6 percent compared with 18.2 percent last year other states posted even better improvements, Decade of Data: Spotlight Colorado is struggling to improve immunizations for seniors. The percentage of older adults receiving recommended immunizations decreased from 62.2 in 2007 to 52.8 in which lowered Colorado s ranking to 15th from 13th. Physical activity is a bright spot: Colorado s seniors reclaimed first place from Oregon with more than 77 percent of older adults getting active, up from 76.1 percent a year ago. There is a considerable economic divide when it comes to mental health. Nearly one of five seniors with annual incomes of less than $10,000 reported poor mental health, about four times the rate of seniors with annual incomes of $75,000 or more. Health Indicator Rank Among States Rank Last Year 94.5 percent of older adults have one (or more) person(s) they think of as their personal doctor or health care provider percent of older adults have had a flu shot during the past 12 months and have had a pneumonia vaccination percent of older adults participated in any physical activity in the past 30 days percent of older adults reported that their physical health was not good for eight or more days in the past month percent of older adults reported that their mental health was not good for eight or more days in the past month percent of older adults reported eight or more days of limited activity in the past month due to poor physical or mental health Colorado Health Report Card
15 Colorado is No. 1 for physical activity. Three of four seniors got active in the past 30 days. Average Grade: B Average Rank: 11 But less income = less activity. Last Report Card: A-/10 Income <$10K 62.8% Income 90.7% Participated in Physical Activity $75K+ Participated in Physical Activity Healthy Aging Colorado s flu and pneumonia immunization rate for older adults has dropped nearly 10 percentage points since % % And more women than men are getting immunized. Female Male 54.5% 50.8% Policies to Promote Healthy Aging Advance Care Planning Advance care planning allows people of all ages to learn about their end-of-life care options, determine which treatments they prefer and communicate with their families and their health care providers about how they want to spend their final days. Research shows most adults prefer to be cared for at home as they near the end of their lives. 14 Yet only a third of Medicare beneficiaries over 65 actually do stay at home in their last days. The goal of advance care planning is to ensure that the wishes of those receiving end-of-life care are honored. Health care providers historically have not been paid to provide advance care planning for their Medicare patients, but the federal government began reimbursing for that service in January This is an important step toward improving participation. In Colorado: Colorado Medicaid reimburses providers for advance care planning consultations for clients with serious, chronic or terminal illnesses. Adequately compensating providers for engaging in this conversation with patients will help increase access to advance care planning by those who could most benefit. It is important to communicate the availability of this service to Medicaid beneficiaries as well as to providers so that they are aware they can bill for this service. 15
16 A Decade of Data 10 Years of Colorado Health Report Cards 2006 Blue Ribbon Commission for Health Care Reform begins work, placing Colorado in the lead on many reforms Lawmakers vote to make school breakfasts free for low-income children The Colorado Public Health Reauthorization Act aims to renovate the state s public health system Legislators pass the Colorado Health Care Affordability Act to expand Medicaid and CHP+, financing it with a provider fee on hospitals The Colorado Health Service Corps Act wins legislative approval, aiming to recruit providers to vulnerable communities. Colorado Milestones Health Report Card Milestones Colorado ranks #1 with nation s lowest adult obesity rate. 14.4% of children live in families below the poverty level, ranking16th. The rate for adults without health insurance reaches 20.1%, highest across the decade. Childhood obesity rate climbs to 14.2% from 9.9%. Rank hits a low of 23rd for the decade. The uninsured rate for children drops to 11.8%. Three indicators from the Health Report Card help to tell the story of Colorado s TOP OF THE CLASS: Health Insurance Not Covered by Public or Private Health Insurance HOLDING STEADY: Obesity Percentage Who Are Obese 19.6% 18.4% 25% 25% 20% 14.1% Children 20% 15% 15% 10% Adolescents 10% 14.1% 8.5% 14.1% 5% 9.9% 5% Adults 5% 0% 0% Colorado Health Report Card Colorado Health 16 Colorado Health Report Card


17 The first decade of the Colorado Health Report Card spans a time of sweeping change in health policy. In many areas, Colorado has been a leader in creating policies that make it easier for all Coloradans to be as healthy as possible. Still, 10 years of measuring Colorado s progress shows that becoming a straight A state is challenging. Much progress has been made, but much work remains Trans fats are banned from public schools. Lawmakers require elementary students to have 150 minutes of physical activity at school each week. Colorado votes to create a state-based insurance market under the ACA, one of 13 states to do so Colorado wins $65 million federal award to fund the State Innovation Model (SIM). Open enrollment through Connect for Health Colorado begins October 1. The General Assembly votes to expand Medicaid eligibility The bipartisan Health Care Cost Containment Commission releases its first report Adult obesity tops out at 22%, but Colorado is still No. 1. The uninsured rate for teens hits 11.3%. 18.3% of teens are in families below poverty line, highest rate over the 10 years. Only 7.1% of children don t have health insurance. 20.1% of children now live in families below the poverty level, higher than when the Health Report Card started. progress or lack of progress in becoming the healthiest state. 21.5% 25% Children 20% 15% 14.4% Adults 10% 10.9% 5% 10.3% 0% ROOM FOR IMPROVEMENT: Poverty Living in Families with Incomes Below the Federal Poverty Level 20.1% 17.7% Report Card Colorado Health Report Card Children Adolescents 17
18 Methodology The Colorado Health Report Card s 38 health indicators are presented through five life stages. Because the data come from many sources, the age ranges for some indicators vary within a life stage. Detailed information about the data, including the ages, years and sources, can be found in the data workbooks at ReportCard. Healthy Beginnings: All indicators are for newborns, with the exception of immunizations. Immunization data are for children between 19 and 35 months. Healthy Children: Insurance and poverty indicators include all children under age 13 while medical home and preventive dental indicators are for all children up through 18 years of age. Physical activity data are for kids between six and 17, while obesity data are for those between 10 and 17. Healthy Adolescents: Insurance and poverty indicators include all teens between ages 13 and 17. Teen fertility is for teen girls between 15 and 19. All other data are for high school students grades Healthy Adults: All data are for adults between 18 and 64. Healthy Aging: All data are for seniors 65 years and older. Data Sources The indicators selected for the Colorado Health Report Card come from eight different data sources. The data are the most recent available for all states. 1. Centers for Disease Control and Prevention. Behavioral Risk Factor Surveillance System (BRFSS), Centers for Disease Control and Prevention, National Center of Health Statistics. National Survey of Children s Health, Centers for Disease Control and Prevention. National Immunization Survey, Centers for Disease Control and Prevention. National Vital Statistics System, Centers for Disease Control and Prevention, Office of Adolescent and School Health. Youth Risk Behavior Survey, Centers for Disease Control and Prevention. Pregnancy Risk Assessment Monitoring System, Colorado Department of Public Health and Environment, Colorado Department of Human Services Office of Behavioral Health, the Colorado Department of Education and University of Colorado Denver. Healthy Kids Colorado Survey, United States Census Bureau. American Community Survey, Ranking The indicators selected are reported consistently across states, allowing Colorado s performance to be ranked relative to other states. For each indicator, the best-performing state is ranked first. An adjusted rank was calculated for indicators with fewer than 50 states reporting data. In cases where states had the same value for an indicator, they were listed randomly. Decade of Data Indicators used for Decade of Data life stage breakouts are reported by the year in which the Health Report Card was released. Grading A grade was assigned to each life stage based on Colorado s average rank for all indicators in that life stage. Average Rank Letter Grade 1-3 A+ 4-6 A 7-10 A B B B C C Average Rank C- Letter Grade D D D F F F- 18 Colorado Health Report Card
19 Health Indicators Endnotes Healthy Beginnings 1 United States Department of Labor. (2015). Wage and Hour Division: Family and Medical Leave Act. 2 United States Department of Labor. (2015). Selected Paid Leave Benefits: Access. 3 A Better Balance: the Work and Family Legal Center. (2015). Overview of Paid Sick Time Laws in the United States. 4 The New York Times. (2015). New Momentum on Paid Leave, in Business and in Politics. Healthy Children 5 Michigan Primary Care Association. (2015). Increasing Retention and Reducing Churn Through Innovative Renewal Strategies. uploads/2015/06/soe_mpca_presentation.pdf 6 Mathematica Policy Research and the Urban Institute. (2014). CHIPRA Mandated Evaluation of the Children s Health Insurance Program: Final Findings. Healthy Adolescents 7 Colorado Department of Health Care Policy and Financing. (2015). Family Planning Services. 8 B more for Healthy Babies. (2015). Teen Pregnancy Prevention. 9 B more for Healthy Babies. (2015). Teen Pregnancies in Baltimore Drop by a Third. Healthy Adults 10 Harvard School of Public Health. (2015). Sugary Drinks and Obesity Fact Sheet Harvard School of Public Health. (2015). Soft Drinks and Disease The State of Obesity. (2015). The State of Obesity in Colorado The Guardian. (2015). How one of the most obese countries on earth took on the soda giants. Healthy Aging 14 American Association of Retired Persons. (2012). The United States of Aging Survey aarp.pdf 15 The Henry J. Kaiser Family Foundation. (2015). 10 FAQs: Medicare s Role in End-of-Life Care.
20 501 South Cherry Street, Suite 1100 Denver, Colorado Phone: Contributing Members Jaclyn Lensen Keri Jones Dustin Moyer Kyle Legleiter Kaye Boeke Kindle Morell Taryn Fort E. 17th Avenue, Suite 930 Denver, Colorado Phone: Contributing Members Sara Schmitt Deborah Goeken Brian Clark Rebecca Silvernale Jessica Fern Cliff Foster
THE 2016 COLORADO. Celebrating a Decade of Data DATA SPOTLIGHT: Mental Health #COHRC.
 THE 2016 COLORADO Celebrating a Decade of Data DATA SPOTLIGHT: Mental Health www.coloradohealth.org/reportcard #COHRC The Colorado Health Report Card tracks Colorado s performance on 38 key health indicators.
HIP Year 2020 Health Objectives related to Perinatal Health:
 PERINATAL HEALTH Perinatal health is the health and wellbeing of mothers and babies before, during, and after child birth. As described by Healthy People 2020, Pregnancy can provide an opportunity to identify
Family Matters in Oral Health
 Family Matters in Oral Health CONNECTING CHILDREN S AND CAREGIVERS DENTAL HEALTH HABITS FEBRUARY 2018 When parents or other caregivers receive dental care, it s good for more than just their own health.
Oral Health in Colorado
 Oral Health in Colorado Progress and Opportunities Sara Schmitt Director of Community Health Policy Prepared for the Delta Dental of Colorado Foundation September 2017 About Us: Inform State and National
5 Public Health Challenges
 5 Public Health Challenges The most recent Mecklenburg County Community Health Assessment (CHA) prioritized the prevention of premature death and disability from chronic disease as the number one public
Sarpy/Cass Department of Health and Wellness
 This 2012 Community Health Report Card is the product of many community surveys and agency recordkeeping. The staff at the Sarpy/ Department of Health and Wellness finds value in all of this community
2016 Collier County Florida Health Assessment Executive Summary
 2016 Florida Health Assessment Executive Summary Prepared by: The Health Planning Council of Southwest Florida, Inc. www.hpcswf.com Executive Summary To access the report in its entirety, visit http://www.hpcswf.com/health-planning/health-planningprojects/.
The Healthy Indiana Plan
 The Healthy Indiana Plan House Enrolled Act 1678 A Pragmatic Approach Governor Mitch Daniels July 16, 2007 Indiana s Fiscal Health is Good First Back-to-Back Balanced Budget in Eight Years $1,000.0 Revenue
Trends in Ohioans Health Status and Income
 October 200 Trends in Ohioans Health Status and Income Since 2005, household incomes in Ohio have steadily declined. In 2005, 65% of Ohio adults were living in households with an annual income over 200%
Will California s Health Care Reform Make Californians Healthier?
 Will California s Health Care Reform Make Californians Healthier? E. Richard Brown, PhD Director, UCLA Center for Health Policy Research Professor, UCLA School of Public Health Council of State Governments
Community Health Status Assessment
 Community Health Status Assessment EXECUTIVE SUMMARY The Community Health Status Assessment (CHSA) is one of four assessments completed as part of the 2015-2016 Lane County Community Health Needs Assessment
Almost 1 in 10 adults have been diagnosed with diabetes. Alabama is ranked fifth in prevalence of diabetes in the United States and its territories.
 2008 FACT SHEET The Diabetes Branch addresses the impact of diabetes in Alabama by developing policies, recommendations, and programs about the disease and related issues. The program is funded through
OVERVIEW OF WOMEN S HEALTH PROGRAMS
 The women s health programs in Texas provide access to women s health, family planning, prenatal, and preventive care services to eligible women in need. In addition to improving health outcomes, the women
MetroWest Adolescent Health Survey
 MetroWest Adolescent Health Survey Informing data driven school and community health policies and practices 2016 High School Report GRADES 9-12 Spring 2017 Funded by: MetroWest Health Foundation Submitted
Dental Care Remains the No. 1 Unmet Health Care Need for Children and Low-Income Adults
 Oral Health and Access to Dental Care for Ohioans, 2007 Dental Care Remains the No. 1 Unmet Health Care Need for Children and Low-Income Adults Oral Health and Access to Dental Care for Ohioans, 2007
WASHINGTON STATE COMPARISONS TO: KITSAP COUNTY CORE PUBLIC HEALTH INDICATORS May 2015
 WASHINGTON STATE COMPARISONS TO: KITSAP COUNTY CORE PUBLIC HEALTH INDICATORS This is a companion document to the Core Public Health Indicators that provides a comparison of to Washington State for the
Kay Johnson, MPH, EdM February 14, 2012 Association of Maternal and Child Health Programs, Washington DC
 Implementing Health Reform and Improving MCH: Opportunities Kay Johnson, MPH, EdM February 14, 2012 Association of Maternal and Child Health Programs, Washington DC Acknowledgements This presentation builds
County Health Rankings Monroe County 2016
 Health Rankings Monroe 2016 Graphics of Health Rankings Include All Counties In the North Central Health District Public Health for Middle Georgia Serving Baldwin, Bibb, Crawford, Hancock, Houston, Jasper,
PHACS County Profile Report for Searcy County. Presented by: Arkansas Center for Health Disparities and Arkansas Prevention Research Center
 PHACS County Profile Report for Searcy County Presented by: Arkansas Center for Health Disparities and Arkansas Prevention Research Center Contents Introduction... Page 2 Demographics...Page 3 Social Environment
50-STATE REPORT CARD
 JANUARY 2014 The State of Reproductive Health and Rights: 50-STATE REPORT CARD U.S. REPRODUCTIVE HEALTH AND RIGHTS AT A CROSSROADS The status of reproductive health and rights in the U.S. is at an historic
County Health Rankings Baldwin County 2016 Graphics of County Health Rankings Include All Counties In the North Central Health District
 Health Rankings Baldwin 2016 Graphics of Health Rankings Include All Counties In the North Central Health District Public Health for Middle Georgia Serving Baldwin, Bibb, Crawford, Hancock, Houston, Jasper,
2014 Healthy Community Study Executive Summary
 2014 Healthy Community Study Executive Summary BACKGROUND The Rockford Health Council (RHC) exists to build and improve community health in the region. To address this mission, RHC conducts a Healthy Community
Increasing Access to Healthy Food
 sound research. Bold Solutions.. Policy BrieF. June 29, 2009 Increasing Access to Healthy Food By Stacey Schultz Access to affordable, healthy food including fresh fruits and vegetables is essential for
HealtheCNY Indicator List by Data Source
 American Community Survey 23 Adults with Health Insurance Children Living Below Poverty Level Children with Health Insurance Families Living Below Poverty Level Homeowner Vacancy Rate Homeownership Households
71 Potential Leading Health Indicators for Healthy Alaskans 2020: Documenting Progress Towards 25 LHIs
 71 Potential Leading Health Indicators for Healthy Alaskans 2020: Documenting Progress Towards 25 LHIs : Documenting Progress Towards 25 LHIs The purpose of this report is to document the data and information
The State of Obesity 2017 Better Policies for a Healthier America
 The State of Obesity 2017 Better Policies for a Healthier America Southern Obesity Summit Atlanta, GA October 2, 2017 Richard Hamburg Executive Vice President and COO Trust for America s Health Overview
EMBARGOED UNTIL: December 9, 12:01 a.m.
 2010 Health Report Card Findings Summary The 2010 edition of Making the Grade on Women s Health: A National and State-by-State Report Card shows that the nation and the states continue to fall short in
These are more than words. They are the principles and philosophy that drive every decision that ProMedica makes as an organization.
 Foreword Mission-driven. Community-based. Not-for-profit. These are more than words. They are the principles and philosophy that drive every decision that ProMedica makes as an organization. With people
women.nyc Fast Facts
 women.nyc Fast Facts Make A #NYCPowerMove. WHY NYC IS THE BEST CITY IN THE WORLD FOR WOMEN: NYC has more women CEOs than any other city in the country. NYC has the smallest wage gap in the country. NYC
PREVENTION. Category: Initiation of Tobacco Use. Strategies to Reduce tobacco use initiation. used smokeless tobacco on one or more of the
 Goal 1: Reduce incidence and mortality from tobaccorelated cancers (lung, throat, mouth, pancreas, kidney, bladder and cervix) in all populations. Category: Initiation of Tobacco Use OBJECTIVE 1.1: By
Factual Information Contained in this Report: PURPOSE. Health Perceptions. Health Insurance Coverage. Health Care Access. Preventive Health Care
 Factual Information Contained in this Report: Health Perceptions Health Insurance Coverage Health Care Access Preventive Health Care Maternal and Child Health Alcohol, Tobacco, and Other Drug Use PURPOSE
Healthy People, Healthy Communities
 Healthy People, Healthy Communities Public Health Policy Statements on Public Health Issues The provincial government plays an important role in shaping policies that impact both individual and community
Arizona Health Improvement Plan
 Arizona Health Improvement Plan Arizona Alliance for Community Health Centers February 4, 2015 Will Humble, MPH ADHS Director Leading Health Issues State Health Assessment Obesity Behavioral Health Services
RHODE ISLAND CANCER PREVENTION AND CONTROL
 RHODE ISLAND CANCER PREVENTION AND CONTROL 2013 2018 STRATEGIC PLAN TABLE OF CONTENTS Purpose 1 The Partnership to Reduce Cancer 3 Prevention 4 Tobacco 4 Healthy Weight 6 Nutrition 6 Physical Activity
Executive Summary To access the report in its entirety, visit
 Executive Summary To access the report in its entirety, visit http://www.hpcswf.com/health-planning/health-planningprojects/. Demographic and Socioeconomic Characteristics Population Demographics has a
Chapter 7 Health: Health and Access To Care
 Chapter 7 Health: Health and Access To Care Percent of Pregnant Women Aged - The Health of Northwest Residents An optimal quality of life mandates a complete state of physical and mental well-being. This
Policies Affecting Our Food Environment
 Policies Affecting Our Food Environment Amy L. Yaroch, Ph.D. Gretchen Swanson Center for Nutrition, Omaha, NE About Us Independent research institution providing scientific expertise, partnership and resources
COMMUNITY HEALTH NEEDS ASSESSMENT AND IMPLEMENATION PLAN JUNE 2016
 COMMUNITY HEALTH NEEDS ASSESSMENT AND IMPLEMENATION PLAN JUNE 2016 is, and has been an active member of the Healthy Blair County Coalition. Representatives of have been members of the Steering Committee,
2012 Assessment of St. Lucie County s Social, Health, and Public Safety Services
 2012 Assessment of St. Lucie County s Social, Health, and Public Safety Services April 5, 2013 140 Intracoastal Pointe Drive, Suite 212 Jupiter, FL 33477-5064 561.744.5662 Fax: 561.575.7396 www.sra-researchgroup.com
SPARTANBURG COUNTY BODY MASS INDEX (BMI) REPORT
 REPORT") SPARTANBURG COUNTY BODY MASS INDEX (BMI) REPORT 1 st, 3 rd, and 5 th GRADE STUDENTS SCHOOL YEAR 2013-2014 2 CHILDHOOD OBESITY TASK FORCE ADVISORY COMMITTEE PARTNERS 3 4 TABLE OF CONTENTS Preface.. 4 Project
SPARTANBURG COUNTY BODY MASS INDEX (BMI) REPORT 1 st, 3 rd, and 5 th GRADE STUDENTS SCHOOL YEAR 2013-2014 2 CHILDHOOD OBESITY TASK FORCE ADVISORY COMMITTEE PARTNERS 3 4 TABLE OF CONTENTS Preface.. 4 Project
Colorado Health Disparities Profiles
 Health Disparities Profiles includes: Larimer County Population Total Population Source: CDC/NCHS 2007-based, bridged-race population estimates, 2007. Social Determinants of Health 287,574 248,312 26,629
ALCOHOL 1, Percent Nearly three of five high schoolers believe it is easy to get alcohol if they wanted.
 ALCOHOL high schoolers use alcohol at a higher rate than any other substance. Nearly six of 10 (59 percent) report ever trying alcohol, closely mirroring the national rate. Alcohol is also the easiest
Executive Board of the United Nations Development Programme, the United Nations Population Fund and the United Nations Office for Project Services
 United Nations Executive Board of the United Nations Development Programme, the United Nations Population Fund and the United Nations Office for Project Services Distr.: General 12 July 2011 Original:
Savannah :: Chatham. August rd Edition COMMUNITY INDICATORS DATABASE COUNTY CHATHAM. produced by the Armstrong Public Service Center
 photo: GA Dept. of Economic Development Savannah :: Chatham COMMUNITY INDICATORS DATABASE August 2013 3rd Edition produced by the Armstrong Public Service Center CHATHAM COUNTY www.savannah-chatham-indicators.org
Rockford Health Council
 2010 Healthy Community Study Rockford Area Early Learning Council Becky Cook Kendall April 12, 2011 Rockford Health Council Community-based healthy community collaborative Formed in 1982 as the Rockford
Racial disparities in health outcomes and factors that affect health: Findings from the 2011 County Health Rankings
 Racial disparities in health outcomes and factors that affect health: Findings from the 2011 County Health Rankings Author: Nathan R. Jones, PhD University of Wisconsin Carbone Cancer Center Introduction
Prince George s County Health Department Health Report Findings
 Prince George s County Health Department 2018 Health Report Findings Our Residents Socioeconomic Factors Compared to Maryland, Prince George s residents: have a higher median household income, are employed
DRAFT: Sexual and Reproductive Rights and Health the Post-2015 Development Agenda
 DRAFT: Sexual and Reproductive Rights and Health the Post-2015 Development Agenda This draft working paper considers sexual and reproductive health and rights in the context of the post- 2015 framework.
Community Health Needs Assessment
 Community Health Needs Assessment Gratiot County Community Health Assessment Community Health Assessment Data Sources Primary Data (new data collected first-hand) Community Opinion Survey Provider Opinion
Some college. Native American/ Other. 4-year degree 13% Grad work
 Access to Affordable Health Care Access to affordable care improves quality of life and health outcomes. Without affordable access to a doctor, residents are more likely to end up in expensive emergency
HEALTH & WELL-BEING TOP LINE FINDINGS
 Health & Well-Being Reproductive Rights Violence & Safety KEY FINDINGS HEALTH & WELL-BEING TOP LINE FINDINGS Nationally, women s health status has improved in four areas and worsened in five: o Improved:
Tennessee Taming the Diabetes Crisis: The Tennessee Journey to Better Health
 Tennessee Taming the Diabetes Crisis: The Tennessee Journey to Better Health Susan R. Cooper MSN, RN Commissioner Tennessee Department of Health NCSL July 23,2009 Adult Diabetes Diabetes Prevalence, Tennessee
Colorado Health Disparities Profiles
 Health Disparities Profiles County includes: Jackson, Moffat, Rio Blanco, and Counties Population Total Population 22,382 43,638 4,861,515 21,015 39,473 3,508,736 904 3,224 909,833 140 263 228,718 210
Santa Barbara 2015 Title V Community Assessment Maternal Child & Adolescent Health. Presented by Sandra Copley, MCAH Director
 Santa Barbara 2015 Title V Community Assessment Maternal Child & Adolescent Health Presented by Sandra Copley, MCAH Director Objectives Define Title V requirements Examine local worsening and improving
2014 Edition RHODE ISLAND
 214 RHODE ISLAND America's Health Rankings is the longest running comparative health index of states. It uses measures of behavior, community and environment, policy, clinical care, and health outcomes
Why the Increase In Obesity
 Obesity From an Economist s Perspective Eric Finkelstein, PhD, MHA RTI INTERNATIONAL The Economics of Obesity (outline) Why the Increase in Obesity Rates Adverse Health Consequences Why do (or should)
Table of Contents INTRODUCTION... 2 METHODOLOGY Appendix 1 Comparison of Peer Counties... 6
 Table of Contents INTRODUCTION... 2 METHODOLOGY... 4 Appendix 1 Comparison of... 6 Appendix 2 Key Findings from the MAPP Assessments... 7 BARRIERS TO HEALTHCARE ACCESS... 7 HEALTH STATUS... 9 DEATH INDICATORS...
First Annual Tobacco Study
 Maryland Department of Health & Mental Hygiene First Annual Tobacco Study Cigarette Restitution Fund Program Tobacco Use Prevention and Cessation Program September, 2002 Table of Contents Page Executive
Obesity Prevention in Schools and Communities. The California Experience
 EXHIBIT E Obesity Prevention in Schools and Communities The California Experience Francine R. Kaufman, M.D. Professor of Pediatrics The Keck School of Medicine of USC Head, Center for Diabetes, Endocrinology
Strategies to Reduce Sugar- Sweetened Beverage Consumption: Lessons from New York City
 Strategies to Reduce Sugar- Sweetened Beverage Consumption: Lessons from New York City Anne Sperling, MPH Ashley Lederer, MS, RD Bureau of Chronic Disease Prevention NYC Department of Health and Mental
2014 Edition TENNESSEE
 214 TENNESSEE America's Health Rankings is the longest running comparative health index of states. It uses measures of behavior, community and environment, policy, clinical care, and health outcomes to
FACT SHEET % 15.0% Percent 10.0%
 FACT SHEET The Branch addresses the impact of diabetes in Alabama by developing, policies, recommendations, and programs about the disease and related issues. The program is funded through a five-year
Oral Health Provisions in Recent Health Reform: Opportunities for Public-Private Partnerships
 Oral Health Provisions in Recent Health Reform: Opportunities for Public-Private Partnerships 2010 National Primary Oral Health Conference Tuesday, October 26, 2010 Catherine M. Dunham, Executive Director
Tuscarawas County Health Department
 Tuscarawas County Health Department Community Health Needs Assessment 214 TUSCARAWAS COUNTY HEALTH DEPARTMENT Community Health Needs Assessment 214 Assessment Commissioned by: Dr. James Hubert D.O Health
New Mexico Department of Health. Racial and Ethnic Health Disparities Report Card
 New Mexico Department of Health Racial and Ethnic Health Disparities Report Card August 30, 2006 Acknowledgments Many individuals contributed to the production of this report card and the Office of Policy
Whereas, nationally, students do not participate in sufficient vigorous physical activity and do not attend daily physical education classes;
 REITZ MEMORIAL HIGH SCHOOL WELLNESS POLICY Preamble Whereas, children need access to healthful foods and opportunities to be physically active in order to grow, learn, and thrive; Whereas, good health
Early Childhood Mental Health and Homelessness
 Issue Brief No. 1 September, 2013 Early Childhood Mental Health and Homelessness A Brief Overview of Family Homelessness The United States has the highest number of children who experience homelessness
Black Women s Access to Health Insurance
 FACT SHEET Black Women s Access to Health Insurance APRIL 2018 Data released by the U.S. Census Bureau show that, despite significant health insurance gains since the Affordable Care Act (ACA) was implemented,
Healthy People 2010 Leading Health Indicators: California, 2000
 January 4 DATA SUMMARY No. DS4- Healthy People Leading Health Indicators: California, By Jim Sutocky This report focuses on the Healthy People Leading Health Indicators (LHIs). H i g h l i g h t s As of
Violence Prevention: Rethinking the Standard of Care for Family Planning
 Violence Prevention: Rethinking the Standard of Care for Family Planning Policy Brief For more than a decade, public health policies have been enacted to reduce health disparities in communities of color.
Basic and Preventive Care
 Basic and Preventive Care Mason County Data Series Health Insurance About 21 or over 6,900 Mason County adults had no form of health care insurance in 2008. About 1,570 or 11 of children are uninsured.
State Health System Performance: A Detailed Look at the Lone Star State
 State Health System Performance: A Detailed Look at the Lone Star State How does Texas fare in the Commonwealth Fund Scorecard on State Health System Performance? A DETAILED LOOK AT THE LONE STAR STATE
YEARS. WORKING TOGETHER to ensure that EVERYONE. HAS ACCESS to HEALTHY, AFFORDABLE FOOD FALL 2012
 20 YEARS of WORKING TOGETHER to ensure that EVERYONE HAS ACCESS to HEALTHY, AFFORDABLE FOOD FALL 2012 The Food Trust was founded 20 years ago with a simple idea: healthy change. There were neighborhoods
Module 6: Substance Use
 Module 6: Substance Use Part 1: Overview of Substance Abuse I am Martha Romney and I am presenting on substance abuse. This module focuses on the healthy people 2020 objective to reduce substance abuse
FNS. State Agencies. Program Operators Participants
 Ending Hunger Improving Nutrition Combating Obesity FNS State Agencies Program Operators Participants About 1 in 4 Americans participates in at least 1 of the U.S. Department of Agriculture s (USDA) domestic
Health Care in Appalachia. Foundations of Modern Health Care, Lecture 12 Anya K. Cope, DO
 Health Care in Appalachia Foundations of Modern Health Care, Lecture 12 Anya K. Cope, DO Learning Objectives: At the completion of this exercise, learners should be able to: Discuss the mortality rates
Module Let s Eat Well & Keep Moving: An Introduction to the Program
 Module 1 Let s Eat Well & Keep Moving: An Introduction to the Program From L.W.Y Cheung, H. Dart, S. Kalin, B. Otis, and S.L. Gortmaker, 2016, Eat Well & Keep Moving, 3rd ed. (Champaign, IL: Human Kinetics).
Community Health Needs Assessment PREPARED BY
 Community Health Needs Assessment PREPARED BY DEAR COMMUNITY PARTNERS We all know that good health is essential for a productive and thriving community. Furthermore, we understand that conditions in the
Food for Thought: Children s Diets in the 1990s. March Philip Gleason Carol Suitor
 Food for Thought: Children s Diets in the 1990s March 2001 Philip Gleason Carol Suitor Food for Thought: Children s Diets in the 1990s March 2001 Philip Gleason Carol Suitor P.O. Box 2393 Princeton, NJ
Child Hunger and Education. Lori Paisley Executive Director Healthy Schools
 Child Hunger and Education Lori Paisley Executive Director Healthy Schools 11.15.18 Child Hunger 3 out of 4 educators see students who regularly come to school hungry 57% of teachers regularly buy food
Improving School Food Environments Through District-Level Policies: Findings from Six California Case Studies. Executive Summary JULY 2006
 JULY 2006 Improving School Food Environments Through District-Level Policies: Findings from Six California Case Studies Executive Summary Prepared by: Sarah E. Samuels, Dr. P.H. Lisa Craypo, M.P.H., R.D.
The Health of Jefferson County: Updates
 The Health of Jefferson County: 2010-11 Updates Jefferson County Public Health Part I: Demographics Part II: Mental Health, Alcohol and Drug Use Part III: Health Care Access Part IV: Births, Quality of
Webinar Series: Diabetes Epidemic & Action Report (DEAR) for Washington State - How We Are Doing and How We Can Improve.
 for Washington State - How We Are Doing and How We Can Improve.") Webinar Series: Diabetes Epidemic & Action Report (DEAR) for Washington State - How We Are Doing and How We Can Improve April 22, 2015 Qualis Health A leading national population health management organization
Webinar Series: Diabetes Epidemic & Action Report (DEAR) for Washington State - How We Are Doing and How We Can Improve April 22, 2015 Qualis Health A leading national population health management organization
ADVOCATING FOR PATIENTS WITH DIABETES
 ADVOCATING FOR PATIENTS WITH DIABETES February 9, 2018 Lashawn Mciver, MD, MPH Senior vice president Government affairs & advocacy Overview 1) Highlight 2017 Advocacy Accomplishments 2) Outline 2018 Advocacy
Community Health Priority: Alcohol & Other Drug Misuse and Abuse
 Alcohol & Other Drug Misuse and Abuse Melissa Dotter, MS Drug Free Communities Coordinator 715.261.1962 melissa.dotter@co.marathon.wi.us Creating a culture in communities where alcohol is used responsibly
Tennessee Tobacco Settlement Health Councils Planning Meeting. Tennessee Public Health Association September 12, 2103
 Tennessee Tobacco Settlement Health Councils Planning Meeting Tennessee Public Health Association September 12, 2103 Session Objectives Identify facts regarding tobacco use and its relationship to county
Childhood Obesity: A National Focus
 Childhood Obesity: A National Focus Christopher Roller Director of Advocacy and State Health Alliances American Heart Association, Nevada Presentation to the WCHD Childhood Obesity Forum, September 15
05/26/2011 Page 1 of 15
 Number of IYS 2010 Respondents N Total Grade 198 203 401 Avg Age N Avg How old are you? 11.9 198 13.9 203 Gender % N % N Female 4 96 5 115 Male 5 99 4 87 Race/Ethnicity N % N % N White 8 165 8 176 Black
05/26/2011 Page 1 of 15
 Number of IYS 2010 Respondents N Total Grade 101 102 203 Avg Age N Avg How old are you? 11.8 101 13.7 102 Gender % N % N Female 4 43 5 52 Male 5 57 4 50 Race/Ethnicity N % N % N White 9 97 9 99 Black /
Jackson County Community Health Assessment
 2016 Jackson County Community Health Assessment With Collaboration from Black River Memorial Hospital and Jackson County Public Health Wisconsin Population Health Institute Table of Contents Structure
Health of the City & Community Health Improvement Planning. Raynard Washington, PhD, MPH Chief Epidemiologist
 Health of the City & Community Health Improvement Planning Raynard Washington, PhD, MPH Chief Epidemiologist What is the Community Health Assessment (CHA)? An annual assessment of population health in
Health Profile Chartbook 2016 Kalkaska County
 Health Profile Chartbook 2016 Kalkaska County 2016 Chartbooks The 2016 Chartbooks provide a snapshot of the health status of the District Health Department #10 jurisdiction. Information is presented by
Health Profile Chartbook 2016 Mecosta County
 Health Profile Chartbook 2016 Mecosta County 2016 Chartbooks The 2016 Chartbooks provide a snapshot of the health status of the District Health Department #10 jurisdiction. Information is presented by
HEALTH REFORM & HEALTH CARE FOR THE HOMELESS POLICY BRIEF JUNE 2010
 HEALTH REFORM & HEALTH CARE FOR THE HOMELESS CREATING HEALTHIER COMMUNITIES: CHRONIC DISEASE PREVENTION INITIATIVES OF INTEREST TO HEALTH CENTERS Chronic disease is the leading cause of death and disability
05/27/2011 Page 1 of 15
 Number of IYS 2010 Respondents N Total Grade 218 194 412 Age Avg N Avg How old are you? 11.9 218 13.8 193 Gender % N % N Female 5 112 5 103 Male 4 99 4 88 Race/Ethnicity N % N % N White 7 164 8 158 Black
MILWAUKEE COUNTY COMMUNITY HEALTH SURVEY 2015
 MILWAUKEE COUNTY COMMUNITY HEALTH SURVEY 2015 Commissioned by: Aurora Health Care Children s Hospital of Wisconsin Columbia St. Mary s Health System Froedtert Health Wheaton Franciscan Healthcare In Partnership
Worcester County Report Card 2012
 Worcester County Report Card 2012 W H Deborah Goeller, R.N., M.S. Health Officer Introduction This community health 2012 Report Card is the fourth published by the Worcester County Health Department. There
STATE AND COMMUNITY MODELS FOR IMPROVING ACCESS TO DENTAL CARE FOR THE UNDERSERVED
 American Dental Association STATE AND COMMUNITY MODELS FOR IMPROVING ACCESS TO DENTAL CARE FOR THE UNDERSERVED October 2004 Executive Summary American Dental Association. State and Community Models for
There are programs and policies that are proven life savers, and we ask that you support them.
 Testimony of the American Cancer Society Cancer Action Network On Governor Cuomo s Proposed Budget Bill Sherman, Vice President Government Relations February 2, 2015 American Cancer Society Cancer Action