Supplemental information contains 7 movies and 4 supplemental Figures
|
|
|
- Oswald Walton
- 6 years ago
- Views:
Transcription
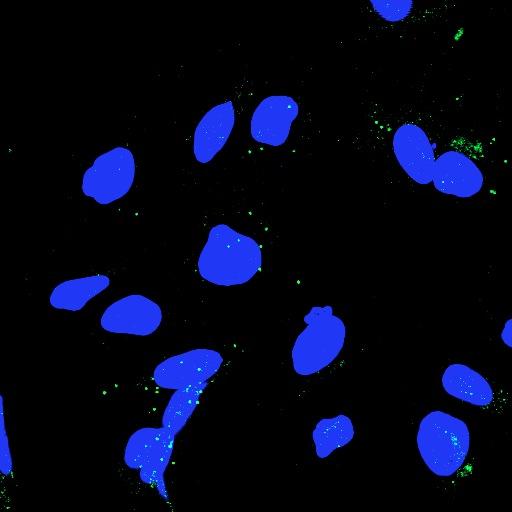
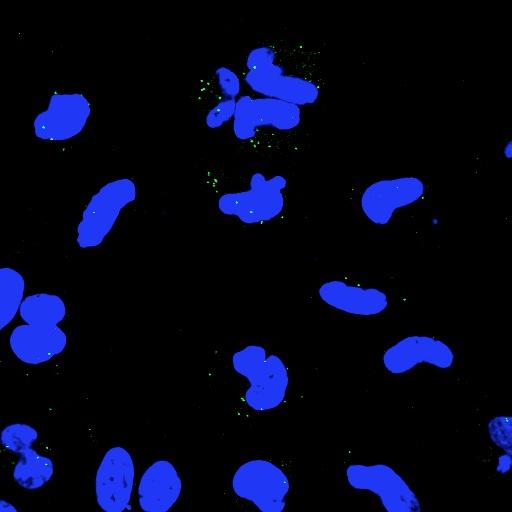
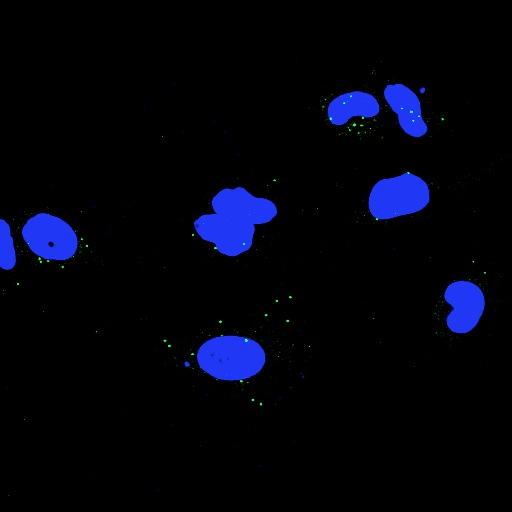
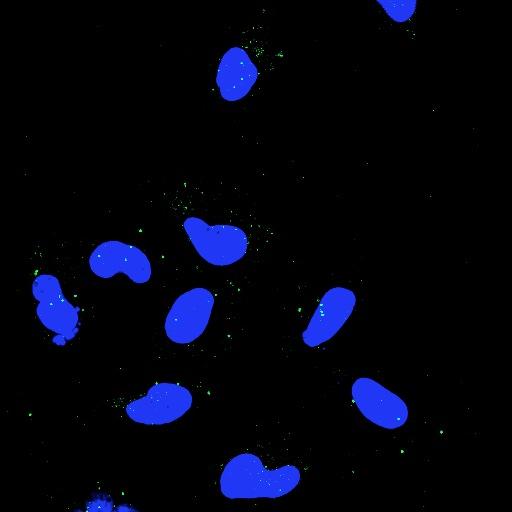
1 Supplemental information contains 7 movies and 4 supplemental Figures Movies: Movie 1. Single virus tracking of A4-mCherry-WR MV colocalization with GFP-Rab5. Movie 2. 3D trajectory profile of an A4-CFP MV particle co-trafficking with a Rab5-positive endosome after internalization. The movie records infection time at 1-14 min after virus addition and is played at 3 frames per sec. Movie 3. Single virus tracking of A4-mCherry-WR MV colocalization with GFP-Rab11. Movie 4. 3D trajectory profile of an A4-CFP MV particle colocalizing with a Rab5-positive endosome and a Rab11-positive endosome sequentially. The movie records infection time at min after virus addition and is played at 3 frames per sec. Movie 5. Single virus tracking of an A4-mCherry-WR MV colocalization with GFP-Rab22. Movie 6. 3D trajectory profile of an A4-CFP MV particle colocalizing within a Rab5-positive and Rab22-positive endosome sequentially. The movie records infection time at min after virus addition and is played at 3 frames per sec. Movie 7. Single virus tracking of time-lapsed epi-fluorescence image showed that there is no colocalization of A4-mCherry-WR MV particle with GFP-Rab7 endosome. Supplemental figures: Figure S1. Immunoblot and RT-PCR data regarding gene knock-down efficiency in HeLa cells. Figure S2. Knocking-down individual components of the WASH protein complex does not reduce WRΔA26 virus entry into HeLa cells. Figure S3. Vaccinia virus intracellular trafficking is Rab34-independent. Figure S4. Inhibition of vaccinia virus core uncoating by GTP-bound and GDP-bound mutants of Rab11 and Rab22 proteins in HeLa cells.
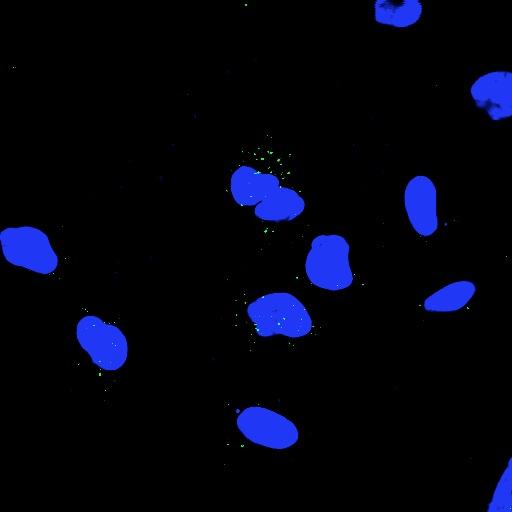
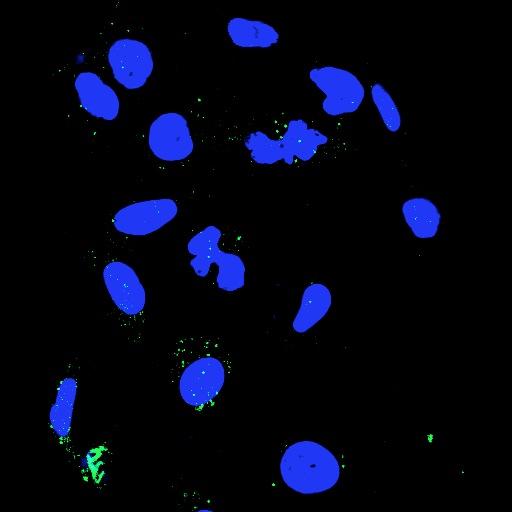
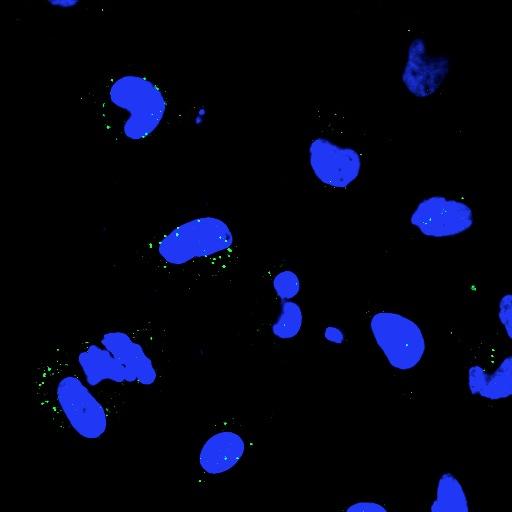
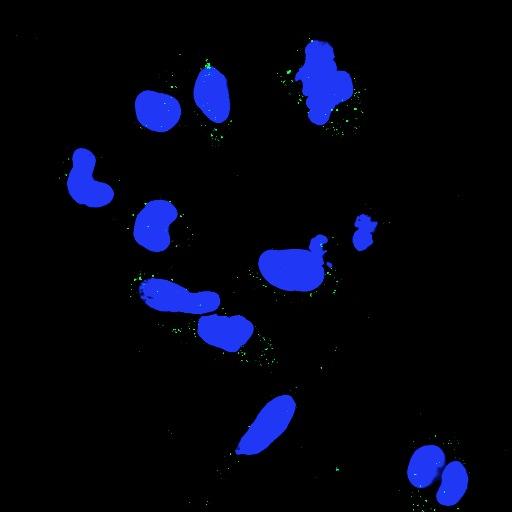
2 Movie 1. Single virus tracking of A4-mCherry-WR MV colocalization with GFP-Rab5. Time-lapsed epi-fluorescence image acquired at 37 C showed that the endocytic trafficking behavior of a A4- mcherry-wr MV particle co-localized with a GFP-Rab5 early endosome. Movie 2. 3D trajectory profile of an A4-CFP MV particle co-trafficking with a Rab5-positive endosome after internalization. Spinning-disk confocal image of an A4-CFP MV particle inoculated into mcherry-rab5 expressing HeLa cells was acquired at 37 C. The time-lapsed images were recorded in one-minute interval. The trajectories of a single virus particle and the Rab-5 positive endosomes were showed in red and blue, respectively. Movie 3. Single virus tracking of A4-mCherry-WR MV colocalization with GFP-Rab11. Timelapsed epi-fluorescence image acquired at 37 C revealed that the endocytic trafficking behavior of a A4- mcherry-wr MV particle co-localized with a GFP-Rab11 recycling endosome. Movie 4. 3D trajectory profile of an A4-CFP MV particle colocalizing with a Rab5-positive endosome and a Rab11-positive endosome sequentially. Spinning-disk confocal image of an A4-CFP MV particle inoculated into mcherry-rab5 and GFP-Rab11 expressing HeLa cells was acquired at 37 C. The time-lapsed images were recorded in one-minute interval. The trajectories of an individual virus particle, the rab5-positive endosome and the Rab11-recycling endosome were shown in red, blue and green, respectively. Movie 5. Single virus tracking of A4-mCherry-WR MV colocalization with GFP-Rab22. Timelapsed epi-fluorescence image acquired at 37 C revealed that the endocytic trafficking behavior of a A4- mcherry-wr MV particle co-localized with a GFP-Rab22 recycling endosome. Movie 6. 3D trajectory profile of an A4-CFP MV particle colocalizing within a Rab5-positive and Rab22-positive endosome sequentially. Spinning-disk confocal image of an A4-CFP MV particle traffics in the infected HeLa cells expressing both mcherry-rab5 and GFP-Rab22 at 37 C. The timelapsed images were recorded with one minute interval. The trajectories of an individual virus particle, the Rab5-positive endosome and the Rab22-positive recycling endosome were shown in red, blue and green, respectively. Movie 7. Single virus tracking of time-lapsed epi-fluorescence image showed that there is no colocalization of A4-mCherry-WR MV particle with GFP-Rab7 endosome
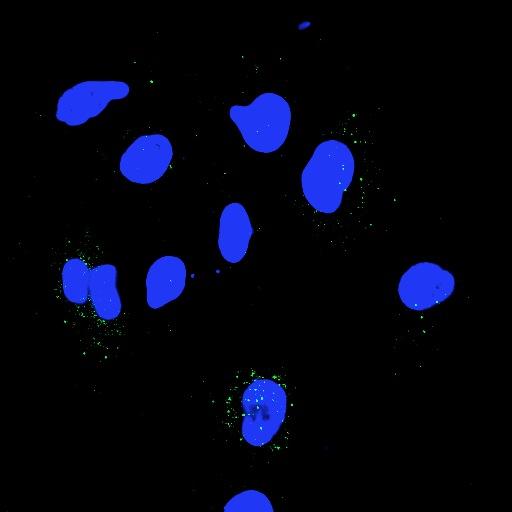
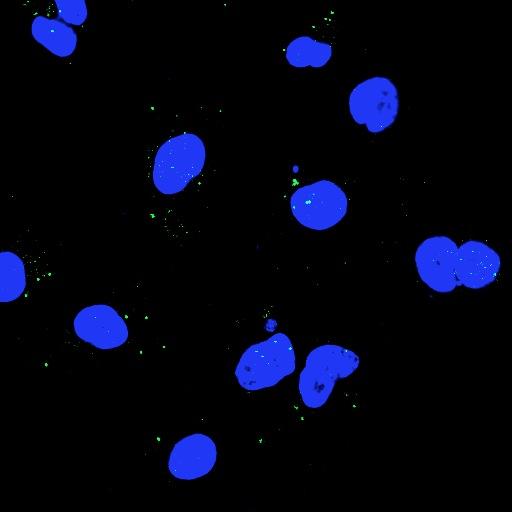
3 Figure S1. Immunoblot and RT-PCR data regarding gene knock-down efficiency in HeLa cells. (A) Immunoblot analyses of the CypB, VPEF, and CapZα1 proteins in control and sirnatreated HeLa cells. HeLa cells were either mock-transfected (Control) or transfected with sirna duplexes targeting cyclophilin B (Si-CypB), VPEF (Si-VPEF), and CapZα1 (Si-CapZα1), and then harvested for immunoblot analyses with indicated antibodies. (B) RT-PCR analyses of WASH, KIAA1033, KIAA0196, and CCD53 transcripts in control and sirna-treated HeLa cells. HeLa cells were either mock-transfected (Control) or transfected with sirna duplexes targeting WASH (Si-WASH), KIAA1033 (Si-KIAA1033), KIAA0196 (Si-KIAA0196), and CCD53 (Si-CCD53). We also included the Si-VPEF and Si-CypB cells described in A. These cells were harvested and total RNA was purified for RT-PCR analyses with gene-specific primers and control primers for the GAPDH transcript. The PCR products were separated on 2% agarose gel and the intensity of each transcript was first normalized with GAPDH (the internal control). Then the knock-down efficiency of each gene was calculated as [normalized PCR product remaining in the knock-down cells] [normalized PCR product of the same gene in the mock cells]. The experiments were repeated twice, and these sirna were effective in reducing each transcript to less than 30%. Figure S2. Knocking-down individual components of the WASH protein complex does not reduce WRΔA26 virus entry into HeLa cells. (A) HeLa cells were either mock-transfected (Control) or transfected with sirna duplexes targeting cyclophilin B (Si-CypB), VPEF (Si- VPEF), CapZα1 (Si-CapZα1), WASH (Si-WASH), KIAA1033 (Si-KIAA1033), KIAA0196 (Si- KIAA0196), HSP70A8 (Si-HSP70A8), HSP70A1A (Si-HSP70A1A), and CCD53 (Si-CCD53) and subsequently infected with WRΔA26 for virus uncoating assays. Ant-A4 antibody staining of viral cores (green) in cells were analyzed using a confocal laser scanning microscope with a 40 objective lens. (B) Quantification of viral core uncoating in the knockdown cells shown in A. The averaged viral core numbers in control HeLa cells were considered 100%.
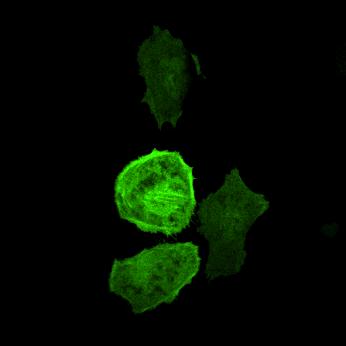
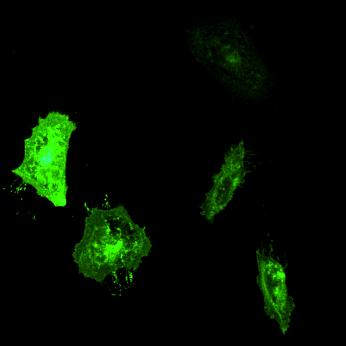
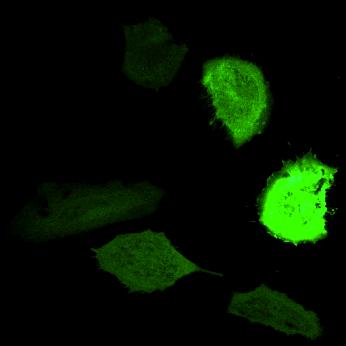
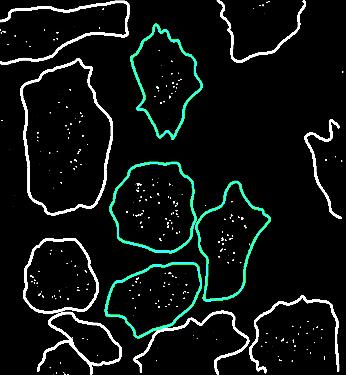
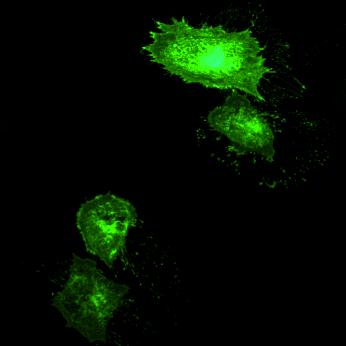
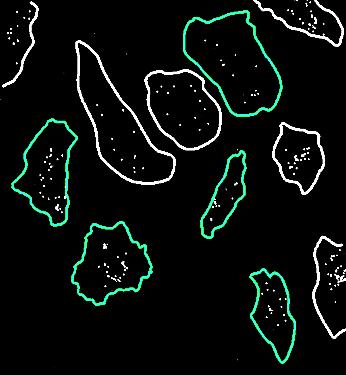
4 Figure S3. Vaccinia virus intracellular trafficking is Rab34-independent. (A) HeLa cells were transfected with individual plasmids encoding GFP, GFP-Rab34, GFP-Rab34Q11L, and GFP-Rab34T22N and then infected with WT-WR MV for virus uncoating assays. Cells were stained with anti-a4 antibody and images were collected by confocal laser scanning microscope using a 63x objective. Green and white lines delineate the edges of GFP-expressing or nonexpressing cells, respectively. (B) Quantification of the viral core uncoating assays of the cells in A. The numbers of A4 cores in control GFP-expressing cell was considered 100%. The bars represent the standard deviations of three independent experiments. Statistical significance was determined by Student s t-test. **P < Figure S4. Inhibition of vaccinia virus core uncoating by GTP-bound and GDP-bound mutants of Rab11 and Rab22 proteins in HeLa cells. HeLa cells were transfected with a pair of plasmids that encode GFP and mcherry tagged proteins as shown at the bottom of the figure, respectively. Next day these cells were infected with WT-WR MV for 2h and viral core numbers in cells expressing both GFP and mcherry fusion proteins were determined as described in Figure S3. The numbers of A4 cores in each dual-fluorescent cells (GFP +mcherry; GFP+mCherry-Rab11Q70L;GFP-Rab22Q64L+mCherry; GFP-WTRab22+mCherry-WTRab11; GFP-Rab22Q64L+mCherry-Rab11Q70L; GFP-Rab22S19N+mCherry-Rab11S25N ) were determined. The A4 core number in control cells ( GFP+mCherry) was considered as 100%. The bars represent the standard deviations of three independent experiments. Statistical significance was determined by Student s t-test. *P < **P <


5 Supplemental Figure S1 A. Immunoblot VPEF CapZα1 CypB β-actin B. RT-PCR VPEF WASH KIAA1033 KIAA0196 CCD53 CypB GAPDH Each cellular RNA is Normalized by GAPDH
6 Supplemental Figure S2 A. Control Si- CypB Si- VPEF Si- CapZα1 Si- CapZα2 Si- WASH Si- KIAA1033 Si- KIAA0196 Si- HSP70A8 Si- HSP70A1A Si- CCD53 B. 100 % of uncoating

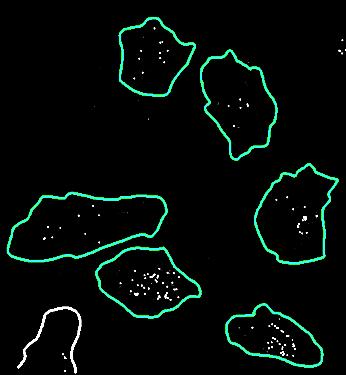
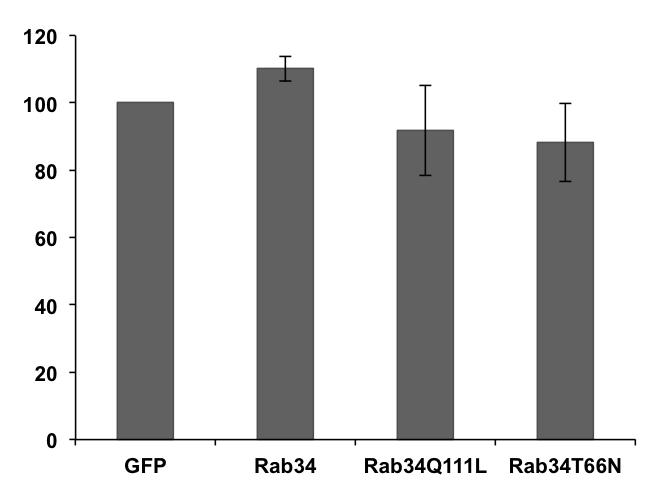
7 Supplemental Figure S3 A. GFP Core GFP- Rab34 Core GFP-Rab34Q11L Core GFP-Rab34T66N Core B. % Virus uncoating Rab34Q11L

8 Supplemental Figure S4 * ** ** ** % Virus uncoating GFP tag GFP GFP Rab22 Q64L Rab22 WT Rab22 Q64L Rab22 S19N mcherry tag mcherry Rab11 Q70L mcherry Rab11 WT Rab11 Q70L Rab11 S25N
SUPPLEMENTARY FIGURES
 SUPPLEMENTARY FIGURES Supplementary Figure 1. (A) Left, western blot analysis of ISGylated proteins in Jurkat T cells treated with 1000U ml -1 IFN for 16h (IFN) or left untreated (CONT); right, western
T H E J O U R N A L O F C E L L B I O L O G Y
 T H E J O U R N A L O F C E L L B I O L O G Y Supplemental material Lu et al., http://www.jcb.org/cgi/content/full/jcb.201012063/dc1 Figure S1. Kinetics of nuclear envelope assembly, recruitment of Nup133
IP: anti-gfp VPS29-GFP. IP: anti-vps26. IP: anti-gfp - + +
 FAM21 Strump. WASH1 IP: anti- 1 2 3 4 5 6 FAM21 Strump. FKBP IP: anti-gfp VPS29- GFP GFP-FAM21 tail H H/P P H H/P P c FAM21 FKBP Strump. VPS29-GFP IP: anti-gfp 1 2 3 FKBP VPS VPS VPS VPS29 1 = VPS29-GFP
MII. Supplement Figure 1. CapZ β2. Merge. 250ng. 500ng DIC. Merge. Journal of Cell Science Supplementary Material. GFP-CapZ β2 DNA
 A GV GVBD MI DNA CapZ β2 CapZ β2 Merge B DIC GFP-CapZ β2 Merge CapZ β2-gfp 250ng 500ng Supplement Figure 1. MII A early MI late MI Control RNAi CapZαβ DNA Actin Tubulin B Phalloidin Intensity(A.U.) n=10
Effects of UBL5 knockdown on cell cycle distribution and sister chromatid cohesion
 Supplementary Figure S1. Effects of UBL5 knockdown on cell cycle distribution and sister chromatid cohesion A. Representative examples of flow cytometry profiles of HeLa cells transfected with indicated
Fig. S1. Subcellular localization of overexpressed LPP3wt-GFP in COS-7 and HeLa cells. Cos7 (top) and HeLa (bottom) cells expressing for 24 h human
 and HeLa (bottom) cells expressing for 24 h human") Fig. S1. Subcellular localization of overexpressed LPP3wt-GFP in COS-7 and HeLa cells. Cos7 (top) and HeLa (bottom) cells expressing for 24 h human LPP3wt-GFP, fixed and stained for GM130 (A) or Golgi97
Fig. S1. Subcellular localization of overexpressed LPP3wt-GFP in COS-7 and HeLa cells. Cos7 (top) and HeLa (bottom) cells expressing for 24 h human LPP3wt-GFP, fixed and stained for GM130 (A) or Golgi97
Nature Structural and Molecular Biology: doi: /nsmb Supplementary Figure 1
 Supplementary Figure 1 Mutational analysis of the SA2-Scc1 interaction in vitro and in human cells. (a) Autoradiograph (top) and Coomassie stained gel (bottom) of 35 S-labeled Myc-SA2 proteins (input)
Supplementary Figure 1. The CagA-dependent wound healing or transwell migration of gastric cancer cell. AGS cells transfected with vector control or
 Supplementary Figure 1. The CagA-dependent wound healing or transwell migration of gastric cancer cell. AGS cells transfected with vector control or 3xflag-CagA expression vector were wounded using a pipette
Supplementary information. MARCH8 inhibits HIV-1 infection by reducing virion incorporation of envelope glycoproteins
 Supplementary information inhibits HIV-1 infection by reducing virion incorporation of envelope glycoproteins Takuya Tada, Yanzhao Zhang, Takayoshi Koyama, Minoru Tobiume, Yasuko Tsunetsugu-Yokota, Shoji
Supplementary information
 Supplementary information Human Cytomegalovirus MicroRNA mir-us4-1 Inhibits CD8 + T Cell Response by Targeting ERAP1 Sungchul Kim, Sanghyun Lee, Jinwook Shin, Youngkyun Kim, Irini Evnouchidou, Donghyun
A. List of selected proteins with high SILAC (H/L) ratios identified in mass
 ratios identified in mass") Supplementary material Figure S1. Interaction between UBL5 and FANCI A. List of selected proteins with high SILAC (H/L) ratios identified in mass spectrometry (MS)-based analysis of UBL5-interacting proteins,
Supplementary material Figure S1. Interaction between UBL5 and FANCI A. List of selected proteins with high SILAC (H/L) ratios identified in mass spectrometry (MS)-based analysis of UBL5-interacting proteins,
Supplemental Materials Molecular Biology of the Cell
 Supplemental Materials Molecular Biology of the Cell Garcia-Alvarez et al. Supplementary Figure Legends Figure S1.Expression and RNAi-mediated silencing of STIM1 in hippocampal neurons (DIV, days in vitro).
Supplementary Materials for
 www.sciencesignaling.org/cgi/content/full/7/334/rs4/dc1 Supplementary Materials for Rapidly rendering cells phagocytic through a cell surface display technique and concurrent Rac activation Hiroki Onuma,
Supporting Information
 Supporting Information Palmisano et al. 10.1073/pnas.1202174109 Fig. S1. Expression of different transgenes, driven by either viral or human promoters, is up-regulated by amino acid starvation. (A) Quantification
(a) Significant biological processes (upper panel) and disease biomarkers (lower panel)
 Significant biological processes (upper panel) and disease biomarkers (lower panel)") Supplementary Figure 1. Functional enrichment analyses of secretomic proteins. (a) Significant biological processes (upper panel) and disease biomarkers (lower panel) 2 involved by hrab37-mediated secretory
Supplementary Figure 1. Functional enrichment analyses of secretomic proteins. (a) Significant biological processes (upper panel) and disease biomarkers (lower panel) 2 involved by hrab37-mediated secretory
SUPPLEMENTARY LEGENDS...
 TABLE OF CONTENTS SUPPLEMENTARY LEGENDS... 2 11 MOVIE S1... 2 FIGURE S1 LEGEND... 3 FIGURE S2 LEGEND... 4 FIGURE S3 LEGEND... 5 FIGURE S4 LEGEND... 6 FIGURE S5 LEGEND... 7 FIGURE S6 LEGEND... 8 FIGURE
Supplementary information. The Light Intermediate Chain 2 Subpopulation of Dynein Regulates Mitotic. Spindle Orientation
 Supplementary information The Light Intermediate Chain 2 Subpopulation of Dynein Regulates Mitotic Spindle Orientation Running title: Dynein LICs distribute mitotic functions. Sagar Mahale a, d, *, Megha
293T cells were transfected with indicated expression vectors and the whole-cell extracts were subjected
 SUPPLEMENTARY INFORMATION Supplementary Figure 1. Formation of a complex between Slo1 and CRL4A CRBN E3 ligase. (a) HEK 293T cells were transfected with indicated expression vectors and the whole-cell
 13 13 1 1 1 12 0250512 24 1 1 48 1 70250512 24 1 148 1 0250512 24 1 48 1313 7025 0512 24 1 48 1313 13 13 11 24 0250512 48 1 7 124 0250512 48 1 124 0250512 48 13 13 7124 0250512 48 1313 13 13 1350250512
SUPPLEMENTARY INFORMATION
 DOI: 10.1038/ncb2988 Supplementary Figure 1 Kif7 L130P encodes a stable protein that does not localize to cilia tips. (a) Immunoblot with KIF7 antibody in cell lysates of wild-type, Kif7 L130P and Kif7
SUPPLEMENTARY INFORMATION
 DOI: 10.1038/ncb2566 Figure S1 CDKL5 protein expression pattern and localization in mouse brain. (a) Multiple-tissue western blot from a postnatal day (P) 21 mouse probed with an antibody against CDKL5.
Appendix. Table of Contents
 Appendix Table of Contents Appendix Figures Figure S1: Gp78 is not required for the degradation of mcherry-cl1 in Hela Cells. Figure S2: Indel formation in the MARCH6 sgrna targeted HeLa clones. Figure
Dynamic Interaction of Stress Granule, DDX3X and IKK-α Mediates Multiple Functions in
 Dynamic Interaction of Stress Granule, and Mediates Multiple Functions in Hepatitis C Virus Infection Véronique Pène, Qisheng Li#, Catherine Sodroski, Ching-Sheng Hsu, T. Jake Liang# Liver Diseases Branch,
a Anti-Dab2 RGD Merge
 a Anti-Da Merge *** ** Percentage of cells adhered 8 6 4 RGE RAD RGE RAD Supplementary Figure Da are localized at clusters. (a) Endogenous Da is localized at clusters. (), ut not RGE nor RAD peptides can
Supplementary Figure 1. Prevalence of U539C and G540A nucleotide and E172K amino acid substitutions among H9N2 viruses. Full-length H9N2 NS
 Supplementary Figure 1. Prevalence of U539C and G540A nucleotide and E172K amino acid substitutions among H9N2 viruses. Full-length H9N2 NS nucleotide sequences (a, b) or amino acid sequences (c) from
Supplementary Information
 Supplementary Information Supplementary Figure 1. EBV-gB 23-431 mainly exists as trimer in HEK 293FT cells. (a) Western blotting analysis for DSS crosslinked FLAG-gB 23-431. HEK 293FT cells transfected
Supplemental Data. Wang et al. (2013). Plant Cell /tpc
. Plant Cell /tpc") Supplemental Data. Wang et al. (2013). Plant Cell 10.1105/tpc.112.108993 Supplemental Figure 1. 3-MA Treatment Reduces the Growth of Seedlings. Two-week-old Nicotiana benthamiana seedlings germinated on
Supplemental Data. Wang et al. (2013). Plant Cell 10.1105/tpc.112.108993 Supplemental Figure 1. 3-MA Treatment Reduces the Growth of Seedlings. Two-week-old Nicotiana benthamiana seedlings germinated on
T H E J O U R N A L O F C E L L B I O L O G Y
 T H E J O U R N A L O F C E L L B I O L O G Y Supplemental material Dunsch et al., http://www.jcb.org/cgi/content/full/jcb.201202112/dc1 Figure S1. Characterization of HMMR and CHICA antibodies. (A) HeLa
Supplementary Fig. S1. Schematic diagram of minigenome segments.
 open reading frame 1565 (segment 5) 47 (-) 3 5 (+) 76 101 125 149 173 197 221 246 287 open reading frame 890 (segment 8) 60 (-) 3 5 (+) 172 Supplementary Fig. S1. Schematic diagram of minigenome segments.
F-actin VWF Vinculin. F-actin. Vinculin VWF
 a F-actin VWF Vinculin b F-actin VWF Vinculin Supplementary Fig. 1. WPBs in HUVECs are located along stress fibers and at focal adhesions. (a) Immunofluorescence images of f-actin (cyan), VWF (yellow),
Supplementary figures
 Supplementary figures Supplementary Figure 1. B cells stimulated with pokeweed mitogen display normal mitotic figures but not cells infected with B95-8. The figures show cells stimulated with pokeweed
Tel: ; Fax: ;
 Tel.: +98 216 696 9291; Fax: +98 216 696 9291; E-mail: mrasadeghi@pasteur.ac.ir Tel: +98 916 113 7679; Fax: +98 613 333 6380; E-mail: abakhshi_e@ajums.ac.ir A Soluble Chromatin-bound MOI 0 1 5 0 1 5 HDAC2
SUPPLEMENTARY INFORMATION
 SUPPLEENTRY INFORTION DOI: 1.138/ncb2577 Early Telophase Late Telophase B icrotubules within the ICB (percent of total cells in telophase) D G ultinucleate cells (% total) 8 6 4 2 2 15 1 5 T without gaps
Nature Structural & Molecular Biology: doi: /nsmb.3218
 Supplementary Figure 1 Endogenous EGFR trafficking and responses depend on biased ligands. (a) Lysates from HeLa cells stimulated for 2 min. with increasing concentration of ligands were immunoblotted
Supplemental Materials. STK16 regulates actin dynamics to control Golgi organization and cell cycle
 Supplemental Materials STK16 regulates actin dynamics to control Golgi organization and cell cycle Juanjuan Liu 1,2,3, Xingxing Yang 1,3, Binhua Li 1, Junjun Wang 1,2, Wenchao Wang 1, Jing Liu 1, Qingsong
Tyrosine phosphorylation and protein degradation control the transcriptional activity of WRKY involved in benzylisoquinoline alkaloid biosynthesis
 Supplementary information Tyrosine phosphorylation and protein degradation control the transcriptional activity of WRKY involved in benzylisoquinoline alkaloid biosynthesis Yasuyuki Yamada, Fumihiko Sato
Reviewers' comments: Reviewer #1 (Remarks to the Author):
:") Reviewers' comments: Reviewer #1 (Remarks to the Author): Nature Communications manuscript number NCOMMS-16-15882, by Miyakawa et al. presents an intriguing analysis of the effects of the tumor suppressor
Reviewers' comments: Reviewer #1 (Remarks to the Author): Nature Communications manuscript number NCOMMS-16-15882, by Miyakawa et al. presents an intriguing analysis of the effects of the tumor suppressor
T H E J O U R N A L O F C E L L B I O L O G Y
 Supplemental material Chen et al., http://www.jcb.org/cgi/content/full/jcb.201210119/dc1 T H E J O U R N A L O F C E L L B I O L O G Y Figure S1. Lack of fast reversibility of UVR8 dissociation. (A) HEK293T
Dual Function of CD81 in Influenza Virus Uncoating and Budding
 Dual Function of CD81 in Influenza Virus Uncoating and Budding The Harvard community has made this article openly available. Please share how this access benefits you. Your story matters. Citation Published
Supplementary Figure 1: Co-localization of reconstituted L-PTC and dendritic cells
 a CD11c Na + K + ATPase Na + K + ATPase CD11c x-y CD11c Na + K + ATPase Na + K + ATPase CD11c x-z c b x-y view BoNT NAPs CD11c BoNT CD11c NAPs BoNT NAPs CD11c 90 x-z view Apical Basolateral Supplementary
El Azzouzi et al., http ://www.jcb.org /cgi /content /full /jcb /DC1
 Supplemental material JCB El Azzouzi et al., http ://www.jcb.org /cgi /content /full /jcb.201510043 /DC1 THE JOURNAL OF CELL BIOLOGY Figure S1. Acquisition of -phluorin correlates negatively with podosome
RAW264.7 cells stably expressing control shrna (Con) or GSK3b-specific shrna (sh-
 or GSK3b-specific shrna (sh-") 1 a b Supplementary Figure 1. Effects of GSK3b knockdown on poly I:C-induced cytokine production. RAW264.7 cells stably expressing control shrna (Con) or GSK3b-specific shrna (sh- GSK3b) were stimulated
1 a b Supplementary Figure 1. Effects of GSK3b knockdown on poly I:C-induced cytokine production. RAW264.7 cells stably expressing control shrna (Con) or GSK3b-specific shrna (sh- GSK3b) were stimulated
Supplementary Figure S1
 Supplementary Figure S1 Supplementary Figure S1. PARP localization patterns using GFP-PARP and PARP-specific antibody libraries GFP-PARP localization in non-fixed (A) and formaldehyde fixed (B) GFP-PARPx
Supplementary material Legends to Supplementary Figures Figure S1. Figure S2. Figure S3.
 Supplementary material Legends to Supplementary Figures. Figure S1. Expression of BICD-N-MTS fusion does not affect the distribution of the Golgi and endosomes. HeLa cells were transfected with GFP-BICD-N-MTS
Supplementary Figure 1.TRIM33 binds β-catenin in the nucleus. a & b, Co-IP of endogenous TRIM33 with β-catenin in HT-29 cells (a) and HEK 293T cells
 and HEK 293T cells") Supplementary Figure 1.TRIM33 binds β-catenin in the nucleus. a & b, Co-IP of endogenous TRIM33 with β-catenin in HT-29 cells (a) and HEK 293T cells (b). TRIM33 was immunoprecipitated, and the amount of
Supplementary Figure 1.TRIM33 binds β-catenin in the nucleus. a & b, Co-IP of endogenous TRIM33 with β-catenin in HT-29 cells (a) and HEK 293T cells (b). TRIM33 was immunoprecipitated, and the amount of
Tumor suppressor Spred2 interaction with LC3 promotes autophagosome maturation and induces autophagy-dependent cell death
 www.impactjournals.com/oncotarget/ Oncotarget, Supplementary Materials 2016 Tumor suppressor Spred2 interaction with LC3 promotes autophagosome maturation and induces autophagy-dependent cell death Supplementary
ACC ELOVL MCAD. CPT1α 1.5 *** 0.5. Reverbα *** *** 0.5. Fasted. Refed
 Supplementary Figure A 8 SREBPc 6 5 FASN ELOVL6.5.5.5 ACC.5.5 CLOCK.5.5 CRY.5.5 PPARα.5.5 ACSL CPTα.5.5.5.5 MCAD.5.5 PEPCK.5.5 G6Pase 5.5.5.5 BMAL.5.5 Reverbα.5.5 Reverbβ.5.5 PER.5.5 PER B Fasted Refed
Appendix: Subcellular localization of MIG-14::GFP in C. elegans body wall muscle cells. Pei-Tzu Yang and Hendrik C. Korswagen
 Appendix: Subcellular localization of MIG-14::GFP in C. elegans body wall muscle cells Pei-Tzu Yang and Hendrik C. Korswagen 129 SUBCELLULAR LOCALIZATION OF MIG-14 Abstract MIG-14/Wls is a Wnt binding
Supplementary Figures
 Supplementary Figures Supplementary Figure 1 Characterization of stable expression of GlucB and sshbira in the CT26 cell line (a) Live cell imaging of stable CT26 cells expressing green fluorescent protein
Supplementary Figure 1. Normal T lymphocyte populations in Dapk -/- mice. (a) Normal thymic development in Dapk -/- mice. Thymocytes from WT and Dapk
 Normal thymic development in Dapk -/- mice. Thymocytes from WT and Dapk") Supplementary Figure 1. Normal T lymphocyte populations in Dapk -/- mice. (a) Normal thymic development in Dapk -/- mice. Thymocytes from WT and Dapk -/- mice were stained for expression of CD4 and CD8.
Supplementary Figure 1. Normal T lymphocyte populations in Dapk -/- mice. (a) Normal thymic development in Dapk -/- mice. Thymocytes from WT and Dapk -/- mice were stained for expression of CD4 and CD8.
Supplementary Figure 1 Induction of cellular senescence and isolation of exosome. a to c, Pre-senescent primary normal human diploid fibroblasts
 Supplementary Figure 1 Induction of cellular senescence and isolation of exosome. a to c, Pre-senescent primary normal human diploid fibroblasts (TIG-3 cells) were rendered senescent by either serial passage
Supplementary Fig. 1. GPRC5A post-transcriptionally down-regulates EGFR expression. (a) Plot of the changes in steady state mrna levels versus
 Plot of the changes in steady state mrna levels versus") Supplementary Fig. 1. GPRC5A post-transcriptionally down-regulates EGFR expression. (a) Plot of the changes in steady state mrna levels versus changes in corresponding proteins between wild type and Gprc5a-/-
Supplementary Fig. 1. GPRC5A post-transcriptionally down-regulates EGFR expression. (a) Plot of the changes in steady state mrna levels versus changes in corresponding proteins between wild type and Gprc5a-/-
T H E J O U R N A L O F C E L L B I O L O G Y
 T H E J O U R N A L O F C E L L B I O L O G Y Supplemental material Krenn et al., http://www.jcb.org/cgi/content/full/jcb.201110013/dc1 Figure S1. Levels of expressed proteins and demonstration that C-terminal
GFP-LC3 +/+ CLU -/- kda CLU GFP. Actin. GFP-LC3 +/+ CLU -/- kda CLU GFP. Actin
 Supplementary Fig. 1 a CQ treatment ScrB OGX11 MG132 I II AZD5363 I II b GFP / / GFP / / GFP / / GFP / / GFP GFP Actin Actin ctrl CQ GFP / / GFP / / GFP / / GFP / / GFP GFP Actin Actin rapamycin rapamycincq
Tanimoto et al., http ://www.jcb.org /cgi /content /full /jcb /DC1
 Supplemental material JCB Tanimoto et al., http ://www.jcb.org /cgi /content /full /jcb.201510064 /DC1 THE JOURNAL OF CELL BIOLOGY Figure S1. Method for aster 3D tracking, extended characterization of
SUPPLEMENTARY INFORMATION
 sirna pool: Control Tetherin -HA-GFP HA-Tetherin -Tubulin Supplementary Figure S1. Knockdown of HA-tagged tetherin expression by tetherin specific sirnas. HeLa cells were cotransfected with plasmids expressing
Live cell imaging of trafficking of the chaperone complex vaccine to the ER. BMDCs were incubated with ER-Tracker Red (1 M) in staining solution for
 in staining solution for") Live cell imaging of trafficking of the chaperone complex vaccine to the ER. BMDCs were incubated with ER-Tracker Red (1 M) in staining solution for 15 min at 37 C and replaced with fresh complete medium.
Live cell imaging of trafficking of the chaperone complex vaccine to the ER. BMDCs were incubated with ER-Tracker Red (1 M) in staining solution for 15 min at 37 C and replaced with fresh complete medium.
Supplemental Materials Molecular Biology of the Cell
 Supplemental Materials Molecular Biology of the Cell Gilberti et al. SUPPLEMENTAL FIGURE LEGENDS: Figure S1: The effect of pharmacological inhibitors on particle uptake. The data presented in Figure 1
Supplementary Figure 1. SC35M polymerase activity in the presence of Bat or SC35M NP encoded from the phw2000 rescue plasmid.
 1 2 3 4 5 6 7 8 9 10 11 12 13 14 15 16 17 18 19 20 21 22 23 24 25 26 27 Supplementary Figure 1. SC35M polymerase activity in the presence of Bat or SC35M NP encoded from the phw2000 rescue plasmid. HEK293T
mock! A3AC106S! A3BE255Q! 86.7! 90.1! 88.0! 89.8! 89.0!
 a A3A A3Bi7 A3Btok A3Bwh A3Blan mock V5 DAPI merge 5 µm b edited A3A A3Bi7 A3Btok A3Blan A3Bwh A3BF38L A3BW359L mock A3AC16S A3BE255Q 79.5 79.7 8.4 81.3 82.5 83.9 85.3 86.7 88. 89. 89.8 9.1 HBV 3DPCR Td/
Supplementary table and figures
 3D single molecule tracking with multifocal plane microscopy reveals rapid intercellular transferrin transport at epithelial cell barriers Sripad Ram, Dongyoung Kim, Raimund J. Ober and E. Sally Ward Supplementary
SUPPLEMENTARY FIGURES
 SUPPLEMENTARY FIGURES Figure S1. Clinical significance of ZNF322A overexpression in Caucasian lung cancer patients. (A) Representative immunohistochemistry images of ZNF322A protein expression in tissue
Chapter 3. Expression of α5-megfp in Mouse Cortical Neurons. on the β subunit. Signal sequences in the M3-M4 loop of β nachrs bind protein factors to
 22 Chapter 3 Expression of α5-megfp in Mouse Cortical Neurons Subcellular localization of the neuronal nachr subtypes α4β2 and α4β4 depends on the β subunit. Signal sequences in the M3-M4 loop of β nachrs
Supplementary Figure 1: si-craf but not si-braf sensitizes tumor cells to radiation.
 Supplementary Figure 1: si-craf but not si-braf sensitizes tumor cells to radiation. (a) Embryonic fibroblasts isolated from wildtype (WT), BRAF -/-, or CRAF -/- mice were irradiated (6 Gy) and DNA damage
Supplementary Figure 1. Rab27a-KD inhibits speed and persistence of HEp3 cells migrating in the chick CAM. (a) Western blot analysis of Rab27a
 Western blot analysis of Rab27a") Supplementary Figure 1. Rab27a-KD inhibits speed and persistence of HEp3 cells migrating in the chick CAM. (a) Western blot analysis of Rab27a expression in GFP-expressing HEp3 cells. (b) Representative
Supplementary Figure 1. Rab27a-KD inhibits speed and persistence of HEp3 cells migrating in the chick CAM. (a) Western blot analysis of Rab27a expression in GFP-expressing HEp3 cells. (b) Representative
Dynamic Partitioning of a GPI-Anchored Protein in Glycosphingolipid-Rich Microdomains Imaged by Single-Quantum Dot Tracking
 Additional data for Dynamic Partitioning of a GPI-Anchored Protein in Glycosphingolipid-Rich Microdomains Imaged by Single-Quantum Dot Tracking Fabien Pinaud 1,3, Xavier Michalet 1,3, Gopal Iyer 1, Emmanuel
Supplementary Figure 1. PAQR3 knockdown inhibits SREBP-2 processing in CHO-7 cells CHO-7 cells were transfected with control sirna or a sirna
 Supplementary Figure 1. PAQR3 knockdown inhibits SREBP-2 processing in CHO-7 cells CHO-7 cells were transfected with control sirna or a sirna targeted for hamster PAQR3. At 24 h after the transfection,
T H E J O U R N A L O F C E L L B I O L O G Y
 T H E J O U R N A L O F C E L L B I O L O G Y Supplemental material Posch et al., http://www.jcb.org/cgi/content/full/jcb.200912046/dc1 Figure S1. Biochemical characterization of the interaction between
Nature Medicine: doi: /nm.4322
 1 2 3 4 5 6 7 8 9 10 11 Supplementary Figure 1. Predicted RNA structure of 3 UTR and sequence alignment of deleted nucleotides. (a) Predicted RNA secondary structure of ZIKV 3 UTR. The stem-loop structure
CD3 coated cover slips indicating stimulatory contact site, F-actin polymerization and
 SUPPLEMENTAL FIGURES FIGURE S1. Detection of MCs. A, Schematic representation of T cells stimulated on anti- CD3 coated cover slips indicating stimulatory contact site, F-actin polymerization and microclusters.
Supplementary Table 1. List of primers used in this study
 Supplementary Table 1. List of primers used in this study Gene Forward primer Reverse primer Rat Met 5 -aggtcgcttcatgcaggt-3 5 -tccggagacacaggatgg-3 Rat Runx1 5 -cctccttgaaccactccact-3 5 -ctggatctgcctggcatc-3
SUPPLEMENTARY INFORMATION
 DOI: 10.1038/ncb2294 Figure S1 Localization and function of cell wall polysaccharides in root hair cells. (a) Spinning-disk confocal sections of seven day-old A. thaliana seedlings stained with 0.1% S4B
SUPPLEMENTARY INFORMATION
 SUPPLEMENTARY INFORMATION doi:10.10/nature10195 NCBI gene: Tagged Subunit(s: HA-Vpx; FLAG-Cul4 HA-DCAF1 FLAG-Cul4 HA-FLAG-Vpx Mock Vpx (SIVmac 100 (a ; 0.159 (b ; 0.05 DCAF1 DDB1 DDA1 Cul4A 1; 0.024591
Figure S1. Reduction in glomerular mir-146a levels correlate with progression to higher albuminuria in diabetic patients.
 Supplementary Materials Supplementary Figures Figure S1. Reduction in glomerular mir-146a levels correlate with progression to higher albuminuria in diabetic patients. Figure S2. Expression level of podocyte
 Supplementary Figure Legends Supplementary Figure S1. Aurora-A is essential for SAC establishment in early mitosis. (a-c) RPE cells were treated with DMSO (a), MLN8237 (b) or BI2536 (c) for Two hours.
Supplementary Figure 1. Spatial distribution of LRP5 and β-catenin in intact cardiomyocytes. (a) and (b) Immunofluorescence staining of endogenous
 and (b) Immunofluorescence staining of endogenous") Supplementary Figure 1. Spatial distribution of LRP5 and β-catenin in intact cardiomyocytes. (a) and (b) Immunofluorescence staining of endogenous LRP5 in intact adult mouse ventricular myocytes (AMVMs)
Supplementary Figure 1. Spatial distribution of LRP5 and β-catenin in intact cardiomyocytes. (a) and (b) Immunofluorescence staining of endogenous LRP5 in intact adult mouse ventricular myocytes (AMVMs)
Single Particle Tracking of Human Immunodeficiency Virus Type 1 Productive Entry into Human Primary Macrophages
 Single Particle Tracking of Human Immunodeficiency Virus Type 1 Productive Entry into Human Primary Macrophages Qin Li 1, 2,, Wei Li 2,, Wen Yin 2, Jia Guo 4, Zhi-Ping Zhang 2, Dejun Zeng 2, Xiaowei Zhang
The clathrin adaptor Numb regulates intestinal cholesterol. absorption through dynamic interaction with NPC1L1
 The clathrin adaptor Numb regulates intestinal cholesterol absorption through dynamic interaction with NPC1L1 Pei-Shan Li 1, Zhen-Yan Fu 1,2, Ying-Yu Zhang 1, Jin-Hui Zhang 1, Chen-Qi Xu 1, Yi-Tong Ma
MicroRNA sponges: competitive inhibitors of small RNAs in mammalian cells
 MicroRNA sponges: competitive inhibitors of small RNAs in mammalian cells Margaret S Ebert, Joel R Neilson & Phillip A Sharp Supplementary figures and text: Supplementary Figure 1. Effect of sponges on
TITLE: Effect of MUC1 Expression on EGFR Endocytosis and Degradation in Human Breast Cancer Cell Lines
 AD AWARD NUMBER: W81XWH-06-1-0464 TITLE: Effect of MUC1 Expression on EGFR Endocytosis and Degradation in Human Breast Cancer Cell Lines PRINCIPAL INVESTIGATOR: Rachid M El Bejjani CONTRACTING ORGANIZATION:
Table S1. Primer sequences used for qrt-pcr. CACCATTGGCAATGAGCGGTTC AGGTCTTTGCGGATGTCCACGT ACTB AAGTCCATGTGCTGGCAGCACT ATCACCACTCCGAAGTCCGTCT LCOR
 Table S1. Primer sequences used for qrt-pcr. ACTB LCOR KLF6 CTBP1 CDKN1A CDH1 ATF3 PLAU MMP9 TFPI2 CACCATTGGCAATGAGCGGTTC AGGTCTTTGCGGATGTCCACGT AAGTCCATGTGCTGGCAGCACT ATCACCACTCCGAAGTCCGTCT CGGCTGCAGGAAAGTTTACA
Supplementary Materials for
 www.sciencesignaling.org/cgi/content/full/9/439/ra78/dc1 Supplementary Materials for Small heterodimer partner mediates liver X receptor (LXR) dependent suppression of inflammatory signaling by promoting
Supplementary Figure 1. Establishment of prostacyclin-secreting hmscs. (a) PCR showed the integration of the COX-1-10aa-PGIS transgene into the
 PCR showed the integration of the COX-1-10aa-PGIS transgene into the") Supplementary Figure 1. Establishment of prostacyclin-secreting hmscs. (a) PCR showed the integration of the COX-1-10aa-PGIS transgene into the genomic DNA of hmscs (PGI2- hmscs). Native hmscs and plasmid
Supplementary Figure 1. Establishment of prostacyclin-secreting hmscs. (a) PCR showed the integration of the COX-1-10aa-PGIS transgene into the genomic DNA of hmscs (PGI2- hmscs). Native hmscs and plasmid
genome edited transient transfection, CMV promoter
 Supplementary Figure 1. In the absence of new protein translation, overexpressed caveolin-1-gfp is degraded faster than caveolin-1-gfp expressed from the endogenous caveolin 1 locus % loss of total caveolin-1-gfp
Supplemental Figures:
 Supplemental Figures: Figure 1: Intracellular distribution of VWF by electron microscopy in human endothelial cells. a) Immunogold labeling of LC3 demonstrating an LC3-positive autophagosome (white arrow)
Influenza virus exploits tunneling nanotubes for cell-to-cell spread
 Supplementary Information Influenza virus exploits tunneling nanotubes for cell-to-cell spread Amrita Kumar 1, Jin Hyang Kim 1, Priya Ranjan 1, Maureen G. Metcalfe 2, Weiping Cao 1, Margarita Mishina 1,
Folliculin directs the formation of a Rab34 RILP complex to control the nutrient-dependent dynamic distribution of lysosomes
 Published online: April 3, 26 Article Folliculin directs the formation of a RILP complex to control the nutrient-dependent dynamic distribution of lysosomes Georgina P Starling,, Yan Y Yip,, Anneri Sanger,
Supplementary Information
 Supplementary Information Supplementary Figure 1: cholesterol manipulation alters the positioning of autophagosomes in cells, related to figure 1. (a) HeLa cells were treated for 24h under conditions reducing
Phosphoinositides Regulate Ciliary Protein Trafficking to Modulate Hedgehog Signaling
 Developmental Cell Supplemental Information Phosphoinositides Regulate Ciliary Protein Trafficking to Modulate Hedgehog Signaling Francesc R. Garcia-Gonzalo, Siew Cheng Phua, Elle C. Roberson, Galo Garcia
Expanded View Figures
 PEX13 functions in selective autophagy Ming Y Lee et al Expanded View Figures Figure EV1. PEX13 is required for Sindbis virophagy. A, B Quantification of mcherry-capsid puncta per cell (A) and GFP-LC3
Supplementary Figure 1. Validation of astrocytes. Primary astrocytes were
 Supplementary Figure 1. Validation of astrocytes. Primary astrocytes were separated from the glial cultures using a mild trypsinization protocol. Anti-glial fibrillary acidic protein (GFAP) immunofluorescent
Supplementary Data Table of Contents:
 Supplementary Data Table of Contents: - Supplementary Methods - Supplementary Figures S1(A-B) - Supplementary Figures S2 (A-B) - Supplementary Figures S3 - Supplementary Figures S4(A-B) - Supplementary
T H E J O U R N A L O F C E L L B I O L O G Y
 Supplemental material Edens and Levy, http://www.jcb.org/cgi/content/full/jcb.201406004/dc1 T H E J O U R N A L O F C E L L B I O L O G Y Figure S1. Nuclear shrinking does not depend on the cytoskeleton
One of the primary actions of insulin on adipose and
 DIABETES-INSULIN-GLUCAGON-GASTROINTESTINAL Rab5 Activity Regulates GLUT4 Sorting Into Insulin- Responsive and Non-Insulin-Responsive Endosomal Compartments: A Potential Mechanism for Development of Insulin
ISG15 sirna # Ctrl sirna+ifn+wt. Virus titer (Pfu/ml) hours post infection. d USP18 sirna #2 IFN
 hours post infection. d USP18 sirna #2 IFN") a ISG15 sirna Ctrl #1 #2 ISG15 conjugates IB: ISG15 Virus titer (Pfu/ml) b ISG15 sirna #2 10 7 Ctrl sirna+ifn+wt Ctrl sirna+ifn+67 10 6 ISG15 sirna+ifn+wt ISG15 sirna+ifn+67 10 5 10 4 10 3 Free ISG15 10
a ISG15 sirna Ctrl #1 #2 ISG15 conjugates IB: ISG15 Virus titer (Pfu/ml) b ISG15 sirna #2 10 7 Ctrl sirna+ifn+wt Ctrl sirna+ifn+67 10 6 ISG15 sirna+ifn+wt ISG15 sirna+ifn+67 10 5 10 4 10 3 Free ISG15 10
Figure S1. HP1α localizes to centromeres in mitosis and interacts with INCENP. (A&B) HeLa
 HeLa") SUPPLEMENTARY FIGURES Figure S1. HP1α localizes to centromeres in mitosis and interacts with INCENP. (A&B) HeLa tet-on cells that stably express HP1α-CFP, HP1β-CFP, or HP1γ-CFP were monitored with livecell
SUPPLEMENTARY FIGURES Figure S1. HP1α localizes to centromeres in mitosis and interacts with INCENP. (A&B) HeLa tet-on cells that stably express HP1α-CFP, HP1β-CFP, or HP1γ-CFP were monitored with livecell
HEK293FT cells were transiently transfected with reporters, N3-ICD construct and
 Supplementary Information Luciferase reporter assay HEK293FT cells were transiently transfected with reporters, N3-ICD construct and increased amounts of wild type or kinase inactive EGFR. Transfections
SUPPLEMENTARY INFORMATION
 Supplementary Figure 1. Formation of the AA5x. a, Camera lucida drawing of embryo at 48 hours post fertilization (hpf, modified from Kimmel et al. Dev Dyn. 1995 203:253-310). b, Confocal microangiogram
EPI TIR-FM min
 a 15 b EPI 45 75 min TIR-FM c min Supplementary figure 1. Fluorescence microscopy of Gag- GFP. HeLa cells were transfected with Gag and Gag-GFP and imaged at 5-6 hpt. a, Images of a single cell observed
Supplementary Figure 1
 Supplementary Figure 1 YAP negatively regulates IFN- signaling. (a) Immunoblot analysis of Yap knockdown efficiency with sh-yap (#1 to #4 independent constructs) in Raw264.7 cells. (b) IFN- -Luc and PRDs