Interleukin-6 promotes pancreatic cancer cell migration by rapidly activating the small GTPase CDC42
|
|
|
- Chester Moses Jefferson
- 6 years ago
- Views:
Transcription
1 Interleukin-6 promotes pancreatic cancer cell migration by rapidly activating the small GTPase CDC42 Gina L. Razidlo, Kevin M. Burton, and Mark A. McNiven SUPPORTING INFORMATION Figure S1. IL-6 promotes migration of pancreatic cancer cells. Figure S2. IL-6 stimulates activation of CDC42. Figure S3. JAK2 and STAT3 are required for IL-6 to activate CDC42 Movie S1. Live-cell fluorescence microscopy of a PANC-1 cell expressing GFP-Actin, before and after treatment with IL-6 (50 ng/ml). Example 1. Movie S2. Live-cell fluorescence microscopy of a PANC-1 cell expressing GFP-Actin, before and after treatment with IL-6 (50 ng/ml). Example 2.
2
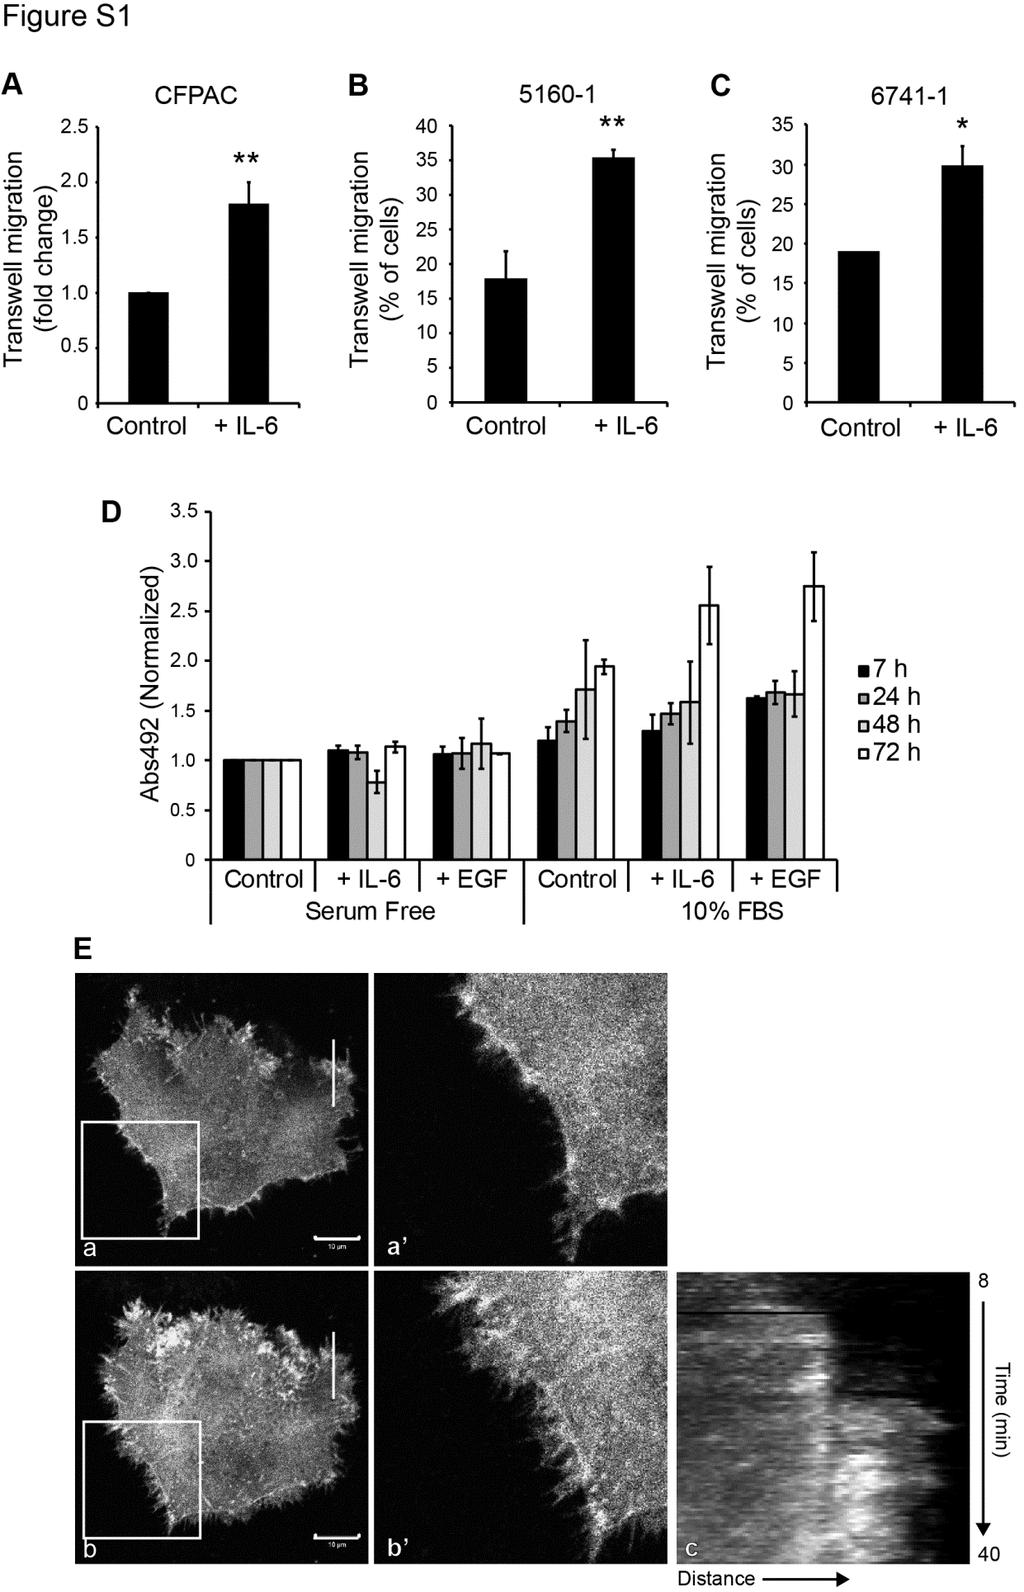
3 Figure S1. IL-6 promotes migration of pancreatic cancer cells. A-C. IL-6 stimulates transwell migration of CFPAC (A), (B), and (C) pancreatic cancer cells. The indicated cell line was serum starved overnight and incubated in a chemotactic transwell migration assay in the presence or absence of IL-6 (50 ng/ml) for 20 hours. The percent of cells that migrated across the filter is shown. D. The effects of IL-6 on transwell migration are likely independent of proliferation. PANC-1 cells were incubated for the indicated times with IL-6 (50 ng/ml) or EGF (30 ng/ml) as a positive control, in the presence or absence of 10% FBS. IL-6 did not increase cell proliferation at the acute timepoints examined in the migration assays (t<24 hours). For A-E, graphed data represent the mean +/- SEM of 3-5 independent biological replicates. * indicates p<0.05, ** indicates p<0.01. E. An additional example of IL-6 inducing filopodial actin protrusions. PANC-1 cells were transfected to express GFP-Actin, and then imaged using live-cell fluorescence microscopy while stimulated with IL-6 (50 ng/ml). Image (a) represents a cell prior to IL-6 addition, (b) represents the same cell 30 minutes after IL-6 addition. Boxed regions are magnified at right (a and b ). (c) represents a kymograph from the region denoted with a white line. Scale bars = 10 µm. See also Figure 1 and Supplemental Movie 1-2.
4
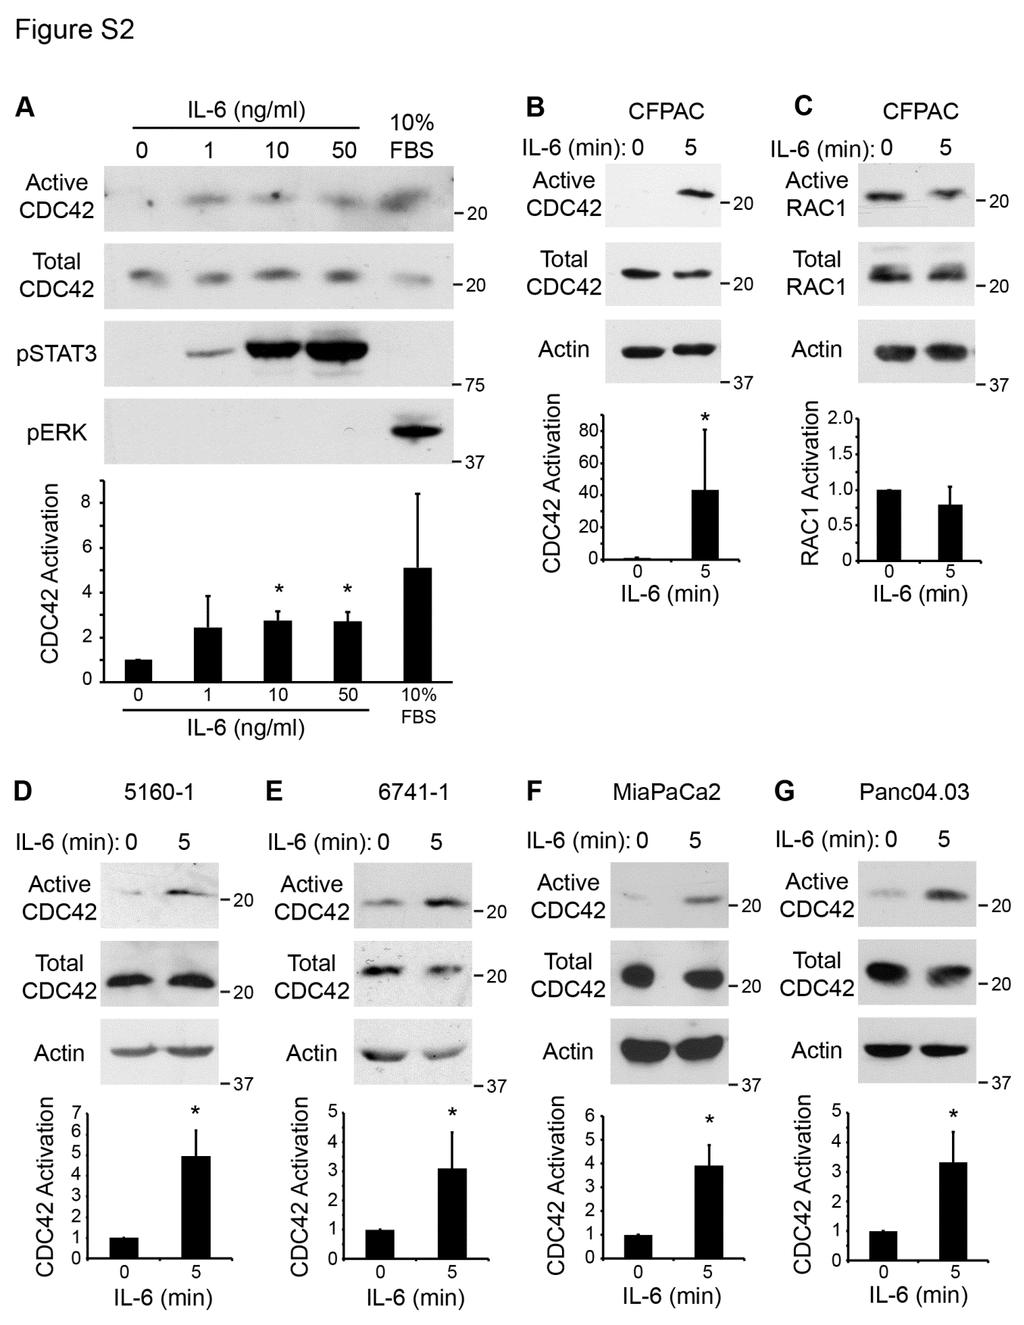
5 Figure S2. IL-6 stimulates activation of CDC42. A. Dose curve of IL-6 demonstrating that IL-6 activates CDC42 from 1-50 ng/ml at a level comparable to that of the positive control, 10% FBS. PANC- 1 cells were treated with the indicated dose of IL-6, or 10% FBS, for 5 min, before GST-PBD pulldown and immunoblotting. Phosphorylated STAT3 was used as a positive control to show canonical IL-6 signaling, and phosphorylated ERK was used as a control to show canonical signaling by FBS. B, C. CFPAC pancreatic cancer cells were treated with IL-6 (50 ng/ml) as described in (A) and a GST-PBD pulldown was used to assess CDC42 activity (B) or RAC1 activity (C). Similar to PANC-1 cells, rapid activation of CDC42, but not RAC1, was observed in CFPAC pancreatic cancer cells. D-G. IL-6 stimulates CDC42 activation within 5 minutes in multiple pancreatic cancer cell lines. The indicated cell lines were treated with IL-6 (50 ng/ml) for 5 min, subjected to GST-PBD pulldown, and immunoblotted for CDC42. Graphed data represent quantitation of immunoblots of active CDC42 normalized to total CDC42, compared to unstimulated control cells in each experiment. Bars indicate the mean +/- SEM from 3-7 independent biological replicates. * indicates p<0.05. See also Figure 2.
 for 5 minutes.")
6 Figure S3. JAK2 and STAT3 are required for IL-6 to activate CDC42. A. RNAi-mediated knockdown of JAK2 or STAT3 prevents activation of CDC42 by IL-6. PANC-1 cells were transfected with either a control non-targeting sirna or additional sirnas targeting JAK2 or STAT3, then stimulated with IL-6 (50 ng/ml) for 5 minutes. Active CDC42 was precipitated using a GST-PBD pulldown. Graphed data represent quantitation of immunoblots of active CDC42 normalized to total CDC42, compared to unstimulated control cells in each experiment. B. Quantification of the protein level of JAK2 following sirna-mediated knockdown using sirna 1 (Figure 4A) or sirna 2 (Figure S3A). C. Quantification of the protein level of STAT3 following sirna-mediated knockdown using sirna 1 (Figure 4C) or sirna 2 (Figure S3A). Graphed data represent quantitation of immunoblots normalized to Actin, compared to nontargeted control-transfected cells. For A-C, graphed data indicate the mean +/- SEM from 3-5 independent biological replicates. * indicates p<0.05, ** indicates p<0.01. See also Figure 4.
mir-509-5p and mir-1243 increase the sensitivity to gemcitabine by inhibiting
 mir-509-5p and mir-1243 increase the sensitivity to gemcitabine by inhibiting epithelial-mesenchymal transition in pancreatic cancer Hidekazu Hiramoto, M.D. 1,3, Tomoki Muramatsu, Ph.D. 1, Daisuke Ichikawa,
Supplementary Materials
 Supplementary Materials Figure S1. MTT Cell viability assay. To measure the cytotoxic potential of the oxidative treatment, the MTT [3-(4,5-dimethylthiazol- 2-yl)-2,5-diphenyl tetrazolium bromide] assay
Cofilin is one crucial mediator of actin cytoskeletal dynamics
 Chronophin coordinates cell leading edge dynamics by controlling active cofilin levels Violaine Delorme-Walker a,b, Ji-Yeon Seo a,b, Antje Gohla c, Bruce Fowler a,b, Ben Bohl a,b, and Céline DerMardirossian
m 6 A mrna methylation regulates AKT activity to promote the proliferation and tumorigenicity of endometrial cancer
 SUPPLEMENTARY INFORMATION Articles https://doi.org/10.1038/s41556-018-0174-4 In the format provided by the authors and unedited. m 6 A mrna methylation regulates AKT activity to promote the proliferation
* * A3027. A4623 e A3507 A3507 A3507
 a c L A327 d e A37 A37 A37 Supplementary Figure 1. Clinical manifestations of individuals with mutations. (a) Renal ultrasound of right kidney in A327 reveals small renal cysts, loss of corticomedullary
T H E J O U R N A L O F C E L L B I O L O G Y
 Supplemental material Jewell et al., http://www.jcb.org/cgi/content/full/jcb.201007176/dc1 T H E J O U R N A L O F C E L L B I O L O G Y Figure S1. IR Munc18c association is independent of IRS-1. (A and
Supplementary Figure 1: Characterisation of phospho-fgfr-y463 antibody. (A)
") Supplementary Figure 1: Characterisation of phospho-fgfr-y463 antibody. (A) Cells over-expressing hfgfr1-pcdna3 (+) or pcdna3 (-) were stimulated for 10 minutes with 50ng/ml FGF2 and lysates immunoblotted
Supplementary Figure 1: Characterisation of phospho-fgfr-y463 antibody. (A) Cells over-expressing hfgfr1-pcdna3 (+) or pcdna3 (-) were stimulated for 10 minutes with 50ng/ml FGF2 and lysates immunoblotted
T H E J O U R N A L O F C E L L B I O L O G Y
 Supplemental material Díaz et al., http://www.jcb.org/cgi/content/full/jcb.201209151/dc1 T H E J O U R N A L O F C E L L B I O L O G Y Figure S1. Hypoxia induces invadopodia formation in different epithelial
Supplementary Figure 1: GFAP positive nerves in patients with adenocarcinoma of
 SUPPLEMENTARY FIGURES AND MOVIE LEGENDS Supplementary Figure 1: GFAP positive nerves in patients with adenocarcinoma of the pancreas. (A) Images of nerves stained for GFAP (green), S100 (red) and DAPI
Supplementary Information
 Supplementary Information mediates STAT3 activation at retromer-positive structures to promote colitis and colitis-associated carcinogenesis Zhang et al. a b d e g h Rel. Luc. Act. Rel. mrna Rel. mrna
Supplementary Figure 1
 Supplementary Figure 1 a γ-h2ax MDC1 RNF8 FK2 BRCA1 U2OS Cells sgrna-1 ** 60 sgrna 40 20 0 % positive Cells (>5 foci per cell) b ** 80 sgrna sgrna γ-h2ax MDC1 γ-h2ax RNF8 FK2 MDC1 BRCA1 RNF8 FK2 BRCA1
William C. Comb, Jessica E. Hutti, Patricia Cogswell, Lewis C. Cantley, and Albert S. Baldwin
 Molecular Cell, Volume 45 Supplemental Information p85 SH2 Domain Phosphorylation by IKK Promotes Feedback Inhibition of PI3K and Akt in Response to Cellular Starvation William C. Comb, Jessica E. Hutti,
Supplementary Figure 1. BMS enhances human T cell activation in vitro in a
 Supplementary Figure 1. BMS98662 enhances human T cell activation in vitro in a concentration-dependent manner. Jurkat T cells were activated with anti-cd3 and anti-cd28 antibody in the presence of titrated
Supplementary Data Table of Contents:
 Supplementary Data Table of Contents: - Supplementary Methods - Supplementary Figures S1(A-B) - Supplementary Figures S2 (A-B) - Supplementary Figures S3 - Supplementary Figures S4(A-B) - Supplementary
Supplemental Figure 1. Western blot analysis indicated that MIF was detected in the fractions of
 Supplemental Figure Legends Supplemental Figure 1. Western blot analysis indicated that was detected in the fractions of plasma membrane and cytosol but not in nuclear fraction isolated from Pkd1 null
Supplemental Materials. STK16 regulates actin dynamics to control Golgi organization and cell cycle
 Supplemental Materials STK16 regulates actin dynamics to control Golgi organization and cell cycle Juanjuan Liu 1,2,3, Xingxing Yang 1,3, Binhua Li 1, Junjun Wang 1,2, Wenchao Wang 1, Jing Liu 1, Qingsong
Supplementary information. The Light Intermediate Chain 2 Subpopulation of Dynein Regulates Mitotic. Spindle Orientation
 Supplementary information The Light Intermediate Chain 2 Subpopulation of Dynein Regulates Mitotic Spindle Orientation Running title: Dynein LICs distribute mitotic functions. Sagar Mahale a, d, *, Megha
p = formed with HCI-001 p = Relative # of blood vessels that formed with HCI-002 Control Bevacizumab + 17AAG Bevacizumab 17AAG
 A.. Relative # of ECs associated with HCI-001 1.4 1.2 1.0 0.8 0.6 0.4 0.2 0.0 ol b p < 0.001 Relative # of blood vessels that formed with HCI-001 1.4 1.2 1.0 0.8 0.6 0.4 0.2 0.0 l b p = 0.002 Control IHC:
Prolonged mitotic arrest induces a caspase-dependent DNA damage
 SUPPLEMENTARY INFORMATION Prolonged mitotic arrest induces a caspase-dependent DNA damage response at telomeres that determines cell survival Karolina O. Hain, Didier J. Colin, Shubhra Rastogi, Lindsey
Supplemental Figures:
 Supplemental Figures: Figure 1: Intracellular distribution of VWF by electron microscopy in human endothelial cells. a) Immunogold labeling of LC3 demonstrating an LC3-positive autophagosome (white arrow)
human epithelial cells were pretreated with control sirna (50 nm) or GSK-3β sirna (50 nm)
 or GSK-3β sirna (50 nm)") GSK3β facilitates IFNγ signaling Supplementary Figure Legends Figure S1. The effects of inhibiting GSK3β on IFNγinduced TNFα expression. A, A549 human epithelial cells were pretreated with control sirna
GSK3β facilitates IFNγ signaling Supplementary Figure Legends Figure S1. The effects of inhibiting GSK3β on IFNγinduced TNFα expression. A, A549 human epithelial cells were pretreated with control sirna
Supplemental Information. NRF2 Is a Major Target of ARF. in p53-independent Tumor Suppression
 Molecular Cell, Volume 68 Supplemental Information NRF2 Is a Major Target of ARF in p53-independent Tumor Suppression Delin Chen, Omid Tavana, Bo Chu, Luke Erber, Yue Chen, Richard Baer, and Wei Gu Figure
Supplementary Fig. 1. GPRC5A post-transcriptionally down-regulates EGFR expression. (a) Plot of the changes in steady state mrna levels versus
 Plot of the changes in steady state mrna levels versus") Supplementary Fig. 1. GPRC5A post-transcriptionally down-regulates EGFR expression. (a) Plot of the changes in steady state mrna levels versus changes in corresponding proteins between wild type and Gprc5a-/-
Supplementary Fig. 1. GPRC5A post-transcriptionally down-regulates EGFR expression. (a) Plot of the changes in steady state mrna levels versus changes in corresponding proteins between wild type and Gprc5a-/-
SUPPLEMENTARY INFORMATION
 DOI: 10.1038/ncb3076 Supplementary Figure 1 btrcp targets Cep68 for degradation during mitosis. a) Cep68 immunofluorescence in interphase and metaphase. U-2OS cells were transfected with control sirna
Figure S1. Western blot analysis of clathrin RNA interference in human DCs Human immature DCs were transfected with 100 nm Clathrin SMARTpool or
 Figure S1. Western blot analysis of clathrin RNA interference in human DCs Human immature DCs were transfected with 100 nm Clathrin SMARTpool or control nontargeting sirnas. At 90 hr after transfection,
Dramatic increase in SHP2 binding activity of Helicobacter. pylori Western CagA by EPIYA-C duplication: its
 Supplementary Information Dramatic increase in SHP2 binding activity of Helicobacter pylori Western CagA by EPIYA-C duplication: its implications in gastric carcinogenesis Lisa Nagase, Takeru Hayashi,
A Hepatocyte Growth Factor Receptor (Met) Insulin Receptor hybrid governs hepatic glucose metabolism SUPPLEMENTARY FIGURES, LEGENDS AND METHODS
 Insulin Receptor hybrid governs hepatic glucose metabolism SUPPLEMENTARY FIGURES, LEGENDS AND METHODS") A Hepatocyte Growth Factor Receptor (Met) Insulin Receptor hybrid governs hepatic glucose metabolism Arlee Fafalios, Jihong Ma, Xinping Tan, John Stoops, Jianhua Luo, Marie C. DeFrances and Reza Zarnegar
A Hepatocyte Growth Factor Receptor (Met) Insulin Receptor hybrid governs hepatic glucose metabolism Arlee Fafalios, Jihong Ma, Xinping Tan, John Stoops, Jianhua Luo, Marie C. DeFrances and Reza Zarnegar
LPS LPS P6 - + Supplementary Fig. 1.
 P6 LPS - - - + + + - LPS + + - - P6 + Supplementary Fig. 1. Pharmacological inhibition of the JAK/STAT blocks LPS-induced HMGB1 nuclear translocation. RAW 267.4 cells were stimulated with LPS in the absence
(a) Significant biological processes (upper panel) and disease biomarkers (lower panel)
 Significant biological processes (upper panel) and disease biomarkers (lower panel)") Supplementary Figure 1. Functional enrichment analyses of secretomic proteins. (a) Significant biological processes (upper panel) and disease biomarkers (lower panel) 2 involved by hrab37-mediated secretory
Supplementary Figure 1. Functional enrichment analyses of secretomic proteins. (a) Significant biological processes (upper panel) and disease biomarkers (lower panel) 2 involved by hrab37-mediated secretory
Supplementary Figure 1: si-craf but not si-braf sensitizes tumor cells to radiation.
 Supplementary Figure 1: si-craf but not si-braf sensitizes tumor cells to radiation. (a) Embryonic fibroblasts isolated from wildtype (WT), BRAF -/-, or CRAF -/- mice were irradiated (6 Gy) and DNA damage
Supplementary Figure 1
 Supplementary Figure 1 Constitutive EGFR signaling does not activate canonical EGFR signals (a) U251EGFRInd cells with or without tetracycline exposure (24h, 1µg/ml) were treated with EGF for 15 minutes
Reactive Oxygen Species Regulate Protrusion Efficiency by Controlling Actin Dynamics
 Reactive Oxygen Species Regulate Protrusion Efficiency by Controlling Actin Dynamics Nicolas Taulet, Violaine D. Delorme-Walker, Céline DerMardirossian* Department of Immunology and Microbial Science,
Intracellular MHC class II molecules promote TLR-triggered innate. immune responses by maintaining Btk activation
 Intracellular MHC class II molecules promote TLR-triggered innate immune responses by maintaining Btk activation Xingguang Liu, Zhenzhen Zhan, Dong Li, Li Xu, Feng Ma, Peng Zhang, Hangping Yao and Xuetao
Nature Structural and Molecular Biology: doi: /nsmb Supplementary Figure 1
 Supplementary Figure 1 Mutational analysis of the SA2-Scc1 interaction in vitro and in human cells. (a) Autoradiograph (top) and Coomassie stained gel (bottom) of 35 S-labeled Myc-SA2 proteins (input)
SUPPLEMENTARY INFORMATION
 DOI: 10.1038/ncb2566 Figure S1 CDKL5 protein expression pattern and localization in mouse brain. (a) Multiple-tissue western blot from a postnatal day (P) 21 mouse probed with an antibody against CDKL5.
Fang et al. NMuMG. PyVmT unstained Anti-CCR2-PE MDA-MB MCF MCF10A
 A NMuMG PyVmT 16.5+.5 47.+7.2 Fang et al. unstained Anti-CCR2-PE 4T1 Control 37.6+6.3 56.1+.65 MCF1A 16.1+3. MCF-7 3.1+5.4 MDA-M-231 42.1+5.5 unstained Secondary antibody only Anti-CCR2 SUPPLEMENTAL FIGURE
SUPPLEMENTARY INFORMATION
 Figure S1 Treatment with both Sema6D and Plexin-A1 sirnas induces the phenotype essentially identical to that induced by treatment with Sema6D sirna alone or Plexin-A1 sirna alone. (a,b) The cardiac tube
a b G75 G60 Sw-2 Sw-1 Supplementary Figure 1. Structure predictions by I-TASSER Server.
 a b G75 2 2 G60 Sw-2 Sw-1 Supplementary Figure 1. Structure predictions by I-TASSER Server. a. Overlay of top 10 models generated by I-TASSER illustrates the potential effect of 7 amino acid insertion
Nature Immunology: doi: /ni.3866
 Nature Immunology: doi:10.1038/ni.3866 Supplementary Figure 1 The effect of TIPE2 on chemotaxis. a, The expression of TIPE2 in dhl-60c, dhl-60t, TIPE2-expressing and 15/16Q-expressing dhl-60t neutrophils
Supplementary Figure 1. Normal T lymphocyte populations in Dapk -/- mice. (a) Normal thymic development in Dapk -/- mice. Thymocytes from WT and Dapk
 Normal thymic development in Dapk -/- mice. Thymocytes from WT and Dapk") Supplementary Figure 1. Normal T lymphocyte populations in Dapk -/- mice. (a) Normal thymic development in Dapk -/- mice. Thymocytes from WT and Dapk -/- mice were stained for expression of CD4 and CD8.
Supplementary Figure 1. Normal T lymphocyte populations in Dapk -/- mice. (a) Normal thymic development in Dapk -/- mice. Thymocytes from WT and Dapk -/- mice were stained for expression of CD4 and CD8.
Supplementary Information. Tissue-wide immunity against Leishmania. through collective production of nitric oxide
 Supplementary Information Tissue-wide immunity against Leishmania through collective production of nitric oxide Romain Olekhnovitch, Bernhard Ryffel, Andreas J. Müller and Philippe Bousso Supplementary
SUPPLEMENTARY INFORMATION
 Supplementary Figures Supplementary Figure S1. Binding of full-length OGT and deletion mutants to PIP strips (Echelon Biosciences). Supplementary Figure S2. Binding of the OGT (919-1036) fragments with
ANGPTL2 increases bone metastasis of breast cancer cells through. Tetsuro Masuda, Motoyoshi Endo, Yutaka Yamamoto, Haruki Odagiri, Tsuyoshi
 Masuda et al. Supplementary information for ANGPTL2 increases bone metastasis of breast cancer cells through enhancing CXCR4 signaling Tetsuro Masuda, Motoyoshi Endo, Yutaka Yamamoto, Haruki Odagiri, Tsuyoshi
SUPPLEMENTAL FIGURE LEGENDS
 SUPPLEMENTAL FIGURE LEGENDS Supplemental Figure S1: Endogenous interaction between RNF2 and H2AX: Whole cell extracts from 293T were subjected to immunoprecipitation with anti-rnf2 or anti-γ-h2ax antibodies
Figures S1-S5, Figure Legends, Table S1 List of primers used in the study
 Insulin receptor alternative splicing is regulated by insulin signaling and modulates beta cell survival Pushkar Malakar,4, Lital Chartarifsky,4, Ayat Hija, Gil Leibowitz 3, Benjamin Glaser 3, Yuval Dor,
supplementary information
 DOI: 10.1038/ncb2133 Figure S1 Actomyosin organisation in human squamous cell carcinoma. (a) Three examples of actomyosin organisation around the edges of squamous cell carcinoma biopsies are shown. Myosin
Supplementary Figure 1. Rab27a-KD inhibits speed and persistence of HEp3 cells migrating in the chick CAM. (a) Western blot analysis of Rab27a
 Western blot analysis of Rab27a") Supplementary Figure 1. Rab27a-KD inhibits speed and persistence of HEp3 cells migrating in the chick CAM. (a) Western blot analysis of Rab27a expression in GFP-expressing HEp3 cells. (b) Representative
Supplementary Figure 1. Rab27a-KD inhibits speed and persistence of HEp3 cells migrating in the chick CAM. (a) Western blot analysis of Rab27a expression in GFP-expressing HEp3 cells. (b) Representative
Supplementary information
 Supplementary information 1 Supplementary Figure 1. CALM regulates autophagy. (a). Quantification of LC3 levels in the experiment described in Figure 1A. Data are mean +/- SD (n > 3 experiments for each
Figure S1: Effects on haptotaxis are independent of effects on cell velocity A)
") Supplemental Figures Figure S1: Effects on haptotaxis are independent of effects on cell velocity A) Velocity of MV D7 fibroblasts expressing different GFP-tagged Ena/VASP family proteins in the haptotaxis
Supplemental Figures Figure S1: Effects on haptotaxis are independent of effects on cell velocity A) Velocity of MV D7 fibroblasts expressing different GFP-tagged Ena/VASP family proteins in the haptotaxis
MII. Supplement Figure 1. CapZ β2. Merge. 250ng. 500ng DIC. Merge. Journal of Cell Science Supplementary Material. GFP-CapZ β2 DNA
 A GV GVBD MI DNA CapZ β2 CapZ β2 Merge B DIC GFP-CapZ β2 Merge CapZ β2-gfp 250ng 500ng Supplement Figure 1. MII A early MI late MI Control RNAi CapZαβ DNA Actin Tubulin B Phalloidin Intensity(A.U.) n=10
SUPPLEMENTARY INFORMATION
 DOI: 10.1038/ncb3443 In the format provided by the authors and unedited. Supplementary Figure 1 TC and SC behaviour during ISV sprouting. (a) Predicted outcome of TC division and competitive Dll4-Notch-mediated
Supplementary Figure 1. Basal level EGFR across a panel of ESCC lines. Immunoblots demonstrate the expression of phosphorylated and total EGFR as
 Supplementary Figure 1. Basal level EGFR across a panel of ESCC lines. Immunoblots demonstrate the expression of phosphorylated and total EGFR as well as their downstream effectors across a panel of ESCC
Supplementary Figure S1 (a) (b)
 (b)") Supplementary Figure S1: IC87114 does not affect basal Ca 2+ level nor nicotineinduced Ca 2+ influx. (a) Bovine chromaffin cells were loaded with Fluo-4AM (1 μm) in buffer A containing 0.02% of pluronic
Supplementary Figure S1: IC87114 does not affect basal Ca 2+ level nor nicotineinduced Ca 2+ influx. (a) Bovine chromaffin cells were loaded with Fluo-4AM (1 μm) in buffer A containing 0.02% of pluronic
Supplementary Figure 1. Characterization of NMuMG-ErbB2 and NIC breast cancer cells expressing shrnas targeting LPP. NMuMG-ErbB2 cells (a) and NIC
 and NIC") Supplementary Figure 1. Characterization of NMuMG-ErbB2 and NIC breast cancer cells expressing shrnas targeting LPP. NMuMG-ErbB2 cells (a) and NIC cells (b) were engineered to stably express either a LucA-shRNA
Supplementary Figure 1. Characterization of NMuMG-ErbB2 and NIC breast cancer cells expressing shrnas targeting LPP. NMuMG-ErbB2 cells (a) and NIC cells (b) were engineered to stably express either a LucA-shRNA
Supplementary Materials for
 www.sciencesignaling.org/cgi/content/full/4/199/ra75/dc1 Supplementary Materials for Signaling by the Matrix Proteoglycan Decorin Controls Inflammation and Cancer Through PDCD4 and MicroRNA-21 Rosetta
Supplementary Figure 1: STAT3 suppresses Kras-induced lung tumorigenesis
 Supplementary Figure 1: STAT3 suppresses Kras-induced lung tumorigenesis (a) Immunohistochemical (IHC) analysis of tyrosine 705 phosphorylation status of STAT3 (P- STAT3) in tumors and stroma (all-time
Supplementary Figure 1. Procedures for p38 activity imaging in living cells. (a) Schematic model of the p38 activity reporter. The reporter consists
 Schematic model of the p38 activity reporter. The reporter consists") Supplementary Figure 1. Procedures for p38 activity imaging in living cells. (a) Schematic model of the p38 activity reporter. The reporter consists of: (i) the YPet domain (an enhanced YFP); (ii) the
Supplementary Figure 1. Procedures for p38 activity imaging in living cells. (a) Schematic model of the p38 activity reporter. The reporter consists of: (i) the YPet domain (an enhanced YFP); (ii) the
Validation & Assay Performance Summary
 Validation & Assay Performance Summary LanthaScreen IGF-1R GripTite Cells Cat. no. K1834 Modification Detected: Phosphorylation of Multiple Tyr Residues on IGF-1R LanthaScreen Cellular Assay Validation
SUPPLEMENTARY INFORMATION
 DOI: 10.1038/ncb2988 Supplementary Figure 1 Kif7 L130P encodes a stable protein that does not localize to cilia tips. (a) Immunoblot with KIF7 antibody in cell lysates of wild-type, Kif7 L130P and Kif7
% of live splenocytes. STAT5 deletion. (open shapes) % ROSA + % floxed
 % ROSA + % floxed") Supp. Figure 1. a 14 1 1 8 6 spleen cells (x1 6 ) 16 % of live splenocytes 5 4 3 1 % of live splenocytes 8 6 4 b 1 1 c % of CD11c + splenocytes (closed shapes) 8 6 4 8 6 4 % ROSA + (open shapes) % floxed
Supp. Figure 1. a 14 1 1 8 6 spleen cells (x1 6 ) 16 % of live splenocytes 5 4 3 1 % of live splenocytes 8 6 4 b 1 1 c % of CD11c + splenocytes (closed shapes) 8 6 4 8 6 4 % ROSA + (open shapes) % floxed
A. List of selected proteins with high SILAC (H/L) ratios identified in mass
 ratios identified in mass") Supplementary material Figure S1. Interaction between UBL5 and FANCI A. List of selected proteins with high SILAC (H/L) ratios identified in mass spectrometry (MS)-based analysis of UBL5-interacting proteins,
Supplementary material Figure S1. Interaction between UBL5 and FANCI A. List of selected proteins with high SILAC (H/L) ratios identified in mass spectrometry (MS)-based analysis of UBL5-interacting proteins,
Supplementary Figure 1
 Supplementary Figure 1 6 HE-50 HE-116 E-1 HE-108 Supplementary Figure 1. Targeted drug response curves of endometrial cancer cells. Endometrial cancer cell lines were incubated with serial dilutions of
Nature Methods: doi: /nmeth.4257
 Supplementary Figure 1 Screen for polypeptides that affect cellular actin filaments. (a) Table summarizing results from all polypeptides tested. Source shows organism, gene, and amino acid numbers used.
Collagen matrices from 12.5 hr of invading cultures in the presence of 1 µm S1P (S1P) or S1P plus 0.1
 or S1P plus 0.1") Two-Dimensional Gel Electrophoresis Collagen matrices from 12.5 hr of invading cultures in the presence of 1 µm S1P (S1P) or S1P plus.1 µg/ml pertussis toxin (S1P+PTx), or in the absence of S1P (Control)
Two-Dimensional Gel Electrophoresis Collagen matrices from 12.5 hr of invading cultures in the presence of 1 µm S1P (S1P) or S1P plus.1 µg/ml pertussis toxin (S1P+PTx), or in the absence of S1P (Control)
Pre-made Reporter Lentivirus for JAK-STAT Signaling Pathway
 Pre-made Reporter for JAK-STAT Signaling Pathway Cat# Product Name Amounts LVP937-P or: LVP937-P-PBS ISRE-GFP (Puro) LVP938-P or: LVP938-P-PBS ISRE-RFP (Puro) LVP939-P or: LVP939-P-PBS ISRE-Luc (Puro)
Supplemental information contains 7 movies and 4 supplemental Figures
 1 2 3 4 5 6 7 8 9 10 11 12 13 14 15 16 17 18 19 20 21 22 23 24 25 26 27 Supplemental information contains 7 movies and 4 supplemental Figures Movies: Movie 1. Single virus tracking of A4-mCherry-WR MV
MANUSCRIPT TITLE: Protein kinase C δ signaling is required for dietary prebiotic-induced strengthening of intestinal epithelial barrier function
 MANUSCRIPT TITLE: Protein kinase C δ signaling is required for dietary prebiotic-induced strengthening of intestinal epithelial barrier function Authors: Richard Y. Wu 1,2, Majd Abdullah 1, Pekka Määttänen
Supplementary Figure 1. Validation of astrocytes. Primary astrocytes were
 Supplementary Figure 1. Validation of astrocytes. Primary astrocytes were separated from the glial cultures using a mild trypsinization protocol. Anti-glial fibrillary acidic protein (GFAP) immunofluorescent
Supplementary Materials
 Supplementary Materials Supplementary Figure S1 Regulation of Ubl4A stability by its assembly partner A, The translation rate of Ubl4A is not affected in the absence of Bag6. Control, Bag6 and Ubl4A CRISPR
Title: Smooth muscle cell-specific Tgfbr1 deficiency promotes aortic aneurysm formation by stimulating multiple signaling events
 Title: Smooth muscle cell-specific Tgfbr1 deficiency promotes aortic aneurysm formation by stimulating multiple signaling events Pu Yang 1, 3, radley M. Schmit 1, Chunhua Fu 1, Kenneth DeSart 1, S. Paul
Inhibition of TGFβ enhances chemotherapy action against triple negative breast cancer by abrogation of
 SUPPLEMENTAL DATA Inhibition of TGFβ enhances chemotherapy action against triple negative breast cancer by abrogation of cancer stem cells and interleukin-8 Neil E. Bhola 1, Justin M. Balko 1, Teresa C.
TRAF6 ubiquitinates TGFβ type I receptor to promote its cleavage and nuclear translocation in cancer
 Supplementary Information TRAF6 ubiquitinates TGFβ type I receptor to promote its cleavage and nuclear translocation in cancer Yabing Mu, Reshma Sundar, Noopur Thakur, Maria Ekman, Shyam Kumar Gudey, Mariya
SUPPLEMENTARY INFORMATION
 DOI:.38/ncb3399 a b c d FSP DAPI 5mm mm 5mm 5mm e Correspond to melanoma in-situ Figure a DCT FSP- f MITF mm mm MlanaA melanoma in-situ DCT 5mm FSP- mm mm mm mm mm g melanoma in-situ MITF MlanaA mm mm
TFEB-mediated increase in peripheral lysosomes regulates. Store Operated Calcium Entry
 TFEB-mediated increase in peripheral lysosomes regulates Store Operated Calcium Entry Luigi Sbano, Massimo Bonora, Saverio Marchi, Federica Baldassari, Diego L. Medina, Andrea Ballabio, Carlotta Giorgi
Pre-made Reporter Lentivirus for MAPK/ERK Signal Pathway
 Pre-made Reporter for MAPK/ERK Signal Pathway Cat# Product Name Amounts LVP957-P or: LVP957-P-PBS SRE-GFP (Puro) LVP958-P or: LVP958-P-PBS SRE-RFP (Puro) LVP959-P or: LVP959-P-PBS SRE-Luc (Puro) LVP960-P
SUPPLEMENTARY FIGURES
 SUPPLEMENTARY FIGURES 1 2 3 4 SUPPLEMENTARY TABLES Supplementary Table S1. Brain Tumors used in the study Code Tumor Classification Age Gender HuTuP51 Glioblastoma 57 Male HuTuP52 Glioblastoma 53 Male
Supplementary Figure 1 Expression of Crb3 in mouse sciatic nerve: biochemical analysis (a) Schematic of Crb3 isoforms, ERLI and CLPI, indicating the
 Schematic of Crb3 isoforms, ERLI and CLPI, indicating the") Supplementary Figure 1 Expression of Crb3 in mouse sciatic nerve: biochemical analysis (a) Schematic of Crb3 isoforms, ERLI and CLPI, indicating the location of the transmembrane (TM), FRM binding (FB)
Supplementary Figure 1 Expression of Crb3 in mouse sciatic nerve: biochemical analysis (a) Schematic of Crb3 isoforms, ERLI and CLPI, indicating the location of the transmembrane (TM), FRM binding (FB)
SUPPLEMENTARY INFORMATION
 DOI: 10.1038/ncb3021 Supplementary figure 1 Characterisation of TIMPless fibroblasts. a) Relative gene expression of TIMPs1-4 by real time quantitative PCR (RT-qPCR) in WT or ΔTimp fibroblasts (mean ±
Supplementary Figures
 Supplementary Figures Supplementary Figure 1. Single cell gene expression analysis during collective cell migration. (a) Florescence and bright-field images of MCF7 cells transfected with dslna probes
SUPPLEMENTAL MATERIALS AND METHODS. Puromycin-synchronized metabolic labelling - Transfected HepG2 cells were depleted of
 SUPPLEMENTAL MATERIALS AND METHODS Puromycin-synchronized metabolic labelling - Transfected HepG2 cells were depleted of cysteine and methionine and then treated with 10 μm puromycin in depletion medium
Supplementary Figure 1.TRIM33 binds β-catenin in the nucleus. a & b, Co-IP of endogenous TRIM33 with β-catenin in HT-29 cells (a) and HEK 293T cells
 and HEK 293T cells") Supplementary Figure 1.TRIM33 binds β-catenin in the nucleus. a & b, Co-IP of endogenous TRIM33 with β-catenin in HT-29 cells (a) and HEK 293T cells (b). TRIM33 was immunoprecipitated, and the amount of
Supplementary Figure 1.TRIM33 binds β-catenin in the nucleus. a & b, Co-IP of endogenous TRIM33 with β-catenin in HT-29 cells (a) and HEK 293T cells (b). TRIM33 was immunoprecipitated, and the amount of
Figure SⅠ: Expression of mir-155, mir-122 and mir-196a in allografts compared with
 Figure SⅠ: Expression of mir-155, mir-122 and mir-196a in allografts compared with isografts (control) at the 2nd week, 4th and 8th week by RT-PCR. At the advanced stage, the expression of these three
HEK293FT cells were transiently transfected with reporters, N3-ICD construct and
 Supplementary Information Luciferase reporter assay HEK293FT cells were transiently transfected with reporters, N3-ICD construct and increased amounts of wild type or kinase inactive EGFR. Transfections
SUPPLEMENTARY INFORMATION
 doi: 10.1038/nature05732 SUPPLEMENTARY INFORMATION Supplemental Data Supplement Figure Legends Figure S1. RIG-I 2CARD undergo robust ubiquitination a, (top) At 48 h posttransfection with a GST, GST-RIG-I-2CARD
Type of file: PDF Title of file for HTML: Supplementary Information Description: Supplementary Figures
 Type of file: PDF Title of file for HTML: Supplementary Information Description: Supplementary Figures Type of file: MOV Title of file for HTML: Supplementary Movie 1 Description: NLRP3 is moving along
Supplementary Information
 Supplementary Information Supplementary Figure 1. Effect of mir mimics and anti-mirs on DTPs a, Representative fluorescence microscopy images of GFP vector control or mir mimicexpressing parental and DTP
Supplementary Material
 Supplementary Material accompanying the manuscript Interleukin 37 is a fundamental inhibitor of innate immunity Marcel F Nold, Claudia A Nold-Petry, Jarod A Zepp, Brent E Palmer, Philip Bufler & Charles
Supplementary Materials for
 www.sciencesignaling.org/cgi/content/full/8/364/ra18/dc1 Supplementary Materials for The tyrosine phosphatase (Pez) inhibits metastasis by altering protein trafficking Leila Belle, Naveid Ali, Ana Lonic,
SUPPLEMENTARY INFORMATION
 Figure S1. Loss of Ena/VASP proteins inhibits filopodia and neuritogenesis. (a) Bar graph of filopodia number per stage 1 control and mmvvee (Mena/ VASP/EVL-null) neurons at 40hrs in culture. Loss of all
Supporting Information
 Supporting Information Palmisano et al. 10.1073/pnas.1202174109 Fig. S1. Expression of different transgenes, driven by either viral or human promoters, is up-regulated by amino acid starvation. (A) Quantification
ECM1 controls T H 2 cell egress from lymph nodes through re-expression of S1P 1
 ZH, Li et al, page 1 ECM1 controls T H 2 cell egress from lymph nodes through re-expression of S1P 1 Zhenhu Li 1,4,Yuan Zhang 1,4, Zhiduo Liu 1, Xiaodong Wu 1, Yuhan Zheng 1, Zhiyun Tao 1, Kairui Mao 1,
Effects of UBL5 knockdown on cell cycle distribution and sister chromatid cohesion
 Supplementary Figure S1. Effects of UBL5 knockdown on cell cycle distribution and sister chromatid cohesion A. Representative examples of flow cytometry profiles of HeLa cells transfected with indicated
Supplementary figure 1
 Supplementary figure 1 (A) Quantitative analysis of F-actin signal intensity in NIH3T3 cells treated with PTD4-myc- RBD. NIH3T3 cells were treated with PTD4-myc-RBD as described. Please note the increase
Novel roles for class II Phosphoinositide 3-Kinase C2 in signalling pathways involved in prostate cancer cell invasion.
 Novel roles for class II Phosphoinositide 3-Kinase C2 in signalling pathways involved in prostate cancer cell invasion. Mavrommati, I; Cisse, O; Falasca, M; Maffucci, T CC-BY For additional information
Crk adaptor proteins act as key signaling integrators for breast tumorigenesis
 RESEARCH ARTICLE Open Access Crk adaptor proteins act as key signaling integrators for breast tumorigenesis Kelly E Fathers 1, Emily S Bell 1, Charles V Rajadurai 1, Sean Cory 2, Hong Zhao 3, Anna Mourskaia
Supplementary information
 Supplementary information Exosomes mediate the cell-to-cell transmission of interferon alpha-induced antiviral activity Jianhua Li, Kuancheng Liu, Yang Liu, Yan Xu, Fei Zhang, Huijuan Yang, Jiangxia Liu,
Supplementary Table 1. Metabolic parameters in GFP and OGT-treated mice
 Supplementary Table 1. Metabolic parameters in GFP and OGT-treated mice Fasted Refed GFP OGT GFP OGT Liver G6P (mmol/g) 0.03±0.01 0.04±0.02 0.60±0.04 0.42±0.10 A TGs (mg/g of liver) 20.08±5.17 16.29±0.8
CD3 coated cover slips indicating stimulatory contact site, F-actin polymerization and
 SUPPLEMENTAL FIGURES FIGURE S1. Detection of MCs. A, Schematic representation of T cells stimulated on anti- CD3 coated cover slips indicating stimulatory contact site, F-actin polymerization and microclusters.
The V-ATPase-inhibitor archazolid abrogates tumor metastasis via inhibition of endocytic activation of the Rho-GTPase Rac1.
 The V-ATPase-inhibitor archazolid abrogates tumor metastasis via inhibition of endocytic activation of the Rho-GTPase Rac1. Item Type Article Authors Wiedmann, Romina M; von Schwarzenberg, Karin; Palamidessi,
Supplementary Figure S1 Supplementary Figure S2
 Supplementary Figure S A) The blots shown in Figure B were qualified by using Gel-Pro analyzer software (Rockville, MD, USA). The ratio of LC3II/LC3I to actin was then calculated. The data are represented