MECHANISMS INVOLVED IN STORAGE OF FEAR IN LATERAL AMYGDALA A COMPUTATIONAL STUDY
|
|
|
- Leslie Maurice Cunningham
- 5 years ago
- Views:
Transcription
1 MECHANISMS INVOLVED IN STORAGE OF FEAR IN LATERAL AMYGDALA A COMPUTATIONAL STUDY A Thesis presented to the Faculty of the Graduate School University of Missouri Columbia In Partial Fulfillment of the Requirement for the Degree Master of Science by CHAO JIANG Dr. Satish S. Nair, Dissertation Supervisor December 2013
2 The undersigned, appointed by the dean of the Graduate School, have examined the dissertation entitled NEURONAL AND NETWORK MECHANISMS IN STORAGE OF AMYGDALAR FEAR A COMPUTATIONAL STUDY presented by Chao Jiang, a candidate for the degree of master of science, and hereby certify that, in their opinion, it is worthy of acceptance. Professor Satish S. Nair Professor Dominic Ho Professor Dmitry Korkin i
3 ACKNOWLEDGEMENTS This project would not have been possible without the support of many people. Many thanks to my adviser, Dr. Satish Nair, who read my numerous revisions and helped make some sense of the confusion. Also thanks to my committee members, Dominic Ho and Dmitry Korkin, who offered guidance and support. Also thanks to other lab members who offered me a lot of help to finish this project. And finally, thanks to my parents, and numerous friends who endured this long process with me, always offering support and love. ii
4 TABLE OF CONTENTS ACKNOWLEDGEMENTS... ii LIST OF FIGURES...vi LIST OF TABLES... viii ABSTRACT... ix CHAPTER 1 INTRODUCTION AND OBJECTIVES....1 Motivation Objectives CHAPTER 2 NEURONAL AND NETWORK MECHANISMS IN STORAGE OF AMYGDALAR FEAR A COMPUTATIONAL STUDY....5 Abstract Introduction....6 Results Discussions Materials and Methods References Figures Supplementary Materials iii
5 CHAPTER 3 PARAMETRIC STUDIES RELATED TO MECHANISMS OF STORAGE OF AMYGDALAR FEAR Abstract Introduction Results Discussions Materials and Methods References...54 Figures CHAPTER 4 SUMMARY AND FUTURE RESEARCH F AMYGDALAR FEAR...63 Summary Future Research APPENDIX CHAPTER Additional Materials I Additional Materials II Additional Materials III CHAPTER Additional Materials I iv
6 VITA v
7 LIST OF FIGURES Figure Page Chapter Amygdalar pathways relevant to auditory fear 2 Chapter (A) Electroresponsive properties of model LA neurons.voltage responses of model cells to intracellular current injection. The responses of the three types of principal cells (types A, B and C) to current injections (left: 400 pa; middle: 300 pa; right: -100 pa; duration 600 ms) are similar to those reported in Faber et al. (2001). (B) Voltage responses of the interneuron model to 200-ms current injections of the same magnitude as in A. (C) Schematic of the LAd network model with 800 principal cells (red and green dots, 400 each, represent principal cells in LAdd and LAdv, respectively) and 200 interneurons (black dots). The principal cells in the model were populated randomly in the horn shaped tridimensional structure with dimensions of 800 μm in the rostralcaudal, 800 μm in the ventral-dorsal, and 400 μm in the mediallateral directions. (D) fear conditioning protocol for the model. As in the experiments of Repa et al. (2001), the behavioral protocol included habituation, conditioning and extinction phases, with 8, 16 and 20 trials, respectively. (E) Tone responses of LAd cells during the different phases of the behavioral protocol. (E1) Model (black, N=91/800) and experimental (red; N=12/100; from Repa et al., 2001) tone responses of TP cells show a sudden increase during early conditioning, and then drop to habituation levels during late conditioning. (E2) Model (black; N=107/800) and experimental (red; N=12/100) tone responses of LP cells increase gradually with conditioning and persist during extinction (A) Direct or indirect shock is important to increase the firing frequency of PNs. Variation of firing frequency of PNs (Hz) with tone and shock afferents received; (B) Increase in tone-pn weights after fear training for different groups of PNs. LF- Low firing; MF- Medium Firing; HF High firing; PC- plastic cell; NPCnon-plastic cell Probability (y-axis) that a PN will be plastic based on the tone and shock afferents it receives Variation of the number of inputs received by PNs from plastic vi
8 cell inputs for the various groups Variation of the number of di-synaptic inhibitory inputs from plastic cell received by PNs in the various groups Variation of PN firing rate with the numbers of excitatory and disynaptic inhibitory inputs received from plastic cells, for the various groups of PNs Differential intrinsic connectivity supports competition. Monosynaptic excitatory (A,C,E) and disynaptic inhibitory (B,D,F) connections among as well as between plastic and nonplastic cells (x-axis) in the control case. (C-F) Connections of type B-C winner and loser cells in the CREB + (C,D) and CREB (E,F) simulations. Averages ± s.e.m S2.1 Firing frequency of interneuron of different external inputs and interneuron firing frequency v/s # of excitatory connections from plastic cells 42 S2.2 Extrinsic and intrinsic weight comparison between plastic cells and non-plastic cells. 42 Chapter Tone responses of LAd cells during the different phases of the behavioral protocol Comparison of firing frequency of different groups of plastic cells and non-plastic cells Variation of PN firing rate with the numbers of excitatory and disynaptic inhibitory inputs received from plastic cells, for the various groups of PNs Excitatory and Di-synaptic inhibitory connections comparison Firing frequency of interneuron of different groups Probability of formation of plastic cells for new LA model vii
9 LIST OF TABLES Table Chapter Gating variables for ion channels used in the single cell models Maximal conductance densities of ion channels Variations in maximal conductances to model neuromodulator effects Model synaptic strengths and learning parameters. 133 Chapter Model synaptic strengths and learning parameters Differences between control and CREB case. 135 viii
10 ABSTRACT This thesis reports a computational model of a neuronal circuit and the insights it provided about the formation of fear memory in a specific nucleus of the amygdala after Pavlovian fear conditioning. An earlier study from our group used a 1000-cell biophysical model of a rodent lateral amygdala and provided a preliminary explanation of how and why certain neurons might be recruited into a memory trace. In the present model we extended the work to investigate the specific roles of the mechanisms involved (intrinsic excitability of cell, afferent tone and shock, neuromodulator receptors, and intrinsic excitatory and inhibitory connections). We first proposed an improved criterion to define plastic cells after recognizing that the Repa criterion used to classify plastic cells favored several principal cells with very low firing rates, which is possibly not biologically realistic. Using the improved criterion, we were able to replicate the development of the two distinct Repa cell populations after fear conditioning. The model suggested that the most important factor was the intrinsic excitability of the cell, i.e., highly excitable cells had a much higher probability of being recruited into the fear memory trace. Although afferent tone and shock were required for a cell to be plastic, the presence of neuromodulator receptors, and the numbers of intrinsic excitatory and di-synaptic inhibitory connections a cell received also played important roles. Finally, we varied the size of the network and internal connectivity among principal cells in the model to study their impact on competition, and found that small networks and reduced connectivity also performed equally well, providing valuable insights for memory formation. ix
11 CHAPTER 1 INTRODUCTION AND OBJECTIVES 1.1. BACKGROUND AND MOTIVATION Computational neuroscience is the study of brain function in terms of the information processing properties of the neurons and synapses that make up the nervous system. A neuron is modeled as a nonlinear electrical element with capacitance and variable resistances, and many neurons are combined to form networks and circuits. Biological data are used to develop neuron model which are then connected via synapses and used to investigate how neurons/network circuits implement functions. In this thesis, we investigate a specific component of the mammalian fear circuit, the lateral amygdala. The fear circuit is essential for the survival of any organism, since an organism that cannot fear appropriately will not be able to escape from dangers. Malfunction of such circuits is thought to be the cause for many of the anxiety disorders including posttraumatic stress disorder. For that reason, there is considerable interest among numerous research agencies in understanding how the mammalian fear circuit works. Studies of such circuits are typically performed by neuroscientists using rodents as the animal model, and Pavlovian fear conditioning as the paradigm. A key element of the mammalian fear circuit is the amygdala which has about 24,000 neurons in rodents. We use a reduced order 1000-cell network model of this amygdala in this thesis. 1
, LA projects to BA, ITCD and CeL.")
12 Fig Amygdalar pathways relevant to auditory fear. Tone and shock information arrive at LA via thalamic and cortical routes. LA projects to BA and also to ITCD and CeL. Based on our present understanding (Amano et al., 2011), LA projects to BA, ITCD and CeL. BA fear neurons project to CeM and BA extinction neurons project to ITCV (fear recall circuit in bold and extinction recall in dashed line type). Ce represents the amygdalar output which projects to the brainstem and other regions eliciting fear. In Pavlovian auditory fear conditioning, an initially neutral conditioned acoustic stimulus (CS), after being associated with an aversive unconditioned stimulus (US), typically electric shock, acquires the ability to induce conditioned fear responses. The components of the amygdala which are critical for fear conditioning are the lateral nucleus (LA), the basal nucleus (BL), and the central nucleus (CE). The LA is believed to be a storage site for such fear memories. In auditory fear conditioning, convergence of tone (conditioned stimulus, CS) and foot-shock (unconditioned stimulus, US) inputs from 2
13 the auditory cortex and auditory thalamus in LA leads to potentiation of CS inputs, resulting in larger tone responses in LA. Increased LA responses are relayed to the CE via the basal nuclei, and the intercalated (ITC) cell masses, eliciting fear responses via successive projections to brain stem and hypothalamic sites. As a result, rats learn to freeze to tones that predict foot-shock. Repeated subsequent presentation of the tone without shock leads to a decrease in fear which eventually goes down to habituation levels, and this process is called extinction. It has been shown that extinction is not just erasure of fear memory but the formation of a different memory. This thesis focuses on how the lateral amygdala stores fear and extinction memories via the potentiation of particular synapses within the structure. 1.2 OVERVIEW OF THESIS AND OBJECTIVES This thesis deals with several issues related to how fear memory might be stored in the lateral amygdala after Pavlovian fear conditioning. Specifically, we investigate the role of afferents (tone, shock), neuromodulator receptors, and intrinsic excitatory and inhibitory connections in the formation of the fear memory trace. The study is presented in the form of stand-alone journal articles, as described below, with supporting materials in documents attached at the end of the article. Chapter 2. Neuronal and network mechanisms in the storage of amygdala fear a computational study. We used a previously developed 1000-cell biophysical model of LAd that reproduced the cellular correlates of auditory fear memory formation, as seen experimentally. We first proposed an improved criterion to define plastic cells after recognizing that the Repa criterion used to classify plastic cells favored several principal 3
14 cells with very low firing rates, which is possibly not biologically realistic. Using the improved classification criterion, we were able to replicate the development of the two distinct Repa cell populations after fear conditioning. The model suggested that excitability of a cell was the most important predictor of its recruitment into the fear memory trace. Other factors such afferent tone and shock, were required for a cell to be plastic, the presence of neuromodulator receptors, and the numbers of intrinsic excitatory and di-synaptic inhibitory connections a cell received also played important roles, and these were quantified using various plots and a regression model. Chapter 3. Parametric studies related to storage of amygdalar fear. We extended our studies to investigate the role that network size and internal connectivity. Two other reduced network sizes were considered with 500 and 100 cells total, and results showed that both reduced models were able to reproduce all the observed features of the larger 1000-cell model. We then evaluated whether a cortical-like internal connectivity might be able to reproduce the observed results. This was implemented in all the three network sizes cited. Also, since internal connectivity estimates are not known within LA, we varied connectivity among principal cells from the present 5% to 0% to see its effect. The findings from this study will be incorporated into the thesis soon. Chapter 4. summarizes the study and suggests areas for future research. 4
15 CHAPTER 2 Neuronal and network mechanisms in storage of amygdalar fear a computational study ABSTRACT Intrinsic excitability of single cells as well as competitive synaptic interactions between cells play an important role in the assignment of model lateral amygdala (LA) neurons to a fear memory trace. Here we investigated the relative contributions of intrinsic as well as extrinsic factors that enabled an LA neuron to participate in the memory trace, using a 1000-cell biophysical computational model that included principal cells (PN) and interneurons (IN). The model suggested that several factors contributed in different proportions, with the most important being the intrinsic excitability of the cell, i.e., highly excitable cells had a much higher probability of being recruited into the fear memory trace. However, other factors also played a prominent role, including whether the cell received tone and shock afferents, whether it had neuromodulator receptors, and how many excitatory (PN-PN) and di-synaptic inhibitory (PN-IN and IN-PN) connections it received. 5
16 INTRODUCTION The ability to learn fear rapidly is essential for survival. The Pavlovian fear conditioning paradigm is popular in studying how associations are formed between new stimuli or circumstances and fear responses, i.e., how an initially neutral stimulus (conditioned stimulus-cs) elicits conditioned fear responses after pairing with a noxious unconditioned stimulus (US). Fear conditioning induces synaptic plasticity in many regions of the brain, including thalamus and cortex (Letzkus et al., 2011; Weinberger, 2011). However, the most studied region is the dorsal portion of the lateral amygdala (LAd) which has been established as a critical site of plasticity for the storage of CS-US associations (LeDoux, 2000; reviewed in Pape and Paré, 2010). Auditory Pavlovian fear conditioning (LeDoux, 2000; Maren 2001; Pape and Paré, 2010) increases the CS responsiveness of principal neurons (PNs) in the dorsal subdivision of the rodent lateral amygdala (LAd) (Quirk et al., 1995; Collins and Paré, 2000; Repa et al., 2001; Goosens et al., 2003). PNs in the most dorsal part of LAd display increases in CS responsiveness that last for only a few trials (transiently plastic or TP cells) and the more ventrally located PNs show a persistent increases in CS responses, even resisting extinction (Repa et al., 2001). A recent biophysical 1000-cell model of dorsal subdivision of the rodent lateral amygdala (Kim et al., 2013a) successfully replicated the observed (Repa et al., 2001) temporal patterns of increased tone responsiveness displayed by neurons in the dorsal and ventral parts of LAd during Pavlovian fear conditioning. The model included conductance-based models of 800 PNs and 200 INs that reproduced the experimentally observed electroresponsive properties of these cell types, neuromodulatory inputs from 6
17 brainstem dopaminergic and noradrenergic neurons, and spatially heterogeneous intrinsic connectivity (Pape and Paré, 2010). Also, all synapses in the model were endowed with short- and long-term activity-dependent plasticity, except for those delivering shock or background inputs. The LAd model was used to investigate competitive mechanisms between neurons underlying formation of the fear memory trace in LAd (Han et al., 2007, 2009). Competition has been hypothesized to cause only a small subset of principal cells (25%) to be assigned to the fear memory trace during Pavlovian fear conditioning, even though most LAd cells receive the necessary inputs. The model suggested that formation of the memory trace might involve groups of principal cells with higher intrinsic excitability banding together by virtue of their excitatory interconnections, and effectively suppressing other principal cells via disynaptic inhibitory connections involving interneurons (Kim et al., 2013b). However, the details of how competition is implemented at the cellular and synaptic levels are not clear. The mechanisms involved in this competition among PNs include intrinsic cellular excitability, intra-lad excitatory and inhibitory connections, extrinsic tone and shock afferents, neuromodulation effects, and intra-amygdalar plasticity (PN-PN, PN-IN and IN-PN) engendered by the training protocol. Here we used the model to shed light on the relative roles of these mechanisms in favoring certain principal cells to participate in the fear memory trace. RESULTS We used a previously developed biophysically-realistic model of LAd (Kim et al., 2013a) to investigate the role of various cellular mechanisms in the competition that forms the LAd fear memory trace. The network model included conductance-based 7
18 models of 800 principal cells and 200 interneurons (Fig. 1A-C). The intrinsic synapses were endowed with both short- and long-term activity-dependent plasticity, except for those delivering shock or background inputs. The training paradigm used is shown in Fig. 1D. The CS-evoked responses were of two distinct types as reported previously (Kim et al., 2013a), plastic cells (e.g., Fig. 1E,F) which showed a significant increase in their firing rates from habituation levels, and non-plastic cells that were unchanged from habituation levels. It is noted that the model was tuned to produce these two distinct tone responsive cell populations and their percentages seen in experiments (Repa et al., 2001). Tone responses are computed as spikes per tone within 300 ms of tone onset. All reported values are averages ± s.e.m. unless stated otherwise. Four key features differentiate the principal cells: their type (A, B, C), the neuromodulator receptors they have (DA, NE or both), the extrinsic inputs they receive (one tone, two tones, shock), and the numbers of intrinsic excitatory (PN-PN) and inhibitory connections (IN-PN) that they receive. CS-evoked PN and IN tone responses varied widely after conditioning Conditioning caused a significant increase in the CS-evoked responses of 20% of model LAd neurons, and these were classified as plastic cells (N=156; PN type: A-3/400, B- 93/240 and C-60/160). These plastic cells comprise the fear memory trace in LAd (Repa et al., 2001; Han et al., 2009). We characterized the tone responses of cells to later investigate (see next section) the underlying mechanisms recruited by conditioning to induce plasticity in various synapses and store fear. 8
19 Conditioning-induced plasticity and storage of fear. The model showed different potentiation patterns for the various synapses as a result of fear training. The tone-pn synapses of plastic cells potentiated by 118.7±7.4% after the conditioning phase and were 80.55±4.82% above baseline after extinction (fig. S1A). The tone-in synapses also potentiated by 149.1±9.22% after conditioning and were ±10.72% above baseline after extinction (fig. S1B). The tone-pn synapses of non-plastic cells showed considerably lower potentiation after conditioning, 0.21±0.54%, as expected (fig. S1C). For characterizing conditioning induced changes in PN-PN, PN-IN and IN-PN weights, we considered a representative group of 10 plastic and 10 non-plastic model cells. PN-PN synapses increased by 15.71±14.54% after conditioning, and were 8.22±10.45% above baseline levels after extinction (the corresponding numbers for non-plastic cells were ±2.13% and -6.5±2.08%, respectively). In the di-synaptic inhibitory pathway, PN-IN weights exhibited negligible change (<1%) for both plastic and non-plastic cells. However, the IN-PN weights increased by ±29.02% after conditioning, and were 175.1±26.94% above baseline level after extinction (the corresponding numbers were ±17.79%% and 90.19±19.87%% for non-plastic cells). Turning off all intraamgydalar plasticity only during recall had an insignificant effect on the tone responses of plastic cells, indicating that fear may be stored primarily in the tone-pn synapses of plastic cells. Of the 156 plastic cells, 139 received shock, indicating that shock was a key afferent for the formation of plastic cells. Of the 139 cells, 137 received at least one tone input, and 9
20 122 had increases in tone weights of >10%; 15 plastic cells had tone weight increases <10% because these cell received more di-synaptic inhibitory inputs from plastic cells (87.67±3.73) than the cells whose tone weights increased more than 10% (67.67±10), and 13 of these did not have NE receptors. Only one cell had increases of tone weight >10% without shock input, and this was because it was type C, and had both tones, both NM receptors. These increases in tone weights also correlated with firing frequency, irrespective of the number of tone inputs they received. If a PN received both thalamic and cortical tones, they tend to typically increase by the same amount, and so we selected the larger one for reporting. From another perspective, the tone weights of most plastic cells (80%; 123/154, 2 plastic cells had no tone inputs and were plastic solely due to strong afferents) potentiated by more than 10%. The 31 whose tone weights did not potentiate >10% received excitatory inputs compared to the other plastic cells (4.74±0.56 v/s 4.5±0.27), and 16 of these did not receive shock inputs. As expected, conditioning induced plasticity changed the firing patterns of both PNs and INs, and we characterized these to investigate trends. Variations in firing patterns. Considering all PNs as a group, the CS-evoked responses were found to vary considerably after conditioning. The PN firing frequency in all cases was calculated over the first 300 ms after tone onset during the first extinction trial. There was a large variation in PN tone responses with plastic cells having significantly higher 10
21 CS-evoked responses when compared to those for non-plastic cells (24.63±1.17 Hz v/s 1.45±0.17 Hz; p<1.15e-56). For analysis purposes, we grouped plastic cells into three categories based on firing frequency, Low firing, LF: <=20Hz (N=66, 42.3% of all PCs); MF: 20-40Hz (N=65, 41.7%); HF: >40Hz (N=25, 16%). The INs as a group also exhibited varying firing frequencies with an average of 44.53±1.8 Hz. Again, we grouped interneurons by firing frequency into three categories, Low firing, LF: <=20 Hz (N=40, 20% of all INs); MF: Hz (N=47, 23.5%); HF: >40 Hz (N=113, 56.5%). TP and LP cells. As cited, tone plasticity was a key determinant for both types of plastic cells, TP and LP, since 97% of the plastic cells had more than 10% increases in tone weights. Why do tone responses of TP cells start decreasing mid-way during conditioning (3 rd block in fig. 1E,F), while those of LP cells show very little change? Our analysis showed that, while most of the other characteristics were similar, LP cells received significantly fewer inhibitory connections from interneurons compared to TP cells (14.49±7.59) v/s 22.40±7.06; p=1.15e-7, α = 0.05). CS-evoked responses of both plastic cells and interneurons potentiated during conditioning. However, the net effect after conditioning was one of increased PN firing for LP cells and firing at habituation levels for TP cells, as shown in Fig. 1E,F. Conditioning increased the tone weights of plastic cells differentially in the thalamic and 11
22 cortical lines: thalamic by ±21.06% and cortical by 47.62±16.87% for TP cells, and thalamic by ±10.82% and cortical by 67.09±10.61% for LP cells. Plastic cells differ in several ways from non-plastic ones We found that shock was necessary to increase the firing frequency of a PN and make it plastic (Fig. 2A). Of the plastic cells, 89.1% received direct shock. The remaining 10.9% received an average of 4.35±0.24 inputs from plastic cells that received direct shock, compared to 3.24±0.71 for the other plastic cells, indicating that they received strong indirect shock. So, either direct or strong indirect shock is necessary for the formation of plastic cells. The firing frequencies were similar for PNs with one or two tones, indicating that additional tones did not predispose a PN to become plastic. Interestingly, the increase in tone weight (Fig. 2B) paralleled the increase in PN firing frequency, and this increase was again comparable for both one and two tones cases. Classifying PNs based on the number of tone and shock inputs it received revealed PNs receiving two tones (thalamic and cortical), shock and having one or both of NE and DE receptors had a high probability of becoming plastic (Fig. 3). Compared to plastic cells, the cells in panel A of Fig. 3 that did not become plastic were found to have higher inhibition (107.8±-42.1 v/s 86.9±41.7, p=0.17) and lower excitation (2.4±2.3 v/s 4.9±2.9, p<0.01). This pattern was seen consistently among cells in panels B-D of Fig. 3, with non-plastic cells receiving significantly higher disynaptic inhibition from plastic cells (95.1±38.8 v/s 78.7±42.2, p= p<0.01) and lower excitation from plastic cells (3.9±2.7 v/s 4.5±3.1, p=0.14) compared to plastic cells as a group. 12
23 Neuromodulators were the next significant factor, after cell type and tone and shock afferent, in enabling a cell to become plastic. For cells that received one or no tones and shock (panels B,C,D of Fig. 3), either NE or DA receptor was required for the cell to become plastic. The probabilities of becoming plastic were as follows: cells with both DA and NE was the highest with 50.9%, with only NE was next with 43.3%, and with DA was third with 11.6% probability. Cells that received no tone and no shock (B&C=26 A=24; 6.25% of PNs) never became plastic. As cited, the cells that did not become plastic in panels B-D of Fig. 3 significantly higher disynaptic inhibition from plastic cells and lower excitation from plastic cells (3.9±2.7 v/s 4.5±3.1, p=0.14) compared to plastic cells as a group. Since type A cells comprised <2% of plastic cells, we considered only type B and C cells in our analyses. For cells that received either 1 or 0 tones and shock, or tones but no shock (panels B, C and D of fig.4-6), we found the following features: (i) plastic cells received more input from plastic cells, as compared to non-plastic cells (4.45±0.32 v/s 3.83±0.19; p<0.1; Fig. 4), indicating that they may band together and excite each other; (ii) non-plastic cells received significantly more di-synaptic inhibition from plastic cells compared to plastic cells in almost all categories (77.01±4.44 v/s ±4.27; p<4.86e- 22; Fig. 5). 13
24 (iii) the number of inhibitory inputs correlated inversely with PN firing rate, but the number of excitatory inputs from other plastic cells did not (Fig. 6). So, although plastic cells aided other plastic cells, inhibition had a more dominant role and determined whether a cell became plastic or not. We also found that the firing frequency of an interneuron correlated linearly with the number of plastic cell afferents it received, and not on its tone and shock afferents (Fig. S2). This indicates that tone-in weights do not potentiate significantly during conditioning to impact CS-evoked firing of INs, and provides an important insight that PNs are in a unique position to inhibit other PNs via disynaptic connections involving INs. This finding will be relevant as we investigate competition among PNs in the following. Mechanisms implicated in the competition The control case had the following distribution of principal cell types: 400 type A, 240 type B, and 160 type C (see methods). Of the 800 principal cells, the model was tuned so that only about 20% were recruited into the memory trace, i.e., become plastic, consistent with the fraction seen in experiments (Han et al., 2007, 2009). Then we asked the question why it was that with 70% of the principal cells receiving tone and shock, only 20% became plastic? Our recent study (Kim et al., 2013) addressed this question and suggested that PNs competed with each other to get recruited to the fear memory trace. We found that both intrinsic excitability and synaptic connections played a role in this competition. Specifically, some PNs with higher levels of intrinsic excitability (e.g., of 14
25 types B and C) fired more by virtue of favorable extrinsic and intrinsic connectivity and these cells (that became plastic eventually) were effective in suppressing other cells from becoming plastic via di-synaptic inhibition involving interneurons. The tone weights of the high firing cells continued to increase, eventually making them plastic, and those of non-plastic PNs were prevented from increasing by di-synaptic inhibition. The modeling study of Kim et al. (2013) then investigated this competitive effect further by converting 25% of type A cells into type C cells, as well as converting 25% of type B and C cells to type A, to mimic the experiments in Han et al. (2009) where they increase excitability due to CREB (denoted as CREB + ) as well as decrease the number of intrinsically excitable cells (denoted as CREB + ) to study competition. The basic idea of competition was still found to hold, and here we extend that study by considering detailed mechanisms involved in the competition in the CREB + and CREB - cases. We considered only cells of types B and C in the comparison groups below, since type A cells comprised <2% of plastic cells. Since the winner and loser groups were of unequal sizes (e.g., N=46 and 21, respectively), we used the standard normalization procedure (give some stat book REF here) when calculating the numbers of connections between groups. For instance, numbers of connections from winners to losers were multiplied by 1 and those from losers to winners by 46/21. CREB + case. When a random 100 type A cells (25%) were converted to types B&C prior to training, the number of plastic cells did not increase proportionately, and changed only 15
26 from 156 to 181. Of these 135 were previously plastic, 46 were new ( winners ; A=0, B&C=46) and 21 became non-plastic ( losers ; A=0, B&C=23). Of the winners, 27 were due to the fact that the cell type changed from A to B&C, while 19 were already of types B&C but had net increase in excitation. Then we compared the connections between winner cells and loser cells shown in Fig.7C (exc) and 7D (inh). The excitatory connections between winner cells was significantly higher than the connections between losers (1.59±0.2 v/s 0.65±0.27; p= 1.84E-5). Also, the number of di-synaptic inhibitory inputs between winner cells was significantly less than same connections between loser cells (23.75±2.27 v/s 37.23±4.6; p<0.05). Moreover, loser cells provided more excitation to winner cells than the other way round (1.506±0.36 v/s 0.95±0.21), and the winner cells had higher di-synaptic inhibitory inputs to the loser cells than the other way round (30.35±3.44 v/s 27.86±3.29). CREB - case. When a random 100 type C cells (25%) were converted to type A prior to training, the number of plastic cells did not decrease proportionately, and changed only from 156 to 125. Of these 104 were previously plastic, 21 were winners (A=6, B&C=15) and 52 became losers (A=38, B&C=14). Of the losers, 38 were due to the fact that the cell type changed from C to A and so they lost excitability. The remaining 14 loser cells (all B&C) received more di-synaptic inhibitory inputs compared to the winners (18.5±1.52 v/s 17.7±1.69, not significant), but also received more excitatory inputs than the winners (1.81±0.32 v/s 0.91±0.27, not significant). We performed a more detailed analysis of their characteristics using insights from a regression model (described later) 16
27 which revealed thalamic tone, shock and the presence of NE receptor to be significant (p<0.01) attributes of plastic cells. For this analysis we used 1 or 0 to indicate the presence or absence of each of these three attributes, and summed them on a cell by cell basis (range of 0 to 3) for the winners and losers. Interestingly, this summed value was significantly greater for winner cells compared to the losers (2.14±0.13 v/s 1.71±0.19, p<0.05). Correlations and regression model: We performed correlation analysis between the various mechanisms that made a cell plastic, and two output measures: whether a cell was plastic or not (binary), and the firing rate of plastic cell (continuous). The mechanisms considered were the number of excitatory inputs from other plastic cells, the number of disynaptic inputs from other plastic cells via inhibitory interneurons, whether it receive thalamic, cortical and shock afferents (each binary), and whether it had DA and NE receptors (again binary). Significant correlations were determined (p<0.01 for all) with the following five inputs ( values provided in parenthesis): disynaptic inputs from plastic cells involving inhibitory interneurons (-0.185), thalamic tone (0.5148), cortical tone (0.1385), shock (0.3386), and presence of NE receptor (0.4096). A multi-linear regression model was then developed and yielded the following coefficients for the variables (in the same order, all binary except the first one; p<<<.01): , , , , and This analysis helps rank the binary mechanisms in their order of importance as follows: thalamic tone, shock, NE receptor, and cortical tone. 17
28 Role of plasticity. In both the control and CREB up- and down-regulation cases, disynaptic inhibition via interneurons was a key mechanisms that enabled high firing PNs to inhibit their competitors. Plasticity in the thalamic and cortical pathways also played a role. In the model, the thalamic pathway has a larger learning rate implying that, for cells with similar intrinsic and afferent connections, the ones with thalamic tone were favored to be plastic, compared to the ones with cortical tone. A regression analysis using PN firing rate as output and the extrinsic (thalamic tone, cortical tone, shock) and intrinsic afferents and neuromodulation receptors (DA and NE), revealed that the significant ones were thalamic tone, shock, and NE receptor (p<0.01; data not shown). We also performed several inactivation experiments to determine the roles of intraamygdalar plasticity (in PN-PN, IN-PN, and PN-IN synapses) on the formation of plastic cells. Instead of remaining constant at 20% (N=156/800), inactivation of all intraamygdalar plasticity caused the size of the number of plastic cells to increase by 54% (to N=240). This implicates intra-amygdalar plasticity as the mechanism limiting the number of plastic cells to 20%. Inactivating each individually revealed the following trends: with PN-PN plasticity off, the number of plastic cells decreased by 8% (to N=144); with PN- IN plasticity off, the number of plastic cells increased by 3% (to N=161); with IN-PN plasticity off, the number of plastic cells increased by 56%. This shows that IN-PN plasticity was the dominant form of plasticity and the others did not contribute much. These trends paralleled the changes in plasticity in the control case in these plastic cell synapses, as cited earlier: PN-PN synapses from all plastic cells to a plastic cell increased by 16±15%, IN-PN connections to plastic cells increased by 163±29%, while PN-IN 18
29 connections for both pre-synaptic plastic cells exhibited minimal change, <1%. We investigated this further and found an interesting pattern of synaptic weight changes for the various inactivation cases (Fig. S2): inactivation of PN-PN and PN-IN synapses had an insignificant effect on the average change in weight of the dominant IN-PN synapse. These inactivation experiments also led to the finding that the inactivation manipulations led to another form of competition among the PNs. This is because inactivation of plasticity did not change the connections themselves, but alters their efficacy. This change in efficacy affected the firing rates of both PNs and INs. We found that the efficacy of the IN-PN connection was important in altering PN characteristics, and that inactivation typically caused a larger decrease in IN-PN weights for winners than losers, compared to the control case. However, this was not consistent and changes in efficacy of other weights such as PN-PN and PN-IN, and the changes in firing frequencies of PNs and INs were also important. Details related to these are complex and so provided in a separate attachment. We also found that the winner PNs also received a higher proportion of thalamic tone, shock and NE receptor distribution, compared to loser PNs. So, this suggests that IN-PN plasticity is the dominant intra-amygdalar form of plasticity. Moreover, the analysis suggests that the competition among PNs resulting from the inactivation of such intrinsic plasticity is affected primarily by the decrease in IN-PN plasticity compared to the control case, to a particular PN. The model also suggested the winner PNs had significantly more of the extrinsic afferents and had NE receptors, compared to loser PNs. 19
30 DISCUSSION Competition has been hypothesized to cause only a small subset of cells (25%) to be assigned to the fear memory trace, even though most LAd cells receive the necessary inputs (Han et al., 2007, 2009). This was also shown recently in a biologically-realistic model of LAd (Kim et al., 2013b) that compared the intrinsic connectivity of plastic vs. non-plastic cells and identified a major substrate of this competition as being the differential distribution of excitatory connections between principal cells and the amount of disynaptic inhibition they generate in other projection cells. In addition to a more detailed investigation of the intrinsic connections, the present study also considered the role of extrinsic tone and shock inputs, and neuromodulator receptors in the competition. Synaptic competition occurs in a subset of principal cells Extending the findings in Kim et al. (2013), we found that all the PNs did not participate in the competition involving synaptic interactions. Tone responses of type A cells adapt rapidly and so none of those became plastic, indicating that they do not participate in the competition. In addition, we found that type B and C PNs that received both thalamic and cortical tones and shock (18%; they were invariably plastic and were not affected by intrinsic afferents), and the set that received no extrinsic tone and no shock (24%; they were never plastic) did not participate in the competition. So, approximately 42% of the PNs were non-participants in the synaptic competition. Plastic cells were found to receive more inputs from plastic cells, compared to non-plastic cells, and this suggests that they may band together and assist each other in the competition. 20
31 Inhibition is the key mechanism that control competition within LAd Among the PNs that participate in the competition, the model implicates inhibition as the dominant mechanism in determining which ones become plastic, due to several reasons. First, the number of inhibitory (and not excitatory) inputs to a PN was inversely correlated with the PN firing rate. Second, IN firing rate increases with the number of inputs they receive from plastic cells, positioning interneurons well for disynaptically inhibiting other PNs. Third, a distinguishing feature of non-plastic cells was that they received significantly more disynaptic inhibitory inputs compared to plastic cells. Fourth, the cells that fail to conform to the probability predictions in Fig. 3 discussed in the previous section did so due to excessive inhibition. Also, potentiation of inhibition (IN-PN synapse) in later COND trials leads to the formation of TP cells. While most of the other characteristics were similar, TP cells received significantly more inhibitory di-synaptic connections from plastic cells involving interneurons, compared to LP cells (22.4±7.1 v/s 14.5±7.6 (SD); p<0.001, α = 0.05). Taken together, this suggests that inhibition via disynaptic inhibition is a key feature of the interactions among cells in the lateral amygdala. Model provides guidelines to predict numbers of plastic cells, as well as winners and losers 21
32 The model suggests that tone responses of cells may be predicted based on the cell type, their neuromodulator receptors, extrinsic afferents, and intrinsic connections. For instance, type A cells can very rarely be plastic. Similarly, almost all cells of types B and C with two tones and shock are almost always plastic, irrespective of the other features. For the others, intrinsic connections as well as neuromodulator receptors played an important role. Using the probability numbers in Fig. 3, we estimated the numbers of plastic cells in three other network configurations, a 1000-cell model that had much reduced connectivity between PNs, a 500-cell network, and a 100-cell network. CONCLUSIONS A previously developed biophysical model of LAd (Kim et al., 2013a,b) was used to investigate the intrinsic and extrinsic mechanisms contributing to the formation of fear memory (Han et al., 2007, 2009) in LAd after conditioning. The model had identified excitatory connections between principal cells and the amount of disynaptic inhibition they generate in other projection cells as two factors that controlled the formation of such a memory. Here we considered the role of the tone and shock afferents as well as neuromodulators, in addition to a more detailed look at the role of intrinsic connectivity, in this competition. The model helps identify the specific roles of intrinsic excitability of PN cells, NM receptors, tone, shock, and PN-PN and IN-PN connections in making a cell plastic. Type B&C cells with both tones, shock and both NM receptors were always plastic unless they received overwhelming intrinsic inhibition. On the other hand, cells without tone and shock, as well as most type A cells, were always non-plastic. This 22
33 implies that competition occurs primarily among the remaining cells and seems to exhibit the interesting patterns discussed. 23
34 METHODS (check references) We provide a brief overview of the 1000-cell biophysical LAd model used in this study. The reader is referred to our prior study for a complete description (Kim et al., 2013b). Single cell models To reproduce to diversity of spike frequency adaptation seen in principal LA neurons (Faber et al., 2001; Faber et al., 2003; Power et al., 2011), we modeled three types of regular spiking principal cells, with high (type-a), intermediate (type-b), or low (type-c) spike frequency adaptation, due to the differential expression of a Ca 2+ -dependent K + current. LA also contains local GABAergic interneurons that exhibit various firing patterns, even among neurochemically-homogeneous subgroups (Pape and Paré, 2010). However, the majority displays a fast-spiking pattern, which was reproduced in the model. The principal cell model had three compartments representing a soma (diameter µm; length 25 µm), an apical dendrite (diameter 2.5 µm; length 119 µm) on which synapses were placed, and another dendrite (diameter 5 µm; length 400 µm) that helped match passive properties. Values of specific membrane resistance, membrane capacity and cytoplasmic (axial) resistivity were within the ranges reported in previous physiological studies. The current types, equations and densities, as well as the match of single cell model and experimental data for responses to various current injections can be found in recent reports (Kim et al., 2013b; Li et al., 2009). The interneuron model had two compartments, a soma (diameter 15 µm; length 15 µm) and a dendrite (diameter 10 µm; length 150 µm). The passive membrane properties were as follows: Rm = 20 KΩ-cm 2, Cm=1.0 µf/cm 2, Ra= 150 Ω-cm, and EL = -70 mv. 24
35 Similar to the pyramidal cell, the interneuron model could reproduce the non-adapting repetitive firing behavior of fast spiking cells, as observed experimentally. Details including currents used have been reported separately (Kim et al., 2013b). Network structure and connectivity It was estimated that there are 24,000 principal cells in LAd (Tunnanen and Pitkanen, 2000). To keep computation times practical while capturing the complexity of the intra- LAd network, we modeled a scaled down (30:1) version of LAd that included 800 principal cells. The various types were in the following numbers: A-400, B-240, and C Because the proportion of interneurons to principal cells is 20:80, the model included 200 interneurons. Principal cells and interneurons were distributed randomly in a realistic tri-dimensional representation of the horn-shaped LAd (Fig. 1A). By comparing the responses of LA cells to local applications of glutamate at various positions with respect to recorded neurons, general principles were inferred for connectivity among principal cells, as well as between local-circuit and principal neurons (Samson and Paré, 2006). Activity-dependent synaptic plasticity Model synapses could undergo activity-dependent synaptic plasticity, consistent with the experimental literature. All AMPA synapses in the model were endowed with longterm postsynaptic plasticity except for those delivering shock or background inputs. Also, all GABA synapses had long-term plasticity. This form of plasticity was implemented using a learning rule that uses the concentration of a post-synaptic calcium pool at each 25
36 modifiable synapse (Shouval et al., 2002a, 2002b). Calcium entered post-synaptic pools at excitatory synapses via NMDA receptors (and AMPA receptors for interneurons) and voltage-gated calcium channels (VGCCs). Similarly, calcium for pools at inhibitory synapses came from post-synaptic intra-cellular stores and VGCCs (Li et al, 2009). For both types of synapses, the synaptic weight decreased when the calcium concentration of the pool was below a lower threshold and increased when it exceeded an upper threshold. All model AMPA and GABA synapses also exhibited short-term presynaptic plasticity, with short-term depression at interneuron to principal cell and principal cell to interneuron connections. Additional details and equations related to the implementation of these plasticity mechanisms can be found in Kim et al. (2013b). Neuromodulator effects Neuromodulators have long been implicated in fear and anxiety, and are known to regulate Pavlovian fear learning and synaptic plasticity in LA (Bissière et al., 2003; Tully et al., 2007). Conditioned aversive stimuli alter the activity of ventral tegmental area and locus coeruleus neurons, which in turn modulate fear and anxiety through their widespread forebrain projections, including to the amygdala. Therefore, the model incorporated the effects of dopamine (DA) and norepinephrine (NE) on LAd cells, based on prior experimental reports. Inputs Background synaptic inputs. LA projection neurons have low spontaneous firing rates in control conditions (Gaudreau and Paré, 1996). To reproduce this, Poisson-distributed, 26
37 random excitatory background inputs were delivered to all model cells, resulting in average spontaneous firing rates of 0.7 Hz for principal cells and 7.2 Hz for interneurons. Tone and shock inputs. Auditory fear conditioning is thought to depend on the convergence of inputs relaying information about the CS (tone) and US (footshock) in LA (LeDoux, 2000; Pape and Paré, 2010; Quirk et al., 1995). In the model, the CS and US inputs were represented by glutamatergic synapses acting via AMPA and NMDA receptors. The frequency of thalamic and cortical tone inputs during habituation was set to 20 Hz. The tone inputs also included noise represented by random Poisson spikes with an average frequency of 2 Hz. The following distribution of inputs was used for the simulations: uniform total tone density throughout LAd with 70% of the LAdd cells receiving thalamic and 35% receiving cortical tone projections, and the opposite for LAdv, i.e., 35% of LAdv cells receiving thalamic and 70% receiving cortical tone projections. The shock inputs were distributed uniformly to 70% of LAd cells. Conditioning protocol used in simulations The schedule of tone and shock inputs in the simulations was based on in vivo studies (Quirk et al., 1995). We scaled down the timing of the auditory fear conditioning protocol so that it would be suitable for computational studies (Fig. 1B). The protocol included three phases (habituation, conditioning and recall), comprised of 8, 16 and 4 trials, respectively. Each trial featured a 0.5 sec tone CS followed by a 3.5 sec gap. Only during conditioning, a shock was administered 100 msec prior to the end of the tone, so that they co-terminated. In light of evidence that fear conditioning leads to plasticity in CS afferent 27
38 pathways, the frequency of thalamic and cortical tone inputs was increased to 40 Hz after the first and sixth conditioning trials, respectively. Plastic cells Using the definition in Repa et al. (2001), a model PN in Kim et al. (2013) was considered plastic if its CS-elicited firing during any of the four trial conditioning blocks was higher than during the habituation trials using a t-test with a significance threshold of P <0.05. As in Repa et al. (2001), in the second step, a persistence value was calculated for each plastic cell by dividing the increase in CS responses during late conditioning (final eight trials) by that seen during early conditioning (first eight trials), both relative to habituation. Model plastic cells with persistence values of < 0.75 were classified as transiently plastic (TP) cells (Fig.4A1), and those with persistence values >0.75 were classified as long-term plastic (LP) cells (Fig. 4A2). The results in Kim et al. (2013) indicated that the criterion permitted several PNs to be plastic, even with an increase of only 1-2 spikes during the conditioning trials. To avoid inclusion of these low firing cells, we required that all plastic cells fire at a frequency > 4Hz during the first extinction block (initial 300 ms of tone). Adding this criterion reduced the number of plastic cells from 198 to 156, with virtually no type A cells (~1%) being part of the fear memory trace. All model runs were performed using parallel NEURON (Carnevale and Hines, 2006) running on a Beowulf supercluster with a time step of 10 s. The primary model used in 28
39 this study will be available on the ModelDB public database ( as part of our previous publication (Kim et al., 2013b). ACKNOWLEDGMENTS This research was supported in part by NIMH grants MH to DP and MH to SSN. REFERENCES COMPETITION Antunes R, Moita MA (2010) Discriminative auditory fear learning requires both tuned and nontuned auditory pathways to the amygdala. J Neurosci 30: Armony JL et al. (1997) Stimulus generalization of fear responses: effects of auditory cortex lesions in a computational model and in rats. Cereb Cortex 7(2): Ball JM, Hummos AM, Nair SS (2012) Role of sensory input distribution and intrinsic connectivity in lateral amygdala during auditory fear conditioning: A computational study. Neurosci 224: Benito E, Barco A (2010) CREB s control of intrinsic and synaptic plasticity: implications for CREB dependent memory models. Cell 33, Collins DR, Paré D (2000) Differential fear conditioning induces reciprocal changes in the sensory responses of lateral amygdala neurons to the CS(+) and CS(-). Learn Mem 7:
40 Doyere V. et al. (2003) Long-term potentiation in freely moving rats reveals asymmetries in thalamic and cortical inputs to the lateral amygdala. Eur J Neurosci 17: Doyere, V. et al. (2007) Synapse-specific reconsolidation of distinct fear memories in the lateral amygdala. Nat. Neurosci 10: Duvel AD, Smith DM, Talk A, Gabriel M (2001) Medial geniculate, amygdalar and cingulate cortical training-induced neuronal activity during discriminative avoidance learning in rabbits with auditory cortical lesions. J Neurosci 21: Faber ES, Callister RJ, Sah P (2001) Morphological and electrophysiological properties of principal neurons in the rat lateral amygdala in vitro. J Neurophysiol 85: Faber ES, Sah P (2003) Ca 2+ -activated K + (BK) channel inactivation contributes to spike broadening during repetitive firing in the rat lateral amygdala. J Physiol 552: Goosens KA, Hobin JA, Maren S (2003) Auditory-evoked spike firing in the lateral amygdala and Pavlovian fear conditioning: mnemonic code or fear bias? Neuron 40: Han JH, Kushner SA, Yiu AP, Cole CJ, Matynia A, Brown RA, Neve RL, Guzowshi JF, Silva AJ, and Josselyn SA (2007) Neuronal competition and selection during memory formation. Science 316: Han JH, Kushner SA, Yiu AP, Hsiang HL, Buch T, Waisman A, Bontempi B, Neve RL, Frankland PW, Josselyn SA (2009) Selective erasure of a fear memory. Science 323: Honig WK, Urcuioli PJ (1981) The legacy of Guttman and Kalish (1956): 25 years of research on stimulus generalization. J Exp Anal Behav 36:
41 Izumi T, Boku S, Shinmin W, Inoue T, Konno K, Yamaguchi T, Yoshida T, Matsumoto M, Watanabe M, Koyama T, Yoshioka M (2011) Retrieval of conditioned fear activates the basolateral and intercalated nucleus of amygdala. J. Neurosci Res 89: Jarrell TW, Gentile CG, Romanski LM, McCabe PM, Schneiderman N (1987) Involvement of cortical and thalamic auditory regions in retention of differential bradycardiac conditioning to acoustic conditioned stimuli in rabbits. Brain Res 412: Kim D, Pare D, Nair SS (2013a) Mechanisms contributing to the induction and storage of Pavlovian fear memories in the lateral amygdala. Learn Mem 20: Kim D, Pare D, Nair SS (2013b) Assignment of lateral amygdala neurons to the fear memory trace depends on competitive synaptic interactions. J Neurosci 33(36): LeDoux, J.E. Emotional circuits in the brain. Annu. Rev. Neurosci. 23, (2000). Letzkus JJ, Wolff SB, Meyer EM, Tovote P, Courtin J, Herry C, Lüthi A (2011) A disinhibitory microcircuit for associative fear learning in the auditory cortex. Nature 480: Li G, Nair S, and Quirk GJ (2009) A biologically realistic network model of acquisition and extinction of conditioned fear associations in lateral amygdala neurons. J Neurophysiol 101: Lin HC, Mao SC, Su CL, Gean PW (2010) Alterations of excitatory transmission in the lateral amygdala during expression and extinction of fear memory. Int J Neuropsychopharmacol 13,
42 Lissek S, Biggs AL, Rabin SJ, Cornwell BR, Alvarez RP, Pine DS, Grillon C (2008) Generalization of conditioned fear-potentiated startle in humans: experimental validation and clinical relevance. Behav Res Ther 46: Lissek S, Rabin S, Heller RE, Lukenbaugh D, Geraci M, Pine DS, Grillon C (2010) Overgeneralization of conditioned fear as a pathogenic marker of panic disorder. Am J Psychiatry 167: McGaugh JL (2012) Memory consolidation and the amygdala: a systems perspective. Trends Neurosci 25, Pape HC, Paré D (2010) Plastic synaptic networks of the amygdala for the acquisition, expression, and extinction of conditioned fear. Physiol Rev 90: Power JM, Bocklisch C, Curby P, Sah P (2011) Location and function of the slow afterhyperpolarization channels in the basolateral amygdala. J Neurosci 31: Quirk GJ, Repa JC, LeDoux JE (1995) Fear conditioning enhances short latency auditory responses of lateral amygdala neurons: parallel recordings in the freely behaving rat. Neuron 15: Repa JC, Muller J, Apergis J, Desrochers TM, Zhou Y, LeDoux JE (2001) Two different lateral amygdala cell populations contribute to the initiation and storage of memory. Nat Neurosci 4: Rumpel S, LeDoux J, Zador A, Malinow R (2005) Postsynaptic receptor trafficking underlying a form of associative learning. Science 308: Shaban H, et al. (2006) Generalization of amygdala LTP and conditioned fear in the absence of presynaptic inhibition. Nat Neurosci 9(8):
43 Siberberg G, Markram H (2007) Disynaptic inhibition between neocortical pyramidal cells mediated by Martinotti cells. Neuron 53(5): Tuunanen J, Pitkänen A (2000) Do seizures cause neuronal damage in rat amygdala kindling? Epilepsy Res 39: Viosca J, Armentia ML, Jancic D, Barco A (2009) Enhanced CREB-dependent gene expression increases the excitability of neurons in the basal amygdala and primes the consolidation of contextual and cued fear memory. Learn Mem 16: Weinberger NM (2011) The medial geniculate, not the amygdala, as the root of auditory fear conditioning. Hear Res 274: Zhou Y, Won J, Karlsson MG, Zhou M, Rogerson T, Balaji J, Neve R, Poirazi R, and Silva AJ (2009) CREB regulates excitability and the allocation of memory to subsets of neurons in the amygdala. Nat Neurosci 12:
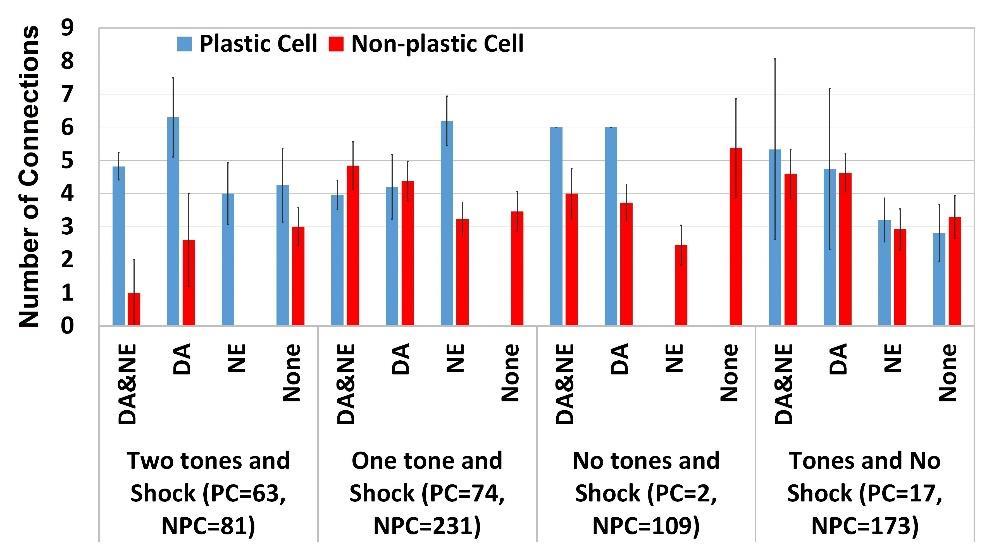
44 FIGURE TITLES Figure1. (A) Electroresponsive properties of model LA neurons.voltage responses of model cells to intracellular current injection. The responses of the three types of principal cells (types A, B and C) to current injections (left: 400 pa; middle: 300 pa; right: -100 pa; duration 600 ms) are similar to those reported in Faber et al. (2001). (B) Voltage responses of the interneuron model to 200-ms current injections of the same magnitude as in A. (C) Schematic of the LAd network model with 800 principal cells (red and green dots, 400 each, represent principal cells in LAdd and LAdv, respectively) and 200 interneurons (black dots). The principal cells in the model were populated randomly in the horn shaped tridimensional structure with dimensions of 800 μm in the rostral-caudal, 800 μm in the ventral-dorsal, and 400 μm in the medial-lateral directions. (D) fear conditioning protocol for the model. As in the experiments of Repa et al. (2001), the behavioral protocol included habituation, conditioning and extinction phases, with 8, 16 and 20 trials, respectively. (E) Tone responses of LAd cells during the different phases of the behavioral protocol. (E1) Model (black, N=91/800) and experimental (red; N=12/100; from Repa et al., 2001) tone responses of TP cells show a sudden increase during early conditioning, and then drop to habituation levels during late conditioning. (E2) Model (black; N=107/800) and experimental (red; N=12/100) tone responses of LP cells increase gradually with conditioning and persist during extinction. Figure 2. (A) Direct or indirect shock is important to increase the firing frequency of PNs. Variation of firing frequency of PNs (Hz) with tone and shock afferents received; (B) 34
45 Increase in tone-pn weights after fear training for different groups of PNs. LF- Low firing; MF- Medium Firing; HF High firing; PC- plastic cell; NPC- non-plastic cell. Figure 3. Probability (y-axis) that a PN will be plastic based on the tone and shock afferents it receives. Figure 4. Variation of the number of inputs received by PNs from plastic cell inputs for the various groups Figure 5. Variation of the number of disynaptic inhibitory inputs from plastic cell received by PNs in the various groups Figure 6. Variation of PN firing rate with the numbers of excitatory and disynaptic inhibitory inputs received from plastic cells, for the various groups of PNs. Figure 7. Differential intrinsic connectivity supports competition. Monosynaptic excitatory (A,C,E) and disynaptic inhibitory (B,D,F) connections among as well as between plastic and non-plastic cells (x-axis) in the control case. (C-F) Connections of type B-C winner and loser cells in the CREB + (C,D) and CREB (E,F) simulations. Averages ± s.e.m. 35
46 FIGURE TITLES Figure 2.1. (A) Electroresponsive properties of model LA neurons.voltage responses of model cells to intracellular current injection. The responses of the three types of principal cells (types A, B and C) to current injections (left: 400 pa; middle: 300 pa; right: -100 pa; duration 600 ms) are similar to those reported in Faber et al. (2001). (B) Voltage responses of the interneuron model to 200-ms current injections of the same magnitude as in A. (C) Schematic of the LAd network model with 800 principal cells (red and green dots, 400 each, represent principal cells in LAdd and LAdv, respectively) and 200 interneurons (black dots). The principal cells in the model were populated randomly in the horn shaped tridimensional structure with dimensions of 800 μm in the rostral-caudal, 800 μm in the ventral-dorsal, and 400 μm in the medial-lateral directions. (D) fear conditioning protocol for the model. As in the experiments of Repa et al. (2001), the behavioral protocol included habituation, conditioning and extinction phases, with 8, 16 and 20 trials, respectively. (E) Tone responses of LAd cells during the different phases of the behavioral protocol. (E1) Model (black, N=91/800) and experimental (red; N=12/100; from Repa et al., 2001) tone responses of TP cells show a sudden increase during early conditioning, and then drop to habituation levels during late conditioning. (E2) Model (black; N=107/800) and experimental (red; N=12/100) tone responses of LP cells increase gradually with conditioning and persist during extinction. 36
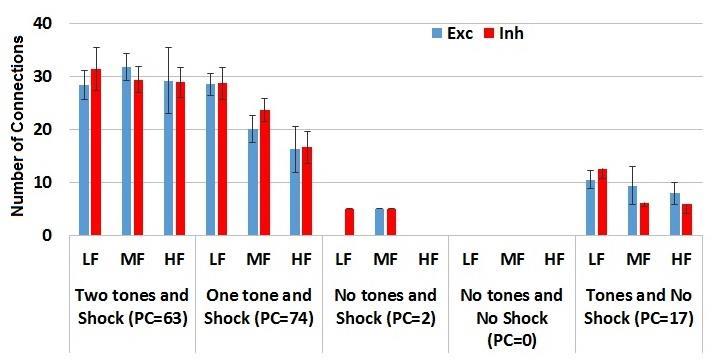
47 Figure 2.2. (A) Direct or indirect shock is important to increase the firing frequency of PNs. Variation of firing frequency of PNs (Hz) with tone and shock afferents received; (B) Increase in tone-pn weights after fear training for different groups of PNs. LF- Low firing; MF- Medium Firing; HF High firing; PC- plastic cell; NPC- non-plastic cell. Figure 2.3. Probability (y-axis) that a PN will be plastic based on the tone and shock afferents it receives. Figure 2.4. Variation of the number of inputs received by PNs from plastic cell inputs for the various groups Figure 2.5. Variation of the number of di-synaptic inhibitory inputs from plastic cell received by PNs in the various groups Figure 2.6. Variation of PN firing rate with the numbers of excitatory and di-synaptic inhibitory inputs received from plastic cells, for the various groups of PNs. Figure 2.7. Differential intrinsic connectivity supports competition. Monosynaptic excitatory (A,C,E) and di-synaptic inhibitory (B,D,F) connections among as well as between plastic and non-plastic cells (x-axis) in the control case. (C-F) Connections of type B-C winner and loser cells in the CREB + (C,D) and CREB (E,F) simulations. Averages ± s.e.m. 37
48 Figures Figure 2.1 Figure

49 Figure 2.3 Figure

50 Figure 2.5 Figure

51 Figure
52 SUPPLEMENTAL FIGURES Figure S1 Figure S2 42
53 CHAPTER 3 Parametric studies related to mechanisms of storage of amygdala fear ABSTRACT Intrinsic excitability of principal cells as well as competitive synaptic interactions between them has been shown to play an important role in the assignment of model lateral amygdala (LA) neurons to a fear memory trace. Here we investigated similar mechanisms were applicable for models with connectivity configuration in the cortex which differs from that in subcortical structures such as LAd. Furthermore, we also considered the effect of model size by considering 1000-, 500- and 100-cell networks, each with biophysical models of principal cells (PN) and interneurons (IN). The new connectivity configuration was able to replicate all findings from the previous model including the formation of two tone responsive populations after fear conditioning. Models with reduced network sizes were equally effective indicating that small networks were also capable of forming memories via synaptic interactions and plasticity. INTRODUCTION The classical fear conditioning paradigm has been extensively used to study how an initially neutral stimulus (conditioned stimulus-cs) elicits conditioned fear responses after pairing with a noxious unconditioned stimulus (US). In rodent fear conditioning 43
54 experiments, the most studied region is the dorsal portion of the lateral amygdala (LAd) which has been established as a critical site of plasticity for the storage of CS-US associations (LeDoux, 2000; reviewed in Pape and Paré, 2010). Fear conditioning using auditory tones (LeDoux, 2000; Maren 2001; Pape and Paré, 2010) increases the CS responsiveness of principal neurons (PNs) in the dorsal subdivision of the rodent lateral amygdala (LAd) (Quirk et al., 1995; Collins and Paré, 2000; Repa et al., 2001; Goosens et al., 2003). PNs in the most dorsal part of LAd display increases in CS responsiveness that last for only a few trials (transiently plastic or TP cells) and the more ventrally located PNs show persistent increases in CS responses, even resisting extinction (Repa et al., 2001). A recent biophysical 1000-cell model of dorsal subdivision of the rodent lateral amygdala (Kim et al., 2013a) successfully replicated the observed (Repa et al., 2001) temporal patterns of increased tone responsiveness displayed by neurons in the dorsal and ventral parts of LAd during Pavlovian fear conditioning. The model included conductance-based models of 800 PNs and 200 INs that reproduced the experimentally observed electroresponsive properties of these cell types, neuromodulatory inputs from brainstem dopaminergic and noradrenergic neurons, and spatially heterogeneous intrinsic connectivity (Pape and Paré, 2010). The network model was used to investigate competitive mechanisms between neurons underlying formation of the fear memory trace in LAd (Han et al., 2007, 2009), and considered primarily intrinsic excitability and intrinsic connections. A later study (Jiang et al., in prep) considered role of extrinsic tone and shock afferents, and neuromodulation effects, and also investigate the role of intrinsic connectivity in more detail. While the previous study considered a connectivity 44
55 configuration specific to LAd (Pape and Paré, 2010), the present study investigates whether competition among PNs might hold for a general cortical connectivity configuration where PNs connect to other PNs over larger distances, but connectivity of INs is limited to only local domains. Would such a connectivity configuration also support competition, and if so, how might the mechanisms involved in recruiting principal cells to the fear memory trace differ. RESULTS We conducted parametric studies using different network model sizes and connectivity to investigate the changes these parameters made to the role of the various cellular mechanisms in the competition to be recruited into the LAd fear memory trace. Specifically, we used a 1000-cell biophysical model of LAd with reduced connectivity, and two reduced order model sizes of 500 and 100 cells. It is noted that, as with previous model, all of the present ones were also tuned to produce these two distinct tone responsive cell populations and their percentages seen in experiments (Repa et al., 2001). All reported values are averages ± s.e.m. expressed as percent change from control and tone responses are computed as spikes per tone within 300 ms of tone onset. We also focus on the four key features differentiate the principal cells: their type (A, B, C), the neuromodulator receptors they have (DA, NE or both), the extrinsic inputs they receive (one tone, two tones, shock), and the numbers of intrinsic excitatory (PN-PN) inhibitory connections (IN-PN) that they receive. 45
56 Mechanisms involved in the formation of plastic cells hold for different connectivity types and network sizes This LA model uses the same type A, type B and type C cells as the previous LA model. And the proportion of different type of cells were also in the same ratio (A:B:C = 5:3:2). And same proportion of external inputs including thalamic tone input, cortical tone input and shock are assigned to the principal cells and interneurons in the dorsal part and ventral part of Lad. The difference between the new model and previous model is the connectivity between principal cells and interneurons. In the previous LA model, the principal cells and interneurons are connected to each other using a connection probability of 2.5%. However, in this new LA model, the principal cells are grouped around an interneuron which connects to them within a certain radius. Each interneuron will connect the principal cells within a radius of 173 m. The principal cells reciprocate these connections with a probability of 25%. The simulation of the new LA1000 model resulted in 177 plastic cells (22% of PN, LP = 109, TP = 68). The tone responsiveness of the LP and TP cells are shown in Fig From the figure we can find that the two tone responsive populations of LP and TP cells exhibited behavior that matched the biological data from Repa et al. (2001), and the total number of plastic cells is also in the range of plastic cells observed experimentally (20% to 25%; Repa et al. (20001), Han et al., (2007, 2009)). After tuning the model to produce the required number of plastic cells, we examined the characteristics of plastic cells and non-plastic cells in this new model. The firing frequency of plastic cells and non-plastic cells and of interneurons of this model are shown in Fig Based on the same criteria as used for the previous LA model (see 46
57 chapter 2), we classified the principal cells into three groups: high firing, medium firing and low firing. As shown in Fig. 3.2, the firing frequency of the plastic cells and nonplastic cells are at about the same level as the firing frequencies of the plastic cells and non-plastic cells in the previous model. Then we investigated how the number of excitatory inputs and number of inhibitory inputs influence the firing frequency of the plastic cells, and found the behavior shown in Fig This figure is similar to the figure in corresponding figure for the previous model (see chapter 2). However, the firing frequency was inversely correlated with the number of inhibitory inputs, rather than being directly correlated to excitatory inputs as in the previous model. Then we checked the firing frequency of interneurons and we found that in the new model, the firing frequency of interneurons was correlated with the number excitatory inputs (fig. 3.5), consistent with the previous model. Competition also occur between the control case and CREB cases of the new LA model We also simulated two CREB cases using the new LAd model. Similar to what we did for the previous LAd model, we made a new CREB +25% model by randomly converting 25% of type A cells to type B and type C cells, and in the new CREB -25% case we randomly picked 25% type B and type C cells and converted them to type A cells. An examination of the CREB case data showed 193 plastic cells for the CREB +25% case and 147 for the CREB -25% case, which indicates that competition also occurred in the LA model with new connectivity configuration. We then checked the excitatory and inhibitory connections between winners and losers. In Fig. 3.4 we found the pattern to be 47
58 similar to that in the previous model (see Fig. 2.7 of Chapter 2) except in the CREB -25% case where winner cells provided more excitatory inputs to loser cells than loser cells provided to winner cells. However, since number of inhibitory inputs play the dominant role, the difference in the number of excitatory input is probably not important. Prediction of the number of plastic cells Based on the external inputs and NM receptors, we again classified the plastic cells into different groups as we did in Chapter 2 and then calculated the probability of PN cells becoming plastic cells (see Fig. 3.6), as with the previous model. Unlike the pattern shown in Fig. 2.7, the external inputs seems to be less important for principal cells to become plastic cells, in this new connectivity configuration. This may be due to the fact that in this new model, reciprocal connections increase the effect of inhibitory inputs and make the number of inhibitory inputs play a more dominant role in determining the plasticity of principal cells. Effect of reduced connectivity on competition We performed preliminary investigations on the role of connectivity in competition by reducing the connectivity between principal cells to a lower number and then to the extreme case of no connectivity between principal cells. The results are shown in Table 1. With reduced connectivity, the number of plastic cells dropped to 145 and with no connectivity they dropped further to 92. We then ran CREB cases with these models and found that there were winner and loser cells, as shown in Table 1. These results are very preliminary and are included for completion here. For each of these reduced connectivity 48
59 configurations, further tuning should be performed to get the number of plastic cells to 177 (as in the control case) and only then should CREB cases be implemented. Although competition is seen presently also, tuning it further may ensure that the size of the memory trace remains relatively constant. These are issues for further investigation. DISCUSSION Memory formation in brains could involve relatively few neurons, such as the case during fear memory formation in LAd which has been shown to involve only about a quarter of the principal cells (2009). So, even though 70% of LAd cells receive afferent tone and shock inputs, only 25% shows increased CS-evoked responses after fear training and this was hypothesized to be due to competition among the PNs (Han et al., 2007). A recent biologically-realistic model of LAd (Kim et al., 2013b) identified a major substrate of this competition as being the differential distribution of excitatory connections between principal cells and the amount of disynaptic inhibition they generate in other projection cells. CONCLUSIONS We investigated the details of how intrinsic excitability of principal cells as well as competitive synaptic interactions between them help some PNs get recruited into the fear memory trace at the expense of others. For this we considered a general connectivity configuration as seen in the cortex, which differs from that in subcortical structures such as LAd. The new connectivity configuration was able to replicate all findings from the previous model including the formation of two tone responsive populations after fear 49
60 conditioning. We also considered the effect of model size by considering 1000-, 500- and 100-cell networks, and found those to be equally effective indicating that small networks were also capable of forming memories via synaptic interactions and plasticity. METHODS We provide a brief overview of the 1000-cell biophysical LAd model used in this study. The reader is referred to our prior study for a complete description (Kim et al., 2013b). Single cell models To reproduce to diversity of spike frequency adaptation seen in principal LA neurons (Faber et al., 2001; Faber et al., 2003; Power et al., 2011), we modeled three types of regular spiking principal cells, with high (type-a), intermediate (type-b), or low (type-c) spike frequency adaptation, due to the differential expression of a Ca 2+ -dependent K + current. LA also contains local GABAergic interneurons that exhibit various firing patterns, even among neurochemically-homogeneous subgroups (Pape and Paré, 2010). However, the majority displays a fast-spiking pattern, which was reproduced in the model. The principal cell model had three compartments representing a soma (diameter µm; length 25 µm), an apical dendrite (diameter 2.5 µm; length 119 µm) on which synapses were placed, and another dendrite (diameter 5 µm; length 400 µm) that helped match passive properties. Values of specific membrane resistance, membrane capacity and cytoplasmic (axial) resistivity were within the ranges reported in previous physiological studies. The current types, equations and densities, as well as the match of 50
61 single cell model and experimental data for responses to various current injections can be found in recent reports (Kim et al., 2013b; Li et al., 2009). The interneuron model had two compartments, a soma (diameter 15 µm; length 15 µm) and a dendrite (diameter 10 µm; length 150 µm). The passive membrane properties were as follows: Rm = 20 KΩ-cm 2, Cm=1.0 µf/cm 2, Ra= 150 Ω-cm, and EL = -70 mv. Similar to the pyramidal cell, the interneuron model could reproduce the non-adapting repetitive firing behavior of fast spiking cells, as observed experimentally. Details including currents used have been reported separately (Kim et al., 2013b). Network structure and connectivity It was estimated that there are 24,000 principal cells in LAd (Tunnanen and Pitkanen, 2000). To keep computation times practical while capturing the complexity of the intra- LAd network, we modeled a scaled down (30:1) version of LAd that included 800 principal cells. The various types were in the following numbers: A-400, B-240, and C Because the proportion of interneurons to principal cells is 20:80, the model included 200 interneurons. Principal cells and interneurons were distributed randomly in a realistic tri-dimensional representation of the horn-shaped LAd (Fig. 1.1A). By comparing the responses of LA cells to local applications of glutamate at various positions with respect to recorded neurons, general principles were inferred for connectivity among principal cells, as well as between local-circuit and principal neurons (Samson and Paré, 2006). 51
62 Activity-dependent synaptic plasticity Model synapses could undergo activity-dependent synaptic plasticity, consistent with the experimental literature. All AMPA synapses in the model were endowed with longterm postsynaptic plasticity except for those delivering shock or background inputs. Also, all GABA synapses had long-term plasticity. This form of plasticity was implemented using a learning rule that uses the concentration of a post-synaptic calcium pool at each modifiable synapse (Shouval et al., 2002a, 2002b). Calcium entered post-synaptic pools at excitatory synapses via NMDA receptors (and AMPA receptors for interneurons) and voltage-gated calcium channels (VGCCs). Similarly, calcium for pools at inhibitory synapses came from post-synaptic intra-cellular stores and VGCCs (Li et al, 2009). For both types of synapses, the synaptic weight decreased when the calcium concentration of the pool was below a lower threshold and increased when it exceeded an upper threshold. All model AMPA and GABA synapses also exhibited short-term presynaptic plasticity, with short-term depression at interneuron to principal cell and principal cell to interneuron connections. Additional details and equations related to the implementation of these plasticity mechanisms can be found in Kim et al. (2013b). Neuromodulator effects Neuromodulators have long been implicated in fear and anxiety, and are known to regulate Pavlovian fear learning and synaptic plasticity in LA (Bissière et al., 2003; Tully et al., 2007). Conditioned aversive stimuli alter the activity of ventral tegmental area and locus coeruleus neurons, which in turn modulate fear and anxiety through their widespread forebrain projections, including to the amygdala. Therefore, the model 52
63 incorporated the effects of dopamine (DA) and norepinephrine (NE) on LAd cells, based on prior experimental reports. Inputs Background synaptic inputs. LA projection neurons have low spontaneous firing rates in control conditions (Gaudreau and Paré, 1996). To reproduce this, Poisson-distributed, random excitatory background inputs were delivered to all model cells, resulting in average spontaneous firing rates of 0.7 Hz for principal cells and 7.2 Hz for interneurons. Tone and shock inputs. Auditory fear conditioning is thought to depend on the convergence of inputs relaying information about the CS (tone) and US (footshock) in LA (LeDoux, 2000; Pape and Paré, 2010; Quirk et al., 1995). In the model, the CS and US inputs were represented by glutamatergic synapses acting via AMPA and NMDA receptors. The frequency of thalamic and cortical tone inputs during habituation was set to 20 Hz. The tone inputs also included noise represented by random Poisson spikes with an average frequency of 2 Hz. The following distribution of inputs was used for the simulations: uniform total tone density throughout LAd with 70% of the LAdd cells receiving thalamic and 35% receiving cortical tone projections, and the opposite for LAdv, i.e., 35% of LAdv cells receiving thalamic and 70% receiving cortical tone projections. The shock inputs were distributed uniformly to 70% of LAd cells. Conditioning protocol used in simulations The schedule of tone and shock inputs in the simulations was based on in vivo studies (Quirk et al., 1995). We scaled down the timing of the auditory fear conditioning protocol 53
64 so that it would be suitable for computational studies. The protocol included three phases (habituation, conditioning and recall), comprised of 8, 16 and 4 trials, respectively. Each trial featured a 0.5 sec tone CS followed by a 3.5 sec gap. Only during conditioning, a shock was administered 100 msec prior to the end of the tone, so that they co-terminated. In light of evidence that fear conditioning leads to plasticity in CS afferent pathways, the frequency of thalamic and cortical tone inputs was increased to 40 Hz after the first and sixth conditioning trials, respectively. Plastic cells Using the definition in Repa et al. (2001), a model PN in Kim et al. (2013) was considered plastic if its CS-elicited firing during any of the four trial conditioning blocks was higher than during the habituation trials using a t-test with a significance threshold of P <0.05. As in Repa et al. (2001), in the second step, a persistence value was calculated for each plastic cell by dividing the increase in CS responses during late conditioning (final eight trials) by that seen during early conditioning (first eight trials), both relative to habituation. Model plastic cells with persistence values of < 0.75 were classified as transiently plastic (TP) cells (Fig. 2.1F), and those with persistence values >0.75 were classified as long-term plastic (LP) cells (Fig. 2.1E). The results in Kim et al. (2013) indicated that the criterion permitted ~200 PNs to be plastic, with only an increase of 1 spike during the conditioning trials. To avoid inclusion of these low firing cells, we required that all plastic cells fire at a frequency > 4Hz during the first extinction block (initial 300 ms of tone). Adding this criterion reduced the number of plastic cells to 156, with virtually no type A cells (~1%) being part of the fear memory trace. 54
65 All model runs were performed using parallel NEURON (Carnevale and Hines, 2006) running on a Beowulf supercluster with a time step of 10 s. The primary model used in this study will be available on the ModelDB public database ( as part of our previous publication (Kim et al., 2013b). ACKNOWLEDGMENTS This research was supported in part by NIMH grants MH to DP and MH to SSN. REFERENCES Ball JM, Hummos AM, Nair SS (2012) Role of sensory input distribution and intrinsic connectivity in lateral amygdala during auditory fear conditioning: A computational study. Neurosci 224: Benito E, Barco A (2010) CREB s control of intrinsic and synaptic plasticity: implications for CREB dependent memory models. Cell 33, Doyere V. et al. (2003) Long-term potentiation in freely moving rats reveals asymmetries in thalamic and cortical inputs to the lateral amygdala. Eur J Neurosci 17: Doyere, V. et al. (2007) Synapse-specific reconsolidation of distinct fear memories in the lateral amygdala. Nat. Neurosci 10: Faber ES, Callister RJ, Sah P (2001) Morphological and electrophysiological properties of principal neurons in the rat lateral amygdala in vitro. J Neurophysiol 85:
66 Faber ES, Sah P (2003) Ca 2+ -activated K + (BK) channel inactivation contributes to spike broadening during repetitive firing in the rat lateral amygdala. J Physiol 552: Goosens KA, Hobin JA, Maren S (2003) Auditory-evoked spike firing in the lateral amygdala and Pavlovian fear conditioning: mnemonic code or fear bias Neuron 40: Han JH, Kushner SA, Yiu AP, Cole CJ, Matynia A, Brown RA, Neve RL, Guzowshi JF, Silva AJ, and Josselyn SA (2007) Neuronal competition and selection during memory formation. Science 316: Han JH, Kushner SA, Yiu AP, Hsiang HL, Buch T, Waisman A, Bontempi B, Neve RL, Frankland PW, Josselyn SA (2009) Selective erasure of a fear memory. Science 323: Izumi T, Boku S, Shinmin W, Inoue T, Konno K, Yamaguchi T, Yoshida T, Matsumoto M, Watanabe M, Koyama T, Yoshioka M (2011) Retrieval of conditioned fear activates the basolateral and intercalated nucleus of amygdala. J. Neurosci Res 89: Kim D, Pare D, Nair SS (2013a) Mechanisms contributing to the induction and storage of Pavlovian fear memories in the lateral amygdala. Learn Mem 20: Kim D, Pare D, Nair SS (2013b) Assignment of lateral amygdala neurons to the fear memory trace depends on competitive synaptic interactions. J Neurosci 33(36): LeDoux, J.E. Emotional circuits in the brain. Annu. Rev. Neurosci. 23, (2000). Letzkus JJ, Wolff SB, Meyer EM, Tovote P, Courtin J, Herry C, Lüthi A (2011) A disinhibitory microcircuit for associative fear learning in the auditory cortex. Nature 480:
67 Li G, Nair S, and Quirk GJ (2009) A biologically realistic network model of acquisition and extinction of conditioned fear associations in lateral amygdala neurons. J Neurophysiol 101: Lin HC, Mao SC, Su CL, Gean PW (2010) Alterations of excitatory transmission in the lateral amygdala during expression and extinction of fear memory. Int J Neuropsychopharmacol 13, Pape HC, Paré D (2010) Plastic synaptic networks of the amygdala for the acquisition, expression, and extinction of conditioned fear. Physiol Rev 90: Power JM, Bocklisch C, Curby P, Sah P (2011) Location and function of the slow afterhyperpolarization channels in the basolateral amygdala. J Neurosci 31: Quirk GJ, Repa JC, LeDoux JE (1995) Fear conditioning enhances short latency auditory responses of lateral amygdala neurons: parallel recordings in the freely behaving rat. Neuron 15: Repa JC, Muller J, Apergis J, Desrochers TM, Zhou Y, LeDoux JE (2001) Two different lateral amygdala cell populations contribute to the initiation and storage of memory. Nat Neurosci 4: Rumpel S, LeDoux J, Zador A, Malinow R (2005) Postsynaptic receptor trafficking underlying a form of associative learning. Science 308: Siberberg G, Markram H (2007) Disynaptic inhibition between neocortical pyramidal cells mediated by Martinotti cells. Neuron 53(5): Tuunanen J, Pitkänen A (2000) Do seizures cause neuronal damage in rat amygdala kindling Epilepsy Res 39:
68 Viosca J, Armentia ML, Jancic D, Barco A (2009) Enhanced CREB-dependent gene expression increases the excitability of neurons in the basal amygdala and primes the consolidation of contextual and cued fear memory. Learn Mem 16: Weinberger NM (2011) The medial geniculate, not the amygdala, as the root of auditory fear conditioning. Hear Res 274: Zhou Y, Won J, Karlsson MG, Zhou M, Rogerson T, Balaji J, Neve R, Poirazi R, and Silva AJ (2009) CREB regulates excitability and the allocation of memory to subsets of neurons in the amygdala. Nat Neurosci 12:
69 FIGURE TITLES Figure 3.1. Tone responsiveness of LP cells (Fig. 3.1A) and TP (Fig. 3.1B) cells of the new LA model during the whole behavioral protocol. Figure 3.2. Comparison of firing frequency (y-axis) of plastic cells and non-plastic cells of the new LA model. Figure 3.3. Relationship between number of excitatory inputs/number of di-synaptic inhibitory inputs and the firing frequency of new plastic cells (y-axis). Figure 3.4. Comparison of excitatory connections and di-synaptic inhibitory inputs between plastic cells and non-plastic cells for control case (winner and losers for CREB cases). Figure 3.5. Interneuron firing frequency (y-axis) based on the different external inputs. Figure 3.6. Probability (y-axis) that a PN will be plastic based on the tone and shock afferents it receives. 59
70 Figure 3.1. Figure

71 Figure 3.3. Figure
72 Figure 3.5. Figure
73 CHAPTER 4 SUMMARY AND FUTURE WORK 4.1 SUMMARY We used a 1000-cell biophysical model to investigate detailed mechanisms involved in the formation of fear memory in a rodent lateral amygdala after classical fear conditioning. Chapter 2. In chapter 2, a 1000-cell biophysical model of LAd was used to shed light on details related to the storage of fear in rodent LAd after Pavlovian fear conditioning, and the main findings in this chapter included the following: (i) the firing rate of PNs was controlled by di-synaptic inhibition from plastic cells; (ii) IN firing frequency correlated with the number of excitatory inputs from plastic cells; (iii) tone and shock afferents play an important role in determining which PNs became plastic (Fig. 2.3) and also showed that competition is restricted to a smaller group of PNs that received one tone and shock, no tone and shock, or one or two tones and no shock; (iv) Neuromodulator receptors and net excitation played an important role in the sub-groups involved in the competition; and (v) inhibition was more important than excitation in the competition. Future work: More detailed studies of the synaptic transmission properties of the 3- compartmental model should be conducted, particularly as it impacts plasticity. This could include a study of the various plasticity models, including the role of dendritic spikes and back propagating action potentials on modulating such plasticity. Also, 63
74 different single cell models need to be considered. For instance, can a single compartmental model or an Izhikevich model reproduce the observed findings. Chapter 3. The findings in this chapter included the following: (i) the form of competition identified in chapter 2 seems to hold for networks with reduced connectivity, as well as those with different sizes. Other findings will be added here later. Future work: Investigate the effect of changing single cell model types. Also, use the detailed 69-compartmental LA single cell model types developed recently, in a small network of 100 cells to determine whether the findings so far can be reproduced. 64
75 APPENDIX Chapter 2 Additional Material I 1. NETWORK CONNECTION CHARACTERISTICS Types: Type A: 400; Type B: 240; Type C: 160 Intrinsic connections Pyr2Pyr: (SD=9.94); Int2Pyr: (SD=8.01); Pyr2Int: (SD=10.06) Extrinsic connections for Pyramidal cells [ =800] 144 cells receive two tone inputs and shock, among them: 68 cells have both DA and NE receptors 33 cells have only DA receptors 27 cells have only NE receptors 16 cells have no neuromodulation receptors 305 cells receive one tone input and shock, among them: 118 cells have both DA and NE receptors 74 cells have only DA receptors & 63 cells have only NE receptors 50 cells have no neuromodulation receptors 111 cells receive shock input but no tone inputs, among them: 40 cells have both DA and NE receptors 33 cells have only DA receptors & 20 cells have only NE receptors 18 cells have no neuromodulation receptors 65
76 190 cells receive at least one tone inputs and no shock, among them: 46 cells have both DA and NE receptors 62 cells have only DA receptors & 39 cells have only NE receptors 43 cells have no neuromodulation receptors 50 cells receive no tone inputs and no shock, among them: 0 cells have both DA and NE receptors 17 cells have only DA receptors & 10 cells have only NE receptors 23 cells have no neuromodulation receptors Extrinsic connections for Interneurons [ =200] 21 cells receive two tone inputs and shock, among them: 19 cells have only NE receptors 2 cells have no neuromodulation receptors 68 cells receive one tone input and shock, among them: 57 cells have only NE receptors 11 cells have no neuromodulation receptors 61 cells receive shock input but no tone inputs, among them: 39 cells have only NE receptors 22 cells have no neuromodulation receptors 31 cells receive at least one tone inputs and no shock, among them: 21 cells have only NE receptors 10 cells have no neuromodulation receptors 19 cells receive no tone inputs and no shock, among them: 66
77 17 cells have only NE receptors 2 cells have no neuromodulation receptors 2. FORMATION OF PLASTIC cells 2.1 TP CELLS Of the 91 TP cells, 83.5% (n=40) showed increases in tone weight and some representative cells were: #439, #391, #388, #376, #374, #339,#295, #274, #270, #267, #249, #247, #245, #231, #225, #180, #178, etc. There are three typical tone weight growth patterns: (1) tone weight goes to the maximum of 20, (2) tone weight goes to an intermediate value of around 10, and (3) no significant change. Case 1: Tone weight exceeds 18 (HAB:0-32;COND:32-96;Gap:96-196; EXT: ) N=23; Some representative cells were: #374, #376, #388, etc. For TP cells that show increase in tone weight, all of the increases occur dramatically starting the shock of the second conditioning trial, where neuromodulation effects kick in. The tone weight increases with each shock till it reaches a maximum value, typically by the end of the fifth (at around 52 seconds into the protocol). The weight then starts to decrease around the tenth conditioning trial (due to increasing inhibition from type 1 interneurons, as we explain below). The weight decreases very slowly during the gap between conditioning and extinction trials. At the beginning of extinction trials, the weight decreases faster initially, and then slows eventually going to a steady value that is higher than the initial weight (probably again due to increasing inhibition from interneurons). 67
78 TP cells, whose tone weight reaches the maximum value (20) were found to have both DA and NE receptors and received shock input. Also, if a TP cell has only one neuromodulation Fig. 1. Typical pattern of TP tone weight increase receptor, its tone weight did not go to the maximum value. An exception was TP cell #159 which had only had DA receptors and shock input but the tone weight reached the maximum value. Case 2: Tone weight exceeds 10% but final weight < 18 (changes were significant for all these cases) N=17; Some representative cells were: #339, #75, #180, #225, etc. TP cell #339 and #75, whose tone weight increased but did not reach the maximum value (20), receives shock input but did not have NE receptors. However, cells #180 and #225, with both DA and NE receptors and shock input did not reach had high inhibition from interneurons (34 and 35, respectively), and so their weights still reached only 14 and 18, respectively. Case 3: Tone weight increase < 10% (we found these to be insignificant changes) N=36; Some representative cells were: #687, #492, #269, #250, #182, #152, etc. 68
79 For TP cells whose finally weight decreased, the patterns are as follows: Figure 2. Two typical weight decrease patterns, both insignificant. Examples of patterns showing continuous decrease of tone weight were #637, #343, #137. Cell #637 and cell #137 had only DA receptors, cell #343 only NE receptor. All these three cells received shock inputs. These three cells show that even when a cell gets shock input, but has only neuromodulation receptor, either DA or NE, its weight may not increase. Other such cells are #s 19, 59, 70, 75, 106, 115. All these cells mentioned above only have DA receptor without NE receptors. TP cells #687, #492, #269, #250, #182, #152, #146, #145, #96, #86, #79, #41, #31 and #1, did not have their tone weights increase because they did not receive shock inputs. Other observations: For TP cells receiving both thalamic and cortical tone inputs, both tone weights increase in a similar manner with significantly lesser increase in the cortical line (average of 103.2% thalamic and 30.5% tone weights; t-test with 5%, and the p-value is 4.87E LP cells Of the 107 LP cells, 83.2% (n=89) showed increases in tone weight similar to TP cells, and some representative cells were: #306, #262, #248, #212, #227, #246, #332, etc. 69
80 Case 1: Tone weight exceeds 18 N=38; Some representative cells were: #306, #262, #248, #212, etc. For an LP cell, if its tone weight increases, it follows the two patterns as TP cells. The difference is that for some LP cells, the level of tone weight during the 100 second gap is the same as the weight during the late conditioning phase, where the tone weight reach the maximum value. The LP cells follow this pattern are cell #361, #360, #353, #345, #331, #324, #318, #315, #309, #306, #262, #248, #212, etc. Figure 3. Weight change pattern of some LP cells. The cells mentioned above all receive shock inputs, and they have at least one type of neuromodulation receptor, DA or NE. Case 2: Tone weight exceeds 10% but final weight < 18 (changes were significant): N=51; Some representative cells were: #227, #246, #332, etc. Figure 4. Intermediate LP cell tone weight change pattern. 70
81 This case happens usually when the LP cells do not get enough neuromodulation receptors, or receive too many inhibitions from interneurons even if they have shock inputs. Case 3: Tone weight increase < 10% (we found these to be insignificant changes) N=17; Some representative cells were: #730, #683, #458, #783, etc. There are three LP cells #711, #730, #683, #554, #553, #299 and #784 that do not show an increases in tone weights maybe because they do not receive shock inputs, have one of the neuromodulation receptors. Another set of LP cells #297, #458, #783, #763, all receive shock inputs and have neuromodulation receptors, but their tone weights still decreased. Other observations: For LP cells receiving both thalamic and cortical tone inputs, both tone weights increase in a similar manner with comparable increases in both lines (average 57% for thalamic and 65.2% for cortical tone weights, with no significant difference) 2.3. Reason for decrease of tone weight in late conditioning for TP cells We explored why the tone weight of TP cells start decreasing beginning the end the tenth conditioning trial, while those of LP cells show very little change. While most of the other characteristics were similar, LP cells received significantly fewer inhibitory connections from interneurons compared to TP cells as shown in the table below (p=1.15e-7, t-test with α = 0.05). 71
82 No. of LP cells (SD) No. of TP cells (SD) Avg. # of monosynaptic (7.59) (7.06) inhibitory connections In section 2.4, we show that interneurons have two kinds of firing patterns, one that keeps increasing across the conditioning trials. For plastic cells that receives significant inhibition from interneurons that increase their firing with conditioning, their tone responses can decrease during the late conditioning phase itself, and these become TP cells. The ones that receive fewer inhibition from such high firing interneurons remain LP cells. 2.4 ANALYSIS OF INTERNEURON FIRING ACROSS TRIALS An analysis of the firing patterns of interneurons revealed two typical patterns as shown in fig. 5 below. We used a regression fit of the firing frequency across trials, and if the R2 of the fit was larger than 25% and the frequency increases, it was classified as type 1 where frequency 72
83 Figure 5. Typical firing pattern of interneurons: (A) firing frequency increases across trials from 20 to 80 Hz; (B) firing frequency changes randomly around a mean of about 20 Hz. continuously increased, and if it was classified as a type 2 interneurons where there was random fluctuation in frequency and no steady increase. Using this classification, we found that 98 interneurons out of 200 were type 1, and the remaining 102 were type 2. We then explored how the types were related to external inputs (thalamic tone, cortical tone or shock), presence of NE neuromodulation receptors, and the excitatory drive it received. This analysis revealed that shock inputs and/or NE receptors were not enough to determine the behavior. This led to the finding that the excitatory drive to an interneuron was important in determining whether it would increase its firing or not. Below is a histogram of the number of excitatory inputs received by interneurons. 73
84 Counts Number of excitatory inputs There are 21 interneurons receiving two tone inputs and shock inputs, among them: 8 < 15 inputs; 9 between 15 and 30, and 4 more than 30 There are 68 interneurons receiving one tone inputs and shock inputs. 16 < 15 inputs; 39 between 15 and 30, and 13 more than 30 There are 61 interneurons receiving no tone inputs and shock inputs. 5 < 15 inputs; 44 between 15 and 30, and 12 more than 30. There are 19 interneurons receiving no tone inputs and no shock inputs. 4 < 15 inputs; 13 between 15 and 30, and 2 more than 30 There are 31 interneurons receiving at least one tone inputs and no shock inputs. 14 < 15 inputs; 12 between 15 and 30, and 5 more than 30 So, we divided the excitatory inputs to interneurons into three groups: High (>15), 74
85 Medium (between 15 and 30) and Low (<15). Then we calculated how the frequency and tone weights of the interneurons varied with excitatory drive see figures below. 75
86 This shows clearly that the higher the # of excitatory inputs, the larger the frequency. The effects on interneuron tone weights did not follow clear trends, but did increase in general with more excitatory inputs CLASSIFICATION OF PLASTIC PYRAMIDAL CELLS Extrinsic connections for Pyramidal cells [ =800] 144 cells (B&C=70, A=74) receive two tone inputs and shock and 63 of these become plastic (B&C=60, A=3). Among these: 68 cells have both DA and NE receptors, 34 of them became plastic cells (B&C=33 (94.3%), A=1 (3.3%); avg exc=22.1 (SD=9.9); avg inh=20.9 (SD=7.9)). For the 34 non-plastic cells (A=32, B&C=2), avg exc=22.3 (9.9); avg inh=20.7 (8) For the 33 plastic B&C cells, the avg exc = 1.8,2.3,0.7, 20.1; avg inh=3.6,14.4,5.1 (4 types for exc: high/medium/low firing/other; 3 types for inh: H/M/L) For the 2 non-plastic B&C cells, the avg exc = 1, 0, 0, avg inh=1, 12, 10 For the plastic A cell, the avg exc=2, 5, 2,28; avg inh=4, 12, 8 76
87 For the 32 non-plastic A cells, the avg exc=1.3,2,0.6,18.2; avg inh= 3.1,12.4,5.5 Difference between plastic B&C cells and non-plastic B&C cells was significant for exc (p<0.03) and significant for inh (p<0.01); Difference between plastic and non-plastic A cells was significant for exc (p<0.04) and not significant for inh (p<0.15). 33 cells have only DA receptors, 11 of them become plastic cells (B&C=10 (66.7%), A=1 (5.6%); avg exc=22.4 (SD=10); avg inh=21.1 (SD=7.8)). For the 22 non-plastic cells (A=17, B&C=5), avg exc=22.4 (SD=2.7); avg inh=21.3 (SD=7.8) For the 10 plastic B&C cells, the avg exc = 2.4, 2.2, 1.7, 19; avg inh=2.5, 8.1, 2.6 For the 5 non-plastic B&C cells, the avg exc = 1.4, 1, 0.2, 17.8; avg inh=3.4, 14, 5.6 For the 1 plastic A cell, the avg exc=5, 2, 1, 29; avg inh=2, 12, 9 For the 17 non-plastic A cells, the avg exc=2.4, 1.9, 0.9,19.1; avg inh= 3.2,15.6, cells have only NE receptors, 14 of them become plastic cells (B&C=13 (100%), A=1 (7.1%); avg exc=22.4 (SD=9.9); avg inh=20.5 (SD=7.9)). For the 13 non-plastic cells (A=13, B&C=0), avg exc=21.8 (SD=6.1); avg inh=20.7 (SD=7.9) For the 13 plastic B&C cells, the avg exc = 2.4, 1.4, 0.2, 17.3; avg inh=2.9, 10.8, 4.2 For the 1 plastic A cell, the avg exc=0, 8, 1, 25; avg inh=3, 11, 1 77
88 For the 13 non-plastic A cells, the avg exc=1.5, 2.4, 0.5,16.6; avg inh= 2.5,11.6, cells have no neuromodulation receptors, 4 of them become plastic cells (B&C=4 (57.1%), A=0 (0%); avg exc=21.5 (SD=9.9); avg inh=19.2 (SD=7.9)). For the 12 non-plastic cells (A = 9, B&C = 3), avg exc=22.2 (SD=9.9); avg inh=20.2 (SD=8) For the 4 plastic B&C cells, the avg exc = 2.3, 1.5, 0.5, 13.5; avg inh=4.8, 6, 1.5 For the 3 non-plastic B&C cells, the avg exc = 1, 1.3, 0.7, 13.3; avg inh=3.3, 13.7, 4 For the 9 non-plastic A cells, the avg exc=1.2, 2.1, 1.3,13.6; avg inh= 3.1,10.1, 2.7 OBSERVATIONS: The average inh connections seem to be uniform (about 20) for all types of cells, and so the difference seems to be due to exc connections; The non-plastic B&C cells received significantly less excitation, compared to the plastic B&C cells (1-3 compared to 22); 305 cells (B&C=155; A=150) receive one tone input and shock and 74 of them become plastic (B&C=74; A=0). Among them: 118 cells have both DA and NE receptors, 48 of them become plastic cells (B&C=48 (78.8%), A=0 (0%)); avg exc=20.5 (SD=9.6); avg inh=19.9 (SD=8.6)). 78
89 For the 70 non-plastic cells (A=57, B&C=13), avg exc=21.7 (SD=8.2); avg inh=20.4 (SD=9.3) For the 48 plastic B&C cells, the avg exc = 1.5, 1.8, 0.6, 16.4; avg inh=2.6, 11.5, 3.4 For the 13 non-plastic B&C cells, the avg exc = 2.5, 1.8, 0.6, 21.5; avg inh=4.1, 14.4, 5.6 For the 57 non-plastic A cells, the avg exc=1.5, 1.7, 0.6,16.7; avg inh= 3.3,11.9, 4.8 Difference between plastic B&C cells and non-plastic B&C cells was significant for inh (p<0.0131); Difference between plastic and non-plastic A cells was significant for inh (p<0.0128). 74 cells have only DA receptors, 5 of them become plastic cells (B&C=5 (14.7%), A=0 (0%)); avg exc=20.9 (SD=7.7); avg inh=20.1 (SD=7.9)). For the 69 nonplastic cells (A = 40, B&C = 29), avg exc=22.1 (SD=8.9); avg inh=21.4 (SD=9) For the 5 plastic B&C cells, the avg exc = 1.6, 1.4, 1.2, 21.6; avg inh=3.4, 9.2, 2.6 For the 29 non-plastic B&C cells, the avg exc = 1.6, 2.1, 0.7, 16.7; avg inh=3.1, 14.1, 4.8 For the 40 non-plastic A cells, the avg exc=2.1, 2.4, 0.7, 20; avg inh= 3.7,13,4.9 Difference between plastic B&C cells and non-plastic B&C cells was significant for inh (p<4.5e-3); Difference between plastic and non-plastic A cells was significant for inh (p<0.0163). 79
90 63 cells have only NE receptors, 21 of them become plastic cells (B&C=21 (61.8%), A=0 (0%)); avg exc=22.2 (SD=9.9); avg inh=19.7 (SD=8.5)). For the 42 non-plastic cells (A = 29, B&C = 13), avg exc=22 (SD=9.4); avg inh=20.7 (SD=10.2) For the 21 plastic B&C cells, the avg exc = 1.9, 3.7, 0.6, 22.3; avg inh=3, 12.8, 4.6 For the 13 non-plastic B&C cells, the avg exc = 1.8, 1.2, 0.15, 16.8; avg inh=4.1, 11.9, 4.8 For the 29 non-plastic A cells, the avg exc=1.7, 1.5, 0.7, 18.7; avg inh= 4, 11.7, 4 50 cells have no neuromodulation receptors, 0 of them become plastic cells (B&C=0 (0%), A=0 (0%)); avg exc=0 (SD=0); avg inh=0 (SD=0)). For the 50 non-plastic cells (A = 24, B&C = 26), avg exc=21.8 (SD=10); avg inh=20.3 (SD=8.9) For the 26 non-plastic B&C cells, the avg exc = 1.2, 1.2, 1.1, 15; avg inh=3.2, 12.3, 5.8 For the 24 non-plastic A cells, the avg exc=2, 1.9, 1, 16.3; avg inh= 3.4,11.8,5.8 OBSERVATIONS: The average inh connections seem to be uniform (about 20) for all types of cells, and so # of exc connections were different for plastic and non-plastic cells; The non-plastic B&C cells received significantly less excitation, compared to the plastic B&C cells (3 compared to 22); No A cell became plastic with only one tone and shock; 80
91 111 cells (B&C=54; A=57) receive shock input but no tone inputs and 2 of them become plastic (B&C=2; A=0). Among these: 40 cells have both DA and NE receptors, 1 of them become plastic cells (B&C=1 (5.6%), A=0 (0%)); avg exc=21 (SD=0); avg inh=17 (SD=0)). For the 39 nonplastic cells (A = 22, B&C = 17), avg exc=22 (SD=9.9); avg inh=20.9 (SD=7.9) For the 1 plastic B&C cells, the avg exc = 1, 1, 4, 15; avg inh=6, 7, 4 For the 17 non-plastic B&C cells, the avg exc = 1.3, 1.6, 1.1, 15.7; avg inh=3.1, 15.2, 5.6 For the 22 non-plastic A cells, the avg exc=1.9, 1.4, 0.5, 16; avg inh= 3.8, 15.6, 5.3 Difference between plastic and non-plastic A cells was significant for inh (p<0.017). 33 cells have only DA receptors, 1 of them become plastic cells (B&C=1 (5.3%), A=0 (0%)); avg exc=29 (SD=0); avg inh=14 (SD=0)). For the 32 non-plastic cells (A = 14, B&C = 18), avg exc=21.7 (SD=2.5); avg inh=20.5 (SD=3.7) For the 1 plastic B&C cells, the avg exc = 2, 2, 2, 23; avg inh=1, 11, 2 For the 18 non-plastic B&C cells, the avg exc = 1.6, 1.6, 0.6, 17.6; avg inh=3.3, 11.2, 4.4 For the 14 non-plastic A cells, the avg exc=1.6, 1.8, 0.36, 15.9; avg inh= 3.2, 14,
92 Difference between plastic and non-plastic A cells was significant for inh (p<0.013). 20 cells have only NE receptors, 0 of them become plastic cells (B&C=0 (0%), A=0 (0%)); avg exc=0 (SD=0); avg inh=0 (SD=0)). For the 20 non-plastic cells (A = 11, B&C = 9), avg exc=22.1 (SD=9.2); avg inh=19.3 (SD=5.2) For the 9 non-plastic B&C cells, the avg exc = 1, 1, 0.44, 14; avg inh=3.6, 10.8, 3.1 For the 11 non-plastic A cells, the avg exc=1.8, 2.6, 0.64, 16.6; avg inh= 2.9, 12, cells have no neuromodulation receptors, 0 of them become plastic cells (B&C=0 (0%), A=0 (0%)); avg exc=0 (SD=0); avg inh=0 (SD=0)). For the 18 non-plastic cells (A = 10, B&C = 8), avg exc=21.9 (SD=5); avg inh=20.5 (SD=4.2) For the 8 non-plastic B&C cells, the avg exc = 2.1, 2.1, 1.1, 20.8; avg inh=3.1, 11.9, 3.6 For the 10 non-plastic A cells, the avg exc=0.7, 1.9, 0.8, 16.4; avg inh=3.3, 14.9, 6.7 OBSERVATIONS: The average inh connections seem to be uniform (about 20) for all types of cells, and so # of exc connections were different for plastic and non-plastic cells; The non-plastic B&C cells received significantly less excitation, 82
93 compared to the plastic B&C cells (3 compared to 22); No A cell became plastic with 0 tone and 0 shock inputs; 190 cells (B&C=95; A=95) receive at least one tone inputs and no shock and 17 (all B&C) of them become plastic cells. Among these: 46 cells have both DA and NE receptors, 3 of them become plastic cells (B&C=3 (13%), A=0 (0%)); avg exc=21.4 (SD=7.2); avg inh=20.3 (SD=8.6)). For the 43 non-plastic cells (A = 23, B&C = 20), avg exc=20.6 (SD=8.1); avg inh=20.9 (SD=9.2) For the 3 plastic B&C cells, the avg exc = 2, 3.3, 0, 21.3; avg inh=2.7, 13.7, 5.7 For the 20 non-plastic B&C cells, the avg exc = 1.8, 2.2, 0.65, 17.4; avg inh=4.2, 12.4, 5 For the 23 non-plastic A cells, the avg exc=1, 1.4, 0.7, 13.3; avg inh= 3.3, 13.7, 4 Difference between plastic and non-plastic A cells was significant for inh (p<0.011). For the non-plastic B&C cells, the avg exc = 1.8, 2.2, 0.7, avg inh = 4.2, 12.3, 5 62 cells have only DA receptors, 4 of them become plastic cells (B&C=4 (12.1%), A=0 (0%)); avg exc=20.9 (SD=7.9); avg inh=19.6 (SD=6.1)). For the 58 nonplastic cells (A = 29, B&C = 29), avg exc=21.2 (SD=6.4); avg inh=21.5 (SD=7.7) For the 4 plastic B&C cells, the avg exc = 1.8, 2.3, 0.8, 12.8; avg inh=2.3, 4.3, 1.8 For the 29 non-plastic B&C cells, the avg exc = 1.5, 2.3, 0.8, 18.3; avg inh=4, 13.3,
94 For the 29 non-plastic A cells, the avg exc=1.4, 2, 0.9, 17.9; avg inh= 3.1, 13.4, 4.6 Difference between plastic and non-plastic B&C cells was significant for inh (p<0.028). Difference between plastic and non-plastic A cells was significant for inh (p<1.8e-4). 39 cells have only NE receptors, 5 of them become plastic cells (B&C=5 (29.4%), A=0 (0%)); avg exc=20.6 (SD=7.2); avg inh=21.1 (SD=6.9)). For the 34 nonplastic cells (A = 22, B&C = 12), avg exc=22.1 (SD=8.9); avg inh=20.8 (SD=5.5) For the 5 plastic B&C cells, the avg exc = 1, 1.2, 1, 12.4; avg inh=3.6, 11.6, 5.2 For the 12 non-plastic B&C cells, the avg exc = 1.3, 1.1, 0.6, 13.9; avg inh=2.9, 11.8, 5 For the 22 non-plastic A cells, the avg exc=1.4, 2.1, 0.68, 16.1; avg inh= 3.1, 10.7, 4 43 cells have no neuromodulation receptors, 5 of them become plastic cells (B&C=5, A=0 (0%)); avg exc=15.6 (SD=8.1); avg inh=6.7 (SD=3.3)). For the 38 non-plastic cells (A = 21, B&C = 17), avg exc=20.1 (SD=4.6); avg inh=20.4 (SD=8) For the 5 plastic B&C cells, the avg exc = 2, 0.2, 0.6, 11.6; avg inh=2.6, 3.4, 1 For the 17 non-plastic B&C cells, the avg exc = 1.3, 1.5, 0.5, 12.5; avg inh=3.1, 11.7,
95 For the 21 non-plastic A cells, the avg exc=2, 1.9, 0.52, 14.2; avg inh= 3.2, 14.6, 6 Difference between plastic and non-plastic B&C cells was significant for inh (p<1.6e-3). Difference between plastic and non-plastic A cells was significant for inh (p<3.7e-4). OBSERVATIONS: The # of exc connections were different for plastic and nonplastic cells; The non-plastic B&C cells received significantly less excitation, compared to the plastic B&C cells (3 compared to 22); No A cell became plastic with only one tone and shock; 50 cells (B &C=26; A=24) receive no tone inputs and no shock and 0 of them become plastic. Among these: 0 cells have both DA and NE receptors, 0 of them become plastic cells (B&C=0 (0%), A=0 (0%)); avg exc=0 (SD=0); avg inh=0 (SD=0)). For the 13 non-plastic cells (A = 6, B&C = 7), avg exc=21.2 (SD=5.6); avg inh=20.3 (SD=7.8) For the 7 non-plastic B&C cells, the avg exc = 1, 0.4, 0.3, 15.1; avg inh=3.4, 9.3, 2.3 For the 6 non-plastic A cells, the avg exc=2.2, 2.3, 0.83, 19.3; avg inh=4.2, 12.7,
96 17 cells have only DA receptors, 0 of them become plastic cells (B&C=0 (0%), A=0 (0%)); avg exc=0 (SD=0); avg inh=0 (SD=0)). For the 17 non-plastic cells (A = 9, B&C = 8), avg exc=21.8 (SD=9.9); avg inh=20.6 (SD=7.9) For the 8 non-plastic B&C cells, the avg exc = 2.9, 1.1, 0.5, 18; avg inh=2, 11.3, 4.3 For the 9 non-plastic A cells, the avg exc=2, 2.1, 1.3, 21; avg inh=3, 15.9, cells have only NE receptors, 0 of them become plastic cells (B&C=0 (0%), A=0 (0%)); avg exc=0 (SD=0); avg inh=0 (SD=0)). For the 10 non-plastic cells (A = 3, B&C = 7), avg exc=23 (SD=10); avg inh=21.1 (SD=7.8) For the 7 non-plastic B&C cells, the avg exc = 2.1, 2.4, 0.9, 21.9; avg inh=2.6, 11, 5.4 For the 3 non-plastic A cells, the avg exc=0.67, 0.67, 1.67, 16.3; avg inh=3.67, 12.3, 4 10 cells have no neuromodulation receptors, 0 of them become plastic cells (B&C=0 (0%), A=0 (0%)); avg exc=0 (SD=0); avg inh=0 (SD=0)). For the 10 non-plastic cells (A = 6, B&C = 4), avg exc=20.3 (SD=9.7); avg inh=20.7 (SD=7.8) For the 4 non-plastic B&C cells, the avg exc = 1.25, 2.5, 0.75, 14; avg inh=2.8, 9.8, 3.5 For the 6 non-plastic A cells, the avg exc=2, 1.8, 0.3, 19.3; avg inh=3.3, 14.5,
97 Extrinsic connections for Interneurons [ =200] 21 cells receive two tone inputs and shock, among them: 19 cells have only NE receptors 2 cells have no neuromodulation receptors 68 cells receive one tone input and shock, among them: 57 cells have only NE receptors 11 cells have no neuromodulation receptors 61 cells receive shock input but no tone inputs, among them: 39 cells have only NE receptors 22 cells have no neuromodulation receptors 31 cells receive at least one tone inputs and no shock, among them: 21 cells have only NE receptors 10 cells have no neuromodulation receptors 19 cells receive no tone inputs and no shock, among them: 17 cells have only NE receptors 2 cells have no neuromodulation receptors 87
98 OBSERVED RULES FOR PLASTIC CELL FORMATION (CONTROL CASE) Let s combine the previous section into this one and make the rules such as.. 1. If a cell is type B&C, receives 2 Tones, Shock, then the probability it will be plastic is 87.2% (60/70). Depending on the neuromodulator receptors the cell has, the probabilities are: - Both DA and NE is 94.3% - DA only is 66.7% - NE only is 100% - None is 57.1% If a cell is type A, receives 2 Tones, Shock, then the probability it will be plastic is 4.3% (3/74). Depending on the neuromodulator receptors the cell has, the probabilities are: - Both DA and NE is 3.3% 88
99 - DA only is 5.6% - NE only is 7.1% - None is 0% 2. If a cell is type B&C, receives 1 Tone, Shock, then the probability it will be plastic is 52.1% (74/155). Depending on the neuromodulator receptors the cell has, the probabilities are: - Both DA and NE is 78.8% - DA only is 14.7% - NE only is 61.8% - None is 0% WE need to check if #EXC and #INH important here for all cases starting 1, 3 and 9, since rest of the cases can not become plastic cells (maybe just for type B&C), so no matter what kind of Ext-Inh is, the probability is always 0. 89
100 If a cell is type A, receives 1 Tone, Shock, then the probability it will be plastic is 0% (0/150). Depending on the neuromodulator receptors the cell has, the probabilities are: - Both DA and NE is 0% - DA only is 0% - NE only is 0% - None is 0% 3. If a cell is type B&C, receives 0 Tone, Shock, then the probability it will be plastic is 4% (2/111). Depending on the neuromodulator receptors the cell has, the probabilities are: - Both DA and NE is 5.6% - DA only is 5.3% - NE only is 0% 90
101 - None is 0% If a cell is type A, receives 0 Tone, Shock, then the probability it will be plastic is 0% (0/57). Depending on the neuromodulator receptors the cell has, the probabilities are: - Both DA and NE is 0% - DA only is 0% - NE only is 0% - None is 0% 4. If a cell is type B&C, receives at least one Tone, No Shock, then the probability it will be plastic is 17.3% (17/95). Depending on the neuromodulator receptors the cell has, the probabilities are: - Both DA and NE is 13% - DA only is 12.1% - NE only is 29.4% - None is 22.7% 91
102 If a cell is type A, receives at least one Tone, No Shock, then the probability it will be plastic is 0%. Depending on the neuromodulator receptors the cell has, the probabilities are: - Both DA and NE is 0% - DA only is 0% - NE only is 0% - None is 0% 5. If a cell is type B&C, receives 0 Tone, No Shock, then the probability it will be plastic is 0% (0/50). Depending on the neuromodulator receptors the cell has, the probabilities are: - Both DA and NE is 0% - DA only is 0% - NE only is 0% - None is 0% 92
103 If a cell is type A, receives 0 Tone, No Shock, then the probability it will be plastic is 0% (0/24). With fewer NM receptors, the probabilities are: - Both DA and NE is 0% - DA only is 0% - NE only is 0% - None is 0% 6. No cell could be plastic (A or B&C) without either tone or shock inputs. 7. A type A cell can be plastic only if it receives two tones AND shock. 93
104 2.6. CONCLUSIONS RELATED TO FORMATION OF PLASTIC CELLS Both TP and LP cells need to have shock inputs for their tone weights to increase, irrespective of the excitatory drive they receive from other cells. Even with shock inputs, TP cells could increase their weight to the maximum value only if they had both DA and NE neuromodulation receptors. However, for LP cells that receives shock input, it s tone weight could reach the maximum value even with only one type of neuromodulation receptors. This implies that although shock input is necessary for weight increase, it is not sufficient. Inhibition has a significant role in deciding whether a plastic cell will be TP or LP. It appears that if a plastic cell receives more than 18 monosynaptic inhibition from. From the observations in section 1.5, the more tone inputs a pyramidal cell receives, the higher possibility it is to become a plastic cell. Neuromodulation receptors can significantly increase the possibility of cells becoming plastic cells. 94
105 3.0 COMPETITION-1 What determines which cells become plastic in the control case? Repa s Criterion: If spikes per tone of any conditioning block (spikes per tone of each block is the average spikes per tone of four continuous conditioning trials) is higher than the spikes per tone of the habituation block (the spikes per tone of the habituation block is the average of spikes per tone of the last six habituation trials) using the significant level 5%, then the cell will be a plastic cell. For plastic cells, using the ratio of mean spikes per tone of the last 8 conditioning trials minus the spikes per tone of the habituation block to mean spikes per tone of the first 8 conditioning trials minus the spikes per tone of the habituation block to further define TP and LP cells. If this ratio is larger than 0.75, then it is classified as an LP cell, else as a TP cell. Revised criterion for plastic cells: We found that this criterion enabled numerous low-firing cells to be classified as plastic due to two reasons. One is that LA cells have a very low spontaneous firing rate, e.g., 0.22 Hz and so fired very little. The second is that the Repa criterion was easy to satisfy for such low-firing cells because even a change of one spike during conditioning compared to habituation would be enough. So, the plastic cells by this definition included cells with very low to others with potentiated tone weights that reached very high firing rates. Model runs with different random seeds for delays showed that high firing plastic cells remained the same across different runs, but the low-firing ones did not, implying that the Repa criterion was not suitable for low-firing cells. We propose a revised criterion for the definition of plastic cells. We noticed that the highest spikes per tone occurred during the first extinction block, for both TP and LP cells. So, in addition to the original criteria, we set an additional criterion that plastic cells should also have a frequency 95
106 of 4Hz or above during the first extinction block. This frequency is calculated by using spikes during the first 300ms of tone onset of each trial. Using the revised criterion, we found that 95% of plastic cells received shock input, while only 65% of the non-plastic cells received shocks. The plastic cells that were dropped by the 4Hz threshold, together with the non-plastic cells came up to 66 %, which also proves that the plastic cells that dropped off were not truly plastic cells. Then t-test is applied using 5% significance level to these two samples and the results show the mean values of the percentage of receiving shock inputs were significantly different with p-value equals to 1.33E-9, indicating that receiving shock input is important for a pyramidal cell to become plastic. A small fraction of pyramidal cells (<15.1%, not including type A cells) received shock inputs but were still non-plastic, and a similar fraction (<3.6%) did not receive shock inputs but were plastic. We investigated why using representative cells. For instance, cell #730 was an LP cell with the firing frequency of the first extinction block equals to 21.7Hz even though it did not receive shock, and did not have any neuromodulation receptors. Three reasons explained this behavior: (i) it was a highly excitatory type C cell, (ii) it received tone inputs from both thalamic and cortical pathways, and (ii) it received 14 excitatory inputs and only 5 monosynaptic inhibitory inputs. As another similar example, cell #784 did not receive shock, but was also type C with DA receptors, received two tone inputs and had many more excitatory than inhibitory inputs (16 excitatory and only 4 inhibitory connections). On the other hand, cell #2 was a type B cell, that received thalamic tone input and shock inputs, and had NE receptors, but was non-plastic. The reason was that it received 25 monosynaptic inhibitory inputs compared to only 3 excitatory inputs from non-plastic cells. 96
107 Another interesting finding is that there were not type A plastic cells with the revised criterion, because type A cells since such cells are highly adaptive and so fire considerably less. What is the behavior of type A cells? Even with two tones input and shock and less inhibition, type A cells could not become plastic. As an example, Cell #132 was type A, had two tones and shock, both DA and NE receptors, but had 31 inhibitory inputs compared to only 18 excitatory inputs. This indicates that cell type was an important indicator of whether a cell would become plastic. 97
 and when they are decreased by 25%")
108 3.0 COMPETITION-2: CREB CASES How do winners and losers differ? We used two cases to investigate competition, when the excitable cells are increased by 25% (CREB +25%, where 100 type A cells are converted to type B and C cells) and when they are decreased by 25% (CREB -25% where 25% of cells of both types B and C are converted to type A). For this analysis we used the revised Repa criterion. Additionally, we considered the number of cells that fired in a band between 3 and 5 Hz as indicators of variation in the # of plastic cells. This is because we found that randomness in the input and intrinsic connections could change the firing of the cells within that band. So, if we have M plastic cells which fire more than 4Hz during the first extinction block and N plastic cells that fire within the bounds of 3 and 5 Hz, then we report the number of plastic cells as M ± N. Control case vs. CREB +25% case. For the control case we get 156 plastic cells, and for this case, the number of plastic cells within the bounds is 24, giving the estimate as 156±24. For the CREB +25% case, this estimate was 181± 28. Since 100 additional plastic cells were created from type A cells in the CREB+25% case, one could expect a total of 256 plastic cells. However, competition limits them to 181 (Fig. 6). This means that some of the new plastic cells ( winners ) win the competition and make some of the previously plastic cells non-plastic. Figure 6. The number of plastic cells for control case, CREB +25% case and estimated number of plastic cells. 98
109 How does competition work between the control case and the CREB +25% case? Competition Motif 1: Consider the cells and connections shown in Fig. 7. Assume P1 and P2 are non-plastic cells of type A, and P3 is a plastic cell. If P1 and P2 are converted to type C cells by CREB manipulation, then they would fire much more than previously, making the interneuron fire much more (including possibly an increase in its tone weight), and thus inhibit P3 more strongly and make it non-plastic. From the CREB+25% case, there were 21 losers, i.e., plastic cells that became non-plastic cells after the conversion. Figure 7. A motif related to competition. P1, P2 and P3 represent three pyramidal cells and the circle represents an interneuron. Competition Motif 2: A total of 46 formerly non-plastic cells became plastic after the CREB +25% manipulation. Of these 19 became so without changing their cell type, and this was because their afferents were formerly A type and became B or C type and so increased input excitation. The remaining 27 new plastic cells were originally type A cells and the conversion to B or C made them more excitable. What kinds of cells win/lose the competition? 99
110 We found that most of the plastic cells which survived in the competition were high firing ones that were far from the plastic/non-plastic cell boundary of 4 Hz. If the cells were close to the boundary, but did not have the connections in Fig. 7, they survived the competition. The total number of plastic cells survived in the CREB +25% case is 135, and only 2 of them are type A plastic cells. In addition, all the cells survived didn t change their cell types in the CREB case, which means they not close to the plastic/non-plastic boundary. For the two type A plastic cells which survived, they all have three external inputs and at least one kind of neuromodulation receptors, which means they are some strong plastic cells, which are not easy to degrade to non-plastic cells. For the loser cells, the ones that were formerly plastic but became non-plastic, most of them (12 out of 21) were close to the plastic/non-plastic cell boundary, which implied that even a small increase in inhibition was enough to change their classification to non-plastic. Except the 12 cells which are close to the plastic/non-plastic cell boundary, the rest 9 cells are dropped off because their spiking frequencies of the first extinction block are less than 4Hz. The increased inhibition from interneurons although doesn t make them non-plastic cells, their spiking frequencies are decreased. Control case vs. CREB -25% case For the CREB -25% case, a random 25% of type B cells and type C cells were converted to type A cells. In this case, we get 125±33 plastic cells. Since 100 plastic cells were converted to type A cells in the CREB-25% case, one could 100
111 expect a total of 50 plastic cells. However, competition limits this decrease to 125 (Fig. 8). Figure 8. The number of plastic cells for control case, CREB -25% case and estimated number of plastic cells. How does competition work between the control case and the CREB -25% case? Competition Motif 1-B: For the CREB- 25% case, consider the motif described earlier (Fig. 7). For this case, assume that P1 and P2 are high firing plastic cells providing strong input to the interneuron, making P3 is a non-plastic cell. Now, if P1 and P2 are converted to type A cells by the CREB manipulation, they would fire much less than previously, making the interneuron fire much less, enabling P3 to become plastic due to lessened inhibition. Our model runs in this case, revealed 21 new plastic cells that followed this motif. Competition Motif 2-B: Due to the decrease in highly excitable cells, the excitation received by pyramidal cells decreased. Among 52 of the loser cells in the CREB -25% case, 14 were originally plastic, and 6 of these 14 cells were close to the plastic/non-plastic cell boundary. The rest 8 cells are dropped off because their spike frequencies of the first extinction block are decreasd to less than 4Hz. What kinds of cells win/lose the competition? 101
112 In the CREB -25% case, the reason why the number of plastic cells decreased (from 156 to 125) is larger than the number of plastic cells increased in the CREB +25% case (from 156 to 181) is that after some type B cells and type C cells becoming type A cells, it s very difficult to them to become plastic cell, because of the high adaptation of type A cells, which also means if a type C cell or a type B cell is converted to a type A cell in the CREB -25% case, it will lose the competition. In the CREB -25% case, totally there are 104 plastic cells which survived the competition, and 3 of them of are type A plastic cells. These three plastic cells all receive three external inputs and have at least one kind of neuromoduation receptors. Two of these three type A cells also survived in the CREB +25% case. For all the plastic cells which survived, all of them did not change their cell types. For some originally non-plastic cells in the control case, if they are close to the plastic cells and non-plastic cell boundary, the decrease of inhibition will give them a chance to become plastic cells. In the CREB -25% case, the results show there are 21 such cells. For these non-plastic which are not close to the boundary, it is still very difficult for them to become plastic cells even the inhibition is decreased. There are 52 cells lost the competition and 14 of them lost the competition because the decreased excitatory inputs. 4.1 MOTIFS FOR COMPETITION 2 For the control case, cells are classified as follows, based on the spike frequency in the first block of extinction (4 trials): Low Firing Group if frequency < 20 Hz (n=66); Medium Firing 102
113 Group if frequency >20Hz but < 40Hz (n=65); High Firing Group if frequency >40Hz (n=25). Figure 8 is the histogram of the firing frequency of the first extinction block. Figure 8. Histogram of the firing frequency of the first extinction block for the control case. Control case: 66 high firing cells (42.3%), 65 medium firing cells (41.7%), and 25 low firing cells (16%). Next, we classify pyramidal cells as survivors, losers and winners based on their firing rates after the CREB manipulations. Cells that continue to be plastic after the manipulations are classified as survivors (note that they can switch between TP and LP), cells that were nonplastic and became plastic are termed winners and cells that were plastic and became nonplastic are termed losers. Control v/s CREB +25% Survivors 86.5% (135 of 156) of the control group cells were survivors in the CREB +25% case. 103
114 Among these there were: 25 (18.5%) in the high fire group in control (TP=3 LP=22). Of these, 0 were TP and got converted to LP, and 2 were LP and got converted to TP. 65 (48.1%) in the medium fire group in control (TP=19 LP=46). Of these, 1 were TP and got converted to LP, and 5 were LP and got converted to TP. 45 (33.3%) in the low fire group in control (TP=10 LP=35). Of these, 2 were TP and got converted to LP, and 5 were LP and got converted to TP. The reason why some LP cells were converted to TP cells is because in the CREB +25% case, the inhibition from some interneurons was increased, if an LP cell gets more inhibition during the late conditioning phase, it has the possibility to become a TP cell. Another reason may be that increased excitatory inputs increased the firing frequency of the habituation phase, which make the p-value less than So these LP cells will become TP cells. For some TP cells were converted to LP cells, the reason is that increased inhibition decreased the firing frequency of habituation phase, which made some TP cells become LP cells. Loser cells 13.5% (21 of 156) of the control group cells (plastic) became losers in the CREB +25% case. Among these there were: 0 (0%) in the high fire group in control (TP=0 LP=0). 0 (0%) in the medium fire group (TP=0 LP=0). 21 in the low fire group (TP=14 LP=7). Winner cells 104
115 7.1% (46 of 644) of the non-plastic cells from the control group cells were winners in the CREB +25% case. Among these there were: 0 (0%) in the high fire group in control. 0 (0%) in the medium fire group. 46 (100%) in the low fire group. Control v/s CREB -25% Survivors 66.7% (104 of 156) of the control group cells were survivors in the CREB -25% case. Among these there were: 17 (16.3%) in the high fire group in control (TP=3 LP=14). Of these, 0 were TP and got converted to LP, and 0 were LP and got converted to TP. 51 (49%) in the medium fire group in control (TP=18 LP=33). Of these, 1 were TP and got converted to LP, and 1 were LP and got converted to TP. 36 (34.6%) in the low fire group in control (TP=11 LP=25). Of these, 4 were TP and got converted to LP, and 6 were LP and got converted to TP. The reason why some LP cells were converted to TP cells is that decreased inhibition increased the firing frequency of the habituation phase, which made the p-value less than 0.75, so some LP cells will become TP cells. Also, decreased excitatory inputs in the habituation phase can also make LP cells to TP cells. The reason why some TP cells become LP cells is that decreased excitatory inputs to interneuron decreased the 105
116 inhibition to pyramidal cells in the late conditioning phase, which can makes TP cells become LP cells. Loser cells 33.3% (52 of 156) of the control group cells (plastic) became losers in the CREB -25% case. Among these there were: 8 (15.4%) in the high fire group in control (TP=0 LP=8). 14 (26.9%) in the medium fire group (TP=1 LP=13). 30 (57.7%)in the low fire group (TP=13 LP=17). Winner cells 3.3% (21 of 644) of the non-plastic control group cells were winners in the CREB -25% case. Among these there were: 0 (0%) in the high fire group in control. 0 (0%) in the medium fire group. 21 (100%) in the low fire group. (In the CREB -25% case, all of the winner cells belong to the low fire group maybe due to the sample size is not large enough.) 106
117 From the observation mentioned above, we can find the loser cells always belong to the low fire group for both CREB +25% case and CREB -25% case. Also, for the high fire group, there are always more LP cells than TP cells. Competition Analysis of CREB +25% Winners from non-plastic type B&C cells There are 19 non-plastic type B&C cells becoming plastic cells in the competition without changing their cell types. The cell IDs for these cells are #41, #215, #329, #536, #554, etc. For these cells, 1 cell has two tone and shock, with DA receptors. 8 cells have one tone input and shock input, all of them have neuromodulation receptors. 1 cell has no tone inputs and shock inputs, and it has both DA and NE receptors. Also there is one cell (#41) has two tone inputs but no shock input, and it also doesn t have any neuromodulation receptors. The rest of the cells have at least one tone inputs and no shock inputs. The reason for these cells becoming plastic cells is that they receive stronger excitatory inputs after the cells which give them excitatory inputs becoming type B&C cells Winners from converted type A cells There are 27 cells new plastic cells from the converted type A cells. The cell IDs for these cells are #10, #32, #490, #118, #168, etc. 107
118 All of the 27 originally type A cells receive shock inputs, in addition, all of them receive at least one tone inputs and have at least one kind of neuromodulation receptors. This means this group type A cells originally they receive very strong external inputs, and if they are type B&C cells, they are potential to become plastic cells. In the CREB 25%+ case, after they are converted to type B&C cells, they become plastic cells. Non-plastic cells in converted type A cells Among 100 converted type A cells, 73 of them still remain non-plastic cells. The cell IDs for these cells include #277, #326, #477, #517, #602, #690, etc. For this group of cells, only 57.5% of them receive shock input, so compared to the previous group (winners from converted type A cells, all of them receive shock inputs), this group of type A cells are less potential to become plastic cells even they get conversion to type B&C cells. 11 of 73 originally type A cells don t have any external inputs. 17 of 73 cells receive only tone input and no shock input. So from our previous findings no matter what type of these cells are, they hardly can become plastic cells. The interesting finding is that 4 of 73 receive two tone inputs, 2 of them still remain nonplastic cells due to they have no neuromodulation receptors and much less excitatory inputs compared to the number of inhibitory inputs. (#83: 15 exc and 25 inh; #313: 1 exc and 3 inh). The rest 2 cells remain non-plastic cells just due to less excitatory inputs than inhibitory inputs (#547: 27 exc and 30 inh; #641: 23 exc and 25 inh). 108
119 Non-plastic cells always There are 644 cells belonging to this group. These cells remain non-plastic cells both in the control case and CREB +25% case. The cell IDs for these cells are: 28, #53, #73, #105,#163, etc. Among these cells, 297 are type A cells, so even they get strong external inputs it is still difficult for them to become plastic cells. The rest of them are type B&C cells, 27 of them receive two tone inputs and shock input. Except 5 of them have no neuromodulation receptors, the rest of them are non-plastic cells due to strong inhibitory inputs. Some of them have more excitatory inputs than inhibitory inputs, but due to the excitatory inputs come from weak cells and inhibitory inputs come from strong cells, they still remain non-plastic cells. Plastic cells always (survivors) There are 135 cells always remaining plastic cells both in the control case and CREB 25%+ case. The cell IDs for these cells include: #590, #575, #391, #295, #125, #131, etc. For these cells, 94.8% of them have shock inputs. 70 of them receive at least one tone inputs and shock input. And there is no cells receive no external inputs. The weakest cell among the survivors is cell #68, it has no tone inputs and only shock input, with DA receptors. But due to 29 excitatory inputs compared to 14 inhibitory inputs, it is still a plastic cell. 109
120 Additional Material II Role of intra-amygdalar plasticity in cellular competition (Repa criteria) The control case for competition studies had the following distribution of principal cell types: 400 type A, 240 type B, and 160 type C (see methods). Fig. 2A shows the spike histograms for a random set each of 100 plastic and non-plastic cells before and after conditioning for the control case, providing a snap shot of the competition. It shows how plasticity accrued during conditioning increases the tone responses of plastic cells, and how plastic cell might then be more effective in suppressing non-plastic cells via disynaptic inhibition involving interneurons. We investigated the role of intra-amygdalar plasticity in this competition, via a series of model inactivation experiments. The tone responses resulting from these inactivation experiments are shown in Fig. 2B, and the specifics related cell numbers are provided below. Since type A plastic cells were very few, we consider plastic cells of types B and C only in the analysis below. These inactivation experiments also led to the finding that the inactivation manipulations led to another form of competition among the PNs. This is because inactivation of plasticity did not change the connections themselves, but alters their efficacy. This change in efficacy affected the firing rates of both PNs and INs. We found three factors affected whether a PN would be a winner or loser: change in efficacy of the IN-PN synapses, and changes in firing rates of INs and PNs connected to it. The details are provided in the specific cases below. We using insights from a regression model (unpublished work) to investigate this further. The regression model revealed thalamic tone, shock and the presence of NE receptor to be significant (p<0.01) attributes of plastic cells. We used 1 or 0 to indicate the presence or absence of each of these three attributes, 110
121 and summed them on a cell by cell basis (range of 0 to 3) for the winners and losers for each category reported below. Inactivation of all intra-amygdalar plasticity. We first disabled all intra-amygdalar plasticity, i.e., in PN-PN, IN-PN, and PN-IN synapses, to study their combined effect. Instead of remaining constant at 25% (N=198/800), inactivation of all intra-amygdalar plasticity caused the size of the number of plastic cells to increase by 33% (to N=264). Further analysis revealed that while 52% (4% A, 66.4%B, and 61.4%C) of the principal cells that received both tone and shock became plastic in the control case, a much larger number, 78.4% (9% A, 80%B, and 77.3%C), became plastic when intra-amygdalar plasticity was disabled, and their tone responses were also higher (Table1; Fig.2B1). Unexpectedly, we found that inactivation caused a larger decrease in IN-PN weights for losers than winners, compared to the control case (112±5% v/s 152±12%; p<0.0008). Also, the firing frequency of INs connected to loser PNs increased more than those of the INs connected to winner PNs (22.46±1% v/s 20±0.6%; p<0.07). Similarly, inactivation caused a larger decrease in PN-PN weights for losers than winners, compared to the control case (55.16±15% v/s -4.16±1%; p<8.2e-10). Also, the firing frequencies of PNs connected to loser PNs decreased less, unexpectedly, than those of PNs connected to winners (86±10% v/s 97±6%; p<0.39). We performed a more detailed analysis of their characteristics using insights from a regression model (described later) which revealed thalamic tone, shock and the presence of NE receptor to be significant (p<0.01) attributes of plastic cells. We used 1 or 0 to indicate the presence or absence of each of these three attributes, and summed them on a cell by cell basis (range of 0 to 3) for the winners and 111
122 losers. Then we found that this summed value was slightly greater for winner cells compared to the losers(1.64±0.07 v/s 1.51±0.12, not significant). Feng do revise and update appropriately. This implicates intra-amygdalar plasticity as the mechanism limiting the number of plastic cells to 25%. Then we asked what the contribution of plasticity in the individual synapses might be towards this overall effect. To investigate this, we disabled plasticity individually in the connections. Inactivation of only PN-PN plasticity. This resulted in a 12% decrease in both the number of plastic cells (from 198 to 178), and their tone responses also decreased (Fig. 2B1). Thus, plasticity in the synapses between principal cells increases excitation to generate additional principal cells. The competition resulting from inactivation of this plasticity resulted in 36 cells losing their plasticity (losers; 16A, 20B&C) and 56 of the former nonplastic cells becoming plastic (winners: 9A, 47B&C). We found that inactivation caused a larger decrease in IN-PN weights for winners than losers, compared to the control case (1.6±0.6% v/s -0.5±0.5%; p<0.05). Also, the increase in firing frequency of INs connected to loser PNs was comparable to those of the INs connected to winner PNs (- 0.52±0.46% v/s 0.1±0.32%; p<0.29). Similarly, inactivation caused a decrease in PN-PN weights for winners but showed an increase for winners, compared to the control case (- 1.36±2.58% v/s 39.84±10%; p<8.5e-3). Also, the decrease in firing frequencies of PNs connected to loser PNs was comparable to those of PNs connected to winners (1.6±3.5% v/s 2.3±1.7%; p<xx). The summed binary values for the presence of thalamic tone, shock and NE receptor was unexpectedly less for winner cells compared to the loser cells (1.54±0.09 v/s 1.89±0.12, p<0.05). 112
123 Inactivation of only IN-PN plasticity. This caused a 33.8% increase in the number of plastic cells (to N=265/800). The competition resulting from inactivation of IN-PN plasticity resulted in 20 cells losing their plasticity (losers; 10A, 10B&C) and 87 of the former non-plastic cells becoming plastic (winners; 24A, 63B&C). We found that inactivation caused a larger decrease in IN-PN weights for winners than losers, compared to the control case (112±7 v/s 84±21; p<0.13). The increase in firing frequency of INs connected to loser PNs was comparable to those of the INs connected to winner PNs (41±3% v/s 41±1%; p<0.94). Similarly, inactivation caused comparable increases in PN- PN weights for losers and winners, compared to the control case (1.9±1.6% v/s 4.5±3.1%; p<0.75). Also, the firing frequencies of PNs connected to loser PNs decreased less than those of PNs connected to winners (67±15% v/s 97±7%; p<xx). We also found that the aforementioned summed value of three attributes was significantly greater for winner cells compared to the loser cells (1.75±0.08 v/s 1.3±0.19, p<0.05). Inactivation of only PN-IN plasticity. This resulted in a 2% increase in the number of plastic cells (to N=202/800). The competition resulting from inactivation of PN-IN plasticity resulted in 34 cells losing their plasticity (losers: 11A, 23B&C) and 38 of the former non-plastic cells becoming plastic (winners: 7A, 31B&C). We found that inactivation caused a comparable decrease in IN-PN weights for winners and losers, compared to the control case (25±9% v/s 29±13%; p<0.8). Also, the firing frequency of INs connected to loser PNs decreased less than those of the INs connected to winner PNs (5.8±1.2% v/s 5.9±0.95%; p<0.95). Similarly, inactivation caused a comparable increase 113
124 in PN-PN weights for losers and winners, compared to the control case (1.4±2.3% v/s 0.4±0.7%; p<0.66). Also, the increase in firing frequencies of PNs connected to loser PNs was comparable to that of PNs connected to winners (17±5% v/s 15±3%; p<0.7). We also found that the aforementioned summed value of three attributes was slightly greater for winner cells compared to the loser cells (1.55±0.12 v/s 1.53±0.14, not significant). Inactivation of IN-PN and PN-IN, but not PN-PN plasticity. With only PN-PN plasticity, there was a 45.5% increase in the number of plastic cells (to N=288). All type B and C cells that received tone and shock became plastic, an increase of 90 from the control case, and 82 such cells became plastic even when they received only one of these afferents. This shows that plasticity in the disynaptic inhibitory pathway is necessary for competition. The competition resulting from inactivation of PN-IN&IN-PN plasticity resulted in 23 cells losing their plasticity (losers: 10A, 13B&C) and 113 of the former non-plastic cells becoming plastic (23A, 90B&C). We found that inactivation caused a larger decrease in IN-PN weights for winners than losers, compared to the control case (115±6% v/s 84±16%; p<0.06). Also, the firing frequency of INs connected to loser PNs increased more than those of the INs connected to winner PNs (23±2% v/s 21±0.6%; p<0.38). Similarly, inactivation caused a comparable increase in PN-PN weights for losers and winners, compared to the control case (1.6±1% v/s 5.6±2.7; p<0.58). Also, the firing frequencies of PNs connected to loser PNs increased less than those of PNs connected to winners (99±27% v/s 100±6%; p<0.1). The summed binary values for the presence of thalamic tone, shock and NE receptor was significantly greater for winner cells compared to the loser cells (1.65±0.07 v/s 1.34±0.18, p<0.05). 114
125 Role of extrinsic afferents and neuromodulation These model experiments also led to the finding that the inactivation of intra-amygdalar plasticity components lead to another form of competition among the PNs. This is because inactivation of plasticity did not change the connections themselves, but altered their efficacy. This change in efficacy affected the firing rates of both PNs and INs. Based on our earlier findings that IN-PN weights were the important ones in altering PN characteristics, we measured the increase in IN-PN weights in the control case for both winner and loser PNs, and found that winner PNs had a larger average decrease in IN-PN weight compared to loser PNs. We also found that thalamic tone, shock and NE receptor distribution plays an important role in determining the cell s plasticity in competition. So, this suggests that IN-PN plasticity is the dominant intra-amygdalar form of plasticity. Moreover, the analysis suggests that the competition among PNs resulting from the inactivation of such intrinsic plasticity is affected primarily by the decrease in IN-PN plasticity compared to the control case, to a particular PN. The model also suggested the winner PNs had significantly more of the extrinsic afferents and had NE receptors, compared to loser PNs. Plasticity in synapses of representative cells To investigate the role of plasticity in competition at the individual cell level, we considered the change in synaptic weights of ten representative plastic and non-plastic cells of types B and C. Since they were rare we omitted type A plastic cells (<1%) from this particular analysis. 115
126 For this group of representative cells, each plastic cell received 6.3±1.3 mono-synaptic excitatory connection from other plastic cells, while each non-plastic cell received only 4.2±1.5 connections from plastic cells. Also, each interneuron typically received 5.13±3 connections from plastic cells. Then we considered all di-synaptic inhibitory connections from plastic cells to cells of each of the two groups. As cited earlier, plastic cells had significantly fewer connections of this type, as compared to non-plastic cells (115.3±7.9 v/s 123±7.3). Since the excitability of a cell depends on these connections as well as on plasticity in these connections, we next investigated the role of plasticity. For each group we investigated the effect of fear conditioning on the various synapses, on a per cell basis (average ±s.e.m.). This analysis revealed that tone-pn synapses increased by 100±35% for a plastic cell and depressed by -2.6±0.4% for a non-plastic cell. Also, PN-PN synapses from all plastic cells to a plastic cell increased by 16±15% while such synapses from plastic cells to a non-plastic cell depressed by -6±2%. Plasticity in IN-PN connections was considered by taking all connections from interneurons to the specific principal cell. Interestingly, IN-PN plasticity was found to be similar for both plastic and non-plastic post-synaptic cell types: plasticity in IN-PN connections to nonplastic cells increased by 103±17% and they increased by 163±29% in such connections to plastic cells. For completion, we also considered plasticity in the PN-IN DISCUSSION Distinct roles of the different components of intra-amygdalar plasticity All intra-amygdalar synapses, PN-PN, PN-IN, and IN-PN participated in the competition in different ways as reported in Results. Even though 56% of all principal 116
127 cells received both tone and shock inputs, intra-amygdalar plasticity limited the number of plastic cells to 25% of the total. This was demonstrated by inactivating intraamygdalar plasticity which caused almost all type B and C cells receiving tone and shock to become plastic (143/222). It is noted that type A cells played a marginal role in the competition (Table 1). PN-PN plasticity helped cells band together and make other cells plastic in the absence of plasticity in the disynaptic inhibitory pathways (PN-IN and IN- PN plasticity disabled) since this increased the number of plastic cells to 288 (a 46% increase), even recruiting 3 cells that did not receive both tone and shock. However, when only PN-PN plasticity was disabled, inhibitory plasticity reduced the number of plastic cells by 10% from the control case, indicating that inhibitory plasticity effectively counters plasticity in the afferent tone-pn synapses. But would PN-PN plasticity or inhibitory plasticity by themselves be enough for competition? To address this, we performed two additional model runs. In one we retained only inhibitory plasticity, i.e., inactivated PN-PN plasticity alone (resulting in N=178 plastic cells), and then simulated the 25% CREB down-regulation experiment. This showed that the number of plastic cells was not maintained, and dropped from 178 to 63, indicating that PN-PN plasticity was important to stabilize the size of the memory trace. In the second model run we simulated the No IN-PN & PN-IN plasticity case (i.e., only PN-PN plasticity) and found that the number of plastic cells were again not maintained, dropping from 288 to 208. These two model experiments showed that plasticity in excitatory connections between principal cells and disynaptic inhibitory plasticity from plastic cells were both necessary for stabilizing the size of the fear memory trace, i.e., competition thus requires both forms of intra-amygdalar plasticity. Considering the components of inhibitory plasticity, we found 117
128 that PN-IN and IN-PN plasticity had similar contributions. In all cases, cells with higher intrinsic excitability (types B and C) were consistently represented in disproportionately larger numbers in the plastic cell group (Table 1), while type A cells were ineffective in the competition, as hypothesized in Kim et al. (2013a). This was also highlighted by the fact that none of the type A cells that received only one or none of the tone and shock afferents became plastic even when inhibitory plasticity was disabled. Analysis at the single cell level revealed that the dominant plasticity mechanisms separating plastic and non-plastic cells were tone-pn plasticity and PN-PN plasticity, but not IN-PN plasticity. In addition, the numbers of such connections were also significantly different for the two cell types as cited in results. Also, for PN-PN connections to a principal cell, both the number of such connections and plasticity in the connections are relevant, but for the disynaptic inhibitory connections from plastic cells, only the number of connections is relevant. 118
 Cells receiving both tone & shock Plastic A/B/C cells Non-Plastic A/B/C cells Cells receiving only tone or only shock or neither Plastic A/B/C cells Non-Plastic")
129 Table 1. Plastic cell numbers and types when different intra-amygdala plasticity components are inactivated. Model Run (Cells: A-400; B-240; C-160) Cells receiving both tone & shock Plastic A/B/C cells Non-Plastic A/B/C cells Cells receiving only tone or only shock or neither Plastic A/B/C cells Non-Plastic A/B/C cells Total number of plastic cells Control case 9/89/54 214/45/34 4/20/22 147/69/ No intrinsic plasticity No PN-PN plasticity No IN-PN plasticity No PN-IN plasticity No IN-PN & PN-IN plasticity 20/108/68 203/27/20 6/31/27 145/58/ /87/54 208/48/34 5/8/9 146/81/ /105/69 204/30/19 8/36/27 143/53/ /94/56 215/41/32 1/23/19 150/66/ /111/74 206/24/14 9/41/32 142/48/
130 Role of intra-amygdalar plasticity in cellular competition (new criteria) The control case for competition studies had the following distribution of principal cell types: 400 type A, 240 type B, and 160 type C (see methods). Fig. 2A shows the spike histograms for a random set each of 100 plastic and non-plastic cells before and after conditioning for the control case, providing a snap shot of the competition. It shows how plasticity accrued during conditioning increases the tone responses of plastic cells, and how plastic cell might then be more effective in suppressing non-plastic cells via disynaptic inhibition involving interneurons. We investigated the role of intra-amygdalar plasticity in this competition, via a series of model inactivation experiments. The tone responses resulting from these inactivation experiments are shown in Fig. 2B, and the specifics related cell numbers are provided below. Since type A plastic cells were very few, we consider plastic cells of types B and C only in the analysis below. Inactivation of all intra-amygdalar plasticity. We first disabled all intra-amygdalar plasticity, i.e., in PN-PN, IN-PN, and PN-IN synapses, to study their combined effect. Instead of remaining constant at 20% (N=156/800), inactivation of all intra-amygdalar plasticity caused the size of the number of plastic cells to increase by 53.8% (to N=240). Further analysis revealed that while 30.7% (1.3% A, 60%B, and 60.2%C) of the principal cells that received both tone and shock became plastic in the control case, a much larger number, 40% (5% A, 77%B, and 77.3%C), became plastic when intra-amygdalar plasticity was disabled, and their tone responses were also higher (Table1; Fig.2B1). We found that inactivation caused a larger decrease in IN-PN weights for winners than losers, compared to the control case (122±6% v/s 120±34%; p<0.94). The firing frequency of INs connected to loser PNs was similar to those of the INs connected to winner PNs 120
131 (20±3% v/s 21±0.6%; p<0.803). Inactivation caused a larger decrease in PN-PN weights for losers than winners, compared to the control case (66±34% v/s -2.4±1.9%; p<2.7e-8). Also, the firing frequencies of PNs connected to loser PNs increased less than those of PNs connected to winners (80±17% v/s 90±6%; p<0.62).we performed a more detailed analysis of their characteristics using insights from a regression model (described later) which revealed thalamic tone, shock and the presence of NE receptor to be significant (p<0.01) attributes of plastic cells. We used 1 or 0 to indicate the presence or absence of each of these three attributes, and summed them on a cell by cell basis (range of 0 to 3) for the winners and losers. Then we found that this summed value was slightly greater for winner cells compared to the losers (1.61±0.08 v/s 1.50±0.33, not significant). This implicates intra-amygdalar plasticity as the mechanism limiting the number of plastic cells to 20%. Then we asked what the contribution of plasticity in the individual synapses might be towards this overall effect. To investigate this, we disabled plasticity individually in the connections. Inactivation of only PN-PN plasticity. This resulted in a 8.3% decrease in both the number of plastic cells (from 156 to 144), and their tone responses also decreased (Fig. 2B1). Thus, plasticity in the synapses between principal cells increases excitation to generate additional principal cells. The competition resulting from inactivation of this plasticity resulted in 22 cells losing their plasticity (losers; 0A, 22B&C) and 14 of the former non-plastic cells becoming plastic (winners; 2A, 12B&C). We found that inactivation had similar effects on IN-PN weights for winners and losers, compared to the control case (0.14±0.8% v/s 1.8±1.1%; p<0.33). However, the firing frequency of INs connected to loser PNs increased less than those of the INs connected to winner PNs 121
132 (0.22±0.38% v/s 0.48±0.59%; p<0.708). Similarly, inactivation caused a larger decrease in PN-PN weights for losers than winners, compared to the control case (27±14% v/s - 3±0.75; p<0.13). Also, the firing frequencies of PNs connected to loser PNs decreased more than those of PNs connected to winners (2.17±2.7% v/s -2±4.3%; p<0.41).the summed binary values for the presence of thalamic tone, shock and NE receptor was slightly greater for winner cells compared to the loser cells (1.79±0.15 v/s 1.59±0.13, not significant). There is no significant difference in the number of excitatory connections and inhibitory connections between winner cells and loser cells. Inactivation of only IN-PN plasticity. This caused a 56.4% increase in the number of plastic cells (to N=244/800). The competition resulting from inactivation of IN-PN plasticity resulted in 8 cells losing their plasticity (losers; 0A, 8B&C) and 96 of the former non-plastic cells becoming plastic (winners; 12A, 84B&C). We found that inactivation caused a larger decrease in IN-PN weights for winners than losers, compared to the control case (130±6% v/s 68±14%; p<0.005). Also, the firing frequency of INs connected to loser PNs increased more (less) than those of the INs connected to winner PNs (40±3.3% v/s 42±0.9%; p<0.54). Similarly, inactivation caused a larger decrease in PN-PN weights for losers than winners, compared to the control case (0.13±1% v/s - 11±5%; p<0.51). Also, the firing frequencies of PNs connected to loser PNs decreased more (increased less) than those of PNs connected to winners (75±28% v/s 98±6%; p<0.44). The summed binary values for the presence of thalamic tone, shock and NE receptor was significantly greater for winner cells compared to the loser cells (1.69±0.07 v/s 1.25±0.25, p<0.05). Feng The winner B&C cells had more excitatory (7.47±0.48) 122
133 than the loser B&C cells (4±1.38), the difference is significant with P-value equals to Inactivation of only PN-IN plasticity. This resulted in a 3.2% increase in the number of plastic cells (to N=161/800). The competition resulting from inactivation of PN-IN plasticity resulted in 11 cells losing their plasticity (losers: A = 2, B&C = 9) and 20 of the former non-plastic cells becoming plastic (winners: A = 0, B&C = 20). We found that inactivation caused a larger decrease in IN-PN weights for winners than losers, compared to the control case (59±19% v/s 40±25%; p<0.58). The increase in firing frequency of INs connected to loser PNs were comparable to those of the INs connected to winner PNs (6.7±1.8% v/s 5.1±1.3%; p<0.5). Also, changes in PN-PN weights was comparable for winners and losers (-2.4±2% v/s 0.83±2.21%; p<0.38). The firing frequencies of PNs connected to loser PNs increased less than those of PNs connected to winners (6.5±3.47% v/s 15±3.21%; p<0.11). The summed binary values for the presence of thalamic tone, shock and NE receptor was unexpectedly less for winner cells compared to the loser cells (1.65±0.17 v/s 2.18±0.18, p<0.05). The winner B&C cells had more excitatory and less di-synaptic inhibitory connections from plastic cells (exc: 5.04±0.71; inh: 90.7±7.3) than the loser cells (exc: 3.54±0.66; inh: 94.2±9.9), but the difference is not significant. This change was comparable to that of the IN-PN only case suggesting that both components of the di-synaptic inhibition pathway had approximately similar contributions towards the resultant inhibition on the principal cell. Inactivation of IN-PN and PN-IN, but not PN-PN plasticity. With only PN-PN plasticity, there was a 65.4% increase in the number of plastic cells (to N=258). 74.7% of type B&C 123
134 cells receiving both tone and shock became plastic. This shows that plasticity in the disynaptic inhibitory pathway is necessary for competition. The competition resulting from inactivation of PN-IN&IN-PN plasticity resulted in 5 cells losing their plasticity (losers: A = 1, B&C = 4) and 108 of the former non-plastic cells becoming plastic (winners: A = 9, B&C = 99). We found that inactivation caused a larger decrease in IN-PN weights for winners than losers, compared to the control case (136±6% v/s 65±22%; p<0.0018). Also, the firing frequency of INs connected to loser PNs increased more than those of the INs connected to winner PNs (26±2% v/s 23±0.7%; p<0.31). Similarly, inactivation caused lesser increase in PN-PN weights for losers than winners, compared to the control case (0.53±0.76% v/s 10±4.5%; p<0.67). Also, the firing frequencies of PNs connected to loser PNs increased less than those of PNs connected to winners (75±28% v/s 98±6%; p<0.44). The summed binary values for the presence of thalamic tone, shock and NE receptor was slightly greater for winner cells compared to the loser cells (1.64±0.07 v/s 1.40±0.51, not significant). The winner B&C cells had significantly more excitatory input (7.9±0.42) than the loser B&C cells (4±1.11). Plasticity in synapses of representative cells To investigate the role of plasticity in competition at the individual cell level, we considered the change in synaptic weights of ten representative plastic and non-plastic cells. Of the ten in each group we picked five of type B and five of type C. Since they were rare we omitted type A plastic cells (<2%) from this particular analysis. For this group of representative cells, each plastic cell received 6.6±1.5 mono-synaptic excitatory connection from other plastic cells, while each non-plastic cell received only 3.8±1.2 connections from plastic cells. Also, each interneuron typically received 5.13±3 124
135 connections from plastic cells. Then we considered all di-synaptic inhibitory connections from plastic cells to cells of each of the two groups. As cited earlier, plastic cells had significantly fewer (82.2±3.4) connections of this type, as compared to non-plastic cells (94.8±1.6), the P-value is Since the excitability of a cell depends on these connections as well as on plasticity in these connections, we next investigated the role of plasticity. For each group we investigated the effect of fear conditioning on the various synapses, on a per cell basis (average ±s.e.m.). This analysis revealed that tone-pn synapses increased by 100±35 % for a plastic cell but only by -2.6±0.4% for a non-plastic cell. Also, PN-PN synapses from all plastic cells to a plastic cell increased by 16±15%, but such synapses from plastic cells to a non-plastic cell grew only by -6±2%. Plasticity in IN-PN connections was considered by taking all connections from interneurons to the specific principal cell. Among the interneuron population, there were six that did not receive any projections from principal cells, and these were excluded to ensure that we considered only inhibitory di-synaptic pathways from plastic cells. Interestingly, IN-PN plasticity was found to be similar for both plastic and non-plastic post-synaptic cell types: plasticity in IN-PN connections to non-plastic cells increased by 103±17% and they increased by 163±29% in such connections to plastic cells. For completion, we also considered plasticity in the PN-IN connections for both plastic and non-plastic presynaptic cells, and these were 0%, and 0%, respectively. 125
136 Figure below shows the percentage of weight change of plastic cells and non-plastic cells for all blocking cases. It looks like tone weight change increased a lot when IN-PN plasticity is blocked. DISCUSSION Distinct roles of the different components of intra-amygdalar plasticity All intra-amygdalar synapses, PN-PN, PN-IN, and IN-PN participated in the competition in different ways as reported in Results. Even though 56% of all principal cells received both tone and shock inputs, intra-amygdalar plasticity limited the number of plastic cells to 25% of the total. This was demonstrated by inactivating intraamygdalar plasticity which caused almost all type B and C cells receiving tone and shock to become plastic (172/223). It is noted that type A cells played a marginal role in the 126
137 competition (Table 1). PN-PN plasticity helped cells band together and make other cells plastic in the absence of plasticity in the di-synaptic inhibitory pathways (PN-IN and IN- PN plasticity disabled) since this increased the number of plastic cells to 258 (a 72% increase), even recruiting 2 cells that did not receive both tone and shock. However, when only PN-PN plasticity was disabled, inhibitory plasticity reduced the number of plastic cells by 4% from the control case, indicating that inhibitory plasticity effectively counters plasticity in the afferent tone-pn synapses. But would PN-PN plasticity or inhibitory plasticity by themselves be enough for competition? To address this, we performed two additional model runs. In one we retained only inhibitory plasticity, i.e., inactivated PN-PN plasticity alone (resulting in N=144 plastic cells), and then simulated the 25% CREB down-regulation experiment. This showed that the number of plastic cells was not maintained, and dropped from 144 to 53, indicating that PN-PN plasticity was important to stabilize the size of the memory trace. In the second model run we simulated the No IN-PN & PN-IN plasticity case (i.e., only PN-PN plasticity) and found that the number of plastic cells were again not maintained, dropping from 258 to 184. These two model experiments showed that plasticity in excitatory connections between principal cells and di-synaptic inhibitory plasticity from plastic cells were both necessary for stabilizing the size of the fear memory trace, i.e., competition thus requires both forms of intra-amygdalar plasticity. Considering the components of inhibitory plasticity, we found that PN-IN and IN-PN plasticity had similar contributions. In all cases, cells with higher intrinsic excitability (types B and C) were consistently represented in disproportionately larger numbers in the plastic cell group (Table 1), while type A cells were ineffective in the competition, as hypothesized in Kim et al. (2013a). This was also highlighted by the 127
138 fact that none of the type A cells that received only one or none of the tone and shock afferents became plastic even when inhibitory plasticity was disabled. Analysis at the single cell level revealed that the dominant plasticity mechanisms separating plastic and non-plastic cells were tone-pn plasticity and PN-PN plasticity, but not IN-PN plasticity. In addition, the numbers of such connections were also significantly different for the two cell types as cited in results. Also, for PN-PN connections to a principal cell, both the number of such connections and plasticity in the connections are relevant, but for the di-synaptic inhibitory connections from plastic cells, only the number of connections is relevant. Table 2. Plastic cell numbers and types when different intra-amygdala plasticity components are inactivated. Model Run (Cells: A-400; B-240; C-160) Cells receiving both tone & shock Plastic A/B/C cells Non-Plastic A/B/C cells Cells receiving only tone or only shock or neither Plastic A/B/C cells Non-Plastic A/B/C cells Total number of plastic cells Control case 3/81/53 220/54/35 0/12/7 151/77/ No intrinsic plasticity No PN-PN plasticity No IN-PN plasticity No PN-IN plasticity No IN-PN & PN-IN plasticity 11/104/68 212/31/20 2/27/25 149/62/ /82/48 218/53/40 0/6/3 151/83/ /105/68 210/30/20 2/31/24 149/58/ /84/53 223/51/35 0/15/9 151/74/ /110/73 213/25/15 1/34/28 150/55/
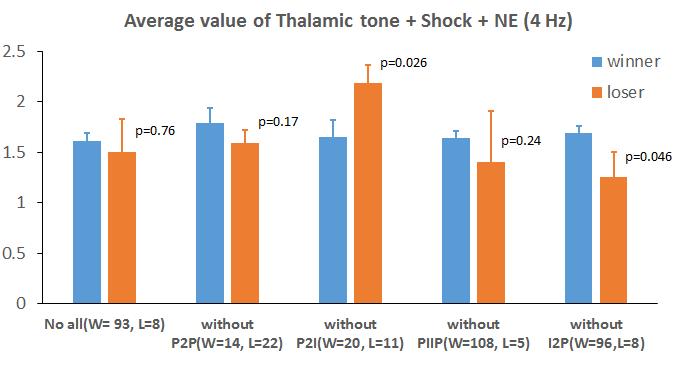
139 129
SUPPLEMENTARY INFORMATION. Supplementary Figure 1
 SUPPLEMENTARY INFORMATION Supplementary Figure 1 The supralinear events evoked in CA3 pyramidal cells fulfill the criteria for NMDA spikes, exhibiting a threshold, sensitivity to NMDAR blockade, and all-or-none
Basics of Computational Neuroscience: Neurons and Synapses to Networks
 Basics of Computational Neuroscience: Neurons and Synapses to Networks Bruce Graham Mathematics School of Natural Sciences University of Stirling Scotland, U.K. Useful Book Authors: David Sterratt, Bruce
Chapter 6 subtitles postsynaptic integration
 CELLULAR NEUROPHYSIOLOGY CONSTANCE HAMMOND Chapter 6 subtitles postsynaptic integration INTRODUCTION (1:56) This sixth and final chapter deals with the summation of presynaptic currents. Glutamate and
Different inhibitory effects by dopaminergic modulation and global suppression of activity
 Different inhibitory effects by dopaminergic modulation and global suppression of activity Takuji Hayashi Department of Applied Physics Tokyo University of Science Osamu Araki Department of Applied Physics
Synaptic plasticityhippocampus. Neur 8790 Topics in Neuroscience: Neuroplasticity. Outline. Synaptic plasticity hypothesis
 Synaptic plasticityhippocampus Neur 8790 Topics in Neuroscience: Neuroplasticity Outline Synaptic plasticity hypothesis Long term potentiation in the hippocampus How it s measured What it looks like Mechanisms
Rolls,E.T. (2016) Cerebral Cortex: Principles of Operation. Oxford University Press.
 Cerebral Cortex: Principles of Operation. Oxford University Press.") Digital Signal Processing and the Brain Is the brain a digital signal processor? Digital vs continuous signals Digital signals involve streams of binary encoded numbers The brain uses digital, all or none,
Digital Signal Processing and the Brain Is the brain a digital signal processor? Digital vs continuous signals Digital signals involve streams of binary encoded numbers The brain uses digital, all or none,
Information Processing During Transient Responses in the Crayfish Visual System
 Information Processing During Transient Responses in the Crayfish Visual System Christopher J. Rozell, Don. H. Johnson and Raymon M. Glantz Department of Electrical & Computer Engineering Department of
BIPN 140 Problem Set 6
 BIPN 140 Problem Set 6 1) The hippocampus is a cortical structure in the medial portion of the temporal lobe (medial temporal lobe in primates. a) What is the main function of the hippocampus? The hippocampus
Active Control of Spike-Timing Dependent Synaptic Plasticity in an Electrosensory System
 Active Control of Spike-Timing Dependent Synaptic Plasticity in an Electrosensory System Patrick D. Roberts and Curtis C. Bell Neurological Sciences Institute, OHSU 505 N.W. 185 th Avenue, Beaverton, OR
BIPN 140 Problem Set 6
 BIPN 140 Problem Set 6 1) Hippocampus is a cortical structure in the medial portion of the temporal lobe (medial temporal lobe in primates. a) What is the main function of the hippocampus? The hippocampus
Applied Neuroscience. Conclusion of Science Honors Program Spring 2017
 Applied Neuroscience Conclusion of Science Honors Program Spring 2017 Review Circle whichever is greater, A or B. If A = B, circle both: I. A. permeability of a neuronal membrane to Na + during the rise
1) Drop off in the Bi 150 box outside Baxter 331 or to the head TA (jcolas).
 Drop off in the Bi 150 box outside Baxter 331 or to the head TA (jcolas).") Bi/CNS/NB 150 Problem Set 3 Due: Tuesday, Oct. 27, at 4:30 pm Instructions: 1) Drop off in the Bi 150 box outside Baxter 331 or e-mail to the head TA (jcolas). 2) Submit with this cover page. 3) Use a
Bi/CNS/NB 150 Problem Set 3 Due: Tuesday, Oct. 27, at 4:30 pm Instructions: 1) Drop off in the Bi 150 box outside Baxter 331 or e-mail to the head TA (jcolas). 2) Submit with this cover page. 3) Use a
SUPPLEMENTARY INFORMATION
 doi:10.1038/nature10776 Supplementary Information 1: Influence of inhibition among blns on STDP of KC-bLN synapses (simulations and schematics). Unconstrained STDP drives network activity to saturation
1) Drop off in the Bi 150 box outside Baxter 331 or to the head TA (jcolas).
 Drop off in the Bi 150 box outside Baxter 331 or to the head TA (jcolas).") Bi/CNS/NB 150 Problem Set 3 Due: Tuesday, Oct. 27, at 4:30 pm Instructions: 1) Drop off in the Bi 150 box outside Baxter 331 or e-mail to the head TA (jcolas). 2) Submit with this cover page. 3) Use a
Bi/CNS/NB 150 Problem Set 3 Due: Tuesday, Oct. 27, at 4:30 pm Instructions: 1) Drop off in the Bi 150 box outside Baxter 331 or e-mail to the head TA (jcolas). 2) Submit with this cover page. 3) Use a
Modeling Depolarization Induced Suppression of Inhibition in Pyramidal Neurons
 Modeling Depolarization Induced Suppression of Inhibition in Pyramidal Neurons Peter Osseward, Uri Magaram Department of Neuroscience University of California, San Diego La Jolla, CA 92092 possewar@ucsd.edu
The storage and recall of memories in the hippocampo-cortical system. Supplementary material. Edmund T Rolls
 The storage and recall of memories in the hippocampo-cortical system Supplementary material Edmund T Rolls Oxford Centre for Computational Neuroscience, Oxford, England and University of Warwick, Department
SUPPLEMENTARY INFORMATION
 Supplementary Figure 1. Normal AMPAR-mediated fepsp input-output curve in CA3-Psen cdko mice. Input-output curves, which are plotted initial slopes of the evoked fepsp as function of the amplitude of the
Tuning properties of individual circuit components and stimulus-specificity of experience-driven changes.
 Supplementary Figure 1 Tuning properties of individual circuit components and stimulus-specificity of experience-driven changes. (a) Left, circuit schematic with the imaged component (L2/3 excitatory neurons)
Plasticity of Cerebral Cortex in Development
 Plasticity of Cerebral Cortex in Development Jessica R. Newton and Mriganka Sur Department of Brain & Cognitive Sciences Picower Center for Learning & Memory Massachusetts Institute of Technology Cambridge,
Na + K + pump. The beauty of the Na + K + pump. Cotransport. The setup Cotransport the result. Found along the plasma membrane of all cells.
 The beauty of the Na + K + pump Na + K + pump Found along the plasma membrane of all cells. Establishes gradients, controls osmotic effects, allows for cotransport Nerve cells have a Na + K + pump and
Introduction to Neurobiology
 Biology 240 General Zoology Introduction to Neurobiology Nervous System functions: communication of information via nerve signals integration and processing of information control of physiological and
Part 11: Mechanisms of Learning
 Neurophysiology and Information: Theory of Brain Function Christopher Fiorillo BiS 527, Spring 2012 042 350 4326, fiorillo@kaist.ac.kr Part 11: Mechanisms of Learning Reading: Bear, Connors, and Paradiso,
Supplementary Information
 Hyperpolarization-activated cation channels inhibit EPSPs by interactions with M-type K + channels Meena S. George, L.F. Abbott, Steven A. Siegelbaum Supplementary Information Part 1: Supplementary Figures
Evaluating the Effect of Spiking Network Parameters on Polychronization
 Evaluating the Effect of Spiking Network Parameters on Polychronization Panagiotis Ioannou, Matthew Casey and André Grüning Department of Computing, University of Surrey, Guildford, Surrey, GU2 7XH, UK
Chapter 2: Cellular Mechanisms and Cognition
 Chapter 2: Cellular Mechanisms and Cognition MULTIPLE CHOICE 1. Two principles about neurons were defined by Ramón y Cajal. The principle of connectional specificity states that, whereas the principle
Sample Lab Report 1 from 1. Measuring and Manipulating Passive Membrane Properties
 Sample Lab Report 1 from http://www.bio365l.net 1 Abstract Measuring and Manipulating Passive Membrane Properties Biological membranes exhibit the properties of capacitance and resistance, which allow
Simulating inputs of parvalbumin inhibitory interneurons onto excitatory pyramidal cells in piriform cortex
 Simulating inputs of parvalbumin inhibitory interneurons onto excitatory pyramidal cells in piriform cortex Jeffrey E. Dahlen jdahlen@ucsd.edu and Kerin K. Higa khiga@ucsd.edu Department of Neuroscience
Bursting dynamics in the brain. Jaeseung Jeong, Department of Biosystems, KAIST
 Bursting dynamics in the brain Jaeseung Jeong, Department of Biosystems, KAIST Tonic and phasic activity A neuron is said to exhibit a tonic activity when it fires a series of single action potentials
Nature Neuroscience: doi: /nn Supplementary Figure 1. Trial structure for go/no-go behavior
 Supplementary Figure 1 Trial structure for go/no-go behavior a, Overall timeline of experiments. Day 1: A1 mapping, injection of AAV1-SYN-GCAMP6s, cranial window and headpost implantation. Water restriction
Long-term depression and recognition of parallel "bre patterns in a multi-compartmental model of a cerebellar Purkinje cell
 Neurocomputing 38}40 (2001) 383}388 Long-term depression and recognition of parallel "bre patterns in a multi-compartmental model of a cerebellar Purkinje cell Volker Steuber*, Erik De Schutter Laboratory
Dynamics of Hodgkin and Huxley Model with Conductance based Synaptic Input
 Proceedings of International Joint Conference on Neural Networks, Dallas, Texas, USA, August 4-9, 2013 Dynamics of Hodgkin and Huxley Model with Conductance based Synaptic Input Priyanka Bajaj and Akhil
Chapter 11 Introduction to the Nervous System and Nervous Tissue Chapter Outline
 Chapter 11 Introduction to the Nervous System and Nervous Tissue Chapter Outline Module 11.1 Overview of the Nervous System (Figures 11.1-11.3) A. The nervous system controls our perception and experience
Basal Ganglia. Introduction. Basal Ganglia at a Glance. Role of the BG
 Basal Ganglia Shepherd (2004) Chapter 9 Charles J. Wilson Instructor: Yoonsuck Choe; CPSC 644 Cortical Networks Introduction A set of nuclei in the forebrain and midbrain area in mammals, birds, and reptiles.
Neurons: Structure and communication
 Neurons: Structure and communication http://faculty.washington.edu/chudler/gall1.html Common Components of a Neuron Dendrites Input, receives neurotransmitters Soma Processing, decision Axon Transmits
Synaptic Transmission: Ionic and Metabotropic
 Synaptic Transmission: Ionic and Metabotropic D. Purves et al. Neuroscience (Sinauer Assoc.) Chapters 5, 6, 7. C. Koch. Biophysics of Computation (Oxford) Chapter 4. J.G. Nicholls et al. From Neuron to
PHY3111 Mid-Semester Test Study. Lecture 2: The hierarchical organisation of vision
 PHY3111 Mid-Semester Test Study Lecture 2: The hierarchical organisation of vision 1. Explain what a hierarchically organised neural system is, in terms of physiological response properties of its neurones.
Neural Communication. Central Nervous System Peripheral Nervous System. Communication in the Nervous System. 4 Common Components of a Neuron
 Neural Communication Overview of CNS / PNS Electrical Signaling Chemical Signaling Central Nervous System Peripheral Nervous System Somatic = sensory & motor Autonomic = arousal state Parasympathetic =
Cellular Neurobiology BIPN140
 Cellular Neurobiology BIPN140 1st Midterm Exam Ready for Pickup By the elevator on the 3 rd Floor of Pacific Hall (waiver) Exam Depot Window at the north entrance to Pacific Hall (no waiver) Mon-Fri, 10:00
Cogs 107b Systems Neuroscience lec9_ neuromodulators and drugs of abuse principle of the week: functional anatomy
 Cogs 107b Systems Neuroscience www.dnitz.com lec9_02042010 neuromodulators and drugs of abuse principle of the week: functional anatomy Professor Nitz circa 1986 neurotransmitters: mediating information
Introduction to Computational Neuroscience
 Introduction to Computational Neuroscience Lecture 7: Network models Lesson Title 1 Introduction 2 Structure and Function of the NS 3 Windows to the Brain 4 Data analysis 5 Data analysis II 6 Single neuron
Relative contributions of cortical and thalamic feedforward inputs to V2
 Relative contributions of cortical and thalamic feedforward inputs to V2 1 2 3 4 5 Rachel M. Cassidy Neuroscience Graduate Program University of California, San Diego La Jolla, CA 92093 rcassidy@ucsd.edu
Dopamine modulation of prefrontal delay activity - Reverberatory activity and sharpness of tuning curves
 Dopamine modulation of prefrontal delay activity - Reverberatory activity and sharpness of tuning curves Gabriele Scheler+ and Jean-Marc Fellous* +Sloan Center for Theoretical Neurobiology *Computational
Lesson 14. The Nervous System. Introduction to Life Processes - SCI 102 1
 Lesson 14 The Nervous System Introduction to Life Processes - SCI 102 1 Structures and Functions of Nerve Cells The nervous system has two principal cell types: Neurons (nerve cells) Glia The functions
STRUCTURAL ELEMENTS OF THE NERVOUS SYSTEM
 STRUCTURAL ELEMENTS OF THE NERVOUS SYSTEM STRUCTURE AND MAINTENANCE OF NEURONS (a) (b) Dendrites Cell body Initial segment collateral terminals (a) Diagrammatic representation of a neuron. The break in
Ube3a is required for experience-dependent maturation of the neocortex
 Ube3a is required for experience-dependent maturation of the neocortex Koji Yashiro, Thorfinn T. Riday, Kathryn H. Condon, Adam C. Roberts, Danilo R. Bernardo, Rohit Prakash, Richard J. Weinberg, Michael
Memory Systems II How Stored: Engram and LTP. Reading: BCP Chapter 25
 Memory Systems II How Stored: Engram and LTP Reading: BCP Chapter 25 Memory Systems Learning is the acquisition of new knowledge or skills. Memory is the retention of learned information. Many different
COGS 107B. Week 7 Section IA: Ryan Szeto OH: Wednesday CSB Kitchen
 COGS 107B Week 7 Section IA: Ryan Szeto OH: Wednesday 1PM @ CSB Kitchen MT2: Tomorrow Question 1 NE: Locus coeruleus HA: Posterior hypothalamus ACh: Two pockets- located in pons and basal forebrain DA:
Theme 2: Cellular mechanisms in the Cochlear Nucleus
 Theme 2: Cellular mechanisms in the Cochlear Nucleus The Cochlear Nucleus (CN) presents a unique opportunity for quantitatively studying input-output transformations by neurons because it gives rise to
NEURONS COMMUNICATE WITH OTHER CELLS AT SYNAPSES 34.3
 NEURONS COMMUNICATE WITH OTHER CELLS AT SYNAPSES 34.3 NEURONS COMMUNICATE WITH OTHER CELLS AT SYNAPSES Neurons communicate with other neurons or target cells at synapses. Chemical synapse: a very narrow
Embryological origin of thalamus
 diencephalon Embryological origin of thalamus The diencephalon gives rise to the: Thalamus Epithalamus (pineal gland, habenula, paraventricular n.) Hypothalamus Subthalamus (Subthalamic nuclei) The Thalamus:
Supporting Information
 ATP from synaptic terminals and astrocytes regulates NMDA receptors and synaptic plasticity through PSD- 95 multi- protein complex U.Lalo, O.Palygin, A.Verkhratsky, S.G.N. Grant and Y. Pankratov Supporting
Chapter 7 Nerve Cells and Electrical Signaling
 Chapter 7 Nerve Cells and Electrical Signaling 7.1. Overview of the Nervous System (Figure 7.1) 7.2. Cells of the Nervous System o Neurons are excitable cells which can generate action potentials o 90%
SUPPLEMENTARY INFORMATION
 doi:10.1038/nature21682 Supplementary Table 1 Summary of statistical results from analyses. Mean quantity ± s.e.m. Test Days P-value Deg. Error deg. Total deg. χ 2 152 ± 14 active cells per day per mouse
EE 791 Lecture 2 Jan 19, 2015
 EE 791 Lecture 2 Jan 19, 2015 Action Potential Conduction And Neural Organization EE 791-Lecture 2 1 Core-conductor model: In the core-conductor model we approximate an axon or a segment of a dendrite
Chapter 12 Nervous Tissue
 9/12/11 Chapter 12 Nervous Tissue Overview of the nervous system Cells of the nervous system Electrophysiology of neurons Synapses Neural integration Subdivisions of the Nervous System 1 Subdivisions of
LESSON 3.3 WORKBOOK. Why does applying pressure relieve pain?
 Postsynaptic potentials small changes in voltage (membrane potential) due to the binding of neurotransmitter. Receptor-gated ion channels ion channels that open or close in response to the binding of a
Computational cognitive neuroscience: 2. Neuron. Lubica Beňušková Centre for Cognitive Science, FMFI Comenius University in Bratislava
 1 Computational cognitive neuroscience: 2. Neuron Lubica Beňušková Centre for Cognitive Science, FMFI Comenius University in Bratislava 2 Neurons communicate via electric signals In neurons it is important
Physiology of synapses and receptors
 Physiology of synapses and receptors Dr Syed Shahid Habib Professor & Consultant Clinical Neurophysiology Dept. of Physiology College of Medicine & KKUH King Saud University REMEMBER These handouts will
Nervous Tissue and Neurophysiology
 Nervous Tissue and Neurophysiology Objectives Describe the two major divisions of the nervous system and their characteristics. Identify the structures/functions of a typical neuron. Describe the location
Synfire chains with conductance-based neurons: internal timing and coordination with timed input
 Neurocomputing 5 (5) 9 5 www.elsevier.com/locate/neucom Synfire chains with conductance-based neurons: internal timing and coordination with timed input Friedrich T. Sommer a,, Thomas Wennekers b a Redwood
The mammalian cochlea possesses two classes of afferent neurons and two classes of efferent neurons.
 1 2 The mammalian cochlea possesses two classes of afferent neurons and two classes of efferent neurons. Type I afferents contact single inner hair cells to provide acoustic analysis as we know it. Type
Neuroscience 201A (2016) - Problems in Synaptic Physiology
 - Problems in Synaptic Physiology") Question 1: The record below in A shows an EPSC recorded from a cerebellar granule cell following stimulation (at the gap in the record) of a mossy fiber input. These responses are, then, evoked by stimulation.
Question 1: The record below in A shows an EPSC recorded from a cerebellar granule cell following stimulation (at the gap in the record) of a mossy fiber input. These responses are, then, evoked by stimulation.
Neurons. Pyramidal neurons in mouse cerebral cortex expressing green fluorescent protein. The red staining indicates GABAergic interneurons.
 Neurons Pyramidal neurons in mouse cerebral cortex expressing green fluorescent protein. The red staining indicates GABAergic interneurons. MBL, Woods Hole R Cheung MSc Bioelectronics: PGEE11106 1 Neuron
BIPN140 Lecture 12: Synaptic Plasticity (II)
") BIPN140 Lecture 12: Synaptic Plasticity (II) 1. Early v.s. Late LTP 2. Long-Term Depression 3. Molecular Mechanisms of Long-Term Depression: NMDA-R dependent 4. Molecular Mechanisms of Long-Term Depression:
BIPN140 Lecture 12: Synaptic Plasticity (II) 1. Early v.s. Late LTP 2. Long-Term Depression 3. Molecular Mechanisms of Long-Term Depression: NMDA-R dependent 4. Molecular Mechanisms of Long-Term Depression:
ZNZ Advanced Course in Neuroscience Mon Limbic System II. David P. Wolfer MD
 ZNZ Advanced Course in Neuroscience Mon 05.05.2014 Limbic System II David P. Wolfer MD Institute of Anatomy, University of Zurich Institute for Human Movement Sciences and Sport, ETH Zurich http://www.dpwolfer.ch
Neurons! John A. White Dept. of Bioengineering
 Neurons! John A. White Dept. of Bioengineering john.white@utah.edu What makes neurons different from cardiomyocytes? Morphological polarity Transport systems Shape and function of action potentials Neuronal
Cholinergic Activation of M2 Receptors Leads to Context- Dependent Modulation of Feedforward Inhibition in the Visual Thalamus
 Cholinergic Activation of M2 Receptors Leads to Context- Dependent Modulation of Feedforward Inhibition in the Visual Thalamus Miklos Antal., Claudio Acuna-Goycolea., R. Todd Pressler, Dawn M. Blitz, Wade
Axon initial segment position changes CA1 pyramidal neuron excitability
 Axon initial segment position changes CA1 pyramidal neuron excitability Cristina Nigro and Jason Pipkin UCSD Neurosciences Graduate Program Abstract The axon initial segment (AIS) is the portion of the
Neocortex. Cortical Structures in the Brain. Neocortex Facts. Laminar Organization. Bark-like (cortical) structures: Shepherd (2004) Chapter 12
 structures: Shepherd (2004) Chapter 12") Neocortex Shepherd (2004) Chapter 12 Rodney Douglas, Henry Markram, and Kevan Martin Instructor: Yoonsuck Choe; CPSC 644 Cortical Networks Cortical Structures in the Brain Bark-like (cortical) structures:
Neocortex Shepherd (2004) Chapter 12 Rodney Douglas, Henry Markram, and Kevan Martin Instructor: Yoonsuck Choe; CPSC 644 Cortical Networks Cortical Structures in the Brain Bark-like (cortical) structures:
Lecture 22: A little Neurobiology
 BIO 5099: Molecular Biology for Computer Scientists (et al) Lecture 22: A little Neurobiology http://compbio.uchsc.edu/hunter/bio5099 Larry.Hunter@uchsc.edu Nervous system development Part of the ectoderm
Sum of Neurally Distinct Stimulus- and Task-Related Components.
 SUPPLEMENTARY MATERIAL for Cardoso et al. 22 The Neuroimaging Signal is a Linear Sum of Neurally Distinct Stimulus- and Task-Related Components. : Appendix: Homogeneous Linear ( Null ) and Modified Linear
Neuromorphic computing
 Neuromorphic computing Robotics M.Sc. programme in Computer Science lorenzo.vannucci@santannapisa.it April 19th, 2018 Outline 1. Introduction 2. Fundamentals of neuroscience 3. Simulating the brain 4.
Physiology Unit 2 CONSCIOUSNESS, THE BRAIN AND BEHAVIOR
 Physiology Unit 2 CONSCIOUSNESS, THE BRAIN AND BEHAVIOR In Physiology Today What the Brain Does The nervous system determines states of consciousness and produces complex behaviors Any given neuron may
Chapter 4 Neuronal Physiology
 Chapter 4 Neuronal Physiology V edit. Pg. 99-131 VI edit. Pg. 85-113 VII edit. Pg. 87-113 Input Zone Dendrites and Cell body Nucleus Trigger Zone Axon hillock Conducting Zone Axon (may be from 1mm to more
Behavioral Neuroscience: Fear thou not. Rony Paz
 Behavioral Neuroscience: Fear thou not Rony Paz Rony.paz@weizmann.ac.il Thoughts What is a reward? Learning is best motivated by threats to survival? Threats are much better reinforcers? Fear is a prime
Synaptic Integration
 Synaptic Integration 3 rd January, 2017 Touqeer Ahmed PhD Atta-ur-Rahman School of Applied Biosciences National University of Sciences and Technology Excitatory Synaptic Actions Excitatory Synaptic Action
Brain anatomy and artificial intelligence. L. Andrew Coward Australian National University, Canberra, ACT 0200, Australia
 Brain anatomy and artificial intelligence L. Andrew Coward Australian National University, Canberra, ACT 0200, Australia The Fourth Conference on Artificial General Intelligence August 2011 Architectures
Analysis of in-vivo extracellular recordings. Ryan Morrill Bootcamp 9/10/2014
 Analysis of in-vivo extracellular recordings Ryan Morrill Bootcamp 9/10/2014 Goals for the lecture Be able to: Conceptually understand some of the analysis and jargon encountered in a typical (sensory)
MOLECULAR BIOLOGY OF DRUG ADDICTION. Sylvane Desrivières, SGDP Centre
 1 MOLECULAR BIOLOGY OF DRUG ADDICTION Sylvane Desrivières, SGDP Centre Reward 2 Humans, as well as other organisms engage in behaviours that are rewarding The pleasurable feelings provide positive reinforcement
Chapter 5: Learning and Behavior Learning How Learning is Studied Ivan Pavlov Edward Thorndike eliciting stimulus emitted
 Chapter 5: Learning and Behavior A. Learning-long lasting changes in the environmental guidance of behavior as a result of experience B. Learning emphasizes the fact that individual environments also play
3) Most of the organelles in a neuron are located in the A) dendritic region. B) axon hillock. C) axon. D) cell body. E) axon terminals.
 Most of the organelles in a neuron are located in the A) dendritic region. B) axon hillock. C) axon. D) cell body. E) axon terminals.") Chapter 48 Neurons, Synapses, and Signaling Multiple-Choice Questions 1) A simple nervous system A) must include chemical senses, mechanoreception, and vision. B) includes a minimum of 12 ganglia. C) has
Chapter 48 Neurons, Synapses, and Signaling Multiple-Choice Questions 1) A simple nervous system A) must include chemical senses, mechanoreception, and vision. B) includes a minimum of 12 ganglia. C) has
QUIZ YOURSELF COLOSSAL NEURON ACTIVITY
 QUIZ YOURSELF What are the factors that produce the resting potential? How is an action potential initiated and what is the subsequent flow of ions during the action potential? 1 COLOSSAL NEURON ACTIVITY
NERVOUS SYSTEM 1 CHAPTER 10 BIO 211: ANATOMY & PHYSIOLOGY I
 BIO 211: ANATOMY & PHYSIOLOGY I 1 Ch 10 A Ch 10 B This set CHAPTER 10 NERVOUS SYSTEM 1 BASIC STRUCTURE and FUNCTION Dr. Lawrence G. Altman www.lawrencegaltman.com Some illustrations are courtesy of McGraw-Hill.
Chapter 2. The Cellular and Molecular Basis of Cognition Cognitive Neuroscience: The Biology of the Mind, 2 nd Ed.,
 Chapter 2. The Cellular and Molecular Basis of Cognition Cognitive Neuroscience: The Biology of the Mind, 2 nd Ed., M. S. Gazzaniga, R. B. Ivry, and G. R. Mangun, Norton, 2002. Summarized by B.-W. Ku,
Inhibition: Effects of Timing, Time Scales and Gap Junctions
 Inhibition: Effects of Timing, Time Scales and Gap Junctions I. Auditory brain stem neurons and subthreshold integ n. Fast, precise (feed forward) inhibition shapes ITD tuning. Facilitating effects of
Zoo400 Exam 1: Mar 25, 1999
 Zoo400 Exam 1: Mar 25, 1999 NAME: There is only 1 best answer per question. (1 pt each) A large dendrite is 1mm long and has a diameter of 3.2 µ. Calculate the following using the assumption that the dendrite
Neurobiology: The nerve cell. Principle and task To use a nerve function model to study the following aspects of a nerve cell:
 Principle and task To use a nerve function model to study the following aspects of a nerve cell: INTRACELLULAR POTENTIAL AND ACTION POTENTIAL Comparison between low and high threshold levels Comparison
Chapter 11: Functional Organization of Nervous Tissue
 Chapter 11: Functional Organization of Nervous Tissue I. Functions of the Nervous System A. List and describe the five major nervous system functions: 1. 2. 3. 4. 5. II. Divisions of the Nervous System
What is Anatomy and Physiology?
 Introduction BI 212 BI 213 BI 211 Ecosystems Organs / organ systems Cells Organelles Communities Tissues Molecules Populations Organisms Campbell et al. Figure 1.4 Introduction What is Anatomy and Physiology?
The Role of Mitral Cells in State Dependent Olfactory Responses. Trygve Bakken & Gunnar Poplawski
 The Role of Mitral Cells in State Dependent Olfactory Responses Trygve akken & Gunnar Poplawski GGN 260 Neurodynamics Winter 2008 bstract Many behavioral studies have shown a reduced responsiveness to
5-Nervous system II: Physiology of Neurons
 5-Nervous system II: Physiology of Neurons AXON ION GRADIENTS ACTION POTENTIAL (axon conduction) GRADED POTENTIAL (cell-cell communication at synapse) SYNAPSE STRUCTURE & FUNCTION NEURAL INTEGRATION CNS
Synaptic transmission
 Outline Synaptic transmission Sompol Tapechum M.D., Ph.D. Department of Physiology Faculty of Medicine Siriraj Hospital, Bangkok, Thailand. sisth@mahidol.ac.th 2 Structure of synapse Modes of synaptic
Receptors and Neurotransmitters: It Sounds Greek to Me. Agenda. What We Know About Pain 9/7/2012
 Receptors and Neurotransmitters: It Sounds Greek to Me Cathy Carlson, PhD, RN Northern Illinois University Agenda We will be going through this lecture on basic pain physiology using analogies, mnemonics,
biological psychology, p. 40 The study of the nervous system, especially the brain. neuroscience, p. 40
 biological psychology, p. 40 The specialized branch of psychology that studies the relationship between behavior and bodily processes and system; also called biopsychology or psychobiology. neuroscience,
The Neurobiology of Learning and Memory
 The Neurobiology of Learning and Memory JERRY W. RUDY University of Colorado, Boulder Sinauer Associates, Inc. Publishers Sunderland, Massachusetts 01375 Table of Contents CHAPTER 1 Introduction: Fundamental
LESSON 3.3 WORKBOOK. Why does applying pressure relieve pain? Workbook. Postsynaptic potentials
 Depolarize to decrease the resting membrane potential. Decreasing membrane potential means that the membrane potential is becoming more positive. Excitatory postsynaptic potentials (EPSP) graded postsynaptic
Supplementary figure 1: LII/III GIN-cells show morphological characteristics of MC
 1 2 1 3 Supplementary figure 1: LII/III GIN-cells show morphological characteristics of MC 4 5 6 7 (a) Reconstructions of LII/III GIN-cells with somato-dendritic compartments in orange and axonal arborizations
Questions Addressed Through Study of Behavioral Mechanisms (Proximate Causes)
") Jan 28: Neural Mechanisms--intro Questions Addressed Through Study of Behavioral Mechanisms (Proximate Causes) Control of behavior in response to stimuli in environment Diversity of behavior: explain the
Jan 28: Neural Mechanisms--intro Questions Addressed Through Study of Behavioral Mechanisms (Proximate Causes) Control of behavior in response to stimuli in environment Diversity of behavior: explain the
Thursday, January 22, Nerve impulse
 Nerve impulse Transmembrane Potential caused by ions moving through cell membrane at different rates Two main ions of concern Na + - Sodium K + - potassium Cell membrane not freely permeable therefore
Lateral Inhibition Explains Savings in Conditioning and Extinction
 Lateral Inhibition Explains Savings in Conditioning and Extinction Ashish Gupta & David C. Noelle ({ashish.gupta, david.noelle}@vanderbilt.edu) Department of Electrical Engineering and Computer Science