SUPPLEMENTARY INFORMATION
|
|
|
- Brook Knight
- 5 years ago
- Views:
Transcription
 VEGF GLUT1 MDA-231 (#) 1-99 patient samples -6.4 11. Z score MCF1A shluc sh N H N H HIF1a VEGF GLUT1 mub-g g 2.5 j MDA-231 2.")
 GLUT1 GLUT4 GLUT1 GLUT4 ANG PKM2 ANG1 ANG2 l DAPI h MDA-231 shmdc1 shluc #1 #2 N H N H N H =8 hr. 2 MDC1 VEGF ANG1 PKM2 EPO 13 12 11 1 i 9 GLUT1 8 5 1 H2AFX 4.5 4. 3.5 3. Pearson R =.49 P <.")
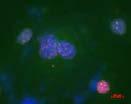
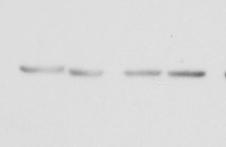
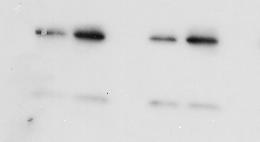
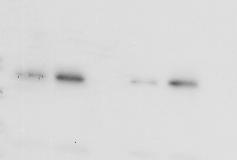
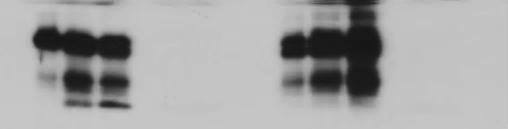
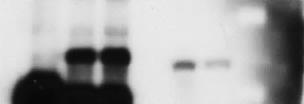
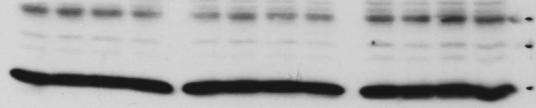
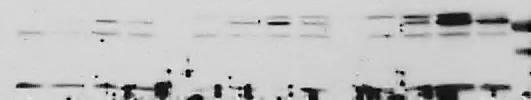
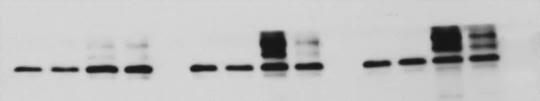
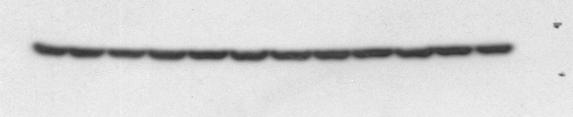
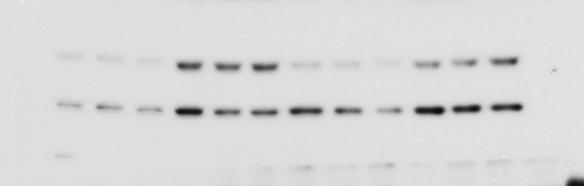
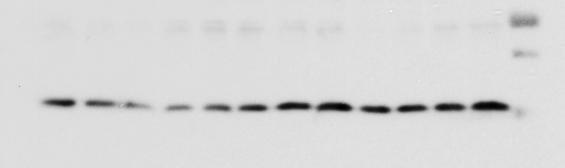
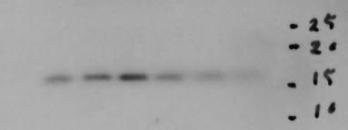
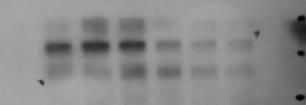
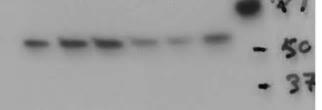
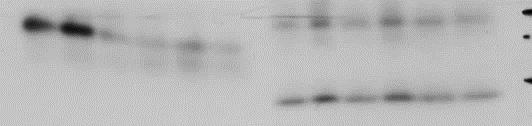
1 DOI: 1.138/ncb3445 In the format provided by the authors and unedited. a b HIF1A Pearson R =.5419 P < H2AFX VEGFA d Pearson R = P < H2AFX Overexpression Vector -WT hr (1% O 2 ) VEGF GLUT1 MDA-231 (#) 1-99 patient samples Z score MCF1A shluc sh N H N H HIF1a VEGF GLUT1 mub-g g 2.5 j MDA shluc shrnf8 H2AFX N H N H =8 hr. f g MEF Cells RNF8 VEGF Mdc1 -/- Mdc1 +/+ MEF Cells hr. (1% O 2 ) ANG H2ax +/+ H2ax -/- 2 MDC1 GLUT hr. (1% O 2 ) GLUT1 GLUT4 GLUT1 GLUT4 ANG PKM2 ANG1 ANG2 l DAPI h MDA-231 shmdc1 shluc #1 #2 N H N H N H =8 hr. 2 MDC1 VEGF ANG1 PKM2 EPO i 9 GLUT H2AFX Pearson R =.49 P <.1 Pearson R =.6579 P <.1 MEF Cells Rnf8 +/+ Rnf8 -/ hr. (1 % O 2 ) RNF8 ANG GLUT1 c GLUT4 PKM2 Hypoxia Normoxia H2ax -/- H2ax +/+ H2ax -/- H2ax +/+ e k 2-NBDG Integration (a.u.) Lactate Production (mm/l) MDA-231: sh shluc #1 #2 #3 N H N H N H N H HIF1a HIF1a N H N H Glucose uptake shluc Normoxia Hypoxia sh Merged shluc sh Supplementary Figure 1 HIF1α signalling is positively correlated with expression but not with DNA damage markers. a, Heat map data were generated from analysis of biopsy specimens of 99 untreated patients with stage 1-3 breast cancer registered at MD Anderson Cancer Center (MDACC). Co-expression analysis was validated by using probes hybridized to, HIF1α, VEGF and PKM2 genes. b, The co-expression of HIF1α target genes was correlated with that of by the study of 5 untreated breast cancer patients at MDACC. c, Luc or knockdown MCF1A breast epithelial cells were cultured in normoxic or hypoxic conditions for 8 h, and lysates were collected for IB.d, Vector- or -overexpressing MDA-MB-231 cancer cells were cultured under hypoxia at the indicated times and harvested for IB. e, Luc or knockdown MDA-MB-231 cells were grown under normoxia or hypoxia for 24 h and treated with NBDG ( mm) for 2 h; glucose uptake was quantified by FACS analysis (n=3 independent experiments, upper). Luc or knockdown MDA-MB-231 cells were cultured under normoxia or hypoxia for 24 h and lactate production was measured (n=3 biological replicate samples, lower). (f-j) H2ax+/+ and H2ax-/- MEF (f) or Mdc1+/+ and Mdc1-/- MEF or LUC and MDC1 knockdown MDA-MB-231 (g, h) or Rnf8+/+ and Rnf8-/- MEF or LUC and RNF8 knockdown MDA-MB-231 (i, j) cells were cultured in hypoxic conditions at the indicated times and harvested for IB of hypoxia-inducible protein expression. k, Luc or knockdown MDA-MB-231 cells silenced by three different shrnas were cultured in normoxic (N) or hypoxic (H=8 hours) conditions and harvested for detection of HIF1α expression level. l, H2ax+/+ and H2ax-/- MEF cells were cultured in hypoxic or normoxic conditions for 12h, and the localization of HIF1α and proteins was visualized by immunofluorescence microscopy. Image represents 1 out of 3 independent experiments.. Scale bar= µm. Statistical significance of triplicated results was assessed by two tailed t-test. Mean ± SD. P<.1 was considered significant. Unprocessed original scans of blots are shown in Supplementary Fig Macmillan Publishers Limited, part of Springer Nature. All rights reserved.


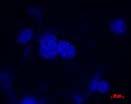


2 a c DAPI MRE11 g Merged Overexpression + Mock SHARP1 SHARP1 N H N H N H N H HIF1a HA-SHARP1 HA- MDA-231 Hypoxia Normoxia H2ax -/- H2ax +/+ H2ax -/- H2ax +/+ d DAPI RNF8 g Merged b Overexpression HA-SHARP1: HA-: Flag-HIF1a: T Flag-HIF1a HA-SHARP1 mub- HA- Hypoxia Normoxia H2ax -/- H2ax +/+ H2ax +/+ H2ax -/- H2ax +/+ 1X 1X 1X 1X 1X 1X 1X 1X Supplementary Figure 2 SHARP1 may exhibit a competition with. a, Mock or or SHARP1 or along with SHARP1 were transiently overexpressed in MDA-MB-231 cells were cultured under hypoxic conditions for 8 hours and harvested for IB analysis. b, Lysates of 293T cells transfected with (Flag)-HIF1α along with HA- or (HA)-SHARP1 were subjected to IB analysis. c, d, H2ax+/+ and H2ax-/- MEF cells were cultured in normoxic or hypoxic conditions for 12h, and the localization of MRE11 (c) or RNF8 (d) and γ proteins was visualized by immunofluorescence microscopy. Scale bar= µm. γ is induced upon hypoxia without colocalization with DNA damage factors such as MRE11 and RNF8. The experiments a-d performed once. Unprocessed original scans of blots are shown in Supplementary Fig Macmillan Publishers Limited, part of Springer Nature. All rights reserved.
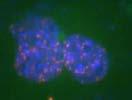
3 a E3 ligase WCE - - Ni-NTA IB: HAmUb- HA- Smurf1/ Smurf2 c-iap2 c-iap1 FBW7 Itch MDM2 SKP2 His-Ub HA b e Stable overexpression, MDA-231 pmx -WT mub- DAPI HIF1a g Merged c HA- - WCE Ni-NTA His-Ub d IB: HAmUb- HA- IP: IgG N H Input N H MDA-231 HIF1a g HIF1a g Hypoxia Normoxia H2ax -/- H2ax +/+ H2ax -/- H2ax +/+ f Human Bovine Mouse Salmon Zebrafish Arabidopsis Drosophila Human Bovine Mouse Salmon Zebrafish Arabidopsis Drosophila Human Bovine Mouse Salmon Zebrafish Arabidopsis Drosophila MSGRGKTGGKARAKAKSRSSRAGLQFPVGRVHRLLRKGHYAE-RVGAGAPVYL MSGRGKTGGKARAKAKSRSSRAGLQFPVGRVHRLLRKGHYAE-RVGAGAPVYL MSGRGKTGGKARAKAKSRSSRAGLQFPVGRVHRLLRKGHYAE-RVGAGAPVYL MSGRGKTGGKARAKAKSRSSRAGLQFPVGRVHRLLRKGNYAH-RVGAGAPVYM MSGRGKAVSKTRAKAKTRSSRAGLQFPVGRVHRLLRKGNYAH-RVGAGAPVYL MSTGAGSGTTKGGRGKPKATKSVSRSSKAGLQFPVGRIARFLKSGKYAE-RVGAGAPVYL -----MAGGKAGKDSGKAKAKAVSRSARAGLQFPVGRIHRHLKSRTTSHGRVGATAAVYS :: :::: :. :.. K74/ AAVLEYLTAEILELAGNAARDNKKTRIIPRHLQLAIRNDEELNKLLGGVTIAQGGVLPNI AAVLEYLTAEILELAGNAARDNKKTRIIPRHLQLAIRNDEELNKLLGGVTIAQGGVLPNI AAVLEYLTAEILELAGNAARDNKKTRIIPRHLQLAIRNDEELNKLLGGVTIAQGGVLPNI AAVLEYLTAEILELAGNAARDNKKSRIIPRHLQLAVRNDEELNKLLGGVTIAQGGVLPNI AAVLEYLTAEILELAGNAARDNKKSRIIPRHLQLAVRNDEELNKLLGGVTIAQGGVLPNI SAVLEYLAAEVLELAGNAARDNKKTRIVPRHIQLAVRNDEELSKLLGSVTIANGGVLPNI AAILEYLTAEVLELAGNASKDLKVKRITPRHLQLAIRGDEELDSLIK-ATIAGGGVIPHI ::::::. ::...:. :: K119/1 K134/135 S139 QAVLLPKKTSATVGPKAPSGGKKATQASQEY QAVLLPKKTSATVGPKAPAGGKKATQASQEY QAVLLPKKSSATVGPKAPAVGKKASQASQEY QAVLLPKKTGAAAAPSGKA-GKKASSQSQEY QAVLLPKKSSGGVSTSG----KKSSQQSQEY HQTLLPSK VGKNKGDIGSASQEF HKSLIGKK----EETVQDPQRKGNVILSQAY : :..:.. Supplementary Figure 3 is an E3 ligase which monoubiquitinates and interacts with HIF1α. a, Lysates of 293T cells transfected with hemagglutinin-tagged (HA-) and His-Ub, along with various E3 ligases, were subjected to in vivo ubiquitination assay and IB analysis. b, Vector (pmx)- or -overexpressing MDA-MB-231 cells were cultured in normoxic or indicated hypoxic time points and subjected to lysis followed by IB analysis. c, 293T cells co-transfected with His-Ub, and HA- or various mutants were subjected to lysis for in vivo monoubiquitination assay. ubiquitination sites were found at Lys (K) 119 and K1. d, Lysates of MDA-231 cells cultured in normoxic or hypoxic conditions for 4 h were immunoprecipitated with control or antibody followed by IB. e, Immunofluorescence assay of the localization of HIF1α and γ proteins from H2ax+/+ and H2ax-/- MEF cells cultured in hypoxic or normoxic conditions for 12 h. Scale bar= µm. Image represents 1 out of 3 independent experiments. f, Multiple alignments of amino acids are shown; ubiquitination sites K119/1 (highlighted in red letters) and the phosphorylation site S139 (in the SQEY motif, highlighted in blue) are highly conserved among different species. Numbers show the positions of K (lysine) and/or S (serine). Unprocessed original scans of blots are shown in Supplementary Fig Macmillan Publishers Limited, part of Springer Nature. All rights reserved.
 HIF1a VEGF GLUT1 GLUT4 g b mrna Expression Fold 8 6 4 2 MEF/Traf6 2 4 c Labeled DNA + Labeled Lysate + Labeled DNA + Cold DNA Lysate DNA 1 2 3 Biotin labeled d Traf6 6 bp ChIP: HIF1a Input")
 MDA-231-sh#2 1 2 PE-A (x 1,) SLC2A4 mrna 3.")

4 a MDA-231 shluc shhif1a hr. (1%O 2 ) HIF1a VEGF GLUT1 GLUT4 g b mrna Expression Fold MEF/Traf6 2 4 c Labeled DNA + Labeled Lysate + Labeled DNA + Cold DNA Lysate DNA Biotin labeled d Traf6 6 bp ChIP: HIF1a Input IgG N H N H (-) Hela cells IP:GAPDH Input 3 e f EPO mrna Pearson R =.3396 P < mrna ANGPT1 mrna Pearson R =.3517 P < mrna Count Count MDA-231-shLUC 1 2 PE-A (x 1,) MDA-231-sh#1 ANGPT2 mrna Pearson R =.3628 P < mrna SLC2A1 mrna Pearson R =.4564 P < mrna g Count PE-A (x 1,) MDA-231-sh#2 1 2 PE-A (x 1,) SLC2A4 mrna Pearson R =.4327 P < mrna PDK1 mrna Pearson R =.21 P < mrna Count (%) 6 4 Cell Cycle Profile ns ns G/G1 S G2/M Poly shluc sh#1 sh#2 Supplementary Figure 4, a hypoxia responsive gene, regulates HIF1α signalling. a, MDA-MB-231 cancer cells in which Luc or HIF1α was silenced by shrna were cultured in normoxic or hypoxic conditions for 8 h, and lysates were collected for IB analysis. b, Primary MEF cells cultured in hypoxic conditions for 2 and 4 h were subjected to qpcr of Traf6 mrna (n=3, biologically independent extracts).. c, Lysates of HEK-293 cells were treated with biotin-labeled -DNA or along with biotin-labeled - DNA and cold DNA (not Labeled) compared to labeled-dna alone were subjected to electrophoretic mobility shift assay (EMSA). d, Hela cells were cultured in normoxic or hypoxic conditions and harvested for chromatin immunoprecipitation (ChIP) with HIF1α antibody followed by qpcr for the expression of genes and were compared to GAPDH control. e, Scatter plots were generated for the correlated expression of HIF1α target genes with. Tumour tissues were used from 5 untreated patients with stage 1-3 breast cancer. The biopsies were obtained through fine-needle aspiration. Expression analysis was carried out by Nexus Expression.3 software (Biodiscovery). f, g, LUC or knockdown MDA-MB-231 cells were subjected to cell cycle analysis (n=3, independent experiments). Statistical significance of three biological replications was assessed by two tailed t test. Mean ± SD, p<.1 was considered significant. Unprocessed original scans of blots are shown in Supplementary Fig Macmillan Publishers Limited, part of Springer Nature. All rights reserved.
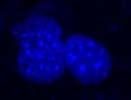
 HIF1a MDA-231 c -SA -KR -WT Vector DAPI HIF1a Merged d 2 2 MEF N H N KU H (=12 hr.) patm (S1981) ATM g HIF1a e 2 2 MEF ATM-WT ATM-Null 4 8 4 8 hr.")
5 a MEF/H2ax -/- /Rescued b vector WT KR SA hr. (1% O 2 ) VEGF GLUT1 g shluc sh#1 sh#2 --- MG MG MG132 N H N H N H N H N H N H (=4 hr.) HIF1a MDA-231 c -SA -KR -WT Vector DAPI HIF1a Merged d 2 2 MEF N H N KU H (=12 hr.) patm (S1981) ATM g HIF1a e 2 2 MEF ATM-WT ATM-Null hr. (1% O 2 ) patm ATM HIF1a ANG VEGF PKM2 f 2 2 IP: ATM NM M N H N H N H In put mub- ATM ATM g g MEF/Traf6 -/- /Rescued Vector WT CA 1% O2: hr. g Chromatin WCE a-tubulin h Expression Value Vector WT KR SA ChIP: anti-hif1a for VEGF Expression N H N H N H N H 293T Supplementary Figure 5 mub- and γ formation are critical for HIF1α signalling. a, H2ax / MEF cells in which was restored with vector, -WT or -KR mutant construct were cultured under hypoxic conditions for the indicated time points and subjected to lysis and IB. b, -silenced MDA-MB-231 cells were treated with vehicle or MG132 in hypoxic conditions for 4 hours and subjected to lysis and IB. c, H2ax-/- MEF cells reconstituted with vector, -WT or -KR or -SA mutant were incubated under hypoxic conditions for 12 h, and the localization of HIF1α was visualized by confocal microscopy. Scale bar= μm. Experiments were performed twice. d, MEF cells cultured in normoxic and hypoxic conditions were treated with or without ATM inhibitor KU55933 for the indicated times, harvested and subjected to lysis for IB. e, MEF cells generated from Atm+/+ or Atm-/- mice cultured in hypoxic conditions for 8 h and subjected to lysis and then to IB analysis. f, 293T cells treated with non-modified (NM) and modified (M, ub-conjugated) peptides (2 ng/ml) were cultured in normoxic or hypoxic conditions for 4 h, and lysates were collected for IP with ATM antibody, followed by IB. Interaction of ATM to mub- was neutralized followed by reduction in γ expression. g, Traf6 / MEF cells restored with vector, -WT or -C7A mutant were cultured in hypoxic conditions for various time points and harvested for chromatin fractionation and IB. γ formation was shown in the chromatin fraction of the cells rescued with -WT. h, 293T cells stably overexpressing vector, -WT or -KR or -SA mutant were cultured in normoxic or hypoxic conditions and harvested for ChIP-qPCR of VEGF using HIF1α antibody (n=3, biologically independent extracts). Results are representative from three biological replications. Statistical significance was assessed by ANOVA. Unprocessed original scans of blots are shown in Supplementary Fig Macmillan Publishers Limited, part of Springer Nature. All rights reserved.
 1 9 6 3 Normoxia Hypoxia shluc sh#1 sh#2 N H N H N H % Migration 4 shluc sh shluc sh#1 sh#2 % Invasion 3 shluc")

.")


 and invasion (f) assay (n=4, biological replicate Scale")
 and ubiquiitnated (right, CVLLPK(ub-K) TSAT) peptides (1 ng/ml)")
6 a b hr Cell Number (X) SA -KR -WT Vector NS Day Vector -WT -KR -SA c pbabe HIF1a-WT HIF1a-Mut sh shluc d e 6 f 4 VEGF Concentration (x1 pg/ml) Normoxia Hypoxia shluc sh#1 sh#2 N H N H N H % Migration 4 shluc sh shluc sh#1 sh#2 % Invasion 3 shluc sh shluc sh#1 sh#2 g 1 5 Nonubiquitinated peptide 1 5 Ubiquitinated peptide Comp-PE-A Comp-PE-A Comp-FITC-A Comp-FITC-A Supplementary Figure 6 -targeting reduces cancer cell survival, migration and tumourigenesis. a, MDA-MB-231 cells stably overexpressing vector, -WT or -KR or -SA mutant were harvested for cell viability assay (n=3, biological replicate samples). b, knockdown MDA-MB-231 cells rescued with -WT or an mutant were seeded in triplicate for a wound healing analysis using confocal microscopy. c, Luciferase expressing MDA-MB-231 cancer cells in which was silenced by shrna and then restored with vector, HIF1α-WT or HIF1α- Mut were injected into the mammary fat pad of nude mice and luciferase expression in tumour growth was counted. d, Luc or knockdown MDA-MB-231 breast cancer cells were cultured in normoxic or hypoxic conditions for 24 h, and the conditioned media were collected for detection of secreted VEGF by ELISA assay (n=4, biological replicate samples). e-f, MDA-MB-231 cells in which Luc or was silenced with two different shrnas and plated in transwell chambers for the cell migration (e) and invasion (f) assay (n=4, biological replicate samples). Scale bar= µm. g, MDA-MB-231 cells were treated with non-ubiquitinated (left, CVLLPKKTSAT) and ubiquiitnated (right, CVLLPK(ub-K) TSAT) peptides (1 ng/ml) overnight, and cell viability was determined by flow cytometry. Statistical significance was measured using two tailed t-test (e-f) and ANOVA (a, d). Mean ± SD, P<.1 and P<.5 were considered significant Macmillan Publishers Limited, part of Springer Nature. All rights reserved.


7 a Biological processes Cancer hallmarks Activation of MAPKKK pathway Cell migration Pyridine biosynthesis Suppression of cell cycle checkpoint Wnt signaling pathway Suppression of apoptosis by intracellular signals Glucose metabolism Glucose transport Cell proliferation Growth hormone secretion Suppression of caspase activation via cytochrome c EGFR signaling pathway Positive regulation of I-κB/NF-κB cascade Telomere maintenance Fatty acid biosynthesis Angiogenesis Suppression of apoptotic program STOP% " " Sustaining proliferation Resisting cell death Tissue invasion and metastasis Replicative immortality Angiogenesis Continuous growth signaling Metabolic reprogramming Evading immune surveillance Cancer-promoting inflammation Genome instability b Sustaining proliferation JNK cascade Positive regulation of JNK cascade I-kB/NF-kB signaling cascade Cell proliferation Activation of MAPKKK activity Activation of NF-kappaB-inducing kinase G2 phase of mitotic cell cycle DNA-dependent DNA replication Activation of MAPK activity Activation of MAPKK activity Activation of JNK activity Positive regulation of I-kB/NF-kB signaling cascade Positive regulation of cell proliferation EGFR pathway S phase of mitotic cell cycle Enrichment score c Metabolic reprogramming Lipid biosynthetic process Fatty acid biosynthetic process Fatty acid metabolic process Amino acid biosynthetic process Lipid metabolic process Glutamate transport Purine ribonucleoside monophosphate biosynthetic process Glucose transport Glucose metabolic process GTP biosynthetic process Pyridine nucleotide biosynthetic process Glutamate signaling pathway Lipopolysaccharide biosynthetic process Coenzyme A biosynthetic process Enrichment score d Tissue invasion and metastasis Regulation of cell adhesion Endothelial cell migration Cell migration Wnt receptor signaling pathway Enrichment score Supplementary Figure 7 Overexpression of is associated with upregulation of major cancer hallmarks. a, Transcriptomics gene expression profiles of 2 breast cancer patients (cohort GSE194, Gene Expression Omnibus database, were analyzed using the Nexus Expression 3. software (BioDiscovery). The gene expression profiles of the highest quartile were compared with the lowest quartile, and then matched with related biological processes and corresponding cancer hallmarks. The size of cancer hallmark symbols signified the magnitude of their upregulation when expression was elevated in breast cancer. b-d, The bar graph indicates a significant increase in cancer proliferation (b), metabolomics reprogramming (c), tissue invasion and metastasis (d) which associated with enhanced expression. Enrichment scores were calculated using the Nexus Expression 3. software (BioDiscovery). This Circos map was built using the Circos software ( Macmillan Publishers Limited, part of Springer Nature. All rights reserved.


 were injected into the mammary fat pad of nude mice (n=5/group) and tumour sizes were monitored weekly (b) and")
 and")

. The publication data range was from Jan. 1954-Apr. 16.")
8 a shluc/vector sh/vector sh/hif1a-wt sh/hif1a-mut 1 Count b Tumour Volume (x mm 3 ) shluc/pbabe sh/pbabe sh/hif WT sh/hif Mut W3 W4 W5 ns c shluc sh/hif1a Vec Vec WT Mut Tumour weight (g) ns MSCV- MSCV- d vector mir-145 e Tumour Volume (x mm 3 ) W1 MSCV mir-145 ns W2 W3 W4 W5 W6 f Supplementary Figure 8. regulates HIF1α-dependent breast cancer development. a-c, knockdown MDA-MB-231 cells (expressing luciferase) rescued with pbabe vector, HIF1α-WT or HIF1α-Mut (constitutively active mutant) were injected into the mammary fat pad of nude mice (n=5/group) and tumour sizes were monitored weekly (b) and tumour weight was measured at week 6 (c, n=5 tumour/group, Mean ± SD) d, MSCV-vector or MSCV-miR-145 overexpressing MDA-MB-231 breast cancer cells were subcutaneously injected into the right flank of 6-weekold nude mice (n=4/group) and tumour volume was measured weekly. e, Primary tissues, cell lines in different human disease with different types of mutation which is involved in functional effect, inheritance mode, translation impact, unclassified mutation, zygosity and wild type were analysed using Ingenuity Pathway ( The publication data range was from Jan Apr. 16. f, Activation of, and HIF1α network in cancer genomics was proven by cbioportal web-based data sets ( Panels e and f indicate that this network is significantly existed including, and HIF1α gene pairs with co-occurring alterations in many cancer types. Statistical significance was assessed by ANOVA. Mean ± SD. ns, not significant. P<.1 was considered significant Macmillan Publishers Limited, part of Springer Nature. All rights reserved.


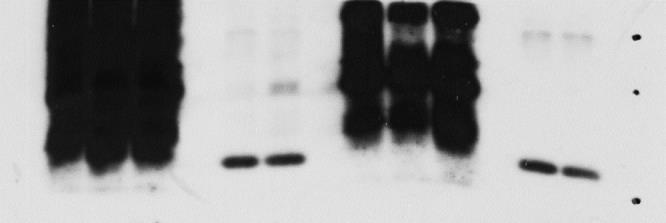
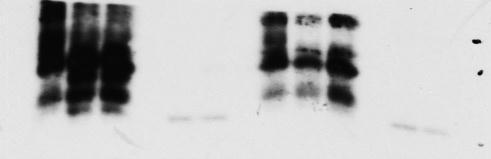
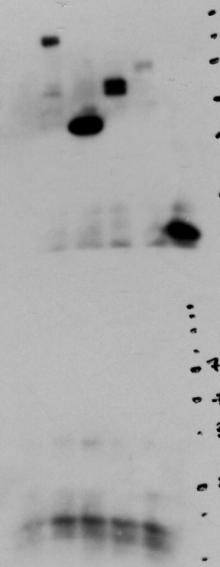
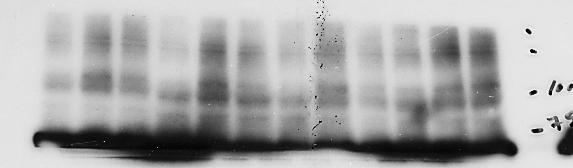
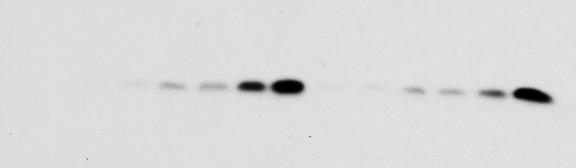
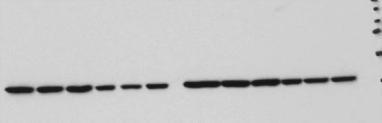
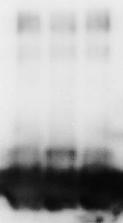
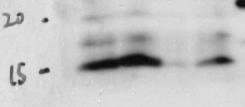
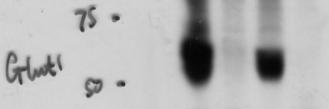
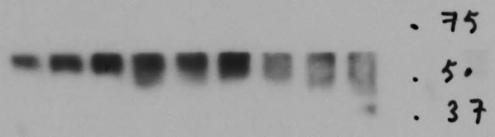
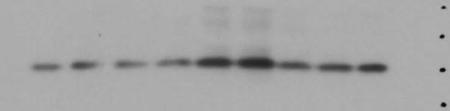
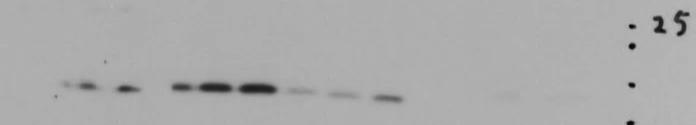
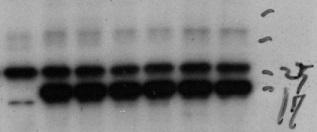
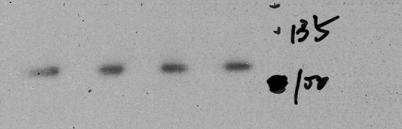
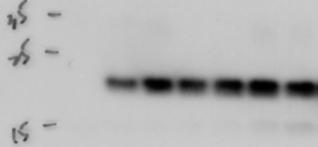
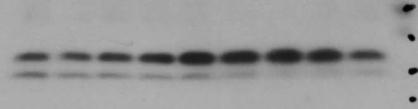
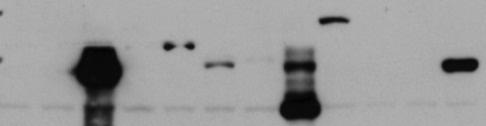
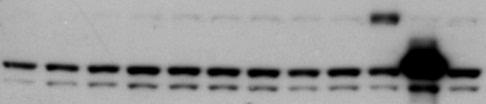
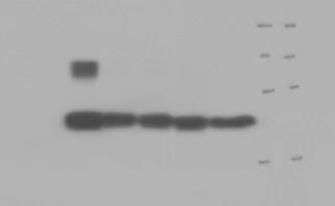
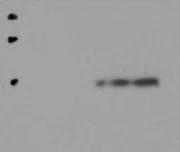
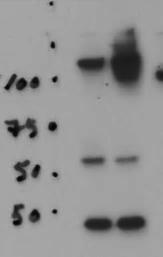
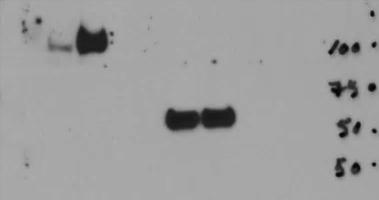
9 Figure 2b Figure 2c 1 1 Figure 2f Supplementary Figure 9 Unprocessed scans of full blots. The unprocessed films showing the key experiments displayed in main figures and Supplementary figure Macmillan Publishers Limited, part of Springer Nature. All rights reserved.


10 Figure 3a 1 Figure 3b Figure 3c 1 H N H Figure 3d 1 Figure 3e Supplementary Figure 9 continued Macmillan Publishers Limited, part of Springer Nature. All rights reserved.


11 Figure 3g Figure 3h 1 1 Figure 3j 1 1 Figure 3i 1 Figure 4a Macmillan Publishers Limited, part of Springer Nature. All rights reserved.


12 Figure 4b 1 Figure 4c 51 Figure 4e Figure 4d Figure 4g Macmillan Publishers Limited, part of Springer Nature. All rights reserved.


13 Figure 4f Figure 4k Figure 4i Figure 5a Macmillan Publishers Limited, part of Springer Nature. All rights reserved.


14 Figure 5b Figure 5d 1 Figure 5e 1 Supplementary Figure 9 continued Macmillan Publishers Limited, part of Springer Nature. All rights reserved.


15 Figure 5h Figure 5f 1 2 Figure 5g Macmillan Publishers Limited, part of Springer Nature. All rights reserved.


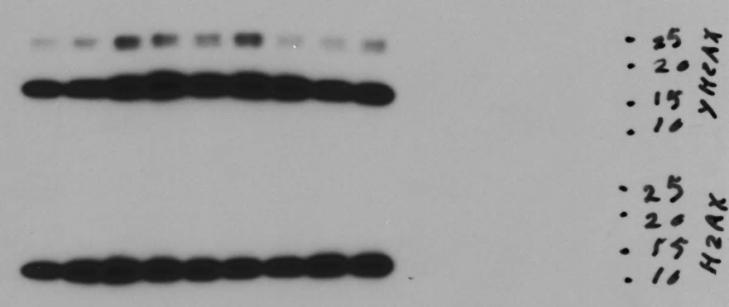
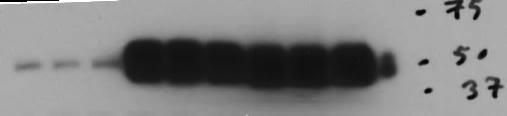
16 FigureS1c Figure5i 2 2 FigureS1d FigureS1f Supplementary Figure 9 continued Macmillan Publishers Limited, part of Springer Nature. All rights reserved.


17 FigureS1g FigureS1i FigureS1j 1 FigureS1h Macmillan Publishers Limited, part of Springer Nature. All rights reserved.


18 FigureS2a FigureS1k FigureS2b FigureS3a Macmillan Publishers Limited, part of Springer Nature. All rights reserved.


19 FigureS3b FigureS3c FigureS3d FigureS4a Macmillan Publishers Limited, part of Springer Nature. All rights reserved.

20 FigureS5a 1 FigureS5b FigureS5d Macmillan Publishers Limited, part of Springer Nature. All rights reserved.


21 FigureS5e FigureS5f FigureS5g Macmillan Publishers Limited, part of Springer Nature. All rights reserved.
22 Supplementary Table Legends Supplementary Table 1 Associations of,, γ, HIF1α, VEGF and GLUT1 expression with tumour status. In 212 breast carcinomas, high expression levels of,, γ, HIF1α, VEGF and GLUT1 were significantly associated with increments of primary tumour status (pt, p.2), nodal metastasis (pn, p.2) and stage (p.6). Supplementary Table 2 Associations between,, γ, HIF1α, VEGF and GLUT1 expression. expression was significantly positively correlated with expression of, γ, HIF1α, VEGF and GLUT1. Interestingly, the labelling indexes of all six of these markers are significantly and positively correlated to each other except for HIF1α and GLUT1, whose correlation is not significant. Supplementary Table 3,, γ, HIF1α, VEGF and GLUT1 expression significantly associated with patient survival outcome. Together with pt status, pn status, and stage,,, γ, HIF1α and VEGF expression significantly predicted disease-specific survival (DSS) and metastasis-free survival (MeFS) by Cox proportional hazards model. GLUT1 expression was significantly predictive for MeFS but not DSS. By log-rank analysis,,, γ and VEGF expression were significantly predictive for both DSS and MeFS, while HIF1α and GLUT1 were predictive for poorer MeFS but not DSS. Supplementary Table 4 Multivariate survival analyses. High expression of and and higher tumour stage remained prognostically significant for DSS (, p=.17;, p<.1) and MeFS (, p=.42;, p=.45). Supplementary Table 5 shrnas, primers and probes used in experimental assays. a, shrnas used for silencing. b, Primers used for real time-quantitative PCR. c, Primers and probes used for ChIP and EMSA assays. Supplementary Table 6 Primary antibody list. Supplementary Table 7 Statistics source data. Supplementary References 1. Gao, J., et al. Integrative analysis of complex cancer genomics and clinical profiles using the cbioportal. Sci Signal. 6, 1-19 (13). 2. Cerami, E., et al., The cbio cancer genomics portal: an open platform for exploring multidimensional cancer genomics data. Cancer Discov. 2, (12) Macmillan Publishers Limited, part of Springer Nature. All rights reserved.
SUPPLEMENTAL FIGURE LEGENDS
 SUPPLEMENTAL FIGURE LEGENDS Supplemental Figure S1: Endogenous interaction between RNF2 and H2AX: Whole cell extracts from 293T were subjected to immunoprecipitation with anti-rnf2 or anti-γ-h2ax antibodies
SUPPLEMENTARY INFORMATION
 DOI: 1.138/ncb3355 a S1A8 + cells/ total.1.8.6.4.2 b S1A8/?-Actin c % T-cell proliferation 3 25 2 15 1 5 T cells Supplementary Figure 1 Inter-tumoral heterogeneity of MDSC accumulation in mammary tumor
SUPPLEMENTARY INFORMATION
 DOI: 10.1038/ncb2607 Figure S1 Elf5 loss promotes EMT in mammary epithelium while Elf5 overexpression inhibits TGFβ induced EMT. (a, c) Different confocal slices through the Z stack image. (b, d) 3D rendering
Supplementary Figure 1
 Supplementary Figure 1 a γ-h2ax MDC1 RNF8 FK2 BRCA1 U2OS Cells sgrna-1 ** 60 sgrna 40 20 0 % positive Cells (>5 foci per cell) b ** 80 sgrna sgrna γ-h2ax MDC1 γ-h2ax RNF8 FK2 MDC1 BRCA1 RNF8 FK2 BRCA1
supplementary information
 DOI: 10.1038/ncb1875 Figure S1 (a) The 79 surgical specimens from NSCLC patients were analysed by immunohistochemistry with an anti-p53 antibody and control serum (data not shown). The normal bronchi served
RAW264.7 cells stably expressing control shrna (Con) or GSK3b-specific shrna (sh-
 or GSK3b-specific shrna (sh-") 1 a b Supplementary Figure 1. Effects of GSK3b knockdown on poly I:C-induced cytokine production. RAW264.7 cells stably expressing control shrna (Con) or GSK3b-specific shrna (sh- GSK3b) were stimulated
1 a b Supplementary Figure 1. Effects of GSK3b knockdown on poly I:C-induced cytokine production. RAW264.7 cells stably expressing control shrna (Con) or GSK3b-specific shrna (sh- GSK3b) were stimulated
Supplementary Information
 Supplementary Information mediates STAT3 activation at retromer-positive structures to promote colitis and colitis-associated carcinogenesis Zhang et al. a b d e g h Rel. Luc. Act. Rel. mrna Rel. mrna
Supplementary Figure 1.TRIM33 binds β-catenin in the nucleus. a & b, Co-IP of endogenous TRIM33 with β-catenin in HT-29 cells (a) and HEK 293T cells
 and HEK 293T cells") Supplementary Figure 1.TRIM33 binds β-catenin in the nucleus. a & b, Co-IP of endogenous TRIM33 with β-catenin in HT-29 cells (a) and HEK 293T cells (b). TRIM33 was immunoprecipitated, and the amount of
Supplementary Figure 1.TRIM33 binds β-catenin in the nucleus. a & b, Co-IP of endogenous TRIM33 with β-catenin in HT-29 cells (a) and HEK 293T cells (b). TRIM33 was immunoprecipitated, and the amount of
Plasma exposure levels from individual mice 4 hours post IP administration at the
 Supplemental Figure Legends Figure S1. Plasma exposure levels of MKC-3946 in mice. Plasma exposure levels from individual mice 4 hours post IP administration at the indicated dose mg/kg. Data represent
Supplementary Figure 1. HOPX is hypermethylated in NPC. (a) Methylation levels of HOPX in Normal (n = 24) and NPC (n = 24) tissues from the
 Methylation levels of HOPX in Normal (n = 24) and NPC (n = 24) tissues from the") Supplementary Figure 1. HOPX is hypermethylated in NPC. (a) Methylation levels of HOPX in Normal (n = 24) and NPC (n = 24) tissues from the genome-wide methylation microarray data. Mean ± s.d.; Student
Supplementary Figure 1. HOPX is hypermethylated in NPC. (a) Methylation levels of HOPX in Normal (n = 24) and NPC (n = 24) tissues from the genome-wide methylation microarray data. Mean ± s.d.; Student
Supplementary Figure 1. Deletion of Smad3 prevents B16F10 melanoma invasion and metastasis in a mouse s.c. tumor model.
 A B16F1 s.c. Lung LN Distant lymph nodes Colon B B16F1 s.c. Supplementary Figure 1. Deletion of Smad3 prevents B16F1 melanoma invasion and metastasis in a mouse s.c. tumor model. Highly invasive growth
SUPPLEMENTARY INFORMATION
 SUPPLEMENTARY INFORMATION doi:1.138/nature9814 a A SHARPIN FL B SHARPIN ΔNZF C SHARPIN T38L, F39V b His-SHARPIN FL -1xUb -2xUb -4xUb α-his c Linear 4xUb -SHARPIN FL -SHARPIN TF_LV -SHARPINΔNZF -SHARPIN
Supplementary Figure 1. The mir-182 binding site of SMAD7 3 UTR and the. mutated sequence.
 Supplementary Figure 1. The mir-182 binding site of SMAD7 3 UTR and the mutated sequence. 1 Supplementary Figure 2. Expression of mir-182 and SMAD7 in various cell lines. (A) Basal levels of mir-182 expression
SUPPLEMENTARY INFORMATION
 DOI: 10.1038/ncb3076 Supplementary Figure 1 btrcp targets Cep68 for degradation during mitosis. a) Cep68 immunofluorescence in interphase and metaphase. U-2OS cells were transfected with control sirna
(a) Schematic diagram of the FS mutation of UVRAG in exon 8 containing the highly instable
 Schematic diagram of the FS mutation of UVRAG in exon 8 containing the highly instable") Supplementary Figure 1. Frameshift (FS) mutation in UVRAG. (a) Schematic diagram of the FS mutation of UVRAG in exon 8 containing the highly instable A 10 DNA repeat, generating a premature stop codon
Supplementary Figure 1. Frameshift (FS) mutation in UVRAG. (a) Schematic diagram of the FS mutation of UVRAG in exon 8 containing the highly instable A 10 DNA repeat, generating a premature stop codon
Supplementary Information and Figure legends
 Supplementary Information and Figure legends Table S1. Primers for quantitative RT-PCR Target Sequence (5 -> 3 ) Target Sequence (5 -> 3 ) DAB2IP F:TGGACGATGTGCTCTATGCC R:GGATGGTGATGGTTTGGTAG Snail F:CCTCCCTGTCAGATGAGGAC
Supplementary Figure 1. Normal T lymphocyte populations in Dapk -/- mice. (a) Normal thymic development in Dapk -/- mice. Thymocytes from WT and Dapk
 Normal thymic development in Dapk -/- mice. Thymocytes from WT and Dapk") Supplementary Figure 1. Normal T lymphocyte populations in Dapk -/- mice. (a) Normal thymic development in Dapk -/- mice. Thymocytes from WT and Dapk -/- mice were stained for expression of CD4 and CD8.
Supplementary Figure 1. Normal T lymphocyte populations in Dapk -/- mice. (a) Normal thymic development in Dapk -/- mice. Thymocytes from WT and Dapk -/- mice were stained for expression of CD4 and CD8.
(a) Significant biological processes (upper panel) and disease biomarkers (lower panel)
 Significant biological processes (upper panel) and disease biomarkers (lower panel)") Supplementary Figure 1. Functional enrichment analyses of secretomic proteins. (a) Significant biological processes (upper panel) and disease biomarkers (lower panel) 2 involved by hrab37-mediated secretory
Supplementary Figure 1. Functional enrichment analyses of secretomic proteins. (a) Significant biological processes (upper panel) and disease biomarkers (lower panel) 2 involved by hrab37-mediated secretory
SUPPLEMENTARY INFORMATION
 DOI:.38/ncb2822 a MTC02 FAO cells EEA1 b +/+ MEFs /DAPI -/- MEFs /DAPI -/- MEFs //DAPI c HEK 293 cells WCE N M C P AKT TBC1D7 Lamin A/C EEA1 VDAC d HeLa cells WCE N M C P AKT Lamin A/C EEA1 VDAC Figure
Supplementary Figures
 Supplementary Figures Supplementary Figure 1 DOT1L regulates the expression of epithelial and mesenchymal markers. (a) The expression levels and cellular localizations of EMT markers were confirmed by
Type of file: PDF Size of file: 0 KB Title of file for HTML: Supplementary Information Description: Supplementary Figures
 Type of file: PDF Size of file: 0 KB Title of file for HTML: Supplementary Information Description: Supplementary Figures Supplementary Figure 1 mir-128-3p is highly expressed in chemoresistant, metastatic
hexahistidine tagged GRP78 devoid of the KDEL motif (GRP78-His) on SDS-PAGE. This
 on SDS-PAGE. This") SUPPLEMENTAL FIGURE LEGEND Fig. S1. Generation and characterization of. (A) Coomassie staining of soluble hexahistidine tagged GRP78 devoid of the KDEL motif (GRP78-His) on SDS-PAGE. This protein was expressed
SUPPLEMENTAL FIGURE LEGEND Fig. S1. Generation and characterization of. (A) Coomassie staining of soluble hexahistidine tagged GRP78 devoid of the KDEL motif (GRP78-His) on SDS-PAGE. This protein was expressed
m 6 A mrna methylation regulates AKT activity to promote the proliferation and tumorigenicity of endometrial cancer
 SUPPLEMENTARY INFORMATION Articles https://doi.org/10.1038/s41556-018-0174-4 In the format provided by the authors and unedited. m 6 A mrna methylation regulates AKT activity to promote the proliferation
Supplemental Table S1
 Supplemental Table S. Tumorigenicity and metastatic potential of 44SQ cell subpopulations a Tumorigenicity b Average tumor volume (mm ) c Lung metastasis d CD high /4 8. 8/ CD low /4 6./ a Mice were injected
Fang et al. NMuMG. PyVmT unstained Anti-CCR2-PE MDA-MB MCF MCF10A
 A NMuMG PyVmT 16.5+.5 47.+7.2 Fang et al. unstained Anti-CCR2-PE 4T1 Control 37.6+6.3 56.1+.65 MCF1A 16.1+3. MCF-7 3.1+5.4 MDA-M-231 42.1+5.5 unstained Secondary antibody only Anti-CCR2 SUPPLEMENTAL FIGURE
SUPPLEMENTARY INFORMATION
 DOI:.38/ncb3399 a b c d FSP DAPI 5mm mm 5mm 5mm e Correspond to melanoma in-situ Figure a DCT FSP- f MITF mm mm MlanaA melanoma in-situ DCT 5mm FSP- mm mm mm mm mm g melanoma in-situ MITF MlanaA mm mm
Supplementary Figure 1. The CagA-dependent wound healing or transwell migration of gastric cancer cell. AGS cells transfected with vector control or
 Supplementary Figure 1. The CagA-dependent wound healing or transwell migration of gastric cancer cell. AGS cells transfected with vector control or 3xflag-CagA expression vector were wounded using a pipette
Supplementary Fig. 1: ATM is phosphorylated in HER2 breast cancer cell lines. (A) ATM is phosphorylated in SKBR3 cells depending on ATM and HER2
 ATM is phosphorylated in SKBR3 cells depending on ATM and HER2") Supplementary Fig. 1: ATM is phosphorylated in HER2 breast cancer cell lines. (A) ATM is phosphorylated in SKBR3 cells depending on ATM and HER2 activity. Upper panel: Representative histograms for FACS
Supplementary Fig. 1: ATM is phosphorylated in HER2 breast cancer cell lines. (A) ATM is phosphorylated in SKBR3 cells depending on ATM and HER2 activity. Upper panel: Representative histograms for FACS
Supplementary Figure 1. MAT IIα is Acetylated at Lysine 81.
 IP: Flag a Mascot PTM Modified Mass Error Position Gene Names Score Score Sequence m/z [ppm] 81 MAT2A;AMS2;MATA2 35.6 137.28 _AAVDYQK(ac)VVR_ 595.83-2.28 b Pre-immu After-immu Flag- WT K81R WT K81R / Flag
SUPPLEMENTARY INFORMATION
 doi: 10.1038/nature05732 SUPPLEMENTARY INFORMATION Supplemental Data Supplement Figure Legends Figure S1. RIG-I 2CARD undergo robust ubiquitination a, (top) At 48 h posttransfection with a GST, GST-RIG-I-2CARD
Supplementary Figure 1: STAT3 suppresses Kras-induced lung tumorigenesis
 Supplementary Figure 1: STAT3 suppresses Kras-induced lung tumorigenesis (a) Immunohistochemical (IHC) analysis of tyrosine 705 phosphorylation status of STAT3 (P- STAT3) in tumors and stroma (all-time
Supplementary Figure 1. Characterization of NMuMG-ErbB2 and NIC breast cancer cells expressing shrnas targeting LPP. NMuMG-ErbB2 cells (a) and NIC
 and NIC") Supplementary Figure 1. Characterization of NMuMG-ErbB2 and NIC breast cancer cells expressing shrnas targeting LPP. NMuMG-ErbB2 cells (a) and NIC cells (b) were engineered to stably express either a LucA-shRNA
Supplementary Figure 1. Characterization of NMuMG-ErbB2 and NIC breast cancer cells expressing shrnas targeting LPP. NMuMG-ErbB2 cells (a) and NIC cells (b) were engineered to stably express either a LucA-shRNA
Supplemental Figure 1
 Supplemental Figure 1 1a 1c PD-1 MFI fold change 6 5 4 3 2 1 IL-1α IL-2 IL-4 IL-6 IL-1 IL-12 IL-13 IL-15 IL-17 IL-18 IL-21 IL-23 IFN-α Mut Human PD-1 promoter SBE-D 5 -GTCTG- -1.2kb SBE-P -CAGAC- -1.kb
Supplementary Figure 1 CD4 + T cells from PKC-θ null mice are defective in NF-κB activation during T cell receptor signaling. CD4 + T cells were
 Supplementary Figure 1 CD4 + T cells from PKC-θ null mice are defective in NF-κB activation during T cell receptor signaling. CD4 + T cells were isolated from wild type (PKC-θ- WT) or PKC-θ null (PKC-θ-KO)
Supplementary Figure 1. Prevalence of U539C and G540A nucleotide and E172K amino acid substitutions among H9N2 viruses. Full-length H9N2 NS
 Supplementary Figure 1. Prevalence of U539C and G540A nucleotide and E172K amino acid substitutions among H9N2 viruses. Full-length H9N2 NS nucleotide sequences (a, b) or amino acid sequences (c) from
(A) SW480, DLD1, RKO and HCT116 cells were treated with DMSO or XAV939 (5 µm)
 SW480, DLD1, RKO and HCT116 cells were treated with DMSO or XAV939 (5 µm)") Supplementary Figure Legends Figure S1. Tankyrase inhibition suppresses cell proliferation in an axin/β-catenin independent manner. (A) SW480, DLD1, RKO and HCT116 cells were treated with DMSO or XAV939
Supplementary Figure Legends Figure S1. Tankyrase inhibition suppresses cell proliferation in an axin/β-catenin independent manner. (A) SW480, DLD1, RKO and HCT116 cells were treated with DMSO or XAV939
SUPPLEMENTARY INFORMATION
 DOI: 10.1038/ncb3311 A B TSC2 -/- MEFs C Rapa Hours WCL 0 6 12 24 36 pakt.s473 AKT ps6k S6K CM IGF-1 Recipient WCL - + - + - + pigf-1r IGF-1R pakt ps6 AKT D 1 st SILAC 2 nd SILAC E GAPDH FGF21 ALKPGVIQILGVK
Supplementary Figure 1: si-craf but not si-braf sensitizes tumor cells to radiation.
 Supplementary Figure 1: si-craf but not si-braf sensitizes tumor cells to radiation. (a) Embryonic fibroblasts isolated from wildtype (WT), BRAF -/-, or CRAF -/- mice were irradiated (6 Gy) and DNA damage
Supplementary Figure 1. PD-L1 is glycosylated in cancer cells. (a) Western blot analysis of PD-L1 in breast cancer cells. (b) Western blot analysis
 Western blot analysis of PD-L1 in breast cancer cells. (b) Western blot analysis") Supplementary Figure 1. PD-L1 is glycosylated in cancer cells. (a) Western blot analysis of PD-L1 in breast cancer cells. (b) Western blot analysis of PD-L1 in ovarian cancer cells. (c) Western blot analysis
Supplementary Figure 1. PD-L1 is glycosylated in cancer cells. (a) Western blot analysis of PD-L1 in breast cancer cells. (b) Western blot analysis of PD-L1 in ovarian cancer cells. (c) Western blot analysis
Supplementary Figure S1 Expression of mir-181b in EOC (A) Kaplan-Meier
 Kaplan-Meier") Supplementary Figure S1 Expression of mir-181b in EOC (A) Kaplan-Meier curves for progression-free survival (PFS) and overall survival (OS) in a cohort of patients (N=52) with stage III primary ovarian
Supplementary Figure S1 Expression of mir-181b in EOC (A) Kaplan-Meier curves for progression-free survival (PFS) and overall survival (OS) in a cohort of patients (N=52) with stage III primary ovarian
Supplementary Figure 1 Induction of cellular senescence and isolation of exosome. a to c, Pre-senescent primary normal human diploid fibroblasts
 Supplementary Figure 1 Induction of cellular senescence and isolation of exosome. a to c, Pre-senescent primary normal human diploid fibroblasts (TIG-3 cells) were rendered senescent by either serial passage
Predictive PP1Ca binding region in BIG3 : 1,228 1,232aa (-KAVSF-) HEK293T cells *** *** *** KPL-3C cells - E E2 treatment time (h)
 HEK293T cells *** *** *** KPL-3C cells - E E2 treatment time (h)") Relative expression ERE-luciferase activity activity (pmole/min) activity (pmole/min) activity (pmole/min) activity (pmole/min) MCF-7 KPL-3C ZR--1 BT-474 T47D HCC15 KPL-1 HBC4 activity (pmole/min) a d
Relative expression ERE-luciferase activity activity (pmole/min) activity (pmole/min) activity (pmole/min) activity (pmole/min) MCF-7 KPL-3C ZR--1 BT-474 T47D HCC15 KPL-1 HBC4 activity (pmole/min) a d
SUPPLEMENTARY INFORMATION
 doi:10.1038/nature12652 Supplementary Figure 1. PRDM16 interacts with endogenous EHMT1 in brown adipocytes. Immunoprecipitation of PRDM16 complex by flag antibody (M2) followed by Western blot analysis
SUPPLEMENTARY INFORMATION
 DOI: 10.1038/ncb3073 LATS2 Binding ability to SIAH2 Degradation by SIAH2 1-160 161-402 403-480 -/ 481-666 1-666 - - 667-1088 -/ 1-0 Supplementary Figure 1 Schematic drawing of LATS2 deletion mutants and
Supplementary Fig. 1. GPRC5A post-transcriptionally down-regulates EGFR expression. (a) Plot of the changes in steady state mrna levels versus
 Plot of the changes in steady state mrna levels versus") Supplementary Fig. 1. GPRC5A post-transcriptionally down-regulates EGFR expression. (a) Plot of the changes in steady state mrna levels versus changes in corresponding proteins between wild type and Gprc5a-/-
Supplementary Fig. 1. GPRC5A post-transcriptionally down-regulates EGFR expression. (a) Plot of the changes in steady state mrna levels versus changes in corresponding proteins between wild type and Gprc5a-/-
SUPPLEMENTARY INFORMATION
 DOI: 10.1038/ncb3461 In the format provided by the authors and unedited. Supplementary Figure 1 (associated to Figure 1). Cpeb4 gene-targeted mice develop liver steatosis. a, Immunoblot displaying CPEB4
S1a S1b S1c. S1d. S1f S1g S1h SUPPLEMENTARY FIGURE 1. - si sc Il17rd Il17ra bp. rig/s IL-17RD (ng) -100 IL-17RD
 -100 IL-17RD") SUPPLEMENTARY FIGURE 1 0 20 50 80 100 IL-17RD (ng) S1a S1b S1c IL-17RD β-actin kda S1d - si sc Il17rd Il17ra rig/s15-574 - 458-361 bp S1f S1g S1h S1i S1j Supplementary Figure 1. Knockdown of IL-17RD enhances
SUPPLEMENTARY FIGURE 1 0 20 50 80 100 IL-17RD (ng) S1a S1b S1c IL-17RD β-actin kda S1d - si sc Il17rd Il17ra rig/s15-574 - 458-361 bp S1f S1g S1h S1i S1j Supplementary Figure 1. Knockdown of IL-17RD enhances
Supplementary Figure 1
 Supplementary Figure 1 YAP negatively regulates IFN- signaling. (a) Immunoblot analysis of Yap knockdown efficiency with sh-yap (#1 to #4 independent constructs) in Raw264.7 cells. (b) IFN- -Luc and PRDs
Supplementary information. MARCH8 inhibits HIV-1 infection by reducing virion incorporation of envelope glycoproteins
 Supplementary information inhibits HIV-1 infection by reducing virion incorporation of envelope glycoproteins Takuya Tada, Yanzhao Zhang, Takayoshi Koyama, Minoru Tobiume, Yasuko Tsunetsugu-Yokota, Shoji
Supplementary Figures
 Supplementary Figures Supplementary Figure 1 Characterization of stable expression of GlucB and sshbira in the CT26 cell line (a) Live cell imaging of stable CT26 cells expressing green fluorescent protein
SUPPLEMENTARY INFORMATION. Supplementary Figures S1-S9. Supplementary Methods
 SUPPLEMENTARY INFORMATION SUMO1 modification of PTEN regulates tumorigenesis by controlling its association with the plasma membrane Jian Huang 1,2#, Jie Yan 1,2#, Jian Zhang 3#, Shiguo Zhu 1, Yanli Wang
Supplementary Figure (OH) 22 nanoparticles did not affect cell viability and apoposis. MDA-MB-231, MCF-7, MCF-10A and BT549 cells were
 22 nanoparticles did not affect cell viability and apoposis. MDA-MB-231, MCF-7, MCF-10A and BT549 cells were") Supplementary Figure 1. Gd@C 82 (OH) 22 nanoparticles did not affect cell viability and apoposis. MDA-MB-231, MCF-7, MCF-10A and BT549 cells were treated with PBS, Gd@C 82 (OH) 22, C 60 (OH) 22 or GdCl
Supplementary Figure 1. Gd@C 82 (OH) 22 nanoparticles did not affect cell viability and apoposis. MDA-MB-231, MCF-7, MCF-10A and BT549 cells were treated with PBS, Gd@C 82 (OH) 22, C 60 (OH) 22 or GdCl
Supplementary Figure 1
 A B D Relative TAp73 mrna p73 Supplementary Figure 1 25 2 15 1 5 p63 _-tub. MDA-468 HCC1143 HCC38 SUM149 MDA-468 HCC1143 HCC38 SUM149 HCC-1937 MDA-MB-468 ΔNp63_ TAp73_ TAp73β E C Relative ΔNp63 mrna TAp73
Supplementary Material
 Supplementary Material Summary: The supplementary information includes 1 table (Table S1) and 4 figures (Figure S1 to S4). Supplementary Figure Legends Figure S1 RTL-bearing nude mouse model. (A) Tumor
Supplementary Materials for
 www.sciencesignaling.org/cgi/content/full/9/439/ra78/dc1 Supplementary Materials for Small heterodimer partner mediates liver X receptor (LXR) dependent suppression of inflammatory signaling by promoting
supplementary information
 DOI: 10.1038/ncb2153 Figure S1 Ectopic expression of HAUSP up-regulates REST protein. (a) Immunoblotting showed that ectopic expression of HAUSP increased REST protein levels in ENStemA NPCs. (b) Immunofluorescent
Supplementary Materials for
 www.sciencesignaling.org/cgi/content/full/6/283/ra57/dc1 Supplementary Materials for JNK3 Couples the Neuronal Stress Response to Inhibition of Secretory Trafficking Guang Yang,* Xun Zhou, Jingyan Zhu,
condition. Left panel, the HCT-116 cells were lysed with RIPA buffer containing 0.1%
 FIGURE LEGENDS Supplementary Fig 1 (A) sumoylation pattern detected under denaturing condition. Left panel, the HCT-116 cells were lysed with RIPA buffer containing 0.1% SDS in the presence and absence
HIF-inducible mir-191 promotes migration in breast cancer through complex regulation of TGFβ-signaling in hypoxic microenvironment.
 HIF-inducible mir-9 promotes migration in breast cancer through complex regulation of TGFβ-signaling in hypoxic microenvironment. Neha Nagpal, Hafiz M Ahmad, Shibu Chameettachal3, Durai Sundar, Sourabh
Supplementary Figure 1. A. Bar graph representing the expression levels of the 19 indicated genes in the microarrays analyses comparing human lung
 Supplementary Figure 1. A. Bar graph representing the expression levels of the 19 indicated genes in the microarrays analyses comparing human lung immortalized broncho-epithelial cells (AALE cells) expressing
(A) Dose response curves of HMLE_shGFP (blue circle), HMLE_shEcad (red square),
 Dose response curves of HMLE_shGFP (blue circle), HMLE_shEcad (red square),") Supplementary Figures and Tables Figure S1. Validation of EMT-selective small molecules (A) Dose response curves of HMLE_shGFP (blue circle), HMLE_shEcad (red square), and HMLE_Twist (black diamond) cells
Supplementary Figures and Tables Figure S1. Validation of EMT-selective small molecules (A) Dose response curves of HMLE_shGFP (blue circle), HMLE_shEcad (red square), and HMLE_Twist (black diamond) cells
SUPPLEMENTARY INFORMATION
 DOI: 10.1038/ncb3021 Supplementary figure 1 Characterisation of TIMPless fibroblasts. a) Relative gene expression of TIMPs1-4 by real time quantitative PCR (RT-qPCR) in WT or ΔTimp fibroblasts (mean ±
SUPPLEMENTARY INFORMATION
 SUPPLEMENTARY INFORMATION doi:10.1038/nature11429 S1a 6 7 8 9 Nlrc4 allele S1b Nlrc4 +/+ Nlrc4 +/F Nlrc4 F/F 9 Targeting construct 422 bp 273 bp FRT-neo-gb-PGK-FRT 3x.STOP S1c Nlrc4 +/+ Nlrc4 F/F casp1
SUPPLEMENTARY FIGURES AND TABLES
 SUPPLEMENTARY FIGURES AND TABLES Supplementary Figure S1: CaSR expression in neuroblastoma models. A. Proteins were isolated from three neuroblastoma cell lines and from the liver metastasis of a MYCN-non
ANGPTL2 increases bone metastasis of breast cancer cells through. Tetsuro Masuda, Motoyoshi Endo, Yutaka Yamamoto, Haruki Odagiri, Tsuyoshi
 Masuda et al. Supplementary information for ANGPTL2 increases bone metastasis of breast cancer cells through enhancing CXCR4 signaling Tetsuro Masuda, Motoyoshi Endo, Yutaka Yamamoto, Haruki Odagiri, Tsuyoshi
SUPPLEMENTARY INFORMATION
 -. -. SUPPLEMENTARY INFORMATION DOI: 1.1/ncb86 a WAT-1 WAT- BAT-1 BAT- sk-muscle-1 sk-muscle- mir-133b mir-133a mir-6 mir-378 mir-1 mir-85 mir-378 mir-6a mir-18 mir-133a mir- mir- mir-341 mir-196a mir-17
Supplementary Table S1. Tumor samples used for analysis Tumor size (cm) BNG (grade) ERα PR. pn-
 BNG (grade) ERα PR. pn-") Supplementary Table S1. Tumor samples used for analysis Sample# Age Tumor size (cm) pn- Stage Stage BNG (grade) ERα PR HER2 (FISH) Triple negative T1 46 3 N1a III 2 Pos Neg N T2 58 1 N(i-) I 3 Pos Neg
Supplementary Table S1. Tumor samples used for analysis Sample# Age Tumor size (cm) pn- Stage Stage BNG (grade) ERα PR HER2 (FISH) Triple negative T1 46 3 N1a III 2 Pos Neg N T2 58 1 N(i-) I 3 Pos Neg
Supplemental information
 Carcinoemryonic antigen-related cell adhesion molecule 6 (CEACAM6) promotes EGF receptor signaling of oral squamous cell carcinoma metastasis via the complex N-glycosylation y Chiang et al. Supplemental
7SK ChIRP-seq is specifically RNA dependent and conserved between mice and humans.
 Supplementary Figure 1 7SK ChIRP-seq is specifically RNA dependent and conserved between mice and humans. Regions targeted by the Even and Odd ChIRP probes mapped to a secondary structure model 56 of the
File Name: Supplementary Information Description: Supplementary Figures and Supplementary Tables. File Name: Peer Review File Description:
 File Name: Supplementary Information Description: Supplementary Figures and Supplementary Tables File Name: Peer Review File Description: Primer Name Sequence (5'-3') AT ( C) RT-PCR USP21 F 5'-TTCCCATGGCTCCTTCCACATGAT-3'
(A) RT-PCR for components of the Shh/Gli pathway in normal fetus cell (MRC-5) and a
 RT-PCR for components of the Shh/Gli pathway in normal fetus cell (MRC-5) and a") Supplementary figure legends Supplementary Figure 1. Expression of Shh signaling components in a panel of gastric cancer. (A) RT-PCR for components of the Shh/Gli pathway in normal fetus cell (MRC-5) and
Supplementary figure legends Supplementary Figure 1. Expression of Shh signaling components in a panel of gastric cancer. (A) RT-PCR for components of the Shh/Gli pathway in normal fetus cell (MRC-5) and
Supplemental Figure 1. Western blot analysis indicated that MIF was detected in the fractions of
 Supplemental Figure Legends Supplemental Figure 1. Western blot analysis indicated that was detected in the fractions of plasma membrane and cytosol but not in nuclear fraction isolated from Pkd1 null
EPIGENETIC RE-EXPRESSION OF HIF-2α SUPPRESSES SOFT TISSUE SARCOMA GROWTH
 EPIGENETIC RE-EXPRESSION OF HIF-2α SUPPRESSES SOFT TISSUE SARCOMA GROWTH Supplementary Figure 1. Supplementary Figure 1. Characterization of KP and KPH2 autochthonous UPS tumors. a) Genotyping of KPH2
SUPPLEMENTARY INFORMATION
 Supplementary Table 1. Cell sphingolipids and S1P bound to endogenous TRAF2. Sphingolipid Cell pmol/mg TRAF2 immunoprecipitate pmol/mg Sphingomyelin 4200 ± 250 Not detected Monohexosylceramide 311 ± 18
Supplementary Figure S1 Supplementary Figure S2
 Supplementary Figure S A) The blots shown in Figure B were qualified by using Gel-Pro analyzer software (Rockville, MD, USA). The ratio of LC3II/LC3I to actin was then calculated. The data are represented
p47 negatively regulates IKK activation by inducing the lysosomal degradation of polyubiquitinated NEMO
 Supplementary Information p47 negatively regulates IKK activation by inducing the lysosomal degradation of polyubiquitinated NEMO Yuri Shibata, Masaaki Oyama, Hiroko Kozuka-Hata, Xiao Han, Yuetsu Tanaka,
An epithelial-to-mesenchymal transition-inducing potential of. granulocyte macrophage colony-stimulating factor in colon. cancer
 An epithelial-to-mesenchymal transition-inducing potential of granulocyte macrophage colony-stimulating factor in colon cancer Yaqiong Chen, Zhi Zhao, Yu Chen, Zhonglin Lv, Xin Ding, Renxi Wang, He Xiao,
HEK293FT cells were transiently transfected with reporters, N3-ICD construct and
 Supplementary Information Luciferase reporter assay HEK293FT cells were transiently transfected with reporters, N3-ICD construct and increased amounts of wild type or kinase inactive EGFR. Transfections
Stewart et al. CD36 ligands promote sterile inflammation through assembly of a TLR 4 and 6 heterodimer
 NFκB (fold induction) Stewart et al. ligands promote sterile inflammation through assembly of a TLR 4 and 6 heterodimer a. mrna (fold induction) 5 4 3 2 1 LDL oxldl Gro1a MIP-2 RANTES mrna (fold induction)
Supplementary Figure 1
 Supplementary Figure 1 3 3 3 1 1 Bregma -1.6mm 3 : Bregma Ref) Http://www.mbl.org/atlas165/atlas165_start.html Bregma -.18mm Supplementary Figure 1 Schematic representation of the utilized brain slice
Supplemental Figure 1
 mrn/ mirn expression 3.5 3.5.5.5 +Jagged mir-5+jagged Supplemental Figure HS mir-5 Z H HS mir-5 Z H HS mir-5 Z H HM MF PT HM JG HS Percentage of 4-44 + cells (%) mrn/mirn 8 6 4.5.5.5 mir-5 sh-jg +Jagged
Supplemental Information. NRF2 Is a Major Target of ARF. in p53-independent Tumor Suppression
 Molecular Cell, Volume 68 Supplemental Information NRF2 Is a Major Target of ARF in p53-independent Tumor Suppression Delin Chen, Omid Tavana, Bo Chu, Luke Erber, Yue Chen, Richard Baer, and Wei Gu Figure
Supplementary Materials for
 www.sciencesignaling.org/cgi/content/full/7/310/ra11/dc1 Supplementary Materials for STAT3 Induction of mir-146b Forms a Feedback Loop to Inhibit the NF-κB to IL-6 Signaling Axis and STAT3-Driven Cancer
SUPPLEMENTARY FIGURES
 SUPPLEMENTARY FIGURES Figure S1. Clinical significance of ZNF322A overexpression in Caucasian lung cancer patients. (A) Representative immunohistochemistry images of ZNF322A protein expression in tissue
Supplemental Figure 1. Isolation and characterization of CD133+ neurosphere-like
 SUPPLEMENTL FIGURE LEGENDS Supplemental Figure 1. Isolation and characterization of CD133+ neurosphere-like spheroids from a human brain tumor sample or glioma xenograft. () CD133+ tumor cells isolated
SUPPLEMENTARY INFORMATION
 DOI: 10.1038/ncb2566 Figure S1 CDKL5 protein expression pattern and localization in mouse brain. (a) Multiple-tissue western blot from a postnatal day (P) 21 mouse probed with an antibody against CDKL5.
Supplementary Materials for
 www.sciencesignaling.org/cgi/content/full/8/407/ra127/dc1 Supplementary Materials for Loss of FTO in adipose tissue decreases Angptl4 translation and alters triglyceride metabolism Chao-Yung Wang,* Shian-Sen
18s AAACGGCTACCACATCCAAG CCTCCAATGGATCCTCGTTA. 36b4 GTTCTTGCCCATCAGCACC AGATGCAGCAGATCCGCAT. Acc1 AGCAGATCCGCAGCTTG ACCTCTGCTCGCTGAGTGC
 Supplementary Table 1. Quantitative PCR primer sequences Gene symbol Sequences (5 to 3 ) Forward Reverse 18s AAACGGCTACCACATCCAAG CCTCCAATGGATCCTCGTTA 36b4 GTTCTTGCCCATCAGCACC AGATGCAGCAGATCCGCAT Acc1
Supplementary Information
 Supplementary Information Supplementary Figure 1. EBV-gB 23-431 mainly exists as trimer in HEK 293FT cells. (a) Western blotting analysis for DSS crosslinked FLAG-gB 23-431. HEK 293FT cells transfected
p.r623c p.p976l p.d2847fs p.t2671 p.d2847fs p.r2922w p.r2370h p.c1201y p.a868v p.s952* RING_C BP PHD Cbp HAT_KAT11
 ARID2 p.r623c KMT2D p.v650fs p.p976l p.r2922w p.l1212r p.d1400h DNA binding RFX DNA binding Zinc finger KMT2C p.a51s p.d372v p.c1103* p.d2847fs p.t2671 p.d2847fs p.r4586h PHD/ RING DHHC/ PHD PHD FYR N
Supplementary Figure 1
 Supplementary Figure 1 Dox Cis Cam Pac 0 15 1 15 1 15 1 15 1 15 µmole/l Ub p53 Cytotoxic anticancer agents increase p53 levels but do not generally promote the accumulation of ubiquitinated. Western blots
(A) Cells grown in monolayer were fixed and stained for surfactant protein-c (SPC,
 Cells grown in monolayer were fixed and stained for surfactant protein-c (SPC,") Supplemental Figure Legends Figure S1. Cell line characterization (A) Cells grown in monolayer were fixed and stained for surfactant protein-c (SPC, green) and co-stained with DAPI to visualize the nuclei.
Supplemental Figure Legends Figure S1. Cell line characterization (A) Cells grown in monolayer were fixed and stained for surfactant protein-c (SPC, green) and co-stained with DAPI to visualize the nuclei.
A. Generation and characterization of Ras-expressing autophagycompetent
 Supplemental Material Supplemental Figure Legends Fig. S1 A. Generation and characterization of Ras-expressing autophagycompetent and -deficient cell lines. HA-tagged H-ras V12 was stably expressed in
SUPPLEMENTARY INFORMATION
 DOI: 1.138/ncb222 / b. WB anti- WB anti- ulin Mitotic index (%) 14 1 6 2 T (h) 32 48-1 1 2 3 4 6-1 4 16 22 28 3 33 e. 6 4 2 Time (min) 1-6- 11-1 > 1 % cells Figure S1 depletion leads to mitotic defects
c Ischemia (30 min) Reperfusion (8 w) Supplementary Figure bp 300 bp Ischemia (30 min) Reperfusion (4 h) Dox 20 mg/kg i.p.
 Reperfusion (8 w) Supplementary Figure bp 300 bp Ischemia (30 min) Reperfusion (4 h) Dox 20 mg/kg i.p.") a Marker Ripk3 +/ 5 bp 3 bp b Ischemia (3 min) Reperfusion (4 h) d 2 mg/kg i.p. 1 w 5 w Sacrifice for IF size A subset for echocardiography and morphological analysis c Ischemia (3 min) Reperfusion (8
a Marker Ripk3 +/ 5 bp 3 bp b Ischemia (3 min) Reperfusion (4 h) d 2 mg/kg i.p. 1 w 5 w Sacrifice for IF size A subset for echocardiography and morphological analysis c Ischemia (3 min) Reperfusion (8
injected subcutaneously into flanks of 6-8 week old athymic male nude mice (LNCaP SQ) and body
 and body") SUPPLEMENTAL FIGURE LEGENDS Figure S1: Generation of ENZR Xenografts and Cell Lines: (A) 1x10 6 LNCaP cells in matrigel were injected subcutaneously into flanks of 6-8 week old athymic male nude mice (LNCaP
SUPPLEMENTAL FIGURE LEGENDS Figure S1: Generation of ENZR Xenografts and Cell Lines: (A) 1x10 6 LNCaP cells in matrigel were injected subcutaneously into flanks of 6-8 week old athymic male nude mice (LNCaP
Supplementary Figure 1. Characterization of ALDH-positive cell population in MCF-7 cells. (a) Expression level of stem cell markers in MCF-7 cells or
 Expression level of stem cell markers in MCF-7 cells or") Supplementary Figure 1. Characterization of ALDH-positive cell population in MCF-7 cells. (a) Expression level of stem cell markers in MCF-7 cells or ALDH-positive cell population by qpcr. Data represent
Supplementary Figure 1. Characterization of ALDH-positive cell population in MCF-7 cells. (a) Expression level of stem cell markers in MCF-7 cells or ALDH-positive cell population by qpcr. Data represent
Prolonged mitotic arrest induces a caspase-dependent DNA damage
 SUPPLEMENTARY INFORMATION Prolonged mitotic arrest induces a caspase-dependent DNA damage response at telomeres that determines cell survival Karolina O. Hain, Didier J. Colin, Shubhra Rastogi, Lindsey
SUPPLEMENTARY FIGURE LEGENDS
 SUPPLEMENTARY FIGURE LEGENDS Supplementary Figure 1. Hippocampal sections from new-born Pten+/+ and PtenFV/FV pups were stained with haematoxylin and eosin (H&E) and were imaged at (a) low and (b) high
SUPPLEMENTAL EXPERIMENTAL PROCEDURES
 SUPPLEMENTAL EXPERIMENTAL PROCEDURES Crystal violet assay Cells were seeded in 24-well plates and cultured in media supplemented with % FBS for 7 days. Media were then removed, plates were briefly washed