7SK ChIRP-seq is specifically RNA dependent and conserved between mice and humans.
|
|
|
- Reginald Montgomery
- 5 years ago
- Views:
Transcription

1 Supplementary Figure 1 7SK ChIRP-seq is specifically RNA dependent and conserved between mice and humans. Regions targeted by the Even and Odd ChIRP probes mapped to a secondary structure model 56 of the 7SK snrna. The Even and Odd probes each independently cover the full length of the RNA. b, qrt-pcr analysis of RNA enriched from mouse ES cell 7SK ChIRP-seq. Chromatin samples were first treated with (+RNase) or without (-RNase) and recovery of 7SK snrna, 18S rrna, U1 snrna, Malat1, Neat1, β-actin, Gapdh, snora16a, snora44, and snord99 were assessed. Data are mean and s.d. of biological duplicate experiments.
2 c, Scaled metagene analysis of 7SK ChIRP-seq (red) and Pol II ChIP-seq (black) enrichment at actively transcribed mouse ES genes. d, 7SK ChIRP-qPCR analysis from mouse ES cell. Data are mean and s.d. of biological duplicate experiments. e, 7SK ChIRP-seq reads mapped to the 13kb transcribed region of the mouse ribosomal DNA (rdna) locus (GeneBank ID: U ). The 18S (red) 5.8S (green) and 28S (blue) regions are highlighted. The percentage of reads mapping to the rdna locus is shown for the Odd, Even, and Input experiments. f, qrt-pcr analysis of RNA enriched from human H1 ES cell and HeLa 7SK ChIRP-seq. Chromatin samples were first treated with (+RNase) or without (-RNase) and recovery of human 7SK snrna and human 18S rrna were assessed. g, Number and classification (genic or distal) of ChIRP-seq peaks called from the three cell types examine are shown. In total 6,452, 5,512, and 12,006 7SK ChIRP-seq peaks were identified in H1, HeLa, and mouse ES cells. h, Scaled metagene analysis of 7SK ChIRP-seq from mouse ES (red), human ES (turquoise), and HeLa (green) cells. The upstream and downstream 1kb relative to the TSS and TTS, respectively, are shown. Gene bodies for each individual gene are scaled to the same length and average ChIRP-seq signal is plotted. i, Metagene analysis of 7SK ChIRP-seq in H1, HeLa, and mouse ES cells centered at active enhancer elements +/- 2kb.
3
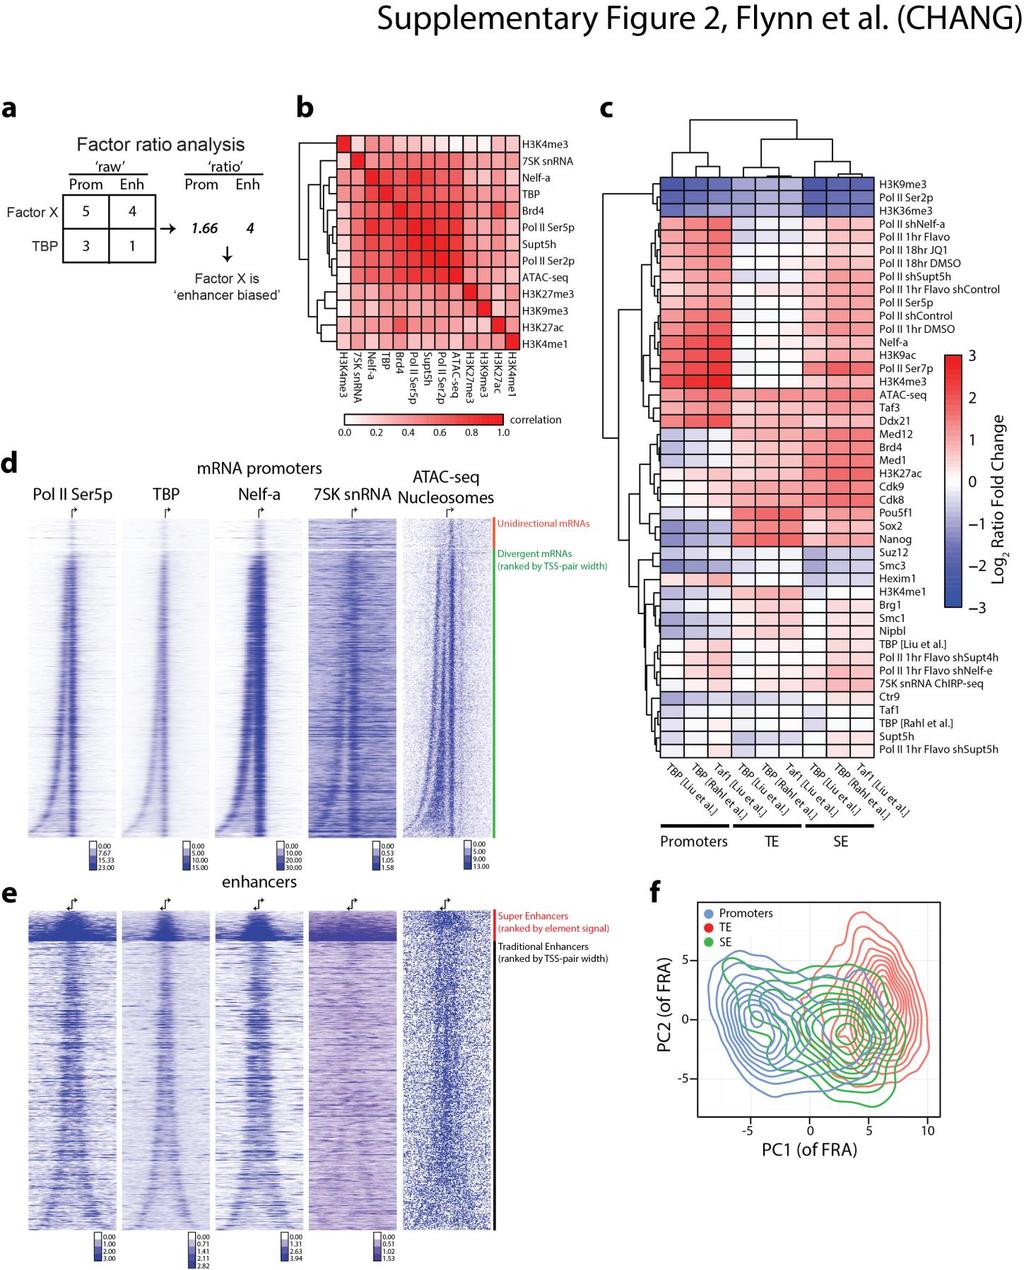
4 Supplementary Figure 2 Factor ratio analysis relative to transcription initiation reveals promoter and enhancer differences. a, Mock example of how the factor ratio analysis is calculated for a given value of Factor X and TBP at a promoter and enhancer. b, Genome-wide correlation of ChIP-seq (13 factors), 7SK ChIRP-seq, and ATAC-seq datasets (Supplementary Table 7). 7SK clusters with factors marking active transcription. c, Extended factor ratio analysis of 41 ChIP-seq, 7SK ChIRP-seq, and ATAC-seq datasets (Supplementary Table 7). Log 2 fold change over TBP 54, TBP 55, or TAF1 55 ChIP-seq are shown from -2 (blue) to +2 (red). d, Heat maps of the 14,234 mrna promoters called using Start-seq data 31, sorted by the TSS-pair width, and oriented with the gene on the right. ChIP-seq signal for Pol II Ser5p, TBP, Nelf-a, ChIRP-seq signal of 7SK, and ATAC-seq is shown. e, Heat maps of the 361 individual SE peaks and 5356 TE regions containing Start-seq signal sorted by the total signal in each region (SE) or the TSS-pair width (TE). ChIP-seq and ChIRP-seq signal is as in (d). f, Principal component analysis using the datasets in (b) to classify promoters, SE, and TE.
5 Supplementary Figure 3 7SK depletion affects promoter and enhancer transcription differently. a, qrt-pcr analysis of 7SK snrna expression levels in mouse ES cells treated with ASOs. Levels are shown as a fraction of control knockdown cells and normalized to 18S rrna levels. Data are mean and s.d. of biological duplicate experiments. b,c, Volcano plot analysis of all promoters (b) and enhancers (c) with significant (FDR < 0.1) increased (red) or decreased (blue) GRO-seq after 7SK depletion. Quantification was performed to capture the area under the curve of change for each type of element: with promoters focusing on
6 the canonical Pol II paused region and enhancers focusing on the bidirectional region of transcription. d, Volcano plot analysis of all enhancers with significant (FDR < 0.1) increased (red) or decreased (blue) H3K36me3 ChIP-seq after 7SK depletion. e,f, GREAT analysis 57 of enhancer elements that gained significant GRO-seq (e) or H3K36me3 ChIP-seq (f) signal. The top 4 enriched terms are shown.
7 Supplementary Figure 4 Convergent transcription is gated by 7SK.
8 a, Schematic of GRO-seq emanating from two proximal TSS-pairs that would generate ConvT signal in the red highlighted area. b, Fold enrichment of convergent transcription (observed/expected) as determined by GROseq at promoters, SE, TE, Ctcf ChIP-seq peaks, and random genomic regions (Ten thousand, 2kb regions were randomly chosen from the genome 1,000 times. Each time, we calculate the Obs/Exp ratio of 100bp blocks that have higher than the mean CT). Specific enrichment values are noted above each bar. c, Comparison of ConvT levels at promoters, SE, and TE after 7SK depletion. Boxes represent 25 th and 75 th percentile and median values are plotted. K-S test *, p = 4.7x10⁻¹¹, **, p < 2.2x d, Comparison of the GRO-seq read density (log 2, x-axis) and the change in convergent transcription after 7SK ASO (Fold Change 7SK ASO/Control ASO, log 2, y-axis). Values for all promoters (black), SE (blue), and TE (orange) are shown. e, Measurement of the distance between ATAC-seq peaks located within SE (green line) or TE (red line). f, Distribution of ConvT levels at the 2916 intergenic TE and 2319 intragenic TE elements. P value determined with K-S test of the difference between intergenic and intragenic TE. g, Comparison of γ-h2ax levels at promoters, SE, and TE after 7SK depletion. Boxes represent 25 th and 75 th percentile and median values are plotted. K-S test *, p = 1.7x10⁻⁸, **, p < 2.2x10⁻¹⁶.
9 Supplementary Figure 5 BAF and Hexim P-TEFb exist as two separate complexes, and 7SK does not modulate histone occupancy at promoters or enhancers. a, Co-IP study of the Hexim1 protein. Recovery of Hexim1, Arid1a, and Brg1 was determined via western blot in biological triplicate. b, Native RNA immunoprecipitation (RIP) qrt-pcr of Arid1a (BAF) or Hexim1 from mouse ES cells. Data are mean and s.d. of biological duplicate experiments. c,d, ChIP-seq analysis of pan-h3 occupancy changes due to 7SK loss at enhancers (c) and promoters (d). The Log 2 fold change (ASO/Scr) is shown, with significantly changed (FDR < 0.1). No elements were significantly changed in the H3 ChIP-seq experiment across two independent biological replicates.
10
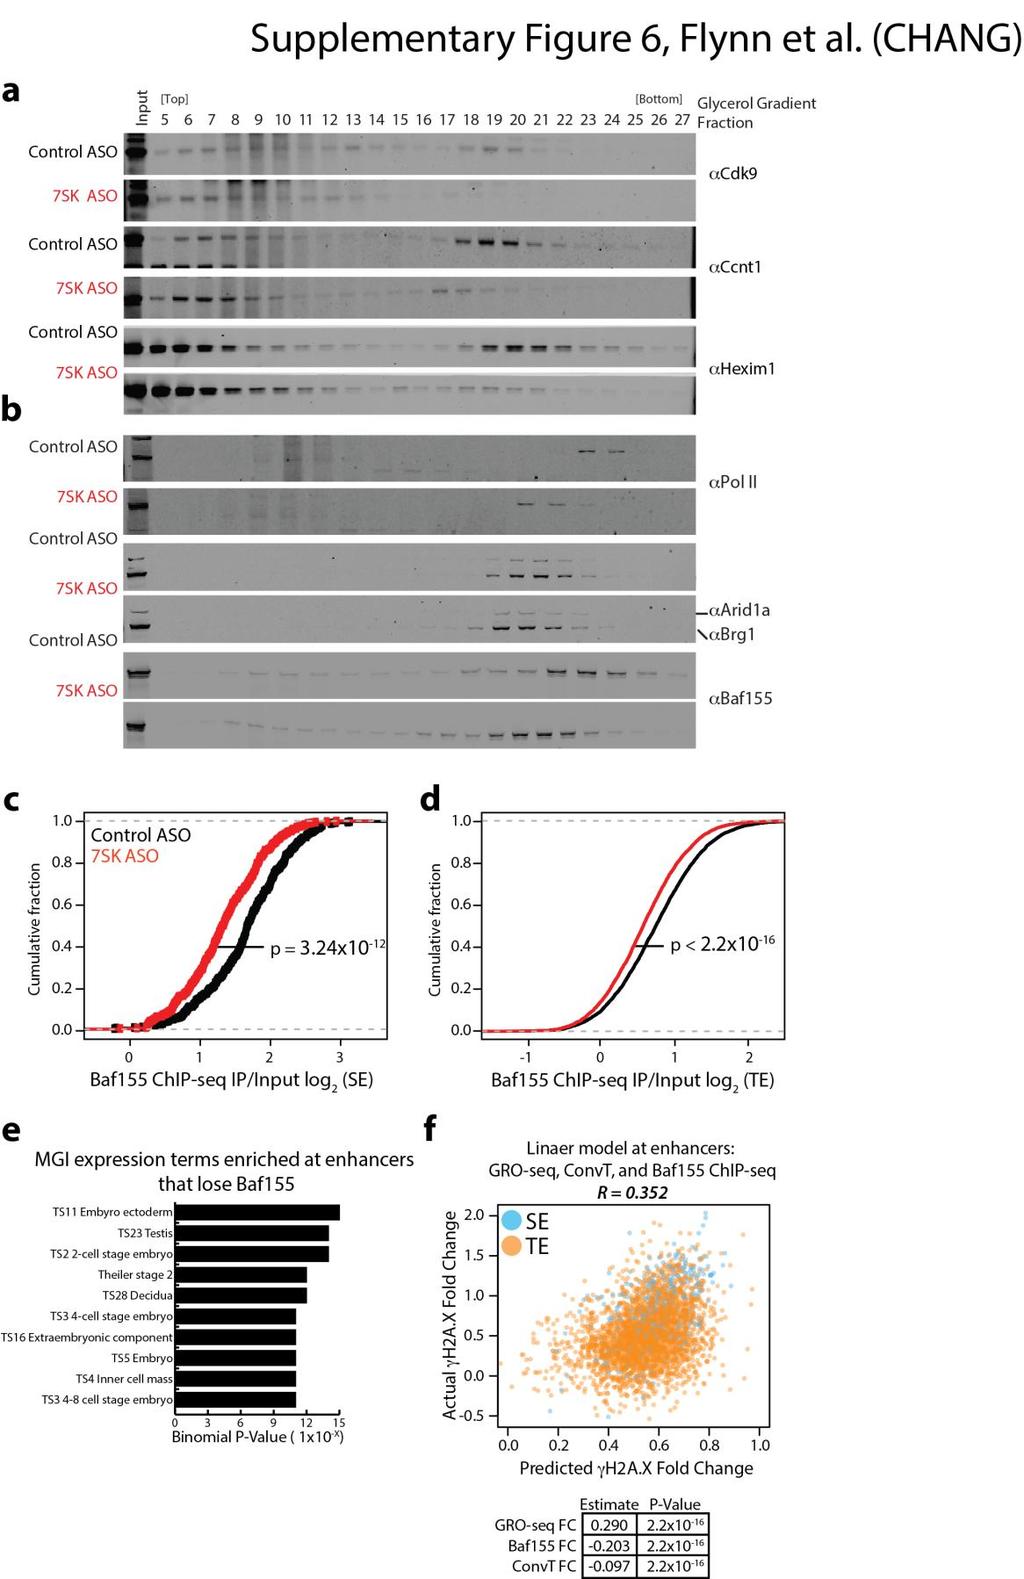
11 Supplementary Figure 6 Depletion of 7SK causes defects in BAF-chromatin association. a,b, Glycerol gradient analysis of Control (black) or 7SK ASO (red) treated mes cells % glycerol gradients were prepared and 30 fractions were isolated from the top followed by western blot analysis. Canonical 7SK snrnp members (a) and Pol II or BAF subunits (b) are blotted. Shown are representative results of two independent experiments. c,d, Cumulative distribution function plot of Baf155 ChIP-seq enrichment values at SE (c) and TE (d). e, GREAT analysis 57 of enhancer elements that lost significant Baf155 ChIP-seq. The top 10 enriched terms are shown. f, Scatter plot (top) and individual contribution estimates (bottom) of three features (GRO-seq, Baf155 ChIP-seq, and ConvT) used in a multivariate linear model (Online Methods) that predicted the changes in γ-h2ax ChIP-seq signal after 7SK depletion.
12 Supplementary Figure 7 Binding of Pou5f1 and Sox2 is globally modulated by 7SK snrna. a, UCSC genome browser view of the sox2 locus with a proximal SE peak, marked with a pink bar. ChIP-seq
13 of Pou5f1 in control (black) or 7SK (red) ASO treated mouse ES cells, 7SK ChIRP-seq (orange) and ATAC-seq open chromatin (blue) are shown. b,c, Metagene analysis of Pou5f1 ChIP-seq at all enhancer elements (b) or promoters (c) in a +/-1kb window in mouse ES cells treated with control (black) or 7SK (red) ASOs. d,e, Cumulative distribution function plot of Pou5f1 ChIP-seq enrichment values at SE (d) and TE (e) elements. P- values were calculated with the K-S test. f, Transcription factor footprinting call scores from the PIQ algorithm ranked by footprint purity score 47. Scores for Ctcf (black), Pou5f1 (blue), and Sox2 (orange) are shown. g,h, Boxplot of Pou5f1, Sox2 (g) and Ctcf (h) footprint scores measured from ATAC-seq data with the PIQ algorithm. Samples treated with control or 7SK ASOs are shown as black and red, respectively.
14 Supplementary Figure 8 JQ1 alters 7SK-chromatin association independently of Pol II. a, qrt-pcr analysis of RNA enriched from mouse ES cell 7SK ChIRP-seq and the recovery of 7SK snrna and 18S rrna was assessed. b, qrt-pcr analysis of mouse ES cells treated with 500nM JQ1 for up to 6 hours. mrna expression levels were normalized to DMSO (mock, 0 min) treated cells. c, Metagene profile of 7SK ChIRP-seq in DMSO (black) or JQ1 (red) treated mouse ES cells across a scaled mrna locus. d,e,f, Metagene analysis of Pol II ChIP-seq in mouse ES cells at promoters (d), SE (e), and TE (f), colors are as in (c). g,h,i, Metagene analysis of 7SK ChIRP-seq in mouse ES cells at promoters (g), SE (h), and TE (i), colors are as in (c).
Comparison of open chromatin regions between dentate granule cells and other tissues and neural cell types.
 Supplementary Figure 1 Comparison of open chromatin regions between dentate granule cells and other tissues and neural cell types. (a) Pearson correlation heatmap among open chromatin profiles of different
Supplementary Figure S1. Gene expression analysis of epidermal marker genes and TP63.
 Supplementary Figure Legends Supplementary Figure S1. Gene expression analysis of epidermal marker genes and TP63. A. Screenshot of the UCSC genome browser from normalized RNAPII and RNA-seq ChIP-seq data
Supplementary Figure 1. Efficiency of Mll4 deletion and its effect on T cell populations in the periphery. Nature Immunology: doi: /ni.
 Supplementary Figure 1 Efficiency of Mll4 deletion and its effect on T cell populations in the periphery. Expression of Mll4 floxed alleles (16-19) in naive CD4 + T cells isolated from lymph nodes and
Nature Structural & Molecular Biology: doi: /nsmb.2419
 Supplementary Figure 1 Mapped sequence reads and nucleosome occupancies. (a) Distribution of sequencing reads on the mouse reference genome for chromosome 14 as an example. The number of reads in a 1 Mb
Nature Immunology: doi: /ni Supplementary Figure 1. Transcriptional program of the TE and MP CD8 + T cell subsets.
 Supplementary Figure 1 Transcriptional program of the TE and MP CD8 + T cell subsets. (a) Comparison of gene expression of TE and MP CD8 + T cell subsets by microarray. Genes that are 1.5-fold upregulated
Supplementary Figures
 Supplementary Figures Supplementary Figure 1. Heatmap of GO terms for differentially expressed genes. The terms were hierarchically clustered using the GO term enrichment beta. Darker red, higher positive
Nature Structural & Molecular Biology: doi: /nsmb Supplementary Figure 1
 Supplementary Figure 1 Effect of HSP90 inhibition on expression of endogenous retroviruses. (a) Inducible shrna-mediated Hsp90 silencing in mouse ESCs. Immunoblots of total cell extract expressing the
Supplementary Figure 1 IL-27 IL
 Tim-3 Supplementary Figure 1 Tc0 49.5 0.6 Tc1 63.5 0.84 Un 49.8 0.16 35.5 0.16 10 4 61.2 5.53 10 3 64.5 5.66 10 2 10 1 10 0 31 2.22 10 0 10 1 10 2 10 3 10 4 IL-10 28.2 1.69 IL-27 Supplementary Figure 1.
MIR retrotransposon sequences provide insulators to the human genome
 Supplementary Information: MIR retrotransposon sequences provide insulators to the human genome Jianrong Wang, Cristina Vicente-García, Davide Seruggia, Eduardo Moltó, Ana Fernandez- Miñán, Ana Neto, Elbert
Nature Immunology: doi: /ni Supplementary Figure 1 33,312. Aire rep 1. Aire rep 2 # 44,325 # 44,055. Aire rep 1. Aire rep 2.
 a 33,312 b rep 1 rep 1 # 44,325 rep 2 # 44,055 [0-84] rep 2 [0-84] 1810043G02Rik Pfkl Dnmt3l Icosl rep 1 [0-165] rep 2 [0-165] Rps14 Cd74 Mir5107 Tcof1 rep 1 [0-69] rep 2 [0-68] Id3 E2f2 Asap3 rep 1 [0-141]
Lung Met 1 Lung Met 2 Lung Met Lung Met H3K4me1. Lung Met H3K27ac Primary H3K4me1
 a Gained Met-VELs 1.5 1.5 -.5 Lung Met 1 Lung Met Lung Met 3 1. Lung Met H3K4me1 Lung Met H3K4me1 1 Lung Met H3K4me1 Lung Met H3K7ac 1.5 Lung Met H3K7ac Lung Met H3K7ac.8 Primary H3K4me1 Primary H3K7ac
a) List of KMTs targeted in the shrna screen. The official symbol, KMT designation,
 List of KMTs targeted in the shrna screen. The official symbol, KMT designation,") Supplementary Information Supplementary Figures Supplementary Figure 1. a) List of KMTs targeted in the shrna screen. The official symbol, KMT designation, gene ID and specifities are provided. Those highlighted
Supplementary Information Supplementary Figures Supplementary Figure 1. a) List of KMTs targeted in the shrna screen. The official symbol, KMT designation, gene ID and specifities are provided. Those highlighted
Computational Analysis of UHT Sequences Histone modifications, CAGE, RNA-Seq
 Computational Analysis of UHT Sequences Histone modifications, CAGE, RNA-Seq Philipp Bucher Wednesday January 21, 2009 SIB graduate school course EPFL, Lausanne ChIP-seq against histone variants: Biological
Nature Immunology: doi: /ni Supplementary Figure 1. Characteristics of SEs in T reg and T conv cells.
 Supplementary Figure 1 Characteristics of SEs in T reg and T conv cells. (a) Patterns of indicated transcription factor-binding at SEs and surrounding regions in T reg and T conv cells. Average normalized
Nature Genetics: doi: /ng Supplementary Figure 1. Assessment of sample purity and quality.
 Supplementary Figure 1 Assessment of sample purity and quality. (a) Hematoxylin and eosin staining of formaldehyde-fixed, paraffin-embedded sections from a human testis biopsy collected concurrently with
Nature Structural & Molecular Biology: doi: /nsmb Supplementary Figure 1
 Supplementary Figure 1 U1 inhibition causes a shift of RNA-seq reads from exons to introns. (a) Evidence for the high purity of 4-shU-labeled RNAs used for RNA-seq. HeLa cells transfected with control
Table S1. Total and mapped reads produced for each ChIP-seq sample
 Tale S1. Total and mapped reads produced for each ChIP-seq sample Sample Total Reads Mapped Reads Col- H3K27me3 rep1 125662 1334323 (85.76%) Col- H3K27me3 rep2 9176437 7986731 (87.4%) atmi1a//c H3K27m3
Raymond Auerbach PhD Candidate, Yale University Gerstein and Snyder Labs August 30, 2012
 Elucidating Transcriptional Regulation at Multiple Scales Using High-Throughput Sequencing, Data Integration, and Computational Methods Raymond Auerbach PhD Candidate, Yale University Gerstein and Snyder
STAT1 regulates microrna transcription in interferon γ stimulated HeLa cells
 CAMDA 2009 October 5, 2009 STAT1 regulates microrna transcription in interferon γ stimulated HeLa cells Guohua Wang 1, Yadong Wang 1, Denan Zhang 1, Mingxiang Teng 1,2, Lang Li 2, and Yunlong Liu 2 Harbin
Nature Genetics: doi: /ng Supplementary Figure 1
 Supplementary Figure 1 Expression deviation of the genes mapped to gene-wise recurrent mutations in the TCGA breast cancer cohort (top) and the TCGA lung cancer cohort (bottom). For each gene (each pair
Supplemental Figure 1
 Supplemental Figure 1 1a 1c PD-1 MFI fold change 6 5 4 3 2 1 IL-1α IL-2 IL-4 IL-6 IL-1 IL-12 IL-13 IL-15 IL-17 IL-18 IL-21 IL-23 IFN-α Mut Human PD-1 promoter SBE-D 5 -GTCTG- -1.2kb SBE-P -CAGAC- -1.kb
CTCF-Mediated Functional Chromatin Interactome in Pluripotent Cells
 SUPPLEMENTARY INFORMATION CTCF-Mediated Functional Chromatin Interactome in Pluripotent Cells Lusy Handoko 1,*, Han Xu 1,*, Guoliang Li 1,*, Chew Yee Ngan 1, Elaine Chew 1, Marie Schnapp 1, Charlie Wah
Supplementary Figures
 Supplementary Figures Supplementary Figure 1. Confirmation of Dnmt1 conditional knockout out mice. a, Representative images of sorted stem (Lin - CD49f high CD24 + ), luminal (Lin - CD49f low CD24 + )
SUPPLEMENTARY FIGURES
 SUPPLEMENTARY FIGURES Figure S1. Clinical significance of ZNF322A overexpression in Caucasian lung cancer patients. (A) Representative immunohistochemistry images of ZNF322A protein expression in tissue
Heintzman, ND, Stuart, RK, Hon, G, Fu, Y, Ching, CW, Hawkins, RD, Barrera, LO, Van Calcar, S, Qu, C, Ching, KA, Wang, W, Weng, Z, Green, RD,
 Heintzman, ND, Stuart, RK, Hon, G, Fu, Y, Ching, CW, Hawkins, RD, Barrera, LO, Van Calcar, S, Qu, C, Ching, KA, Wang, W, Weng, Z, Green, RD, Crawford, GE, Ren, B (2007) Distinct and predictive chromatin
Figure S1A. Blood glucose levels in mice after glucose injection
 ## Figure S1A. Blood glucose levels in mice after glucose injection Blood glucose (mm/l) 25 2 15 1 5 # 15 3 6 3+3 Time after glucose injection (min) # Figure S1B. α-kg levels in mouse livers after glucose
SUPPLEMENTARY INFORMATION
 doi:10.1038/nature12215 Supplementary Figure 1. The effects of full and dissociated GR agonists in supporting BFU-E self-renewal divisions. BFU-Es were cultured in self-renewal medium with indicated GR
Supplemental Figure S1. Tertiles of FKBP5 promoter methylation and internal regulatory region
 Supplemental Figure S1. Tertiles of FKBP5 promoter methylation and internal regulatory region methylation in relation to PSS and fetal coupling. A, PSS values for participants whose placentas showed low,
Broad H3K4me3 is associated with increased transcription elongation and enhancer activity at tumor suppressor genes
 Broad H3K4me3 is associated with increased transcription elongation and enhancer activity at tumor suppressor genes Kaifu Chen 1,2,3,4,5,10, Zhong Chen 6,10, Dayong Wu 6, Lili Zhang 7, Xueqiu Lin 1,2,8,
Supplemental Figure 1. Genes showing ectopic H3K9 dimethylation in this study are DNA hypermethylated in Lister et al. study.
 mc mc mc mc SUP mc mc Supplemental Figure. Genes showing ectopic HK9 dimethylation in this study are DNA hypermethylated in Lister et al. study. Representative views of genes that gain HK9m marks in their
H3K4 demethylase KDM5B regulates global dynamics of transcription elongation and alternative splicing in embryonic stem cells
 Nucleic Acids Research, 2017 1 doi: 10.1093/nar/gkx251 H3K4 demethylase KDM5B regulates global dynamics of transcription elongation and alternative splicing in embryonic stem cells Runsheng He 1,2 and
EPIGENETIC RE-EXPRESSION OF HIF-2α SUPPRESSES SOFT TISSUE SARCOMA GROWTH
 EPIGENETIC RE-EXPRESSION OF HIF-2α SUPPRESSES SOFT TISSUE SARCOMA GROWTH Supplementary Figure 1. Supplementary Figure 1. Characterization of KP and KPH2 autochthonous UPS tumors. a) Genotyping of KPH2
SUPPLEMENTARY INFORMATION
 DOI: 10.1038/ncb2607 Figure S1 Elf5 loss promotes EMT in mammary epithelium while Elf5 overexpression inhibits TGFβ induced EMT. (a, c) Different confocal slices through the Z stack image. (b, d) 3D rendering
SUPPLEMENTARY FIGURES
 SUPPLEMENTARY FIGURES 1 Supplementary Figure 1, Adult hippocampal QNPs and TAPs uniformly express REST a-b) Confocal images of adult hippocampal mouse sections showing GFAP (green), Sox2 (red), and REST
Accessing and Using ENCODE Data Dr. Peggy J. Farnham
 1 William M Keck Professor of Biochemistry Keck School of Medicine University of Southern California How many human genes are encoded in our 3x10 9 bp? C. elegans (worm) 959 cells and 1x10 8 bp 20,000
Supplementary Materials for
 www.sciencesignaling.org/cgi/content/full/8/375/ra41/dc1 Supplementary Materials for Actin cytoskeletal remodeling with protrusion formation is essential for heart regeneration in Hippo-deficient mice
fl/+ KRas;Atg5 fl/+ KRas;Atg5 fl/fl KRas;Atg5 fl/fl KRas;Atg5 Supplementary Figure 1. Gene set enrichment analyses. (a) (b)
 (b)") KRas;At KRas;At KRas;At KRas;At a b Supplementary Figure 1. Gene set enrichment analyses. (a) GO gene sets (MSigDB v3. c5) enriched in KRas;Atg5 fl/+ as compared to KRas;Atg5 fl/fl tumors using gene set
KRas;At KRas;At KRas;At KRas;At a b Supplementary Figure 1. Gene set enrichment analyses. (a) GO gene sets (MSigDB v3. c5) enriched in KRas;Atg5 fl/+ as compared to KRas;Atg5 fl/fl tumors using gene set
Nature Structural & Molecular Biology: doi: /nsmb Supplementary Figure 1. Differential expression of mirnas from the pri-mir-17-92a locus.
 Supplementary Figure 1 Differential expression of mirnas from the pri-mir-17-92a locus. (a) The mir-17-92a expression unit in the third intron of the host mir-17hg transcript. (b,c) Impact of knockdown
Discovery of Novel Human Gene Regulatory Modules from Gene Co-expression and
 Discovery of Novel Human Gene Regulatory Modules from Gene Co-expression and Promoter Motif Analysis Shisong Ma 1,2*, Michael Snyder 3, and Savithramma P Dinesh-Kumar 2* 1 School of Life Sciences, University
EPIGENOMICS PROFILING SERVICES
 EPIGENOMICS PROFILING SERVICES Chromatin analysis DNA methylation analysis RNA-seq analysis Diagenode helps you uncover the mysteries of epigenetics PAGE 3 Integrative epigenomics analysis DNA methylation
Nature Structural & Molecular Biology: doi: /nsmb Supplementary Figure 1
 Supplementary Figure 1 Frequency of alternative-cassette-exon engagement with the ribosome is consistent across data from multiple human cell types and from mouse stem cells. Box plots showing AS frequency
SUPPLEMENTARY INFORMATION
 doi:10.1038/nature10866 a b 1 2 3 4 5 6 7 Match No Match 1 2 3 4 5 6 7 Turcan et al. Supplementary Fig.1 Concepts mapping H3K27 targets in EF CBX8 targets in EF H3K27 targets in ES SUZ12 targets in ES
User Guide. Association analysis. Input
 User Guide TFEA.ChIP is a tool to estimate transcription factor enrichment in a set of differentially expressed genes using data from ChIP-Seq experiments performed in different tissues and conditions.
Nature Genetics: doi: /ng Supplementary Figure 1. Immunofluorescence (IF) confirms absence of H3K9me in met-2 set-25 worms.
 confirms absence of H3K9me in met-2 set-25 worms.") Supplementary Figure 1 Immunofluorescence (IF) confirms absence of H3K9me in met-2 set-25 worms. IF images of wild-type (wt) and met-2 set-25 worms showing the loss of H3K9me2/me3 at the indicated developmental
Supplementary Figure 1 Immunofluorescence (IF) confirms absence of H3K9me in met-2 set-25 worms. IF images of wild-type (wt) and met-2 set-25 worms showing the loss of H3K9me2/me3 at the indicated developmental
Sirt1 Hmg20b Gm (0.17) 24 (17.3) 877 (857)
 24 (17.3) 877 (857)") 3 (0.17) 24 (17.3) Sirt1 Hmg20 Gm4763 877 (857) c d Suppl. Figure 1. Screen validation for top candidate antagonists of Dot1L (a) Numer of genes with one (gray), two (cyan) or three (red) shrna scored
3 (0.17) 24 (17.3) Sirt1 Hmg20 Gm4763 877 (857) c d Suppl. Figure 1. Screen validation for top candidate antagonists of Dot1L (a) Numer of genes with one (gray), two (cyan) or three (red) shrna scored
Sudin Bhattacharya Institute for Integrative Toxicology
 Beyond the AHRE: the Role of Epigenomics in Gene Regulation by the AHR (or, Varied Applications of Computational Modeling in Toxicology and Ingredient Safety) Sudin Bhattacharya Institute for Integrative
Supplemental Information. Genomic Characterization of Murine. Monocytes Reveals C/EBPb Transcription. Factor Dependence of Ly6C Cells
 Immunity, Volume 46 Supplemental Information Genomic Characterization of Murine Monocytes Reveals C/EBPb Transcription Factor Dependence of Ly6C Cells Alexander Mildner, Jörg Schönheit, Amir Giladi, Eyal
Supplementary Information
 Supplementary Information 5-hydroxymethylcytosine-mediated epigenetic dynamics during postnatal neurodevelopment and aging By Keith E. Szulwach 1,8, Xuekun Li 1,8, Yujing Li 1, Chun-Xiao Song 2, Hao Wu
Supplementary Figure 1. Using DNA barcode-labeled MHC multimers to generate TCR fingerprints
 Supplementary Figure 1 Using DNA barcode-labeled MHC multimers to generate TCR fingerprints (a) Schematic overview of the workflow behind a TCR fingerprint. Each peptide position of the original peptide
Dynamic reorganization of the AC16 cardiomyocyte transcriptome in response to TNFα signaling revealed by integrated genomic analyses. Luo et al.
 Dynamic reorganization of the AC1 cardiomyocyte transcriptome in response to TNFα signaling revealed by integrated genomic analyses Luo et al. Luo et al. BMC Genomics 1, 15:155 Luo et al. BMC Genomics
Supplemental Data. Integrating omics and alternative splicing i reveals insights i into grape response to high temperature
 Supplemental Data Integrating omics and alternative splicing i reveals insights i into grape response to high temperature Jianfu Jiang 1, Xinna Liu 1, Guotian Liu, Chonghuih Liu*, Shaohuah Li*, and Lijun
Social deficits in Shank3-deficient mouse models of autism are rescued by histone deacetylase (HDAC) inhibition
 inhibition") SUPPLEMENTARY INFORMATION Articles https://doi.org/10.1038/s41593-018-0110-8 In the format provided by the authors and unedited. Social deficits in Shank3-deficient mouse models of autism are rescued by
SUPPLEMENTARY INFORMATION Articles https://doi.org/10.1038/s41593-018-0110-8 In the format provided by the authors and unedited. Social deficits in Shank3-deficient mouse models of autism are rescued by
Nature Immunology: doi: /ni Supplementary Figure 1. DNA-methylation machinery is essential for silencing of Cd4 in cytotoxic T cells.
 Supplementary Figure 1 DNA-methylation machinery is essential for silencing of Cd4 in cytotoxic T cells. (a) Scheme for the retroviral shrna screen. (b) Histogram showing CD4 expression (MFI) in WT cytotoxic
RNA-Seq Preparation Comparision Summary: Lexogen, Standard, NEB
 RNA-Seq Preparation Comparision Summary: Lexogen, Standard, NEB CSF-NGS January 22, 214 Contents 1 Introduction 1 2 Experimental Details 1 3 Results And Discussion 1 3.1 ERCC spike ins............................................
Xenoestrogen-induced Regulation of EZH2 and Histone Methylation via Non-Genomic Estrogen
 Xenoestrogen-induced Regulation of EZH2 and Histone Methylation via Non-Genomic Estrogen Receptor Signaling to PI3K/AKT Tiffany G. Bredfeldt, Kristen L. Greathouse, Stephen H. Safe, Mien-Chie Hung, Mark
Peak-calling for ChIP-seq and ATAC-seq
 Peak-calling for ChIP-seq and ATAC-seq Shamith Samarajiwa CRUK Autumn School in Bioinformatics 2017 University of Cambridge Overview Peak-calling: identify enriched (signal) regions in ChIP-seq or ATAC-seq
Supplemental Material for:
 Supplemental Material for: Transcriptional silencing of γ-globin by BCL11A involves long-range interactions and cooperation with SOX6 Jian Xu, Vijay G. Sankaran, Min Ni, Tobias F. Menne, Rishi V. Puram,
15. Supplementary Figure 9. Predicted gene module expression changes at 24hpi during HIV
 Supplementary Information Table of content 1. Supplementary Table 1. Summary of RNAseq data and mapping statistics 2. Supplementary Table 2. Biological functions enriched in 12 hpi DE genes, derived from
Supplementary Figures
 Supplementary Figures Supplementary Figure 1 Characterization of stable expression of GlucB and sshbira in the CT26 cell line (a) Live cell imaging of stable CT26 cells expressing green fluorescent protein
TEB. Id4 p63 DAPI Merge. Id4 CK8 DAPI Merge
 a Duct TEB b Id4 p63 DAPI Merge Id4 CK8 DAPI Merge c d e Supplementary Figure 1. Identification of Id4-positive MECs and characterization of the Comma-D model. (a) IHC analysis of ID4 expression in the
An Unexpected Function of the Prader-Willi Syndrome Imprinting Center in Maternal Imprinting in Mice
 An Unexpected Function of the Prader-Willi Syndrome Imprinting Center in Maternal Imprinting in Mice Mei-Yi Wu 1 *, Ming Jiang 1, Xiaodong Zhai 2, Arthur L. Beaudet 2, Ray-Chang Wu 1 * 1 Department of
Supplementary Information
 Supplementary Information mediates STAT3 activation at retromer-positive structures to promote colitis and colitis-associated carcinogenesis Zhang et al. a b d e g h Rel. Luc. Act. Rel. mrna Rel. mrna
Lentiviral Delivery of Combinatorial mirna Expression Constructs Provides Efficient Target Gene Repression.
 Supplementary Figure 1 Lentiviral Delivery of Combinatorial mirna Expression Constructs Provides Efficient Target Gene Repression. a, Design for lentiviral combinatorial mirna expression and sensor constructs.
Supplementary Figure 1 ITGB1 and ITGA11 increase with evidence for heterodimers following HSC activation. (a) Time course of rat HSC activation
 Time course of rat HSC activation") Supplementary Figure 1 ITGB1 and ITGA11 increase with evidence for heterodimers following HSC activation. (a) Time course of rat HSC activation indicated by the detection of -SMA and COL1 (log scale).
Supplementary Figure 1 ITGB1 and ITGA11 increase with evidence for heterodimers following HSC activation. (a) Time course of rat HSC activation indicated by the detection of -SMA and COL1 (log scale).
Supplementary Fig. 1. GPRC5A post-transcriptionally down-regulates EGFR expression. (a) Plot of the changes in steady state mrna levels versus
 Plot of the changes in steady state mrna levels versus") Supplementary Fig. 1. GPRC5A post-transcriptionally down-regulates EGFR expression. (a) Plot of the changes in steady state mrna levels versus changes in corresponding proteins between wild type and Gprc5a-/-
Supplementary Fig. 1. GPRC5A post-transcriptionally down-regulates EGFR expression. (a) Plot of the changes in steady state mrna levels versus changes in corresponding proteins between wild type and Gprc5a-/-
Computational aspects of ChIP-seq. John Marioni Research Group Leader European Bioinformatics Institute European Molecular Biology Laboratory
 Computational aspects of ChIP-seq John Marioni Research Group Leader European Bioinformatics Institute European Molecular Biology Laboratory ChIP-seq Using highthroughput sequencing to investigate DNA
Supplemental Figure S1. Expression of Cirbp mrna in mouse tissues and NIH3T3 cells.
 SUPPLEMENTAL FIGURE AND TABLE LEGENDS Supplemental Figure S1. Expression of Cirbp mrna in mouse tissues and NIH3T3 cells. A) Cirbp mrna expression levels in various mouse tissues collected around the clock
SUPPLEMENTARY INFORMATION
 DOI: 10.1038/ncb2638 Figure S1 Morphological characteristics of fetal testes and ovaries from 6.5-20 developmental weeks. Representative images of Hematoxylin and Eosin staining of testes and ovaries over
Effects of UBL5 knockdown on cell cycle distribution and sister chromatid cohesion
 Supplementary Figure S1. Effects of UBL5 knockdown on cell cycle distribution and sister chromatid cohesion A. Representative examples of flow cytometry profiles of HeLa cells transfected with indicated
m 6 A mrna methylation regulates AKT activity to promote the proliferation and tumorigenicity of endometrial cancer
 SUPPLEMENTARY INFORMATION Articles https://doi.org/10.1038/s41556-018-0174-4 In the format provided by the authors and unedited. m 6 A mrna methylation regulates AKT activity to promote the proliferation
Supporting Information
 Supporting Information Palmisano et al. 10.1073/pnas.1202174109 Fig. S1. Expression of different transgenes, driven by either viral or human promoters, is up-regulated by amino acid starvation. (A) Quantification
ChIP-seq data analysis
 ChIP-seq data analysis Harri Lähdesmäki Department of Computer Science Aalto University November 24, 2017 Contents Background ChIP-seq protocol ChIP-seq data analysis Transcriptional regulation Transcriptional
Supplementary Figure 1: High-throughput profiling of survival after exposure to - radiation. (a) Cells were plated in at least 7 wells in a 384-well
 Cells were plated in at least 7 wells in a 384-well") Supplementary Figure 1: High-throughput profiling of survival after exposure to - radiation. (a) Cells were plated in at least 7 wells in a 384-well plate at cell densities ranging from 25-225 cells in
Supplementary Figure 1: High-throughput profiling of survival after exposure to - radiation. (a) Cells were plated in at least 7 wells in a 384-well plate at cell densities ranging from 25-225 cells in
REVIEWERS' COMMENTS: Reviewer #1 (Remarks to the Author):
:") Editorial Note: this manuscript has been previously reviewed at another journal that is not operating a transparent peer review scheme. This document only contains reviewer comments and rebuttal letters
Editorial Note: this manuscript has been previously reviewed at another journal that is not operating a transparent peer review scheme. This document only contains reviewer comments and rebuttal letters
Figure S1, Beyer et al.
 Figure S1, eyer et al. Pax7 Myogenin si sitrl Hoechst T = 72h 14 1.8.6.4.2 12 1 8 6 4 2 24h 48h 96h diff. sitrl siset1 212 72h diff. b1 td r t Se km MyH Vinculin Myogenin β-ctin Vinculin MW b1 ka td r
 DOI: 10.1038/ncb2210 b. ICAM1 ng ml -1 P = 0.0001 Small RNA (15-30nts) ng ml -1 Cell Lysate Exosome HDL Plasma HDL Normal Human HDL mirnas R = 0.45 P < 0.0001 Normal Human Exosome mirnas Figure S1. Characterization
High Throughput Sequence (HTS) data analysis. Lei Zhou
 data analysis. Lei Zhou") High Throughput Sequence (HTS) data analysis Lei Zhou (leizhou@ufl.edu) High Throughput Sequence (HTS) data analysis 1. Representation of HTS data. 2. Visualization of HTS data. 3. Discovering genomic
High Throughput Sequence (HTS) data analysis Lei Zhou (leizhou@ufl.edu) High Throughput Sequence (HTS) data analysis 1. Representation of HTS data. 2. Visualization of HTS data. 3. Discovering genomic
SUPPLEMENTAL INFORMATION
 SUPPLEMENTAL INFORMATION GO term analysis of differentially methylated SUMIs. GO term analysis of the 458 SUMIs with the largest differential methylation between human and chimp shows that they are more
Supplementary Figures
 Supplementary Figures Supplementary Figure 1 DOT1L regulates the expression of epithelial and mesenchymal markers. (a) The expression levels and cellular localizations of EMT markers were confirmed by
Results. Abstract. Introduc4on. Conclusions. Methods. Funding
 . expression that plays a role in many cellular processes affecting a variety of traits. In this study DNA methylation was assessed in neuronal tissue from three pigs (frontal lobe) and one great tit (whole
Table S1. Relative abundance of AGO1/4 proteins in different organs. Table S2. Summary of smrna datasets from various samples.
 Supplementary files Table S1. Relative abundance of AGO1/4 proteins in different organs. Table S2. Summary of smrna datasets from various samples. Table S3. Specificity of AGO1- and AGO4-preferred 24-nt
Yingying Wei George Wu Hongkai Ji
 Stat Biosci (2013) 5:156 178 DOI 10.1007/s12561-012-9066-5 Global Mapping of Transcription Factor Binding Sites by Sequencing Chromatin Surrogates: a Perspective on Experimental Design, Data Analysis,
RNA-seq Introduction
 RNA-seq Introduction DNA is the same in all cells but which RNAs that is present is different in all cells There is a wide variety of different functional RNAs Which RNAs (and sometimes then translated
Fig. S1. Validation of ChIP-seq binding sites by single gene ChIP-PCR Fig. S2. Transactivation potential of PPAR
 Fig. S1. Validation of ChIP-seq binding sites by single gene ChIP-PCR ChIP-PCR was performed on PPARγ and RXR-enriched chromatin harvested during adipocyte differentiation at day and day 6 as described
Supplementary Figures
 Supplementary Figures Supplementary Figure 1. Pan-cancer analysis of global and local DNA methylation variation a) Variations in global DNA methylation are shown as measured by averaging the genome-wide
Patterns of Histone Methylation and Chromatin Organization in Grapevine Leaf. Rachel Schwope EPIGEN May 24-27, 2016
 Patterns of Histone Methylation and Chromatin Organization in Grapevine Leaf Rachel Schwope EPIGEN May 24-27, 2016 What does H3K4 methylation do? Plant of interest: Vitis vinifera Culturally important
Title: Epigenetic mechanisms underlying maternal diabetes-associated risk of congenital heart disease
 1 Supplemental Materials 2 3 Title: Epigenetic mechanisms underlying maternal diabetes-associated risk of congenital heart disease 4 5 6 Authors: Madhumita Basu, 1 Jun-Yi Zhu, 2 Stephanie LaHaye 1,3, Uddalak
Supplementary Materials for
 advances.sciencemag.org/cgi/content/full/1/8/e1500296/dc1 Supplementary Materials for Transcriptional regulation of APOBEC3 antiviral immunity through the CBF- /RUNX axis This PDF file includes: Brett
Nature Neuroscience: doi: /nn Supplementary Figure 1. Behavioral training.
 Supplementary Figure 1 Behavioral training. a, Mazes used for behavioral training. Asterisks indicate reward location. Only some example mazes are shown (for example, right choice and not left choice maze
SUPPLEMENTARY INFORMATION
 DOI: 1.138/ncb3355 a S1A8 + cells/ total.1.8.6.4.2 b S1A8/?-Actin c % T-cell proliferation 3 25 2 15 1 5 T cells Supplementary Figure 1 Inter-tumoral heterogeneity of MDSC accumulation in mammary tumor
(a) Significant biological processes (upper panel) and disease biomarkers (lower panel)
 Significant biological processes (upper panel) and disease biomarkers (lower panel)") Supplementary Figure 1. Functional enrichment analyses of secretomic proteins. (a) Significant biological processes (upper panel) and disease biomarkers (lower panel) 2 involved by hrab37-mediated secretory
Supplementary Figure 1. Functional enrichment analyses of secretomic proteins. (a) Significant biological processes (upper panel) and disease biomarkers (lower panel) 2 involved by hrab37-mediated secretory
Transcript-indexed ATAC-seq for immune profiling
 Transcript-indexed ATAC-seq for immune profiling Technical Journal Club 22 nd of May 2018 Christina Müller Nature Methods, Vol.10 No.12, 2013 Nature Biotechnology, Vol.32 No.7, 2014 Nature Medicine, Vol.24,
Nature Genetics: doi: /ng Supplementary Figure 1. SEER data for male and female cancer incidence from
 Supplementary Figure 1 SEER data for male and female cancer incidence from 1975 2013. (a,b) Incidence rates of oral cavity and pharynx cancer (a) and leukemia (b) are plotted, grouped by males (blue),
SSM signature genes are highly expressed in residual scar tissues after preoperative radiotherapy of rectal cancer.
 Supplementary Figure 1 SSM signature genes are highly expressed in residual scar tissues after preoperative radiotherapy of rectal cancer. Scatter plots comparing expression profiles of matched pretreatment
Supplementary information
 Supplementary information High fat diet-induced changes of mouse hepatic transcription and enhancer activity can be reversed by subsequent weight loss Majken Siersbæk, Lyuba Varticovski, Shutong Yang,
The Insulator Binding Protein CTCF Positions 20 Nucleosomes around Its Binding Sites across the Human Genome
 The Insulator Binding Protein CTCF Positions 20 Nucleosomes around Its Binding Sites across the Human Genome Yutao Fu 1, Manisha Sinha 2,3, Craig L. Peterson 3, Zhiping Weng 1,4,5 * 1 Bioinformatics Program,
The Epigenome Tools 2: ChIP-Seq and Data Analysis
 The Epigenome Tools 2: ChIP-Seq and Data Analysis Chongzhi Zang zang@virginia.edu http://zanglab.com PHS5705: Public Health Genomics March 20, 2017 1 Outline Epigenome: basics review ChIP-seq overview
Supplementary Table S1. List of PTPRK-RSPO3 gene fusions in TCGA's colon cancer cohort. Chr. # of Gene 2. Chr. # of Gene 1
 Supplementary Tale S1. List of PTPRK-RSPO3 gene fusions in TCGA's colon cancer cohort TCGA Case ID Gene-1 Gene-2 Chr. # of Gene 1 Chr. # of Gene 2 Genomic coordiante of Gene 1 at fusion junction Genomic
(a) Schematic diagram of the FS mutation of UVRAG in exon 8 containing the highly instable
 Schematic diagram of the FS mutation of UVRAG in exon 8 containing the highly instable") Supplementary Figure 1. Frameshift (FS) mutation in UVRAG. (a) Schematic diagram of the FS mutation of UVRAG in exon 8 containing the highly instable A 10 DNA repeat, generating a premature stop codon
Supplementary Figure 1. Frameshift (FS) mutation in UVRAG. (a) Schematic diagram of the FS mutation of UVRAG in exon 8 containing the highly instable A 10 DNA repeat, generating a premature stop codon
<10. IL-1β IL-6 TNF + _ TGF-β + IL-23
 3 ns 25 ns 2 IL-17 (pg/ml) 15 1 ns ns 5 IL-1β IL-6 TNF