Supplementary Information and Figure legends
|
|
|
- Prosper Wilkerson
- 5 years ago
- Views:
Transcription
1 Supplementary Information and Figure legends Table S1. Primers for quantitative RT-PCR Target Sequence (5 -> 3 ) Target Sequence (5 -> 3 ) DAB2IP F:TGGACGATGTGCTCTATGCC R:GGATGGTGATGGTTTGGTAG Snail F:CCTCCCTGTCAGATGAGGAC R:CCAGGCTGAGGTATTCCTTG CD24 F:GCCAGTCTCTTCGTGGTCTC R:CCTGTTTTTCCTTGCCACAT Twist F:GGAGTCCGCAGTCTTACGAG R:TCTGGAGGACCTGGTAGAGG CD44 F:AGCAACCAAGAGGCAAGAAA R:GTGTGGTTGAAATGGTGCTG Slug F:GGGGAGAAGCCTTTTTCTTG R:TCCTCATGTTTGTGCAGGAG CD117 F:CAAGGCTTCTCCAATTCTGC R:TGCAGTGGTCCACAGAAGAG FOXC2 F:GCCTAAGGACCTGGTGAAGC R:TTGACGAAGCACTCGTTGAG CD133 F:GCCACCGCTCTAGATACTGC R:TGTTGTGATGGGCTTGTCAT Sox-2 F:AGCTACAGCATGATGCAGGA R:GGTCATGGAGTTGTACTGCA Sca-1 F:TGGCTCTTCTTCCGCTACAT R:GCCTCGAAGACCTCACAGTC KLF4 F:TCTCAAGGCACACCTGCGAA R:TAGTGCCTGGTCAGTTCATC ZEB1 F:TTCAAACCCATAGTGGTTGCT R:TGGGAGACACCAAACCAACTG Oct4 F:AGCGAACCAGTATCGAGAAC R:TTACAGAACCACACTCGGAC SIP1 F:TTCCTGGGCTACGACCATAC R:TGTGCTCCATCAAGCAATTC c-myc F:ACTCTGAGGAGGAACAAGAA R:TGGAGACGTGGCACCTCCTT CD44S F:AGCAGCGGCTCCTCCAGTGA R:CCCACTGGGGTGGAATGTGTCT CD44v3 F:GCACTTCAGGAGGTTACATC R:CTGAGGTGTCTGTCTCTTTC CD44v6 F:AGGAACAGTGGTTTGGCAAC R:CGAATGGGAGTCTTCTCTGG CD44v8 F:TCAGCCTACTGCAAATCCAA R:GAGGTCCTGTCCTGTCCAAA 1
2 Table S2. The list of primers for ChIP detection; CD44 promoter region Target Sequence (5 -> 3 ) Target Sequence (5 -> 3 ) P1 P2 P3 F: TGAGCTCTCCCTCTTTCCAC F: ATGGTGGATGGTTGTGGTTT P4 R: GAGGATGACCGAACCGTAAA R: CATCCTCCTGTCCATCCACT F: CCCTATGACAGGCCATCAGT F: AAAAGGCTTCCCCTGAAGAA P5 R: GGGAGTTGGTGAATCTTCCA R: CAACCATCCACCATCCTCTT F: AGTGGATGGACAGGAGGATG F: CTTGCCACAGCCACTGATAA P6 R: ACTGATGGCCTGTCATAGGG R: TTCTTCAGGGGAAGCCTTTT 2
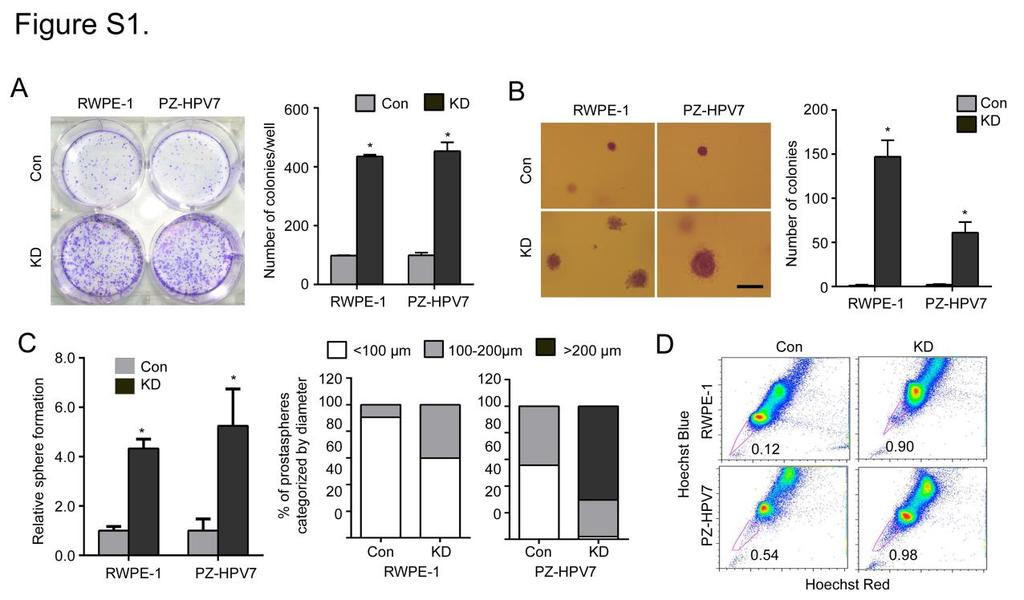
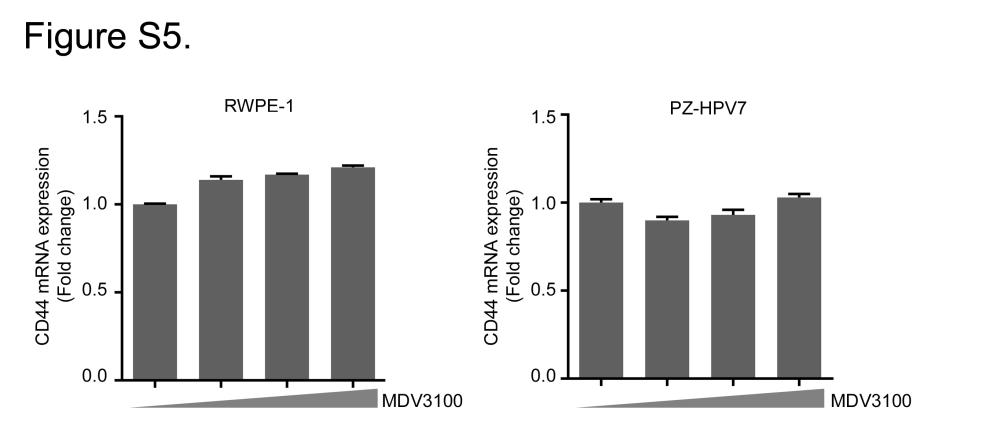
3 Figure S1. Loss of DAB2IP increased clonogenicity and stemness in normal prostate epithelial cells. (A) Cells were seeded in 6-well plates at a density of 1,000 cells per well, and cultured for 10 days. At the end, cells were stained with crystal violet, photographed. The colony numbers were counted using Image J analysis software. (B) Cells were suspended in growth medium with 0.3% agar, then plated onto a 0.6% agar foundation in 6-well plates at a density of cells per well. After 2 weeks, colonies were counted under the microscope. (C) RWPE-1 and PZ-HPV7 cells were grown in sphere forming condition for 2 weeks, and the numbers of prostaspheres were counted in 5 randomly selected fields ( 100) (Left panel). Error bars represented mean ± SD. *, p<0.01. And the size of prostaspheres in diameter was measured, and the percentage of each sphere was calculated (Right panel). (D) Cells were stained with Hoechst for determining SP cells using flow cytometry. Three independent experiments were performed and representative result was shown. Figure S2. Loss of DAB2IP increased in vitro invasion and motility in normal prostate epithelial cells. RWPE-1 and PZ-HPV7 cells were plated onto Matrigel-coated Transwell chambers (A) or plated upper Transwell chambers without Matrigel (B) for 48 h, and quantitative measurements of invade or migratory cells were determined. Data were presented as mean ± SD of each sample measured in triplicate. *, p<0.01. Con, control; KD, DAB2IP knock down. Figure S3. DAB2IP inhibits CD44 expression in human prostate epithelial cell lines. (A and B) Expression levels of several stem cell markers and EMT markers were analyzed by qrt-pcr. After normalizing with 18S rrna in each sample, the relative mrna levels were calculated using control (=1). (C) Left panel: wild type PZ-HPV7 cells (WT) and PZ-HPV7T (T) 3
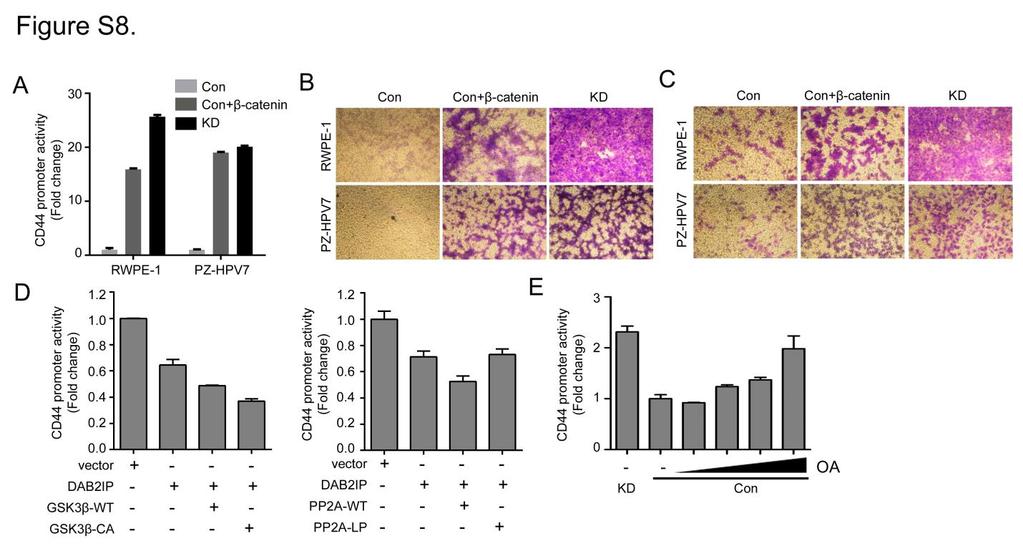
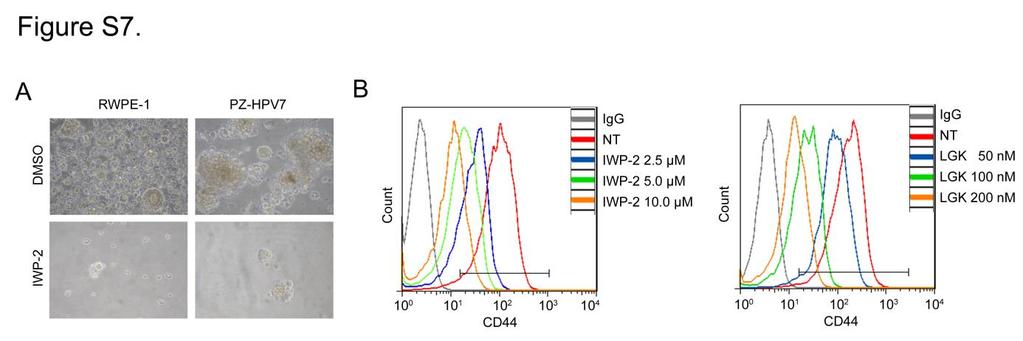
4 cells were stained with PE conjugated CD44 and analyzed by flow cytometry. PE conjugated mouse IgG was used for gating. Right panel: PZ-HPV7 WT and T cells were grown in semisolid culture condition for 14 days and sphere forming ability was compared. (D) Relationship between CD44 and DAB2IP immunostaining. Number represented the percentage of total sample analyzed. (E) Expression levels of CD44 mrna in wild-type and KO mice were determined by qrt-pcr. Figure S4. Wnt pathway correlates with CRPC progression. (A) For measuring the CD44 gene promoter activity, cells were transfected with CD44-luc for 48 h and subjected to dual luciferase assay. The activity of Renilla reporter was used for the normalization of transfection efficiency. Each experiment was performed twice in triplicates. (B- D) The correlation between CD44 and β-catenin gene (CTNNB1) expression from PCa specimens were shown. β-catenin expressions (y-axis) are plotted against the measurements of CD44 expression (x-axis), both in log scale. The Pearson s correlation coefficient and p-value in each study are listed for each dataset. Figure S5. AR inhibitor doesn t affect the expression of CD44. RWPE-1 and PZ-HPV7 cells were treated with increasing dose of AR inhibitor, MDV3100 for 48 hr, and then CD44 mrna expression was measured by qpcr. Figure S6. All CD44 variants respond to Wnt inhibitor. (A) Expression levels of CD44 isoforms were analyzed by qrt-pcr. The primers used in the experiment were shown in Table S1. (B) RWPE-1 and PZ-HPV7 KD cells were treated with 100 nm paclitaxel, 2.5 µm IWP-2, or combination for 48 h and the level of CD44 isoforms were analyzed by qrt-pcr. Figure S7. Wnt signal regulates CD44 expression and stem cell properties. 4
5 (A) Prostaspheres from RWPE-1 and PZ-HPV7 KD cells were treated with 5 µm IWP-2 for 2 weeks. The media containing IWP-2 were replenished every 3 days. (B) PZ-HPV7 KD cells treated with increasing dose of IWP-2 (left panel) or LGK974 (right panel) were labeled with PE conjugated CD44 antibody, and CD44 expression were analyzed by flow cytometry. Figure S8. Wnt signal pathway mediates the expression of CD44. (A) RWPE-1 and PZ-HPV7 Con cells were co-transfected with CA β-catenin mutant (S37A) and CD44-luc plasmid for 48 h then subjected to dual luciferase assay. (B and C) RWPE-1 Con and PZ-HPV7 Con cells transfected with CA β-catenin mutant plasmid (S37A) were plated onto the upper chamber of Transwell for cell migration (B) and cell invasion (C). (D) RWPE-1 KD cells were co-transfected with GSK3-β (WT or constitutive active CA), PP2A (WT or catalytic inactive LP) and CD44-luc. After 48 h, reporter assay was performed. (E) RWPE-1 Con cells transfected with CD44-luc plasmid were treated with different dose of Okadaic acid for 24 h, and then, reporter activity were measured by dual luciferase assay system. OA, Okadaic acid. Figure S9. Wnt inhibitors diminish the chemo-resistance of KD cells. (A) CD44 + and CD44 - cells sorted from PZ-HPV7T were seeded in a 96-well and treated with docetaxel or LGK975 for 48 h and subjected to MTT assay. (B) Con or KD cells from RWPE-1 or PZ-HPV7 were treated with paclitaxel or IWP-for 48 h and subjected to MTT assay. (C) RWPE-1 KD or PZ-HPV7 KD cells were treated with 100 nm paclitaxel, 2.5 µm IWP-2, or combination for 48 h and subjected to MTT assay, and drug synergistic effects were determined. NT, non-treated; PTX, paclitaxcel; P+I, combination treatment of paclitaxel and IWP-2. (D and E) PZ-HPV7T cells (D) or 22Rv 1 cells (E) were treated with 1 nm Docetaxel, 100 nm LGK974, or combination for 48 h. And cell viability was determined by MTT assay and drug synergistic effects were determined based on combination index (CI). NT, Non-treatment; DCT, docetaxel; 5
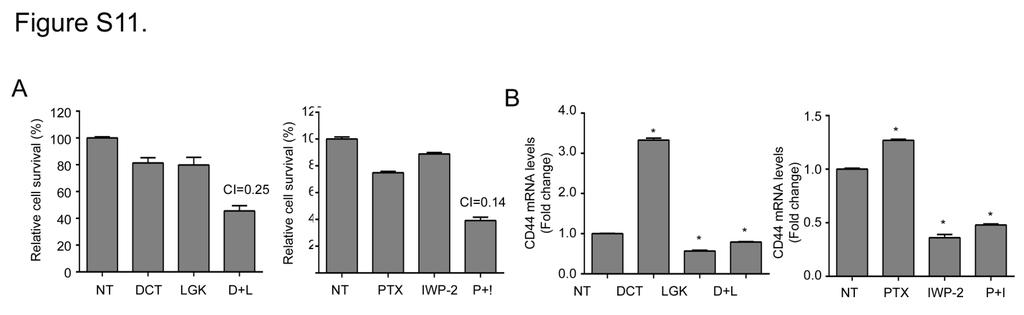
6 LGK, LGK974; D+I, docetaxel and LGK974 combination treatment. (F) 22Rv1 cells treated with docetaxel, LGK974, or combination for 48 h and labeled with PE conjugated CD44 antibody then subjected to flow cytometrical analyses. Figure S10. Overexpression of CD44 rescue the growth inhibition by LGK974. (A) PZ-HPV7 KD and RWPE-1 KD cells were transfected with CD44S plasmid for 24 h and CD44S expressions were analyzed by qpcr. (B) Cells transfected with CD44S were plated into 96 well plate and treated with LGK974 (200 nm) for 48 h. Cell viability was measured by MTT assay and normalized with untreated group. Figure S11. Synergistic effect of Wnt inhibitors combined with docetaxel on Du145 cells. (A) Cells were treated with docetaxel and LGK974, or combination of paclitaxel and IWP-2 for 48 h and subjected to MTT assay, and drug synergistic effects were determined. (B) Cells were treated with docetaxel and LGK974, or combination of paclitaxel and IWP-2, and expression levels of CD44 mrna were analyzed by qrt-pcr. 6
7
8
9
10
11
Supplementary Figure 1. HOPX is hypermethylated in NPC. (a) Methylation levels of HOPX in Normal (n = 24) and NPC (n = 24) tissues from the
 Methylation levels of HOPX in Normal (n = 24) and NPC (n = 24) tissues from the") Supplementary Figure 1. HOPX is hypermethylated in NPC. (a) Methylation levels of HOPX in Normal (n = 24) and NPC (n = 24) tissues from the genome-wide methylation microarray data. Mean ± s.d.; Student
Supplementary Figure 1. HOPX is hypermethylated in NPC. (a) Methylation levels of HOPX in Normal (n = 24) and NPC (n = 24) tissues from the genome-wide methylation microarray data. Mean ± s.d.; Student
Type of file: PDF Size of file: 0 KB Title of file for HTML: Supplementary Information Description: Supplementary Figures
 Type of file: PDF Size of file: 0 KB Title of file for HTML: Supplementary Information Description: Supplementary Figures Supplementary Figure 1 mir-128-3p is highly expressed in chemoresistant, metastatic
Supplementary Figures
 Supplementary Figures Supplementary Figure 1 DOT1L regulates the expression of epithelial and mesenchymal markers. (a) The expression levels and cellular localizations of EMT markers were confirmed by
SREBP-2 promotes stem cell-like properties and metastasis by transcriptional activation of c-myc in prostate cancer
 SREBP-2 promotes stem cell-like properties and metastasis by transcriptional activation of c-myc in prostate cancer Supplementary Material Supplementary Methods Supplementary References Supplementary Figure
(A) RT-PCR for components of the Shh/Gli pathway in normal fetus cell (MRC-5) and a
 RT-PCR for components of the Shh/Gli pathway in normal fetus cell (MRC-5) and a") Supplementary figure legends Supplementary Figure 1. Expression of Shh signaling components in a panel of gastric cancer. (A) RT-PCR for components of the Shh/Gli pathway in normal fetus cell (MRC-5) and
Supplementary figure legends Supplementary Figure 1. Expression of Shh signaling components in a panel of gastric cancer. (A) RT-PCR for components of the Shh/Gli pathway in normal fetus cell (MRC-5) and
Supplementary Figure (OH) 22 nanoparticles did not affect cell viability and apoposis. MDA-MB-231, MCF-7, MCF-10A and BT549 cells were
 22 nanoparticles did not affect cell viability and apoposis. MDA-MB-231, MCF-7, MCF-10A and BT549 cells were") Supplementary Figure 1. Gd@C 82 (OH) 22 nanoparticles did not affect cell viability and apoposis. MDA-MB-231, MCF-7, MCF-10A and BT549 cells were treated with PBS, Gd@C 82 (OH) 22, C 60 (OH) 22 or GdCl
Supplementary Figure 1. Gd@C 82 (OH) 22 nanoparticles did not affect cell viability and apoposis. MDA-MB-231, MCF-7, MCF-10A and BT549 cells were treated with PBS, Gd@C 82 (OH) 22, C 60 (OH) 22 or GdCl
Supplementary Figure 1. The CagA-dependent wound healing or transwell migration of gastric cancer cell. AGS cells transfected with vector control or
 Supplementary Figure 1. The CagA-dependent wound healing or transwell migration of gastric cancer cell. AGS cells transfected with vector control or 3xflag-CagA expression vector were wounded using a pipette
Supplementary Figure 1.TRIM33 binds β-catenin in the nucleus. a & b, Co-IP of endogenous TRIM33 with β-catenin in HT-29 cells (a) and HEK 293T cells
 and HEK 293T cells") Supplementary Figure 1.TRIM33 binds β-catenin in the nucleus. a & b, Co-IP of endogenous TRIM33 with β-catenin in HT-29 cells (a) and HEK 293T cells (b). TRIM33 was immunoprecipitated, and the amount of
Supplementary Figure 1.TRIM33 binds β-catenin in the nucleus. a & b, Co-IP of endogenous TRIM33 with β-catenin in HT-29 cells (a) and HEK 293T cells (b). TRIM33 was immunoprecipitated, and the amount of
SUPPLEMENTAL EXPERIMENTAL PROCEDURES
 SUPPLEMENTAL EXPERIMENTAL PROCEDURES Crystal violet assay Cells were seeded in 24-well plates and cultured in media supplemented with % FBS for 7 days. Media were then removed, plates were briefly washed
Supplemental Table S1
 Supplemental Table S. Tumorigenicity and metastatic potential of 44SQ cell subpopulations a Tumorigenicity b Average tumor volume (mm ) c Lung metastasis d CD high /4 8. 8/ CD low /4 6./ a Mice were injected
SUPPLEMENTARY INFORMATION
 DOI: 10.1038/ncb2607 Figure S1 Elf5 loss promotes EMT in mammary epithelium while Elf5 overexpression inhibits TGFβ induced EMT. (a, c) Different confocal slices through the Z stack image. (b, d) 3D rendering
An epithelial-to-mesenchymal transition-inducing potential of. granulocyte macrophage colony-stimulating factor in colon. cancer
 An epithelial-to-mesenchymal transition-inducing potential of granulocyte macrophage colony-stimulating factor in colon cancer Yaqiong Chen, Zhi Zhao, Yu Chen, Zhonglin Lv, Xin Ding, Renxi Wang, He Xiao,
Supplementary Material
 Supplementary Material The Androgen Receptor is a negative regulator of eif4e Phosphorylation at S209: Implications for the use of mtor inhibitors in advanced prostate cancer Supplementary Figures Supplemental
Supplementary Information
 Supplementary Information mediates STAT3 activation at retromer-positive structures to promote colitis and colitis-associated carcinogenesis Zhang et al. a b d e g h Rel. Luc. Act. Rel. mrna Rel. mrna
Figure S1. ERBB3 mrna levels are elevated in Luminal A breast cancers harboring ERBB3
 Supplemental Figure Legends. Figure S1. ERBB3 mrna levels are elevated in Luminal A breast cancers harboring ERBB3 ErbB3 gene copy number gain. Supplemental Figure S1. ERBB3 mrna levels are elevated in
(A) Dose response curves of HMLE_shGFP (blue circle), HMLE_shEcad (red square),
 Dose response curves of HMLE_shGFP (blue circle), HMLE_shEcad (red square),") Supplementary Figures and Tables Figure S1. Validation of EMT-selective small molecules (A) Dose response curves of HMLE_shGFP (blue circle), HMLE_shEcad (red square), and HMLE_Twist (black diamond) cells
Supplementary Figures and Tables Figure S1. Validation of EMT-selective small molecules (A) Dose response curves of HMLE_shGFP (blue circle), HMLE_shEcad (red square), and HMLE_Twist (black diamond) cells
Bmi-1 regulates stem cell-like properties of gastric cancer cells via modulating mirnas
 Wang et al. Journal of Hematology & Oncology (2016) 9:90 DOI 10.1186/s13045-016-0323-9 RESEARCH Bmi-1 regulates stem cell-like properties of gastric cancer cells via modulating mirnas Open Access Xiaofeng
Supplementary Figure 1. Characterization of ALDH-positive cell population in MCF-7 cells. (a) Expression level of stem cell markers in MCF-7 cells or
 Expression level of stem cell markers in MCF-7 cells or") Supplementary Figure 1. Characterization of ALDH-positive cell population in MCF-7 cells. (a) Expression level of stem cell markers in MCF-7 cells or ALDH-positive cell population by qpcr. Data represent
Supplementary Figure 1. Characterization of ALDH-positive cell population in MCF-7 cells. (a) Expression level of stem cell markers in MCF-7 cells or ALDH-positive cell population by qpcr. Data represent
Lentiviral Delivery of Combinatorial mirna Expression Constructs Provides Efficient Target Gene Repression.
 Supplementary Figure 1 Lentiviral Delivery of Combinatorial mirna Expression Constructs Provides Efficient Target Gene Repression. a, Design for lentiviral combinatorial mirna expression and sensor constructs.
(a) Significant biological processes (upper panel) and disease biomarkers (lower panel)
 Significant biological processes (upper panel) and disease biomarkers (lower panel)") Supplementary Figure 1. Functional enrichment analyses of secretomic proteins. (a) Significant biological processes (upper panel) and disease biomarkers (lower panel) 2 involved by hrab37-mediated secretory
Supplementary Figure 1. Functional enrichment analyses of secretomic proteins. (a) Significant biological processes (upper panel) and disease biomarkers (lower panel) 2 involved by hrab37-mediated secretory
TMA-VARESE COHORT-1 TMA-BERN COHORT-2
 Supplementary Figure 1 TMA-VARESE COHORT-1 TOTAL SAMPLES #5 GLEASON SCORE Number Percentage 6 16 32% = 7 17 34% >7 17 34% TUMOR STAGE T2C 28 56% T3A- 21 42% T3C-T4 1 2% NODE STATUS N 42 84% N1 8 16% PSA
Supplementary Figures
 Supplementary Figures Supplementary Figure 1 Correlation between LKB1 and YAP expression in human lung cancer samples. (a) Representative photos showing LKB1 and YAP immunohistochemical staining in human
Supplementary Materials and Methods
 DD2 suppresses tumorigenicity of ovarian cancer cells by limiting cancer stem cell population Chunhua Han et al. Supplementary Materials and Methods Analysis of publicly available datasets: To analyze
Supplementary Information Supplementary Fig. 1. Elevated Usp9x in melanoma and NRAS mutant melanoma cells are dependent on NRAS for 3D growth.
 Supplementary Information Supplementary Fig. 1. Elevated Usp9x in melanoma and NRAS mutant melanoma cells are dependent on NRAS for 3D growth. a. Immunoblot for Usp9x protein in NRAS mutant melanoma cells
SUPPLEMENTARY INFORMATION
 DOI:.38/ncb3399 a b c d FSP DAPI 5mm mm 5mm 5mm e Correspond to melanoma in-situ Figure a DCT FSP- f MITF mm mm MlanaA melanoma in-situ DCT 5mm FSP- mm mm mm mm mm g melanoma in-situ MITF MlanaA mm mm
SUPPLEMENTARY INFORMATION
 DOI: 1.138/ncb3355 a S1A8 + cells/ total.1.8.6.4.2 b S1A8/?-Actin c % T-cell proliferation 3 25 2 15 1 5 T cells Supplementary Figure 1 Inter-tumoral heterogeneity of MDSC accumulation in mammary tumor
mir-509-5p and mir-1243 increase the sensitivity to gemcitabine by inhibiting
 mir-509-5p and mir-1243 increase the sensitivity to gemcitabine by inhibiting epithelial-mesenchymal transition in pancreatic cancer Hidekazu Hiramoto, M.D. 1,3, Tomoki Muramatsu, Ph.D. 1, Daisuke Ichikawa,
Supplementary Material
 Supplementary Material Summary: The supplementary information includes 1 table (Table S1) and 4 figures (Figure S1 to S4). Supplementary Figure Legends Figure S1 RTL-bearing nude mouse model. (A) Tumor
Table S1. Primer sequences used for qrt-pcr. CACCATTGGCAATGAGCGGTTC AGGTCTTTGCGGATGTCCACGT ACTB AAGTCCATGTGCTGGCAGCACT ATCACCACTCCGAAGTCCGTCT LCOR
 Table S1. Primer sequences used for qrt-pcr. ACTB LCOR KLF6 CTBP1 CDKN1A CDH1 ATF3 PLAU MMP9 TFPI2 CACCATTGGCAATGAGCGGTTC AGGTCTTTGCGGATGTCCACGT AAGTCCATGTGCTGGCAGCACT ATCACCACTCCGAAGTCCGTCT CGGCTGCAGGAAAGTTTACA
well for 2 h at rt. Each dot represents an individual mouse and bar is the mean ±
 Supplementary data: Control DC Blimp-1 ko DC 8 6 4 2-2 IL-1β p=.5 medium 8 6 4 2 IL-2 Medium p=.16 8 6 4 2 IL-6 medium p=.3 5 4 3 2 1-1 medium IL-1 n.s. 25 2 15 1 5 IL-12(p7) p=.15 5 IFNγ p=.65 4 3 2 1
Supplementary Figure 1. The mir-182 binding site of SMAD7 3 UTR and the. mutated sequence.
 Supplementary Figure 1. The mir-182 binding site of SMAD7 3 UTR and the mutated sequence. 1 Supplementary Figure 2. Expression of mir-182 and SMAD7 in various cell lines. (A) Basal levels of mir-182 expression
(A) Cells grown in monolayer were fixed and stained for surfactant protein-c (SPC,
 Cells grown in monolayer were fixed and stained for surfactant protein-c (SPC,") Supplemental Figure Legends Figure S1. Cell line characterization (A) Cells grown in monolayer were fixed and stained for surfactant protein-c (SPC, green) and co-stained with DAPI to visualize the nuclei.
Supplemental Figure Legends Figure S1. Cell line characterization (A) Cells grown in monolayer were fixed and stained for surfactant protein-c (SPC, green) and co-stained with DAPI to visualize the nuclei.
Soft Agar Assay. For each cell pool, 100,000 cells were resuspended in 0.35% (w/v)
") SUPPLEMENTARY MATERIAL AND METHODS Soft Agar Assay. For each cell pool, 100,000 cells were resuspended in 0.35% (w/v) top agar (LONZA, SeaKem LE Agarose cat.5004) and plated onto 0.5% (w/v) basal agar.
SUPPLEMENTARY MATERIAL AND METHODS Soft Agar Assay. For each cell pool, 100,000 cells were resuspended in 0.35% (w/v) top agar (LONZA, SeaKem LE Agarose cat.5004) and plated onto 0.5% (w/v) basal agar.
Supplemental information
 Carcinoemryonic antigen-related cell adhesion molecule 6 (CEACAM6) promotes EGF receptor signaling of oral squamous cell carcinoma metastasis via the complex N-glycosylation y Chiang et al. Supplemental
Supplementary Figure 1. SC35M polymerase activity in the presence of Bat or SC35M NP encoded from the phw2000 rescue plasmid.
 1 2 3 4 5 6 7 8 9 10 11 12 13 14 15 16 17 18 19 20 21 22 23 24 25 26 27 Supplementary Figure 1. SC35M polymerase activity in the presence of Bat or SC35M NP encoded from the phw2000 rescue plasmid. HEK293T
Supplemental Figure 1. Western blot analysis indicated that MIF was detected in the fractions of
 Supplemental Figure Legends Supplemental Figure 1. Western blot analysis indicated that was detected in the fractions of plasma membrane and cytosol but not in nuclear fraction isolated from Pkd1 null
Supplemental Figure 1
 Supplemental Figure 1 1a 1c PD-1 MFI fold change 6 5 4 3 2 1 IL-1α IL-2 IL-4 IL-6 IL-1 IL-12 IL-13 IL-15 IL-17 IL-18 IL-21 IL-23 IFN-α Mut Human PD-1 promoter SBE-D 5 -GTCTG- -1.2kb SBE-P -CAGAC- -1.kb
Supplementary Figure 1. EC-specific Deletion of Snail1 Does Not Affect EC Apoptosis. (a,b) Cryo-sections of WT (a) and Snail1 LOF (b) embryos at
 Cryo-sections of WT (a) and Snail1 LOF (b) embryos at") Supplementary Figure 1. EC-specific Deletion of Snail1 Does Not Affect EC Apoptosis. (a,b) Cryo-sections of WT (a) and Snail1 LOF (b) embryos at E10.5 were double-stained for TUNEL (red) and PECAM-1 (green).
Supplementary Figure 1. EC-specific Deletion of Snail1 Does Not Affect EC Apoptosis. (a,b) Cryo-sections of WT (a) and Snail1 LOF (b) embryos at E10.5 were double-stained for TUNEL (red) and PECAM-1 (green).
Supplementary Figure 1
 A B D Relative TAp73 mrna p73 Supplementary Figure 1 25 2 15 1 5 p63 _-tub. MDA-468 HCC1143 HCC38 SUM149 MDA-468 HCC1143 HCC38 SUM149 HCC-1937 MDA-MB-468 ΔNp63_ TAp73_ TAp73β E C Relative ΔNp63 mrna TAp73
(a) Schematic diagram of the FS mutation of UVRAG in exon 8 containing the highly instable
 Schematic diagram of the FS mutation of UVRAG in exon 8 containing the highly instable") Supplementary Figure 1. Frameshift (FS) mutation in UVRAG. (a) Schematic diagram of the FS mutation of UVRAG in exon 8 containing the highly instable A 10 DNA repeat, generating a premature stop codon
Supplementary Figure 1. Frameshift (FS) mutation in UVRAG. (a) Schematic diagram of the FS mutation of UVRAG in exon 8 containing the highly instable A 10 DNA repeat, generating a premature stop codon
Supplementary Figures
 Supplementary Figures Supplementary Figure 1 Characterization of stable expression of GlucB and sshbira in the CT26 cell line (a) Live cell imaging of stable CT26 cells expressing green fluorescent protein
Cells and reagents. Synaptopodin knockdown (1) and dynamin knockdown (2)
 and dynamin knockdown (2)") Supplemental Methods Cells and reagents. Synaptopodin knockdown (1) and dynamin knockdown (2) podocytes were cultured as described previously. Staurosporine, angiotensin II and actinomycin D were all obtained
Supplemental Methods Cells and reagents. Synaptopodin knockdown (1) and dynamin knockdown (2) podocytes were cultured as described previously. Staurosporine, angiotensin II and actinomycin D were all obtained
Serafino et al. Thymosin α1 activates complement receptor-mediated phagocytosis in human monocyte-derived macrophages. SUPPLEMENTARY FIGURES
 Supplementary Fig. S1. Evaluation of the purity and maturation of macrophage cultures tested by flow cytometry. The lymphocytic/monocytic cellular fraction was isolated from buffy coats of healthy donors
Supplementary Figure S1 Expression of mir-181b in EOC (A) Kaplan-Meier
 Kaplan-Meier") Supplementary Figure S1 Expression of mir-181b in EOC (A) Kaplan-Meier curves for progression-free survival (PFS) and overall survival (OS) in a cohort of patients (N=52) with stage III primary ovarian
Supplementary Figure S1 Expression of mir-181b in EOC (A) Kaplan-Meier curves for progression-free survival (PFS) and overall survival (OS) in a cohort of patients (N=52) with stage III primary ovarian
SUPPLEMENTARY FIGURES AND TABLE
 SUPPLEMENTARY FIGURES AND TABLE Supplementary Figure S1: Characterization of IRE1α mutants. A. U87-LUC cells were transduced with the lentiviral vector containing the GFP sequence (U87-LUC Tet-ON GFP).
ECM1 controls T H 2 cell egress from lymph nodes through re-expression of S1P 1
 ZH, Li et al, page 1 ECM1 controls T H 2 cell egress from lymph nodes through re-expression of S1P 1 Zhenhu Li 1,4,Yuan Zhang 1,4, Zhiduo Liu 1, Xiaodong Wu 1, Yuhan Zheng 1, Zhiyun Tao 1, Kairui Mao 1,
Color Key PCA. mir- 15a let-7c 106b let-7b let-7a 16 10b 99a 26a 20b 374b 19b 135b 125b a-5p 199b-5p 93 92b MES PN.
 1123 83 528 816 84 2 17 718 Comp3 3 2 1 1 2 3 4 Comp2 a b Color Key MES PN PCA 3 2 1 1 2 3 4 Comp1 1 2 3 1 2 3 4-2 -1 1 2 mi- 15a let-7c 16b let-7b let-7a 16 1b 99a 26a 2b 374b 19b 135b 125b 9 34 125a-5p
Nature Genetics: doi: /ng Supplementary Figure 1
 Supplementary Figure 1 MSI2 interactors are associated with the riboproteome and are functionally relevant. (a) Coomassie blue staining of FLAG-MSI2 immunoprecipitated complexes. (b) GO analysis of MSI2-interacting
Supplementary Table 1. List of primers used in this study
 Supplementary Table 1. List of primers used in this study Gene Forward primer Reverse primer Rat Met 5 -aggtcgcttcatgcaggt-3 5 -tccggagacacaggatgg-3 Rat Runx1 5 -cctccttgaaccactccact-3 5 -ctggatctgcctggcatc-3
Supplementary Figure 1
 Supplementary Figure 1 Constitutive EGFR signaling does not activate canonical EGFR signals (a) U251EGFRInd cells with or without tetracycline exposure (24h, 1µg/ml) were treated with EGF for 15 minutes
HEK293FT cells were transiently transfected with reporters, N3-ICD construct and
 Supplementary Information Luciferase reporter assay HEK293FT cells were transiently transfected with reporters, N3-ICD construct and increased amounts of wild type or kinase inactive EGFR. Transfections
L1 on PyMT tumor cells but Py117 cells are more responsive to IFN-γ. (A) Flow
 Flow") A MHCI B PD-L1 Fold expression 8 6 4 2 Fold expression 3 2 1 No tx 1Gy 2Gy IFN Py117 Py117 Supplementary Figure 1. Radiation and IFN-γ enhance MHCI expression and PD- L1 on PyMT tumor cells but Py117 cells
A MHCI B PD-L1 Fold expression 8 6 4 2 Fold expression 3 2 1 No tx 1Gy 2Gy IFN Py117 Py117 Supplementary Figure 1. Radiation and IFN-γ enhance MHCI expression and PD- L1 on PyMT tumor cells but Py117 cells
Impact of hyper-o-glcnacylation on apoptosis and NF-κB activity SUPPLEMENTARY METHODS
 SUPPLEMENTARY METHODS 3D culture and cell proliferation- MiaPaCa-2 cell culture in 3D was performed as described previously (1). Briefly, 8-well glass chamber slides were evenly coated with 50 µl/well
Supplementary Fig. 1 No relative growth advantage of Foxp3 negative cells.
 Supplementary Fig. 1 Supplementary Figure S1: No relative growth advantage of Foxp3 negative cells. itreg were induced from WT (A) or FIR (B) CD4 + T cells. FIR itregs were then removed from the TCR signal
MII. Supplement Figure 1. CapZ β2. Merge. 250ng. 500ng DIC. Merge. Journal of Cell Science Supplementary Material. GFP-CapZ β2 DNA
 A GV GVBD MI DNA CapZ β2 CapZ β2 Merge B DIC GFP-CapZ β2 Merge CapZ β2-gfp 250ng 500ng Supplement Figure 1. MII A early MI late MI Control RNAi CapZαβ DNA Actin Tubulin B Phalloidin Intensity(A.U.) n=10
Supplementary Information
 Supplementary Information Supplementary Figure 1. Effect of mir mimics and anti-mirs on DTPs a, Representative fluorescence microscopy images of GFP vector control or mir mimicexpressing parental and DTP
PREPARED FOR: U.S. Army Medical Research and Materiel Command Fort Detrick, Maryland
 AD Award Number: W81XWH-12-1-0212 TITLE: Wnt/Beta-Catenin, Foxa2, and CXCR4 Axis Controls Prostate Cancer Progression PRINCIPAL INVESTIGATOR: Xiuping Yu CONTRACTING ORGANIZATION: Vanderbilt University
SUPPLEMENTARY INFORMATION
 DOI: 10.1038/ncb3021 Supplementary figure 1 Characterisation of TIMPless fibroblasts. a) Relative gene expression of TIMPs1-4 by real time quantitative PCR (RT-qPCR) in WT or ΔTimp fibroblasts (mean ±
SUPPLEMENTARY INFORMATION
 doi:.38/nature8975 SUPPLEMENTAL TEXT Unique association of HOTAIR with patient outcome To determine whether the expression of other HOX lincrnas in addition to HOTAIR can predict patient outcome, we measured
Supplementary Figure 1. Characterization of NMuMG-ErbB2 and NIC breast cancer cells expressing shrnas targeting LPP. NMuMG-ErbB2 cells (a) and NIC
 and NIC") Supplementary Figure 1. Characterization of NMuMG-ErbB2 and NIC breast cancer cells expressing shrnas targeting LPP. NMuMG-ErbB2 cells (a) and NIC cells (b) were engineered to stably express either a LucA-shRNA
Supplementary Figure 1. Characterization of NMuMG-ErbB2 and NIC breast cancer cells expressing shrnas targeting LPP. NMuMG-ErbB2 cells (a) and NIC cells (b) were engineered to stably express either a LucA-shRNA
HCC1937 is the HCC1937-pcDNA3 cell line, which was derived from a breast cancer with a mutation
 SUPPLEMENTARY INFORMATION Materials and Methods Human cell lines and culture conditions HCC1937 is the HCC1937-pcDNA3 cell line, which was derived from a breast cancer with a mutation in exon 20 of BRCA1
Supplemental Figure 1. Isolation and characterization of CD133+ neurosphere-like
 SUPPLEMENTL FIGURE LEGENDS Supplemental Figure 1. Isolation and characterization of CD133+ neurosphere-like spheroids from a human brain tumor sample or glioma xenograft. () CD133+ tumor cells isolated
TITLE: A Novel Immune-Intact Mouse Model of Prostate Cancer Bone Metastasis: Mechanisms of Chemotaxis and Bone Colonization
 AWARD NUMBER: W81XWH-16-1-0174 TITLE: A Novel Immune-Intact Mouse Model of Prostate Cancer Bone Metastasis: Mechanisms of Chemotaxis and Bone Colonization PRINCIPAL INVESTIGATOR: Srinivas Nandana CONTRACTING
SUPPLEMENTARY FIGURES AND TABLES
 SUPPLEMENTARY FIGURES AND TABLES Supplementary Figure S1: CaSR expression in neuroblastoma models. A. Proteins were isolated from three neuroblastoma cell lines and from the liver metastasis of a MYCN-non
File Name: Supplementary Information Description: Supplementary Figures and Supplementary Table. File Name: Peer Review File Description:
 File Name: Supplementary Information Description: Supplementary Figures and Supplementary Table File Name: Peer Review File Description: Supplementary Table 1 Primers and taqman probes used were the following:
Bhatnagar et al, 2010 Cell Death and Disease Manuscript # CDDIS T
 Bhatnagar et al, Cell Death and Disease Manuscript # CDDIS--98-T Supplemental Materials. Supplemental Figure Legends Supplemental Figure (A) WPE-NA and WPE-NB6 cells were treated with 4 nm of Docetaxel
Supplementary Figure 1. Deletion of Smad3 prevents B16F10 melanoma invasion and metastasis in a mouse s.c. tumor model.
 A B16F1 s.c. Lung LN Distant lymph nodes Colon B B16F1 s.c. Supplementary Figure 1. Deletion of Smad3 prevents B16F1 melanoma invasion and metastasis in a mouse s.c. tumor model. Highly invasive growth
Supplementary Figure 1. IL-12 serum levels and frequency of subsets in FL patients. (A) IL-12
 IL-12") 1 Supplementary Data Figure legends Supplementary Figure 1. IL-12 serum levels and frequency of subsets in FL patients. (A) IL-12 serum levels measured by multiplex ELISA (Luminex) in FL patients before
1 Supplementary Data Figure legends Supplementary Figure 1. IL-12 serum levels and frequency of subsets in FL patients. (A) IL-12 serum levels measured by multiplex ELISA (Luminex) in FL patients before
Supplementary material. Supplementary Figure legends
 Supplementary material Supplementary Figure legends Supplementary Figure 1: Senescence-associated proliferation stop in response to oncogenic N-RAS expression Proliferation of NHEM cells without (ctrl.)
SUPPLEMENTARY INFORMATION
 1. Supplementary Figures and Legends Supplementary Fig. 1. S1P-mediated transcriptional regulation of integrins expressed in OP/monocytoid cells. Real-time quantitative PCR analyses of mrna for two integrins,
Supporting Information. FADD regulates NF-кB activation and promotes ubiquitination of cflip L to induce. apoptosis
 1 2 Supporting Information 3 4 5 FADD regulates NF-кB activation and promotes ubiquitination of cflip L to induce apoptosis 6 7 Kishu Ranjan and Chandramani Pathak* 8 9 Department of Cell Biology, School
SUPPLEMENTARY FIGURE LEGENDS. atypical adenomatous hyperplasias (AAH); Grade II: adenomas; Grade III: adenocarcinomas;
; Grade II: adenomas; Grade III: adenocarcinomas;") SUPPLEMENTARY FIGURE LEGENDS Supplementary Figure S1: Tumor grades in Ras G12D ; p53 / lung tumors. Representative histology (H&E) of K-Ras G12D ; p53 / lung tumors 13 weeks after tumor initiation. Grade
SUPPLEMENTARY FIGURE LEGENDS Supplementary Figure S1: Tumor grades in Ras G12D ; p53 / lung tumors. Representative histology (H&E) of K-Ras G12D ; p53 / lung tumors 13 weeks after tumor initiation. Grade
SUPPLEMENTARY INFORMATION. Supplementary Figures S1-S9. Supplementary Methods
 SUPPLEMENTARY INFORMATION SUMO1 modification of PTEN regulates tumorigenesis by controlling its association with the plasma membrane Jian Huang 1,2#, Jie Yan 1,2#, Jian Zhang 3#, Shiguo Zhu 1, Yanli Wang
TITLE: The Role of HOX Proteins in Androgen-Independent Prostate Cancer
 AD Award Number: W81XWH-6-1-64 TITLE: The Role of HOX Proteins in Androgen-Independent Prostate Cancer PRINCIPAL INVESTIGATOR: Sunshine Daddario, B.A. CONTRACTING ORGANIZATION: University of Colorado Health
Type of file: PDF Title of file for HTML: Supplementary Information Description: Supplementary Figures
 Type of file: PDF Title of file for HTML: Supplementary Information Description: Supplementary Figures Type of file: MOV Title of file for HTML: Supplementary Movie 1 Description: NLRP3 is moving along
Supplementary Figures
 Supplementary Figures Supplementary Figure 1. Confirmation of Dnmt1 conditional knockout out mice. a, Representative images of sorted stem (Lin - CD49f high CD24 + ), luminal (Lin - CD49f low CD24 + )
Inhibition of FOXC2 restores epithelial phenotype and drug-sensitivity in prostate cancer cells with stem-like properties
 SUPPLEMENTAL INFORMATION Inhibition of FOXC2 restores epithelial phenotype and drug-sensitivity in prostate cancer cells with stem-like properties Anurag N Paranjape 1, *, Rama Soundararajan 1, *, Steven
supplementary information
 DOI: 10.1038/ncb1875 Figure S1 (a) The 79 surgical specimens from NSCLC patients were analysed by immunohistochemistry with an anti-p53 antibody and control serum (data not shown). The normal bronchi served
a 10 4 Link et al. Supplementary Figure 1 Nature Immunology: doi: /ni.1842 Cells per mouse ( 10 5 ) TRPV2KO anti-gr1 anti-gr anti-f4/80
 TRPV2KO anti-gr1 anti-gr anti-f4/80") a 10 4 WT 10 4 TRPV2KO 10 3 10 3 anti-gr1 10 2 10 1 anti-gr1 10 2 10 1 10 0 10 0 10 1 10 2 10 3 10 4 anti-f4/80 42.3 45.2 10 0 10 0 10 1 10 2 10 3 10 4 anti-f4/80 10 4 10 4 40 42.5 anti-cd11b 10 3 10 2
a 10 4 WT 10 4 TRPV2KO 10 3 10 3 anti-gr1 10 2 10 1 anti-gr1 10 2 10 1 10 0 10 0 10 1 10 2 10 3 10 4 anti-f4/80 42.3 45.2 10 0 10 0 10 1 10 2 10 3 10 4 anti-f4/80 10 4 10 4 40 42.5 anti-cd11b 10 3 10 2
Supplementary Figure 1. Basal level EGFR across a panel of ESCC lines. Immunoblots demonstrate the expression of phosphorylated and total EGFR as
 Supplementary Figure 1. Basal level EGFR across a panel of ESCC lines. Immunoblots demonstrate the expression of phosphorylated and total EGFR as well as their downstream effectors across a panel of ESCC
Figure S1 Time-dependent down-modulation of HER3 by EZN No Treatment. EZN-3920, 2 μm. Time, h
 Figure S1 Time-dependent down-modulation of HER3 by EZN-392 HE ER3 mrna A, %Contr rol 12 No Treatment EZN-392, 2 μm 1 8 6 4 2 2 8 24 Time, h Figure S2. Specific target down-modulation by HER3 (EZN-392)
Supplementary fig. 1. Crystals induce necroptosis does not involve caspases, TNF receptor or NLRP3. A. Mouse tubular epithelial cells were pretreated
 Supplementary fig. 1. Crystals induce necroptosis does not involve caspases, TNF receptor or NLRP3. A. Mouse tubular epithelial cells were pretreated with zvad-fmk (10µM) and exposed to calcium oxalate
X P. Supplementary Figure 1. Nature Medicine: doi: /nm Nilotinib LSK LT-HSC. Cytoplasm. Cytoplasm. Nucleus. Nucleus
 a b c Supplementary Figure 1 c-kit-apc-eflu780 Lin-FITC Flt3-Linc-Kit-APC-eflu780 LSK Sca-1-PE-Cy7 d e f CD48-APC LT-HSC CD150-PerCP-cy5.5 g h i j Cytoplasm RCC1 X Exp 5 mir 126 SPRED1 SPRED1 RAN P SPRED1
injected subcutaneously into flanks of 6-8 week old athymic male nude mice (LNCaP SQ) and body
 and body") SUPPLEMENTAL FIGURE LEGENDS Figure S1: Generation of ENZR Xenografts and Cell Lines: (A) 1x10 6 LNCaP cells in matrigel were injected subcutaneously into flanks of 6-8 week old athymic male nude mice (LNCaP
SUPPLEMENTAL FIGURE LEGENDS Figure S1: Generation of ENZR Xenografts and Cell Lines: (A) 1x10 6 LNCaP cells in matrigel were injected subcutaneously into flanks of 6-8 week old athymic male nude mice (LNCaP
Expanded View Figures
 Shao-Ming Shen et al Role of I in MT of cancers MO reports xpanded View igures igure V1. nalysis of the expression of I isoforms in cancer cells and their interaction with PTN. RT PR detection of Ish and
Supplementary Materials for
 www.sciencesignaling.org/cgi/content/full/9/439/ra78/dc1 Supplementary Materials for Small heterodimer partner mediates liver X receptor (LXR) dependent suppression of inflammatory signaling by promoting
Supplementary Figure 1 CD4 + T cells from PKC-θ null mice are defective in NF-κB activation during T cell receptor signaling. CD4 + T cells were
 Supplementary Figure 1 CD4 + T cells from PKC-θ null mice are defective in NF-κB activation during T cell receptor signaling. CD4 + T cells were isolated from wild type (PKC-θ- WT) or PKC-θ null (PKC-θ-KO)
Supplementary. presence of the. (c) mrna expression. Error. in naive or
 mrna expression. Error. in naive or") Figure 1. (a) Naive CD4 + T cells were activated in the presence of the indicated cytokines for 3 days. Enpp2 mrna expression was measured by qrt-pcrhr, infected with (b, c) Naive CD4 + T cells were activated
Figure 1. (a) Naive CD4 + T cells were activated in the presence of the indicated cytokines for 3 days. Enpp2 mrna expression was measured by qrt-pcrhr, infected with (b, c) Naive CD4 + T cells were activated
TITLE: MiR-146-SIAH2-AR Signaling in Castration-Resistant Prostate Cancer
 AWARD NUMBER: W81XWH-14-1-0387 TITLE: MiR-146-SIAH2-AR Signaling in Castration-Resistant Prostate Cancer PRINCIPAL INVESTIGATOR: Dr. Goberdhan Dimri, PhD CONTRACTING ORGANIZATION: George Washington University,
Supplemental Table 1. Primers used for RT-PCR analysis of inflammatory cytokines Gene Primer Sequence
 Supplemental Table 1. Primers used for RT-PCR analysis of inflammatory cytokines Gene Primer Sequence IL-1α Forward primer 5 -CAAGATGGCCAAAGTTCGTGAC-3' Reverse primer 5 -GTCTCATGAAGTGAGCCATAGC-3 IL-1β
HIF-inducible mir-191 promotes migration in breast cancer through complex regulation of TGFβ-signaling in hypoxic microenvironment.
 HIF-inducible mir-9 promotes migration in breast cancer through complex regulation of TGFβ-signaling in hypoxic microenvironment. Neha Nagpal, Hafiz M Ahmad, Shibu Chameettachal3, Durai Sundar, Sourabh
Supplementary Data Table of Contents:
 Supplementary Data Table of Contents: - Supplementary Methods - Supplementary Figures S1(A-B) - Supplementary Figures S2 (A-B) - Supplementary Figures S3 - Supplementary Figures S4(A-B) - Supplementary
T H E J O U R N A L O F C E L L B I O L O G Y
 Supplemental material Díaz et al., http://www.jcb.org/cgi/content/full/jcb.201209151/dc1 T H E J O U R N A L O F C E L L B I O L O G Y Figure S1. Hypoxia induces invadopodia formation in different epithelial
Neocortex Zbtb20 / NFIA / Sox9
 Neocortex / NFIA / Sox9 Supplementary Figure 1. Expression of, NFIA, and Sox9 in the mouse neocortex at. The lower panels are higher magnification views of the oxed area. Arrowheads indicate triple-positive
SUPPLEMENTARY INFORMATION
 Suppl. Fig. 1 in vivo expression of ISL1 in the human fetal heart. a, Hematoxylin eosin staining showing structures of left atrium and left atrium appendage (*) of a human fetal heart at 11 weeks of gestation.
Figure S1. Reduction in glomerular mir-146a levels correlate with progression to higher albuminuria in diabetic patients.
 Supplementary Materials Supplementary Figures Figure S1. Reduction in glomerular mir-146a levels correlate with progression to higher albuminuria in diabetic patients. Figure S2. Expression level of podocyte
Cell isolation. Spleen and lymph nodes (axillary, inguinal) were removed from mice
 were removed from mice") Supplementary Methods: Cell isolation. Spleen and lymph nodes (axillary, inguinal) were removed from mice and gently meshed in DMEM containing 10% FBS to prepare for single cell suspensions. CD4 + CD25
Supplementary Methods: Cell isolation. Spleen and lymph nodes (axillary, inguinal) were removed from mice and gently meshed in DMEM containing 10% FBS to prepare for single cell suspensions. CD4 + CD25
T H E J O U R N A L O F C E L L B I O L O G Y
 T H E J O U R N A L O F C E L L B I O L O G Y Supplemental material Amelio et al., http://www.jcb.org/cgi/content/full/jcb.201203134/dc1 Figure S1. mir-24 regulates proliferation and by itself induces
Supplementary Figure 1. Expression of CUGBP1 in non-parenchymal liver cells treated with TGF-β
 Supplementary Figures Supplementary Figure 1. Expression of CUGBP1 in non-parenchymal liver cells treated with TGF-β and LPS. Non-parenchymal liver cells were isolated and treated with or without TGF-β
Supplementary Figures. T Cell Factor-1 initiates T helper 2 fate by inducing GATA-3 and repressing Interferon-γ
 Supplementary Figures T Cell Factor-1 initiates T helper 2 fate by inducing GATA-3 and repressing Interferon-γ Qing Yu, Archna Sharma, Sun Young Oh, Hyung-Geun Moon, M. Zulfiquer Hossain, Theresa M. Salay,